business development strategies used by...
TRANSCRIPT

BUSINESS DEVELOPMENT STRATEGIES USED BY GENERAL CONTRACTING
CONSTRUCTION COMPANIES IN TEXAS FOR MARKET DIVERSIFICATION
A Thesis
by
SEENU ANNA KURIEN
Submitted to the Office of Graduate Studies of Texas A&M University
in partial fulfillment of the requirements for the degree of
MASTER OF SCIENCE
May 2004
Major Subject: Construction Management

BUSINESS DEVELOPMENT STRATEGIES USED BY GENERAL CONTRACTING
CONSTRUCTION COMPANIES IN TEXAS FOR MARKET DIVERSIFICATION
A Thesis
by
SEENU ANNA KURIEN
Submitted to Texas A&M University in partial fulfillment of the requirements
for the degree of
MASTER OF SCIENCE
Approved as to style and content by:
Charles W. Graham (Chair of Committee)
James W. Craig (Member)
Larry G. Gresham (Member)
James C. Smith (Head of Department)
May 2004
Major Subject: Construction Management

iii
ABSTRACT
Business Development Strategies Used by General Contracting Construction Companies
in Texas for Market Diversification. (May 2004)
Seenu Anna Kurien, B.Arch., University of Kerala
Chair of Advisory Committee: Dr. Charles W. Graham
The construction industry in recent times is seen to be highly competitive and
dynamic. To remain progressive in such an environment construction companies need to
be aggressive in terms of getting business. This is where the importance of marketing
and business development comes into play. This thesis addresses the different business
development strategies used by general contracting construction companies in Texas for
market diversification. Initially, a framework is established for this study through the
presentation of brief history and marketing theories. Then, through literature review,
four common business development strategies are identified, which are in turn later used
to compare the data collected from the industry. Data are collected via surveys of general
contractors in Texas. Results show that companies which satisfied majority of the four
charecteristics identified previously showed better growth. Further conclusions are
discussed and future recommendations are also presented.

iv
ACKNOWLEDGMENTS
I would like to thank everyone who assisted me with this research endeavor,
especially the construction industry professionals who participated in my survey. I
would like to thank my committee chair, Dr. Charles W. Graham, for his guidance and
encouragement. I would like to extend my gratitude to my committee members, Dr.
Larry G. Gresham and Dr. James W. Craig for their valuable advice. Finally, I would
like to thank my family and friends for their continuous support and for putting up with
me throughout the study process.

v
TABLE OF CONTENTS
Page
ABSTRACT .......................................................................................................................iii
ACKNOWLEDGMENTS.................................................................................................. iv
TABLE OF CONTENTS .................................................................................................... v
LIST OF FIGURES...........................................................................................................vii
LIST OF TABLES ............................................................................................................. ix
INTRODUCTION............................................................................................................... 1
Background ......................................................................................................... 1 Problem Statement .............................................................................................. 2 Research Objectives ............................................................................................ 2 Limitations .......................................................................................................... 3 Delimitations ....................................................................................................... 3 Assumptions ........................................................................................................ 3 Definitions........................................................................................................... 4
LITERATURE REVIEW.................................................................................................... 5
History of Construction Marketing ..................................................................... 5 Corporate Strategic Planning .............................................................................. 6 Business Development Strategy........................................................................ 10 Promotion .......................................................................................................... 14 Significance of Study ........................................................................................ 15 Thesis Organization........................................................................................... 16
METHODOLOGY............................................................................................................ 17
Method Selection............................................................................................... 17 Development of Questions ................................................................................ 18 Research Hypotheses......................................................................................... 19 Study Population ............................................................................................... 21 Pre-test............................................................................................................... 21

vi
Page
Survey................................................................................................................ 23
DATA ANALYSIS ........................................................................................................... 24
Descriptive Statistics ......................................................................................... 24 Hypotheses Testing ........................................................................................... 25 Chi-Square Goodness-of-Fit Test...................................................................... 26 Survey Results................................................................................................... 37
CONCLUSIONS............................................................................................................... 58
Findings from Respondents' Comments............................................................ 58 Recommendations ............................................................................................. 59 Recommendations for Future Studies ............................................................... 62
REFERENCES.................................................................................................................. 63
APPENDIX A ................................................................................................................... 64
APPENDIX B ................................................................................................................... 70
VITA ................................................................................................................................. 77
vii
LIST OF FIGURES
Page
Figure 1 Growth rate of sample companies.............................................................. 30
Figure 2 Operations within primary area ................................................................. 37
Figure 3 Operations within primary area expressed as percentage .......................... 38
Figure 4 Operations outside primary area ................................................................ 39
Figure 5 Operations outside primary area expressed as percentage......................... 39
Figure 6 Delivery system within primary area ......................................................... 40
Figure 7 Delivery system within primary area expressed as percentage ................. 41
Figure 8 Delivery system outside primary area........................................................ 41
Figure 9 Delivery system outside primary area expressed as percentage ................ 42
Figure 10 Market forces within primary area........................................................... 43
Figure 11 Market forces within primary area expressed as percentage ................... 43
Figure 12 Market forces outside primary area ......................................................... 44
Figure 13 Market forces outside primary area expressed as percentage .................. 44
Figure 14 Market research within primary area ....................................................... 45
Figure 15 Market research within primary area expressed as percentage................ 46
Figure 16 Market research outside primary area...................................................... 46
Figure 17 Market research outside primary area expressed as percentage .............. 47
Figure 18 Business objectives within primary area.................................................. 48

viii
Page
Figure 19 Business objectives within primary area expressed as percentage ............................................................................................ 48
Figure 20 Business objectives outside primary area ................................................ 49
Figure 21 Business objectives outside primary area expressed as percentage ............................................................................................ 49
Figure 22 Internal resource planning within primary area ....................................... 50
Figure 23 Internal resource planning within primary area expressed as percentage............................................................................ 50
Figure 24 Internal resource planning outside primary area...................................... 51
Figure 25 Internal resource planning outside primary area expressed as percentage............................................................................ 51
Figure 26 System of measuring customer satisfaction within primary area ............ 52
Figure 27 System of measuring customer satisfaction within primary area expressed as percentage ...................................................... 52
Figure 28 System of measuring customer satisfaction outside primary area ........... 53
Figure 29 System of measuring customer satisfaction outside primary area expressed as percentage.................................................................... 53
Figure 30 Ranking of marketing tools within primary area ..................................... 54
Figure 31 Ranking of marketing tools outside primary area.................................... 55
Figure 32 Ranking of business objectives within primary area ............................... 56
Figure 33 Customer orientation................................................................................ 57

ix
LIST OF TABLES
Page
Table 1 1 X 2 table for hypothesis 1 ........................................................................ 28
Table 2 Observed frequency table for hypothesis 1 ................................................. 28
Table 3 Expected frequency table for hypothesis 1 ................................................. 29
Table 4 2 X 2 table for hypothesis 2 ........................................................................ 30
Table 5 Observed frequency table for hypothesis 2 considering bottom 1/3 companies as ‘no growth’ ........................................................................... 31
Table 6 Observed frequency table for hypothesis 2 considering companies falling below median as ‘no growth’ .......................................................... 32
Table 7 2 X 2 table for hypothesis 3 ........................................................................ 34
Table 8 Observed frequency table for hypothesis 3 considering bottom 1/3 companies as ‘no growth’ ........................................................................... 34
Table 9 Observed frequency table for hypothesis 2 considering companies falling below median as ‘no growth’ .......................................................... 35

1
INTRODUCTION
Background
The commercial building industry is comprised of some of the brightest and most
creative architectural and engineering mindsets. These talented professionals bring
expertise and skill, thus working towards a common goal, to satisfy their client. In fact,
the entire construction industry is based on the concept of making sure that the owner
receives what he requests (Pryor, 2001). Everyone in construction must be cognizant of
the technology, products, financing, processes and ever-changing conditions of today’s
market. In order to remain progressive and forward looking, a firm’s decision makers
need to assume more prominent roles and incorporate strategic planning to ensure
survival of their respective companies as well as the construction industry. Marketing
strategy is acknowledged to play an important role in the success of a construction
company in this highly competitive industry (Bessom, 1975).
In order to make a company better, its strategic plan should be a calculated one based
on the business acumen of the decision makers and the knowledge they possess
collectively about the construction industry. It describes the overall business plan,
including the plan for business development (Pryor, 2001). A company’s marketing
department formulates the marketing goals and objectives that are defined in the
strategic plan.
_______________
This thesis follows the style and format of Construction Management and Economics.
2
The marketing department is responsible for implementing this strategic marketing
plan. There are many ways of growth and expansion for a construction company, the
study of everything would not be feasible in a short span. This thesis is to study the
market development strategies, the factors influencing design making and the way
companies implement their strategic plan, so that best practices can be identified.
Problem statement
The purpose of this research was to identify the business development strategies used
by construction companies in the Texas for market diversification.
Research objectives
The objective of this research was to explore the following aspects:
1) To analyze and find out whether strategies vary with geographic regions.
2) To identify if there is any conscious effort taken by companies in marketing such as a
separate department for business development for preparing the market plan.
3) To identify and analyze if companies with marketing plans have higher sales growth
than the ones which did not have a plan.
4) To identify and analyze if companies that are customer oriented have higher sales
growth than the ones which did not have a plan.

3
Limitations
Data collected through surveys will be based on knowledge and personal experience
of respondents.
Delimitations
As mentioned before, the companies and their strategies are vast and so the study
needs to be limited to the following areas for feasibility of study:
• New markets will include only new geographical domestic markets
• The research will be limited to medium and large sized companies.
• Only private companies are included in the study.
• Only general contracting companies are included in the study.
Assumptions
To study about companies, surveys were used. The surveys included opinions of
individuals and therefore the following assumptions were made:
• It was assumed that the parties filling out the survey were knowledgeable about
the relevant topics.
• It was assumed that the participants would fill out the survey honestly and
accurately.

4
Definitions
The following terms will be widely used in this thesis:
Business development - A company’s team effort of combining various departments of
skilled professional expertise to answer ultimately all client questions and to prove to the
client why the company should be retained for the project.
Customer segmentation - The identification of homogenous client groups for the purpose
of knowing their needs and to respond specifically to them.
Corporate strategic plan - The overall business plan which establishes a company profile,
that identifies managerial strengths and weaknesses, competitive edge, financial
strength, and technical strength for five or more years.
Market diversification - The process of expansion of companies into new geographical
regions offering the same set of services that they offer in other regions.
Marketing mix - The elements that an organization controls to satisfy or communicate
with customers. This includes product, place, promotion, price, people, physical
evidence and process.
Market positioning - Establishing and maintaining a position in the market with respect
to the competitors.
Market research - A study to identify the features that are most important to customer,
the level of these features which customers expect, what customers think the company
can and should do when problems occur in service delivery.
Services marketing - Marketing of services, which include deeds, processes and
performances.

5
LITERATURE REVIEW
History of construction marketing
According to Smyth (2000), there have been four eras of construction. These were:
1) railways in the 1800s;
2) urban infrastructures of 1930s;
3) electricity generation era; and,
4) petrochemicals in the post world war era.
Civil engineering and government projects were more prominent in domestic markets
during the early eras. The strategic side of business development for contactors began in
1930s. Recession was the main driver. Since governments dominated the construction
market, marketing and selling remained underdeveloped until the oil crisis in mid 1970s.
During the late 1970s and early 1980s, U.S. companies faced competition from
international construction companies. Networking through government officials, local
representatives, financial institutions became important. This was the beginning of
having to develop a sales capacity within the senior management level (op.cit.).
Privatization became more prominent during late 1980s and early 1990s. Many
companies went through booms and slumps of the market, and a few of them emerged
successful. Restructuring and delayering to create a client focused structure and strategic
planning was essential during the early 1990s. But this process did not happen. Trends
can be seen on better market planning and more efficient organizational structures.
Investment is not intended to reflect the amount of resources put into marketing, but how

6
existing resource allocation is applied. Marketing has now become a high profile activity
for construction organizations everywhere. Recast as more than mere advertising and
promotion, marketing now has an important place in many construction corporations’
strategic policies, and is seen generally as contributing directly to corporate performance
(Narver and Slater, 1990).
Corporate strategic planning
Strategic planning is a road map for the long-term destiny of a company. It
establishes the overall business plan for the company. Corporate planning is usually
done by top level management including CEOs, CFOs, Presidents, Vice-Presidents and
other department heads. The strategic plan encompasses the following:
• company mission;
• goals and objectives;
• acquisitions and growth options; and,
• market plan (Pryor, 2001).
Company mission statement
Strategic planning is based on the fact that all markets undergo evolutionary change,
including mutable client needs, technologies, competitors and laws. A mission statement
ensures that all senior level executives possess the same philosophy and direction. A
well formulated mission statement serves as an incredible marketing piece. An excellent
statement is a paragraph that succinctly captures the company’s purpose. Those that
surpass a paragraph in length tend to become diluted in content and convoluted in form.

7
A mission statement is an important philosophical piece for employee also because it
states the company’s expectations (Pryor, 2001).
Goals and objectives
The goals and objectives look forward to what the company plans to achieve in the
future. These should always be related to the company mission. There are three primary
areas of company goals – profit, finance and personnel (Pryor, 2001). Many plans fail
because of lack of time, commitment and forethought. The best approach is for senior
management to calculate their objectives and to understand completely all types of
issues that they will have to deal with in a growth environment.
Growth options
There are several options available for companies to grow such as market penetration,
service diversification, market diversification and pioneering (Smyth, 2000). This
research concentrates on market diversification which is the provision of existing
services to new markets. Such growths require medium risk and medium investment.
Through a company risk profile, the senior management should determine its comfort
zone. At this point, some theories related to services marketing can be discussed.
Services marketing and the marketing mix
The construction industry is characterized by product and services marketing.
Zeithmal and Bitner (2000) defines services to include all economic activities whose
output is not a physical product or construction, is generally consumed at the time it is
produced, and provides added value in forms (such as convenience, timeliness, comfort
or health) that are essentially intangible concerns of its first purchaser”. In recent years,

8
service marketing has become more prominent due to intense specializations,
development of management and consulting services.
Zeithmal and Bitner (2000) defines the traditional marketing mix as composed of the
four P’s: product, prices, place (distribution) and promotion. These elements appear as
core decision variables in any marketing plan. All the variables interact with each other
and depend on each other to a certain extent. Because services are produced and
consumed simultaneously, customers are often co-producers and so they interact directly
with the company’s personnel. Moreover, since services are intangible the marketing
mix is extended to include people, physical evidence and process.
Corporate market planning
A corporate marketing plan describes the tactics that a company would use to meet its
overall corporate objectives. Growth is developed by identifying and seeking out new
opportunities, promoting the firm’s products and services, including responsibility for
technical appraisals and supply of advice to customers on all aspects of the firm’s
business from procurement to final delivery. Marketing in construction embraces the key
elements needed to successfully operate in the expanding sectors for design and build
work, partnering, management contracting etc. Historically the concept and design of the
project were largely under the control of an architect or engineer and the contractor’s
area for commercial influence was limited. Large contractors operating in design and
build construction will benefit considerably by carrying out marketing studies since
some turnover comes from negotiated contracts. It is in this field that contractors can
offer attractive packages to the client and thereby have more control over revenue. The

9
business development function is essentially the implementation of the market plan
(Harris and McCaffer, 2001) A company will thus need all major technical and
managerial elements required to draw clients into meaningful contracts such as capital
sourcing, scope/feasibility services, cost planning, estimating, construction planning,
buying, legal and contractual matters.
Market position and segmentation
As the construction industry becomes more global and national boundaries less
relevant, the survival of a construction firm is determined by its ability to create and
sustain a strategic market position (Ngowi et al., 2001). Defining individual marketing
position is a company’s identification of work in the public or private sector. This
research is restricted to the private sector. Multiple scenarios exist in this sector. For
example, one company can specialize in the construction of retail stores, and another can
specialize in the construction of both retail stores along with churches. Businesses of
various types have placed new demands upon the construction industry within recent
years. A company that focuses on these latest trends can enhance its marketing and seek
segmented markets in which to conduct business. When a company enters a niche, it
must be aware of the singular specifications germane to that industry. Whichever
segmented market a company enters, the owner must define the company’s position and
its capabilities to perform the requisite work.
Market forces and competition
Competition is widely seen as an effective spur to improve performance. Firms are
selected to undertake construction projects and the prices for their works are established

10
by competition. Professional education and training very largely accept without question
that the best way to select contractors is to invite competitive bids from competent firms.
Such competitions serve to drive down prices (Bennett, 2000). The disadvantage is that
this causes problems such as poor quality work, late completions etc. as contractors
struggle to make a profit out of the prices established by competition. The advantage of
competition is that it motivates people to beat the current norms, improve performance
and strive for quality in their product and delivery of service. This paves the way to
research, innovation and technological advancements, which ultimately benefit both the
customer and the seller. It becomes important that construction companies should adopt
the advantages provided by competition and find out ways to overcome the
disadvantages.
Business development strategy
To set new objectives, the company must be prepared to undertake the most thorough
investigation of itself and its business opportunities. This investigation typically involves
two stages:
• formulating a business forecast; and,
• assessing strengths and weaknesses of the company (Harris and McCaffer 2001).
Business forecast
All companies buy and hire factors of production, in the form of labor, material and
equipment. Initially capital is borrowed or saved to purchase the goods, which are then
turned into other products, which are sold at a profit, the lender of the capital thus being
11
rewarded for putting money at risk. The company that knows the market well is thus in a
better position to improve its competitiveness and profitability. The main areas of the
forecast for a construction company are the following:
1. Analyzing competition for contracts
A brief survey of the past performance of other companies will tell us the areas of
contracting which have been successful and are favorable for development or conversely
to avoid because of fierce competition. The main points are:
• The present share of the company for each of the different classes of work
carried out.
• The share and turnover for each of the major competitors.
• The recent growth record and profitability of major competitors
• The record of obtaining work of each type in competition related to past mark up
levels (Harris and McCaffer 2001).
2. Analyzing potential for new business
• Apart from studying the competitors, specific opportunities must be researched
for finding patterns and trends.
• The type and volume of work available for tender and negotiation during past
years, the number of competitors tendering for different contracts, the location of
work and the clients involved.
• Forecast of growth opportunities
• Government regulations and laws in the area (Harris and McCaffer 2001).

12
3. Analyzing the competition for resources
Capital - Some construction companies, because of their small asset bases, enjoy very
limited access to investment capital since little collateral security can be offered to offset
the lending risk. Private sources or bank overdrafts are likely to be principal providers
for these companies. Consequently, some strategically well placed construction
companies wishing to open opportunities in bigger markets tend to face take over
pressures from more powerful companies with access to long-term capital and business
development skills.
Materials and labor resources - Access to reliable sources of either labor or materials
carries risks of availability. Labor supply, especially experienced managers, engineers
and skilled workers is very competitive requiring major commitments on the part of
companies to train and hire and the right people.
4. Analyzing the client
Any records kept on clients should be very revealing and may have considerable
bearing on the final decision to enter a market. Some clients prefer to select contractors
on the basis of bids, others by negotiation, partnering etc. If the company has been
dropped from a client’s bid list the reasons why may be important. At present, both
contractor’s and client’s financial positions can be questioned and so there is little point
in obtaining contracts if payment by client is open to doubt (Harris and McCaffer 2001).
The SWOT analysis
It is widely recognized that the heart of the whole strategic planning system is called
the SWOT analysis, which identifies the strengths and weaknesses of the organization

13
for comparison with the opportunities and threats in the future environment (Fellows et
al., 2002). The following are some of the aspects normally considered in SWOT
analysis:
1. Organization structure
A company of any size must have elements of structure, style and authority or else
risk the “health” of the organization. The decision makers of the company select a
company culture which varies from company to company. The three styles are formal
versus informal, centralized versus decentralized, and autocratic versus democratic.
None of these styles is better than the other. However, a company should have clear
expectations for its clients as well as its employees about the working environment. A
good study of the management capabilities, skills and qualifications of the employees
need to done before venturing into a new market (Harris and McCaffer 2001).
2. Physical resources
For constructing new office spaces, land and finance will be essential. This takes time
and therefore requires careful planning.
3. Financial analysis
To assess the financial strength of the company and to compare its performance with
that of major competitors, financial ratios have to be calculated. Also contract trading
analysis need to be done. This includes effect on profit for various contract types and
different construction sectors. A checklist to analyze the threats and opportunities facing
an organization is:
political changes;

14
economic changes;
social changes;
technological changes;
changes in your own industry; and,
other changes.
Promotion
The construction industry needs to communicate better with the outside world
(Preece et al., 2001). The techniques for persuading the customer are many, some of
which are mentioned in the following paragraphs:
Advertising
• Eye catching advertisements of company and successful projects, in magazines.
• Standard and attractive color scheme
• Sales brochures outlining activities of companies.
• Hoardings at football grounds, construction sites etc.
Public relations
• Encouraging students to visit company construction sites
• Conducting seminars and lectures
• Publishing articles
• Producing films

15
Customer relations
Companies should strive to promote loyalty within their clientele. A majority of the
projects come from already existing customers. Well-satisfied customers also help in
promoting the company, thus helping the overall business (Zeithmal and Bitner, 2000).
The lifetime value of a customer also needs to be considered. Many clients are impressed
by ‘added values’. A contractor with backup services of experienced and well qualified
staff in designing, planning, estimating, laws, insurance, industrial relations, research
and development, are able to advise clients of their needs and bring projects successfully
to implementation will tend to be a more credible company than one without such
facilities. The company should also provide after-sales service during the maintenance
period. Such co-operation can only lead to a better tendering situation in future (Harris
and McCaffer 2001). Some companies move to geographical regions following the
movement of their clients.
Significance of study
The literature review reveals the importance of business development strategies and
how they can affect the overall growth and future of construction companies. Not many
studies have been conducted in this field so far. Several pre-proposal interviews with
people involved in the industry also revealed the importance of this study. This research
therefore strives to analyze the various factors involved in making intelligent decisions
during the preparation of business development strategies and later identify the trends
that can be seen in market.

16
Thesis organization
The research objectives described previously form the outline for this research. The
first part of the study will be a literature review of books, journals, periodicals, and
World Wide Web sources related to strategies used by construction companies. The
second part of the study will include a survey of construction companies in the United
States. The list of the companies will be obtained from the Associated General
Contractor listing and Associated Builders and Constructors listing in Texas. The
questions in the survey will be formulated on the basis of the literature review. The
secondary source for data of the companies will come from company brochures, public
releases and annual reports. The data from each company will be analyzed to identify
qualitative characteristics with the areas of inquiry. The findings will be then be
subjected to statistical analysis to identify trends. From the statistical analysis, inferences
will be made about the trends in business development related to general contracting
construction companies in Texas. Marketing strategies will be identified and
recommendations will also be provided.
17
METHODOLOGY
Method selection
This study utilized surveys to collect primary data. The choice of this method was
dictated by the research objectives, the number of companies available, and the
knowledge that the data is spread out in a vast sample. The current shortage of scholarly
research in this particular area called for the objective of this research to be qualitative in
nature. Leedy (1993) suggests that the nature of the data decide the research
methodology: quantitative or qualitative. At first there was the need to identify and
describe the strategies used by general contracting construction companies before they
could be analyzed in a quantitative manner.
Surveys provided the primary source of data. Leedy (1993) suggests that
questionnaires succeed to the extent that their success is planned. A survey questionnaire
with multiple choice questions was the ideal choice, to get maximum response from an
industry which is known for very low response rates. A survey which has only multiple
choice questions restricts the thinking of the subjects and so some open ended questions
were essential. During the preparation of the survey questionnaire, a brainstorming
session to formulate questions was done. The original list of questions was reduced by
eliminating redundant questions and refined before the actual survey was tested. The
researcher prepared a questionnaire which contained eighteen questions which were
framed based on the research objectives. The method of primary data collection was
divided into various stages.

18
A pre-test of the survey instrument was conducted in a small sample to test the
validity and effectiveness of the instrument. After review of the results from the pretest,
the survey was introduced to the entire sample population
Secondary sources of data were taken from company brochures, annual reports, and
other documents that were either public or made available to the researcher by the
participants. This data supplemented the surveys, providing important information about
the companies. Information relating to marketing strategies was available in the form of
corporate objectives and goals.
Development of questions
The questions were formulated on the basis of a literature review. They were also
organized in such a way as to answer the research questions specifically linked to the
hypotheses. The primary objective of the thesis was to identify strategies used by
companies to introduce their services in new markets, or in other words, the strategies
they used to enter markets different from their primary working area. The literature
review revealed that companies usually prepare market plans when they are getting
ready to enter new markets. A market plans encompasses key elements such as project
delivery systems, types of contracts, market forces, company resources and growth
options. Market research provides background information for companies to frame their
market plan. These were some the areas which the researcher tried to identify primarily.

19
Therefore questions five to ten (see Appendix A) were framed to provide answers to
these areas. Another section related to marketing strategies used by companies which the
researcher tried to probe into was the marketing tools used by them and the level of
priority the companies gave for different marketing tools. The subjects were asked to
rank order the tools.
Research hypotheses
The secondary objective of the thesis was to prove three hypotheses:
1) H0: Business development strategies for new geographic regions are not different
from those in primary business areas.
Ha: Business development strategies for new geographic regions are different from those
in primary business areas.
In this hypothesis, the dependent variable is business development strategy and the
independent variable is the geographic region. The questions used to retrieve this data
was designed to cover aspects such as marketing tools, resource planning, operating
systems, project delivery systems, and contracting methods.
2) H0: Construction companies with a market plan/strategic plan for new business
developments do not have higher rate of growth compared to companies without a
market plan/strategic plan.
20
Ha: Construction companies with a market plan/strategic plan for new business
developments have higher rate of growth compared to companies without a market
plan/strategic plan.
In this hypothesis, the dependent variable is rate of growth and the independent
variable is market plan/strategic plan. The questions used to retrieve the data to test this
hypothesis were designed to cover aspects such as strategic planning, marketing
research, and annual sales volume.
3) H0: Companies that are customer oriented do not have higher rate of growth
compared to ones that are not.
Ha: Companies that are customer oriented have higher rate of growth compared to ones
that are not.
In this hypothesis, the dependent variable is rate of growth and the independent
variable is customer orientation. The questions used to retrieve the data to test this
hypothesis were designed to cover aspects such as customer relations, customer
orientation, business objectives.
A few open-ended questions were also provide along with multiple choice question
especially “Yes/No” type questions to let the subjects give a reason for their answers
and also to let them give information bout anything that they felt is pertinent to the
study.
21
Study population
Several small, medium and large size companies were selected for the study, mainly
because the researcher also wanted to identify if there were any trends that were
associated with the size of the company, and also to find out if size had anything to do
with having a market plan.
Three criteria were used to establish candidates for the study. First, only private
companies were selected. Second, only companies doing predominantly general
contracting works were contacted. Third, only companies who are operating in Texas
were considered. The sample selected for this study was all general contractors in Texas.
The decision to restrict the study to Texas was taken so as to have a base similarity and
so comparison between companies would be more valid. Above all, there is large
concentration of general contractors based in Texas. The study population included all
the companies listed under Associated General Contractors, Association of Builders and
Constructors in their respective Texas chapters and also the Construction Industry
Advisory Council to the Department of Construction Science at Texas A&M University.
Pre-test
A pre-test was conducted prior to actual introduction of the questionnaire to the larger
sample. For pre-testing, contractors in Austin, Texas were selected. The subjects were
identified on the basis of their membership with the professional organization, the
Associated General Contractors (AGC). The office phone numbers were obtained from
the AGC website and phone calls were made. The phone calls were made to identify the

22
right person who would be able to complete the survey. Several calls were made before
the right subjects were identified. Email addresses were obtained from them over the
phone, after which the surveys were sent to them.
Approval from the Institutional Review Board (IRB) at Texas A&M Universty,
regarding human subjects in research was obtained before the surveys were sent to the
subjects. For the pre-testing, surveys were sent only to people to whom the researcher
could personally speak to and from whom the researcher obtained the subjects’ personal
email addresses. The pre-test study population had 15 companies but the survey was sent
to only 10 subjects. The survey questionnaires were made as forms in Microsoft Word®,
a licensed word processing software of Microsoft Corporation and were attached to
emails before sending to the subjects. The next stage was following up with phone calls
and also sending email reminders. This kind of system was easier to track because there
was one person in the company who was solely responsible for the surveys. Such a
procedure also helped to minimize non-response bias.
The pre-test offered good results. Out of the ten subjects to whom the surveys were
sent, six responded. Two subjects faced technical difficulties attaching the completed
survey to email to send back to the researcher. The only difficulty which the researcher
faced was the time delay in contacting the right person in the companies. The results
were analyzed to see whether the information obtained were sufficient to answer the
research questions.

23
Survey
After the pre-testing, some changes were made to the survey questionnaire before use
in the larger sample. The survey instrument was later introduced to Houston, Dallas and
San Antonio general contractors. This time the subjects were selected from the listing of
Associated General Contractors, Association of Builders and Contractors and the
Construction Industry Advisory Council to the Department of Construction Science at
Texas A&M University. The survey instrument was emailed along with a cover letter
briefing about the project, the objectives, and proof that the survey was approved by the
IRB, Texas A&M University thus ensuring confidentiality. The survey was tested in
several regions so as to avoid regional bias. Here again the first step was calling
companies and identifying the right subjects. When this took a longer time, email
addresses of the concerned people were obtained directly from receptionists or any other
person in the office. Twenty surveys were distributed to companies who came for the
Department of Construction Science, Texas A&M University, Career Fair. Follow-up
phone calls and emails were sent to remind the subjects of the survey. Surveys which
were sent at a later stage had to be sent with cover letters which had instructions on
attaching the document to emails, reference contacts and phone numbers. This had to be
done to add authenticity to the survey and to improve the response rate. The survey
responses were obtained through email, fax and by mail.
24
DATA ANALYSIS
The results of the questionnaire were divided into three sections: counts of
dichotomous data, pie and bar charts for qualitative data, and respondent comments.
Graphical techniques are used to describe the overall data gathered. This marketing
research study is descriptive because the objectives include portraying characteristics of
marketing phenomena, determining the frequency of occurrence, and determining the
degree to which certain marketing variables are associated. The researcher tried to
identify some common practices in the industry by observing the frequency of
occurrence and also tried to identify if there were any relationships between customer
orientation and average sales growth, having a strategic plan and average sales growth.
Descriptive statistics
Data description was the primary objective of the researcher and the set of
measurements available was the entire population. The major problem with such a vast
source of data is the difficulty in organizing, summarizing and describing the data, or in
other words, making meaningful sense out of the available data. Therefore, use of
descriptive statistics was the best option to make interpretations of the data by reducing
the large set of measurements into a few summary measures that provide a good picture
of the original measurements (Kinnear, 1991). Graphical and numerical descriptive
techniques were used to describe the data collected. Graphical descriptive results and
summary measures are obtained from qualitative data and expressed as frequencies, bar
and pie charts. These results can be seen in Figures 1-33. Of the 18 questions used in the
25
survey, which are shown in Appendix A, question numbers 1, 5-7, 11, 12, 14, 15 provide
qualitative data and are expressed this way. They are mainly related to:
1) method of operation;
2) project delivery system;
3) market forces
4) marketing tools;
5) the job title of the person who completed the survey;
6) business objectives;
7) customer satisfaction indices; and,
8) strategic planning.
However, just describing what is in the sample was not enough to make logical
inferences. The researcher wanted to make inferences from the sample to the population
from which it was drawn. For this, hypothesis testing was essential.
Hypotheses testing
The numerical descriptive statistics tests used in this study included non-parametric
testing. Non-parametric methods were used since the data obtained is in nominal form.
Nominal data is data in which numbers serve only as labels to identify and categorize
objects (Kinnear, 1991). It is this data that will form variables to do the hypotheses
testing. For all hypotheses, the researcher tried to find the relationship of a certain
occurrence with one variable. Therefore, a univariate data analysis procedure was
employed.

26
As has been mentioned before, hypotheses testing typically consists of a null
hypothesis and an alternate hypothesis (Ott and Longnecker, 2001). The researcher
wanted to establish a statement regarding the relation ship between two sets of
quantities, which are:
1) geographic region and marketing strategies;
2) presence of strategic plan and average sales growth; and,
3) customer orientation and average sales growth.
In case of hypotheses testing, the null hypothesis is normally the opposite of what the
researcher is trying to prove. Thus, by failing to reject the null hypotheses the researcher
could prove that the hypothesizing was right. If not, the null hypothesis would fail to be
rejected and thus prove that the researcher’s hypothesizing was wrong (Ott and
Longnecker, 2001).
There are some decision rules that are related to hypotheses testing. The level of
significance is the probability the researcher assigned to the decision made about the null
hypotheses. The chances for error are comparatively lesser since sample size is 300, and
hence an α level or level of significance of 0.05 can be considered statistically
significant. This means that there is a 5 % chance that the researcher is wrong in making
the decision to reject the null hypothesis.
Chi-Square Goodness-of-Fit test
In a Chi-Square test, a hypothesized population distribution is compared with a
distribution generated by the sample. Since all the variables of interest for all hypotheses
27
are dichotomous in nature (i.e., “yes” and “no”) the Chi-Square Goodness-of-Fit test is
appropriate (Kinnear, 1991). Of the 18 questions use in the survey shown in Appendix
A, question numbers 2-4, 8-10 and 13 were dichotomously scaled “yes” and “no”. Since
all the hypotheses were used to find out the relationship between two variables, question
number 16 provides one variable for two hypotheses. The answers to these questions
were used for hypotheses testing.
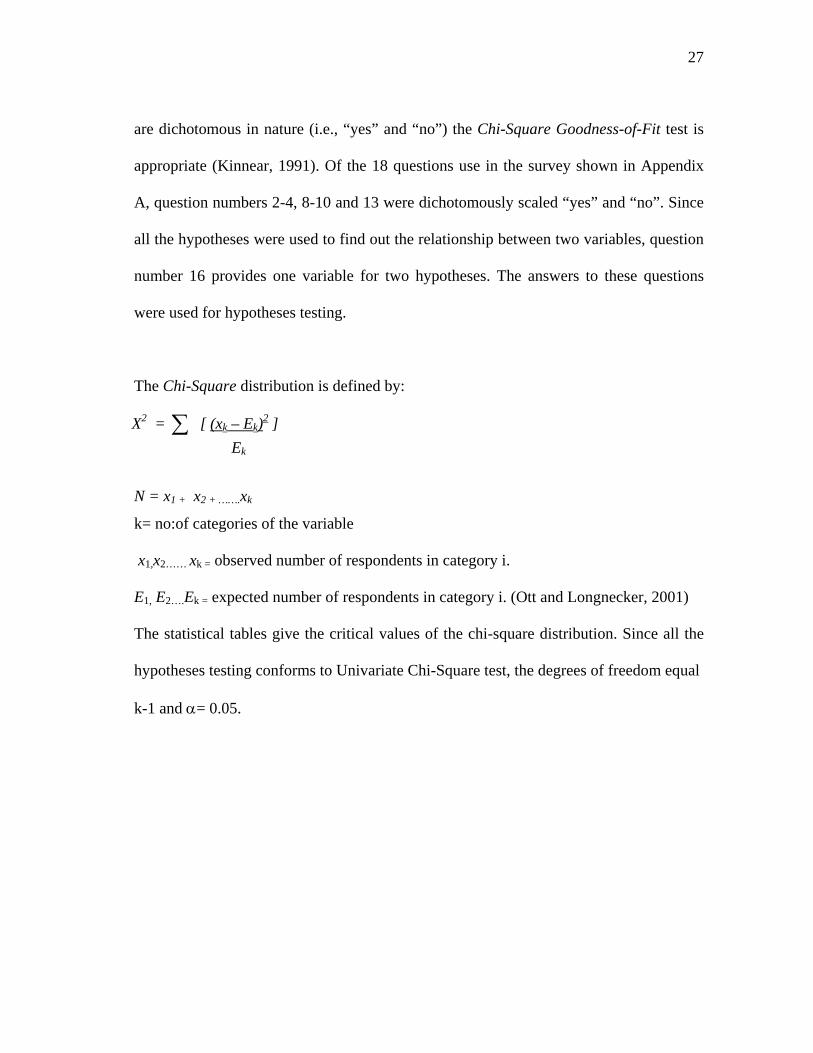
The Chi-Square distribution is defined by:
X2 = [ ∑ (xk – Ek)2 ] Ek
N = x1 + x2 + …….xk
k= no:of categories of the variable
x1,x2…… xk = observed number of respondents in category i.
E1, E2….Ek = expected number of respondents in category i. (Ott and Longnecker, 2001)
The statistical tables give the critical values of the chi-square distribution. Since all the
hypotheses testing conforms to Univariate Chi-Square test, the degrees of freedom equal
k-1 and α= 0.05.
28
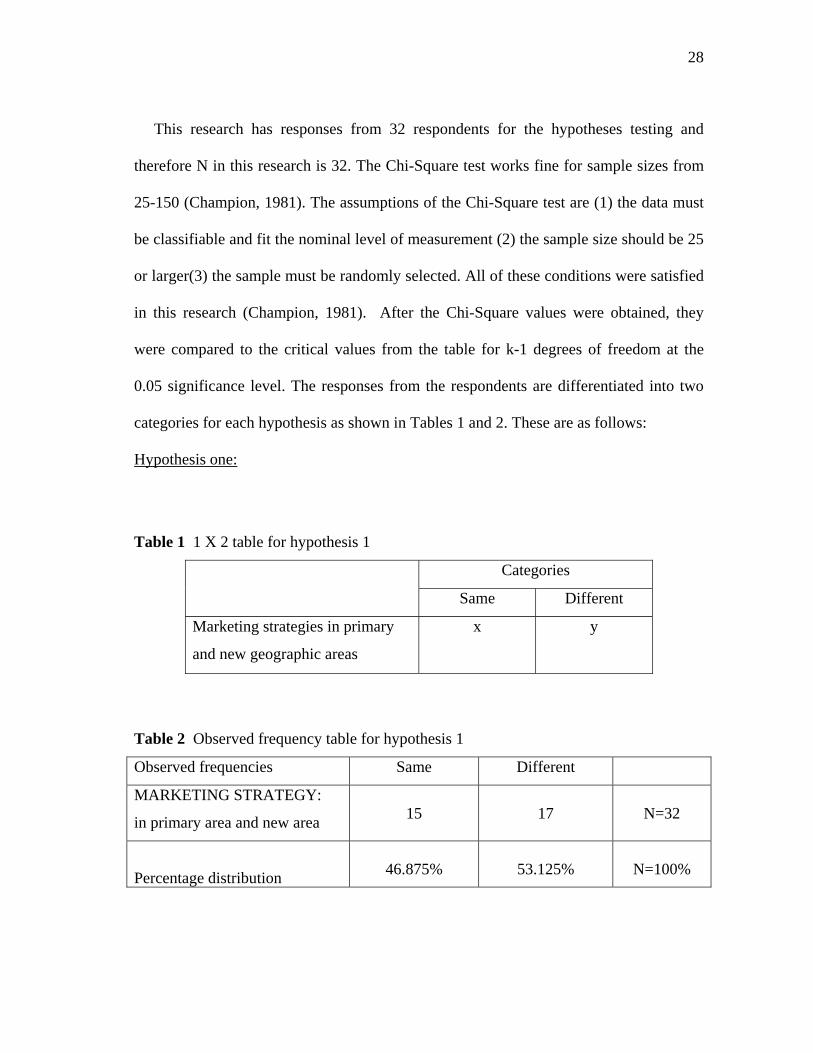
This research has responses from 32 respondents for the hypotheses testing and
therefore N in this research is 32. The Chi-Square test works fine for sample sizes from
25-150 (Champion, 1981). The assumptions of the Chi-Square test are (1) the data must
be classifiable and fit the nominal level of measurement (2) the sample size should be 25
or larger(3) the sample must be randomly selected. All of these conditions were satisfied
in this research (Champion, 1981). After the Chi-Square values were obtained, they
were compared to the critical values from the table for k-1 degrees of freedom at the
0.05 significance level. The responses from the respondents are differentiated into two
categories for each hypothesis as shown in Tables 1 and 2. These are as follows:
Hypothesis one:
Table 1 1 X 2 table for hypothesis 1
Categories
Same Different
Marketing strategies in primary
and new geographic areas
x y
Table 2 Observed frequency table for hypothesis 1
Observed frequencies Same Different
MARKETING STRATEGY:
in primary area and new area
15
17
N=32
Percentage distribution
46.875%
53.125%
N=100%

29
In this case k=2 categories, ‘same’ and ‘different’. Therefore, the expected frequencies
in each cell can be calculated as follows:
N/k = 32/2 = 16
As seen in Tables 3 and 4, this distribution of frequencies is based on the assumption
that companies with same and differing strategies are distributed equally.
Table 3 Expected frequency table for hypothesis 1
Expected frequencies Same Different
MARKETING STRATEGY:
in primary area and new area
16
16
N=32
Percentage distribution
50%
50%
N=100%
The following Chi-Square test is applied:
X2 = [ ∑ (xk – Ek)2 ] Ek
X2 = [ (15 – 16)2 ] + [ (17 – 16)2 ] 16 16 X2 = [ (1)2 ] + [ (1)2 ] = 0.125 16 16

30
Therefore the observed Chi-Square value = 0.125. The table value of Chi-Square value
with degree of freedom as k-1, which is 1 in this case and significance level 0.05, is
3.841. The table value is larger than the observed Chi-Square value, and therefore, the
H0 cannot be rejected.
Hypothesis two:
Table 4 2 X 2 table for hypothesis 2
Categories- Sales growth
Yes No
Yes a b
Presence of a
Strategic Plan No c d
Figure 1 is used to categorize the companies based on their average growth rate in
ascending order.
0.4 0.3 0.2 0.1
0 2 3 4 5 6 7
Figure 1 Growth rate of sample companies
-0.4 -0.3 -0.2 -0.1 1 8 9 1011121314151617181920212223242526 27 28 29 30 31 32
companies
aver
age
grow
th ra
te
31
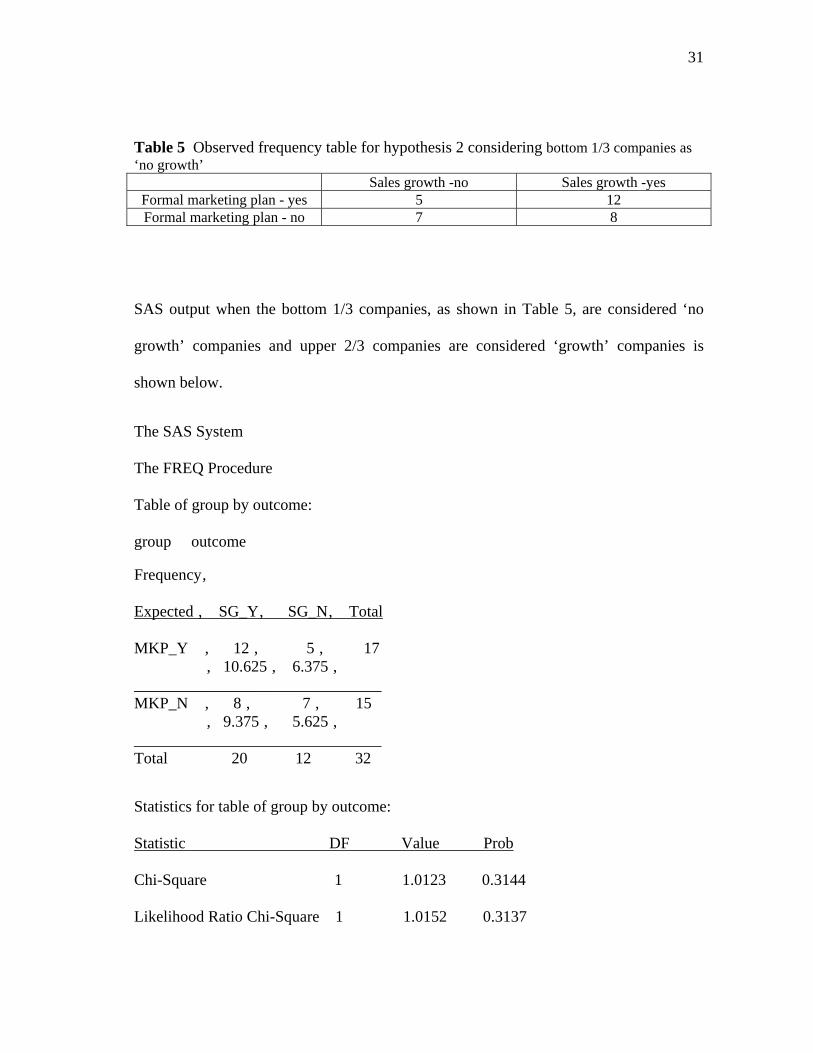
Table 5 Observed frequency table for hypothesis 2 considering bottom 1/3 companies as ‘no growth’
Sales growth -no Sales growth -yes Formal marketing plan - yes 5 12 Formal marketing plan - no 7 8
SAS output when the bottom 1/3 companies, as shown in Table 5, are considered ‘no
growth’ companies and upper 2/3 companies are considered ‘growth’ companies is
shown below.
The SAS System The FREQ Procedure Table of group by outcome: group outcome
Frequency‚ Expected ‚ SG_Y‚ SG_N‚ Total MKP_Y ‚ 12 ‚ 5 ‚ 17 ‚ 10.625 ‚ 6.375 ‚ _______________________________ MKP_N ‚ 8 ‚ 7 ‚ 15 ‚ 9.375 ‚ 5.625 ‚ _______________________________ Total 20 12 32
Statistics for table of group by outcome: Statistic DF Value Prob
Chi-Square 1 1.0123 0.3144
Likelihood Ratio Chi-Square 1 1.0152 0.3137

32
Statistic DF Value Prob
Continuity Adj. Chi-Square 1 0.4099 0.5220
Mantel-Haenszel Chi-Square 1 0.9807 0.3220
Phi Coefficient 0.1779
Contingency Coefficient 0.1751
Cramer's V 0.1779
The observed Chi-Square = 1.0123. The table value of Chi-Square value with degree of
freedom as( k-1)(k-1),which is 1 in this case and significance level 0.05, is 3.841. The
table value is larger than the observed Chi-Square value. Therefore, the H0 cannot be
rejected.
Table 6 Observed frequency table for hypothesis 2 considering companies falling below median as ‘no growth’
Sales growth -no Sales growth -yes Formal marketing plan - yes 9 10 Formal marketing plan - no 7 6
SAS output when companies falling below median, as shown in Table 6, are considered
‘no growth’ companies and those above median are ‘growth’ companies (50/50) is
shown below.
The SAS System
The FREQ Procedure Table of group by outcome: group outcome
33
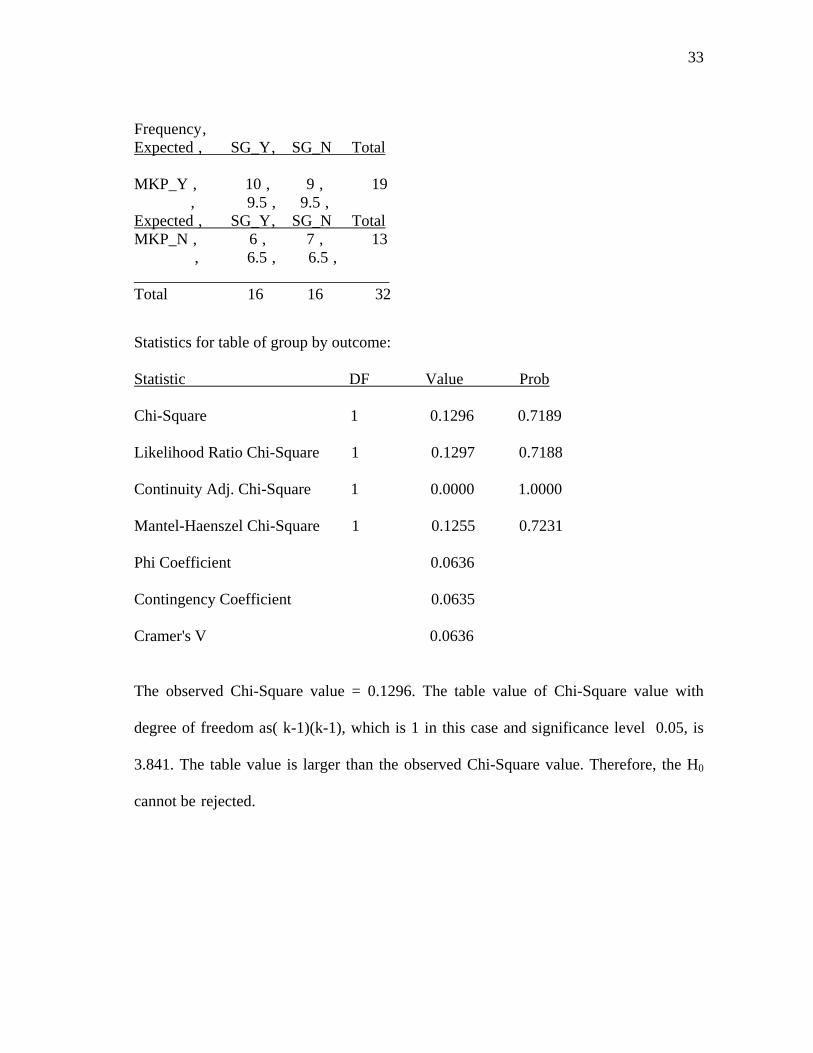
Frequency‚ Expected ‚ SG_Y‚ SG_N Total MKP_Y ‚ 10 ‚ 9 ‚ 19 ‚ 9.5 ‚ 9.5 ‚ Expected ‚ SG_Y‚ SG_N Total MKP_N ‚ 6 ‚ 7 ‚ 13 ‚ 6.5 ‚ 6.5 ‚ ________________________________ Total 16 16 32
Statistics for table of group by outcome: Statistic DF Value Prob
Chi-Square 1 0.1296 0.7189
Likelihood Ratio Chi-Square 1 0.1297 0.7188
Continuity Adj. Chi-Square 1 0.0000 1.0000
Mantel-Haenszel Chi-Square 1 0.1255 0.7231
Phi Coefficient 0.0636
Contingency Coefficient 0.0635
Cramer's V 0.0636
The observed Chi-Square value = 0.1296. The table value of Chi-Square value with
degree of freedom as( k-1)(k-1), which is 1 in this case and significance level 0.05, is
3.841. The table value is larger than the observed Chi-Square value. Therefore, the H0
cannot be rejected.

34
Hypothesis three:
Table 7 2 X 2 table for hypothesis 3
Categories- Sales growth
Yes No
Yes a b
Customer
Orientation No c d
Table 8 Observed frequency table for hypothesis 3 considering bottom 1/3 companies as ‘no growth’
Sales growth -no Sales growth -yes Customer orientation - yes 5 13 Customer orientation - no 7 6
SAS output when the bottom 1/3 companies, as shown in Tables 7 and 8, are considered
‘no growth’ companies and upper 2/3 companies are considered ‘growth’ companies is
shown below.
The SAS System
The FREQ Procedure
Table of group by outcome:
group outcome
Frequency‚ Expected ‚ SG_Y‚ SG_N‚ Total MKP_Y ‚ 13 ‚ 5 ‚ 18

35
‚ 11.25 ‚ 6.75 ‚ MKP_N ‚ 7 ‚ 7 ‚ 14 ‚ 8.75 ‚ 5.25 ‚_________ Total 20 12 32 Statistics for table of group by outcome: Statistic DF Value Prob
Chi-Square 1 1.6593 0.1977
Likelihood Ratio Chi-Square 1 1.6616 0.1974
Continuity Adj. Chi-Square 1 0.8466 0.3575
Statistic DF Value Prob
Mantel-Haenszel Chi-Square 1 1.6074 0.2049
Phi Coefficient 0.2277
Contingency Coefficient 0.2220
Cramer's V 0.2277
The observed Chi-Square value = 1.6593. The table value of Chi-Square value with
degree of freedom as( k-1)(k-1), which is 1 in this case and significance level 0.05, is
3.841. The table value is larger than the observed Chi-Square value. Therefore, the H0
cannot be rejected.
Table 9 Observed frequency table for hypothesis 3 considering companies falling below median as ‘no growth’
Sales growth -no Sales growth -yes Customer orientation - yes 11 10 Customer orientation - no 5 6

36
SAS output when companies falling below median, as shown in Table 9, are considered
‘no growth’ companies and those above median are ‘growth’ companies (50/50) is
shown below.
The SAS System
The FREQ Procedure
Table of group by outcome:
group outcome
Frequency Expected ‚ SG_Y‚ SG_N‚ Total CO_Y ‚ 11 ‚ 10 ‚ 21 Expected ‚ SG_Y‚ SG_N‚ Total ‚ 10.5 ‚ 10.5 ‚ ______________________________________ CO_N ‚ 5 ‚ 6 ‚ 11 ‚ 5.5 ‚ 5.5 ‚ ______________________________________ Total 16 16 32 Statistics for table of group by outcome:
Statistic DF Value Prob
Chi-Square 1 0.1385 0.7097
Likelihood Ratio Chi-Square 1 0.1387 0.7096
Continuity Adj. Chi-Square 1 0.0000 1.0000
Mantel-Haenszel Chi-Square 1 0.1342 0.7141
Phi Coefficient 0.0658
The observed Chi-Square value = 0.1385. The table value of Chi-Square value with
degree of freedom as ( k-1)(k-1), which is 1 in this case and significance level 0.05, is

37
3.841. The table value is larger than the observed Chi-Square value. Therefore, the H0
cannot be rejected.
Survey results
The primary question for the qualitative data was to identify whether their new
market venture was within their primary market area or outside their primary market
area. Based on that, the rest of the responses were classified. The first topic of interest
was the method of operation in new markets.
25 Direct operation
20
15
10 Joint venture Acquisition5
Franchise Merger0
1 2 3 4 5
No:
of re
spon
dent
s
Figure 2 Operations within primary area

38
Acquisition
Merger 0%
Joint venture 16%
Franchise 0%
Direct operation71%
13%
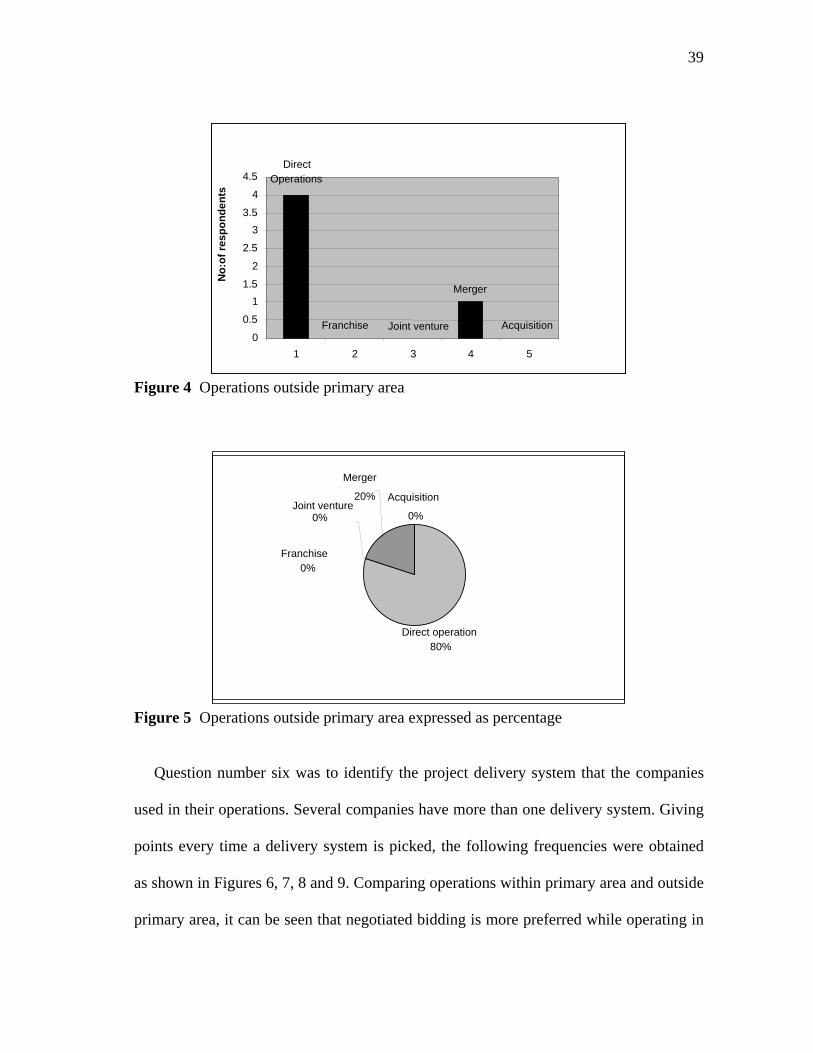
Figure 3 Operations within primary area expressed as percentage Figures 2 and 3 shows that for ventures in a primary market, 71% of respondents
resort to direct operation, followed by joint ventures (16%), and acquisition (13%).
Whereas, in the case of operations outside the primary area, which are shown in Figures
4 and 5, 80% of respondents resorted to direct operations followed by mergers (20%). In
the case of operations within primary area, acquisition is a feasible option because the
acquiring company would have greater knowledge of the company that they are
acquiring. Joint venture is also possible for the same reason. It is easier to trust someone
whom they have known for a long time. These two options are less feasible when trying
to venture into a new area because it becomes riskier for the company, which is
acquiring or going in for joint venture. Joint ventures help the companies to pool in
resources, technical capabilities and capital. Merger is a feasible option in operations
outside the primary area, so that the name of the partner company can be utilized in
getting established in the new geographic region.
39
Direct
Figure 4 Operations outside primary area
Figure 5 Operations outside primary area expressed as percentage Question number six was to identify the project delivery system that the companies
used in their operations. Several companies have more than one delivery system. Giving
points every time a delivery system is picked, the following frequencies were obtained
as shown in Figures 6, 7, 8 and 9. Comparing operations within primary area and outside
primary area, it can be seen that negotiated bidding is more preferred while operating in
Acquisition
Merger
Joint ventureFranchise
Operations
0 0.5
1 1.5
2 2.5
3 3.5
4 4.5
No:
of re
spon
dent
s
1 2 3 4 5
Merger
20% AcquisitionJoint venture
0%
Franchise0%
Direct operation80%
0%

40
the primary area (36%) than in the new area (14%). This could be because of the
familiarity of clients. It is easier to negotiate with people whom the companies are
familiar with. Design/Build is the most preferred system while operating outside the
primary geographic area (43%). This could be because there is only a single point of
contact and also because this system is more professionally and technically advanced.
Competitive bidding and CM@risk are almost equally used in operations within and
outside the primary area.
Negotiated
Figure 6 Delivery system within primary area
CM @ riskCompetitive
bidding
bidding
Design Build
0 2 4 6 8
10 12 14 16
1 2 3 4
No:
of re
spon
dent
s

41
Design/BuildCM@risk24%24%
Competitive bidding
16%Negotiated
bidding36%
Figure 7 Delivery system within primary area expressed as percentage
3.5 Design Build
3 2.5
CM @ risk2
Negotiated Competitive 1.5 bidding bidding
1 0.5
0 1 2 3 4
No:
of re
spon
dent
s
Figure 8 Delivery system outside primary area

42
CM@risk
Design/Build
43%Competitive
bidding
14% Negotiated bidding
14%
29%
Figure 9 Delivery system outside primary area expressed as percentage Question number seven was to identify the market forces that affected market entry.
For operations within primary area, competitive (44%) and economic forces (35%) were
more prominent. For ventures into new geographic regions, socio-cultural (10%) and
regulatory (10%) forces were more prominent than ventures in the primary area (3% and
6% respectively) as seen in Figures 10, 11, 12 and 13. This is expected because there are
variations in law from place to place and companies need to be aware of that. The
attitude of people and working style also changes from place to place. The companies
need to be aware of this when they venture into unfamiliar territories.

43
Competitive
Figure 10 Market forces within primary area
Figure 11 Market forces within primary area expressed as percentage
Sociocultural
TechnologicalLegal & regulatory
Economic
0 2 4 6 8
10 12 14 16
No:
of re
spon
dent
s
1 2 3 4 5
Socio cultural
Technological12%
Legal & regulatory Competitive
6%44%
Economic35%
3%

44
Figure 12 Market forces outside primary area
Figure 13 Market forces outside primary area expressed as percentage
Question number eight was to identify whether the companies undertook market
research before their new venture. It can be said that undertaking a market research
shows planning capabilities of the company. For ventures in the primary area, 59% of
the respondents said “yes” and for ventures outside the primary area, 100% of
respondents said “yes” as shown in Figures 14, 15, 16 and 17. In the former case, the
Sociocultural TechnologicalLegal &
regulatory
Economic
Competitive
0 0.5
1 1.5
2 2.5
3 3.5
4 4.5
No:
of re
spon
dent
s
1 2 3 4 5
Socio cultural
Technological10% Competitive
40%Legal & regulatory
10%
Economic30%
10%

45
high percentage of “no” respondents is because they are probably familiar with the
market conditions and market forces and so they did not have to undertake research. In
the latter case, 0% of “no” respondents is because nobody wanted to take the risk of not
knowing properly about the area that they were stepping into. The researcher is linking
market research with the presence of strategic business planning within the companies
because market researches are essential components in the process of preparing a
business plan. So, companies who did not undertake market research were also mostly
classified under companies, which did not have a strategic plan. This categorization is
again dependent on the answers, which the companies gave for question numbers nine
and ten.
Market research-within primary area
02468
1012141618
YES NO
No:o
f res
pond
ents
Series1
Figure 14 Market research within primary area

46
YES59%
NO41%
YESNO
Figure 15 Market research within primary area expressed as percentage
Market research-outside primary area
0
1
2
3
4
5
6
YES NO
No:o
f res
pond
ents
Series1
Figure 16 Market research outside primary area

47
YES100%
NO0%
YESNO
Figure 17 Market research outside primary area expressed as percentage
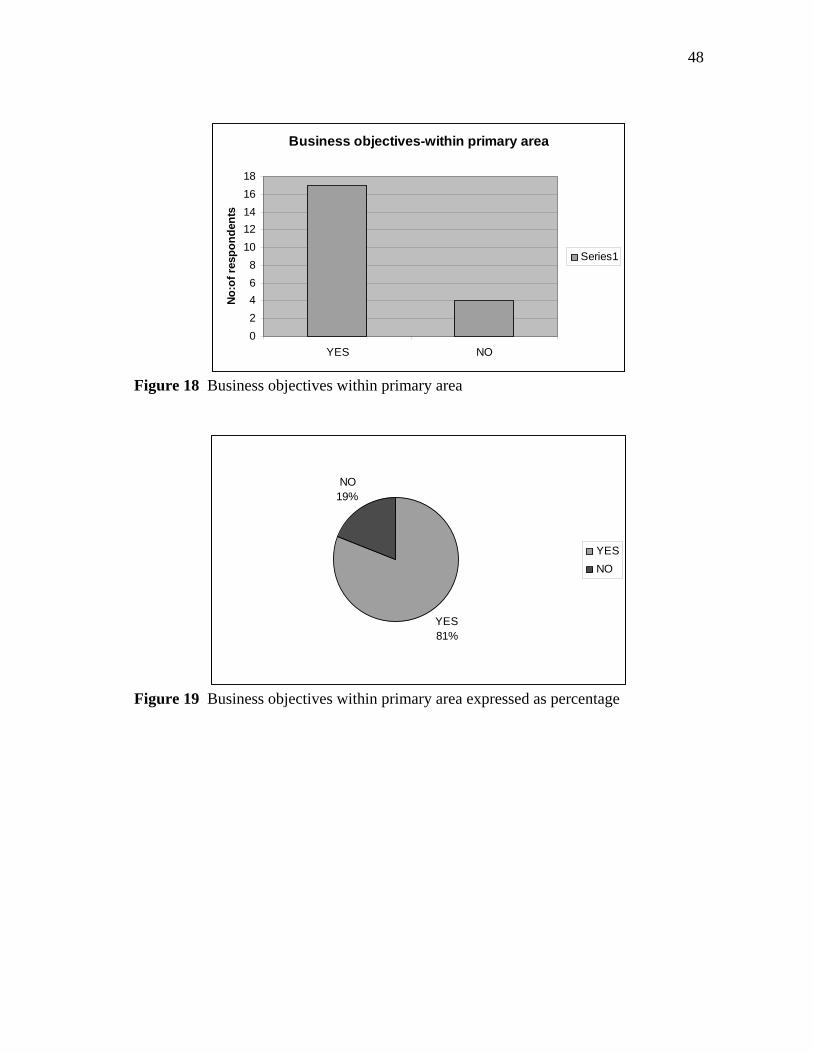
Question number nine, regarding business objectives was asked to find out whether
the companies had any fixed business objectives before they took up their business
venture. It was found that for ventures inside primary area, 19% of the respondents did
not have fixed business objectives. When compared to ventures outside primary area,
this value was 0% as shown in Figures 18, 19, 20 and 21. The researcher links the
presence of having fixed business objectives as part of the strategic plan. The researcher
reasons that for ventures outside primary business area, it is more important to have
fixed business objectives since the companies are spending a good amount of money for
such ventures.
48
Business objectives-within primary area
02468
1012141618
YES NO
No:o
f res
pond
ents
Series1
Figure 18 Business objectives within primary area
YES81%
NO19%
YESNO
Figure 19 Business objectives within primary area expressed as percentage

49
Business objectives-outside primary area
0
1
2
3
4
5
6
YES NO
No:o
f res
pond
ents
Series1
Figure 20 Business objectives outside primary area
YES100%
NO0%
YESNO
Figure 21 Business objectives outside primary area expressed as percentage
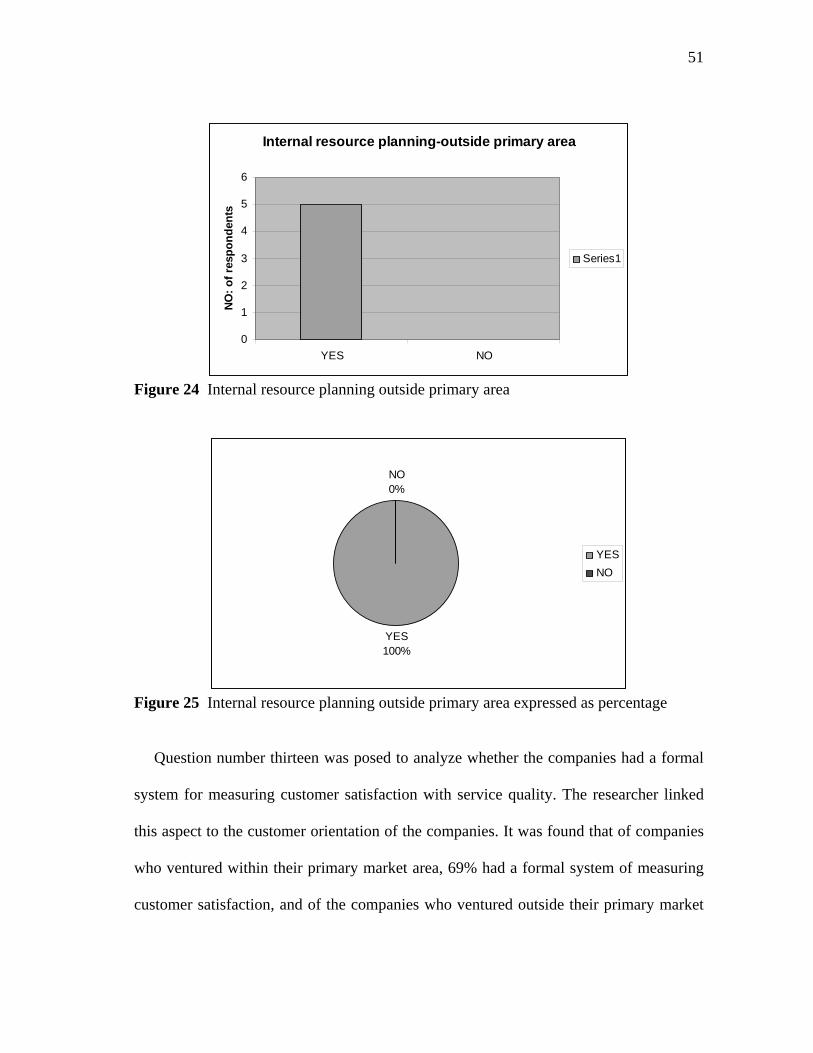
Question number ten was to identify whether the companies undertook internal
resource planning before venturing into new markets. In case of ventures within the
primary area, there was a small percentage of respondents (11%) who said that they did
not have to undertake internal resource planning as seen in Figures 22, 23, 24, and 25.
The researcher again links the aspect of internal resource planning to the overall strategic

50
planning capabilities of the companies. It could be possible that the companies who said
“no” to internal resource planning directly operated their projects from the main office.
Internal resource planning-within primary area
0
5
10
15
20
25
30
YES NO
No:
of re
spon
dent
s
Series1
Figure 22 Internal resource planning within primary area
YES89%
NO11%
YESNO
Figure 23 Internal resource planning within primary area expressed as percentage
51
Internal resource planning-outside primary area
0
1
2
3
4
5
6
YES NO
NO
: of r
espo
nden
ts
Series1
Figure 24 Internal resource planning outside primary area
YES100%
NO0%
YESNO
Figure 25 Internal resource planning outside primary area expressed as percentage
Question number thirteen was posed to analyze whether the companies had a formal
system for measuring customer satisfaction with service quality. The researcher linked
this aspect to the customer orientation of the companies. It was found that of companies
who ventured within their primary market area, 69% had a formal system of measuring
customer satisfaction, and of the companies who ventured outside their primary market

52
area, 75% had a formal system of measuring customer satisfaction as seen in Figures 26,
27, 28 and 29. So it can be reasoned that, when companies enter unfair territories, they
are more cautious and proactive.
Formal system of measuring customer satisfaction with service quality - within primary
area
0
5
10
15
20
25
YES NO
No:
of r
espo
nden
ts
Series1
Figure 26 System of measuring customer satisfaction within primary area
YES69%
NO31%
YESNO
Figure 27 System of measuring customer satisfaction within primary area expressed as percentage

53
Formal system of measuring customer satisfaction with service quality -
outside primary area
00.5
11.5
22.5
33.5
YES NO
No:o
f res
pond
ents
Series1
Figure 28 System of measuring customer satisfaction outside primary area
YES75%
NO25%
YESNO
Figure 29 System of measuring customer satisfaction outside primary area expressed as percentage
The next set of questions was slightly different from the previous set. Question
numbers eleven and twelve were used to rank the marketing tools that the companies
used in their ventures according to the order of importance. It was seen that for ventures
within the primary area personal selling was ranked first by maximum number of
respondents. Advertising was ranked lowest as seen in Figure 30. An interesting
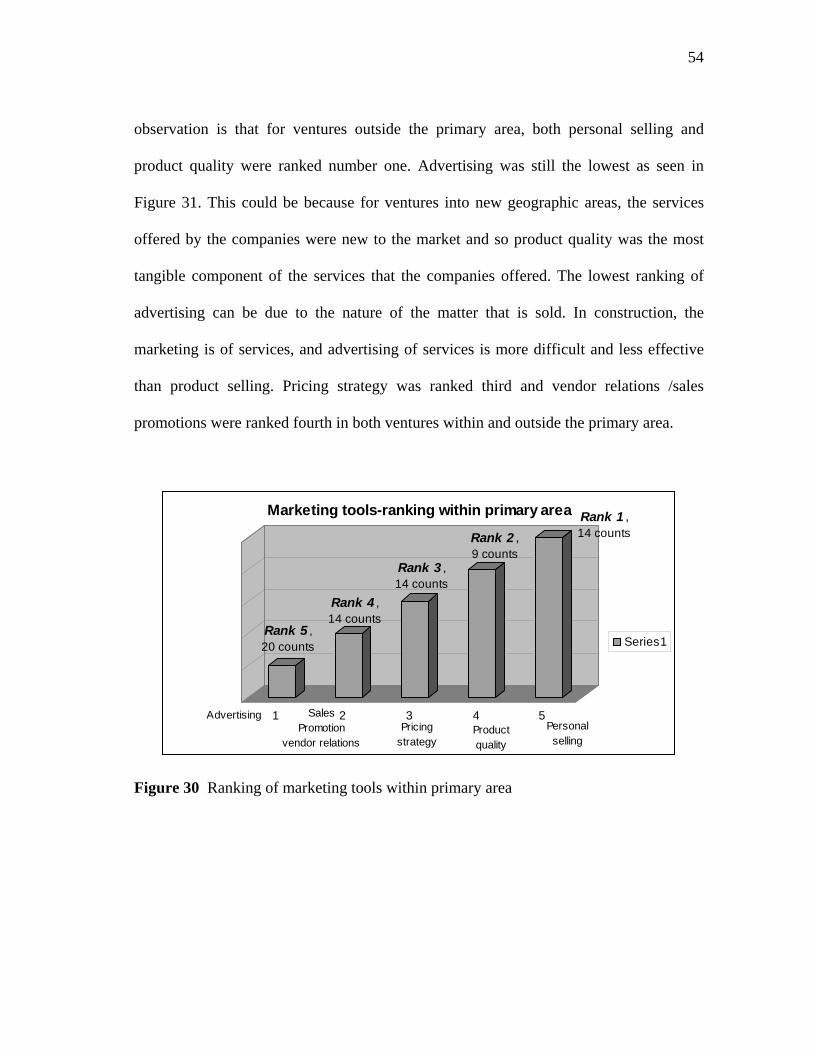
54
observation is that for ventures outside the primary area, both personal selling and
product quality were ranked number one. Advertising was still the lowest as seen in
Figure 31. This could be because for ventures into new geographic areas, the services
offered by the companies were new to the market and so product quality was the most
tangible component of the services that the companies offered. The lowest ranking of
advertising can be due to the nature of the matter that is sold. In construction, the
marketing is of services, and advertising of services is more difficult and less effective
than product selling. Pricing strategy was ranked third and vendor relations /sales
promotions were ranked fourth in both ventures within and outside the primary area.
Rank 5 ,20 counts
Rank 4 ,14 counts
Rank 3 ,14 counts
Rank 2 ,9 counts
Rank 1 , 14 counts
1 2 3 4 5
Marketing tools-ranking within primary area
Series1
Sales Promotion
vendor relations
AdvertisingPricing
strategyProduct quality
Personal selling
Figure 30 Ranking of marketing tools within primary area

55
, Rank 1
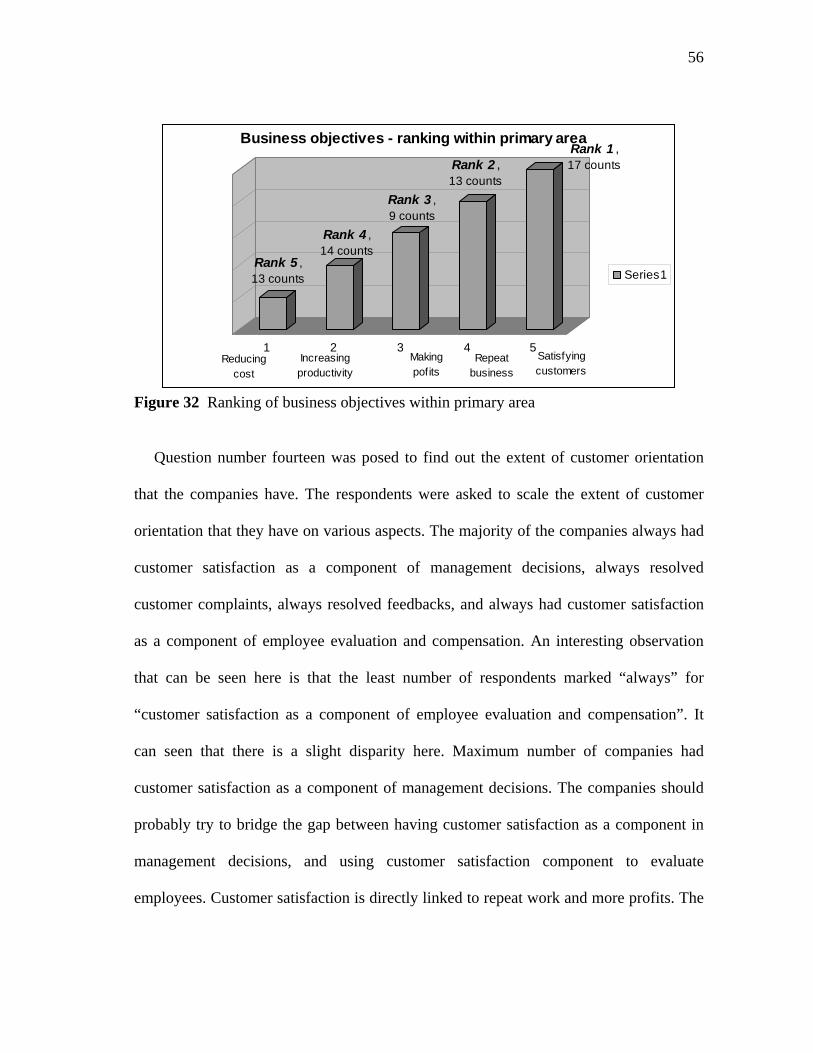
Figure 31 Ranking of marketing tools outside primary area Question number fifteen was related to the business objectives of the companies. The
respondents were asked to rank their business objectives in the order of importance. It
was found that satisfying customers was ranked first by maximum respondents and
reducing costs was ranked lowest as seen in Figure 32. Most of the respondents believed
that getting repeat business and making profits often followed the idea the satisfying
customers and so satisfying customers was the most important.
Rank 5 , 18 counts
Rank 4 ,10 counts
Rank 3 ,10 counts
,Rank 114 counts
13 counts
1 2 3 4 5Sales Advertising Promotion Personal Pricing Product
sellingstrategyvendor relations quality
56
Rank 5 ,13 counts
Rank 4 ,14 counts
Rank 3 ,9 counts
Rank 2 ,13 counts
Rank 1 , 17 counts
1 2 3 4 5
Business objectives - ranking within primary area
Series1
Increasing productivity
Reducing cost
Making pofits
Repeat business
Satisfying customers
Figure 32 Ranking of business objectives within primary area
Question number fourteen was posed to find out the extent of customer orientation
that the companies have. The respondents were asked to scale the extent of customer
orientation that they have on various aspects. The majority of the companies always had
customer satisfaction as a component of management decisions, always resolved
customer complaints, always resolved feedbacks, and always had customer satisfaction
as a component of employee evaluation and compensation. An interesting observation
that can be seen here is that the least number of respondents marked “always” for
“customer satisfaction as a component of employee evaluation and compensation”. It
can seen that there is a slight disparity here. Maximum number of companies had
customer satisfaction as a component of management decisions. The companies should
probably try to bridge the gap between having customer satisfaction as a component in
management decisions, and using customer satisfaction component to evaluate
employees. Customer satisfaction is directly linked to repeat work and more profits. The
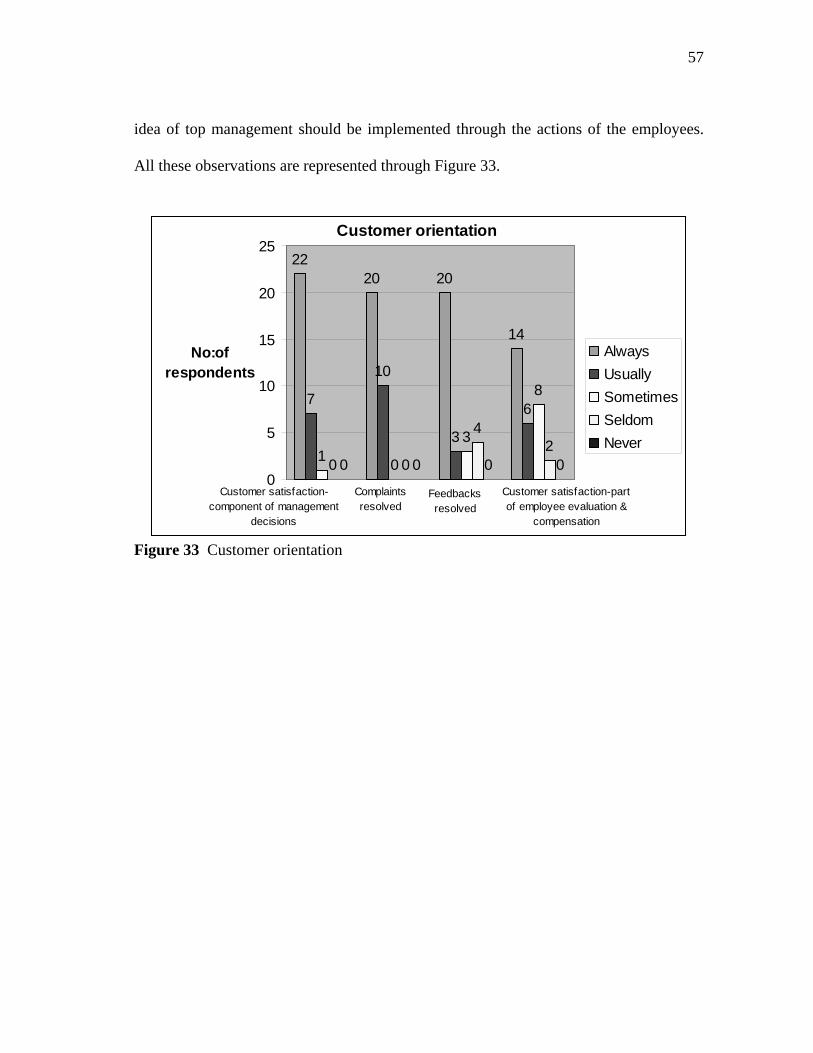
57
idea of top management should be implemented through the actions of the employees.
All these observations are represented through Figure 33.
Customer orientation
2220 20
14
7
10
3
6
1 0
3
8
0 0
42
0 0 0 00
5
10
15
20
25
No:of respondents
AlwaysUsuallySometimesSeldomNever
Customer satisfaction-component of management
decisions
Complaints resolved
Feedbacks resolved
Customer satisfaction-part of employee evaluation &
compensation
Figure 33 Customer orientation

58
CONCLUSIONS
Findings from respondents’ comments
Monopoly in market
It was seen from several respondents’ comments that they prefer to enter a market
where they know that they can have a monopoly. In other words, companies, which
knew that they would have a competitive and technological advantage over other players
in the new market ventured into new areas. This strategy also included targeting certain
market segments where competition was less.
Pursue one project
Several respondents expressed that they preferred to target one particular project to
enter a new market. During the execution of that project, the company understands the
new market and the players in that particular region and later decides whether to
continue working in the market or not. Some companies also follow their clients to new
markets. Such entries are less risky for the companies.
Join with local players
For some general contractors entering new markets, the players, the legal, regulatory
and economic forces were new to them. To overcome these difficulties they teamed up
with local players such as subcontractors, suppliers, and laborers or even went in for
joint ventures.

59
Establish good PR
Many respondents expressed that good word of mouth and networking was important
to stay in business. Individuals working in the marketing department did most of the
service selling and were usually the first people to go to the new market. Some
companies also indicated that over 50 % of the work was obtained through repeat clients
thus highlighting the importance of relationship selling.
External factors
Some of the external factors that the companies indicated were economic forces and
behavior of market. Doing economic down cycles it was important for companies to
search for opportunities in new markets to stay in business. Sometimes the markets
became stagnant and again it became important for companies to venture out into new
markets in search of growth opportunities.
Recommendations
• Having a competitive and technological advantage makes market entry easier
because there will be lesser competition in that sector. Being an expert in specific
areas and by targeting a certain segment will help the companies focus on tehir
primary business objectives.
• Networking, or in other words personal selling, is an important aspect of getting
new projects into any market. The marketing mix for services marketing consists
of people and processes. Thus the people who network become an essential
ingredient of the business development process.

60
• Customer orientation is an essential factor in relationship building. This should
be incorporated into the company mission and buiness objectives.
• If a company knows that it is the only player in a certain market, it does not need
a specific strategic plan. But long term goals are important for ecomonic growth.
This is where well planned market positioning comes into play.
• Market research is important while entering new geographic areas to know the
woking style of subcontractors,reglatory issues in the area and scopes of works
conducted by subcontractors.
• Joint ventures with local companies help to reduce competition and local orcs
acting against the entry of new companies.Such ventures can take advantage of
local market knowledge and relationships.
• A good rapport with clients is a must because they may bring work to the
companies even during economic down cycles.
• Companies should do SWOT analysis which should include a business forecast
and this should be incorporated into the market plan.
• As one of the respondents has clearly stated, the goal is to make clients and not
customers. There is more personal attachment in the former and the seller needs
to gain the clients’ confidence in the first few moments of contact for long lasting
relationship.
• Developing separate marketing plans for different market sectors, helps to focus
and plan resources for market entry.

61
• When growth stunts in existing markets, the business developers should be far
sighted enough to look for new opportunities and such ideas should be part of the
strategic plan.
• When the purpose of entering new markets is to serve existing clients,the best
way of operation is direct operation because competitive forces are lesser in such
cases.
• Relationships with clients should be maintained until project completion.
Completion of project to the perfect quality with proper management of close out
documents is essential to create a long lasting impresion about the general
contractor.
• As one respondent clearly mentioned, for commercial developers, tensions may
run high as they struggle to begin leasing the project by moving the construction
loan to permanent financing. Therefore, it is essential for general contractors to
stick to the schedules to maintain good reletionship with clients.
• Though it could not be proved using hypothesis testing, the relationship between
having customer orientation and sales growth, the general observation and
comments of companies who were categorized in the ‘growth’ category
expressed strong customer orientation. This is the same case with having a
market plan for entries into new markets. The presence of a market plan shows
vision, far sightedness, planning capabilities. A market plan will help companies
plan for for any unforeseen circumstances that may occur in future. A majority of
the companies in the growth category expressed very strong planning ideas.

62
Recommendations for future studies
Sample size is one of the critical factors involved in making a statistical analysis
valid. Thus future studies can be conducted with wider sample sizes and with a wider
sample type such as considering general contractors outside Texas. This research is
restricted to general contracting constuction companies and so future studies can be
conducted to include Design/Build firms, subcontractors and architectural/engineering
firms. In the beginning of the study, it was assumed that all the subjects who answered
the questionnaires were knowledgeable in their own fields. In future, surveys can be
conducted amongst a wider range of professionals in the companies who know about the
working of the companies.
63
REFERENCES
Bennett, J.(2000) Construction –The Third Way. Butterworth-Heinemann, Oxford.
Bessom, R.(1975) Marketing’s role in construction firms. Journal of Construction
Engineering and Management, 9(3), 647-659.
Champion, J. D. (1981) Basic Statistics for Social Research. Macmillan Publishing Co.
Inc, New York.
Fellows, R.,Langford, D., Newcombe, R. and Urry, S.(2002) Construction Management
in Practice. Blackwell Science, London.
Harris, F. and McCaffer, R. (2001) Modern Construction Management. Blackwell
Science, London.
Kinnear, T. C. (1991) Marketing Research : An Applied Approach. McGraw-Hill, New
York.
Leedy, P. D. (1993) Practical Research : Planning and Design. Macmillan Publishing
Co., New York.
Narver, J. A. and Slater, S. F. (1990) The effect of market orientation on business
profitability. Journal of Marketing, 54, 20-35.
Ngowi A.B., Iwisi D.S., and Rwelamila P.D.(2001) Creating and sustaining a
construction market position. International Journal for Construction Marketing,
1(1), 1-2.
Ott, L., and Longnecker, M.(2001) An Introduction to Statistical Methods and Data
Analysis. Duxbury Press, Pacific Grove, CA .
Preece, C.N., Moodley, K. and Smith, A.M. Corporate Communications in
Construction: Public Relations Strategies for Successful Business and Projects.
Blackwell Science, Oxford.
Pryor, P. (2001). Marketing Construction Services. Industrial Press, Inc., New York.
Smyth, H. (2000). Marketing and Selling Construction Services. Blackwell Science,
London.
Zeithmal,V. and Bitner,M.(2000). Services Marketing. Irwin McGraw-Hill, Boston.
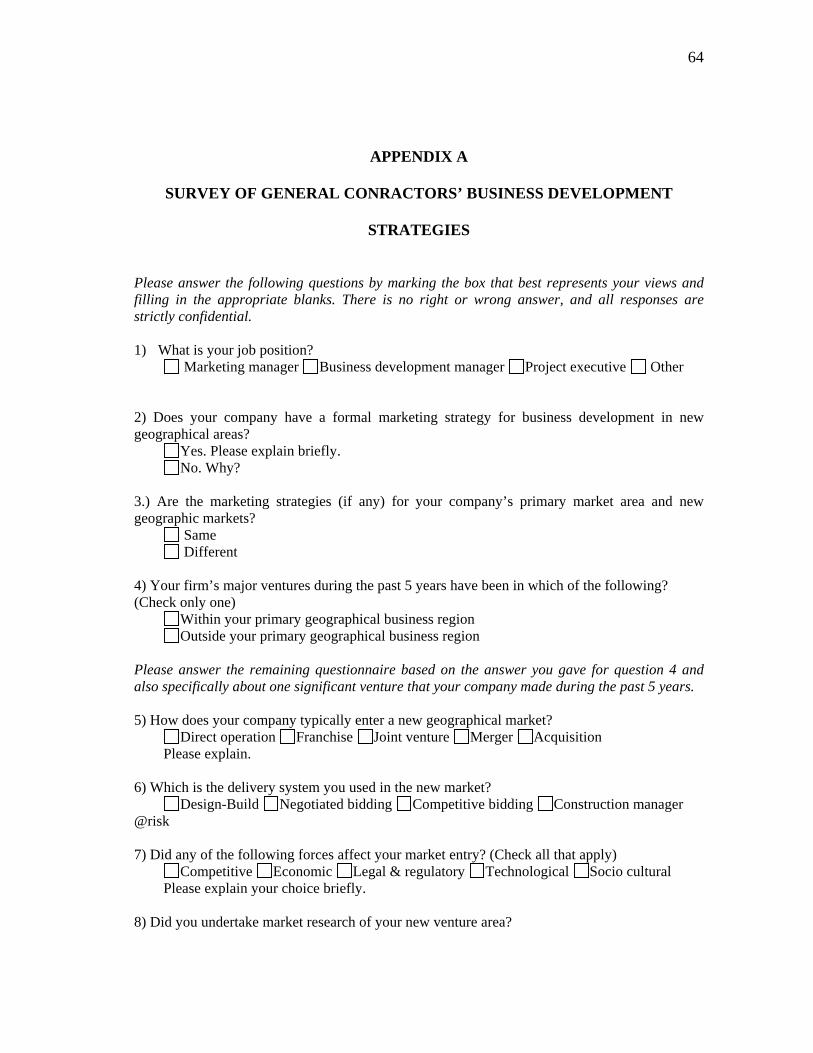
64
APPENDIX A
SURVEY OF GENERAL CONRACTORS’ BUSINESS DEVELOPMENT
STRATEGIES
Please answer the following questions by marking the box that best represents your views and filling in the appropriate blanks. There is no right or wrong answer, and all responses are strictly confidential. 1) What is your job position? Marketing manager Business development manager Project executive Other 2) Does your company have a formal marketing strategy for business development in new geographical areas? Yes. Please explain briefly. No. Why? 3.) Are the marketing strategies (if any) for your company’s primary market area and new geographic markets? Same Different 4) Your firm’s major ventures during the past 5 years have been in which of the following? (Check only one) Within your primary geographical business region Outside your primary geographical business region
Please answer the remaining questionnaire based on the answer you gave for question 4 and also specifically about one significant venture that your company made during the past 5 years. 5) How does your company typically enter a new geographical market? Direct operation Franchise Joint venture Merger Acquisition Please explain. 6) Which is the delivery system you used in the new market? Design-Build Negotiated bidding Competitive bidding Construction manager @risk 7) Did any of the following forces affect your market entry? (Check all that apply) Competitive Economic Legal & regulatory Technological Socio cultural Please explain your choice briefly. 8) Did you undertake market research of your new venture area?

65
Yes No. 9) Did you have clearly defined objectives for your new venture before entering the new market? Yes No. 10) Did you do any kind of internal resource planning before you entered the new market? Yes No. 11) Please rank the following marketing tools in the order of their importance to your company’s business development activities in your primary market area. (most important=1: and least important=5) Pricing strategy Advertising Personal selling Sales promotion activities/vendor relations Product quality 12) Please rank the marketing tools again in order of their importance for new business development in new market areas. Pricing strategy Advertising Personal selling Sales promotion activities/vendor relations Product quality 13) Does your company have a formal system for measuring customer satisfaction with service quality? Yes No. 14) Please rate your perception of the “customer-orientation” of your company (1= always, 2= usually, 3= sometimes, 4= seldom, 5= never). Customer satisfaction is a key component in all management decisions. Customer complaints are quickly resolved Customer feedback is solicited Customer satisfaction is an important part of employee evaluation and compensation 15) Please rank the importance to the management of your company of the following business objectives (1= Most Important and 5= Least Important) Making profits Satisfying customers Getting repeat business Increasing productivity Reducing costs 16) Please provide the total annual sales volume for your company for the 1996-2002 period. This information is critical to the study. It is to be used for statistical

66
purposes only. It is strictly confidential and will be reported only in aggregate form with data from all companies participating in the survey. 1996 1997 1998 1999 2000 2001 2002 17) What is your company’s target segment currently? (Please check what is appropriate and give percentage market share for each) Commercial % Transportation % Industrial % Schools % Medical % Entertainment % Religious % Residential % Utilities % 18) Please feel free to add anything else related to new ventures, lessons learned, business strategies etc. that you feel are pertinent to this study of General Contractors’ business development strategies. Would you like to receive a summary of this study? Yes No Thank you for your cooperation. Please save and attach your completed survey to an email addressed to: [email protected] Seenu Anna Kurien Graduate Student Department of Construction Science Texas A&M University 3137 TAMU College Station Texas 77843-3137.

67

68

69
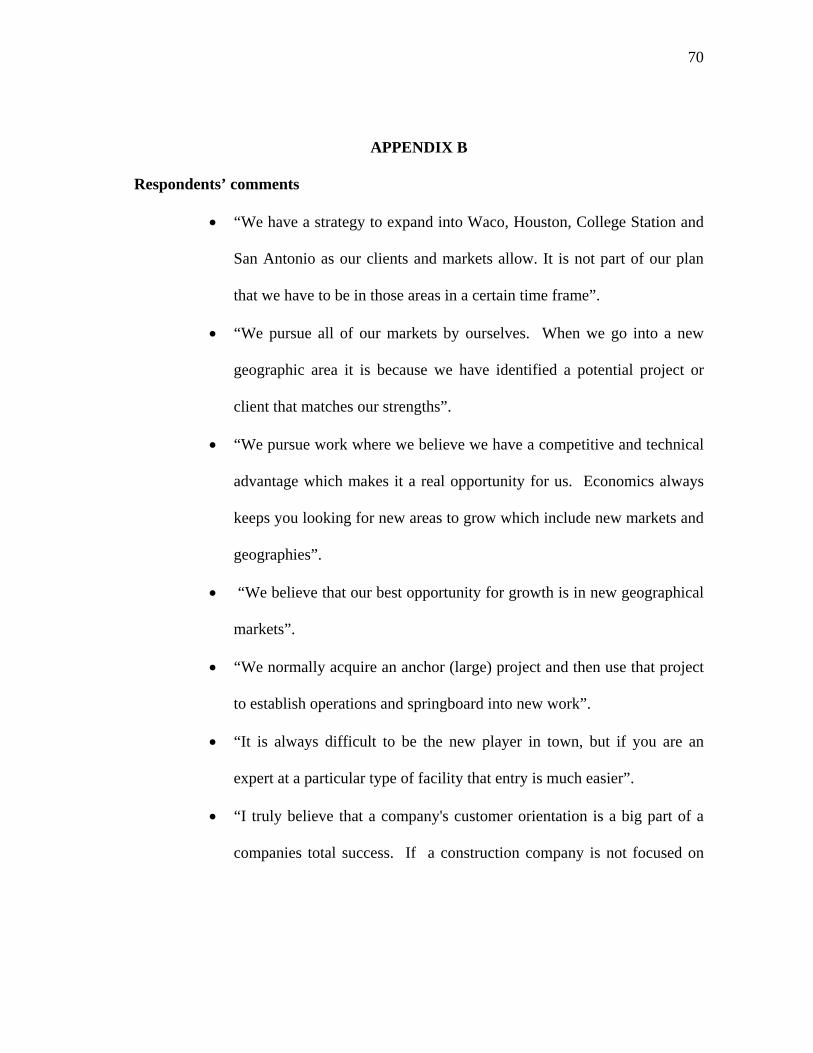
70
APPENDIX B
Respondents’ comments
• “We have a strategy to expand into Waco, Houston, College Station and
San Antonio as our clients and markets allow. It is not part of our plan
that we have to be in those areas in a certain time frame”.
• “We pursue all of our markets by ourselves. When we go into a new
geographic area it is because we have identified a potential project or
client that matches our strengths”.
• “We pursue work where we believe we have a competitive and technical
advantage which makes it a real opportunity for us. Economics always
keeps you looking for new areas to grow which include new markets and
geographies”.
• “We believe that our best opportunity for growth is in new geographical
markets”.
• “We normally acquire an anchor (large) project and then use that project
to establish operations and springboard into new work”.
• “It is always difficult to be the new player in town, but if you are an
expert at a particular type of facility that entry is much easier”.
• “I truly believe that a company's customer orientation is a big part of a
companies total success. If a construction company is not focused on

71
the customer and customer satisfaction, then it is truly difficult to be
successful”.
• “Typically, our approach is to identify specific sector(s) to direct our
efforts with the goal of becoming a dominant and recognized competitor
in the chosen sector(s)”.
• “Local contractors are hard to beat”.
• “We don’t have a formal marketing strategy because we have a highly
specialized niche”.
• “We do not enter a new geographical market unless an existing client
asks us to do a project outside of our typical geographic areas”.
• “All markets have nuances that make them different, usually, from your
home market. You have to gain an understanding of the subcontractor
market, the regulatory rules and issues of scope idiosyncrasies (ie; does
the drywaller do the taping and floating or does the painter)”.
• “We believe the key to successful business development efforts follows
the old axiom, "it's not what you know, it is WHO you know". Technical
ability is a commodity - understanding the corporate real estate network
and knowing who is about to build something, proving your value to that
client, landing the project, doing a good job, then using that client as a
reference is the way to grow a company”.
• “Each new geographical area must have enough potential work by X
volume to sustain itself as a new corporate district”.

72
• “We have a formal marketing strategy.It is called "relationship selling"
and is based on the premise that clients do business with people first and
companies second”.
• “We start out by staffing a new job and if the market warrants grow the
operation to include other clients over time”.
• “There are always forces. In public work, the key force is to team with
local companies. This minimizes the traditional push back by locals not
wanting to let in out-of-town firms”.
• “Buy with local company or joint venture with local company to gain
advantage of local market knowledge and relationships”.
• “We use "National Account Rep" system to develop contact rapport;
follow up with standard, then customize marketing materials; and
maintain relationships to be aware of projects on horizon in any area”.
• “By specifically promoting our unique services directly to clients who
could use us in order to cultivate a successful project. These targeted
clients or markets must adhere to our established business plan”.
• “An example of market forces is how we used our Design/Build
capabilities and advanced knowledge of pharmaceutical facilities and
manufacturing to provide multiple cost-efficient, quality-controlled,
value-driven, technologically-savvy projects for one specific client, with
whom we have worked over the last four years. During economically
competitive times, this success has allowed us to become their go-to

73
company in a geographical market where we had not previously done
much business”.
• “Contractors must know where their greatest expertise lies, what their
profit margin allowable per project can be, which markets are most
profitable, and if they have the resources (staff) to commit to each
project they pursue, win and execute. Learning what not to pursue is as
valuable as knowing what to pursue. We are always looking for the next
new pond - new trend and seeing if that is a stable market to pursue.
• “How fast you close the sale depends on how well you started the
relationship with the client. Perceptions of your firm are formed in the
first 4 seconds of meeting that client, whether it is a brochure selling
your services, a person/ staff member or other collateral material.
Making a good first impression and establishing a strong relationship
with your client will carry you through many projects. A client is
someone under your care and protection. A customer is someone you
provide a service to. We want clients. We recognize the importance of
flexibility in an ever-changing business climate. While we focus on
clients and projects in certain industires, we keep an eye on the horizon
to add new industries and facilities to our body of work”.
• “As part of the business planning each year, each region develops
specific regional marketing plans including target client groups by each

74
market sector and strategies for contacting and developing relationships
within those”.
• “The firm has tried both extending operations and mergers and found
that the latter typically is more successful”.
• “Entry into new markets are typically made because of a strategic
opportunity to grow the firm from a revenue and profit perspective”.
• “We needed to look elsewhere for work due to a lack of opportunities in
existing markets”.
• “Competitive forces affect our market entry.We monitor the number of
available projects in an area vs. the number of design-builders”.
• “The economy has driven decisions to pursue additional work in
different markets”.
• “Our marketing strategy is incorporated into our yearly business plan.
We target specific market sectors and project ahead a few years as to
market sectors to pursue based on projected activity”.
• “We travel to new geographical areas based on program or long-term
accounts which produce more than one project in the area, or multiple
projects with the same client”.
• “Very few phases of a construction project are more important than the
Close out of the project and punch list management. A construction
project can proceed on schedule with minimal issues and completely fall
apart toward the end without strong management direction to swiftly and

75
efficiently complete the project. Often times, an Owner will judge the
overall success of a construction project during the last few weeks of the
project’s duration.Many factors must be considered to fully understand
the dynamics of successfully completing a construction project”.
• “For general contractors who solicit only private work, word of mouth is
everything. And general contractors often stake their reputations on their
ability to deliver buildings within a certain time frame. Obtaining the
Certificate of Occupancy within the allocated time frame is of utmost
importance to good general contractors.Bringing quick and complete
closure to construction projects is what separates good general
contractors from outstanding general contractors. Once the race is won
and the Certificate of Occupancy is obtained, many good general
contractors think the race is over. The project loses its sense of urgency
and importance. This is a fatal mistake. The outstanding general
contractor knows that this is when they must work more diligently than
ever. Completing work items like touching up walls that were scratched
when the furnishings were delivered, producing quality as-built and
warranty documents and other similar issues – quickly and efficiently –
mean that the owners can stop focusing on the construction process and
begin on their core function in their new space. This often translates into
realizing profits and moving into new areas faster, thus gaining a
competitive advantage over their peers. The best general contractors will

76
manage their Punch Lists as the work item occurs, leaving only a handful
at substantial completion. Quickly and efficiently completing the
remaining items is the preferred method to deliver to the owner an
excellent facility and a great feeling about the general contractor”.
• “We have a marketing plan now under review. Covers all areas of
business development, including advertising, trade shows, prospect
tracking, promotions, sponsorships, press releases, etc”.
• “Honesty and concise, open communication with customers is the most
reliable measure for success on any project. We focus heavily on team-
building, partnering and consensus-based decision making”.
• “We prefer direct operation. When one of our existing customers request
that we build in a new geographical market, we typically use the person
assigned to that area as our local marketing representitive”.
77
VITA
Seenu Anna Kurien
E-mail: [email protected] Texas A&M University M.S. Construction
Management May 2004 3.875
Mays Business School, Texas A&M University
Certificate in Business
Dec 2003
University of Kerala Bachelor of Architecture
Dec 2000 3.9
EXPERIENCE Lyda Builders, Swinerton Inc. Intern Project Engineer Summer 2003
Department of Engineering Technology &Industrial Distribution
Graduate Assistant - Non Teaching (Web designer)
Sept 2002 – Dec 2003
HOMETECH Architects, Engineers & Builders, Trivandrum, Kerala, India
Junior Architect Mar 2001 - Oct 2001
ACHIEVEMENTS • First place winner- Annual National Graduate Student
Competition organized by ASC, Reno- ’03. • O. N. Mitchell, Jr. Endowed Fellowship in Construction
Management - recipient for 2002 • Construction Industry Advisory Council scholarship recipient
2003. • International Education Scholarship 2003