business education innovation journal volume 4 number 1
TRANSCRIPT
Business Education Innovation Journal VOLUME 4 NUMBER 1 June 2012
Contents
Page
2 Introduction
3 Journal Information
4 Subscriptions and Cabell’s Listing
5 Integrative Thinking for Business Education: Interdisciplinary Learning and Assessment
Chae Mi Lim, Philadelphia University, Pennsylvania, USA
Nioka Wyatt, Philadelphia University, Pennsylvania, USA
Elizabeth Mariotz, Philadelphia University, Pennsylvania, USA
Leslie Browning-Samoni, Philadelphia University, Pennsylvania, USA
14 Equipping Future Marketers to Meet the Emerging Demand for Video Communications
Dr. Katherine Taken Smith, Murray State University, Murray, Kentucky, USA
19 AACSB Assurance of Learning: Lessons Learned in Ethics Module Development
David L. Baker, California State University, San Bernardino, USA
Anna Ya Ni, California State University, San Bernardino, USA
Montgomery Van Wart, California State University, San Bernardino, USA
28 The Rise, Fall, and Return of E-Marketing Curriculum: A Call for Integration
Chong “Joanna” S.K. Lee, California State University, East Bay, Hayward, CA, USA
37 Assisting Students in Gaining Employable Skills: Valuing and Encouraging Extracurricular
Activities
Chris Ward, The University of Findlay- Findlay, Ohio, USA
Dan Yates, The University of Findlay- Findlay, Ohio, USA
41 Using Tinkertoys to Teach Networking and Telecommunications to Business Students
(“Tinker Toys” is a registered trademark of Hasbro)
Jeffrey A. Livermore, Henry Ford Community College – Dearborn, MI, USA
45 A Comparison of the Readability of Advanced Accounting Textbooks
Kenneth J. Plucinski, State University of New York at Fredonia – Fredonia, NY, USA
Linda A. Hall, State University of New York at Fredonia – Fredonia, NY, USA
51 Incorporating Sustainability into the Business Curricula: Ecological Footprint Analysis
Wendy B. Wilhelm, Western Washington University, Washington, U.S.
59 Effective Accounting Lectures in a Cohort Business Program
Michael S. Wilson, Metropolitan State University, Minnesota, USA
Tong Xiang, University of Indianapolis, Indiana, USA
65 Enlightened Teaching Strategies in an Enlightened Era: Applying Humor in Business
Education
Joan Marques, Woodbury University, CA, USA
72 Assessing Learning Outcomes Beyond Knowledge Attainment
Lee Revere, Phillip Decker, Robert Hill
University of Houston – Clear Lake, Houston, TX
80 LEGO® Demonstrations for Understanding the Implications of Changing Work Practices on
Human Resource Management
Sherry K. Mills, New Mexico State University – Las Cruces, New Mexico, USA
Phil Benson, New Mexico State University – Las Cruces, New Mexico, USA
Cathleen Burns, University of Colorado at Boulder – Boulder, Colorado, USA
Janice L. Ammons, Quinnipiac University – Hamden, Connecticut, USA
92 Manuscript Guidelines, Submission and Review Process
94 Manuscript Style Guide and Example

2 Business Education Innovation Journal Volume 4 Number 1 June 2012
Introduction
Welcome to this issue of the Business Education Innovation Journal.
The purpose of this journal is to assemble researched and documented ideas that help drive successful learning
and motivate business students to learn. The intention is to draw ideas from across both methods and disciplines
and to create a refereed body of knowledge on innovation in business education. As a result, the primary
audience includes business education faculty, curriculum directors, and practitioners who are dedicated to
providing effective and exciting education.
We invite you to read about innovations published and apply in your classroom. We also encourage you to
develop your original creative ideas, prepare an article, and submit for review.
This particular issue includes a number of interesting classroom innovations in diverse areas.
Peter J. Billington
Editor
Content Verification: The ideas presented in the journal articles are not tested nor verified for accuracy, quality, or
value. The opinions and claims expressed in the articles are those of the authors and do not represent a position or
opinion of the editor or staff of the Business Education Innovation Journal.
No responsibility is assumed by the Editor or Publisher for any injury and/or damage to persons or property as a
matter of product liability, negligence or otherwise, or from any use or operation of any methods, products,
instructions or ideas contained in the material in this journal.
Copyright © 2012, by Elm Street Press. Permission to make digital or hard copies of all or part of this work for
personal or classroom use is granted without fee provided that copies are not made or distributed for profit or
commercial advantage and that copies bear this notice and full citation on the first page. Copyright for components
of this work owned by others than Elm Street Press must be honored. Abstracting with credit is permitted. To copy
otherwise, to republish, to post on servers for commercial use, or to redistribute to lists requires prior specific
permission and/or fee. Request permission to publish from: Editor, BEI Journal, 6660 Delmonico Drive, Suite D
232, Colorado Springs, CO 80919 Attn: Reprints, or via e-mail to [email protected]
Elm Street Press All Rights Reserved © 2012 www.beijournal.com 3
Business Education Innovation Journal
www.beijournal.com
ISSN 1945-0915
Business Education Innovation Journal is an imprint of
Editor
Peter J. Billington
Colorado State University – Pueblo, CO
Editorial Review Board
Dirk Barram George Fox University, Newberg, OR
J. Brad Gilbreath Colorado State University – Pueblo, CO
James H. Browne Professor Emeritus, Colorado State University – Pueblo
Uma Gupta State University of New York (SUNY) at Buffalo State
Maryann Billington Executive Development Specialist
J. Andrew Morris California State University – Channel Islands, CA
Jose Castillo Truman State University, Kirksville, MO
Kristie Ogilvie California State University at San Bernardino
Jui-Kuei Chen Tamkang University-Dansui Campus, Taipei, Taiwan
Ramanjeet Singh Institute of Management and Technology, Chandigarh, India
Steven I-Shuo Chen Trinity College Dublin, Ireland
Alice Valerio De La Salle University-Dasmarinas, Philippines
Michael J. Fekula The Citadel, Charleston, SC
Stuart H. Warnock Metropolitan State University of Denver, Denver, CO
Lynn A. Fish Canisius College, Buffalo, NY
Marsha Weber Minnesota State University Moorhead, Moorhead, MN
Kelly Flores City University of Seattle, WA
Business Manager, Graphics, Design, and Production
Drew C. Billington
Submissions - [email protected]
Subscriptions - [email protected]
Add or remove from our mailing list - [email protected]
Write in “add” or “remove” in the topic line.
Webmaster - [email protected]
Elm Street Press 6660 Delmonico Drive, Suite D 232, Colorado Springs, CO 80919-1899
4 Business Education Innovation Journal Volume 4 Number 1 June 2012
Subscriptions For subscriptions to Business Education Innovation Journal, please email: [email protected].
Subscription Rates:
Destination Individual * Institutional Back Issues
Individual
Back Issues
Institutional
United States
Countries other than the U.S.
$25
$50
$50
$100
$15
$30
$30
$60
* Published authors are entitled to a free issue of the Journal in which their article is published.
Business Education Innovation (BEI) Journal © 2010 by Elm Street Press (ISSN 1945-0915) BEI Journal is
published two times per year or more, based on submission volume.
Authorization for use of derivative works or to photocopy items for internal, personal or any other use as well as
requests for multiple reprints will be priced and granted by the publisher ([email protected] ).
Use of information in the articles and journal are governed by U.S. national copyright laws. No claims for missing
issues will be processed after two months following the month of publication of the issue. Send author inquiries to
Postmaster: Please send address changes to Elm Street Press, 6660 Delmonico Drive, Suite D232, Colorado Springs,
CO 80919-1899.
Listings and Indexing Business Education Innovation Journal is listed in the most recent on-line edition of Cabell's
Directory of Publishing Opportunities in Management. www.cabells.com
Full text article access of the journal is available from EBSCO and the journal is indexed in
EBSCO’s databases.
Elm Street Press All Rights Reserved © 2012 www.beijournal.com 5
Integrative Thinking for Business Education:
Interdisciplinary Learning and Assessment
Chae Mi Lim, Philadelphia University, Pennsylvania, USA
Nioka Wyatt, Philadelphia University, Pennsylvania, USA
Elizabeth Mariotz, Philadelphia University, Pennsylvania, USA
Leslie Browning-Samoni, Philadelphia University, Pennsylvania, USA
ABSTRACT
Interdisciplinary approaches in higher education are thriving in both teaching and research. The industry-engaged
interdisciplinary project-based approach helps graduates become versatile professionals with knowledge and skills
that are transferrable across professional boundaries. However, implementation of the project is challenging from a
practical perspective such as coordinating activities among various disciplines as well as between academia and
industry. Furthermore, assessment of its effectiveness is challenging, because outcomes of the interdisciplinary
approach differs from those of discipline-based approach. This paper describes an industry-engaged interdisciplinary
project that was developed and implemented at Philadelphia University which involved five courses, nine faculty
members, approximately 100 undergraduate students, and a multichannel retailer as an industry partner. The
objectives of this paper are to: 1) provide a case study of implementing an industry-engaged interdisciplinary project
in business education; 2) address how to incorporate industry support in implementing the project; and (3) address
assessment aspects of the project.
Keywords: interdisciplinary learning, assessment, innovative pedagogy, collaboration
INTRODUCTION
As today’s employers have increased expectations for graduates to have integrative and adaptive thinking skills, and
take an active role in their careers, development of a variety of soft-skills has become an important goal in higher
education (Zlotkowski, 1996). The interdisciplinary learning approach facilitates higher-order thinking (e.g.,
analyzing, applying, generalizing) by motivating students to engage in deep learning and creates integrated
knowledge that is more comprehensive than knowledge obtained from discipline-based learning (Ivanitskaya, Clark,
Montgomery, and Primeau, 2002; Klein, 1990).
Despite its many benefits, implementation of an interdisciplinary project is challenging at the practical and
administrative levels such as designing teams across disciplines, coordinating among disciplines, and scheduling
within a time constraint (i.e., one semester−15 weeks). Often the implementation of these projects relies mainly on
the faculty’s individual experiences and working networks without clear guidelines for procedures. Therefore, little
attention has been paid to explore models for interdisciplinary teaching in higher education at an implementation
level. Furthermore, assessment of the effectiveness of the interdisciplinary learning approach is challenging as well,
because outcomes of this approach differ from those of a discipline-based approach that aims to build the depth of
single-subject knowledge. Ivanitskaya et al. (2002) noted that outcomes of the interdisciplinary approach should
encompass subtle ones such as higher-order cognitive skills, critical and proactive thinking, enlarged perspectives
and horizons, ability to synthesize or integrate, and the ability to tolerate ambiguity. Assessment methodologies used
in traditional discipline-based courses might not capture the effectiveness of the interdisciplinary learning in
achieving the distinctive outcomes.
This paper is based on the experience gained by implementing an industry-engaged interdisciplinary project at
Philadelphia University which involved five courses from Marketing, Merchandising, Fashion Industry
Management, Fashion Design, and Graphic Design, nine faculty members, approximately100 undergraduate
students, and a multichannel retailer as an industry partner. Specific objectives of this paper are to: (1) provide a
case study of implementing an industry-engaged interdisciplinary project in business education; (2) address how to
incorporate industry support in implementing the project; and (3) address assessment aspects of the project. By
sharing logistics of a relatively large-scale industry-engaged interdisciplinary project and addressing challenges in

6 Business Education Innovation Journal Volume 4 Number 1 June 2012
the implementation, this paper attempts to present one way to integrate an interdisciplinary perspective in business
education and some insight that may be of use to other educators attempting to implement interdisciplinary learning.
INTERDISCIPLINARY LEARNING
As higher education is being called to address complex problems that cannot be resolved by a single disciplinary
perspective, interdisciplinary initiatives and approaches in colleges and universities have become thriving in both
teaching and research (Lattuca, 2001; Klein, 1996; Kandiko and Blackmore, 2008). Moreover, because of the
increasingly multidisciplinary nature of the business world, interdisciplinary collaboration with professionals who
have various knowledge, jargon, and way of thinking becomes necessary in many fields (Kimmons and Spruiell,
2005). Interdisciplinary learning is the synthesis of two or more disciplinary perspectives to establish integration of
knowledge and a more comprehensive understanding (Klein, 1990). The initiatives can be found in integrative
curricular development, new interdisciplinary courses (e.g., first-year seminars and capstone courses), team-
teaching, collaborative learning, or problem-based learning. Although interdisciplinary approaches challenge
traditional notions of disciplinary ways of knowing and specialization, it is not a rejection of the disciplines as it is
grounded in the disciplines by constructing integrative knowledge that is greater than the sum of its distinctly
disciplinary parts (Newell, 1998).
As suggested by Kleinberg (2008), a problem (or project)-based instruction, which brings more than one discipline
together to address a specific issue or solve real-world problems, is one of the effective interdisciplinary instruction
methods. Instead of relying entirely on lectures and class discussions, problem-based learning enables students to
learn through the problem-solving process itself and provide students with an active leaning environment (Carpenter
and Fairhurst, 2005). Active leaning offers opportunities to work with concepts at high cognitive levels—
application, analysis, synthesis, and evaluation (Salemi, 2002). Active learning is effective for students with
different learning curves in classes; while some learners may learn by listening critically and questioning what they
do not understand, other learners may serve as tutors for their peers (Farr, Ownbey, Branson, Cao, and Starr, 2005;
Johnson, Johnson, and Smith, 1998). When the interdisciplinary instructional model is used, the blending of various
types of learners enables the students to engage in the dynamics of the project while creating well-balanced teams.
The effectiveness of the interdisciplinary projects can be enhanced by industry partnership which could involve
solving a real business problem, interacting with professionals in a project, and developing an industry sponsorship.
Ideally, educational innovation should be based on a partnership between educators and industry partners (Pearce,
1998; Wright, Cushman, and Nicholson, 2002). Zlotkowski (1996) noted that facilitating development of a variety
of soft-skills is an important goal in higher education. The industry-engaged interdisciplinary project-based
approach helps graduates become versatile professionals with knowledge and skills that are transferrable across
professional boundaries such as creativity, collaborative communication skills, leadership skills, and critical,
integrative, and adaptive thinking skills. Also, students can learn how to negotiate the difficulties associated with
team work, to use the strengths of each team member, and to function in the business world where they will
encounter various opinions (Kimmons and Spruiell, 2005; Russ and Dickinson, 1999; Salemi, 2002). The approach
encourages faculty to create working networks across the disciplines and with industry; have a fresh outlook on
pedagogical methods; find opportunities for collaborative research; and to produce knowledge through innovative
scholarship and foster an informed and critical public (Kleinberg, 2008).
IMPLEMENTATION OF INTERDISCIPLINARY LEARNING IN A CLASS ENVIRONMENT
Overview of the Interdisciplinary Project
The project was implemented during fall semester of 2010 at Philadelphia University with the goal of the project to
identify a new market for an industry partner; to create a new apparel line for its target market by engaging in
product development; to create brand identity with a logo and promotional items for the products; and to develop
marketing strategies (i.e., pricing, promotions, and selling) for the new line. In other words, the project was
designed to try to solve a real-world problem for an industry partner from beginning to end. In consultation with the
industry representatives and the faculty involved in the project, a potential new product concept that had never been
tried by the industry partner was identified. The concept was to develop a women’s and children’s coordinating
clothing line that reflects the concept of having styles that are matching and are appealing to both target markets.
Elm Street Press All Rights Reserved © 2012 www.beijournal.com 7
The industry partner does not have a children’s line and thought that this would be an interesting approach to
gaining more market share in the misses market.
Participants of the project at the University include a total of nine faculty members from Marketing, Fashion
Merchandising (FM), Fashion Industry Management (FIM), Fashion Design (FD), and Graphic Design (GD), five
undergraduate courses and approximately 100 students enrolled in the courses−three business courses (Consumer
Behavior, Merchandise Buying/Operations, and Survey of Global Apparel Industry/Material Research and
Production (2 sections)) and two design courses (Advanced Patternmaking (2 sections) and Package Design).
Industry participants included professionals from merchandising, selling strategy, and the sourcing departments.
The project began with market/consumer research by Marketing and FM students who formed teams to do
collaborative research on industry and company overview; demographics and lifestyle of new target market; and
competition. FD students designed new lines of apparel and FIM students worked on the technical aspects of getting
specifications for manufacturing the products, sourcing materials, and communicating with factories in China for
sample production. GD students worked on branding including brand identity, logo, and promotional items for the
products. Marketing and FM students, based on the market/consumer research, worked on marketing strategies for
the pricing, promotions, and selling of the garments.
Students across the disciplines worked together collaboratively in interdisciplinary teams where they represented
their unique discipline while working together with others from different disciplines. They were engaged in
market/consumer research, branding, product design, product development, promotional item design, and marketing
strategies to reach the new markets.
Instructional Methodology
One of the unique approaches of this project was for students to work collaboratively, yet respectively in their own
disciplines as necessary, toward achievement of the goal of the project. Each course was taught by an instructor who
is a specialist in the discipline. Throughout the semester, the instructor focused on topics and materials that reflect
the discipline and used the interdisciplinary project as a part of or one of the class projects or assignments in each
course. The collaborative work was facilitated through meetings with the entire group, small work groups, industry
representatives, as well as through fieldtrips. The approach is based on the notion that the practice of
interdisciplinary should be rooted in the strong disciplines (Newell, 1998). Quality interdisciplinary work can be
obtained from outstanding works of its each disciplinary part. With this approach, interdisciplinary comprehensive
understanding can be maximized at the same time ensuring disciplinary-based knowledge.
Designing Student Teams
Students in the Consumer Behavior class and the Merchandise Buying/Operations class were integrated into six
collaborative teams to perform the Marketing/Merchandising part of the project. Each team was formed based on its
tasks (i.e., industry research, target market research, competition research, pricing strategy, promotion strategy, and
selling strategy). Each FD student in the Advanced Patternmaking class worked individually to design and to create
a line for women and children. The FIM students in the Survey of Global Apparel Industry class formed six teams to
partner with six FD students whose designs were selected to be manufactured as industry samples using the industry
partner’s factories in China. Inspired by the FD students’ designs, FIM students created modified designs of the lines
based on cost analysis and developed technical packets of the modified lines. GD students in the Package Design
class individually developed a brand logo and a promotional item for the garments that were inspired by works done
by the FD students.
Interdisciplinary Approach
To understand the dynamics of the full spectrum of the process and gain a holistic view, student teams representing
each discipline were required to meet with student teams from other disciplines individually, as small groups, and as
a whole group. Work done by each team representing its discipline was shared among the entire group by giving
several presentations. Information was shared among the entire collective group of students through three
presentations: (1) research by Marketing and FM students (i.e., industry research, target market research, and
competition research) (Figure 1, Arrow 1); (2) garments designed by FD students and the modified designs and

8 Business Education Innovation Journal Volume 4 Number 1 June 2012
technical specification by FIM students (Figure 1, Arrow 2); and (3) brand identity and logos by GD students
(Figure 1, Arrow 3).
Interdisciplinary collaboration was also done in small group and individual meetings. FD students and FIM students
met individually to modify the design of the garments to be manufactured as industry samples in the industry
partner’s factories in China (Figure 1, Arrow 4). Inspired by the six garments by FD students and the six modified
garments by FIM students, GD students created promotional items using the bonding theme. The items included
toys, activity projects, and interactive accessories (Figure 1, Arrow 5, 6).
Interaction between FD students and GD students was done by individual meetings and through a joint course
website that was created on Blackboard. Marketing/ FM students who worked on a pricing strategy met with FIM
students through small group discussions. Their cost analysis was based on feedback from the merchandising
department and sourcing departments of the industry partner. These students determined retail price and markup for
each garment (Figure 1, Arrow 7). Research on price strategies and the cost analysis were shared with Marketing/
FM students who worked on promotion and selling strategies to develop a promotional marketing campaign for the
product lines. (Figure 1, Arrow 8). These students met with GD students who developed the promotional items to
incorporate the items as a part of promotion and selling strategies (Figure 1, Arrow 9). One of the Marketing/FM
groups developed a plan and a script for a one-hour on-air show.
A final presentation was made at the end of the semester with students and faculty involved in the project, industry
representatives, and invited faculty and administration. Final deliverables consisted of market research data and
marketing strategies including pricing, promotions, and a short mock-up on-air show; technical specifications and
industry samples manufactured by the industry partner’s factories in China; brand logo and promotional gift items;
and fashion designs of the apparel lines.
Figure 1: Knowledge and Information Flow for Interdisciplinary Understanding
Knowledge Flow by Presentation to Entire Group
Marketing &
Merchandising
Fashion Design
Fashion IndustryManagement
Graphic Design
Entire
Group
Knowledge Flow by Small Group & individual Meetings
1
2
3
Marketing &
Merchandising
(Pricing)
Fashion DesignFashion Industry
Management
Graphic Design
Marketing &
Merchandising
(Promotion & Selling)
4
5 6
7
9
8

Elm Street Press All Rights Reserved © 2012 www.beijournal.com 9
Instructional Technological Support for Communication
To enhance communication among participants of the project and oversee the entire process, a joint course website
was created on Blackboard. Group schedules, work done by each discipline, pictures and videos taken at meetings,
fieldworks and presentations were accessible on the site and available to all students and faculty who were involved.
Other technologies such as conference calls to communicate with industry partners and Survey Monkey® to collect
information on branding were used.
Industry Partnership
Industry engagement provides a sense of authenticity to student learning. Stinson and Miler (1996) noted that
projects in problem-based learning should be similar in nature to the problem that can be found in professional
practice which help students develop the types of skills needed for effective solutions. Often times, projects
implemented in business courses are neatly designed, well-structured, with prepackaged information; seldom like
the situations that happen in practice. Solving a real-world business problem for the industry partner helped students
develop the ability to deal with ambiguity and understand challenges that industry faces in implementing a product
development process. From modification of the original fashion design concept, to meet requirements regarding
costs and production, to communication with manufacturers in China, students had to cope with many real-world
issues.
Industry engagement was done in several ways: field trips, industry guest lectures, individual/group feedback, and
industry support for industry samples. More specifically:
1. Students had a field trip to the headquarters of the industry partner, at the beginning of the semester. This
visit provided students with an overview of the company and allowed them to discuss the project with the
industry representatives.
2. Merchandising buyers and representatives from the Selling Strategy departments provided information on
the company’s unique business model, its merchandising, and its selling strategy through the guest
lectures to Marketing/FM students.
3. Industry representatives interacted individually with students helping students develop strategies on
pricing, promotion, and production of on-air show.
4. Industry partners provided feedback and input on fashion design which allowed students to gain more
insight for the project.
5. FIM students worked with the sourcing team of the industry partner to create technical packets, analyze
costs, and produce the industrial samples in factories in China.
6. Industry representatives were on campus to provide feedback to students at the final presentation, at the end
of the semester.
ASSESSMENT
Assessment of the interdisciplinary learning approach is challenging but essential to foster student learning and to
improve learning, teaching, and the content of courses. Rooted in Stonewater’s (2002) Multi-Tiered Model of
Assessment, Butler, Stonewater, and Kinney (2005) suggested four guidelines for learning-centered assessment: (1)
focus on goals, (2) view assessment from multiple points of view, (3) emphasize student learning outcomes, and (4)
disseminate assessment results. They emphasized that assessment should examine the extent to which the actual
delivery of the course (project) is congruent with the intended goals and student learning outcomes; and analyze the
course (project) from various perspectives including views from students and faculty to add a richness to the
assessment. They also stated that assessment results should offer information to redesign the course (project) in
order to improve student learning.
Based on Butler et al.’s guidelines for assessment, the assessment of the project was done in two ways to ensure
views from both students and faculty: (1) by utilizing a survey questionnaire for students to assess the overall
effectiveness of the project in achieving the project goals; and (2) by having faculty in-depth discussions to identify
issues and challenges of implementation of the projects and potential solutions. While assessment using student
survey focused on actual delivery of the project and achievement of the project goals and learning outcomes, faculty
assessment focused on overall planning and implementation of the project to improve the project. Faculty in-depth

10 Business Education Innovation Journal Volume 4 Number 1 June 2012
discussions help faculty members to identify their role as facilitators and to determine how to best guide and support
students as they encounter the stumbling blocks of collaboration and the development soft skills (Deretchin, 2002).
Student Assessment of the Project
Based on the notion by Stinson and Miler (1996) that the learning outcomes should be holistic and should not be
divided by narrow disciplinary boundaries, the survey questionnaire of the project was designed to assess the overall
effectiveness of the project in enhancing students’ interdisciplinary, experiential, and collaborative learning
experience, rather than improving disciplinary-based knowledge. The survey questionnaire was to evaluate: (1) the
usefulness of the project and effectiveness of logistics in enhancing student experience; (2) the effectiveness of the
project to achieve the project goals; and (3) the effectiveness of the project to enhance students’ soft skill sets. The
usefulness of the project and the effectiveness of logistics were measured on a 6-point scale, anchored by “very
poor” (1) and “excellent” (6). The effectiveness of the project goals and effectiveness of the project to enhance
students’ soft skills were measure on a 6-point scale, anchored by “not at all” (1) and “very much” (6). The survey
was conducted with students involved in the project. Table 1 shows the mean scores of each evaluation item by
disciplines and the results of the mean comparison using Analysis of Variance (ANOVA) among students from the
three disciplines. FIM students and M/FM students evaluated the effectiveness of the project higher than FD
students did. Generally, students evaluated the effectiveness of the project to enhance students’ soft skills highly.
The evaluation item that received the highest rating was the effectiveness of the project in providing “the real-world
application,” and the item that received the lowest rating was “the project organization/coordination.”
Table 1: Students’ Evaluation of the Project
Evaluation Items
Means
M/FM
(N=24)
FIM
(N=33)
FD
(N=7)
Total
(N=64)
Fa
(df=2)
Usefulness and effectiveness of logistics in enhancing student experience
Clear objectives of this project 4.0 4.2 3.0 4.0 3.57*
Project organization/coordination 3.7 3.3 3.0 3.4 1.61
Feedback from the industry partner 3.6 4.3 3.1 3.9 4.58*
Usefulness of project activities 4.3 4.8 3.3 4.4 5.42**
Usefulness of DEC course website 3.9 4.0 2.7 3.8 2.59
Real-world application 4.8 5.4 4.1 5.0 6.57**
Quality of overall experience of the project
4.4 4.7 3.3 4.5 6.15**
Effectiveness of the project to achieve the project goals
Understand the product development process 4.1 5.0 3.6 4.5 8.44**
Understand how to market the products to target consumers 4.3 4.7 3.6 4.4 3.19*
Understand challenges that industries face in implementing process of
taking products from concept to final products
4.7 5.2 4.4 4.9 3.51*
Effectiveness of the project to enhance students’ soft skill sets
Gain an appreciation for working with students from other disciplines 4.3 4.6 3.6 4.3 1.92
Develop communication skills to work in a team environment 4.8 4.7 3.7 4.6 2.66
Develop critical thinking skills 4.6 4.7 3.3 4.5 5.73**
Appreciate dynamics of working and coordinating work to meet
deadlines
4.7 4.9 4.1 4.8 1.50
a Mean differences among Marketing/Fashion Merchandising students, Fashion Industry Management students, and Fashion
Design students. * The mean differences among M/FM, FIM, and FD students are significant at the 0.05 level (p < 0.05). ** The mean differences among M/FM, FIM, and FD students are significant at the 0.01 level (p < 0.01).
Elm Street Press All Rights Reserved © 2012 www.beijournal.com 11
Faculty Assessment of the Project
Review of the students’ assessments helped to underscore the issues perceived by the faculty during in-depth
discussions about the planning, implementation, and outcomes of the project. The nine faculty members who were
involved with the project had a number of meetings to discuss issues and challenges of implementing the project.
The biggest challenges were the timeline and the scheduling of times to coordinate various aspects of the project.
These issues corroborated with the students’ evaluation on project organization/coordination. Completing the full
process of developing and executing an apparel line within a semester was challenging in the following ways:
1. The time frame did not allow sufficient time for the Marketing students to conduct research on the
marketplace and target consumers.
2. The schedule did not allow for enough interaction among disciplines.
3. Course schedules, along with the project implementation through disciplinary courses, did not allow
enough opportunity for collaborative teaching among disciplines to foster a greater understanding of
collaboration among departments in industry.
4. Time schedules were frequently in conflict and therefore scheduling industry guest lectures and interaction
between students and industry representatives were found to be difficult.
RECOMMENDATIONS
In addition to examining the challenges of the project, the in-depth faculty review discussed learning outcomes,
evaluation of student works, and areas for opportunity when planning future projects. In implementing an industry-
involved interdisciplinary project, both course outcomes and project outcomes need to be articulated at the
beginning of the process and shared by both the faculty and the students. The project outcomes must align with the
course outcomes and careful thought must be given to the courses that are to be included in the project to insure that
the content of the courses support the outcome of the project. Conversely, the goals of the project should also
enhance the course goals and contribute to the student’s learning outcomes. The level of participation of a course
within the project should be determined by these learning goals. In the assessment of the project, the course with
sporadic or limited involvement in the entirety of the project was reviewed to be less effective than the courses with
long-term and active participation. Therefore, it is important to clearly articulate the goals of the project to each
audience and create long-term and active opportunities for all student populations involved.
Evaluation of student works is one of the important issues. In this project, student works were evaluated by the
instructor of each class based on criteria and outcomes of the individual course. While this method is effective to
evaluation the disciplinary skills and knowledge developed by students, it cannot capture the development of the soft
skill sets defined as a project goal. The faculty needs to collaborate when identifying the project goals to create an
evaluation system throughout the course of the project to provide feedback to students in a timely manner, not only
at the conclusion of the project (Hernon, Dugan, and Schwartz, 2006; Stevens and Levi, 2005). One consideration
for timely and meaningful feedback may be a project rubric, designed by the faculty team to identify and quantify
the dimensions and levels of achievement. A rubric may also be used to diminish the variance in grades related to
the project across the courses, as this tool type clearly defines expectations and performance levels.
Future project frameworks should encourage cross instruction by faculty to offer students a better understanding of
other disciplines and their contributions to the project. Also, extending the time frame for the project to be at least
six to eight months will allow more time to develop relationships among the faculty and with the industry partner.
Developing an interdisciplinary course that may occur over two consecutive semesters will be effective to insure
that there is continuity and coordination among the courses. Also, it is important to create a common class schedule
for courses that participate in the interdisciplinary project. The large number of students involved in the project was
found to be challenging in terms of project coordination. Thus, limiting the number of students who participate in
the project might be needed to insure active learning. Funding and legal support are the important elements in
implementation of the project. It is essential to gain the support of upper leadership before the beginning of the
project. Finding a funding source to accommodate the various aspects of the project such as field trips, materials for
the products, and faculty development will be critical in successful implementation of the project. In addition,
managing the implementation process for industry projects should allow instructors to add the course as additional
course load or use a course release. Legal support is also vital to establish boundaries of intellectual property
ownership and to develop appropriate contractual agreements for an industry-engaged project.

12 Business Education Innovation Journal Volume 4 Number 1 June 2012
CONCLUSIONS
While traditional academic curriculum is disciplinary-based with an emphasis on specialization, industry works in
the interdisciplinary way in which employees work collaboratively from design through engineering to commerce.
As an effective way to enhance student learning, the industry-engaged interdisciplinary project provides students
with real-world experience and opportunity to develop a set of skills such as communication skills, leadership skills,
and critical, integrative, and adaptive thinking skills. The pedagogical approach described in this paper will provide
educators with valuable information on logistics of implementation and industry engagement of interdisciplinary
class projects that can be applied in many professional colleges and universities.
REFERENCES
Butler, S., Stonewater, J., and Kinney, J. (2005). The application of an assessment model to a costume history course: A case study. Clothing &
Textile Research Journal, V. 23, No. 4, pp 333-349.
Carpenter, J. and Fairhurst, A. (2005). Delivering quality and value in the classroom: The use of problem-based learning in retail merchandising
courses. Clothing & Textile Research Journal, V. 23, No. 4, pp 257-265. Deretchin, L. F. (2002). Making the Grade, In P. Schwartz and G. Webb (Eds.), Assessment: case studies, experience and practice from higher
education (pp. 114-120). London: Kogan Page.
Farr, C., Ownbey, S., Branson, D., Cao, H., and Starr, C. (2005). Multimedia and problem-based instruction in the textiles laboratory, Clothing & Textile Research Journal, V. 23, No. 4, pp 360-367.
Hernon, P., Dugan, R. and Schwartz, C. (2006). Revisiting outcomes assessment in higher education. Westport, CT: Libraries Unlimited.
Ivanitskaya, L., Clark, D., Montgomery, G., and Primeau, R. (2002). Interdisciplinary learning: Process and outcomes, Innovative Higher Education, V. 27, No. 2, pp 95-111.
Johnson, D. W., Johnson, R. T., and Smith, K. A. (1998). Cooperative learning returns to college: What evidence is there that it works? Change,
V. 30, Issue July/August, pp 27-35. Kandiko, C. B. and Blackmore, P. (2008). Institutionalising interdisciplinary work in Australia and the UK, Australasian Association for
Institutional Research, 14(1). Retrieved from http://www.aair.org.au/articles/volume-14-no-1/14-1-institutionalising-interdisciplinary-work-in-
australia-and-the-uk Kimmons, J. and Spruiell, P. (2005). Using problem-based learning in a multidisciplinary setting, Clothing & Textile Research Journal, V. 23,
No. 4, pp 385-395.
Klein, J. T. (1990). Interdisciplinarity: History, theory, and practice. Detroit, MI: Wayne State University Press. Klein, J. T. (1996). Crossing boundaries: Knowledge, disciplinarities, and interdisciplinarities. Charlottesville, VA: The University Press of
Virginia.
Kleinberg, E. (2008). Interdisciplinary studies at a crossroads, Liberal Education, V. 94, No. 1, pp 6-11. Lattuca, L. (2001). Creating interdisciplinarity: Interdisciplinary research and teaching among college and university faculty, Nashville, TN:
Vanderbilt University Press.
Newell, W. (1998). Professionalizing interdisciplinarity. In W. Newell (Ed.), Interdisciplinarity: Essays from the literature (pp. 529-563). New
York: College Board.
Pearce, J. (1999). Faculty survey on business education reform. The Academy of Management Executive, V. 13, No. 2, pp 105-109.
Russ, R. and Dickenson, J. (1999). Collaborative design: “Forming, storming, and norming”. Journal of Interior Design, V. 25, No. 2, pp 52-58. Salemi, M. K. (2002, January). An illustrated case for active learning. Southern Economic Journal, 68(3), 721-731.
Stevens, D. and Levi, A. (2005). Introduction to rubrics: An assessment tool to save grading time, convey effective feedback, and promote student
learning. Sterling, VA: Stylus Publishing, LLC. Stinson, J. and Milter, R. (1996). Problem-based leaning in business education: Curriculum design and implementation issues, New Directions for
Teaching and Learning, V. 68, Issue Winter, pp 33-42.
Wright, J., Cushman, L., and Nicholson, A. (2002). Reconciling industry and academia: Perspectives on the apparel design curriculum. Education + Training, V. 44, No. 3, pp 122-128.
Zlotkowski, E. (1996). Opportunity for all: Linking service-learning and business education, Journal of Business Ethics, V. 15, pp 5-19.
AUTHOR BIOGRAPHIES
Chae Mi Lim, Ph.D.
Chae-Mi Lim is an Assistant Professor of Marketing at Philadelphia University. She currently teaches Consumer
Behavior and Marketing Research. Her current research focuses on consumer shopping behavior in the context of
luxury shopping and consumer experience in multichannel environment. She has published her research in journals
that include Psychology & Marketing, Journal of Global Academy of Marketing Science, International Journal of
Retail & Distribution Management, Journal of Customer Behaviour, and Journal of Consumption Culture.
Nioka Wyatt
Nioka Wyatt is an Assistant Professor at Philadelphia University. She currently teaches Quality Assurance, Global
Product Management, Survey of Textiles, Survey of Global Products and Textile Production I. Prior to teaching,

Elm Street Press All Rights Reserved © 2012 www.beijournal.com 13
Nioka spent her tenure working with an electronic retailer in Quality Assurance and the Merchandising department
evaluating products for compliance and travelling to factories.
Elizabeth Mariotz, Ed.D.
Elizabeth Mariotz is an Associate Professor of Retail Management at Philadelphia University. She has taught
Retailing, Merchandising, Marketing Communications, and International Business (Graduate-level). Her research
interests focus on International retailing, Trading Blocks, European Union, Internet shopping and privacy issues.
Leslie Browning-Samoni
Leslie Browning-Samoni is an Assistant Professor at Philadelphia University. She currently teaches core courses in
the Fashion Industry Management program. In addition she has helped develop and teaches Integrative Design
Process, a course created to introduce all freshman students in the College of Design, Engineering, and Commerce
to design thinking through cross disciplinary research.

14 Business Education Innovation Journal Volume 4 Number 1 June 2012
Equipping Future Marketers to Meet the Emerging Demand for
Video Communications
Dr. Katherine Taken Smith, Murray State University, KY
ABSTRACT
The use of video in commerce is on the rise. There is good reason to believe that today’s students will encounter a
task involving the application of an online video at some point in their career. Even though this Millennial
generation is more technologically savvy, the average student does not have experience in creating a video that will
engage the viewer while also conveying pertinent information. This paper describes a video assignment in which
teams are required to create a 10-minute video that demonstrates the application of a concept from the course
material. The video assignment can: (a) help equip students for using digital marketing strategies that require the use
of video, and (b) provide an active learning exercise in which students can be creative while applying marketing
concepts to business situations. Positive side effects of the assignment include enhanced learning and improved
student engagement.
Keywords: Digital marketing communications, Information technology, Oral communication, Student video
assignment, Active learning exercise.
EMERGING CONSUMER DEMAND FOR VIDEO
The use of video in ecommerce is on the rise. Nearly three-fourths of US retailers featured a video on their company
websites in 2010 (Verna, 2011). Businesses are also posting videos on social media and sharing venues, such as
Facebook and YouTube. Marketers find that videos enhance ecommerce and increase conversion rates (eMarketer,
2011a). Consumers who visit websites containing videos are more likely to take some form of desired action, such
as purchasing a product or registering for membership. According to Craig Wax, CEO of an ecommerce video
company, every retailer will eventually use video (eMarketer, 2011b).
In addition to increasing conversion rates, videos improve the customer’s online experience. Customers respond
positively to videos, whether they are on company websites, news sources, or YouTube. You could even say that
consumers are demanding videos. Advertising dollars are being re-allocated, with online video expenditures
growing faster than any other online advertising category (MarketWire, 2011). Video is becoming a standard tool in
the ecommerce marketing mix.
There is good reason to believe that today’s students will encounter a task involving the application of an online
video at some point in their career. Even though this generation is more technologically savvy, the average student
does not have experience in creating a video that will engage the consumer while also conveying product
information. The assignment described in this paper involves student teams producing a video that revolves around a
marketing concept. This video presentation assignment can help equip students to leverage the expanding use of
videos in the marketplace.
RELEVANCE TO MARKETING COURSES
Learning about a tool that is increasingly being used in the field of digital marketing is relevant to marketing
education objectives. Since videos can facilitate the exchange process, it is beneficial for future marketers to become
adept at using this tool.
Video presentations are effective for most marketing courses because they are an active learning exercise. Academic
knowledge should be presented in various forms, including non-journal sources. Knowledge develops well in an
interactive process (Polonsky, 2007). In this assignment, students experience marketing concepts by applying them
to practical business situations. Students who actively experience class material will have better recall of the
information (Gremler et al., 2000). Active learning is conducive to deep learning in which the students are able to

Elm Street Press All Rights Reserved © 2012 www.beijournal.com 15
apply the information to various situations (Vander Schee, 2011). Active learning also increases student attention,
engagement, involvement, and motivation (Wooldridge, 2006).
Active learning has also been linked to students having a positive perception of the class (Karns, 2006). Millennials
respond especially well to active learning. Due to their profuse usage of the Internet, social media, and mobile
devices, this generation has new ways to communicate and process information. Research has shown that active
learning exercises, which allow students to interact with each other, are conducive to significant improvements in
learning (Yamarik, 2007). Learning is most effective when it takes place in a collaborative and social environment
(Gremler et al., 2000).
The video presentation is also a team exercise. Most marketing educators would agree that teamwork, with its
interpersonal dynamics and hands-on learning, provides multiple benefits to the students. Researchers have found
that students view team assignments as effective and good learning exercises. Students feel positive about team
dynamics and cohesion (Chapman et al., 2010). Teamwork provides practice in dealing with the challenges of group
dynamics and conflicts. With teamwork skills being important in the workplace, recruiters are actively seeking
students who have demonstrated their ability to work in teams (Vance, 2007).
This assignment also fosters creativity. Creativity is considered a vital ingredient in marketing. The success of
American capitalism can partly be attributed to our aptitude for generating new and creative products, services, and
customer experiences. Companies vie for resourceful employees who can infuse the firm with innovative ideas.
Unfortunately, some research has found that a person’s creativity decreases as he or she advances through the
educational system (Anderson, 2006).
THE VIDEO ASSIGNMENT
Each team is required to create an 8 to 10 minute video that demonstrates the application of a concept from the
course material. Specifically, teams must:
Create and film a demonstration of how the concept works in relation to a product or brand. Teams
must apply the concept to a business situation.
Provide the definition of the concept and show how a real company applies the concept (commercials
on YouTube can be helpful with this).
The instructor can either assign specific concepts or let students chose from any of the topics in the textbook. For
example, a video may demonstrate product differentiation, glocalization, guerrilla marketing, or the consumer
behavior traits of Millennials. This latter topic can be viewed in an actual student video on YouTube
(http://www.youtube.com/watch?v=Dt-lm-J8i8g).
Unlike a typical student presentation, video enables the teams to go on location and utilize different scenes and
people. Students have the opportunity to insert attention-getting tactics into their videos, such as high-energy
activities and emotional displays of humor, surprise, or fear.
Examples of previous student videos help clarify what is expected from the assignment. This assignment is given
twice during the semester. Giving students two opportunities to produce a video presentation is conducive to good
teaching methods in that the student can receive feedback and make improvements for the second time around. The
list of marketing concepts for each presentation will come from course material that is included on the upcoming
exam. Video presentations are shown in class the week before the exam, thus providing a good review of the
concepts.
The technical side of video editing is not discussed in class. There are free video editing programs available online,
such as Windows Movie Maker, which are user friendly. If no one on the team has previous experience with editing
videos, then they quickly learn and come away from the class with an additional skill. Most students are pleased at
increasing their expertise in a technological area. In fact, team members are generally quite proud of themselves
after making a video. Students are cautioned that videos should be “G” rated – no offensive content. Videos can be
played in class by way of DVD, CD, flash drive, or YouTube.
16 Business Education Innovation Journal Volume 4 Number 1 June 2012
GRADING THE ASSIGNMENT
Presentation grades are based upon their utilitarian and hedonic value to the class. To be considered utilitarian, the
class should gain a better understanding of the marketing concept. The presentation is considered hedonic if the
class enjoys the experience. Using both of these measures helps make presentations engaging for the class. Student
video presentations are actually a highlight of the semester. Students enjoy coming to class and seeing the creativity
and vitality of their classmates.
Presentations can be graded while the instructor watches them in class. A grade sheet for each team is used, on
which the instructor writes the following comments.
Good points: aspects of the presentation that provided utilitarian and hedonic value.
Needs improvement: aspects of the presentation that can be improved upon for the next presentation.
Grade sheets provide the students with timely and constructive feedback that helps them improve their skills. On the
day they present, students are required to submit a copy of their video or save it to the instructor’s computer. Thus,
the instructor has the option to view the video a second time if necessary.
Apart from receiving a grade from the instructor, the students vote on the best video of the day. Teams that win the
competition are awarded wristbands that say “Marketing Presentation Winner.” Many students wear their wristband
the remainder of the semester.
TIME SCHEDULE
The video assignment is discussed in detail two or three weeks before its due date. Some class time can be allocated
for teams to discuss their presentation ideas. Even though each video is 8 to 10 minutes long, it is wise to allocate 15
minutes for each presentation in order to allow for any technical difficulties. Videos can be shown consecutively in
one week, or spread throughout the semester. For large classes of 100 students or more, it is better to require only
one video presentation from each team and to space the videos throughout the semester.
ASSIGNING TEAMS
Team composition is a critical factor in the success of this assignment, as is the case with all team projects.
Optimally, teams have three to five members. Students are allowed to specify people they would like on their team.
However, the instructor still has the task of assigning numerous students to teams. To facilitate good team relations,
a questionnaire is administered at the beginning of the semester. The questionnaire contains the following questions.
Do you have any experience making or editing homemade videos?
Do you prefer being in front of a camera or behind the scenes?
In one sentence write a personal motto you try to live by. (Examples: be kind to others, work hard, live
for the moment)
Teams are compiled with the goal of joining students who have a variety of skills, but similar personal mottos. For
this assignment, the philosophy that has successfully reduced friction within teams is to put like-minded people
together.
HOW THE VIDEO ASSIGNMENT EQUIPS STUDENTS
By constructing a video, students acquire knowledge of what makes a good or bad video. They also have a new
awareness of the many elements that go into a video. Students experience everything from brainstorming to
converting ideas into action to editing the video. A practical challenge is learning to convey information in an
engaging manner through video. The video presentation develops the following skills:
Expressing concepts in a visual and oral format.
Applying information technology tools.
Grabbing and maintaining consumer attention.
Knowing good filming techniques, such as lighting, background, sound quality, and editing.
Using and manipulating video clips from online sources.

Elm Street Press All Rights Reserved © 2012 www.beijournal.com 17
Online videos are currently still an underutilized marketing tool; companies are on the brink of learning how to
maximize the potential of this digital asset. Having experience with videos, no matter how small, may be the
differentiator between prospective job candidates.
Another benefit of the video presentation is that it reinforces the material from the textbook. Students have a better
understanding and recall of course material after the concepts have been explained and demonstrated in video
format.
EFFECTIVENESS OF THE VIDEO ASSIGNMENT
Three classes, for a total of ninety students, were surveyed to determine student perceptions of the video assignment.
A Likert scale was used, with 1 being strongly disagree and 5 being strongly agree. Students’ qualitative
assessments of the assignment suggest the following:
Participating in video presentations is a good learning experience for students (mean 4.14).
Students feel more confident working with online videos in the future as part of a marketing campaign
(mean 4.22).
Students agree that making videos improves their creative skills (mean 4.23).
All means were significantly different from neutral (“3”).
Students enjoy making team videos. They have the opportunity to be innovative and resourceful, plus connect with
their classmates. Students enjoy watching other class videos, which succeed in inspiring even further creativity. This
form of active learning has definitely increased student engagement with the course.
Getting to know teammates outside of class during the making of a video, plus watching other classmates in their
videos, has a positive side effect. Students feel a connection to people in class; this makes the class environment
more friendly and comfortable for discussion. Students are engaged and responsive. The class takes on a personality
of its own.
CHALLENGES FOR THE INSTRUCTOR
A common problem with teamwork is “slackers” who are chronically absent. Slackers have not been a notable
problem with video presentations. There may be several reasons for this. The nature of the assignment bonds people;
students have fun making the video and being creative. They spend a good bit of time together in this endeavor.
They often go to each other’s abodes or eat together in the process of filming. Comments are often made along the
lines of “I don’t want to let my teammates down.”
There is also some accountability involved that wards off the inclination to be a slacker. Team members rate each
other’s participation in the preparation of the presentation. Points can be detracted from a student’s presentation
grade if he or she receives low ratings. Since the team has two video presentations for the class, a person knows
there will be a double penalty for not pulling his or her share of the work. Team members also know that this isn’t a
one-time exercise; they will be interacting with each other the entire semester.
Due to this assignment’s technical nature, difficulties can arise during the filming or presentation of the video. Some
students may want to test out their video on the classroom computer prior to presenting, just to make sure it will
play. For example, videos made on a Mac computer may not be compatible with the classroom computer. However,
the solution is simple – upload the video to YouTube and play from it. Students are resourceful and will find a way
to overcome technical difficulties.
ADAPTABILITY OF VIDEO ASSIGNMENT
Any marketing course is a candidate for a video presentation assignment. It can be used with undergraduates or
graduates. Any size class may be used; simply adjust the size of the teams along with the number of videos required.
For Principles of Marketing, Consumer Behavior, Retailing, or Global Marketing, the instructor can assign concepts
from the textbook, or use other topics such as current trends relating to the course. In a Consumer Behavior class, for
example, students may be assigned a consumer behavior concept for which they would create a demonstration of a
18 Business Education Innovation Journal Volume 4 Number 1 June 2012
marketer applying the concept or consumers practicing the concept in relation to a brand. The presentation can also
include examples of real companies using the concept in their interaction with consumers. For instance, if the
assigned concept were “total value concept,” then the goal of the assignment would be to show the marketer
communicating the various ways the consumer could derive value from a brand.
In Advertising, Promotions, or Integrated Marketing Communications classes, the assignment can be geared towards
creating actual promotional videos. For example, if the assigned concept were “habituation,” then the goal of the
promotions would be to introduce a new stimulus to the consumer in order to regain his or her attention and solicit a
response. As part of the video, students may film any promotional tool, such as sales promotions, social media,
guerrilla marketing, event sponsorship, or point of purchase advertising.
Video presentations are compatible with the Millennial student’s strengths. Inter-active technologies along with
product websites and social media are facilitators for Millennials to naturally become more active in the promotion
and advancement of products and brands. Videos are an ideal outlet for these students to leverage these technologies
and hone their marketing skills in the classroom.
REFERENCES Anderson, L. (2006). Building Confidence in Creativity: MBA Students. Marketing Education Review. V. 16, No. 1, pp 91-96. Chapman, K. J., Meuter, M. L., Toy, D., and Wright, L. K. (2010). Are Student Groups Dysfunctional? Journal of Marketing Education. V. 32,
No. 1, pp 39-49.
eMarketer.com (2011a). How Retail Sites Can Make the Most of Video. April 29, 2011. Accessed May 3, 2011 at: http://www.emarketer.com/Article.aspx?R=1008366.
eMarketer.com (2011b). Online Video for Retail Gains Sophistication. May 6, 2011. Accessed May 6, 2011 at:
http://www.emarketer.com/Article.aspx?R=1008375. Gremler, D. D., Hoffman, K. D., Keaveney, S. M., and Wright, L. K. (2000). Experiential Learning Exercises in Services Marketing Courses.
Journal of Marketing Education. V. 22, No. 1, pp 35-45.
Karns, G. (2006). In-Class Active Cooperative Learning: A Way to Build Knowledge and Skills in Marketing Courses. Marketing Education Review. V. 16, No. 2, pp 59-76.
MarketWire.com (2011). BrightRoll Study: Budget Increases on Online Video Outpace All Other Online Categories, TV Dollars Continue to
Shift. May 3, 2011. Accessed May 3, 2011 at: http://www.marketwire.com/press-release/brightroll-study-budget-increases-on-online-video-outpace-all-other-online-categories-1509106.htm.
Polonsky, M. J. and Polonsky, C. (2007). What is Referenced in Marketing Publications and Has it Changed over Time? Journal for
Advancement of Marketing Education. V. 10, Summer, pp 40-48. Vance, E. (2007). College Graduates Lack Key Skills, Report Says. Chronicle of Higher Education. February 22, pp A30.
Vander Schee, B. A. (2011). Marketing Feud: An Active Learning Game of Misperception. Marketing Education Review. V. 21, No. 1, pp 63-68.
Verna, P. (2011). Video in Ecommerce: Success Strategies Come into Focus. EMarketer. April 2011. Accessed 5-4-11 at: http://www.emarketer.com/Report.aspx?code=emarketer_2000808.
Woodridge, B. R. (2006). The Power of Perception: An Active/Experiential Learning Exercise for Principles of Marketing. Marketing Education
Review. V. 16, No. 2, pp 5-7. Yamarik, S. (2007). Does Cooperative Learning Improve Student Learning Outcomes? Journal of Economic Education. V. 38, No. 3, pp 259-
277.

Elm Street Press All Rights Reserved © 2012 www.beijournal.com 19
AACSB Assurance of Learning:
Lessons Learned in Ethics Module Development
David L. Baker, California State University, San Bernardino, USA
Anna Ya Ni, California State University, San Bernardino, USA
Montgomery Van Wart, California State University, San Bernardino, USA
ABSTRACT
Student learning is the central activity of higher education. Widespread interest in educational accountability and
pressure from accrediting bodies push instructors to document assurance of learning as well as their efforts at
continuous improvement of learning outcomes. This article assists those associated with Association to Advance
Collegiate Schools of Business accredited programs to achieve assurance of learning in a particularly challenging
area to document: the teaching of ethical reasoning. It shares lessons learned concerning faculty involvement and
coordination, learning goals, designing an assessment rubric, quantitative and qualitative measurement challenges,
understanding students served, and the value of continuous feedback. These insights extend the literature while
supporting others in satisfying learning goals more efficiently.
Keywords: AACSB, assurance of learning, ethics training, assessment measurement, continuous teaching
improvement.
INTRODUCTION
Higher education wrestles with responsiveness to increasing accountability demands (Fitzpatrick and Miller-
Stevens, 2009; Glenn, 2011; Powell, 2009; Weldy and Turnipseed, 2010; Westerfelt, 2011). This includes the
federal government’s concern with accrediting bodies producing evidence that students reach articulated learning
goals (Suskie, 2004). As a consequence, widespread interest and pressure push instructors to document assurance of
learning (AoL) as well as their efforts at continuous improvement of learning outcomes. AoL refers to a systematic
process of collecting, evaluating, and employing information about educational programs to improve student
learning and development (Palomba and Banta, 1999). Top teaching and learning issues include “establishing and
supporting a culture of evidence, . . . demonstrating improvement of learning” and “translating learning research into
practice” (Campbell and Oblinger, 2007, p. 15). As a consequence, AoL will receive increasing attention by
accrediting bodies. Among those, the Association to Advance Collegiate Schools of Business (AACSB) functions as
the foremost accrediting body for business programs. It cannot afford to be anything less than on the leading edge.
After all, graduating business majors must leverage their skill set swiftly by contributing to a company’s bottom line
to justify their retention.
This article extends the literature by providing a case study on a common but particularly challenging learning goal:
the teaching of ethical reasoning. It also provides an AACSB-specific example of demonstrating continuous AoL.
The case study reviews the strategy used by one department to address a substantive learning outcome, how it did
so, and what lessons the faculty learned as a result. We begin by describing the motivation for an allied but
non-AACSB accredited department to contribute the anchoring module of an ethics component. Second, we discuss
the AACSB’s AoL perspective and review AoL literature generally. Third, we explain the departmental effort to
develop, refine, install, assess, revise, and improve the module material to meet the AACSB AoL standard. Fourth,
we share the valuable lessons learned while offering recommendations about how others can streamline their efforts
in satisfying AoL goals more efficiently.
BACKGROUND
The College of Business and Public Administration (CBPA) at California State University, San Bernardino offers
AACSB accredited business programs, both at the graduate and undergraduate levels. In the AY 2008-09
accreditation self-study, ethical reasoning was identified as one of the weaknesses among the five learning goals of

20 Business Education Innovation Journal Volume 4 Number 1 June 2012
the CBPA.1 The major deficiencies include: 1) lack of a clearly defined teaching goal and structured assessment
mechanisms; 2) lack of faculty initiative and a coordinative effort in achieving the goal; and 3) lack of
documentation of learning outcomes. As a result of the latest reaccreditation for the business curriculum, there is
renewed interest in documenting associated curricula for AoL currency.
The Public Administration Department (PAD) supplies an upper-division undergraduate course called “government-
business relations” for the CBPA’s business majors. This core course serves as a foundational pillar to the overall
business curriculum, which includes majors in accounting and finance, information decision sciences, management,
and marketing. All undergraduate business majors must take the course and the average enrollment exceeds 700
annually.
The PAD faculty members value the close, strategic, and collegial affiliation with the business curriculum. They
enthusiastically offered to design, develop, and deliver a substantive ethics module in the government-business
relations course. While the PAD is the only non-business department in the CBPA, it historically addresses ethics in
its curricula. This partnership demonstrates the CBPA’s commitment to maintain and enhance the importance of
ethics as a vital learning goal. Module development materially undergirds and contributes to the overall AoL
strategy for the business majors. Moreover, the move also is an efficient win-win for the business curriculum and the
PAD since its courses routinely address issues concerning ethics anyway.
A faculty sub-committee designed and vetted the new ethics module during the summer of 2009. The first class
piloted the module with a written essay assessment. In the fall of the same year, two classes piloted the module with
cross-group experimental testing for teaching effectiveness. In spring and summer 2010, another cross-group
experiment of student surveys were conducted in three classes. The module was revised and improved based on
analysis of the feedback from faculty and students. In fall 2010, all full-time faculty teaching the class implemented
the ethics module. Adjunct faculty teaching the course incorporated the module into their government-business
relations courses throughout the academic year. By fall 2011, all public administration faculty and adjuncts teaching
the course covered the ethics module.
AACSB and the AoL Framework
The AACSB determines and communicates accreditation standards to aspiring business schools. The Eligibility
Procedures and Accreditation Standards for Business Accreditation (AACSB International, 2011) declare student
learning the fundamental concern of collegiate education. This shifts the spotlight from what instructors teach to
what students learn (Martell, 2007; Stivers and Phillips, 2009). Accordingly, the intent of AACSB’s AoL standards
is to determine the relative success of business schools in meeting their particular learning goals. There are two
reasons why this is important to a school’s stakeholders (students, faculty, trustees, supporters, accreditors, and
employers). First, measures of learning illustrate institutional accountability in documenting student learning
outcomes. Second, measures of learning enable faculty evaluation of student learning outcomes from which (1) to
make curricula improvements, and (2) to counsel students regarding their individual learning.
The AACSB recommends that AoL proceed from the development of learning goals (AACSB International, 2011).
Learning goals should address “broad educational expectations for each degree program” (p. 61). They should arise
from the institutional mission and link that mission to degree programs. Learning goals must convey to stakeholders
the targeted educational outcomes. Sound learning goals encompass the intellectual and behavioral competencies
encouraged. This includes student learning outcomes, or how students will be different as a result of the experience.
Further, such clarity, or truth in advertising, permits informed choice by potential students seeking a business degree
program.
AACSB focuses on program-level learning goals (AACSB International, 2007). For instance, a program goal may
involve ethical reasoning. Goals state desirable student outcomes. They represent the most important competencies
mastered through an educational program. For a business student majoring in marketing, there may be a variety of
individual marketing course learning objectives. One of them is the use of professional standards (a type of applied
ethics) in various marketing contexts. Curricula alignment arises from demonstrating that student course work leads
1 The five teaching goals of the CBPA are communication skills (oral and written), problem solving skills, ethical reasoning skills, informational
technology skills, and general and specific management knowledge and skills.

Elm Street Press All Rights Reserved © 2012 www.beijournal.com 21
to learning goal achievement. “If learning goals are adopted but are not addressed in the curricula, the outcome
assessment process will be worthless” (AACSB International, 2007, p. 8).
As learning outcomes emerge, the challenge turns to designing course learning experiences. These are covered
through syllabi and consist of lectures, class discussions, exercises, projects, writing assignments, exams, and a wide
range of supportive activities. Instructors carry the responsibility to monitor and to assess learning experiences
routinely to assure that learning occurs. Assessment involves collecting, interpreting, and using information to
inform decision making (McMillian, 2001). Such monitoring and assessing must be “regular, systematic, and
sustained” (AACSB International, 2011, p. 62). Thus, learning experiences must be operationalized for valid and
reliable measurement. Validity and reliability in assessment provides quality of assurance (Hoffman and Michel,
2010). The overriding question is, “How can it be demonstrated that the learning experiences accomplish the
learning goals?”
AoL Assessment
Educational assessment, according to AACSB (AACSB International, 2007), entails distinctive yet complementary
elements to enforce accountability. These include (1) delineation of learning goals and objectives, (2) curricula
alignment, (3) assessment measures, (4) data collection and analysis, and (5) assessment documentation and use for
continuous improvement. Ideally, the process results in credible information about changes in student abilities and
skills. The data should drive the improvement of student learning and development (Palomba and Banta, 1999).
Assessment measures should follow, not dictate, learning goals and objectives (AACSB International, 2007). They
should reflect what the faculty wants students to do to demonstrate competency (Martell, 2007). Assessment
measures should be anchored by faculty determined program benchmarks. Yet, AACSB recommends that programs
establish curricula intervention points as well. They should provide performance-based triggers to refine curricula in
the quest for continuous improvement.
AACSB once required indirect measures of assessment (Pringle and Michel, 2007). These measures involved asking
for stakeholder opinions regarding (1) how well students achieved program learning objectives, and (2) relative job
performance in connection with their major, or concentration. Most frequently, surveys substantiate and aggregate
these opinions. Now, AACSB calls for direct measures of student skills, knowledge, and abilities (AACSB
International, 2011). Direct measures of learning mean course embedded assessments. Examples of such
assessments include standardized assessment questions, case studies, and various exercises (Weldy and Turnipseed,
2010). Further, AACSB recognizes that AoL seldom is the result of a single tool embedded in the curriculum. Quite
the contrary, it more likely reflects a mix of tools deployed throughout multiple courses (Bisoux, 2008; Weldy and
Turnipseed, 2010).
AACSB accepts an array of direct measures for learning assessment (AACSB International, 2007). They may
consist of a variety of strategies with appropriate rubrics (e.g., exams, group projects, class presentations, writing
assignments, role playing, etc.) to support peer norming (Hoffman, 2006). These measures frequently perform
double duty. They assess specific course learning used in the course as well as overall program learning goals, both
with documentation.
Two sanctioned approaches describe process options used by instructors in connection with the ethical reasoning
learning goal for all business majors. First, course-embedded measures refer to in-course activities where students’
task performance also serves for assessment purposes. Such task appraisal serves the purpose of AoL through an
instructor’s measurement instrument to determine a course grade. Additionally, the tasks will be considered a second
time based on a program’s criteria. This micro-level assessment method is strongly recommended as the primary
vehicle. It is perceived as the most likely to result in outcome measures specific enough to target improvement.
However, this requires faculty “buy-in” since select data from their classes will be accessible to others with regard to
course embedded measures. Second, “demonstration through stand-alone testing or performance” involves
assessment of student performance related to the learning goal through standardized appraisal (AACSB
International, 2007). Such assessments may be either internal or external from the program and may occur outside of
the regular classroom. While this is often considered a more convenient method, the challenge is in providing
outcomes that are concrete enough to result in tangible curricular changes. For example, a comprehensive essay
exam at the end of a program of study is a useful tool for discriminating among the performance of students.
However, it is not a robust tool for documenting specific learning outcomes and providing a clear path to improve

22 Business Education Innovation Journal Volume 4 Number 1 June 2012
learning outcomes. Detailed comprehensive assessment tests have the challenges of being too large and difficult to
design and administer. Whatever the methods chosen, the results of learning assessments must feed back into the
curricula monitoring processes to steer tangible improvement (Allen, Fellows, and Harrison, 2009; LaFleur, Babin,
and Lopez, 2009). This is referred to as “closing the loop” (Bisoux, 2008). AACSB also calls for the availability of
documentation for accreditation inspections.
Student performance data requires dissemination to the program faculty for analysis. AACSB urges a standing AoL
Committee to be on point. This committee’s responsibility is to demonstrate how the assessment data informs the
particular major and overall program educational effectiveness. Further, it closes the loop by recommending and
implementing changes to advance student learning (Kelley, Tong, and Choi, 2010). Such changes should engage
enhanced coordination among multi-section courses and pivotal efforts to enhance pedagogies.
THE CBPA ETHICS MODULE ASSESSMENT CYCLE
This section explains our assessment cycle design and implementation process under the AACSB’s AoL guidelines.
The cycle consists of multiple phases (Matthews, 2010). For our ethics module, we worked through five phases of
the AACSB AoL process summarized in Table 1.
Table 1: AoL Assessment Cycle for the Public Administration Ethics Module
No. Assessment Phase Faculty Activity
1 Delineation of learning goals The PAD subcommittee discusses and formulates learning goals
with faculty from the business majors. Subcommittee reviews
consensus with public administration faculty.
2 Curriculum alignment The PAD subcommittee develops and aligns student course
material and expected learning outcomes and reviews with public
administration faculty and business majors’ faculty. Subcommittee
formulates student learning experiences and reviews them with
faculty who will teach government-business relations.
3 Assessment measurement The PAD subcommittee constructs pre and post module assessment
instruments and reviews them with the faculty who will teach
government-business relations.
4 Data collection and analysis PAD faculty teaching government-business relations in a particular
term administer the assessment instruments and reviews results
with the CBPA’s AoL committee.
5 Assessment documentation
and use for continuous
improvement
Faculty teaching government-business relations reviews results and
determines what course materials need modification to improve
learning.
Delineation of Learning Goals
Businesses across the spectrum have increased interest in individual morality and corporate social responsibility in
the wake of scandals over the past two decades (Teasley and Hornyak, 2010). Business schools have followed
business’s lead and urgings for a more robust ethics curriculum. The AACSB in 2003 proposed new standards
suggesting that business schools make teaching ethics a higher priority (Sims and Felton 2006). Consequently, many
business schools have placed greater priority on ethics.
A variety of views abound concerning what the goals of teaching business ethics should be (see Alam, 1999; Carson
and Burke, 1998; Gandz and Hayes, 1988; Kracher, 1999; LeClair, 1999; Loeb, 1988; McDonald and Donleavy,
1995; Nelson and Wittmer, 2001; Procario-Foley and McLaughlin, 2003; Sims, 2004; Sims and Brinkmann, 2003;
Strong and Hoffman, 1990; Schwartz, Kassem, and Ludwig, 1991; Waples, Antes, Murphy, Connelly, and Mumford
2009). The rationales underpinning our ethical reasoning assessment cycle are that 1) the teaching goal should be in
alignment with the overall college mission and values; 2) it should involve realistic operationalizations; and 3) it
should be set and revised at a level that encourages continuous improvement (Felton and Sims, 2005).
The PAD subcommittee, based on a literature review, defined ethical reasoning as the skill of reasoning about right
and wrong personal and business conduct. Students are required to understand their professional ethical roles, assess

Elm Street Press All Rights Reserved © 2012 www.beijournal.com 23
their own ethical values and the social context of problems, recognize ethical issues in a business scenario, consider
how different ethical perspectives might be applied to the ethical dilemmas, and evaluate the ramifications of
alternative actions. The goal encompasses four performance dimensions: 1) identification of key stakeholders in
specific situations, 2) comprehension of ethical dilemmas presented in case studies, 3) improvement in the quality of
the moral reasoning to resolve the ethical problems, and 4) sensitizing student attitudes about the importance of
reflecting on the ethical issues.
Curriculum alignment Debates rage over whether ethics can or cannot be taught and which pedagogical methods are most effective in
imparting a business ethics education (Felton and Sims, 2005). Surveys of business schools show a wide range of
pedagogical approaches to teaching business ethics. Some rely on structured lectures, emphasizing western ethical
thinking and principles. Others use approaches that lead students toward understanding ethical concepts and
reasoning by themselves. Still others analyze management case studies, which allow for active dissection of ethical
judgments in different contexts (Sims and Felton, 2006).
The CBPA is unable to hire specialized faculty for courses in ethics as some business schools have (Meinhardt,
2003) due to budget constraints. Instead of new faculty, the curriculum effort focused on redesigning of an existing
core undergraduate course (government-business relations) to achieve and to assess the teaching goal. This core
course curriculum assessment technique is recommended by the AACSB to business schools (AACSB, 2007).
The ethics teaching module is designed to fulfill the following purposes:
To inform students of the importance of business ethics;
To teach students about the concepts and principles undergirding ethics;
To introduce a straightforward analytical framework that can be applied in a real ethical dilemma;
To use business case studies to demonstrate the application of the analytical framework; and
To assess data for AoL.
A faculty sub-committee designed and vetted the new ethics module during the summer of 2009. Instructors have
the discretion to cover the module in either one or two sessions (over a twenty-session quarter course with each
session lasting one hour and fifty minutes).The module consists of the following elements:
A module guideline with introductions to the content, implementation approaches, and data collection and
documentation methods for AoL;
A pre-class required reading, introducing the importance of business ethics, major business ethics
principles, and a framework for ethical reasoning;
A PowerPoint presentation to support students in comprehending the reading;
Two teaching cases with a study guide;
Two assessment cases with a study guide; and
A CBPA undergraduate ethical reasoning learning goal rubric.
Assessment Measurement Educational assessment involves the "systematic collection, interpretation, and use of information about student
characteristics, the educational environment, and learning outcomes to improve student learning and satisfaction"
(Gainen and Locatelli, 1995). Course-embedded assignments, capstone seminars, and simulations supply an array of
assessment options for business schools (Bisoux, 2008). Because the college has a capstone seminar for
undergraduate programs in place, the ethics module uses a course-embedded test.
Tests are recognized in higher education as a reliable and relatively efficient strategy for obtaining valid data about
those assessed. A test refers to a measuring device or procedure while assessment encompasses more (Cohen and
Swerdlik, 2009). Testing is characterized as conducting, scoring, and interpreting results collected through some
examination instrument (Farenga and Ness, 2005). Overall assessment of tests may involve some form of data
collection within a distinct context.
In the ethics module, AoL is addressed through cross-group pretests and posttests consisting of written case
analyses. Instructors have the option to adopt either the posttest alone or pretest and posttests with the two
24 Business Education Innovation Journal Volume 4 Number 1 June 2012
comparable testing cases. This assessment design offers additional advantages besides providing assessment data for
AoL: 1) individual instructors can review his/her teaching outcomes and improve teaching based on pretest and
posttests; and 2) the cross-group comparison facilitates the consistency of assessments.
In addition to the written case analysis tests, we also conduct periodic student surveys to monitor student
demography, cognitive level, and learning style. Information from surveys informs the contemplated modifications
to teaching objectives, teaching styles, formatting of assessments, and the continuous improvement of AoL.
Data Collection and Analysis
Instructors collect the case assessment data for the CBPA AoL Committee. To facilitate efficient data storage and
transmission, instructors use online teaching platforms (e.g., Blackboard) to collect the assessment data. They
submit a hard copy of the material turned in by students, or an electronic copy downloaded from Blackboard to the
department’s representative to the AoL Committee. The AoL Committee analyzes the assessment data based on the
scoring rubric (see Appendix 1). Results are reported to the CBPA’s various stakeholders.
Assessment Documentation for Continuous Improvement
The instructor may keep the original copy of the test or survey submitted by the students. The CBPA AoL
Committee documents and analyzes assessment records for continuous improvement. The committee periodically
reviews the records and readjusts specific learning goals based on the college’s overall AoL strategies. The
assessment results drive change for continuous improvement.
AoL activity is not linear. It is iterative with backtracking (Wiggens and McTighe, 2005) and successive
approximations. It invites and encourages faculty to take ownership of the curriculum. The PAD faculty invested in
and created ownership (Maki, 2010) of the ethics module through customizing delivery and assessment to fit their
individual styles. Through feedback, discussion, and alignment with the business program faculty, the CBPA assures
collective responsibility for student ethics learning.
LESSONS LEARNED
Despite some early shortcomings with the ethics module, it proves to be a practical way to assess student learning.
Several lessons we learned may help business programs elsewhere to improve their process.
Faculty Involvement and Coordination
The government-business relations course is taught by several different faculty members, both full-time and adjunct,
in various formats. On the one hand, the ethics module requires faculty endorsement and commitment for consistent
delivery of the teaching goal. On the other hand, module design permits a certain degree of flexibility for individual
instructors to integrate it with their course theme(s) and structure. The whole design and implementation process
should be an open process that constantly addresses faculty and student feedback sensitively. Additionally, it is
critical to have a faculty member lead or coordinate the process. In our case, the faculty member who coordinates
the process is also the department representative to the CBPA’s AoL Committee. This arrangement creates an
efficient linkage between the department’s effort and the CBPA’s overall AoL strategy. This connection fosters a
nimble responsiveness to our continuous improvement strategy.
Understanding and Defining Learning Goals prior to Curriculum Design The ethics module was conceived prior to the CBPA fully defining student learning goals. Retrospectively, we have
learned that this is a disadvantage. As a consequence, modifications to the teaching module have been required to
reach an evolving learning goal. Launching learning goals should be an early step in the AoL process and is a
prerequisite to choosing methods or establishing performance standards (Martell 2007). The assessment cycle
should follow faculty determination of what students will do to demonstrate learning achievement.
Design an Assessment Rubric and the Curriculum in Tandem with the Learning Goal Our experience suggests the triangular alignment of three key strategies for AoL: learning goals, assessment rubrics,
and curriculum design. The overriding learning goal should be realistic, taking in the constraints of the students’
cognitive level, their socio-cultural background, and the overall learning environment. It should drive both the
assessment rubrics and the curriculum design. Successful practices should balance carefully these three strategies
and purposely design an assessment rubric and curriculum to complement the learning goal.
Elm Street Press All Rights Reserved © 2012 www.beijournal.com 25
Qualitative and Quantitative Measurement Challenges
We find there are tradeoffs between quantitative and qualitative measurements in assessing learning outcomes. A
quantitative approach allows for large-scale measurement of ideas, beliefs, and attitudes. It facilitates comparison
and statistical aggregation of the data with a limited set of questions. When staff and the budget are constrained, it is
generally more efficient for large samples. On the other hand, qualitative methods provide the opportunity to assess
the individual student’s learning more effectively. For example, could the student successfully identify stakeholders,
ethical issues, and reason coherently about the competing values in an articulate fashion?
The quantitative approach, such as the student survey, has proved to be an efficient strategy to understand a
student’s socio-cultural background, cognitive level, and points of learning deficiencies. However, we found the
quantitative method in our two piloted experiments was not effective in assessing a student’s understanding of
ethical dilemmas. Further, it was ineffectual in gauging a student’s capability in applying ethical principles in
business scenarios holistically. Faculty and students criticized its rigidity, pre-judgments, and superficiality. In
contrast, the qualitative essay style case analysis proves to be more effective. It creates openness, simulates a
student’s individual experiences, and provides more depth and detail. Yet, it does require more grading time and a
well-structured rubric for assessing the essays. Our experience suggests that each data strategy presents advantages
depending on what is assessed. We find that a mix of quantitative and qualitative strategies enriches the evaluation
of teaching outcomes.
Understanding Students’ Socio-cultural Background, Cognitive Level, and Learning Style Understanding students is the key to student-centered teaching. The content delivered as well as the way it is
delivered should be appropriate for students and relevant to their lives. This is especially important for teaching
business ethics. In our case, based on two student surveys, we found that the demography of our student group was
mostly non-white (over 70%), relatively religious (68%), with an immigrant or international background (30%), and
represented many first generation college students (37%). Students generally lacked exposure to the concepts related
to corporate social responsibility and have an excessively negative impression of government regulation. Through
comparing pre and post student surveys, we found that the teaching module was relatively effective in improving
students’ knowledge of facts related to business ethics and awareness of ethical issues and personal responsibilities.
Disappointingly, this single module was relatively ineffective in changing students’ fundamental behavior (e.g., no
significant change in the percentage of students reporting that “I would lie and cheat for a million dollars, but I
would not break the law even if I was unlikely to be caught” in pre and post surveys). Based on this information, we
are reviewing how to adjust our teaching to increase the impact on students, but we realize the limitations of a
single, introductory teaching module on student beliefs and behavior systems. There is the need, recognized by
accrediting bodies such as AACSB, to ensure that critical curriculum goals are integrated across many courses.
Curriculum goals should build on introductory sessions with increasingly more sophisticated and discipline specific
treatments. We are just now launching that phase in terms of bringing representatives from all CBPA departments to
discuss how the ethics curriculum unfolds in their upper division studies.
Continuous Feedback Supports Continuous Improvement
Feedback from an overall curricula perspective as well as individual course assessment supports continuous
improvement (Marshall, 2007). Holistically, faculty driven curricula redesign is informed by summative evaluation
on an overall program basis. At the course level unit of analysis, instructors teaching a particular course can act to
fine tune future course elements. This closes the loop in achieving more exacting outcomes. Assessment data, both
on an overall curriculum and on an individual course basis, informs a continuous dialog among the faculty teaching
the course regarding effectiveness. The perennial questions are (1) whether we truly are delivering the learning
outcomes we are targeting, and (2) if not, can the data pinpoint where we need to improve (Bisoux, 2008). This type
of probing encourages and supports a continuous dialogue among faculty about learning outcomes. It reinforces and
revitalizes teaching by supporting a continuous culture of change on an upwardly rising trajectory. This in turn
stimulates more interest in assessment throughout the curriculum. It ignites imagination and energizes enriched
experimentation.
CONCLUSION
As higher educational institutions worldwide strive to achieve their learning goals, this article provides practical
lessons from our experience following the AACSB’s AoL framework in the difficult area of teaching ethical
26 Business Education Innovation Journal Volume 4 Number 1 June 2012
reasoning. We found our AoL journey rewarding despite some misteps. We learned from each other fortifying a
collegiality through debating the learning goal formation and developing the assessment mechanisms. Through
surveying students and listening to their feedback, we better understand our students and can build a stronger sense
of community. Through conducting class experiments and benchmarking our progress, we improve our teaching
effectiveness. In summary, our AoL journey is not simply an approach of getting the job done for students,
taxpayers, and accrediting bodies. It also involves a process of building faculty relationships and creating a sense of
faculty responsibility and ownership of the academic programs.
REFERENCES
AACSB International. (2007). AACSB Assurance of Learning Standards: An Interpretation. The Association to Advance Collegiate Schools of
Business. Accessed January 4, 2012 at http://www.aacsb.edu/accreditation/reourses/publications.asp
AACSB International. (2011). Eligibility Procedures and Accreditation Standards for Business Accreditation. The Association to Advance Collegiate Schools of Business. Accessed January 4, 2012 at http://www.aacsb.edu/accreditation/standards/
Alam, K. F. (1999). Ethics and accounting education. Teaching Business Ethics, V. 2, pp. 261-272.
Allen, S., Fellows, P. and Harrison, K. (2009). A Continuous Improvement Process to Include Closing the Loop Activities. Business Education Innovation Journal, V1, No. 2, pp. 5-11.
Bisoux, T. (2008). Measures of success. BizEd, March-April, pp. 22-30.
Campbell, J. P. and Oblinger, D. G. (2007). Top-ten Teaching and Learning Issues, 2007. EDUCAUSE Quarterly, V. 3, pp. 15-22. Carson, P. J. and F. Burke. (1998). Lessons Learned from Ethics in the Classroom Exploring Student Growth in Flexibility, Complexity and
Comprehension. Journal of Business Ethics, V. 17, pp. 1179-1187.
Cohen, R. J. and Swerdlik, M. E. (2009). Psychological Testing and Assessment: An Introduction to Tests and Measurement, 7th ed. New York: The McGraw-Hill Companies.
Farenga, S. J. and Ness, D., eds. (2005). Encyclopedia of Education and Human Development, Volume I. Armonk, NY: M. E. Sharpe. Felton, E. L., Jr. and Sims, R. R. (2005). Teaching Business Ethics: Targeted Outputs. Journal of Business Ethics, V. 60, No. 4, pp. 377-391.
Fitzpatrick, J. L. and Miller-Stevens, K. (2009). A Case Study of Measuring Outcomes in an MPA Program. Journal of Public Affairs Education,
V. 15, No. 1, pp. 17-31. Gandz, J. and Hayes, N. (1988). Teaching Business Ethics. Journal of Business Ethics, V. 7, No. 9, pp. 657-669.
Gainen, J. and Locatelli, P. (1995). Assessment for the New Curriculum: A Guide for Professional Accounting Programs. Sarasota, FL:
Accounting Education Change Commission, American Accounting Association. Glenn, D. (2011). Business Students, What Have You Learned? An Accreditor Wants to Know. The Chronicle of Higher Education, April 14.
Accessed January 11, 2010 at http://chronicle.com/articles/Business-Students-What-Have/127109/
Hoffman, T. (2006). Developing Assessment Rubrics for PLA Courses. Journal of Continuing Higher Education, V. 50, No. 1, p. 22. Hoffman, T. and Michel, K. A. (2010). Recognizing Prior Learning Assessment Best Practices for Evaluators: An Experiential Learning
Approach. Journal of Continuing Higher Education, V. 58, No. 2, pp. 113-120.
Kelley, C., Tong, P. and Choi, B. J. (2010). A Review of Assessment of Student Learning Programs at AACSB Schools: A Dean’s Perspective. Journal of Education for Business, V. 85, pp. 299-306.
Kracher, B. (1999). What Does it Mean When Mitchell Gets an 'A' in Business Ethics? Or the Importance of Service Learning. Teaching
Business Ethics, V. 2, pp. 291-303. LaFleur, E. K., Babin, L. A. and Lopez, T. B. (2009). Assurance of Learning for Principles of Marketing Students: A Longitudinal Study of a
Course-Embedded Direct Assessment. Journal of Marketing Education, V. 31, No. 2, pp. 131-141.
LeClair, D. T. (1999). The Use of a Behavioral Simulation to Teach Business Ethics. Teaching Business Ethics, V. 3, pp. 283-296. Loeb, S. E. (1988). Teaching Students Accounting Ethics: Some Crucial Issues. Issues in Accounting Education, V. 3, pp 316-329.
Maki, P. L. (2010). Assessing for Learning: Building a Sustainable Commitment Across the Institution (2nd ed.). Sterling, VA: Stylus Publishing.
Marshall, L. L. (2007). Measuring Assurance of Learning at the Degree Program and Academic Major Levels. Journal of Education for Business, V. 83, No. 2, pp. 101-109.
Martell, K. (2007). Assessing Student Learning: Are Business Schools Making the Grade? Journal of Education for Business, V. 82, No. 4, pp
189-195. Matthews, E. (2010). How it Took a Whole Village. In P. L. Maki (Ed.), Coming to terms with student outcomes assessment, (pp. 92-106).
Sterling, VA: Stylus Publishing.
McDonald, G. M. and Donleavy, G. D. (1995). Objections to the Teaching of Business Ethics, Journal of Business Ethics, V. 14, No. 10, pp. 829- 835.
McMillian, J. H. (2001). Classroom assessment: Principles and Practice for Effective Instruction. Needham Heights, MA: Allyn & Bacon.
Meinhardt, J. (2003). Survey shows MPA programs. Tampa Bay Business Journal, February 24, 2003. Accessed January, 11, 2011 at http://www.bizjournals.com/tampabay/stories/2003/02/24/focus3.html.
Nelson, D. R. and Wittmer D. P. ( 2001). Developing a Learning Community Approach to Business Ethics Education. Teaching Business Ethics,
V. 5, pp. 267-281.
Palomba, C. A. and Banta, T. W. (1999). Assessment Essentials. San Francisco, CA: Jossey-Bass.
Powell, David C. (2009). How do we Know What they Know? Evaluating Student-learning Outcomes in an MPA program. Journal of Public
Affairs Education, V. 15, No. 3, pp. 269-287. Pringle, C. and Michel, M. (2007). Assessment Practices in AACSB-Accredited Business Schools. Journal of Education for Business, V. 82, No.
4, pp. 202-211.
Procario-Foley, E. G. and M. T. McLaughlin. (2003) A Propaedeutic for a Framework: Fostering Ethical Awareness in Undergraduate Business Students. Teaching Business Ethics, V. 7, pp. 279-301.
Schwartz, R. H., Kassem, S., and Ludwig, D. (1991). The Role of Business Schools in Managing the Incongruence Between Doing What Is Right
and Doing What It Takes to Get Ahead. Journal of Business Ethics, V. 10, No. 1, pp. 133-151. Sims, R. R. (2004). Business Ethics Teaching: Using Conversational Learning to Build An Effective Classroom Learning Environment. Journal
of Business Ethics, V. 49, pp. 201-211.

Elm Street Press All Rights Reserved © 2012 www.beijournal.com 27
Sims, R. R. and Brinkmann, J. (2003). Business Ethics Curriculum Design: Suggestions and Illustrations. Teaching Business Ethics, V. 7, No. 1,
pp. 69-86. Sims, R. R. and Felton, E. L., Jr. (2006). Designing and Delivering Business Ethics Teaching and Learning. Journal of Business Ethics, V. 63, pp.
297-312.
Stivers, B. and Phillips, J. (2009). Assessment of Student Learning: A Fast-track Experience. Journal of Education for Business, V. 84, No. 15, pp. 258-262.
Strong, V. K. and Hoffman, A. N. (1990). There is Relevance in the Classroom: Analysis of Present Methods of Teaching Business Ethics.
Journal of Business Ethics, V. 9, pp. 603-607. Suskie, L. (2004). Assessing Student Learning: A Common Sense Guide. Bolton, MA: Anker.
Teasley, W. and Hornyak, M. (2010). Ethics and Social Responsibility: Not Just for Chapter Six Anymore. Business Education Innovation
Journal, V. 2, No. 2, pp. 65-72. Waples, E. P., Antes, A. L., Murphy, S. T., Connelly, S., and Mumford, M. D. (2009). A Meta-Analytic Investigation of Business Ethics
Instruction. Journal of Business Ethics, V. 87, No. 1, pp. 133-151.
Weldy, T. G. and Turnipseed, D. L. (2010). Assessing and Improving Learning in Business Schools: Direct and Indirect Measures of Learning. Journal of Education for Business, V. 85, pp 268-273.
Westerfelt, D. (2011). Quality Does Matter in Your University Online Course. Business Education Innovation Journal, V. 3, No. 2, pp. 5-12.
Wiggins, G. P. and McTighe, J. (2005). Understanding by Design, 2nd ed. Washington, DC: Association for Supervision and Curriculum Development.
David L. Baker, Ph.D., is an Associate Professor of Public Administration, in the College of Business and Public
Administration, California State University, San Bernardino, USA.
Anna Ya Ni, is an Assistant Professor of Public Administration, in the College of Business and Public
Administration, California State University, San Bernardino, USA.
Montgomery Van Wart, is a Professor of Public Administration, in the College of Business and Public
Administration, California State University, San Bernardino, USA.
Appendix 1: CBPA Core Course Outcomes Assessment Scoring Rubric—Ethical Reasoning Skills
Student Name: ____________________________ Assignment: _______________________
Performance Criteria Superior (3) Acceptable (2) Unacceptable (1)
Identification of key
stakeholders in the
situation involved
Identification of most key
stakeholders in the
situation involved
Identification of some key
stakeholders in the situation
involved
Failure to identify key
stakeholders in the
situation involved
Comprehension of the
ethical dilemma
presented in the case
Thorough understanding
of the general ethical
dilemma and the major
tradeoff of competing
values
Some understanding of the
general ethical dilemma
and the major tradeoff of
competing values
Little or no
understanding of the
general ethical dilemma
and the major tradeoff of
competing values
Quality of the
solution(s) presented to
resolve the ethical
problem
Recommends a course of
action that would resolve
the ethical problem in an
effective manner under
the circumstances
Recommends a course of
action that is workable, but
less effective than other
options/solutions
Recommends a course
of action that would not
resolve the ethical
problem
Student attitude about
resolving the ethical
problem presented in the
case
Words and manner
suggesting a view that
meets (or exceeds)
general social
expectations of business
professionals
Words and manner
suggesting a view that does
not significantly fall short
or deviate from general
social expectations of
business professionals
Words and manner
suggesting a view that
significantly falls short
or deviates from general
social expectations of
business professionals
Quarter: ____________ Course ____________ Section ____ Professor: _______________
Superior _______ (10-12 points) Acceptable _______ (7-9 points) Unacceptable ______ (4-6 points)

28 Business Education Innovation Journal Volume 4 Number 1 June 2012
The Rise, Fall, and Return of E-Marketing Curriculum:
A Call for Integration
Chong “Joanna” S.K. Lee, California State University, East Bay, Hayward, CA, USA
ABSTRACT
In the late 1990s, a marketing department engaged in developing a market-based E-Marketing curriculum and
launched a BSBA E-Marketing option in response to strong community interests in E-Commerce. The program
failed to garner sufficient interest due to the bursting of the dot-com bubble in the early 2000s, shortly before the
program launch. Students showed mixed interest in the E-Marketing option program and corresponding courses,
evidenced by registering for individual courses yet few students enrolling in the option program as a whole. This
trend continued long after the successful comeback of E-Commerce until 2008. The University eventually dropped
E-Marketing from the list of options in the Undergraduate Business Major in 2009. This paper reflects on the lessons
learned from experiencing the rise and fall of interest in the E-Marketing program in its early form and discusses the
way ahead for E-Marketing programs in a changing marketing education environment.
Keywords: E-marketing curriculum, marketing education, integrated marketing curriculum
INTRODUCTION
The dot-com proliferation in the late 1990s was a wake-up call to educators as well as to industry practitioners.
Many businesses in the community, reflecting on their E-commerce possibilities and interests, demanded an E-
Marketing curriculum that addressed teaching operational knowledge of E-Commerce. In response to the strong
community interests in the E-Commerce curriculum in the late 1990s, a Northern California state university’s
marketing department undertook a market-based curriculum development process. In 2001, the department launched
an undergraduate degree (BSBA), embedding an E-Commerce Marketing program as an area of concentration.
Upon introduction, the program was noted as the first undergraduate E-Commerce Marketing program anticipated in
the San Francisco Bay Area (Goll 2001). Contrary to expectations of the department, however, students’ responses
to the E-Commerce Marketing curriculum were mixed. After seven years of low enrollment in the E-Commerce
Marketing option program, the option was discontinued. The purpose of this paper is to review the experience of an
E-Commerce Marketing Curriculum from its development to discontinuation between 2000 and 2008, and to impart
the lessons learned from the E-Marketing program in its early form into a discussion of a future E-marketing
curriculum. The following section describes the life of the program in detail from development, to implementation,
and discontinuation.
THE PROGRESS OF AN E-MARKETING CURRICULUM
The Rise of an E-Marketing Program The search for a market-based E-Marketing curriculum began with information-gathering exercises. In addition to
consulting the widely accepted criteria for accreditation of business programs (AACSB, 1995), the department
sought to understand employers’ requirements for marketing jobs in the community. A study of marketing careers in
the university’s immediate service area was conducted in the fall quarter of 1998 (Lee and Ardoin, 1998). The
exploratory study involved content analysis of marketing position requirements and qualifications noted in job
announcements of selected companies of various sizes. By and large, the findings confirmed the previous
understanding of employers’ expectations of marketing graduates, such as the possession of strong communication,
interpersonal, and team building skills. In addition, the study findings revealed several new key areas that needed to
be incorporated into the curriculum. They included analytical and research skills, strategic and integrative skills,
negotiation skills, an international/global perspective, and leadership skills. The summary of the study findings is
presented in the Appendix A.
The aforementioned study of marketing career announcements identified a set of skills employers reportedly
required. However, it did not uncover the emerging needs of E-marketing practitioners in the industry at the time.
Due to the nature of discontinuous innovation (i.e., E-marketing practice as well as curriculum), it seemed critical to
understand the needs of practitioners in developing the E-curriculum in 1998. Faculty participation in practitioners’

Elm Street Press All Rights Reserved © 2012 www.beijournal.com 29
seminars and industry conferences were sought in order to gain insights into emerging interests of marketing
practitioners. Participants of various Direct Marketing Seminars, for example, coming from a wide range of
industries, desired to learn how to operate and benefit from E-marketing, use the media and technology to improve
their marketing, understand and analyze customer behavior, design web pages and interactive communication
programs such as email marketing, and understand the impact of the new development on their practice at the time.
Lessons learned from industry seminar participation indicated that the E-Marketing curriculum needed to
incorporate the desired technical skill sets of database analysis and application of information gained from analysis
using the technology of E-marketing. It was understood that the E-Marketing curriculum ought to include a set of
hands-on courses to teach and learn about both front and back-end responsibilities and operations in addition to
integrating strategic/theoretical content. Incorporating the marketing career position analysis and the understanding
of marketing practitioners’ needs, an E-Commerce Marketing Curriculum was developed as follows:
Table 1: E-Commerce Marketing Option program in 2000
Required Courses: 20 units (5 courses)
Marketing Principles
Marketing Research
Database Marketing* OR Web Marketing*
E-Commerce Marketing*
Integrated Marketing Management
Elective Courses: choose 8 units (2 courses) from:
Advertising Management Consumer Behavior
Product/Pricing Promotion
Web Marketing OR Database Marketing
International Marketing Sales Management
Environmental Marketing
*notes unique requirements for the E-commerce Marketing option. Note: the option requirement is added to the
BSBA core course requirements (approx. 90 units)
The E-Commerce Marketing Management option in the BSBA program was designed to prepare students for
marketing jobs in E-Business. The E-Commerce Marketing Management option required two more courses than
other option choices in the BSBA major program. Specifically, the option required courses in Marketing Principles,
Marketing Research, E-Commerce Marketing, Integrated Marketing Management, three courses in Marketing
Electives including Database Marketing and Web Marketing. It was intended that the program would prepare
graduates with either back-end operational tools or front-end presentation skills necessary to perform the E-
Marketing functions in an organization.
The Fall of the E-Marketing Option Program
There was a substantial time lapse between the initial sensing of the need in 1998 and the officially-approved
program start date in 2002 due to the required due diligence in the curriculum development process of the
institution. The first E-content course, a Special topics course on Web-Marketing, was test-marketed in summer
1999, generating 200 percent of the course cap on the waitlist. The positive results from the test-offering of the E-
content course brought accolades to the department during the preparation period from curriculum development to
hiring new faculty. The program officially took effect in 2002 and the department was prepared to grow enrollment
with the new E-Commerce Marketing program.
Contrary to the department’s expectations, the substantial interest shown in the program was not realized in the
actual enrollments in the program. It was anticipated that after the dot-com shakeout settled, the demand for the
program would improve (Goll 2001). However, enrollment in the option did not improve after a grace period of
several years and it was placed on the list of discontinuation in 2009. In the aftermath of the unsuccessful launch of
the E-Commerce Marketing option program, it is speculated that there may have been several factors responsible for
low enrollment in the option:

30 Business Education Innovation Journal Volume 4 Number 1 June 2012
Bad Timing: The dot-com bubble burst in 2001 may have contributed to the perception of reduced career
opportunity in E-Marketing, and therefore to the lack of interest in a degree in E-Commerce Marketing.
Wrong Price: It cost more to graduate with the option (i.e., requiring two more courses) than other options in
BSBA, such as the traditional Marketing Management option.
Promotion Neglect: There was a lack of visibility and attractiveness of the option due to lack of promotion. The
department may have been discouraged by the reduced excitement in the industry shortly after the bubble burst.
Benefit Deficient: There may have been a lack of differentiating value of the option. That is, students could take
E-marketing content courses as electives for the Marketing Management option without increasing their overall
course load.
Lack of Relative Advantage compared to the regular marketing option.
It should be noted, however, that while very few students selected E-Commerce Marketing as their area of
concentration, individual enrollments were strong in e-marketing content courses such as E-Commerce Marketing,
Database Marketing, and Web Marketing. This mismatch between the course enrollment and the option demand
may indicate that students are interested in learning the E-marketing concepts and tools in general but not as an area
of specialization. It may also reflect the natural course of progress in the E-Marketing curriculum life cycle. At its
inception, E-Marketing may have been a separate area to augment the traditional marketing practice. But as time
passed, the new and innovative approach became a part of the regular process and normative behavior. In other
words, there is no need to separate E-marketing process from the marketing practice and E-consumer behavior, from
normative consumer behavior, because the E-Marketing as well as E-consumer behavior became an integral part of
the regular marketing process and consumer behavior.
The Return of E-Marketing curriculum: a Call for Integration into the Marketing Program
As one of the first providers of the stand-alone undergraduate E-Commerce Marketing option degree program, the
department experienced the rise and fall of an E-Marketing degree program interest in its early form. Though the
department did not realize the anticipated response to the option program, it did experience the benefits of growing
interest in courses that addressed marketing with new technology. The sustained student interest in E-marketing
content courses seems to confirm the importance of teaching and learning marketing with new technology.
A decade-long progression in E-behaviors and marketing practices seems to note a strong call for an integrated
marketing curriculum in which E-marketing contents are incorporated into all relevant marketing courses. Since the
dot-com enthusiasm in late 1990s, there have been continuous innovations made in computing and communication
technology that resulted in changes in marketing. Of those innovations that took place in the last decade, the social
media phenomenon marks a significant change and is expected to bring about further substantial changes in business
practices as well as the daily lives of individuals.
Marketing tools and technologies have and will continue to evolve in the future. Thanks to technological advances,
E-shopping behavior has become the norm in the general public’s life. The fast-paced changes in the last decade
negate the need to recognize E-Marketing as a separate practice, as E-Marketing has become an integral part of the
general practice of marketing. The concepts and methods used in E-Marketing should be included in all courses. It
is, therefore, imperative that instructors of marketing reassess the validity of the scope and the relevance of the
methods of their instruction in the context of the changing educational requirements of marketing.
A review of recent studies which investigated desirable qualities of marketing graduates reveal areas that marketing
educators need to consider in preparing their students for marketing jobs. In an in-depth interview with marketing
professionals, Lee (2006) identified a list of desirable qualities of marketing graduates as perceived by marketing
professionals. The list confirmed previously identified skills such as communication, teamwork, analytical, and
problem solving. The study also identified information skills, research skills, and technological fluency as important
qualities that employers look for in their new marketing hires. In addition, the study notes that employers also view
openness and flexibility (i.e., ability to learn/adapt as you go) as an important personal quality along with creativity
and high energy.
In an in-depth interview of graduates and employers, Walker et al. (2011) investigated important skills that are
necessary for a successful marketing career. The study indicated that employers view communication, sales
knowledge, analytical skills and tools, market research, and application skills as important for a successful
marketing career. The study further identified two types of communication as important. They included
Elm Street Press All Rights Reserved © 2012 www.beijournal.com 31
communication specific to marketing roles and generic communication skills and communication software. Both
types of communications skills were viewed as important. The sales knowledge refers to the understanding of the
customer and the sales process, which seems to indicate the importance of customer orientation and focus in
persuasive communication process.
A study of UK employers (Heffernan et al., 2010) found eight employability attributes in marketing graduates. The
eight attributes included communication, teamwork, problem solving, work ethic, desirable persona, customer focus,
core skills, and leadership. The study attributed work ethic to flexibility and willingness to learn, the desirable
persona to self awareness and confidence, and the core skills, to numeric, verbal, and IT skills. The study also
indicated that employers valued ‘application skills’ as well as ‘customer orientation’ in their new hires.
In a broader study of top ten marketing managers' competency, Montoya et al. (2010) posited marketing managers
as a firm’s key resource and investigated their distinctive core competencies through the Delphi technique. The
study found that half of the top ten competencies were classified as attitudes such as open-mindedness, anticipation,
flexibility, developing others, and leadership. Other competencies included formulating a marketing plan,
identifying the source of a competitive advantage, aligning marketing and sales plans, communication (personal)
and communication of company image and reputation.
It appears that recent studies indicate attitudinal qualities to be as important as knowledge and skills that have been
identified as important in previous studies. It is interesting to note that the desirable attitudinal qualities of ‘open-
mindedness, flexibility, willingness to learn, and confidence’ tend to reflect the necessary qualities in coping with
changing business environments. Incorporating desirable qualities of marketing graduates found in recent studies, a
list of learning goals is developed and presented in the Appendix B. The appendix shows a list of goals that need to
be reflected in a new marketing curriculum. The list indicates that a marketing curriculum needs to offer strong
customer focus training, to equip them with enabling tools and technologies, and to teach them how to learn and
adapt to changing business contexts in addition to developing communication, teamwork, problem solving, and
leadership skills. The list suggests a few required courses for students interested in a marketing career. The required
courses may include marketing strategy and planning, market research, international marketing, advertising and
marketing communications, and one or more courses in marketing information systems including marketing
research, database development and analysis, web marketing and research. The growing importance of attitudinal
qualities in marketing hires indicates that marketing educators should be alert to the need to bring out innate
qualities of creativity, open-mindedness, flexibility and confidence from students and be mindful of instructional
methods that may foster the desired outcomes. The challenge to educators is not only to develop a curriculum that
would train students with the current tools and techniques but also to prepare them to be adaptive to future changes.
Therefore, the scope of a marketing education should not be limited to the realities of today but rather extend to the
possibilities of tomorrow. Furthermore, students should be encouraged to go beyond the classroom and to get
involved in internships and extracurricular activities that offer further confidence building opportunities. The tasks
are to equip students with a solid foundation of principles, to practice new tools and methods in the class, and to
foster an engaging learning environment in which students will learn to adapt and grow in confidence.
Educators also need to incorporate new technology into their mode of instruction to improve the overall pedagogical
effectiveness. Today’s students grew up with computers and cell phones in everyday life. Not only is new
technology an important business tool to teach but also, it is a student lifestyle that may be used as another tool to
improve instructional effectiveness. Students need to learn how to utilize the communication tools in everyday life
and build confidence in learning new technology. Regular use of new technology in classes may contribute to the
development of ‘technological fluency’ desired by employers. There is a need, therefore, to incorporate new
technology in pedagogy as an instructional tool.
Today’s marketing educators face the challenge of preparing students for future marketing jobs in which digital
connectivity is not only prevalent in the work environment but is also expected to progress in sophistication and
importance. The E-Marketing curriculum interest has remained steady and it will continue to grow. This growth
ought to be reflected not in the form of a separate program but of an integrated curriculum in which E-marketing
issues are blended into every marketing course. Therefore, the E-marketing curriculum needs to be incorporated into
the core marketing discipline as an integral part rather than a division of the discipline. This continuing evolution of
marketing technology and the demand for an integrative perspective call for a reform of the curriculum, in which
32 Business Education Innovation Journal Volume 4 Number 1 June 2012
every course incorporates E-marketing contents, tools, and technology. Reflecting this view, an alternative
curriculum is proposed in Table 2.
Table 2: An Integrated Marketing Curriculum
Required Courses: (20-28 units)
1. Marketing Principles: Incorporate Electronic & Mobile-Commerce models, tools and techniques
2. Marketing Research and Analytics: Possibly a two-part course addressing the complete cycle of marketing
information process. The major contents may include quantitative and qualitative research methods;
database and customer base analysis; online behavior analysis and web analytics; marketing performance
measurements: hands-on, project based
3. Buyer Behavior: Incorporate e-buyer behaviors and customer journey; the role of digital media (e.g., Web,
YouTube, Facebook and Twitter) in information search and buyer decision making; cases and projects
4. Advertising/Integrated Marketing Communication (IMC): Possibly a two-part course; incorporate social
media in advertising media analysis and planning; train students in professionally using social media such
as Facebook, Twitter, LinkedIn, and mobile communication channels; require an Integrated Marketing
Communication (IMC) campaign project that utilizes various media channels including social media
5. Integrated Marketing Management: A capstone project; require development of an integrated marketing
plan which includes an Integrated Marketing Communication (IMC) plan.
Elective Courses: (4-8 units)
Marketing Channels B2B Marketing
International Marketing Product and Price
Table 2 proposes an integrated marketing curriculum in which existing courses are revised to reflect the changes in
marketing. The table lists current marketing management option courses, which incorporate new marketing concepts
and tools as appropriate and relevant to the subject. In addition, each course is identified with areas to be
incorporated as well as suggestions for structure and exercises. As the table shows, the concepts and tools of E-
marketing are incorporated in all required marketing courses in the form of relevant course contents and exercises.
CONCLUSION AND RECOMMENDATIONS
This paper presents the learning experience of a marketing department with an E-marketing curriculum in its early
form. Although the E-Marketing option enrollment was disappointing, there has been continuing interest in
individual E-marketing content courses. A reflection on the E-Marketing curriculum journey offers a direction for
the future development of a marketing curriculum. As the vast majority of today’s consumers engage electronically
in some or all parts of their consumer decision making process, E-buyer behavior should be regarded as an integral
part of their overall buyer behaviors. Consumers may start their shopping journey online, for example, but they may
complete their purchasing off-line in a brick and mortar operation, or vice versa. This is a different environment
from the late 1990s when there was a clear distinction between commerce and E-commerce, and the E-commerce
operation was considered a separate division of the business. Today, there is no longer a divide between commerce
and E-commerce.
Over the course of the last decade, the boundaries of E-Marketing have disappeared and E-marketing practices have
permeated all aspects of marketing operations. The state of market reality calls for an integrated marketing
curriculum in which relevant E-marketing concepts, tools, techniques, and strategies are incorporated into regular
marketing courses. On the surface, there may not be any change reflected in a new course title or a new program.
However, the changes ought to be made internally in every marketing course. Marketing courses need revision and
retooling to maintain relevancy in ever-changing marketing conditions and the ubiquitous presence of technology. It
is inconceivable to introduce new courses every time new marketing methods arrive. Inasmuch as new methods can
be incorporated into existing courses, it is desirable to reinvent and retool the existing courses.
In addition to the need for an integrated marketing curriculum, marketing educators today face challenges that result
from multi-faceted changes. They include technological advances, globalized operations, buyer characteristics and
behaviors, industry norms and practices, employer expectations and preferences, and student characteristics and

Elm Street Press All Rights Reserved © 2012 www.beijournal.com 33
learning styles. For instance, marketing educators are challenged by technological gaps between the old instructional
methods that instructors are accustomed to and the new instructional methods that the new generation of students
responds to. Today’s students, often known as Generation Y or Millennials, learn differently. They were born and
raised in a multi-media environment and they reflect multi-media usage in their communication. They tend to
respond better to more dynamic and participatory experiences (Odell, 2004). This implies that they need to be
engaged in and outside of the classroom. It is noted that students learn better by doing (Lee, 2006) and that a
dynamic and engaging teaching method prepares students for the workplace, where employers require marketing
graduates who can apply their marketing knowledge (Walker, Tsarenko, Wagstaff, Powell, Steel and Brace-Gavan,
2011). Students need to be challenged with real life projects and internships to practice application and to build
confidence. Educators should think beyond the traditional classroom lecture and exercises in order to provide an
engaging learning environment. Furthermore, new teaching methods need to be developed to entice the technology
savvy lifestyle of the new generation of students (Athaide 2005; Kaplan, Piskin, and Bol, 2010). Educators may
need to augment lectures and discussions by incorporating technology-enhanced responsive mechanisms such as
i>Clicker in order to engage students in the classroom.
In anticipation of continuing changes in the marketing environment, one can relate to the adage, “The only thing that
is constant is change.” While we take this statement for granted, it does offer significant challenges to educators in
marketing as they must teach students how to stay relevant in a constantly changing environment. The notion of
constant changes poses a challenge to marketing educators with the question of how to prepare their students for this
fast-paced, ever-changing, dynamic environment. What we teach in the class may soon become yesterday’s reality.
The industry practice is always a step ahead of the faculty’s preparedness with the newest marketing technology. It
is imperative for academia to continue to strengthen its ties with practitioners (Doria, Rozanski, and Cohen, 2003) in
order to reflect business reality in the classroom and to prepare students for their future careers (Mirbach, 2010).
Practitioners need to be included as partners in the continuous revision of curriculum (Kelly, 2005; Lee, 2006).
To put the educational challenge of ‘constant change’ in a long term perspective, it is important for educators to
prepare students for changes in the future. Marketing inherently deals with changes. It is the rate and the scope of
changes that need further emphasis in teaching students to anticipate and learn to navigate the forthcoming changes.
In reflecting upon the journey of an E-Marketing curriculum in the context of a changing environment, a few points
emerge as critical to preparing students as learning individuals: teaching timeless principles of marketing (focus on
the customer as the moving target), developing continuous learning/research skills, building confidence through
applications, and promoting positive attitudes and high energy.
In conclusion, marketing education today requires a balance of instructing the unchanging principles and
incorporating new tools and technologies in the classroom in order to prepare agile professionals for tomorrow. The
best of the old methods need to be strengthened in the relevant context. Clearly, the traditional approach to
curriculum (i.e. a collection of individual courses taught in the classroom, independent of one another) cannot
prepare students to perform effectively in the next wave of change that may require continuous transformation of the
discipline and careers in Marketing.
REFERENCES
AACSB (1995). Achieving Quality and Continuous Improvement through Self- Evaluation and Peer Review: Standards for Accreditation/Business Administration and Accounting. St. Louis, MO: American Assembly of Collegiate Schools of Business.
Athaide, Gerard A. (2005). Design and Implementation of Interdisciplinary Marketing/Management Course on Technology and Innovation Management, Journal of Marketing Education, 27 (3), 239-249.
Doria, Joyce, Horacio Rozanski, and Ed Cohen (2003). What Business Need from Business Schools, Strategy + Business, 32 (Fall), 39-45.
Goll, David (2001). Cal State creates first don-com degree, East Bay Business Times, March 30, 7.
Heffernan, Troy, Weizhe Feng, Robert Angell, and Yan Fang (2010). Employability and Marketing Education: Insights from the United
Kingdom, Retrieved on March 3, 2012, from anzmac2010.org/proceedings/pdf/anzmac10Final00140.pdf
34 Business Education Innovation Journal Volume 4 Number 1 June 2012
Kaplan, M. D.., Piskin, B., and Bol, B. (2010). Educational blogging: Integrating Technology into marketing experiences, Journal of Marketing
Education, 32(1), 50-63.
Kelly, Craig A. (2005). Introducing Professional and Career Development Skills in Marketing Curriculum, Journal of Marketing Education, 27
(3), 212-218.
Lee, Chong “Joanna” S. K. and Melanie Ardoin (1998). Careers in Marketing: A Report of Marketing Jobs in the Bay Area, Unpublished Paper,
California State University, Hayward.
Lee, Chong “Joanna” S. K. (2006). Marketing a department: One Chair’s Experience in Curriculum Revision, Journal for Advancement of
Marketing Education, 9(1), 9-17.
Mirbach, Bill (2010). How to Prepare for Successful Careers in Direct Marketing, Keynote Speech in the Direct Marketing Educators’
Foundation Student Career Forum, Direct Marketing Association Conference, October 11, 2010.
Montoya, Gemma, Emilio Huerta, and Josep Rialp (2010). Marketing Managers as Firm’s Key Resource: Setting Their Distinctive Core
Competencies Through a Delphi, Retrieved on March 8, 2012, from www2.hull.ac.uk/.../ID%20151%20Montoya%20G,%20Huerta%20E...
Odell, P. (2004). Catching up with Echo Boomers, 4As conference. Retrieved February 7, from http://promomagazine.com/news/marketing_catching_echo_boomers/
Walker, Ian, Yelena Tsarenko, Peter Wagstaff, Irene Powell, Marion Steel, and Jan Brace- Govan (2011). The Development of Competent
Marketing Professionals, Journal of Marketing Education, 31(3), 253-263.
Chong “Joanna” S.K. Lee, Ph.D., is a professor of marketing and the chair of the Department of Marketing and
Entrepreneurship at California State University, East Bay. Her research interests include assessments of promotional
effectiveness and customer satisfaction as well as marketability of marketing graduates.

Elm Street Press All Rights Reserved © 2012 www.beijournal.com 35
Appendix A: Desired Skill Sets for Marketing Major from 1998 Marketing Job Analysis
Communication Skills
Organizational communication skills, written, spoken, and listening
Interpersonal communication skills
Presentation skills
Information Competency
Knowledge of databases and statistics
Ability to generate, analyze, report, and apply information for business problems
Ability to ask critical questions
Problem Solving Skills
Ability to define problems, collect data, establish facts and define strategy
Creative and analytical skills: sound creative judgment as well as analytical capabilities
Critical thinking skills
Information based problem solving capabilities
Process Management Skills
Ability to manage multiple assignments
Ability to manage project from conceptual development to completion
Organization skills
Time management skills
Team Building Skills
Motivated team player
Flexible, team oriented attitude and skills
Effective partnering skills
Technology Proficiency
Proficiency in relevant PC Software
Proficient in the use of the Internet
Proficiency in Web-based research method
Other Qualities:
Business integrity and ethics
Service to community
Leadership capacity
International (Global) understanding

36 Business Education Innovation Journal Volume 4 Number 1 June 2012
APPENDIX B: Desired Qualities of Marketing Graduates in 2006 and Beyond:
What Employers Look For in Their New Marketing Hires
Communication Skills
Written, Verbal, and Listening
Cross-cultural communication skills
Presentation skills
Communication software
Teamwork and Collaboration
Flexible, team oriented attitude and skills
Effective partnering skills
Problem Solving Skills
Ability to define problems, collect data, establish facts and define strategy
Creative and analytical skills: sound creative judgment, analytical capabilities
Information based problem solving capabilities
Information/Research Skills
Ability to generate, analyze, report, and apply information for business problems
Ability to ask critical questions
Technological Fluency
Online research
Database analysis
Software and process
Experience in data-to-information process
Application Skills
Apply theory to practice
Apply information to problem solving
Hans-on analysis and business problem solving
Customer orientation
Knowledge of customer process
Knowledge of sales process
Customer focus
Other Qualities:
Cross-cultural training, international exposure
Openness and flexibility, ability to learn and grow
High energy, creativity, intelligence, enthusiasm
Elm Street Press All Rights Reserved © 2012 www.beijournal.com 37
Assisting Students in Gaining Employable Skills: Valuing and Encouraging
Extracurricular Activities
Chris Ward, The University of Findlay- Findlay, Ohio, USA
Dan Yates, The University of Findlay- Findlay, Ohio, USA
ABSTRACT
Discussions regarding the preparation of undergraduate students for employment often stop at the class level with
specific content to be delivered or skills to be sharpened through assignments, projects and tests. While knowledge
and skills learned in the classroom are important, students may not have enough opportunities to apply what they
have learned or the time to develop leadership skills they need to be more confident and to compete in the job
market. This research looked at the importance of extracurricular activities, including internships and a study
abroad, as a key part of preparing students for employment.
Keywords: Extra-curricular activities, undergraduate students, learning outcomes
INTRODUCTION
It is becoming increasing important for undergraduate students to approach their education differently. In the past,
students could concentrate on getting a high GPA and be fairly confident it would lead to multiple job offers.
However, in this economic environment, it is important for students to develop a broader view of their education and
the impact that extracurricular activities (ECAs) can have on their overall experience and job prospects. In this
context, extracurricular activities include part-time jobs (on and off campus), internships, athletics, study abroad,
academic and professional clubs, volunteer activities, multicultural activities, the arts, student government,
fraternities and sororities, and honorary organizations. In our research, we found that while a significant number of
business students did participate in service and volunteer activities (59%) and many held a position of leadership on
campus (33%), only 9% is students had participated in a study abroad and 33% of students had done an internship.
For the purposes of this paper, out-of-class and extracurricular are used interchangeably. Again, while GPA is still a
factor in the job selection process, students should be aware that employers are seeking candidates who have a wide
breadth of experiences. It may benefit students to plan their extracurricular involvement in the same manner they
plan the academic portion of their time at a university.
PREVIOUS RESEARCH
Universities often have a set of learning outcomes for their students with specific courses tasked with achieving
specific outcomes. While these learning outcomes can be achieved in courses, it is important to recognize out-of-
class experiences as an important predictor of personal development and to the development of cultural dispositions.
“Today’s college students may gain access to valuable forms of social and cultural capital by “building their
resume” – by becoming involved in activities like Greek life, athletics, community service, and other groups and
organizations on campus” (Stuber, 2009, p.880).
In the research done by Kuh (1995) students who engaged in out-of-class experiences noted changes in specific
outcomes including practical competence, social competence, reflective thought and altruism. In addition,
dispositions such as increased self-awareness and confidence along with a sense of altruism were also reported by
students. “…Leadership experiences (for example, student government or fraternity officer, peer advisor) accounted
for 45.1 percent of all gains in Interpersonal Competence and for almost one quarter of all gains in Practical
Competence” (Kuh, 1995, p. 131). One particular student body president “learned how to plan budgets and manage
resources (Practical Competence) and communicate to different groups of people (Interpersonal Competence)” (p.
131). In another example, a student who was serving as a peer advisor reported increased Interpersonal
Competence, Humanitarianism and Cognitive Complexity as her role provided “... insights into, and appreciation
for, the issues with which many students from historically underrepresented racial and ethnic groups must contend
on predominately white campuses” (p. 134). This is not to take away from the importance of active learning in the

38 Business Education Innovation Journal Volume 4 Number 1 June 2012
classroom but it is an additional opportunity to synthesize information and further develop characteristics valued by
employers while engaged in these out-of-class experiences.
Astin’s (1993) study showed other types of academic involvement were generally beneficial to student learning and
personal development. This included participating in cultural workshops, internships, independent research projects
but also making class presentations. Internships in particular, Stuber (2009) noted, especially interacting with a boss
and co-workers during an internship, students’ can gain in areas like social capital and cultural know-how. They can
also observe how people in their field “interact with clients and co-workers on the job and outside of work” (p.881).
Knouse, S. B., Tanner, J. T., & Harris, E. W. (1999) believe “College internships offer a variety of benefits to
students both for improving performance while in college and for increasing opportunities for finding a job upon
graduation (P. 2). The internships were a way to separate the student from their peers and a national recruiter for a
large financial company agreed when she commented “Schools that focus in on accommodating internships as part
of their course curriculum position their students very well for future employment” (quoted in Burnside, 2010, p.
52). Employers interviewed in a study by Muldoon (2009) cited communication skills, including customer service,
and organizational skill along with personal attributes such as responsibility and motivation were best learned
through part-time work and increases employability. Stuart, Lido, Morgan, Solomon and May (2011) study asked
successfully employed alumni to reflect on the effect of participating in extracurricular activities had on their
academic performance and career. Alumni emphasized the social aspect of engaging in extracurricular activities
but also how these activities helped to develop their sense of identity and build self-confidence. “… all alumni”
Stuart, et al reported, “described how the social networks they make in ECAs helped them to find jobs or to progress
within their chosen career, some directly, others indirectly via their social contact helping them with job placement”
(p. 209). In addition to surveying alumni, Stuart, et al (2011) asked employers the relative importance
extracurricular activities played in their selection and hiring practices. Ultimately employers want a person with
relevant work experience but they did recognize that all students may not be able to acquire the experience.
Therefore, “… ECAs became a way for applicants to illustrate the skills and experiences they had developed
through other means” (p. 210).
The scaffolding theory applies well to these situations as it “… involves performing parts of the task that the
students cannot perform and gradually reducing the amount of guidance and shifting the control to the student”
(Merrill, 2002, p. 50). This technique allows the student to adjust to the new task with only some prior knowledge
and develop multiple alternatives in low risk situations. Many times these opportunities occur in extracurricular
activities. The key to providing many of these experiences is to encourage student as early as their freshmen year to
seek out opportunities to get involved in clubs, service, internships, and other extracurricular activities.
RESEARCH
Much of the authors’ research up to this point has been connecting the engagement of students to external content
knowledge, specifically the National Survey of Student Engagement to the ETS Business Major Field Test. Several
questions on the survey did gather information on extracurricular activities. These included whether the students
participated in community service or volunteer work; the type of co-curricular activities they participates in (this
was a check all that applied); number of hours per week spent on extracurricular activities; if they had done an
internship or study abroad; and if they had held a position of leadership (student government, resident assistant, club
officer, etc.) on campus. A total of 81 students have taken the survey. All of the students have some sort of
business related major. The results can be seen in Table 1.
Table 1: Student Participation in Extracurricular Activities
Extracurricular activity Percent of students
Community Service or Volunteer Work 59%
Internship 36%
Study Abroad 9%
Held a Position of Leadership on Campus 33%
As indicated above, the number of hours the students spent participating each week in these activities along with the
types of activities they participated in was also collected. Most of the students spent 1-3 hours (53%) but other
students spent more time with 10% spending 4-7 hours per week and 14% spent 8 hours and over participating in

Elm Street Press All Rights Reserved © 2012 www.beijournal.com 39
extracurricular activities. It is important to note that these hours excluded intercollegiate sports. In addition, the
students participating in the following activities: School-based clubs or groups (excluding fraternity and sorority) –
68%, intercollegiate sports – 37%, on campus work (student assistant, etc.) – 30%, community based clubs or
groups (Habitat Rotaract, etc.) – 17%, creative or performing arts – 7%, orientation or admissions ambassador – 5%,
fraternity or sorority – 4%, campus publication – 4%, and resident assistant – 2%. It is important to point out that
students could check all that applied to them and it is not uncommon for students to be involved in multiple clubs or
participate in athletics as well as be involved in other extracurricular activities. Typical leadership positions for
business students included Marketing Club, Accounting Club, Investment Club, Students in Free Enterprise (SIFE),
Student Government Association, Black or Korean Student Association, Law Society, Colleges Against Cancer, and
Public Relations Student Society of America (PRSSA).
While we are pleased with the participation rate in community service or volunteer work and leadership positions,
the numbers for internships and particularly study abroad experiences are a bit disappointing. Although motivation,
noted Knouse, et al (1999), may be a factor in some students seeking out internships, more recognition of those
individuals doing internships as well as broad communication of internship positions through websites, brochures,
and even directing information to incoming freshmen brings a higher degree of awareness to the importance of
doing internships as well as motivate students to begin preparing themselves for an internship early in their
academic career. While motivation could play a part, students may not participate in a study abroad simply because
they do not have the financial means. The same philosophy applies to internships, especially for the low paying or
unpaid internships. This is particularly difficult for situation for everyone. Career services and professors would
like students to have the internship experience and are sympathetic to the organization that maybe unsure of the
value a student could add to their organization. However, we also know that many students simply do not have 10-
15 hours a week to spare or are likely working in a job, like a waitress, where they have the potential to make more
money in a shorter number of hours. A possible message to encourage students to get involved in extra-curricular
activities and to do internships was an “increased self-efficacy on the job market which could lead students to
increase their estimated value to employers” (Sallop & Kirby, 2007, p. 134). Employers want to know what the
student did in college beyond going to classes and that the student is going to provide value to the organization
quickly. Students who can communicate that in a resume and then in an interview will more than likely be in a better
position to be chosen for a job than those students who have not accrued those skills. Brunsed (2010) felt smaller
schools were in a better position to provide internships as they could form partnerships with local companies as well
as work one-on-one with the students to prepare and assist them in the pursuit for an internship.
DISCUSSION
Multiple areas of universities can assist students in developing the necessary leadership capacities, social and human
capital and personal responsibility. Career Services, Alumni Office, Development Office, club and organizational
advisers, and faculty should communicate often and work to provide the network, experiences, and support so
students have the best possible opportunity to develop into responsible citizens. “Companies”, noted Knouse, et al
(1999) involved in partnering efforts with the college, such as philanthropy, contracts and special projects, should be
encouraged to use internships as a means of giving to the college and at the same time receiving a qualified pool of
former interns in return” (Implications for College Internship Programs, P. 2). In addition, Stuber (2009) suggested
internships be a requisite part of a student’s major, just like taking a course, and suggested that universities create
financial pathways, better communicate opportunities to study abroad and make “work-study dollars available to
students for internships and other professional work experiences” (p. 897). We know, and the research like Burnsed
(2010) agrees, that “University officials and employers almost universally maintain that partaking in an internship –
or several – before graduation is integral to finding meaningful employment in today’s seemingly impenetrable job
market” (p. 52). If these are strategic priorities, then policies such as the ones mentioned above should be developed
and financially supported. The end result will be students who are better prepared to compete and lead in a global
marketplace.
FUTURE RESEARCH
Our future research will be to survey alumni to determine the value they found in participating in extracurricular
activities and examine the types of students (majors, gender, etc.) who participate most frequently in extracurricular
activities. We would also like to determine why students do not participate in study abroad opportunities or apply for
internships and find institutional models which might be adopted at our own institution.
40 Business Education Innovation Journal Volume 4 Number 1 June 2012
REFERENCES
Astin, A.L. (1993). What Matters in College? Liberal Education. 79(4), 4-15.
Burnsed, B. (2010). When a Degree Isn't Enough. U.S. News & World Report, 147(5), 52.
Knouse, S. B., Tanner, J. T., & Harris, E. W. (1999). The Relation of College Internships, College Performance, and Subsequent Job Opportunity. Journal Of Employment Counseling, 36(1), 35.
Kuh, G.D. (March/April 1999). The Other Curriculum: Out-of-Class Experiences Associated with Student Learning and Personal Development. Journal of Higher Education. 66(2), 123-155.
Merrill, M.D. (2002). First Principles of Instruction. ETR&D. 50(3), 43-59.
Muldoon, R. (2009). Recognizing the Enhancement of Graduate Attributes and Employability Through Part-Time Work While at University. Active Learning in Higher Education. 10(3), 237-252.
Norwood, F. B & Henneberry, S. R. (May 2006). Show Me the Money! The Value of College Graduate Attributes as Expressed by Employers
and Perceived by Students. Amer. J. Agr. Econ. 88(2), 484-498. Stuart, M., Lido, C., Morgan, J., Solomon, L., & May, S. (2011). The Impact of Engagement with Extracurricular Activities on the Student
Experience and Graduate Outcomes for Widening Participation Populations. Active Learning in Higher Education. 12(3), 203-215.
Stuber, J.M. (December 2007). Class, Culture, and Participation in the Collegiate Extra-Curriculum. Sociological Forum 40(2), 877-900. Tenhouse, A. (nd). College Extracurricular Activities – Impact on Students, Types of Extracurricular Activities.
http://education.stateuniversity.com/pages/1855/College-Extracurricular-Activities.html">College Extracurricular Activities - Impact on
Students, Types of Extracurricular Activities
Dr. Chris Ward is an Associate Professor of Business at The University of Findlay. She brings her expertise from
two Fortune 500 companies into the classroom teaching operations and logistics, marketing, leadership, and research
courses. Professor Ward holds the following degrees: University of Sarasota, EdD, Organizational Leadership; The
University of Findlay, MBA and Bachelor of Science in Business Administration. She is also a Six Sigma Black
Belt, 2008 and 2010 Ohio Partnership for Excellence Examiner, NxLevel Certified Instructor, and Six Disciplines
Coach. Her areas of research include student engagement, active learning, undergraduate research, general
education, small business marketing, and promotion and tenure.
Dr. Dan Yates is an Associate Professor of Business at The University of Findlay. His teaching interests include
entrepreneurship, leadership, organization development, and business strategy. Yates holds a PhD degree in
Management from Northcentral University. He also has a MBA from University of Dayton, a Master of
Organization Development degree from Bowling Green State University, and a BS in Accounting from Tiffin
University. He completed the NxLevel Certification Course for Instructor Certification for teaching business plans
at the Innovation Center (Ohio University). He has 30 years industrial and governmental experience.
Elm Street Press All Rights Reserved © 2012 www.beijournal.com 41
Using Tinkertoys to Teach Networking and Telecommunications to Business
Students “Tinker Toys” is a registered trademark of Hasbro
Jeffrey A. Livermore, Henry Ford Community College – Dearborn, MI, USA
ABSTRACT
Tinkertoys are a popular building toy that has been around for almost a century. Industry and education have found
a variety of uses for Tinkertoys. Tinkertoys can be used to create models of business situations and
telecommunication models. The author presents a framework for using Tinkertoys to teach networking concepts to
business students.
Keywords: Tinkertoys, networking, modeling, simulation
INTRODUCTION
Tinkertoys are a popular building toy that has a multitude of uses. Children use Tinkertoys for play purposes, while
businesses and engineers have used them to create physical models or simulations of a variety of processes and
objects. Tinkertoys are easy to use and are available at almost every department and toy store. Tinkertoys are not
indestructible but are relatively durable and have become a fixture in many schools and homes.
Tinkertoys have two basic components; hubs and spokes. The hubs are round wood disks with holes drilled into the
edge of the disk and through the middle of the disk. The spokes are wooden dowels of varying lengths and colors
that can be inserted into the holes drilled in the disks. Tinkertoys can be plugged together to form two and three
dimensional models.
TINKERTOY MODELING
Tinkertoys have been used in real world situations to model problems and stimulate creativity. In 1990, the Hubble
space telescope had an antenna snag that put the entire $2.1 billion telescope at risk. Engineers used Tinkertoys to
model the problem and come up with a solution (Boston Globe, 1990). The engineers constructed a model out of a
lamp cord and a set of Tinkertoys.
The idea of using Tinkertoys to illustrate construction components was used by Ken Thompson of Lucent's Bell labs
when discussing operating system construction (Cooke, Urban, & Hamilton, 1999). Thompson's point was that
sophisticated models and constructions can be visualized with very simple objects. Tinkertoys were also used in the
development of the first cartoon character control software. A data collecting “suit” was developed that used
Tinkertoys connected to potentiometers that enabled a human actor to control a cartoon character (Sturman, 1998).
Tinkertoys have been used by business to create three dimensional models of economic situations. Amoco Oil
Company created an analytical model of their product lines, marketing channels, and marketing outlets. To help
their senior executives understand the model, three sets of Tinkertoys were used to build a three dimensional model.
The Tinkertoys enabled the executives to view the data as a cube where each vertical slice represented a product and
horizontal slices represented a distribution channels. Differences in the Tinkertoy model showed how different
distribution outlets (service stations and retail stores) carried different product lines.
Business schools have used Tinkertoys to illustrate the first mover advantage principle to business students (Coff &
Hatfield, 2003). Students are randomly assigned to groups and asked to build the tallest possible structure with a
given set of Tinkertoys. The students are given 15 minutes to plan the construction and 45 minutes to construct their
tower. The groups that are allowed to observe the construction efforts of other groups typically do better than the
first or second construction group. The builders are debriefed after all teams have built their towers and asked if
their group learned from the efforts of preceding groups.

42 Business Education Innovation Journal Volume 4 Number 1 June 2012
The students are supposed to learn about the resource-based concepts of rarity, instability, substitutability, and the
pros and cons of the first mover advantage. Tinkertoys provide a finite set of resources that can be combined in a
wide variety of ways to construct the tower. Strategy and problem solving are learned while students determine how
to build their tower. This business lesson is extended by asking students if the early builders could “patent” any of
their design elements and what resources might have offset the disadvantage of going first. Students are then given
illustrations of these concepts from the business world. This lesson has even be used in online courses by placing
videos of the Tinkertoy construction efforts in the school's Learning Management System (LMS) . Tinkertoys have
been used to teach a variety of subjects in business education. One school uses an exercise where teams of students
are challenged to build the tallest tower possible with Tinkertoys is a short period of time. According to Peterson
(1977), Tinkertoys are the perfect tool for modeling social systems.
One of the drawbacks to designing and modeling networks on paper or a software graphics program is that networks
are three dimensional. Most networks go into buildings with more than one floor. Two dimensional media and
tools do not capture the reality of a three dimensional network. When modeling with Tinkertoys, it is possible to
build a three dimensional model that reflects the physical reality of common networks. Using a software program
does not provide the same tactile feedback as a set of modeling toys (Eng, Camarata, Yi-Luen, & Gross, 2006).
Removing the tactile stimulus may reduce the feeling of satisfaction associated with creating a physical model.
Voice and data networking can be modeled with the use of Tinkertoys. The hubs can represent network nodes and
the connecting rods can represent the various types of network connections.
TEACHING NETWORKING WITH TINKERTOYS
Illustrate the heterogeneous makeup of network equipment in the typical corporate network by using inexpensive
paint to color code the components of your Tinkertoys. The connecting rods that come with some sets are already
painted but you may want to paint the hubs Color coding the connecters can resent fiber-optic versus copper
connections. Different speeds and type of connection can be modeled with different colored connectors. Different
brands or sizes of hubs, switches and routers can be modeled using different colors of hubs. It is always a good idea
to post the color scheme so it is easily accessible to the students. Some suggestions would be to post it in your
Learning Management System (LMS), include it in the modeling assignment, post it on the classroom wall, or
include it in a PowerPoint slide that is shown during the modeling time.
Table 1: Color coding network connections
Color Connection
Yellow Fiber optic (six pair)
Red Gigabit Ethernet
Blue T-1 or fractional T-1
Green Microwave (line of sight)
Black Structural support only – non networking supports used to support the model
Tinkertoys are an effective tool for teaching business students the economics of networking. The faculty member
can assign a dollar value to each type of device and connector being modeled and have the students estimate the cost
of their model. To further complicate a network modeling assignment, a faculty member can place a dollar cap on
the models which will force the students to decide between different technologies and strategies.
Tinkertoy modeling can be done at the macro and micro levels. The individual pieces can be used to represent:
routers and fiber links for local area networks (LAN), office buildings and plants for metropolitan area networks
(MAN), and cities or even countries for wide area networks (WAN). The only limit to what the pieces can represent
is the instructor’s imagination.
Tinkertoys can be used to teach the basic concepts of cell phone networks. This can be done by spreading out a
county or regional map on a table and then handing out a pre-constructed Tinkertoy hub and spoke that provide a
circular coverage area. The students can understand the problems of selecting and acquiring and cell phone tower
locations. This can be done in a lecture format by displaying a satellite image on a screen with an LCD projector
and holding up a hub and spoke construction. Depending on the height and equipment used for a tower, different
length spokes can be attached to the hubs to model different signal ranges. Examples of different size hubs can be
seen in Figure 1.

Elm Street Press All Rights Reserved © 2012 www.beijournal.com 43
Figure 1: Hub and spoke simulators
Tinker Toy network modeling is very helpful when teaching information assurance and risk management. The
importance of firewall placements and subnet control is easily illustrated in a three dimensional model. The use and
location of intrusion detection devices can also be modeled with Tinker Toys. The use of a three dimensional
models enables a faculty member to demonstrate the impact of moving the location of these key networking devices
around a network.
A home-crafted variation of tactile modeling is gluing strong magnets to the back of Tinkertoy hubs. This enables
the hubs to magnetically “adhere” to many whiteboards, file cabinets, and other classroom fixtures to facilitate
network modeling. It can be challenging to get the connecting rods to remain in place but it enables the model to be
elevated and visible to a larger group of people.
Many business programs have three or four hour class sessions held early in the morning or in the evening for
working students. Keeping the attention of students can be extremely challenging. Breaking the students into small
groups and having them work around tables building models is an excellent technique to break up long lecture
sessions.
On a practical note, there are some challenges to teaching with Tinker Toys or any other prop that students handle.
Tinkertoys can be damaged. Pieces will be broken or lost and the size of your modeling collection will shrink with
time. The best solution to this challenge is to visit garage sales and rummage sales to purchase replacement pieces
at the lowest prices. The author has found that building a collection this way has also led to the acquisition of many
unique and discontinued pieces.
Tinkertoys has produced a variety of unusually shaped building pieces over the years. The author has ‘shopped” for
Tinkertoy sets at garage sales over the years to build of these pieces. Unique building pieces can be used to
represent unique networking devices such as packet sniffers, SNORT monitors, and packet shaping appliances.
Figure 2 illustrates some of the pieces that can represent unique network devices.
If you feel that you absolutely need to have custom sized or shaped toys, it is a simple matter to construct them.
Anyone with basic carpentry skills and a drill can convert blocks of wood or plastic into modeling devices. Match
your drill bit selection to the size of your Tinker Toys and start drilling. Figure 2 illustrates some of the different
“stock” pieces that can be used to simulate different network devices.
Tinkertoys have come in different sizes over the years. Being handy with a drill enables you to create hubs that
enable you to connect different sized pipes to. This is an effective method of visualizing the different sized “pipes”
that we connect our networks with.
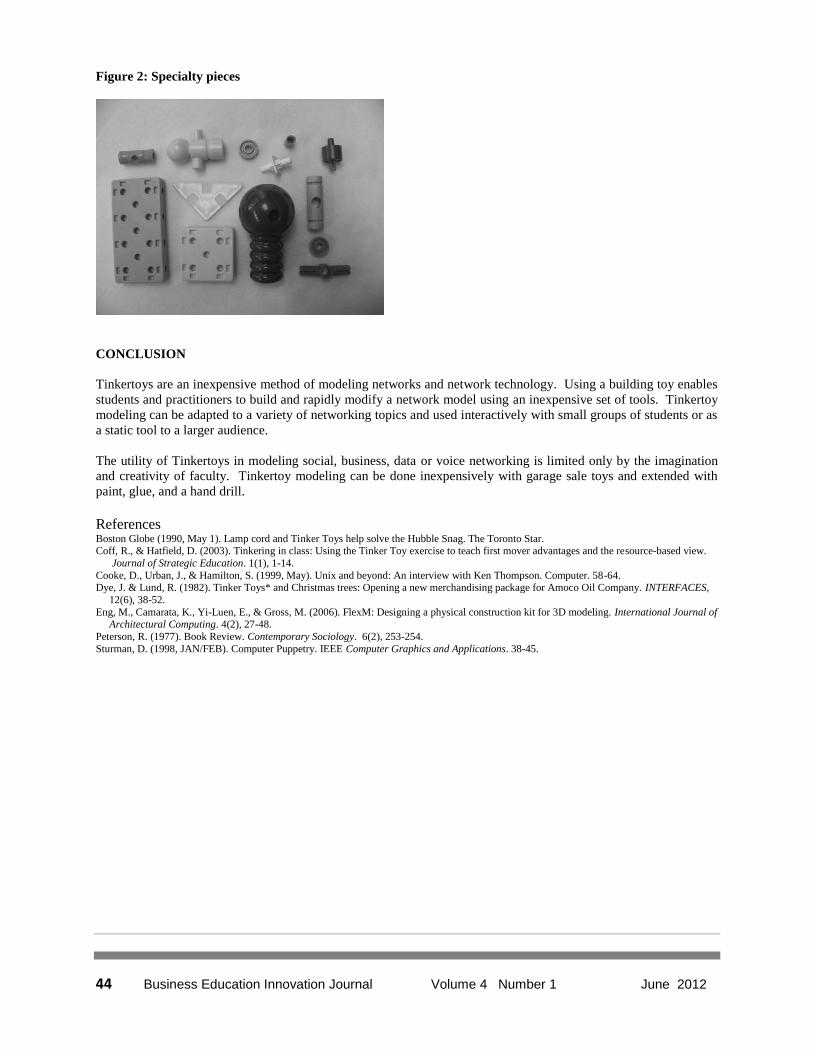
44 Business Education Innovation Journal Volume 4 Number 1 June 2012
Figure 2: Specialty pieces
CONCLUSION
Tinkertoys are an inexpensive method of modeling networks and network technology. Using a building toy enables
students and practitioners to build and rapidly modify a network model using an inexpensive set of tools. Tinkertoy
modeling can be adapted to a variety of networking topics and used interactively with small groups of students or as
a static tool to a larger audience.
The utility of Tinkertoys in modeling social, business, data or voice networking is limited only by the imagination
and creativity of faculty. Tinkertoy modeling can be done inexpensively with garage sale toys and extended with
paint, glue, and a hand drill.
References Boston Globe (1990, May 1). Lamp cord and Tinker Toys help solve the Hubble Snag. The Toronto Star. Coff, R., & Hatfield, D. (2003). Tinkering in class: Using the Tinker Toy exercise to teach first mover advantages and the resource-based view.
Journal of Strategic Education. 1(1), 1-14.
Cooke, D., Urban, J., & Hamilton, S. (1999, May). Unix and beyond: An interview with Ken Thompson. Computer. 58-64. Dye, J. & Lund, R. (1982). Tinker Toys* and Christmas trees: Opening a new merchandising package for Amoco Oil Company. INTERFACES,
12(6), 38-52.
Eng, M., Camarata, K., Yi-Luen, E., & Gross, M. (2006). FlexM: Designing a physical construction kit for 3D modeling. International Journal of Architectural Computing. 4(2), 27-48.
Peterson, R. (1977). Book Review. Contemporary Sociology. 6(2), 253-254.
Sturman, D. (1998, JAN/FEB). Computer Puppetry. IEEE Computer Graphics and Applications. 38-45.

Elm Street Press All Rights Reserved © 2012 www.beijournal.com 45
A Comparison of the Readability of Advanced Accounting Textbooks
Kenneth J. Plucinski, State University of New York at Fredonia – Fredonia, New York, USA
Linda A. Hall, State University of New York at Fredonia – Fredonia, New York, USA
ABSTRACT
Choosing an advanced accounting textbook for use in an undergraduate or graduate curriculum can be a challenging
task for faculty. Advanced accounting textbooks, in general, cover a variety of topical areas, including accounting
for business combinations, international accounting, segment reporting, government and not-for-profit accounting,
partnerships, and reorganizations and liquidations. Publishers offer a variety of ancillary materials including online
lectures, homework, and study tools; vignettes and case studies; and entire course management systems. While
topical coverage and associated supplements are important features, instructors should also consider a textbook’s
readability. This study analyzes the predicted readability of six current advanced accounting texts utilizing the
Flesch-Kincaid Grade Level index. T-tests are performed to determine whether significant differences in readability
exist among the textbooks chosen for the study. No significant differences among the texts in terms of overall
readability are found; however, some variation in readability level was discovered within topic coverage. These
findings can be useful to adopters, authors, editors, and publishers of advanced accounting textbooks. Results also
point to a need for a study of the types and uses of ancillary materials offered with textbooks, and the relative
importance of the text in the learning process.
Keywords: readability, advanced accounting, textbook, Flesch, Flesch-Kincaid
INTRODUCTION
Selecting a textbook for use in an advanced accounting course is a challenging decision for faculty. Since advanced
accounting courses are generally required in the upper-level curriculum and offered as either undergraduate or
graduate level courses, most accounting majors are affected by their decision. As for any text selection, the process
is complicated by multiple text attributes for faculty to consider. Attributes include a text’s pedagogical approach,
topical coverage, type and number of exhibits and examples, vignettes, end-of-chapter materials, and availability of
student and instructor supplements. The authors’ reputations, as well as instructors’ past experiences with the text
and/or authors also factor into the decision. In addition to all of these, a faculty member may wish to consider a
text’s readability in order to maximize the likelihood that a student will understand what is read.
Readability may be defined as the degree to which a class of people finds certain reading matter compelling and
comprehensible (McLaughlin, 1969). Readability, in this context, refers to the qualities of writing which are related
to reader comprehension, rather than legibility or formatting. A variety of techniques have been used to predict
readability, including several readability formulas (or indexes) which have been used widely since the 1950s.
Examples of readability indexes include SMOG (developed by McLaughlin), Flesch Reading Ease, Flesch-Kincaid
Grade Level, Gunning-Fog, and Fry.
An index of readability can be helpful to faculty when making textbook adoption decisions. It has been found that
one of the criteria to which faculty attach the most significance in those decisions is textbook comprehensibility
(Smith & DeRidder, 1997), which can be predicted, at least in part, using a readability index. Evidence also suggests
that the higher the readability (difficulty) level of textbooks, the lower the grade averages in those courses (Spinks &
Wells, 1993).
LITERATURE REVIEW
An increasing, though still limited, amount of research on the readability of accounting textbooks has been
conducted in the recent past. Most previous research, similar to this study, focuses on a certain level or course of
study in accounting. For example, a recognized area of research concerns the readability of introductory accounting
texts, those used in the first or second courses in accounting required of many business and accounting curricula
(Chiang, Englebrecht, Phillips, Jr., & Wang, 2008; Plucinski, Olsavsky, & Hall, 2009; Sullivan & Benke, 1997;

46 Business Education Innovation Journal Volume 4 Number 1 June 2012
Traugh, Powers, & Adedokun, 1987). It is at this ground level that understanding the basic principles of accounting
is deemed critical to future student success, and therefore, deserves this attention (Phillips & Phillips, 2007). Many
of these studies’ results are prescriptive in nature, with results pointing to best practices in choosing an introductory
text.
Several studies have focused (at least in part) on intermediate and cost accounting texts (Adelberg & Razek, 1984;
Davidson, 2005; Flory, Phillips Jr., & Tassin, 1992; Plucinski, 2010; Plucinski, 2011; Razek, Hosch, & Pearl, 1982).
The results of these inquiries are helpful to accounting faculty as the associated courses are required in most
accounting programs. Davidson (2005) considered the long-term trends of the readability of accounting textbooks,
including that of 25 intermediate and 30 advanced books published over five decades. The results showed that
among intermediate and advanced texts, sentence complexity increased, while word complexity decreased over the
period studied. The Davidson (2005) study investigated trends over many years; however it did not compare the
readability of individual texts.
Razek, et al. (1982) examined the readability of six advanced accounting textbooks. They found that all of the texts
measured at a graduate reading level or higher, and that significant differences at the .01 and .05 level existed
between many of the texts. These results, although dated, also pointed out that reliance on the textbook may increase
at the advanced accounting level, not only because of the depth of the coverage of content areas, but also because of
the breadth of content areas addressed. Instructor class time is limited and therefore students are forced to rely on the
text as a source of information and knowledge in order to be successful. Of the texts included in that study, only
three of the authors (contributing to two editions of texts) are included in the current investigation. Since the most
recent readability study of individual advanced accounting textbooks (Razek, et al., 1982) is over 30 years old, and
the textbook offerings have changed appreciably since the 1982 study, this study is an update of the readability of
advanced accounting texts.
METHODS
Choice of Readability Index
Only one of the many accounting textbook readability studies completed in the last 30 years used the Cloze
Procedure (Adelberg & Razek, 1984), a procedure that gauges readability by deleting every fifth word from
passages, then measuring the reader’s ability to restore the passages to their original form. The remaining and more
recent studies use readability indexes, specifically the Fog Index, Flesch-Kincaid Grade Level, or Flesch Reading
Ease. These indexes use a formula based upon characteristics of text passages, such as average word length, number
of syllables per word, average sentence length, and word complexity, to generate a readability score. The Razek, et
al. (1982) study on advanced accounting textbooks utilized the Flesch Reading Ease Score. The current study uses
the Flesch-Kincaid Grade Level, which is an extension of that method. The Flesch-Kincaid Grade Level index was
widely used in previously published studies of readability. It can be easily generated using word processing
software, thereby permitting analysis of a large amount of text with results that are objective and easily replicated.
Flesch-Kincaid Grade Level
The Flesch-Kincaid Grade Level has its roots in the Flesch Reading Ease formula developed in 1948 by Rudolf
Flesch. In 1975, J. Peter Kincaid tested over 500 enlisted United States (U.S.) Navy personnel on a reading-
comprehension test and also on passages from Navy training manuals. This enabled him to derive a version of the
Flesch Reading Ease formula which yielded reading grade-level scores. The resulting Flesch-Kincaid Grade Level
has since been adopted by the U.S. military services as the basis for deciding whether technical manuals from
suppliers meet their readability requirements (Pearson, 2002). The Flesch-Kincaid index is now one of the leading
readability indexes, used extensively by the U.S. government, lawyers, and professional writers (Stockmeyer, 2009).
The Flesch-Kincaid Grade Level formula is based upon sentence length and word length. The index translates to a
U.S. grade level, and can also be interpreted as the number of years of education generally required to understand
text, which may be more relevant at higher education (college) levels. For example, a score of 11.0 indicates that an
eleventh grader can understand the document. The index is best used to compare the relative readability (difficulty)
of text, as is the case in this research. It can be accessed through the spelling and grammar-checking feature in the
word processing software, Microsoft Word (MS-Word). Similar features are available in other word processing
software.
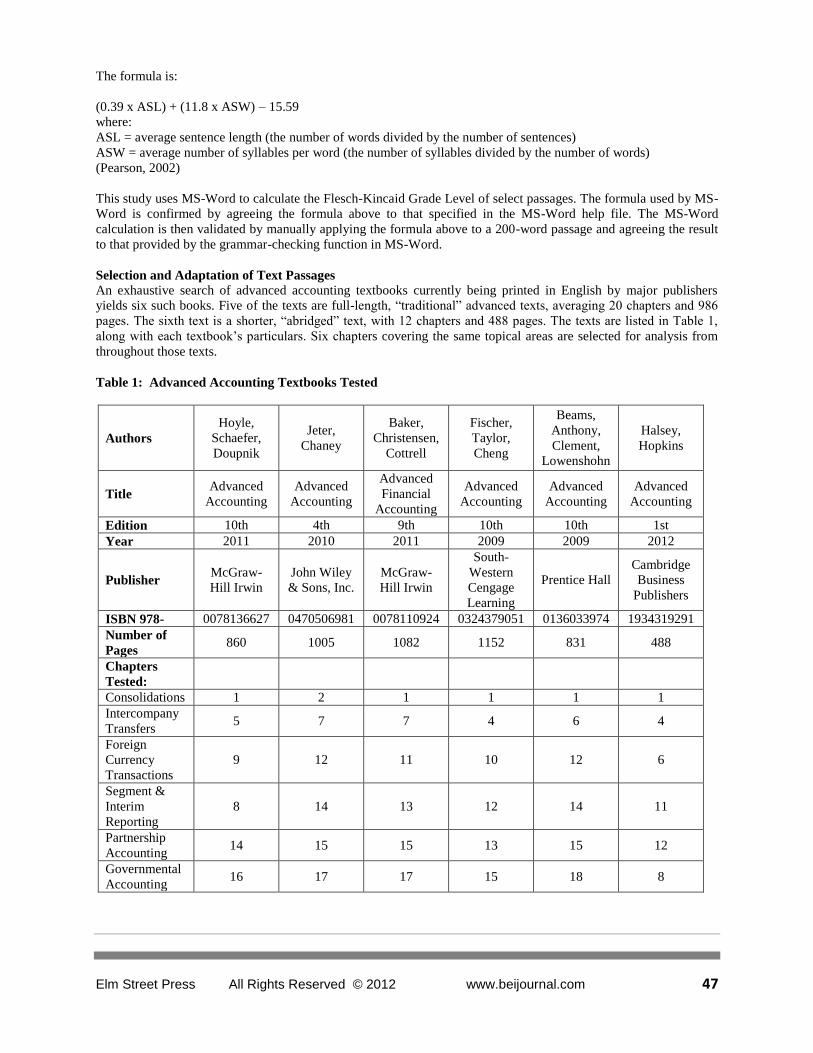
Elm Street Press All Rights Reserved © 2012 www.beijournal.com 47
The formula is:
(0.39 x ASL) + (11.8 x ASW) – 15.59
where:
ASL = average sentence length (the number of words divided by the number of sentences)
ASW = average number of syllables per word (the number of syllables divided by the number of words)
(Pearson, 2002)
This study uses MS-Word to calculate the Flesch-Kincaid Grade Level of select passages. The formula used by MS-
Word is confirmed by agreeing the formula above to that specified in the MS-Word help file. The MS-Word
calculation is then validated by manually applying the formula above to a 200-word passage and agreeing the result
to that provided by the grammar-checking function in MS-Word.
Selection and Adaptation of Text Passages
An exhaustive search of advanced accounting textbooks currently being printed in English by major publishers
yields six such books. Five of the texts are full-length, “traditional” advanced texts, averaging 20 chapters and 986
pages. The sixth text is a shorter, “abridged” text, with 12 chapters and 488 pages. The texts are listed in Table 1,
along with each textbook’s particulars. Six chapters covering the same topical areas are selected for analysis from
throughout those texts.
Table 1: Advanced Accounting Textbooks Tested
Authors
Hoyle,
Schaefer,
Doupnik
Jeter,
Chaney
Baker,
Christensen,
Cottrell
Fischer,
Taylor,
Cheng
Beams,
Anthony,
Clement,
Lowenshohn
Halsey,
Hopkins
Title Advanced
Accounting
Advanced
Accounting
Advanced
Financial
Accounting
Advanced
Accounting
Advanced
Accounting
Advanced
Accounting
Edition 10th 4th 9th 10th 10th 1st
Year 2011 2010 2011 2009 2009 2012
Publisher McGraw-
Hill Irwin
John Wiley
& Sons, Inc.
McGraw-
Hill Irwin
South-
Western
Cengage
Learning
Prentice Hall
Cambridge
Business
Publishers
ISBN 978- 0078136627 0470506981 0078110924 0324379051 0136033974 1934319291
Number of
Pages 860 1005 1082 1152 831 488
Chapters
Tested:
Consolidations 1 2 1 1 1 1
Intercompany
Transfers 5 7 7 4 6 4
Foreign
Currency
Transactions
9 12 11 10 12 6
Segment &
Interim
Reporting
8 14 13 12 14 11
Partnership
Accounting 14 15 15 13 15 12
Governmental
Accounting 16 17 17 15 18 8
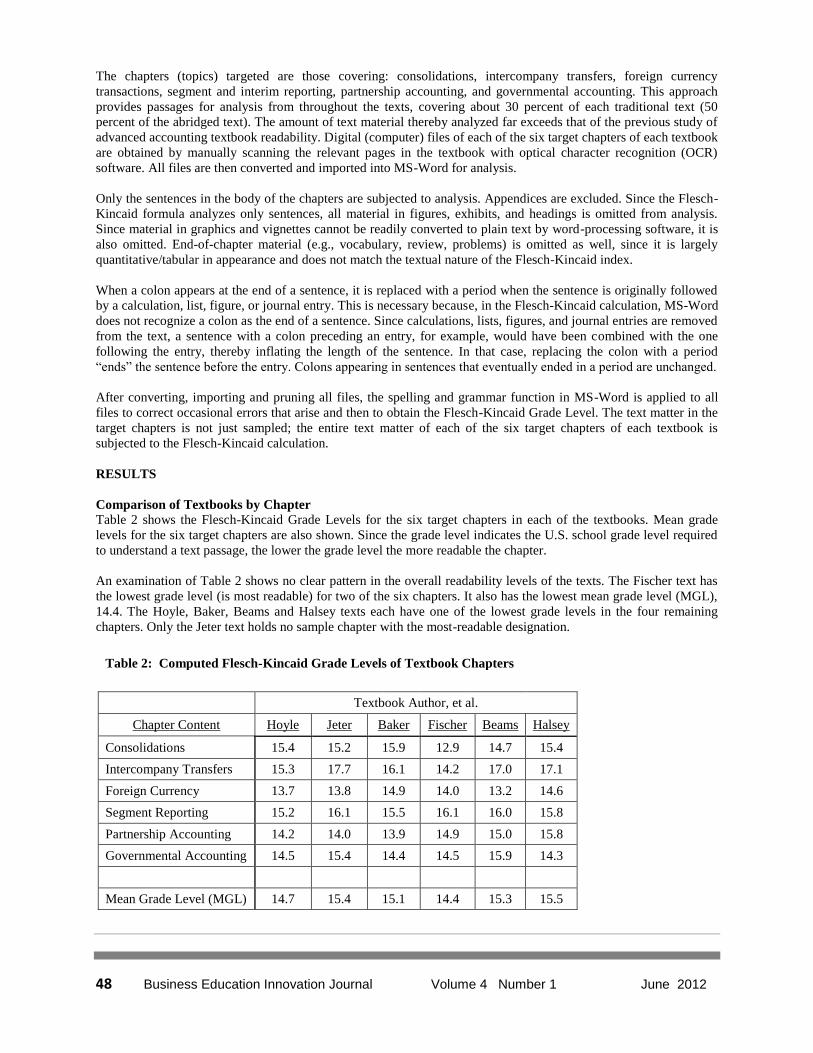
48 Business Education Innovation Journal Volume 4 Number 1 June 2012
The chapters (topics) targeted are those covering: consolidations, intercompany transfers, foreign currency
transactions, segment and interim reporting, partnership accounting, and governmental accounting. This approach
provides passages for analysis from throughout the texts, covering about 30 percent of each traditional text (50
percent of the abridged text). The amount of text material thereby analyzed far exceeds that of the previous study of
advanced accounting textbook readability. Digital (computer) files of each of the six target chapters of each textbook
are obtained by manually scanning the relevant pages in the textbook with optical character recognition (OCR)
software. All files are then converted and imported into MS-Word for analysis.
Only the sentences in the body of the chapters are subjected to analysis. Appendices are excluded. Since the Flesch-
Kincaid formula analyzes only sentences, all material in figures, exhibits, and headings is omitted from analysis.
Since material in graphics and vignettes cannot be readily converted to plain text by word-processing software, it is
also omitted. End-of-chapter material (e.g., vocabulary, review, problems) is omitted as well, since it is largely
quantitative/tabular in appearance and does not match the textual nature of the Flesch-Kincaid index.
When a colon appears at the end of a sentence, it is replaced with a period when the sentence is originally followed
by a calculation, list, figure, or journal entry. This is necessary because, in the Flesch-Kincaid calculation, MS-Word
does not recognize a colon as the end of a sentence. Since calculations, lists, figures, and journal entries are removed
from the text, a sentence with a colon preceding an entry, for example, would have been combined with the one
following the entry, thereby inflating the length of the sentence. In that case, replacing the colon with a period
“ends” the sentence before the entry. Colons appearing in sentences that eventually ended in a period are unchanged.
After converting, importing and pruning all files, the spelling and grammar function in MS-Word is applied to all
files to correct occasional errors that arise and then to obtain the Flesch-Kincaid Grade Level. The text matter in the
target chapters is not just sampled; the entire text matter of each of the six target chapters of each textbook is
subjected to the Flesch-Kincaid calculation.
RESULTS
Comparison of Textbooks by Chapter
Table 2 shows the Flesch-Kincaid Grade Levels for the six target chapters in each of the textbooks. Mean grade
levels for the six target chapters are also shown. Since the grade level indicates the U.S. school grade level required
to understand a text passage, the lower the grade level the more readable the chapter.
An examination of Table 2 shows no clear pattern in the overall readability levels of the texts. The Fischer text has
the lowest grade level (is most readable) for two of the six chapters. It also has the lowest mean grade level (MGL),
14.4. The Hoyle, Baker, Beams and Halsey texts each have one of the lowest grade levels in the four remaining
chapters. Only the Jeter text holds no sample chapter with the most-readable designation.
Table 2: Computed Flesch-Kincaid Grade Levels of Textbook Chapters
Textbook Author, et al.
Chapter Content Hoyle Jeter Baker Fischer Beams Halsey
Consolidations 15.4 15.2 15.9 12.9 14.7 15.4
Intercompany Transfers 15.3 17.7 16.1 14.2 17.0 17.1
Foreign Currency 13.7 13.8 14.9 14.0 13.2 14.6
Segment Reporting 15.2 16.1 15.5 16.1 16.0 15.8
Partnership Accounting 14.2 14.0 13.9 14.9 15.0 15.8
Governmental Accounting 14.5 15.4 14.4 14.5 15.9 14.3
Mean Grade Level (MGL) 14.7 15.4 15.1 14.4 15.3 15.5

Elm Street Press All Rights Reserved © 2012 www.beijournal.com 49
The Halsey text has the highest grade level (is least readable) for only one of its chapters; however, it has the highest
MGL at 15.5. The Jeter, Baker, Fischer and Beams texts each have either one or two of the highest grade levels in
the five remaining chapters. The Jeter text has the least readable of all sample chapters from all the texts, at 17.7.
Jeter is tied with Fischer for the highest grade level in segment and interim reporting at 16.1. Only the Hoyle text has
no sample chapter with the least-readable designation.
Overall Comparison of Textbooks
While some texts are more readable than others for select chapters, no one text is more readable (nor less readable)
than the other texts for all six chapters. In addition many of the grade levels for each chapter, while different
between texts, are very close to each other. Clearly, statistical tests are required to determine if significant
differences exist between the texts overall (i.e., mean grade levels).
While the entire text of each target chapter is analyzed, those results constitute sample passages relative to the text
overall. Therefore, t-tests are performed to determine whether significant differences exist between the textbooks
overall. Independent-samples t-tests are performed on the sample means, without assuming equality of variances.
Table 3 shows the p-values of differences between the grade level means of each textbook.
Table 3: P-Values of Differences Between Mean Grade Levels (MGLs)
Textbook Author,
et al. (MGL)
Hoyle (14.7)
Jeter (15.4) .351
Baker (15.1) .399 .725
Fischer (14.4) .597 .232 .250
Beams (15.3) .365 .935 .782 .238
Halsey (15.5) .149 .856 .495 .103 .773
Hoyle
(14.7)
Jeter
(15.4)
Baker
(15.1)
Fischer
(14.4)
Beams
(15.3)
Halsey
(15.5)
Textbook Author, et al. (MGL)
Note: No statistically significant differences at the .01, .05, or .10 levels.
No significant differences exist between the mean grade levels of the texts at the .01, .05, or .10 levels. These results
are inconsistent with the Razek, et al. (1982) study, which found significant differences between many of its texts.
The results of this study provide a necessary update to the literature in this area and can provide faculty, authors and
publishers with a baseline from which to continuously improve their choices and offerings.
CONCLUSIONS
If faculty place substantial emphasis on readability in selecting an advanced accounting textbook, they should
strongly consider the results of this study. In terms of overall readability, there is no compelling evidence to choose
any one of the texts over any other. Faculty might therefore base their text adoption decision entirely on other
factors, such as a text’s pedagogical approach, coverage of material, exhibits, and supplements. However, faculty
may want to consider the variation in the indexes among the individual content areas when choosing a text. That is,
they may wish to base their choice on the relative readability of the content areas that they find to be particularly
challenging for their students. Textbook authors should also examine these variations in an effort to synchronize
their individual writing styles and continuously improve the cohesiveness of the text.
Editors of advanced accounting texts can also use these findings. There is more to comprehensibility of a subject
than the readability of text matter. The diagrams, charts, demonstrations, calculations, and figures included in
textbooks are intended to aid in the student’s comprehension of the subject matter. Nonetheless, long, complicated

50 Business Education Innovation Journal Volume 4 Number 1 June 2012
sentences, while sometimes necessary, may hinder a student’s comprehension when used extensively. Textbook
editors may use these findings to set their expectations of authors of future advanced accounting textbooks.
LIMITATIONS
One limitation in this study concerns readability formulas in general. They assume that the lower the readability
level the better; but an unrealistically low readability level may lead to lower transferability of the content. In
addition, readability formulas predict readability; they do not measure it. More costly and time-consuming
techniques such as the Cloze Procedure are necessary to actually measure readability. While there have been many
critics that questioned the validity and value of readability formulas, there is ample research to suggest that
formulas, despite their faults, can predict whether one piece of text will be easier to read than another (Pearson,
2002).
Secondly, the results of this study should not be the sole basis for judging the appropriateness of a particular
advanced accounting textbook. Only the main body of each target chapter was analyzed in this study. The
calculations, vignettes, journal entries, charts, exhibits, graphics, figures, and end-of-chapter material are excluded
from analysis. Ancillaries such as instructor and student supplements are also not considered. It is likely that faculty
will subjectively evaluate the effectiveness of this material separately from the main body of the textbook.
Finally, as Smith and DeRidder (1997) indicated, business faculty, when making a textbook selection, attach the
most significance to comprehensibility to students, timeliness of text material, compatibility between text material
and homework problems, and exposition quality of text, respectively. The first of those criteria, comprehensibility,
is addressed (at least in part) by this study. However, one of the underlying assumptions of this study may well be its
greatest weakness; that is, we assume that students rely heavily on the textbook as a major source of information for
a course (Razek, et al., 1982), and therefore, read it in order to comprehend the material better. Future studies might
include primary research on students’ perceived importance of the text relative to other course tools in the learning
process. Students’ motivations to read the text should be investigated, and in a manner similar to the studies
conducted by Phillips & Phillips (2007) and Maksy & Zheng (2010), the motivating factors associated with both
reading and utilization of alternate learning tools should be studied. In addition, a comparison of texts in terms of the
type and amount of ancillary materials would broaden the resources available to faculty when facing the complex
decision of adopting a textbook.
REFERENCES
Adelberg, A.H., & Razek, J.R. (1984). The Cloze Procedure: A Methodology for Determining the Understandability of Accounting Textbooks.
The Accounting Review, V. 59, No. 1, pp 109-121. Chiang, W., Englebrecht, T.D., Phillips, Jr., T.J., & Wang, Y. (2008). Readability of Financial Accounting Principles Textbooks. The Accounting
Educators’ Journal, V. 18, pp 47-80.
Davidson, R.A. (2005). Analysis of the Complexity of Writing Used in Accounting Textbooks Over the Past 100 Years. Accounting Education: An International Journal, V. 14, No. 1, pp 53-74.
Flory, S.M., Phillips Jr., T.J., & Tassin, M.F. (1992). Measuring Readability: a Comparison of Accounting Textbooks. Journal of Accounting
Education, V. 10, pp 151-161. Maksy, M., & Zheng, L. (2010). Factors Associated with Student Performance in Advanced Accounting and Contemporary Financial Accounting
Issues: An Empirical Study in a Commuter University. Journal of Accounting, Ethics & Public Policy, V. 11, No. 3, pp 317-339.
McLaughlin, G.H. (1969). SMOG Grading – A New Readability Formula. Journal of Reading, V. 22, pp 639-646. Pearson, P.D. (2002). Handbook of Reading Research. Mahwah, New Jersey: Lawrence Erlbaum Associates.
Phillips, B.J., & Phillips, F. (2007). Sink or Skim: Textbook Reading Behaviors of Introductory Accounting Students. Issues in Accounting
Education, V. 22, No. 1, pp 21-44. Plucinski, K.J., Olsavsky, J., & Hall, L. (2009). Readability of Introductory Financial and Managerial Accounting Textbooks. Academy of
Educational Leadership Journal, V. 13, No. 1, pp 119-127.
Plucinski, K.J. (2010). Readability of Intermediate Accounting Textbooks. Academy of Educational Leadership Journal, V. 14, No. 2, pp 49-57.
Plucinski, K.J. (2011). Readability of Cost Accounting Textbooks. Business Education Innovation Journal, V. 3, No. 1, pp 15-20.
Razek, J.R., Hosch, G.A., & Pearl, D. (1982). Readability of Accounting Textbooks. Journal of Business Education, October, pp 23-26.
Smith, K.J., & DeRidder, J.J. (1997). The Selection Process for Accounting Textbooks: General Criteria and Publisher Incentives – A Survey. Issues in Accounting Education, V. 12, No. 2, pp 367-384.
Spinks, N., & Wells, B. (1993). Readability: A Textbook Selection Criterion. Journal of Education for Business, V. 69, No. 2, pp 83-88.
Stockmeyer, N.O. (2009). Using Microsoft Word’s Readability Program. Michigan Bar Journal, January, pp 46-47. Sullivan, M.C., & Benke, Jr., R.L. (1997). Comparing Introductory Financial Accounting Textbooks. Journal of Accounting Education, V. 15,
No. 2, pp 181-220.
Traugh, H.M., Powers, O.S., & Adedokun, A.J. (1987). Readability of Accounting Principles Texts. Journal of Education for Business, V. 63, No. 1, pp 159-162.

Elm Street Press All Rights Reserved © 2012 www.beijournal.com 51
Incorporating Sustainability into the Business Curricula:
Ecological Footprint Analysis
Wendy B. Wilhelm, Western Washington University, Washington, U.S.
ABSTRACT
This study describes an ecological footprint analysis (EFA) project designed to help business students understand
the significant environmental and social impacts of their lifestyles, and to encourage them to reduce these impacts
over the course of the quarter through changes in consumption practices. Employing assessment methods developed
specifically to measure the effectiveness of the project given its objectives, data were collected over a three year
period from 225 undergraduate marketing majors enrolled in a 400-level sustainable marketing elective. Findings
indicate that students willingly make significant reductions to their ecological footprint during the course and that
most commit to continuing their reduction efforts over the long term. The results of this study demonstrate that an
EFA exercise such as this, appropriate for use in any business course, makes students aware of the connection
between business strategies and sustainable consumption and can effect significant changes in pro-environmental
values and behavior over a short time period.
Keywords: sustainability, ecological footprint, business education, blogging
INTRODUCTION
While firms have been moving aggressively to adopt sustainable business practices (e.g., Esty and Winston, 2006;
Lovins and Cohen, 2011; Senge, 2008), business coursework has been slow to follow suit (Beyond Grey Pinstripes,
2011; Wilhelm, 2009). Attention to sustainability 2 issues in business curricula is limited, and many educators are
not aware of the fact that in 2005 the United Nations Environment Program (UNEP) called for a Decade of
Education for Sustainable Development (2005-2014; UNESCO, 2004). With this impetus, Deans from business
schools across the globe have joined with AACSB and the United Nations Global Compact, a network of over 375
business associations devoted to pursuing sustainable practices in their organizations, to develop Principles for
Responsible Business and Principles for Responsible Management Education (UN Global Compact, 2008a, 2008b).
These agreements provide a framework for integrating sustainability education across all business curricula,
including Principles such as: “we will develop the capabilities of students to be future generators of sustainable
value for business and society at large and to work for an inclusive and sustainable global economy” (Principle 1;
http://www.unpreme.org ).
This paper describes one project assigned to undergraduate marketing students in a 400-level Sustainable Marketing
elective. The objective of the ecological footprint analysis (EFA) assignment is to develop the above-mentioned
capabilities by demonstrating to students that their lifestyles have significant environmental and social impacts, and
that they can reduce these impacts over the course of the quarter through changes in consumption practices. Our
business students cannot be change agents, i.e., leaders in promoting sustainable business practices and sustainable
consumption, unless they first believe that change is possible. Equally important, this project introduces
sustainability metrics, helping students to understand how firms and individuals can measure and reduce their
environmental impact. This knowledge will allow students to be advocates for such metrics within their place of
employment and among their colleagues and friends.
The next section of the paper describes the project in detail, so that any who wish to incorporate this EFA
assignment into their business courses may do so. This is followed by a discussion of the assessment methods used
1 Sustainability can be defined as meeting the needs of the present without compromising the ability of future
generations to meet their needs; ensuring the long-term viability and well-being of our ecosystem, community and
society. This requires a focus on the “triple bottom line” of (1) environmental stewardship, (2) social equity,
community health and well-being, and (3) economic viability/continuity (Agenda 21, 1993; Blackburn, 2007;
Elkington, 1998).

52 Business Education Innovation Journal Volume 4 Number 1 June 2012
to determine whether the project objectives are being achieved, and an analysis of the findings based on these
assessment measures. The final section of the paper considers the challenges and concerns associated with
implementing and assessing the effectiveness of the EFA exercise and why it is of value to business educators.
ECOLOGICAL FOOTPRINT ANALYSIS
Definition of the Ecological Footprint Metric
Ecological footprint analysis (EFA) allows an individual to evaluate the environmental impact of his/her
consumption behavior by calculating the amount of earth’s resources required to support a particular lifestyle
(Wackernagel and Rees, 1996). Most EFA operationalize environmental impact by measuring how many tons of
carbon dioxide an individual produces each year, i.e., his/her “carbon footprint.” The carbon footprint is calculated
to be 54% of humanity’s overall ecological footprint and its most rapidly-growing component; in fact, humanity’s
carbon footprint now exceeds global bio-capacity by more than 20% (www.footprintnetwork.org ). EFA translates
the amount of carbon dioxide produced into the amount of productive land and sea area required to sequester carbon
dioxide emissions and accommodate waste. Most ecological footprint calculators assess the total amount of land
required for the consumption categories of food, housing, transport, consumer goods, and services (e.g., health care,
infrastructure).
Selection of Footprint Calculators
There are many WEB-based footprint calculators, but two were selected for the present project: (1)
www.footprintnetwork.org/en/index.php/GFN/page/personal_footprint/, developed by the Global Footprint
Network, and (2) www.StepGreen.org , developed by researchers at Cornell, Carnegie-Mellon and MIT (Mankoff
et al., 2010). Both calculators were selected based on research in environmental psychology and social marketing
regarding the most effective means of persuading individuals to change their environmental behavior (e.g.,
Abrahamse et al., 2005; Andreason, 2005; McCalley and Midden, 2002; Stern, 2000). Calculators that can provide
frequent feedback, allow for footprint sharing and public commitment, include visualization tools, and provide
information about the cost savings associated with footprint reduction actions – these are some of the important
characteristics of a successful pro-environmental behavior change intervention. Just providing information is not
enough – numerous studies have reported a weak relationship between environmental knowledge and pro-
environmental behavior (Abrahamse et al., 2005).
The Global Footprint Network Calculator calculates an individual’s footprint for each of the consumption
categories noted above based on specific input data that often requires research (e.g. electricity bill/month), and
visually depicts the number of planets that would be needed if everyone consumed at the same overall level for a
year (see Figure 1). Footprint re-calculations with new consumption data can be run anytime and results are stored
for easy access. Recommendations for reducing one’s footprint are also provided.
The StepGreen Calculator calculates the projected per-year carbon-dioxide savings and projected per-year dollar
savings for each action committed to (e.g., walk to school instead of drive, restrict meat consumption to one day a
week, switch to green power) (see Figure 2). Recurring actions require updates each week (for example, if you
commit to walking to school, each week you would report how many times you did so). Each time a member logs
onto the site, StepGreen reports total CO2 and dollar savings to date for all actions combined; students download the
StepGreen applet to their blog so that they can see each other’s savings for the week.

Elm Street Press All Rights Reserved © 2012 www.beijournal.com 53
Figure 1: Global Footprint Network: Example of Output from EF Calculations
Figure 2: StepGreen.org: Possible Footprint Reduction Actions
Description of EFA Project
The verbatim instructions given to students are provided in Figure 3. Prior to calculating their personal EF, students
read about what a carbon footprint is at: http://www.footprintnetwork.org/en/index.php/GFN/page/carbon_footprint/
(source: Global Footprint Network). Class discussion focuses on how calculation of their EF will enable students to
understand and reduce their own ecological impact while also improving their understanding of how footprint
metrics are used by corporations to develop and assess their sustainable business practices. We also watch A Story of

54 Business Education Innovation Journal Volume 4 Number 1 June 2012
Stuff (www.storyofstuff.org), a short film produced by Annie Leonard that examines the product life cycle and how
the production and consumption of consumer goods is impacting the environment and society. This film gets
students thinking about the products they buy and how they dispose of them. We then move on to a discussion of
specific firms and products and what constitutes a “sustainable product/firm;” I also encourage them to consult the
Better World Shopping Guide (www.betterworldshopper.com) prior to their next shopping trip (some students
subsequently decide to boycott certain products/firms as one of their footprint reduction actions). One two hour
class period typically suffices to cover this material.
Figure 3: EFA Project Instructions Given to Students
Ecological Footprint Calculation (beginning of quarter): Calculate your personal carbon footprint at
www.footprintnetwork.org/en/index.php/GFN/page/personal_footprint/ . Get as close an estimate of the correct
answer as you can. Which consumption category contributes the most to your Footprint? Next, visit
www.StepGreen.org and commit to at least 3 recurring actions and 2 non-recurring, one-time actions you will take
to reduce your carbon footprint during the quarter (you may create your own actions). Download the StepGreen
applet to your blog so that all can view your commitments and your weekly report on your progress. Finally, post
the visual print-out of your EF calculations from the Footprint Network, your reduction plans from StepGreen.org,
and a short reflection on them to your blog.Progress vis a vis Reduction Commitments: Each student will keep a
weekly blog. Use the blog to record progress toward your goals. Think of it as a diary – how difficult is it to stick
to your commitments? What are some of the challenges? Students will give periodic updates in class on how these
efforts are proceeding. Halfway through the quarter, you will re-evaluate your EF reduction actions/commitments
and either add new ones or determine to more religiously comply with your existing ones. I expect, at the very
least, to see one blog posting per week. Please use www.google.com/blogger to host your blog; blog analytics can
be accessed from the “stats” link. Ecological Footprint Re-calculation (end of quarter): You will re-calculate
your EF at the end of the quarter, posting on your blog your (1) re-calculated EF, (2) original EF, (3) total CO2 and
dollars saved from your commitments at StepGreen.org, and (4) a reflection on your efforts. You will also be asked
to share with the class if and how you plan to continue your commitments once the course is over.
Students are given a week to calculate their footprint, decide on their EF reduction goals and commit to them on
StepGreen.org, and set up their blog with the first posting. At the beginning of each class session 2-3 students are
asked to share information from their blogs with classmates; Blackboard’s blog function is used to enable easy
access. Student blogs and the sharing of student postings are an important part of this project because, as noted
above, public commitment to environmental goals improves goal achievement. As the quarter progresses, students
report on their progress (and receive helpful suggestions from classmates) and also share relevant videos, events,
articles, websites, etc. about businesses that are adopting sustainable business practices (this is another required
assignment). The last blog posting of the quarter must include the original and re-calculated footprints, the total CO2
and dollars saved from actions carried out at StepGreen.org, a discussion of successes/failures, and plans to honor
their commitments once the course is over. Students also hand in a hard copy of their blog analytics report for the
quarter.
ASSESSMENT METHODOLOGY AND SAMPLE
Consistent with the project objectives stated at the beginning of this paper, the project would be considered
effective if it (1) demonstrates to students that their lifestyles have significant environmental and social impacts, and
that they can reduce these impacts over the course of the quarter through changes in consumption behavior, (2) helps
students to understand how firms can measure and reduce their environmental impact using one particular
sustainability metric, and (3) persuades students that they can be effective change agents for sustainability within
their families, peer group and place of employment – “if I can reduce my EF, so can my roommate/employer.”
Key Measures of Effectiveness
A summary of the measures used to assess project effectiveness can be found in Table 1. Three of the key measures
are described below.

Elm Street Press All Rights Reserved © 2012 www.beijournal.com 55
Table 1: Measures Used to Assess Project Effectiveness
Objective
Measure
Awareness: lifestyle choices have significant
social/environmental impacts
Objective test
Calculation of personal EF
Reflective essay (blog)
Behavior Change: impact reduction is possible
w/moderate changes over time
Objective test
Reduction in size of EF
Reflective essay (blog)
Learning: meaning of ecological footprint, how it is
calculated, and possible reduction strategies
Objective test
Calculation of personal EF
Analysis of relative size of U.S. footprint versus
another country (blog)
Persuasion: “I can be an effective change agent for
sustainability”
Public sharing of EF reduction efforts (3 times)
Visiting classmates’ blogs and offering
encouragement and advice (blog analytics report)
Presentation on how they will continue lifestyle
changes after course is over (also on blog)
Course evaluation questions
Objective test of EF awareness and knowledge. A 100 point multiple choice test of basic ecological footprint
concepts is administered at the beginning and end of the course. Students are tested on EF concepts and metrics,
marketing strategies that can reduce the size of consumers’ footprint, the relationship between consumption and
environmental/social impacts, and the meaning of sustainable consumption. Demographic data are collected to
explore possible individual difference influences on awareness and knowledge levels. Students are also required to
use the Global Footprint calculator to compare the per person footprint of the U.S. with that of a second country of
their choice, an assignment that shows students how large our footprint is relative to other countries.
Reduction in EF size. A comparison of each student’s footprint size (number of planets needed to support his/her
lifestyle) before and after each commits to and carries out his/her footprint reduction actions is used to measure
behavior change. In addition to the quantitative measure of footprint change over time, student blogs are also
reviewed for evidence of a thoughtful, insightful self-examination of the successes and challenges associated with
reaching footprint reduction goals. It is important to assist each student in selecting specific, measurable actions
unique to that individual, actions that are somewhat ambitious and not too easily achieved so that each student ends
the quarter with a sense of accomplishment and a belief that he/she can effect change in the larger world. To further
strengthen this belief, each student makes a short presentation at the end of the course that includes steps he/she will
make to maintain the lifestyle changes implemented during the quarter (their Power Point slides are also posted to
their blog). The requirement that each student visit the blogs of at least two classmates to offer encouragement and
advice regarding their EF reduction efforts serves to reinforce the belief that they can use the knowledge gained in
the course to persuade others in their sphere of influence to adopt more sustainable practices.
Course evaluations. A third measure used to determine whether this project effectively changes behavior is a set of
two questions on a customized course evaluation instrument administered at the end of the quarter: (1) “How
successful were you in implementing your EF reduction commitments?” (0-100% scale), and (2) “How likely are
you to continue the lifestyle changes you made during the course?” (1-7, not at all likely-very likely). The
anonymity of the measure is helpful for determining if, in fact, students are making the lifestyle changes they have
committed to and how strong the commitment is to continue them.
Sample
The sample consisted of 225 undergraduate marketing students who were enrolled in a senior level elective on
sustainable marketing over a three year period at a medium sized public university on the west coast. The course is
taught two times a year, with 35-40 students per section. A profile of the sample can be found in Table 2. Ages

56 Business Education Innovation Journal Volume 4 Number 1 June 2012
ranged from 18-23 and respondents were split evenly between males and females. Most lived in urban areas within
200 miles of the university and came from Caucasian, middle class backgrounds. The sample is fairly representative
of marketing majors at this university.
Table 2: Sample Characteristics
Characteristic
Sample
(2008-2011; n= 225)
Marketing Majors at the
University (2009-2010)
Median Age (yrs.)
21.5 (range 18-23)
20
Gender
51% female
54% female
Year in School
30% Juniors; 70% Seniors
45% Juniors; 55% Seniors
Ethnicity
90% Caucasian
90% Caucasian
Average HH Income
$101,000
$98,000
RESULTS
The results for the three primary assessment tools used to determine whether the EFA exercise is meeting the stated
objectives are summarized in Table 3. As might be expected, scores on the first knowledge test were typically below
50% (most students have never heard of the term, ecological footprint). Test scores on the same test administered
ten weeks later, over the six sections assessed in this study, averaged 83%, representing a significant improvement
in awareness as measured by a paired t-test (t = 12.94, p < . 05). No significant differences in test scores as a
function of demographic variables were found.
Table 3: Assessment Results for Three Primary Measures (n= 225)
Measure
Pre-Post Results
Statistical Significance
Objective Test (multiple choice)
Pre: average score = 46/100 pts.
Post: average score = 83/100 pts.
Paired t-test: t = 12.94, p < .05
Reduction in Size of Ecological
Footprint (number of earths needed
to support lifestyle)
Pre: average of 4.7 earths
Post: average of 3.1 earths
Paired t-test: t= 8.21, p < .05
Course Evaluation questions:
(1) How successful were you in
implementing your EF reduction
commitments? (0-100% scale)
(2) How likely are you to continue
the lifestyle changes you made
during the course? (1-7, not at all
likely-very likely).
Overall 73% success rate
(range = 50% - 95%)
Overall mean = 6.1
No statistically significant
demographic differences
Women significantly more likely
than men to continue their efforts
(women= 6.5, men = 5.2, t=7.63, p
< .05)
The average EF size calculated during the first week of class was 4.7 earths. Over the course of the ten week quarter,
students made significant reductions in their footprints, to an average of 3.1 earths, as measured by a paired t-test (t=
8.21, p < .05). Once again, demographic differences did not significantly influence footprint size. The few students
that reported no change in the size of their footprint were those who did not take this exercise seriously; they also
performed poorly on other assignments and exams. It should be noted that it is not possible for an individual living
Elm Street Press All Rights Reserved © 2012 www.beijournal.com 57
in the United States to reduce their footprint to one planet, because a person’s footprint also includes societal
impacts or “services,” such as government assistance, roads and infrastructure, public services, and the military of
the country they live in. All citizens of a country are allocated their share of these societal impacts. The footprint of
these societal impacts does not vary, and therefore in developed countries like the U.S. it is not possible to reduce
one’s personal footprint to below one planet. Once students understand the footprint methodology, they are less
discouraged about the fact that their sustained efforts typically reduce their footprint by “only” 1.6 earths.
Students reported that they were able to successfully carry out their reduction commitments (overall success rate of
73%) and that they would continue their EF reduction efforts (overall mean = 6.1). These commitments are
typically significant: buying only organic produce, unplugging all electronics after use/before leaving home, using
their own cloth bags when shopping, switching to all green electricity ($10 more/month), and/or walking to school
instead of driving. T-tests to determine whether there were any gender, year in school, ethnicity or age differences in
success rates or continued commitment levels revealed only one significant difference: women are more likely to
continue their commitments than men (mean for women = 6.5, mean for men = 5.2, p < .05). Follow up interviews
after the course was over indicated that female respondents are more concerned about ensuring the viability of our
planet’s ecosystem over the long term, for future generations (i.e., their children).
CONCLUSIONS
The findings indicate that the EFA project described here is an effective means of teaching students about the
concepts and metrics related to ecological footprint analysis, and persuading them to change their consumption
behaviors in a pro-environmental direction. Women, in particular, take the need to live in a more sustainable
manner to heart (see footnote 1). Several issues related to project implementation and outcomes assessment warrant
further discussion, however.
Challenges and Concerns
One component of the project that requires a significant amount of instructor time and effort is assisting students in
the identification of the 3+ actions they plan to take to reduce their footprint. As noted earlier, the goals must be
specific, measurable and realistic, but should also be somewhat challenging if students are to end the quarter with a
sense of success about what they have achieved. The definition of “challenging” varies depending on the individual.
For some, remembering to unplug all appliances before going to bed or leaving the house is difficult, while others
may already be in the habit of doing this to save electricity. While students report that they are able to successfully
meet 70% of their commitments, it’s possible that this success rate could be improved by a more careful selection of
actions/goals. This aspect of the project requires further development.
Another concern is the question of whether students are actually carrying out the EF reduction actions they commit
to at the beginning of the course. While students report that, for the most part, they were able to honor their
commitments, there is no good means of determining whether this is actually true since the data consist of self-
reported behaviors. It should be noted, however, that most students become excited about the idea of reducing their
footprint (“we should be learning about this stuff in elementary school!”) and roommates or other professors often
speak about the impact the project is having on student behavior. The development of longitudinal measures to
determine whether students do actually continue their efforts to reduce their footprint once the course is over is an
important next step. It’s vital to examine behavior change since knowledge alone is typically insufficient to effect
changes in pro-environmental behavior. Post-course behavioral data would still be based on self-reports, however,
since it is difficult to conceive of how actual behaviors could be observed. In-depth interviews with a small number
of individuals (perhaps in their homes) might improve the data quality somewhat.
Last, the considerable amount of grading involved can be challenging. Since most of the assignments are posted on
students’ blogs, grading requires a substantial amount of time reading and posting comments on them, a taxing
undertaking if one is accustomed to hard copy grading. Instructors may decide to include only one or two of the
assessment methods discussed here, especially if the course is a general business course rather than a sustainable
marketing elective.
Incorporating the EFA Project into Other Business Courses
Because this project focuses on how personal consumption impacts the environment/society and thus economic
performance, it is relevant to all business courses, particularly when one considers the role business plays in

58 Business Education Innovation Journal Volume 4 Number 1 June 2012
encouraging consumption (Peattie 2009; Sheth et al. 2011). The project has been successfully assigned in 400-level
and MBA-level elective courses on Sustainable Marketing, in undergraduate capstone marketing strategy courses,
and in 300-level Principles of Marketing courses. The relative weight given to the project, the amount of time spent
discussing EFA, and the particular methods of assessment vary depending on the subject and level of the course.
Contribution to Business Education
The results of this study are of value to business educators because they demonstrate that an EFA exercise such as
this can effect significant changes in pro-environmental values and behavior within a single ten week quarter. At a
time when many marketing educators are (or should be) striving to include sustainability concepts in their courses
(Bridges and Wilhelm, 2008; Wilhelm, 2009), this paper describes an experiential learning tool in sufficient detail to
enable ready adoption in any business course. Overall, the benefits of the project far outweigh the challenges noted
above. The enthusiasm with which students commit to reducing their footprint and the creative approaches they
take in doing so indicate that students who successfully complete an EFA project such as the one described here are
more likely to become sustainability advocates in their future places of employment and leaders in the global
movement toward a sustainable economy.
REFERENCES
Abrahamse, W., Steg, L., Vlek, C. and Rothengatter, T. (2005). A Review of Intervention Studies Aimed at Household
Energy Conservation. Journal of Environmental Psychology. V. 25 (September), pp. 273-291. Agenda 21: Earth Summit–The United Nations Programme of Action from Rio (1993). New York: United Nations.
Andreason, A. (2005). Social Marketing in the 21st Century. Beverly Hills: Sage Publications Inc. Beyond Grey Pinstripes (2011). Search of core and elective courses at
http://www.beyondgreypinstripes.org/search/search_coursework.cfm Accessed 5/20/2011.
Blackburn, W. (2007). The Sustainability Handbook: the Complete Management Guide to Achieving Social, Economic and Environmental Responsibility. Boston: Environmental Law Institute.
Bridges, C. and Wilhelm, W. (2008). Going Beyond Green: the ‘Why and How’ of Integrating Sustainability into the
Marketing Curriculum. Journal of Marketing Education. V. 30 (1), pp. 33-46. Elkington, J. (1998). Cannibals with Forks: the Triple Bottom Line of 21st Century Business. Gabriola Island BC: New
Society Publishers.
Esty, D. and Winston, A. (2006). Green to Gold. New Haven: Yale University Press. Lovins, L.H. and Cohen, B. (2011). Climate Capitalism. New York: Hill and Wang.
Mankoff, J. (2010). StepGreen.org: Increasing Energy Saving Behaviors via Social Networks. Proceedings of the
Fourth International AAAI Conference on Weblogs and Social Media. pp. 106-113, accessed at http://research.stepgreen.org/site/uploads/Footprints/Mankoff-ICWSM10.pdf
McCalley, L. and Midden, C. (2002). Energy Conservation Through Product-integrated Feedback: the Roles of Goal-
setting and Social Orientation. Journal of Economic Psychology. V. 23, pp. 589-603. Peattie, K. (2009). Guest Editorial: Perspectives on Sustainable Consumption. International Journal of Consumer
Studies. V. 33, pp. 107-112.
Senge, P., Smith, B., Kruschwitz, N., Laur, J. and Scheley, S. ( 2008). The Necessary Revolution. New York: Doubleday.
Sheth, J., Sethia, N. and Srinivas, S. (2011). Mindful Consumption: a Customer-centric Approach to Sustainability.
Journal of the Academy of Marketing Science. V. 39, pp. 21-39. Stern, P. (2000). Toward a coherent theory of environmentally significant behavior. Journal of Social Issues. V. 56, No. 3,
pp. 407–424.
UNESCO (2004). United Nations Decade of Education for Sustainable Development. Available at: http://portal.unesco.org/education/en/en/
United Nations Global Compact (2008a). Principles for Responsible Business. Available at:
http://www.unglobalcompact.org United Nations Global Compact (2008b). Principles for Responsible Management Education. Available at:
http://www.unprme.org
Wackernagel, M. and Rees, W. (1996). Our Sociological Footprint: Reducing Human Impact on the Earth. Gabriola Island BC: New Society Publishers.
Wilhelm, W. (2009). Marketing Education for Sustainability. Journal for Advancement of Marketing Education.
V. 13 (Winter), pp. 8-20.
Wilhelm, W., Day, R. and Olney, T. (1997). Commitment Approach to Motivating Community Recycling: New Zealand
Curbside Trial. The Journal of Consumer Affairs. V. 31. No. 1, pp. 27 – 52.
Wendy B. Wilhelm, Ph.D., is a professor of marketing at Western Washington University. Her pedagogical research
interests include developing curricula for sustainable business courses, and using choice-based conjoint analysis to
explore different aspects of teaching effectiveness.

Elm Street Press All Rights Reserved © 2012 www.beijournal.com 59
Effective Accounting Lectures in a Cohort Business Program
Michael S. Wilson, Metropolitan State University, Minnesota, USA
Tong Xiang, University of Indianapolis, Indiana, USA
ABSTRACT
Educators in Western universities face challenges in teaching international students in fast-growing cohort
programs. This descriptive paper identifies effective teaching strategies based on a survey of American and Chinese
students in undergraduate and graduate introductory accounting classes at an American university, and the personal
experiences of the authors. The strategies emphasize an educator orientation towards a difference model rather than
a deficit model when working with international students (Fox, 1994; Kennedy, 2002; Ward, 2001).
Keywords: teaching strategies, accounting classes, international students
INTRODUCTION
Higher education in Western universities has seen increasing numbers of more culturally and socially diverse
students than ever before due to supply and demand changes. On the supply side, more international students have
access to study abroad opportunities. In the past, government and scholarship providers selected the elite few to
study in Western universities. However, the current hurdles are limited to university entrance exam requirements,
and the desires and resources of students (Carroll and Ryan, 2005). On the demand side, recent changes in the
funding and expansion of Western higher education have increasingly encouraged institutions to look towards
overseas students both as a source of revenue and as a way of diversifying the university community (Humfrey,
1999). International students in Western universities have grown in numbers as well as the range of countries of
origin.
According to the Open Doors report published annually by the Institute of International Education, the number of
international students at colleges and universities in the USA increased by 3% to 691,000 during the 2009/10
academic year, which represents a record high number of international students in the United States. This year's
growth was primarily driven by a 30% increase in Chinese student enrollment in the United States to a total of
nearly 130,000 students, or more than 18% of the total international student population, making People’s Republic
of China the number one sending country. Chinese students enroll in American universities as individual
international students or through partnerships between American and Chinese universities in the form of cohort
programs.
Often cohort programs integrate American and Chinese students into the same classroom which presents challenges
for instructors. The challenges include separate ethnic learning groups, limited classroom interactions between
instructors and Chinese students, and between Chinese students and American students; English language barriers
and different cultural and academic environment facing Chinese students. Many instructors faced with unfamiliar
student characteristics, are unsure how to respond while meeting perceived expectations for new program
development and income generation from their institutions (Carroll and Ryan, 2005).
The purpose of this paper is to identify effective teaching strategies in introductory accounting classes for Chinese
and American students. These strategies are based on two factors. A convenience survey of students enrolled in the
authors’ accounting classes. These classes included managerial accounting, intermediate accounting, and
introductory MBA accounting class at an American university, and the experiences of the authors overseeing and
teaching a cohort business program at the university.
RESEARCH QUESTION
This descriptive study sought to answer the question, what are American and Chinese students’ perceptions of good
accounting teaching in introductory accounting classes? The purpose is to stimulate discussions on effective
teaching in cohort programs through sharing the experiences of the authors and students with American and Chinese
cultural backgrounds. An interest in developing an emic understanding was prevalent throughout the study as
authors often discussed how to create an optimal learning environment for students. Pike and McKinney (1996)
used the term “emic” to describe how researchers often only see the particles and not the waves of culture that can
60 Business Education Innovation Journal Volume 4 Number 1 June 2012
lead to misunderstanding in cross-cultural studies. The authors’ discussions were also influenced by their outsider
status that helped to identify differences unrecognized by researchers who belong only to the culture under
investigation (Watkins and Biggs, 2001).
However, the task of making generalizable conclusions about effective teaching strategies is limited because we did
not engage in an experimental study, nor did we attempt to draw correlation between effective teaching strategies
and academic performance. In addition, the primary learning outcome of these accounting classes was the
application of materials and not a higher level objective, such as evaluation, that is often cited from Bloom’s 1956
Taxonomy.
LITERATURE REVIEW
Several researchers have noted differences in Western and Chinese education. Western education is generally
described as Socratic where knowledge is generated through questioning and the evaluation of beliefs. Critical
thinking and problem solving skills are considered important (Greenholz, 2003; Pratt, 1992). Many Western
educators have adopted a constructivist view of learning that places the individual at the center of the learning
process where learning is not passively received through others sharing information but actively constructed by the
learner through mental schemas that are used to organize knowledge, and sum up what is already known from
previous experiences, interactions, and beliefs. In order for learning to occur new information has to “hook” into
existing knowledge. The role of educators is to create the context for learners to connect new information to
existing knowledge, thereby developing further understanding (Carroll & Ryan, 2005). Biggs (1996) described this
type of learning as deep learning. On the contrary, contemporary Chinese education is often characterized by
memorization, rote learning, and repetition and influenced by a dialectic or traditional model of learning which tends
to be linear, competition-oriented, and authority-centered (Hammond and Gao, 2002), Biggs (1996) described this
method as surface learning.
The role of culture plays a significant role in perceptions. Researchers examining the influence of societal culture
on learning approaches have found Asian students may be reluctant to take part actively in class due to their
shyness, lack of confidence in language skills, and uncertainty about social conventions for classroom participation
(James et al., 2002). Many Chinese students, including those with a good command of the English language,
encounter significant difficulties in Western universities due to lack of discipline-specific vocabularies, different
social and cultural customs, different teaching and learning methods. Many Western educators fail to recognize the
premise that Chinese students arrived with the skills and experiences that have proven to be valuable for their
achievement in the past but may not be fully useful in their new setting (Carroll and Ryan, 2005). A deficit view of
Chinese students is often used by Western educators who see Chinese students as “lacking in independent, critical
thinking skills; as plagiarizers or rote learners, speaking broken English and having awkward ways of participating
in class.” Many of the earlier studies have focused on the need for Chinese students to adapt as quickly as possible
to Western traditions and become “ideal students” (Carroll and Ryan, 2005). Although increasingly challenged in
recent years, there is still a common perception among Western educators of the stereotypical Chinese rote learners.
However this perception appears to be incompatible with the paradox that Chinese learners nevertheless often
perform better in comparison with their Western counterparts (Cooper, 2004).
A widely-used instrument to measure approaches to learning is the Study Process Questionnaire (SPQ) (Biggs,
1987) which contains main scales for three learning approaches: deep, surface and achieving. The concept of the
surface approach is often related to rote learning, while the deep approach is equated with understanding (Cooper,
2004). However, subsequent researches in this area argue that these categories are oversimplified. For example, the
surface learning of memorization can be the first step towards a deep learning outcome. This may be a reason why
students from a Confucian heritage tend to adopt a surface approach to learning but still outperform fellow students
from other cultures (Abeysekera, 2008). Furthermore, Chinese teaching methods have indeed been recognized as
promoting deep learning. Various studies have used SPQ to explain the apparent dichotomy between perceived rote
learning and high achievement of Asian students. Researchers have documented that memorization occurs in
conjunction with attempts to reach understanding, suggesting that the assumption that Asian students were rote-
learning could well be false (Kember, 2000).

Elm Street Press All Rights Reserved © 2012 www.beijournal.com 61
RESEARCH DESIGN
This study gathered data by a specifically designed questionnaire distributed to students in the authors’ accounting
classes during a traditional lecture one week prior to the final exams. Students were asked to evaluate the
effectiveness of various teaching strategies that were used by the authors over the course of semester. The students
were either American students or Chinese students who were enrolled in a cohort business program between the
American university and its partner institution in China and who were completing residency requirement at the
American university.
The 58 respondents were students representing a convenience sample from the authors’ managerial accounting (two
sections), intermediate accounting, and introductory MBA accounting classes. The MBA class was included to have
a statistically significant sample size. The questionnaire was pilot-tested for its clarity to the satisfaction of two
additional faculty members. Prior to administering the questionnaire, students were presented with an overview of
the teaching methods used during the semester.
The goal of the survey was to identify whether there were differences between the two groups’ perceptions of
effective teaching in accounting based on teaching methods employed during the semester. The questionnaire asked
students to rank pedagogical practices used in the class, types of exams, and publishers’ support material on a five-
point Lickert scale as being not effective (1) to very effective (5). Students were asked to describe whether English
was a foreign language, and this provided the basis for an analysis of the two groups.
One factor that influenced the results was the way in which student learning was assessed. Each class was given
three exams over the course of the semester. These exams were primarily application questions that required
students to apply an understanding of the materials that were covered in classes through a review of exercises and
problems. If students performed well on applied accounting problems, it is logical that they rated the teaching
methods used in the class higher. If students did not perform well on the exams, the opposite would likely occur.
The statistical results were analyzed through the lens of the authors’ experiences of teaching in a cohort program.
Students’ perceptions of effective strategies may be influenced and shaped by different factors. However, in order
to make sense of students’ perceptions, it is necessary to identify the factors that students consider effective.
The following teaching strategies were evaluated in the questionnaire.
1. Required readings of the text before lectures
2. Required readings of the text after lectures
3. Instructor describing real life examples to explain concepts
4. Instructor engaging students with thought-provoking questions
5. Instructor providing publisher’s study guide
6. Instructor presenting publisher’s PowerPoint slides during lectures
7. Instructor illustrating solution to key problems step-by-step
8. Instructor posting solution to key problems on-line
9. Instructor preparing practice exams
10. Instructor assigning group projects
11. Instructor assigning individual homework
12. Multiple-choice questions on exams
13. Essay questions on exams
DATA AND ANALYSIS
Table 1 summarizes the student data from the three accounting classes.
The results were evaluated based on two sample t-tests based on a post hoc analysis with the teaching methods as
factors of interest (dependent variables). The independent variable was the nationality of the students. Using
inferential statistics based on a p-value of .05, the study supported the existence of students’ perceptions of effective
teaching as reported in Table 2. The authors arbitrarily considered a teaching strategy to be effective when the
average score was 4.0 or above.
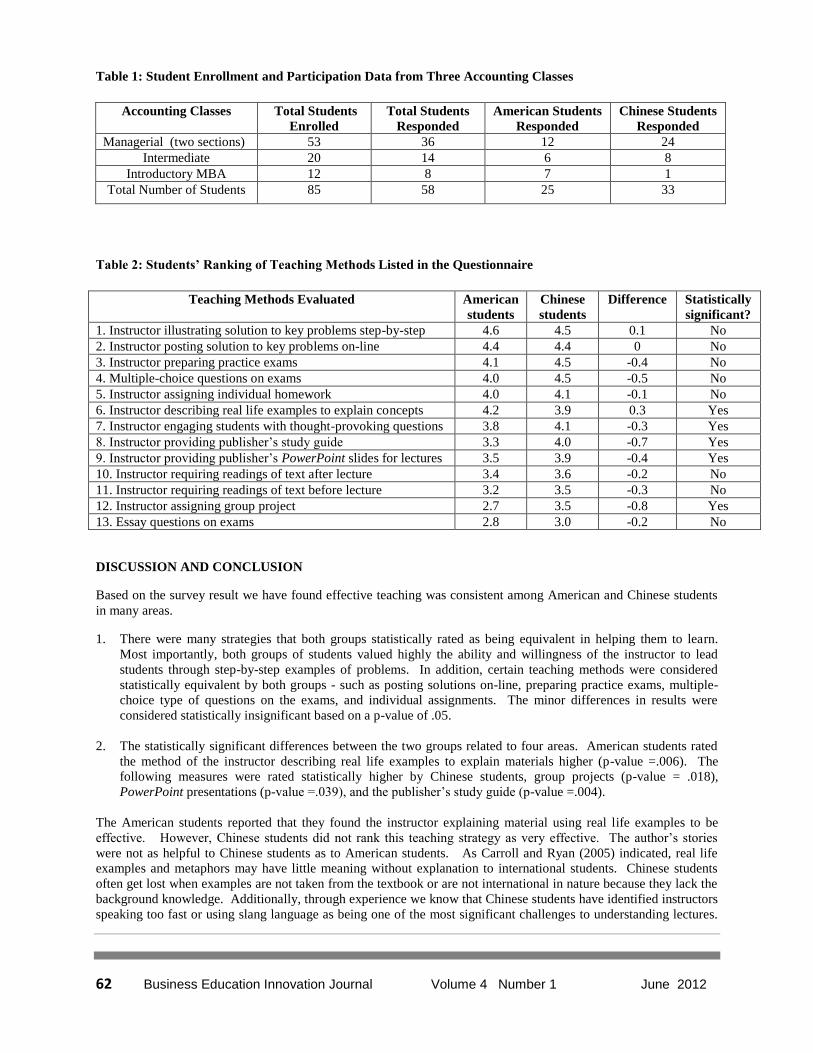
62 Business Education Innovation Journal Volume 4 Number 1 June 2012
Table 1: Student Enrollment and Participation Data from Three Accounting Classes
Accounting Classes Total Students
Enrolled
Total Students
Responded
American Students
Responded
Chinese Students
Responded
Managerial (two sections) 53 36 12 24
Intermediate 20 14 6 8
Introductory MBA 12 8 7 1
Total Number of Students 85 58 25 33
Table 2: Students’ Ranking of Teaching Methods Listed in the Questionnaire
Teaching Methods Evaluated American
students
Chinese
students
Difference Statistically
significant?
1. Instructor illustrating solution to key problems step-by-step 4.6 4.5 0.1 No
2. Instructor posting solution to key problems on-line 4.4 4.4 0 No
3. Instructor preparing practice exams 4.1 4.5 -0.4 No
4. Multiple-choice questions on exams 4.0 4.5 -0.5 No
5. Instructor assigning individual homework 4.0 4.1 -0.1 No
6. Instructor describing real life examples to explain concepts 4.2 3.9 0.3 Yes
7. Instructor engaging students with thought-provoking questions 3.8 4.1 -0.3 Yes
8. Instructor providing publisher’s study guide 3.3 4.0 -0.7 Yes
9. Instructor providing publisher’s PowerPoint slides for lectures 3.5 3.9 -0.4 Yes
10. Instructor requiring readings of text after lecture 3.4 3.6 -0.2 No
11. Instructor requiring readings of text before lecture 3.2 3.5 -0.3 No
12. Instructor assigning group project 2.7 3.5 -0.8 Yes
13. Essay questions on exams 2.8 3.0 -0.2 No
DISCUSSION AND CONCLUSION
Based on the survey result we have found effective teaching was consistent among American and Chinese students
in many areas.
1. There were many strategies that both groups statistically rated as being equivalent in helping them to learn.
Most importantly, both groups of students valued highly the ability and willingness of the instructor to lead
students through step-by-step examples of problems. In addition, certain teaching methods were considered
statistically equivalent by both groups - such as posting solutions on-line, preparing practice exams, multiple-
choice type of questions on the exams, and individual assignments. The minor differences in results were
considered statistically insignificant based on a p-value of .05.
2. The statistically significant differences between the two groups related to four areas. American students rated
the method of the instructor describing real life examples to explain materials higher (p-value =.006). The
following measures were rated statistically higher by Chinese students, group projects (p-value = .018),
PowerPoint presentations (p-value =.039), and the publisher’s study guide (p-value =.004).
The American students reported that they found the instructor explaining material using real life examples to be
effective. However, Chinese students did not rank this teaching strategy as very effective. The author’s stories
were not as helpful to Chinese students as to American students. As Carroll and Ryan (2005) indicated, real life
examples and metaphors may have little meaning without explanation to international students. Chinese students
often get lost when examples are not taken from the textbook or are not international in nature because they lack the
background knowledge. Additionally, through experience we know that Chinese students have identified instructors
speaking too fast or using slang language as being one of the most significant challenges to understanding lectures.
Elm Street Press All Rights Reserved © 2012 www.beijournal.com 63
This study indicated that Chinese students ranked PowerPoint slides and study guide as more effective than
American students. Instructors should recognize that most Chinese students prefer a well-structured academic
environment where learning objectives and instructors’ expectations are clearly defined, and visual support for
lectures is utilized. Chinese students appreciate the efforts the instructor has made in posting the text-book
publisher’s PowerPoint handout and study guide online in advance, sticking to lecture schedule outlined in course
syllabus, providing a framework for each lecture, writing down important terminologies and illustrating calculations
on the board, summarizing key concepts at the end of each lecture, and trying to speak clearly and use standard
English. We also find that referring to global and multi-cultural examples engaged and encouraged Chinese students
in class participation.
We also recognize that learning is enhanced by interactions between instructors and learners, and between learners
and learners - especially for Chinese students. Chinese students ranked group project much higher. We believe
group work provides Chinese students with the opportunities to discuss assignment in a more comfortable language
and setting. As Carroll and Ryan (2005) commented, international students may need the safety of working within
familiar behaviors and rules. This is reflected on our survey result, and it is also consistent with our observation that
generally Chinese students are hesitant to speak up in class but will ask many questions afterwards or during
instructors’ office hours. We recognized the potential benefit for students to work in cross-cultural groups.
However we also realize that the projects assigned in these accounting classes are discipline-specific and application
in nature, in which case self-selected groups work better to achieve learning outcome for most students.
The results of students’ performance in these accounting classes indicate that Chinese students outperformed
American students on application level tests. There are a number of reasons for this including the majority of the
Chinese students in the cohort program were stronger in quantitative subjects than American students and had more
pressures to perform well. However as stated previously this descriptive study did not attempt to draw correlations
between effective teaching methods and academic performance of the students.
ADDITIONAL CONSIDERATIONS
We found other helpful tips for cross-cultural classrooms from our literature review and our experiences in the
classroom. Instructors should recognize that reading in English is often challenging for non-native learners and
complicated by the amount of reading assigned. Many international students believe they are expected to read every
word of every chapter. Providing guideline on the relative importance of each chapter, adding a list of key questions
for students to think about with reading assignment, and modeling effective reading by going over several short
chapters and evaluating them through an instructor’s argument, opinion and supporting information (Carroll &
Ryan, 2005) are very helpful.
A unique contribution of this study to the existing literature, despite its limitations, is its emphasis for educators in
Western higher education to create a context of inclusion without a focus on remediation of perceived weaknesses of
international students. Chinese students have shown initiatives in trying to succeed in a foreign environment in a
foreign and inherently difficult language (Carroll and Ryan, 2005), and these efforts and attributes should be
recognized. To maximize international students’ learning, institutions and their teaching faculty in Western
universities should become more sensitive to international students’ learning style preferences, and difference that
may exist (Ramburuth and McCormick, 2001). A better understanding of international students, indentifying and
adopting more supportive and inclusive teaching methods can enhance the experiences for educators, international
students as well as domestic students in Western higher education institutions.
FURTHER RESEARCH OPPORTUNITIES/LIMITATIONS
This study targeted students taking introductory accounting classes where the focus of exams was on application
type questions. Students were graded on three exams that were derived from the text-book publisher’s test bank.
Exam questions were primarily focused on accounting application based on Bloom’s 1956 Taxonomy. However,
the Accounting Education Change Commission (1990) advocated changes in the basic accounting curriculum to
encourage students to “learn how to learn” and develop their “critical thinking skills”. Critical thinking is deemed
to occur when students are required to perform in the Analysis, Synthesis and Evaluation levels of Bloom’s
Taxonomy (Flinn and Crumbley, 2009). Consequently, the most effective teaching strategies may be considerably
different for more advanced accounting courses that require a higher level of critical thinking skills.

64 Business Education Innovation Journal Volume 4 Number 1 June 2012
Cunningham (1996) illustrated examples of how to improve students’ critical thinking while learning accounting.
Cunningham advocated discussions involving unresolved issues and identifying assumptions, less lectures and more
debates, fewer recall questions and more compare/contrast on exams among other recommendations. These
strategies were used in limited settings for the introductory classes assessed in this study. Consequently, the results
of this study and the teaching strategies evaluated may change if this study were extended to advanced accounting
courses.
REFERENCES
Abeysekera, I. (2008). Preferred Learning Methods: A Comparison between International and Domestic Accounting Students. Accounting
Education: an international journal. Vol. 17, No. 2, pp. 187-198. Biggs, J. (1987). Study Process Questionnaire Manual. Camberwell, Vic.: Australian Council for Educational Research.
Biggs, J. (1996). Western Misperceptions of the Confucian Heritage Learning Culture, in: D. Watkins and J. Biggs (Eds) The Chinese Learner:
Cultural, Psychological, and Contextual Influences, pp. 45-67. Hong Kong: Comparative Education Research Centre/ Melbourne: Australian Council for Education Research.
Bloom, B.S. (Ed.) (1956). Taxonomy of Educational Objectives – Handbook 1: Cognitive Domain. New York: Longman.
Carroll, J. (2005). Multicultural Groups for Discipline-Specific Tasks: Can a New Approach Be More Effective?, in: Carroll, J. and Ryan, J. (Eds) Teaching International Students: Improve Learning for All, pp. 84-91. London and New York: Routledge.
Carroll, J. and Ryan, J. (2005). ‘Canaries in the Coalmine’: International Students in Western Universities, in: Carroll, J. and Ryan, J. (Eds)
Teaching International Students: Improve Learning for All, pp. 3-10. London and New York: Routledge.
Cooper, B.J. (2004). The Enigma of the Chinese Learner, Accounting Education : an international journal, 13(3), pp. 289-310.
Cunningham, B. M. (1996). How to Restructure an Accounting Course to Enhance Creative and Critical Thinking. Accounting Education: A
Journal of Theory, Practice and Research, 1(1), 49–66. Greenholz, J. (2003). Socratic Teachers and Confucian Learners: Examining the Benefits and Pitfalls of a Year Abroad. Language and
Intercultural Communication, 3(2), pp. 122-130. Fox, H. (1994). Listening to the World: Cultural Issues in Academic Writing. Urbana, IL: National Council of Teachers of English.
Hammond, S. and Gao, H. (2002). Pan Gu’s Paradigm: Chinese Education’s Return to Holistic Communication in Learning, in: X. Lu, W. Jia,
and R. Heisey (Eds) Chinese Communication Studies: Contexts and Comparisons, pp. 227-244. Westport, CT: Ablex. Heath, R. (2009). Assessing Critical Thinking, in: Flinn, R. E. and Crumbley, D. L. (Eds) Measure Learning Rather than Satisfaction in Higher
Education, pp. 119-131. Florida: Teaching, Learning and Curriculum Section of the American Accounting Association.
Humfrey, C. (1999). Managing International Students. Buckingham: Open University Press. James, R., McInnis, C. and Devlin, M. (2002). Assessing Learning in Australian Universities. The University of Melbourne: Centre for Higher
Education, University of Melbourne and The Australian Universities Teaching Committee.
Kember, D. (2000). Misconceptions about the Learning Approaches, Motivation and Study Practices of Asian Students. Higher Education 40(1), pp. 99-121.
Kennedy, P. (2002). Learning Cultures and Learning Styles, in: Cribbin, J. and Kennedy, P. (Eds) Lifelong Learning in Action: Hong Kong
Practitioners’ Perspectives, pp. 71-92. Hong Kong: Hong Kong University Press. McLean, P. and Ransom, L. (2005). Building Intercultural Competencies: Implications for Academic Skills Development, in: Carroll, J. and
Ryan, J. (Eds) Teaching International Students: Improve Learning for All, pp. 45-62. London and New York: Routledge.
Piaget, J. (1959). The Language and Thought of the Child. London: Routledge & Kegan Paul. Pike, K.L. and McKinney, C.V. (1996). Understanding Misunderstand as Cross-Cultural Emic Clash, in: Jankowsky, K.R. (Ed) The Mystery of
Culture Contacts, Historical Reconstruction, and Text Analysis, pp. 39-64. Washington, D.C.: Georgetown University Press.
Pratt, D. (1992). Chinese Conceptions of Learning and Teaching: A Westerner’s Attempt at Understanding. International Journal of Lifelong Education, 11(4), PP. 301-319.
Ramburuth, P. and McCormick, J. (2001). Learning Diversity in Higher Education: A Comparative Study of Asian International and Australian
Students. Higher Education, 42(3), pp. 333-350. Ryan, J. and Hellmundt, S. (2005). Maximising International Students’ ‘Cultural Capital’, in: Carroll, J. and Ryan, J. (Eds) Teaching
International Students: Improve Learning for All, pp. 13-16. London and New York: Routledge.
Ward, C. (2001). The Impact of International Students on Domestic Students and Host institutions: A Literature Review. Prepared for the Export Education Policy Project, Strategic Information and Resourcing Division, New Zealand Ministry of Education, Wellington.
Watkins, D. and Biggs, J. (2001). Teaching the Chinese Learner: Psychological and Pedagogical Perspectives. Hong Kong: Comparative
Education Research Centre/Melbourne: Australian Council for Education Research Ltd.
The authors contributed equally to this manuscript.
Michael S. Wilson, CPA, Ph.D., is an associate professor of accounting at Metropolitan State University in
Minneapolis. Dr. Wilson's professional work experience includes positions in auditing, financial services, consumer
goods, and investment banking. Dr. Wilson has published articles related to applied research.
Tong Xiang, MBA, MPA, is an assistant professor of business at the University of Indianapolis where she teaches
financial accounting and finance courses in addition to her administrative responsibilities as the director of
undergraduate business programs. Professor Xiang’s business experience includes working for international trading
companies and professional services firms.
Elm Street Press All Rights Reserved © 2012 www.beijournal.com 65
Enlightened Teaching Strategies in an Enlightened Era:
Applying Humor in Business Education
Joan Marques, Woodbury University, CA, USA
ABSTRACT
This article discusses the use of humor in higher education. Advantages of using humor in the classroom are
presented, such as stress and anxiety reduction, increased engagement, and improved interpersonal relations, while
points of caution, such as appropriateness, effectiveness, and audience readiness, are also addressed. The use of
humor in business performance and education is specifically reviewed, addressing some significant points such as
conveying messages better, enhancing effectiveness, and increasing a sense of unity, while points of caution when
using humor in professional settings are also presented. A figure presents the reciprocity between health, education
and professional performance through humor.
Keywords: Higher Education, Humor, Business education, Anxiety, Stress reduction, Engagement, Interpersonal
relations, Student Perceptions, Educators
MOVING TOWARD PRAGMATIC APPROACHES
With the emergence of the previous “soft skills” such as empathy, emotional intelligence, compassion, and listening
as important leadership qualities in the 21st century, we also see a need to cultivate qualities that have been
suppressed for too long now. Humor is one of them. Humor is not just pleasant for interpersonal relations, but it is
usually absorbed with more eagerness, and has a healthy effect as well. Humor instigates laughter, which has been
researched on its health effects for quite some time now. Singer (2011) describes the emergence of scientific interest
in the health effects of laughter since 1976, resulting from the amazing recovery of journalist Norman Cousins, who
managed to turn around a grim health forecast on a painful autoimmune illness by taking large doses of Vitamin C
and watching funny movies. Singer reports that laughter causes astounding biochemical transformations that
improve our immune system. It also decreases three destructive stress hormones: Cortisol, epinephrine (adrenaline),
and dopac. These are the hormones that usually emerge when we are stressed or scared. A Japanese study
established that laughter is one of the two simple acts (the other is music), which can reduce blood pressure with as
much as six to seven points, due to the fact that both activities lower our levels of the stress hormone Cortisol
(Healthy Tune-Up, 2011). Donaldson (2011) reviews the use of humor by doctors and lists a number of health
effects that laughter is now known for: stress reduction, healthy blood vessels, managing diabetes, warding off heart
attacks, and aiding fertility. Of course the aspect of a good mood should not be underestimated.
Education and Humor: Match or Clash?
When incorporating the subject of humor in education, specifically higher education, there are a few perspectives
that have been observed over time. Ramsey, Knight, Knight, and Verdon (2011) and Vuorela (2005) remind us of
the three main theoretical perspectives, which humor scholars have established: 1. Superiority – a perspective that is
based on things we generally consider foolish, leading to teasing, mocking, or putting down through laughter. This
type of humor stems, according to the scholars, from a sense of superiority or aggression. 2. Relief – a perspective
that focuses on the laughter after a situation that could have been painful. This sense of humor mostly occurs after
tension has elevated significantly, after which it is relieved and the laughter occurs. The basis for this theory is,
hence, psychological. 3) Incongruity – a perspective that explains humor as a consequence of surprises, violations of
norms, or inconsistencies. This type of humor is very much based on one’s notions of language.
Martin, Puhlik-Doris, Larsen, Gray and Weir (2003) distinguish four different styles of interpersonal humor: 1)
Affiliative, self-enhancing, aggressive, and self-defeating humor. This style involves non-hostile joking, aimed at
building relationships; 2) Self-enhancing humor. This style aims at elevating other’s esteem by reducing the effects
of stressful situations. Self-enhancing humor is often used by people who are fairly comfortable with ambiguous
circumstances; 3) Aggressive humor. This style involves the more piquant types of humor, among which racist,
sexist, sarcastic, teasing, and satiric expressions. It is not always received well and may offend or intimidate others;
66 Business Education Innovation Journal Volume 4 Number 1 June 2012
and 4) Self-disparaging jokes, in which the joker puts the joke on him or herself with the aim to win recognition and
acceptance from others.
In a 2008 review on pedagogy, race and humor, Mayo asserts, “Humor is fundamentally about rethinking and re-
embodying one's relationship to the topics raised: one's body, identity, gestures are all open to critique, and one
responds via bodily acts -laughter, blushing - and thoughtful engagement” (p. 55). While Mayo’s main reasons for
his above mentioned article are to demonstrate how humor can effectively be used in anti-racist performance art, his
notion is generally applicable, as humor can be applied to all areas of life, and hence, education.
Punch Line inclusion for a Quickly Distracted Student Population
The idea of a new millennium demanding a different direction than the one we were used to in the past has now
fully settled, and with that, the awareness has risen that many of the abstract formats in which education was
transferred in the past decade don’t find broad and lasting appeal anymore among current generations of learners.
People are too busy, too restless, too stressed, and too driven, to focus on models that are already obsolete before
they graduate. The learner of today is seeking an appealing message that preferably serves multiple purposes,
inspires him or her to think, and elevates his or her understanding. This is not a time where people need, or even
want, to learn superficially. The time when we could simply learn by heart for a few hours and then disregard the
lessons learned is history. Learning without questioning is known as single loop learning, and does not suffice as a
learning mode for the challenging millennial generation. Even double-loop learning, which entails learning to learn,
is now insufficient. Given the greater demands on our performance in the 21st century, the rapid change, the need
for broader orientation and understanding, and the vast amount of developments of all kinds, there is a greater need
for ecumenical learning (Marques, 2007), which includes all dimensions that guarantee in-depth retention: the what,
how, and why of anything to be taught, and its relationship to anything else. Longenecker and Ariss (2002) are
convinced that “effective learning environments are created when instructors create a balance between seriousness,
light-heartedness and humor as a vehicle to stimulate learning and to promote alertness on the part of the learner” (p.
648). Focusing on the link between the learning environment and the students’ post-educational performance, they
continue, “It is important to note that without all of these characteristics being part of our management education
program the program's ability to create competitive advantage is greatly diminished” (p. 648).
Humor, as an educational strategy, fits perfectly in the trend of enhanced interaction in higher education. It blends in
seamlessly with the concept of andragogy, which entails more ownership and greater reciprocity based on the fact
that students in higher education are adult learners, albeit to various degrees of adulthood. In a setting where
interaction needs to be enhanced, ice breakers are important, and humor is one of the greatest ice breakers human
beings have at their disposal, but it is far more than that.
A good example to demonstrate the strong advent of humor in higher education is the existence of the International
Society for Humor Studies. This society comprises of professors from a wide variety of study directions with a
common goal: exploring the advantages and use of humor to enhance the educational experience. The organization
publishes a journal and conferences on humor in higher education. Yet, while we are still testing the waters on the
possibility of structurally applying humor in higher education courses, studies have long proven its merit.
ADVANTAGES AND POINTS OF CAUTION WHEN APPLYING HUMOR IN EDUCATION
Reasons to Consider Humor in Education
Emphasizing appropriateness as the main prerequisite to its use, Torok, McMorris, and Lin (2004) assert, “humor
has the potential to humanize, illustrate, diffuse, encourage, reduce anxiety and keep people thinking” (p. 14). With
this enumeration, they also capture the most important and effective reasons for using humor in education. On the
website from the office of the Provost at Michigan State University, the following statement is posted:
“Humor can do much to enhance the classroom environment, reduce stress, increase student interest and
attentiveness, and even promote long-term recall. The articles and websites below offer research,
guidelines, and examples of humor in the college classroom, online courses, and "dread courses" such as
statistics. The final two sites provide information on a society for humor studies and a source for college
humor” (Rosen, 2011, par. 1).
Elm Street Press All Rights Reserved © 2012 www.beijournal.com 67
Torok, McMorris and Lin (2004) conducted a survey among 124 students and their instructors, and found that the
use of humor was very positively perceived by both groups. Eighty percent of the students responded positively to
the learning that happens in humor driven lectures. Of this percentage, half stated that they learned and understood
better most of the time, and half felt that it worked for them all of the time. A majority of students (79 percent)
responded that their professors used the humor constructively in the classes. The types of humor students mostly
appreciated were: funny stories, funny comments, jokes, and professional humor. Sarcasm was considered useful,
but was also seen as a point of caution, as it was potentially harmful. Overall, the students that participated in Torok,
McMorris and Lin’s (2004) study did not feel that the use of humor confused them during class sessions, but
conveyed that it might not be a very good idea on exams and tests. The latter is challenged by Berk (2000) who
avows that the use of humor in exams can help students reduce their anxiety levels. The attribute of humor that he
considers helpful in these cases is its ability to reduce anxiety, tension, and stress. Berk claims that there have not
been many studies on the effects of humor in exams to be able to draw a conclusion in either direction. Berk (2000)
posits that the use of humor in tests should be encouraged when the following criteria are in place: 1) the instructor
has used humor in the course as well. 2) there is no specific - or a very mild - limit to the duration of taking the test,
3) the nature of the humor is a positive one, 4) the humor fits in the topic and student group, 5) there are no cultural
differences between test writer and test takers, and 6) humor is an area with which the test taker is comfortable. Berk
subsequently presents findings from his own study about this topic for which he used 695 students from
undergraduate and graduate programs. The study showed that students generally prefer humor during their tests, but
agree that there should be a well-considered approach in place when doing so. Berk finally reveals four major
techniques that could be used when taking tests: incongruous descriptors under the title of the test, jocular inserts in
the directions, humorous notes on the last page, and humor in the test items.
Garner (2005) underscores that when we use proper humor, analogy, and metaphor in our college classes, we ensure
better attention from our students, greater retention in our courses, better understanding of what we teach, and
overall a more pleasant environment. Martin (2007) points out that humor reduces anxiety and helps students
understand the discussed material much better, because they are more relaxed and motivated, as opposed to students
who feel anxious and threatened. Zambor (2006) discusses an example of a professor who uses humor in his
statistics classes, thus getting even the most math-averse student to become of fan of his course topic and losing all
anxiety for math.
McCarron and Savin-Baden (2008), two educators from different disciplines, feel that course facilitators should
adopt some of the techniques of stand up comedians. What they perceive as the commonality between a teacher and
a stand-up comedian is the continuous interaction between them and their audience. McCarron and Savin-Baden
also feel that humor has now become more important than before due to the gravitation of higher education from a
precious few members of the elite to larger, more diverse, and differently situated communities, which has led
educators to believe that they should be nurtured instead of challenged. However, they suggest instructors to deviate
from that erroneous mindset and engage in “infotainment,” which is the hybrid of information and entertainment.
Their four suggestions to instructors are: 1) to improvise more and prepare less; 2) to remain detached in a way that
students are less inhibited to perform. While relationships are good, they can also become impediments to openness
when too intense. 3) Challenge, rather than support. This does not mean that students should not be supported, but
the aspect of triggering their will to show what they can, should be considered here. 4) No names, rather than most
names. This pertains mainly to large seminar sized courses with more than 60 students, where professors spend too
much time worrying about knowing names. McCarron and Savin-Baden consider it best to reallocate the energy
invested in this time consuming task into the quality of the interaction during the course sessions. Evans-Palmer
(2010) confirms that teachers who include humor in their practices, along with those who strongly believe in their
self-efficacy, are divergent thinkers with the ability to establish advantageous social connections.
Both are innovative, flexible, resilient, and able to motivate students. They possess heightened emotional,
cognitive, and affective capabilities. They face their problems with optimism, working hard to seek
solutions. Their teaching methods engage and motivate students and clarify content. Not only do students
learn more from humorous teachers; they also remember more easily when teachers use humor devices
(Evans-Palmer, 2010, p. 81).
Points of Caution in using Humor in Education
It should be noted that humor, like everything else, requires proper use, which in this case, ultimately lies in the
responsibility area of the course facilitator. Dickmeyer (1993) warns for misuses of humor in the classroom, because

68 Business Education Innovation Journal Volume 4 Number 1 June 2012
these may be more devastating than the advantages gained by creating an open environment. Teachers therefore
need to consider their own presentation skills as well as their audience when choosing the type of humor they
present.
Summerfelt, Lippman, and Hyman (2010), who did extensive research on the psychology of humor in the
classroom, found that while humor is consistently regarded a popular tool, and can make a strong difference in
students’ perceptions of their professors and the topic of the course at hand, there is no guarantee that the use of
humor also increases learning. For that to happen, educators have to be aware of close integration of the humor with
the information to be remembered. The reason for this is simple: recalling the humor will then also lead to recalling
the information that is considered relevant. Furthermore, as previously indicated by Torok, McMorris and Lin
(2004), humor should be appropriate: it should relate to the topic and be constructive rather than harmful. While,
therefore, any type of humor could be used properly, Torok, McMorris and Lin feel that particularly the use of
sarcasm should be done in a highly cautious manner, especially when dealing with diverse audiences.
Romal (2008) brings another point of caution to the surface: students’ various backgrounds, learning styles, and
personalities. She warns that a particular style of humor could work on one level (for instance freshmen), but not on
another (for instance seniors), and that teachers should therefore try to identify the proper way for each level of
students: “humor that is ‘above their heads’ or beyond their experience is simply confusing” (Romal, 2008, p. 93).
Finding out what works for which audience is therefore, according to Romal, a gradual process that requires
research, rehearsing, and then frequent application.
Almost two decades ago, Edwards and Gibboney (1992) compiled a list in which they captured most of the
advantages and points of caution mentioned above regarding the use of humor in the college classroom: 1) it
enhances a sense of unity in the class; 2) It helps students understand and retain the course material better; 3) It
works best when it pertains to the situation and has something that resembles the instructor or students; 4) It should
be used responsibly, and should be left out of tests; 5) It should not target the students or the professor; 6) It should
be free from sexist notions; 7) It can help increase professors’ evaluation ratings; 8) Instructors should select the
type of humor that fits their style and personality; 9) Some humor styles fit better with male and others better with
female instructors; 10) Humor combines very well with storytelling.
HUMOR IN BUSINESS EDUCATION
Business education has always been taken seriously, mainly because the focus has been for a long time to maximize
profits and ensure the greatest efficiency at the same time. However, having seen where that led us in the past years
of repeated scandals based on dishonesty and greed, we now see a redefining process of business unfolding, in
which a hard look is taken at people, purpose, and profit, and their respective roles in the managerial scene.
Using humor in business is nothing new: many corporate leaders and managers have used humor in various forms
and to different degrees to ensure greater advantages. However, there is one major problem with humor in business:
its effect cannot be measured. It is one of those things that you see and just know that it’s good, but you cannot
measure its effects in numbers, which means that there is never a real guarantee whether and how it will work out.
As for the reactions of business students on the use of humor in their classes, there has not been extensive research
posted on this. One of the early scholars to study humor in business education are Lundgren and Graves (1994), who
sought responses from 97 business faculty, and found that 72 of them (74%) presented humorous incidents in
business education. These authors concluded that all these instructors, while not considering themselves humorous,
use humor in class. Slocombe, Miller, and Hite (2011) conducted a survey among 163 business students at an
AACSB accredited university and found that students reported giving higher evaluations to professors who used
humor in their classes. The business students also believed they learned more in classes where they liked their
professor. The survey actually revealed that students considered liking their professor an important aspect of their
educational experience. Slocombe, Miller, and Hite made the interesting comment that this qualitative evaluation of
professors by students is in stark contrast with the increasingly quantitative preferences of accrediting bodies! They
also expressed their concern about the fact that students’ preference for humorous professors may not be a helpful
guidance toward improvement for educators, because being humorous is not a trait that can easily be acquired.
While the comment from Slocombe et. al. about humor makes perfect sense, it should not be disregarded right away,
because even instructors with little sense of humor can find ways to lighten the atmosphere in their classes, either by

Elm Street Press All Rights Reserved © 2012 www.beijournal.com 69
inviting guest lecturers with a sense of humor, by showing clips or sharing readings that are humorous, or simply
inviting students to select and share some humorous materials that pertain to the course topics. It may be appropriate
here to reiterate a previously made recommendation from McCarron and Savin-Baden (2008) that educators should
behave a little bit more like standup comedians: not every person has an equal sense of humor or an equal ability to
be funny in the classroom. But the growing number of materials that shine a humoristic light on almost every topic
without making it preposterous or confusing, should be considered. There are always helpful tools available for
those who understand their importance, and educators are well aware of the importance of their students’ evaluations
about their teaching.
Reviewing the role of humor in accounting education, Romal (2008) finds that this phenomenon is nowadays
considered more effective than it was in the early eighties, and that, like other educators, accounting professors may
also benefit from it. More importantly, Romal directly addresses an earlier raised concern by Slocombe et al by
believing that the inclusion of humor in one’s educational package is possible. She provides some strategies and
illustrations related to the use of humor that may enable interested accounting teachers to develop humor consistent
with their personal styles and the needs of their students. Romal first asserts that some educators still believe that
using humor in their classes is unprofessional, risky, politically incorrect or inappropriate. As a result, their courses
are often considered boring by students, regardless of their brightness or their ability to explain the material well.
Romal further states that humor has the potential to increase a presenter's effectiveness because it builds rapport
between him or her and the audience. “Humor helps the presenter draw the listeners’ attention to the material to
make it more salient” (Romal, 2008, p. 84). Romal engages in a meta-analysis of existing literature on the use of
humor in business and educational settings and cites various authors who have stated that in the business world as
well as in the college classroom humor can help convey messages better, enhance effectiveness, a sense of unity,
and improves interpersonal relationships.
Humor in Business Performance
As Romal’s above mentioned study already revealed, humor is considered a useful tool in business performance.
Holmes (1998) concurs with this notion and, referring to its use in business negotiations, asserts, “The power of
humor lies in its flexibility for all these purposes - it can function as a bouquet, a shield, and a cloak, as well as an
incisive weapon in the armory of the oppressed” (par. 37). Holmes discusses four ways in which humor is often used
in the workplace: 1) as a positive politeness strategy (to build solidarity); 2) as a negative politeness strategy (to
downplay the impact of an order that could be considered unwelcome or unpleasant by the addressee); 3) repressive
humor (to subtly control the behavior of others – often used by superiors to exert their power positions), and 4)
contestive humor (to challenge power relations – often by subordinates to challenge their superiors).
Studying two distinctive business negotiations, one organizational-internal, and one between organizational
representatives and a potential customer, Vuorela (2005) found that in both cases, humor was a major factor for
success. The first interesting fact he noted was the difference in use of humor: there was more humor in the internal
meeting than in the one with an external stakeholder. A second finding Vuorela noted was that humor was used
more cautiously when dealing with an external stakeholder than when communicating with colleagues amongst one
another. Furthermore, Vuorela found that the type of humor used in both cases was different: while the internal
meeting was interspersed with irony and incongruence based jokes, the one with the external stakeholder was of a
more cautionary sort, with irony used to a more limited degree. In general, however, Vuorela asserted that “humor
seems to have strategic potential for negotiations: it can be used to diffuse tension, mitigate a possible offense,
introduce a difficult issue, and thus to pursue one's own goals (p. 105).
The element of caution manifests itself in multiple dimensions when humor is being used in business dealings.
Vuorela explains that joking seems to be linked to power: the most powerful person in a team seems to have the
right to begin and end a joke, and also seems to determine whose joke is laughed at. In that light, Gkorezis,
Hatzithomas, and Petridou (2011) stress that leaders should be aware of how they use humor toward subordinates.
Their study on humor and job related attitudes found that humor is directly related to its effects on workers’
empowerment: positive humor exerts a positive effect, while negative humor has a negative effect on employees’
psychological empowerment.
“Positive humor, such as affiliative and moderate self-defeating humor, can facilitate interpersonal
interactions, reducing social distance between supervisors and their subordinates. On the other hand,
negative humor is an aggressive way to establish hierarchical relations, teasing and belittling the lower

70 Business Education Innovation Journal Volume 4 Number 1 June 2012
status employees […]. Aggressive humor can be detrimental to the well-being of employees since it
induces hostility and anger, while at the same time is negatively related to relationship satisfaction”
(Gkorezis et al, 2011, p. 87).
In addition to the above, Vecchio, Justin, and Pearce (2009) explain that the effect of humor from a leader is also
determined by subordinates’ perceptions of the leader’s integrity, and perceived fairness, especially in educational
and non-profit settings.
CONCLUSION
While this article profiled humor as a very positive strategy in education and business settings, as well as a valuable
attribute for better personal health of those who laugh often, some important prerequisites and points of caution were
presented as well. Yet, if the points of caution are considered well, there is very little to bring up against this natural
human aspect. Humor is a positive emotion, and it creates constructive learning and working climates: two
environments that we need as we move forward into this millennium and away from obsolete, tedious educational
structures, and negative motives in business dealings.
One advantage to the use of humor in education that was not earlier presented in this article because it is a rather
subliminal one, is the fact that attentive business students who are exposed to responsibly applied humor in the
classroom, may realize its value and decide to apply it in their work settings as well, even if they are not strictly
aware of the research and findings about using humor in business settings.
Figure 1 below represents a one-glance view of the points discussed in this paper, and may serve as a roadmap for
those who want to explore the option of humor in education, particularly business education, while remaining aware
of potential pitfalls as well as all the positive health contributions they make when responsibly implementing humor
in their courses.
Figure 1: Humor in Business Education

Elm Street Press All Rights Reserved © 2012 www.beijournal.com 71
Aside from summarizing the message conveyed in this article, Figure 1 also illustrates an important purpose of this
article: the synergistic connection between health, education, and professional performance, through humor. While
several articles highlighted each area separately, there has not been any attempt to consider the reciprocal
association in all three fields when it regards the use of humor.
REFERENCES
Berk, R. A. (2000). Does Humor in Course Tests Reduce Anxiety and Improve Performance? College Teaching, V.48 No.4, p.151. Dickmeyer, S. G. (1993). Humor as an Instructional Practice: A Longitudinal Content Analysis of Humor Use in the Classroom. Paper presented
at the annual meeting of the Eastern Communication Association – Retrieved on August 11 2011 from
http://www.eric.ed.gov/PDFS/ED359587.pdf Donaldson, D. (2011). The Giggle Cure. Saturday Evening Post, V.283 No.3, pp.25-29.
Edwards, C. M., & Gibboney, E. R. (1992). "The Power of Humor in the College Classroom" ERIC Document ED346535. Retrieved on August
11 2011 from http://www.ntlf.com/html/lib/suppmat/v7n6prin.htm Evans-Palmer, T. (2010). The Potency of Humor and Instructional Self-Efficacy on Art Teacher Stress. Studies in Art Education, V.52 No.1,
pp.69-83
Garner, R. (2005). Humor, Analogy, and Metaphor: H.A.M. it up in Teaching. Radical Pedagogy. Retrieved on August 11 2011 from http://radicalpedagogy.icaap.org/content/issue6_2/garner.html
Gkorezis, P., Hatzithomas, L., and Petridou, E. (2011). The Impact of Leader's Humor on Employees' Psychological Empowerment: the
Moderating Role of Tenure. Journal of Managerial Issues, V.23 No1, pp. 83-95; 7-8. Healthy Tune-Up. (2011). Shape, V.30 No.11, pp.42.
Holmes, J. (1998). No joking matter! The functions of humour in the workplace. Australian Linguistic Society. Retrieved on August 14 2011
from http://emsah.uq.edu.au/linguistics/als/als98/holme358.html Hughes, L. W. and Avey, J. B. (2009). Transforming with levity: humor, leadership, and follower attitudes. Leadership & Organization
Development Journal, V.30 No.6, pp.540-562. Longenecker, C. O., and Ariss, S. S. (2002). Creating competitive advantage through effective management education. The Journal of
Management Development, V.21 No.9/10, pp.640-654
Lundgren, C. A. & Graves, P. R. (1994). Funny business: should humor be part of teaching business education? Business Education Forum No.48, pp.11-13
Marques, J. (2007). Ecumenical Learning: Considering All Stakeholders. Performance Improvement, V.46 No.5, pp.25-29.
Martin, R. A., Puhlik-Doris, P., Larsen, G., Gray,J. and Weir, K. (2003). “Individual Differences in Uses of Humor and their Relation to Psychological Well-being: Development of the Humor Style Questionnaires.” Journal of Research in Personality V.37 No.1, pp.48-
75.
Martin, R. (2007). The psychology of humor: an integrative approach. Elsevier Academic Press: Burlington, MA. Mayo, C. (2008). Being in on the Joke: Pedagogy, Race, Humor. Philosophy of Education Yearbook, pp.244-252, Champaign, IL.
McCarron, K., and Savin-Baden, M. (2008). Compering and comparing: Stand-up comedy and pedagogy. Innovations in Education and Teaching
International, V.45 No.4, pp.355-363. Ramsey, M. C., Knight, R. A., Knight, M. L., and Verdon, T. (2011). Telic State Teaching: Understanding the Relationships Among Classroom
Conflict Strategies, Humor, and Teacher. Florida Communication Journal [serial online] V.39 No.1, pp.1-15.
Romal, J. B. (2008). Use of humor as a Pedagogical Tool for Accounting Education. Academy of Educational Leadership Journal V.12 No.1, pp.83-106
Rosen, L. (2011). Online Instructional Resources Teaching Methods: Humor Introduction General Resources. Retrieved on 11 August 2011 from
http://fod.msu.edu/oir/TeachingMethods/humor.asp Singer, W. (2011). Laugh Yourself Healthy…and That's No Joke! Odyssey, V.20 No.2, p. 32.
Slocombe, T., Miller, D., and Hite, N.. (2011). A Survey Of Student Perspectives Toward Faculty Evaluations. American Journal of Business
Education, V. 4 No.7, pp. 51-57 Stambor, Z. (2006). How laughing leads to learning: Research suggests that humor produces psychological and physiological benefits that help
students learn. Monitor Staff 37(6), Retrieved on August 11 2011 from http://www.apa.org/monitor/jun06/learning.aspx
Summerfelt, H., Lippman, L., and Hyman, I. (2010). The Effect of Humor on Memory: Constrained by the Pun. The Journal of General Psychology, V. 137 No.4, pp. 376-94.
Torok, S. E., McMorris, R. F., and Lin, W. (2004). Is Humor an Appreciated Teaching Tool? Perceptions of Professors' Teaching Styles and Use
of Humor. College Teaching, V. 52 No.1, p. 14 Vuorela, T. (2005). Laughing Matters: A Case Study of Humor in Multicultural Business Negotiations. Negotiation Journal, V. 21 No.1, p. 105.
Joan Marques, Ph.D., Ed.D., is Director and Chair of the BBA Program and faculty in undergraduate and graduate
management courses at Woodbury University, Burbank, CA, USA. Her research interests pertain to consciousness
and empathy in leadership, Buddhist psychology in work settings, and new trends in organizational leadership.

72 Business Education Innovation Journal Volume 4 Number 1 June 2012
Assessing Learning Outcomes Beyond Knowledge Attainment
Lee Revere, University of Houston – Clear Lake, Houston, TX
Phillip Decker, University of Houston – Clear Lake, Houston, TX
Robert Hill, University of Houston – Clear Lake, Houston, TX
ABSTRACT
Both accrediting bodies and employers are challenging schools of business to improve content relevancy and
become more accountable to market needs. Because teaching typically follows assessment, designing a competency
model based on advanced cognitive and behavioral domain characteristics will inevitably foster higher-level
teaching. While none of the accrediting bodies suggest assessment be based on any particular theory of learning,
they do expect assessment to be direct, based on the ability to perform, and to include “higher” teaching activities
and assessment methods. A closer look at the AACSB’s trend in assurance of learning supports the foreseeable need
for colleges of business to develop and assess behavioral, complex cognitive and affective competencies. Industry
demand further supports this presumption. This research discusses the current trends in accreditation, delineates
higher-level performance competencies, and outlines a methodology for designing assessments (and pedagogies)
aimed at assuring higher levels of student learning and engagement.
Keywords: Competency models, accreditation, assessment, assurance of learning, outcomes data, AACSB
INTRODUCTION
Schools of Business have been assessing their programs, services and students for decades. Traditionally these
assessments were aimed at assuring acceptable level of inputs were available to meet the presumed needs of the
students. Outcome measures such as an adequate number of academically qualified faculty members, high faculty to
student ratio, small class sizes, and available financial resources were considered acceptable, and even
commendable. More recently, accrediting agencies have changed the assessment focus from inputs to outputs;
specifically the output of competency-based learning. The requirements of accrediting body standards have led to
the development of competency assessment for guiding curriculum planning across a number of academic
disciplines (Calhoun, Vincent, Calhoun & Brandsen, 2008; Garman & Johnson, 2006; Gardiner, Corbitt & Adams,
2010). Specifically, agencies such as the Association to Advance Collegiate Schools of Business (AACSB) and
Commission on Accreditation of Healthcare Management Education (CAHME) are focused on encouraging schools
to have a defined competency model for student learning. Developing a competency model provides an opportunity
for faculty to collectively re-think their academic teachings and outcome expectations, as well as, to identify
weaknesses and implement improvements.
Establishing a culture of continuous improvement of learning has been identified as a top issue facing academic
professionals (Campbell, Olinger, & Colleagues, 2007). Many critiques have challenged schools of business to
improve content relevancy and become more accountable to market needs (Keys & Wolfe, 1988; Rubin &
Dierdorff, 2009). Rubin and Dierdorff (2009) have shown a misalignment between the outcomes thought critical by
practicing managers and MBA programs. Belasen and Fortunato (2000) suggested that the split between theory and
practice is too great in business schools, with curriculum emphasizing theory and cognitive skills rather than
application skills. Wren, Halbesleben, and Buckley (2007), using recent survey data compared to earlier surveys,
conclude that there is an increasing emphasis towards teaching theory in business schools. Despite these criticisms,
business schools have done little to respond to these criticisms and have continued to focus more on cognitive
learning outcomes (Stokes, King, & Rosetti, 2010). Consequently, current critics suggest business education leaves
students with little practice to become competent in the action skills necessary for good management (Bennis &
O’Toole, 2005; Belasen & Rufer, 2007). The misalignment between required career skills and academic teachings
needs to be addressed and competency-based assessment provides a platform for this necessary task.
Competency-based assessment has been widely adopted and has been investigated across the health and business
professions during the past decade (Bishop, Ferran, & Bishop, 2001; Griffith, 2000; Calhoun, et al., 2009; Kelly,
Tong & Choi, 2010). Management and leadership are enormously complex; competencies required are more
relational and multidimensional than ordered and sequential, and more intuitive than intellectual (Belasen &

Elm Street Press All Rights Reserved © 2012 www.beijournal.com 73
Huppertz, 2009). However, business educators and curriculum planners find it challenging to shift their pedagogical
emphasis from knowledge acquisition to skill development (Mintzsberg, 2004; Chia & Holt, 2008). It is the intent of
this manuscript to discuss the current trends in accreditation, to explore higher-level performance competencies
(beyond retention of knowledge) and to delineate pedagogy and assessment techniques aimed at these higher-level
competencies.
CURRENT TRENDS IN ACCREDITATION
Business Education
The AACSB, in accrediting colleges of business, revised its standards in 1992 to emphasize continuous
improvement and outcome-based assessment (AACSB International, 2009). In 2005, AACSB incorporated the
assurance of learning (AoL) standards that include defining outcome goals and designing assessment methods for
student learning (Shaftel & Shaftel, 2007). The AoL standards require the use of direct measures of student learning,
but indirect measures may be used to supplement the data collected with direct measures. Examples of indirect
measures include asking students their perceptions of their learning and collecting employer feedback on graduates’
job performance (Stivers & Phillips, 2009). In making decisions regarding the selection of direct measures, AACSB
focuses on three areas: tracking performance on professional licensing exams, commercially available standardized
testing, and course-embedded testing with common exams and capstone course project activities. Course-embedded
measures, because of their ease and usefulness, are ranked very high among department chairs with respect to
usefulness (Miles, Hazeldine & Munilla, 2004) and are also one of the top knowledge acquisition assessments
reported being used by colleges of business (Pringle & Michel, 2007) and marketing departments (Nicholson,
Barnett & Dascher, 2005). However, some schools favor a standardized test as a direct measure of student learning
to meet the AoL standards. For example, the Major Field Test (MFT) offered by the Educational Testing Service
(2008) is a standardized objective test that assesses knowledge of graduating seniors and MBAs (Shaftel & Shaftel,
2007). Standardized tests typically result in measurements at the cognitive, and often, the lower cognitive levels of
learning outcomes (Kilpatrick, Dean & Kilpatrick, 2008), while course-embedded measures enhance the potential to
assess high-level performance competencies.
Healthcare Management
Calhoun, et al. (2009) discuss the history of the National Center for Healthcare Leadership (NCHL) which was
created to develop a comprehensive strategy for improving health management education. Central to NCHL’s vision
was the identification of healthcare leadership competencies and the assessment of outcomes using uniform methods
and measures. Specific objectives include elevating the level of course learning objectives to higher-levels (i.e. from
knowledge/comprehension to analysis, synthesis, and behavioral measurement). These researchers indicate that, in
healthcare administration education, like business, there has been a predominant emphasis on the lower-level
retention through faculty-driven learning activities such as lecture and less time mapped for career-like activities. Of
specific note was the predominance of knowledge learning objectives as compared to the behavioral, advanced
cognitive or affective domain characteristics (Bloom, Englehart, Furst, Hill & Krathwohl, 1956) widely
acknowledged as key discriminators in future leadership roles (McClelland 1973, 1988; McClelland, Clark, &
Lowell, 1976; Spencer & Spencer, 1993). The NHCL provides academics with examples of lower and higher
teaching and learning levels in an effort to support learning activities (Table 1).
CAHME is an accrediting body whose standards for healthcare administration graduate education also demonstrate
the trend towards higher-level learning outcomes. CAHME’s 2009 and 2012 standards require team-based
instruction and integrative experiences, as well as, assurance of critical thinking. In 2009, the standards include,
“The Program will structure its curriculum so that students achieve levels of competency appropriate to graduate
education.” In 2012 the standards will expand to: “The Program will incorporate a range of teaching, and learning
methods driven by adult learning principles. The methods will be based on higher education taxonomic levels
appropriate to graduate education” (CAMHE 2011). Also, programs will be required to track the percentages of
lower and higher level teaching activities. Clearly, healthcare administration accreditation requires competency-
based assessment aimed at the higher cognitive, affective, and behavioral levels.
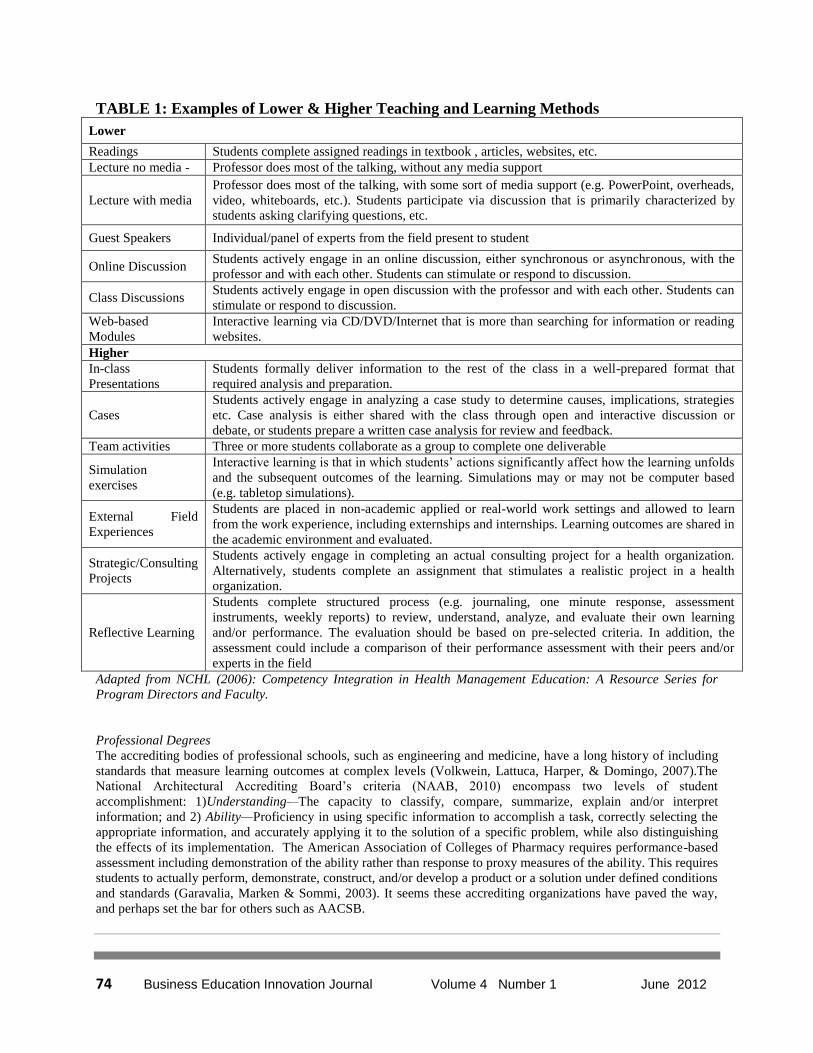
74 Business Education Innovation Journal Volume 4 Number 1 June 2012
TABLE 1: Examples of Lower & Higher Teaching and Learning Methods
Lower
Readings Students complete assigned readings in textbook , articles, websites, etc.
Lecture no media - Professor does most of the talking, without any media support
Lecture with media
Professor does most of the talking, with some sort of media support (e.g. PowerPoint, overheads,
video, whiteboards, etc.). Students participate via discussion that is primarily characterized by
students asking clarifying questions, etc.
Guest Speakers Individual/panel of experts from the field present to student
Online Discussion Students actively engage in an online discussion, either synchronous or asynchronous, with the
professor and with each other. Students can stimulate or respond to discussion.
Class Discussions Students actively engage in open discussion with the professor and with each other. Students can
stimulate or respond to discussion.
Web-based
Modules
Interactive learning via CD/DVD/Internet that is more than searching for information or reading
websites.
Higher
In-class
Presentations
Students formally deliver information to the rest of the class in a well-prepared format that
required analysis and preparation.
Cases
Students actively engage in analyzing a case study to determine causes, implications, strategies
etc. Case analysis is either shared with the class through open and interactive discussion or
debate, or students prepare a written case analysis for review and feedback.
Team activities Three or more students collaborate as a group to complete one deliverable
Simulation
exercises
Interactive learning is that in which students’ actions significantly affect how the learning unfolds
and the subsequent outcomes of the learning. Simulations may or may not be computer based
(e.g. tabletop simulations).
External Field
Experiences
Students are placed in non-academic applied or real-world work settings and allowed to learn
from the work experience, including externships and internships. Learning outcomes are shared in
the academic environment and evaluated.
Strategic/Consulting
Projects
Students actively engage in completing an actual consulting project for a health organization.
Alternatively, students complete an assignment that stimulates a realistic project in a health
organization.
Reflective Learning
Students complete structured process (e.g. journaling, one minute response, assessment
instruments, weekly reports) to review, understand, analyze, and evaluate their own learning
and/or performance. The evaluation should be based on pre-selected criteria. In addition, the
assessment could include a comparison of their performance assessment with their peers and/or
experts in the field
Adapted from NCHL (2006): Competency Integration in Health Management Education: A Resource Series for
Program Directors and Faculty.
Professional Degrees
The accrediting bodies of professional schools, such as engineering and medicine, have a long history of including
standards that measure learning outcomes at complex levels (Volkwein, Lattuca, Harper, & Domingo, 2007).The
National Architectural Accrediting Board’s criteria (NAAB, 2010) encompass two levels of student
accomplishment: 1)Understanding—The capacity to classify, compare, summarize, explain and/or interpret
information; and 2) Ability—Proficiency in using specific information to accomplish a task, correctly selecting the
appropriate information, and accurately applying it to the solution of a specific problem, while also distinguishing
the effects of its implementation. The American Association of Colleges of Pharmacy requires performance-based
assessment including demonstration of the ability rather than response to proxy measures of the ability. This requires
students to actually perform, demonstrate, construct, and/or develop a product or a solution under defined conditions
and standards (Garavalia, Marken & Sommi, 2003). It seems these accrediting organizations have paved the way,
and perhaps set the bar for others such as AACSB.
Elm Street Press All Rights Reserved © 2012 www.beijournal.com 75
With the increased emphasis on competency-based assessment and the need to meet the market and industry
demands, colleges of business have an opportunity to build competency models aimed at higher-level learning.
Because teaching typically follows assessment (Hand, O’Neil, & Sanderson, 1996), designing a competency model
that includes knowledge learning objectives, but is also focused on the behavioral, advanced cognitive or affective
domain characteristics, will inevitably foster higher-level teaching. For business faculty to develop such models
requires a thorough understanding of these higher-level competencies and a pedagogical approach to assuring the
competencies are attained
HIGHER-LEVEL PERFORMANCE COMPETENCIES
Bloom’s Taxonomy
There is more than one type of learning. Bloom (1956), identified three domains of educational activities:
Cognitive: ranging from retention of factual material to complex cognitive skills such as decision making and
evaluation. Affective: growth in feelings or emotional areas. And, Psychomotor: manual or physical skills, Bloom
identified six levels within the cognitive domain, from the simple recall or recognition of facts, as the lowest level,
through increasingly more complex and abstract mental levels, to the highest order which is classified as evaluation.
The categories can be thought of as degrees of difficulty. That is, the first one must be mastered before the next one
can take place. The affective domain (Krathwohl, Bloom, & Masia, 1973) includes the manner in which we deal
with things emotionally, such as feelings, values, appreciation, enthusiasms, motivations, and attitudes. There are
five major categories in the affective domain. The psychomotor domain (Harrow, 1972) includes physical
movement, coordination, and use of the motor-skill areas. Development of these skills requires practice and is
measured in terms of speed, precision, distance, procedures, or techniques in execution. Seven major categories are
listed from the simplest behavior to the most complex.
Bloom (1956) found that over 95 % of what students encounter in educational classroom assessment requires them
to think only at the lowest possible level - the recall of information or declarative knowledge. This has not changed
much in the decades since his initial research (Chia & Holt, 2008; Calhoun, et. al., 2009). A goal of Bloom's
Taxonomy was to motivate educators to focus on all three domains, creating a more holistic form of education. The
work of Dominguez et al. (2009); and Pringle et al. (2010) suggest that the key discriminators in future leadership
roles depend upon much more than just declarative knowledge (Anderson, 1976).
Industry-defined Competencies
Rubin & Dierdorff (2009) found that six behavioral competencies underlie all managerial work and that practicing
managers deemed two of these competencies to be significantly more important than the others: managing human
capital and managing decision making. When Rubin & Dierdorff (2009) cross-referenced these competencies to
MBA curriculum, they found the curriculums of most schools underemphasized these two competencies. They
suggest that curricular design should integrate leadership, teamwork, and human communication skills in the
teaching program. Assessment of student learning should also include traits and observable behaviors. It has
become clear that business and management education programs have not done enough to include the leadership
development, communication, teamwork, and interpersonal skills which are essential for successful management in
their core curricula (Jones, 2002a; Richards-Wilson, 2002).
A September 2003 Wall Street Journal/Harris Interactive survey rated student and program attributes most desired
by recruiters (Wall Street Journal, 2003). Of the 26 attributes identified by recruiters, the top three are examples of
desirable executive skills; communication, teamwork, and problem-solving. Percentages of recruiters rating these
attributes as “very important” were (1) communication and interpersonal skills (89%); (2) ability to work well
within a team (87%); and, (3) analytical and problem-solving skills (85%). Furthermore, Boyatzis et al. (2002)
found that MBA students could acquire cognitive and emotional intelligence competencies, but not as part of a
typical MBA curriculum. Navarro (2008) surveyed business schools and found a lack of emphasis on
multidisciplinary integration, experiential learning, and teaching of soft skills such as leadership, negotiation, team
building, etc. These themes have been echoed by researchers and practitioners in healthcare management, who noted
that the same limitations apply to master’s degree programs designed to produce a new generation of healthcare
leaders (Shewchuk, O’Connor & Fine, 2006; Friedman & Frogner, 2010). Much more has to be done to assist with
an understanding of the development of curriculum that teaches behavioral skills; and one of the drivers will be
assessment of behavior and affective outcomes (Calhoun, et. al., 2009).

76 Business Education Innovation Journal Volume 4 Number 1 June 2012
PEDAGOGY AND ASSESSMENT TECHNIQUES FOR HIGHER-LEVEL COMPETENCIES
Business faculty are exploring many innovative pedagogical methods such as class projects (Weldy & Turnipseed,
2010), role-playing (Libin et. al., 2010), action research (Raelin, 2006), business games (Anderson & Lawton, 2008;
Salas, Wildman, & Piccolo, 2009), and service projects and internships (Narayanan, Fukami & Olk, 2010) to
enhance higher-order learning. All of these methods incorporate behavioral skills as well as affective and higher
cognitive skills in the activity. Research indicates that class projects (Goretsky, 1984; Thomas, 2002), role-play
(Alden, 1999; Baglione, 2006), and service learning (Eyler, 2001;McIntyre, Webb, & Hite, 2005) are more effective
for higher-levels of learning and engagement (Gujarathi & McQuade, 2002; Umbach & Wawrzynski, 2005; Young,
2002) and have a stronger connection to the real world (Cannon & Newble, 2000). The benefits increase when the
project involves researching a real-world business problem or opportunity (Broderick, 2007; Goretsky, 1984). Allen
& Hartman (2008) surveyed business leaders to determine their perspectives on the effectiveness and efficiency of
27 approaches to leader development. They found that the respondents deemed 10 approaches the most useful – all
included behavioral performance. Other researchers have shown that skills such as self-efficacy, optimism, and
resiliency (Luthans, Avey & Patera, 2008), as well as, reflective leadership skills (Roglio & Light, 2009) can be
successfully and efficiently taught in business school classrooms. Clearly, business schools have the ability to teach
soft skills and provide complex higher-level pedagogy which is learner-focused (Forrest & Peterson, 2006). What
seems to be lacking is a clearly defined competency-based model which can influence pedagogy and inform
assessment.
Defining a Competency-based Model for Higher-level Learning
Garavalia et al. (2003) suggest that the selection of an assessment technique depends on the nature of the learning or
knowledge being assessed. They describe three distinct types of knowledge - declarative, procedural, and
conditional. Declarative knowledge is "knowing that" something is so and is typically assessed using multiple-
choice, fill in the blank or other types of tests. Procedural knowledge is "knowing how" to execute a skill or apply
concepts and principles to specific situations and is assessed through performance. If a student merely explains how
to do these activities, it is declarative in nature. Conditional knowledge is "knowing when and why" to utilize
declarative or procedural knowledge. Gardner (1993) states that "most individuals involved in education do not have
a clear sense of the nature of understanding and they do not know how to document that it has (or has not) been
achieved"(p. 187). He advocates that faculty should assess students in terms of relevant performance; for example,
students should be able to fill out their tax returns. He also suggests that these skills can only be “apprehended and
appreciated if they are performed by a student"(p. 190).
Many educators use learning cycles and styles as a way to break down complex tasks for developing assessment
(Harper & Harder, 2009). Several researchers have suggested a number of theories of learning styles that are
involved in experiential learning. The most popular seems to be that of Kolb (1984) who proposes that experiential
learning has several characteristics. He suggests learning is best conceived as a process; learning is continuous and
grounded in experience; learning is, by its very nature, full of tension and learners need reflection; and learning is a
holistic process of adaptation to the world. Kolb's learning theory sets out four distinct learning styles, which are
based on a cycle, and he has developed a survey to measure these (Kolb, 1999). However, it should be noted that the
empirical evidence underlying learning styles has been severely criticized; a recent review commissioned by the
Association for Psychological Science was unable to uncover any evidence that tailoring instruction to these
preferences actually produces any better learning outcomes (Pashler, McDaniel, Rohrer, & Bjork, 2009).
Guilkers et al. (2010) argue for the inclusion of all stakeholders (i.e., teachers, students, and employers) in
evaluation; however, student self-assessment does not predict cognitive or performance learning (Sitzmann, Ely,
Brown & Baur, 2010). Self-assessments of knowledge refer to the evaluations learners make about their current
knowledge levels or increases in their knowledge levels. Their meta-analysis revealed self-assessments are strongly
related to reactions and motivation and moderately related to self-efficacy. Consequently, self-assessment is a better
indicator of how learners feel about a course than how much they learned from it. Sitzmann et al. (2010) suggest that
self-assessments of knowledge have a critical role in the learning process as formative evaluation and that learners
benefit from having an accurate understanding of their knowledge levels. They suggest courses should be designed
to develop learners’ self-assessment skills. Learners should be provided with periodic feedback on their
performance in a course, should have the opportunity to practice self-assessing, and be given feedback on the
accuracy of their self-assessments. That being said, many accrediting agencies such as the AACSB, conclude that
self-assessments are only moderately related to actual knowledge levels, thus basing learning needs and subsequent
Elm Street Press All Rights Reserved © 2012 www.beijournal.com 77
course-related decisions on these ratings may lead organizations to overlook areas of knowledge deficiency. While
none of the professional accrediting bodies require assessment be based on any particular theory of learning, they do
seem to suggest a growing movement toward “higher” teaching activities and assessment methods.
Developing an Assessment Strategy
While AACSB schools of business are developing learning outcomes and direct assessment, we believe it is
important to move beyond knowledge retention outcomes and incorporate learning outcomes at the behavioral,
affective, and higher-level cognitive domains. This will further drive business school pedagogy to higher learning
levels. Garavalia et al. (2003) propose a three question approach to developing an assessment strategy. These
questions and their purpose are:
1) What is the task? Instructors need to map the task to understand the types of knowledge the student is
expected to use (declarative, procedural, & conditional) in accomplishing the task. Most business tasks
require all three levels of knowledge in some order.
2) At what level of cognitive processing should students demonstrate learning? This question involves
the level at which students should be able to think about the material. If the learning outcome is to
identify, then a case with multiple-choice questions might be appropriate. If the students must actually
solve problems, then assessment might be performance-based. This is often delineated by verbs in the
objective, such as “Understand,” “Identify,” or “Do.”
3) What is the appropriate context for the assessment? Context has to do with determining the format of
the assessment. Format can generally be divided into two types: selected and constructed response.
Performance is almost always constructed response. And consideration must be given to the time
feasibility of such assessments.
For most classroom business tasks, if the level of processing was delineated and the learning objectives stated, it
would be clear that most tasks are, or should be, performance-based. Developing appropriate assessments would be
easier for some tasks – financial or statistical problem solving; but many would be very difficult for others –
visioning or developing a positive communication culture in leadership. That being said, these challenges should
not be barriers in determining desired student-learning outcomes, or developing innovative assessment
methodologies. Assessment methodologies will be based on the outcomes desired and in the sense of “quality
improvement,” the assessment results will drive new curriculum and engaging pedagogy.
DISCUSSION
Colleges of business are in the business of producing students who can be leaders and managers, who are desired by
employers, and who can immediately provide value to the organization. Faculty should be in the business of
developing pedagogy to achieve these results; pedagogy that cuts across behavioral, affective, and higher level
cognitive skills. However, more research on how to effectively teach management and leadership competencies at
the behavioral, affective, and higher-order cognitive levels is needed. Faculty are often unfamiliar or uncomfortable
with teaching methods and evaluation tools regarding behavioral and affective learning domains, including student
behaviors, ethics, values, predispositions, and other personal attributes. Instructors often believe that performance
assessments can only carried out in real-life contexts. This creates the concerns that they are time consuming to
construct and use; they may require trained, or expert, assessors; and may require elaborate equipment, or situations,
to be performed. Furthermore, it can be time-consuming to implement these assessment which leads to frustration
and disillusionment with the process. Nevertheless, students are going to need additional instruction and mentoring
in these domains in order to be successful across their career progression (Rubin & Dierdorff, 2009).
While none of the accrediting bodies suggest assessment be based on any particular theory of learning, they do seem
to have several things in common: 1) they wish assessment to be direct, 2) that it be based on the ability to perform,
and 3) that the tasks be mapped in some way to differentiate “lower and higher” teaching activities and assessment
methods. For example, a closer look at the AACSB’s trend in assurance of learning supports the foreseeable need
for colleges of business to develop and assess behavioral, complex cognitive and affective competencies. In the
first self-study cycle for the current AACSB standards, the emphasis was on defining outcome goals and assessment
systems, while the second cycle has emphasized “closing the loop” through the improvement of curriculum. The
natural evolution will be for the third cycle to focus on higher order behavioral and affective competencies, rather
than lower level cognitive skills such as knowledge retention. A cursory review of the industry demands further
support of this presumption. The industry pressure on MBA programs to be more relevant is a direct indication of
the forthcoming migration of accrediting standards. The widening of the concept of competence from learning
78 Business Education Innovation Journal Volume 4 Number 1 June 2012
outcomes to having the ability “to do the job” is another. Finally, it is the reality in other professional education
accreditation standards. These bodies seem to have paved the way for schools of business. Couple the probable
AACSB trends with the continued industry emphasis on relevancy and the focus of professional accreditation
organizations, and it is apparent that the future of assessment lies in higher-level competency-based assessments.
And, that future begins now.
REFERENCES
Association to Advance Collegiate Schools of Business (AACSB). (2009). Eligibility procedures and accreditation standards for business
accreditation.
Alden, D. (1999). Experience with scripted role play in environmental economics. Journal of Economic Education, 30, 127–133. Allen, S. J., & Hartman, N. S. (2008). Leadership development: An exploration of sources of learning. SAM Advanced Management Journal,
71(1), 10-19, 62.
Anderson , J. R. (1976). Language, memory, and thought. Hillsdale, NJ: Erlbaum. Anderson, P. H. & Leigh Lawton, L (2009). Business simulations and cognitive learning developments, desires, and future directions. Simulation
& Gaming, 40 (2) April, 193-216.
Baglione, S. L. (2006). Role-playing a public relations crisis: Preparing business students for career challenges. Journal of Promotion Management, 12, 47–61.
Belasen, A. & Rufer, R. (2007). Building a competency-based MBA from the ground up: Curriculum design and program delivery. Best paper,
Academy of Management Proceedings. Philadelphia, 1-6. Belasen, A. T., & Fortunato, M. V (2000). A competency-based MBA rooted in the competing values framework: One institutional response to
failures of traditional management education. Academy of Management, Toronto. Belasen, A. T. Huppertz, J. W. (2009) , Designing and implementing a mission-driven, student-centered assessment program. The Journal of
Health Administration Education 26(1), 5-26.
Bennis W. G., & O’Toole, J. (2005) How business schools lost their way. Harvard Business Review. 83(5), 98-104. Bishop, J. H., Ferran, M., & Bishop, M. (2001). How external exit exams spur achievement. Educational Leadership, 58-63.Outcomes-based
Health Management Education 189.
Bloom B. S. (1956). Taxonomy of Educational Objectives, Handbook I: The Cognitive Domain. New York: David McKay Co Inc. Bloom, B. S., Englehart, M. D., Furst, E.J., Hill, W. H., & Krathwohl, D. R. (1956) Taxonomy of educational objectives, handbook 1: Cognitive
domain. New York: Longmans Green.
Boyatzis, R. E.; Stubbs, E. C.; Taylor, S. N.(2002). Learning cognitive and emotional intelligence competencies through graduate management education. Academy of Management Learning & Education, 1(2), 150-162.
Broderick, P. (2007). Business students reach for life lessons instead of the books: Sales pitches to trade shows are budding entrepreneurs’ real
world training ground. San Diego Business Journal, 28, 16–19. CAHME, 2011 http://www.cahme.org/Latest_News/Fall2012_Criteria_for_Accreditation_CirculatedDraft.pdf (accessed June 30, 2011).
Calhoun, J. G., Vincent, E. T., Calhoun, G. L., & Brandsen, L. E. (2008). Why competencies in graduate health management and policy
education? Journal of Health Administration Education, 25(1), 17-35. Calhoun, J. D., Wainio, J. A., Sinioris, M. E., Decker, M., Hearld, L. R. & Brandsen, L. E., (2009) Outcomes-based health management
education: Baseline findings from a national curriculum development demonstration project. The Journal of Health Administration
Education, Vol. 26, No. 3 Summer. Campbell, J. P., Olinger, D. G. & Colleagues (2007), Top-ten teaching and learning issues, Educause Quarterly, 30(3), 15-22.
Cannon, R., & Newble, D. (2000). A handbook for teachers in universities & colleges: A guide to improving teaching methods (4th ed.). London:
Kogan Page. Chia, R. & Holt, R. (2008). The Nature of knowledge in business schools. Academy of Management Learning and Education, 7, 471-486.
Dominguez, D. G., Teachout, M. & LaFrance, K. (2009) Using a client-based experiential learning approach to address CAHME criteria and
evaluate program effectiveness The Journal of Health Administration Education, Vol. 26, No. 3 Summer. Educational Testing Service (2008). MFT–Major Field Tests. http://www.ets.org/portal/site/ets/menuitem.1488512ecfd5b8849a77b13bc3921509/
?vgnextoid=f119af5e44df4010VgnVCM10000022f95190RCRD&vgnextchannel=86f346f1674f4010VgnVCM10000022f95190RCRD,
accessed February 28, 2009. Eyler, J. (2001). Creating your reflection map. New Directions for Higher Education, 114, 35–43.
Forrest, S.P., Peterson, T.O. (2006). It’s called andragogy. Academy of Management Learning and Education. 5 (1), 113-122.
Freidman & Frogner (2007). Are our graduates being provided with the right competencies? Findings from an early careerist skills survey, The Journal of Health Administration Education Fall 2010 27(4), 270 -296.
Garavalia, L. S.: Marken, P. A. & Sommi, R. W. (2003). Selecting appropriate assessment methods: Asking the right questions. American Journal
of Pharmaceutical Education, Vol. 66, Summer, 108-112.
Gardiner, LR; Corbitt, G; & Adams, SJ. (2010). Program assessment: Getting to a practical how-to model. Journal Of Education For Business,
85: 139–144.
Gardner, H. (1993). Multiple intelligences: The theory into practice, Harper Collins, New York NY, 187-188. Garman, A. N., & Johnson, M. P. (2006). Leadership competencies: An introduction. Journal of Healthcare Management, 51(1), 13-17.
Griffith, J. R. (2000, Spring) Towards evidence-based health administration education: The tasks ahead. The Journal of Health Administration
Education, 18(2), 263-269. Goretsky, M. E. (1984). Class projects as a form of instruction. Journal of Marketing Education, 6, 33–37.
Gujarathi, M. R., & McQuade, R. J. (2002). Service-learning in business schools: A case study in an intermediate accounting course. Journal of
Education for Business, 77, 144–150. Gulikers, J. M., Baartman, L. K., and Biemans, H.J. (2010). Facilitating evaluations of innovative, competence-based assessments: Creating
understanding and involving multiple stakeholders. Evaluation and Program Planning,33 (2), P120-127.

Elm Street Press All Rights Reserved © 2012 www.beijournal.com 79
Hand, L., O’Neil, M.,& Sanderson, P. (1996). Fostering deep and active learning through assessment. Accounting Education 5 (1), 103-119.
Harper, J. S., Harder, J.T. (2009). Assurance of learning in the MIS program. Decision Sciences Journal of Innovative Education. 7 (2), 489-. Harrow, A. (1972) A Taxonomy of Psychomotor Domain: A Guide for Developing Behavioral Objectives. New York: David McKay.
Jones, E. A. (2002a). Transforming the curriculum: Preparing students for a changing world. ASHE-ERIC Higher Education Report. San
Francisco: Jossey-Bass. Kelly, C., Tong, P. and Choi, B. (2010) A review of assessment of student learning programs at AACSB schools: A dean’s perspective Journal of
Education for Business, 85: 299-306.
Keys B, Wolfe J. (1988) Management education and development: Current issues and emerging trends. Journal of Management, 14,205-229. Kilpatrick, J., Dean, K.L., Kilpatrick, P. (2008). Philosophical concerns about interpreting AACSB assurance of learning standards. Journal of
Management Inquiry. 17 (3), 200-212.
Kolb, D. (1984). Experiential learning: experience as the source of learning and development. Englewood Cliffs, New Jersey: Prentice Hall. Kolb D. (1999). The Kolb Learning Style Inventory, Version 3. Boston: Hay Group.
Krathwohl, D. R., Bloom, B. S., & Masia, B. B. (1973). Taxonomy of Educational Objectives, the Classification of Educational Goals. Handbook
II: Affective Domain. New York: David McKay Co., Inc. Libin, A., Donnellan, J., Green, B., Groah, S., Lauderdale, M., Millo, Y., Shamloo, C., Spencer, R., Wellesley, C. (2010). Role-Playing
simulation as an educational tool for health care personnel: Developing an embedded assessment framework. Cyberpsychology, Behavior,
and Social Networking. 13 (2), 217-. Luthans, F., Avey, J.B., Patera, J.L. (2008). Experimental analysis of a web-based training intervention to develop positive psychological capital.
Academy of Management Learning and Education. 7 (2), 209-221.
McClelland, D. C. (1973). Testing for competence rather than for intelligence. American Psychologist, 28, 1-14. McClelland, D. C., Clark, R. A., & Lowell, E. I. (1976). The achievement motive, 2nd revised edition. John Wiley and Sons, Inc.
McIntyre, F.,Webb, D. J., & Hite, R. E. (2005). Service learning in the marketing curriculum: Faculty views and participation. Marketing
Education Review, 15(1), 35–45. Miles, M. P., Hazeldine, M. F., & Munilla, L. S. (2004). The 2003 AACSB accreditation standards and implications for business faculty: A short
note. Journal of Education for Business, 80, 29-34.
Mintzberg, H. (2004). Managers not MBAs: A hard look at the soft practice of managing and management development. San Francisco: Berrett-Koehler Publishers.
NAAB 2010 Conditions for Accreditation, The National Architectural Accrediting Board, Inc. April 2010 The National Architectural Accrediting Board, Inc. 1735 New York Avenue NW Washington, DC 20006
Narayanan, V.K., Fukami, C.V., Olk, P.M. (2010). Determinants of internship effectiveness: An exploratory model. Academy of Management
Learning and Education. 9 (1), 61-80. Nicholson, C., Barnett, S. T., & Dascher, P.E. (2005, Summer). Curriculum assessment in marketing programs: Current status and examination of
AACSB core standards at the program level. Marketing Education Review, 15, 13-26.
Pashler, H.; McDaniel, M.; Rohrer, D.; Bjork, R. (2009). "Learning styles: Concepts and evidence". Psychological Science in the Public Interest, 9: 105–119.
Pringle, C., & Michel, M. (2007). Assessment practices in AACSB accredited business schools. Journal of Education for Business, 82, 202-211.
Pringle, J.D., Nippak, P., & Isaac, W. (2010) Simulations as an instruction tool to teach healthcare change management: The influence of repeat simulation testing, gender and additional instructions on performance scores? The Journal of Health Administration Education, 27(1).
Raelin, J. (2006). Does action learning promote collaborative leadership?. Academy of Management Learning and Education. 6 (2), 152-168.
Richards-Wilson, S. (2002). Changing the way MBA programs do business: Lead or languish. Journal of Education for Business. 77 (5), 296-300.
Roglio, K., Light, G. (2009). Executive MBA programs: The development of the reflective executive. Academy of Management Learning and
Education. 9 (2), 156-173. Rubin, R. S. & Dierdorff, E. C. (2009,). How relevant is the MBA? Assessing the alignment of required curricula and required managerial
competencies. Academy of Management Learning and Education, 8(2), 208-224.
Salas, E., Wildman, J. L.; Piccolo, R. F. (2009). Using simulation-based training to enhance management education. Academy of Management Learning & Education, 8 (4), 559-573.
Shaftel, J., & Shaftel, T. L. (2007). Educational assessment and the AACSB 2007. Issues in Accounting Education, 22, 215–232.
Shewchuk, R.M., O’Connor, S.J., & Fine, D.J. (2006). Bridging the gap: Academic and practitioner perspectives to identify early career competencies needed in healthcare management. Journal of Health Administration Education, 23(4), 368-392.
Sitzmann, T; Ely, K.; Brown, KG; & Baur, KN. (2010) Self-assessment of knowledge: A cognitive learning of affective measure? Academy of
Management Learning & Education, 9 (2), 169-191. Spencer, SM and Spencer, LM (1993) Competence at Work: Models for Superior Performance, New York: Wiley & Sons.
Stivers, B., & Phillips, J. (2009). Assessment of student learning: a fast-track experience. Journal of Education for Business, 258-262.
Stokes, L., King, M. & Rosetti, J.L. (2010). Form over substance: Learning objectives in the business core. Contemporary Issues in Education Research. 3 (11), 11-.
Thomas, J. C. (2002). Active learning for organizational development students: The masterpiece project. Organization Development Journal,
20(3), 8–15. Umbach, P. D., & Wawrzynski, M. (2005). Faculty do matter: The role of college faculty in student learning and engagement. Research in Higher
Education, 46, 153–184.
Volkwein, J. F., Lattuca, L. R., Harper, B. J., & Domingo, R. J. (2007).Measuring the impact of professional accreditation on student experiences and learning outcomes. Research in Higher Education, 48, 251–282.
(2002, September 17) Wall Street Journal.
Weldy, T. G and Turnipseed, D.L. (2010) Assessing and improving learning in business schools: Direct and indirect measures of learning. Journal of Education for Business, 85, 268–273.
Wren, D.A.,; Halbesleben, J. R. & Buckley, M. R. (2007). The theory-application balance in management pedagogy: A longitudinal update.
Academy of Management Learning & education, 6(4), 484-492. Young, M. R. (2002). Experiential learning = hands-on + minds-on. Marketing Education Review, 12(1), 43–51.
80 Business Education Innovation Journal Volume 4 Number 1 June 2012
LEGO® Demonstrations for Understanding the Implications of Changing
Work Practices on Human Resource Management
Sherry K. Mills, New Mexico State University – Las Cruces, New Mexico, USA
Phil Benson, New Mexico State University – Las Cruces, New Mexico, USA
Cathleen Burns, University of Colorado at Boulder – Boulder, Colorado, USA
Janice L. Ammons, Quinnipiac University – Hamden, Connecticut, USA
ABSTRACT
This paper discusses an interactive approach using LEGO ® models in experiential exercises to help students learn
the interrelationship between production methods and human resource (HR) management. By enhancing student
involvement, these demonstrations provide tangible illustrations of the impact of modern, modular production
systems on HR issues, which deepen the students’ theoretical understanding of HR management. Implications for
education are discussed, and handouts and suggested questions are provided.
Keywords: Demonstration, active learning, human resource management, lean production, mass production,
LEGO®
INTRODUCTION
As manufacturing companies have introduced a number of innovative practices into the workplace (Delbridge, 2007;
Ichniowski, Kochan, Levine, Olson, & Strauss, 1996; Vastag & Montagon, 2001), a relevant question is how to best
portray the implications of workplace changes to new and prospective managers. All of these innovations may
potentially improve productivity, reduce costs, and increase employee satisfaction. However, these practices are
often difficult for college students to comprehend because they have had little experience in manufacturing settings
or professional work environments.
In an attempt to increase student engagement, and to increase the perceived relevance of classroom activities,
increasing numbers of faculty have advanced a variety of active learning methods to illustrate key learning points
(Cyrs, 1994). Active learning provides a broad range of benefits including providing a bridge between theory and
practice, increased motivation to learn, increased retention of concepts, and developing empathy (Meyers & Jones,
1993). Experiential learning activities can facilitate learning about operations management concepts and processes
(Ashenbaum, 2008, 2010; Dhumal, 2008; Piercy, 2010; & Elbadawi, 2010) and marketing practices (Frontczak,
2000; Greene, 2011; and Minch, 2007).
Demonstrations place students in artificially-constructed environments that are sufficiently realistic to promote
learning and retention of that learning (Meyers & Jones, 1993). Many educators use LEGO building materials in
business demonstrations to help students learn abstract concepts or complex processes. Demonstrations using
LEGOs help students understand accounting (Burns, 1997; Mastilak, 2012; Roth, 2005), operations management
and manufacturing processes (Burns, 1997; Fish, 2005, 2006; Freeman, 2003; Lindsey, 2010; Paxton, 2003; Roth,
2005; Snider, 2009), organization behavior (Coye, 2009), and economics (Ariely, 2008). These demonstrations
provide concrete learning experiences for students to understand abstract business concepts and can be adapted so
that students can be better prepared to discuss the impact of these practices on employees and the company.
The purpose of this paper is to describe demonstrations as experiential in-class exercises that can be used to
illustrate the changing nature of work and highlight potential improvements to existing human resource (HR)
management techniques. We are not aware of any LEGO demonstrations that have been used to teach human
resource management. The goal is to help students look at work practices and business processes and identify
implications (and perhaps changes to) human resource management practices. Specifically, after the demonstrations,
students should be better able to discuss the following types of issues:
1. Will the change in a business technology (in the broadest sense) or process make some jobs
unnecessary? Why? Does the change necessitate any additional job positions or will new

Elm Street Press All Rights Reserved © 2012 www.beijournal.com 81
responsibilities be assumed by existing positions? What changes in training or compensation will be
necessary?
2. Can staff be used more flexibly to provide incentives that will move business strategy forward?
3. What performance benchmarks should be used as a basis for rewards or compensation?
4. What kinds of data will show the how, why, and where that allow employees to guide their own
continuous improvement initiatives?
The paper is organized as follows. First, we discuss the evolution of management principles and their impact on
human resource management. Second, we illustrate two demonstrations that jointly provide the context for learning
about the workplace and the impact of changes in the workplace on employees and human resource management.
We offer instructions and handouts to assist instructors in the implementation of this innovation. We conclude with a
discussion of the role of demonstrations as an active learning technique to help students learn about HR issues in
business.
HUMAN RESOURCE MANAGEMENT AND CHANGES IN THE WORKPLACE
The shift to lean manufacturing has had a variety of implications for management in general and HR and operations
management in particular. In an increasingly global economy, advanced economies are under pressure for highly
productive work methods, as this is the only way to compete with those nations that have extremely low labor costs
(see Delbridge, 2007).
What has emerged from these pressures is a system best known as “lean production,” a set of practices that are often
traced to the efforts of Toyota in automobile manufacturing (Womack, Jones & Roos, 2007). Essentially, such
manufacturing models emphasize team-based work, empowerment of employees within those teams, and the
necessary workplace changes to support those changes. When such changes are made, HR managers often “bundle”
human resource management practices to align those practices with operations to maximize efficiencies. Such
practices are often referred to as “high performance work systems” (HPWS), and have been demonstrated in
numerous contexts. Early examples of this approach can be found in the seminal work of Ichniowsi, et al. (1995,
1997), as well as the work of Arthur (1994), Becker & Gerhart (1996), and MacDuffie (1995).
Such practices have been demonstrated to work in various settings and cultures. While much of the premise of
HPWS can be traced to the Hawthorne Studies, and to the seminal work of the Tavistock Institute, after substantial
development in Japan the practices have moved from Toyota to land squarely in the USA (Danford, 2003). Still, the
practices have also been shown to have international relevance, such as the study by Vastag & Montabon (2001)
which shows the relevance of such practices to the USA, and both Western and Eastern Europe.
Essentially, these practices result in systems of manufacturing that break from traditional Tayloristic or Fordist
approaches to reflect mechanistic models of work organization (Morgan, 1997). Morgan notes that one powerful
view of organizations in the early years of industrialization was the mechanical view; this model of organization is
directly tied to traditional manufacturing methods and the resultant HR practices which must be replaced in lean
production systems. Thus, such changes in manufacturing methods cannot be expected to take form in an
organization without a serious change in the way the HR management function is managed and developed. A team-
based model requires much more emphasis on issues such as cross-training (and the skill-based pay systems that
result), autonomy of the group or team (and the decision making skills and ability to resolve conflicts that ensue),
and other such functions. In short, a change of this magnitude requires a shift in the basic operations of the
organization, including all aspects of management.
We suggest in this paper that certain experiential exercises can be used to demonstrate the need for new models of
HR management. These exercises can be used with college students, with practicing managers, with production
workers, or with other interested groups. Our purpose here is to outline the use of such active learning
demonstrations.
DEMONSTRATING HR IMPLICATIONS OF INNOVATIVE WORKPLACE PRACTICES
The demonstrations presented in this section are active learning experiences that help students personally experience
workplace practices in a production environment. The learning outcome for the HR demonstration is that students

82 Business Education Innovation Journal Volume 4 Number 1 June 2012
describe the changes in human resource management necessitated by changes in a method, technology, or practice.
Students work in a team, playing various roles, including assembly, materials handling, inventory control, and
quality control. Operating in a predefined workplace setting, students build a predetermined number of vehicles
within a certain time. While the demonstration is set in a manufacturing setting, instructors can help students
extend their learning from the demonstration to a service application such as processing mortgages or insurance
claims. A debriefing session follows in which students discuss the strengths and weaknesses of the workplace setting
and consider how management could improve the processes.
The design and preparation for the demonstration are important. The instructor must select a LEGO vehicle and
design the manufacturing context. Exhibit 1 lists the materials needed and the tasks necessary to complete this
phase, while the picture in Exhibit 7 illustrates clustering the pictorial instructions as a way to create the assembly
departments and raw materials needed by each department during the production process.
Mass production demonstration Our demonstration of the traditional, mass production method, which operates in a bureaucratic and classical
management style, uses a linear batch process work method in which batches of three vehicles move through three
sequential subassembly departments to build the vehicle. Each department has tightly defined tasks and must wait to
receive materials or partially completed vehicles from the previous department. The supervisor is responsible for
overseeing the manufacturing process. Workers are hired based on the skills defined from job descriptions for the
position held. Workers are trained to do their job and are rewarded on a piece rate basis. Positions for materials
inventory control, materials handler, assembly worker, assembly supervisor, and finished goods inventory control
also exist in the demonstration.
Before the demonstration class begins, the instructor will arrange tables and set up the inventory and assembly
department workstations. Exhibit 1 provides a list of materials and tasks performed by the instructor before the
demonstration begins. Exhibit 3 and 4 present job descriptions for the roles of student participants in the mass and
lean production cycles, respectively. Exhibit 5 is an observation sheet that is completed by students observing the
demonstration.
A portion of the students in the class participate in the demonstration, while the other students become the audience
that observes and makes comments about the process. The best way for the audience to observe the process would
be look down on the demonstration from tiered rows of seats. Alternatively, the class could be divided into teams
and each team could complete the learning activities, fill out the observation sheet, and then discuss the process.
As shown in Exhibit 8, the production line is created at a table placed closer to the audience. Assembly workers,
representing each assembly departments, sit next to each other in sequential order. Pictorial instructions for the
assembly of the parts and requisition forms to acquire materials are placed at each station.
At the beginning of class, the instructor places students in their roles and spends about 5 minutes explaining the
assembly process and the various roles and responsibilities of the participants. The instructor also includes a review
the HR aspects of the mass production process as summarized in Exhibit 5. The instructor may highlight information
about HR management and changes in the workplace as presented earlier in this paper, as well as in Exhibit 2.
The instructor, as assembly supervisor, starts the production process by tasking student participants to complete ten
perfect vehicles in ten minutes. Materials handlers move the cups of parts in batches of three from the materials
inventory control person to the production floor afterthe assembly worker for the respective department gives the
material handler a completed materials’ requisition form. Each department assembly worker completes the
department’s subassembly, attaches it to the partially completed vehicle and then moves the batch to the next
department. The assembly worker in the last department sends the completed vehicles, via the materials handler, to
quality control. Quality control inspects for quality and prepares a report for the debriefing session. The assembly
supervisor oversees the process and will be contacted by any assembly worker when a problem with parts occurs.
A 20-minute debriefing session follows in which the supervisor (instructor) oversees the presentation of the
performance results (cycle time, productivity, and yield) and the quality control report. The instructor reinforces
some of the human resource factors and then asks students to work in small groups to identify issues that might arise
if the workers were cross trained to work with a team to build the vehicles.

Elm Street Press All Rights Reserved © 2012 www.beijournal.com 83
Lean production demonstration While the students are meeting in groups, the sequential production line is transformed into a manufacturing work
cell. A cellular work method allows for concurrent production by a team of cross-trained workers. Once again, the
instructor will replace some of the good parts in the cups with bad parts in order to create problems in the production
process that will be addressed by assembly workers during production and discussed during the debriefing session.
Alternatively, all parts for each department can be clustered together in sections of a pre-segmented Styrofoam plate
to represent a complete parts vehicle kit. Each department only completes their work and then moves the kit to the
next department. The Styrofoam kits can act as a kanban signal and limit the amount of work-in-process inventory to
the single kit. This is helpful when there are production problems and can reduce the cost of rework.
The instructor begins the second demonstration by discussing the changes in technology and organizational structure
(Exhibit 2). Observation sheets (Exhibit 5) allow the students in the audience to take notes during the simulation
about the impact of workplace changes on the workers. Half of the workers are now in the audience rather than on
the production line and new roles exist for the remaining production workers. Students are told that the workers are
in a team and empowered to complete the work without supervision. A kanban system provides signals that
materials are needed. Participants are instructed to complete 10 vehicles in 10 minutes.
When the instructor signals the production process to begin, workers collectively complete one vehicle at a time and
are responsible for inspecting for quality throughout the process. As problems arise during the production process,
the workers stop to discuss the problem and plan a solution. As the completed vehicle moves out of the
manufacturing cell, materials for a new vehicle are delivered from the suppliers. After the demonstration, students
work in small groups to finish recording their observations. A debriefing session follows in which the instructor
oversees the presentation of the performance results (cycle time, productivity, and yield), the quality control report,
and facilitates a discussion about the impact of technology changes on HR management.
HR Demonstration Discussion Points
As the lean production demonstration unfolds, students will begin to see a number of HR factors affected by the
changes in technology. The most obvious change is the drastic reduction in the number of workers and the resulting
performance expectations on the remaining workers. During the debriefing session, the following points should be
made: (a) Workers must be multi-skilled and team-oriented because the workers are reciprocally interdependent
rather than sequentially independent; (b) workers must be more adaptable and flexible; (c) workers are hired based
on broad competencies rather than specific skills; (d) rewards will be based on team performance rather than
individual performance so there is less emphasis on a limited job task or duty; and (5) career progression is the result
of broad individual expertise, positive team interactions, and high quality production. Exhibit 6 provides additional
questions for in class discussions, exam questions, and homework assignments.
Instructors may direct discussions to deepen or expand student awareness of other HR issues. For example, Lawler
(2000) pointed out that pay for team performance is in part a function of the nature of the type of team involved.
When production methods are changed to a team-centered approach as described above, the resulting team is a
“work team” in Lawler’s terminology. These teams are best rewarded on the basis of learning and development,
often involving cross training so that all aspects of the work can be performed efficiently within the group (Lawler,
2000). While various kinds of teams exist, and different reward structures may be appropriate to each, some
traditional methods (e.g., rewards for individual suggestions, Lawler 2000, p. 205) are not appropriate in modern
production settings. This applies to service sector operations as well as manufacturing sector operations. For
example, the Scanlon plan is a reward system that has been traditionally associated with unionized manufacturing
settings, but this method of gainsharing has been recently shown to apply in a service sector organization,
specifically a large retail organization (Scott, Floyd, Benson, & Bishop, 2002).
One aspect of HRM that we have not specifically investigated with this experiential activity is to explore the nature
of organizational reward systems. When work systems are changed in significant ways, changes in reward structures
need to follow to ensure organizational functioning (see Heneman, Ledford, & Gresham, 2002). One could easily set
up reward structures using M&M candy or similar rewards, and base the payout on differential aspects of
performance. While individual rewards work in traditional manufacturing, students would quickly realize that
group-based incentives are the only feasible incentives in team-based lean production systems. As a note, one reason
84 Business Education Innovation Journal Volume 4 Number 1 June 2012
we have not yet looked at this aspect of management is because students tend to be intrinsically motivated in this
exercise; however, this does not preclude the use of reward systems.
As a possible extension, instructors may address the issue that many middle-management employees are being
replaced by work teams operating on a self-managing basis to empower workers and decrease supervisory overhead
costs. Members of these work teams must then confront questions such as: What form of pay system and selection
systems to use? Will rewards be based on the competency of its team members or on specific tasks they perform?
What broad competencies or specific skills are needed in future workers? Who, or how many individuals, play the
role of “expert” on the team? What happens to displaced middle management employees? Suddenly, every
business student may potentially face these decisions, and an understanding of the HR issues become quite relevant.
Assessment of Lego Demonstrations as an Active Learning Experience
To evaluate students understanding of the implications of changing work practices on HR management, students
submitted answers to the handout shown in Exhibit 5 at the end of the demonstration and answered questions over
the content material on the next exam. To assess the value of the learning activity, students answered the following
feedback question: “What did you learn from today’s class?” at the end of class. In a recent class of 35 students,
48% realized that HR managers need to understand how changes in technology affect the tasks performed by
assembly workers. Fifteen percent commented on the need to change training activities and reward structures to
adapt to the changes in technology, while about 10% saw the need to see the job tasks in order to better design
formal job descriptions.
Then, at the end of the semester students completed a course survey that included questions regarding the usefulness
of various materials, activities and assignments in the learning process. In a recent semester with 35 students, the
mean scores of students’ responses (using a Likert scale: 1 = very low level of usefulness and 7 = very high level of
usefulness) were textbooks materials (5.35), course lectures (6.0) and LEGO demonstration (6.35). Students
recognized the importance of course lectures and the LEGO demonstrations, as these were tied more closely to
course examinations.
CONCLUSION
This paper has discussed how demonstrations using LEGO building materials can be manipulated to achieve
desired HR learning outcomes. For example, job descriptions, work scheduling, downsizing, the role of supervision,
and alternative pay for performance strategies are some of the HR learning outcomes that can result from the use of
demonstrations. Planning the demonstration and focusing the debriefing sessions on key learning objectives are the
responsibilities of the instructor.
Students who have experienced these LEGO® demonstrations can identify the lessons learned from the
manufacturing production line and can discuss the relevance of those lessons in the settings of universities, health
care organizations, and other service businesses. Although LEGO® demonstrations have been used in a variety of
business contexts, this paper suggests how LEGO® demonstrations could be used to accomplish learning goals in a
human resource management course. Students also benefit from a team-teaching environment where various cross-
functional faculty experts share how their learning goals are demonstrated in the participative LEGO® experiences.
Even students with limited or no work experience leave the class with a powerful shared experience that anchors
theoretical text material in an active, participative student experience. In our experience, achievement of desired
learning outcomes and retention of that learning surpasses what we can typically generate from lectures. In the same
way that organizations need new HR practices to mirror new production and service environments, academe needs
to create active learning experiences that will more greatly benefit our students and the firms who eventually hire
them.

Elm Street Press All Rights Reserved © 2012 www.beijournal.com 85
REFERENCES
Ariely, D., Kamenica, E. & Prelec, D. (2008). Man’s search for meaning: The case of LEGOs. Journal of Economic Behavior & Organization. V.
67, pp 671-677. Arthur, J. (1994). Effects of human resource management systems on manufacturing performance and turnover. Academy of Management
Journal, V. 37, pp 670-687. Ashenbaum, B. (2008). The global sourcing and logistics exercise: A group exercise to demonstrate basic global supply chain principles.
Decision Sciences Journal of Innovative Education, V.6, No. 2, pp 355-365.
Ashenbaum, B. (2010). The twenty-minute just-in-time exercise. Decision Sciences Journal of Innovative Education, V. 8, No. 1
pp 269-274. Baron, J. N., & Kreps, D. M. (1999). Strategic Human Resources: Frameworks for General Managers. Hoboken, NJ, John Wiley & Sons.
Becker, B. & Gerhart, B. (1996). The impact of human resource management on organizational performance: Progress and prospects.
Academy of Management Journal, V. 39, pp 779-801. Burns, C, & Mills, S. (1997). Bringing the factory into the classroom. Journal of Accountancy,V.183, No. 1, pp 56-60.
http://www.aicpa.org/pubs/jofa/jan97/factory.htm
Coye, R. (2009). Becoming a better observer. Decision Sciences Journal of Innovative Education, V. 7, No. 2, pp 511-514. Cyrs, T. (1994). Essential Skills for College Teaching: An Instructional Systems Approach. Las Cruces, NM: The Center for Educational
Development at New Mexico State University.
Danford, A. (2003). Workers, unions and the high performance workplace. Work, Employment and Society, V. 17, No. 3, pp 569-573. Delbridge, R. (2007). HRM and contemporary manufacturing. In P. Boxall, J. Purcell, & P. Wright (Eds.), The Oxford handbook of human
resource management. Oxford, UK: Oxford University Press, pp 405-427. Dhumal, P., Sundararaghavan, P., & Nandkeolyar, U. (2008). Coca-Cola: An innovative approach to teaching inventory management in a supply
chain. Decision Sciences Journal of Innovative Education, V. 6, No. 2, pp 265-285.
Elbadawi, I., McWilliams, D. & Tetteh, E. (2010). Enhancing lean manufacturing learning experience through hands-on simulation. Simulation & Gaming, V. 41, No. 4, pp 537-552.
Fish, L. (2005). Teaching assembly line balancing: A mini-demonstration with DUPLAR blocks or “The Running of the Dogs”. Decision
Sciences Journal of Innovative Education, V. 3, No. 1, pp 169-274. Fish, L. (2006). Push versus pull mini-demonstration: A continuation of the mini-demonstration with DUPLAR blocks or “The running of the
dogs – part II”. Decision Sciences Journal of Innovative Education, V. 4, No. 2, pp 169-274.
Freeman, L. (2003). Simulation and role playing with LEGOR blocks. Journal of Information Systems Education, V. 14, No. 2, pp 137-144. Frontczak, N. (2003). Experiential learning in marketing education. Journal of Marketing Education, V. 22, No. 1, pp 3-4.
Greene, H. (2011). Freshmen marketing: A first-year experience with experiential learning. Marketing Education Review, V. 2, No 1, pp 79-87.
Heneman, R.L., Ledford, G.E., Jr., & Gresham, M.T. (2002). The changing nature of work and its effects on compensation design and delivery. In R. L. Heneman (Ed.), Strategic reward management: Design, implementation, and evaluation, pp. 35-73. Greenwich, CT: Information
Age Publishing.
Ichniowski, C., Shaw, K., & Prennushi, G. (1997). The effects of human resource management practices on productivity: A study of steel finishing lines. American Economic Review, V. 87, pp 291-313.
Lawler, E. E., III (2000). Rewarding Excellence: Pay Strategies for the New Economy. San Francisco, CA: Jossey-Bass.
Lindsey, M., & Neeley, C. (2010). Building learning curve and script theory knowledge with LEGO. Marketing Education Review, V. 20, No. 1, pp 71-75.
MacDuffie, J. (1995). Human resource bundles and manufacturing performance: Organizational logic and flexible production systems in the
world auto industry. Industrial and Labor Relations Review, V. 48, No. 2, pp 197-221. Mastilak, C. (2012). First-day strategies for millennial students in introductory accounting courses: It's all fun and games until something gets
learned. Journal of Education for Business, V. 384, No. 1, pp 48-51.
Meyers, C & Jones, T. (1993). Promoting Active Learning: Strategies for the College Classroom. San Francisco, CA: Jossey-Bass. Minch, R. & Tabor, S. (2007). Achieve active learning with a student-run internet service provider business: The case of BSU.net. Decision
Sciences Journal of Innovative Education, V. 5, No. 1, pp 179-182.
Morgan, G. (1997). Images of organization. Thousand Oaks, CA: Sage Publications. Paxton, J. (2003). A short simple learning curve classroom exercise. Decision Sciences Journal of Innovative Education, V. 1, No. 2, pp 303-307.
Piercy, N. (2010). Experiential learning: The case of the production game. Decision Sciences Journal of Innovative Education, V. 8, No. 1, pp
275-279. Roth, H. (2005). An active learning exercise illustrating a manufacturing process in a cost management class. Decision Sciences Journal of
Innovative Education, V. 3, No. 2, pp 367-374.
Scott, K. D., Floyd, J., Benson, P. G., & Bishop, J. W. (2002). The Impact of the Scanlon Plan on Retail Store Performance. World at Work
Journal, V. 11, No. 3, pp 25-31.
Snider, B. & J. Eliasson. (2009). Push versus pull and mass customization: A LEGO inukshuk demonstration. Decision Sciences Journal of
Innovative Education, V. 7, No. 2, pp 411-416. Swanson, L. (2008). The lean lunch. Decisions Science Journal of Innovative Education, V. 6, No. 1, pp 153-157.
Vastag, G., & Montabon, F. (2001). Linkages among manufacturing concepts, inventories, delivery service and competitiveness.”
International Journal of Production Economics, V. 71, pp 195-204.

86 Business Education Innovation Journal Volume 4 Number 1 June 2012
Exhibit 1: Instruction to Design, Prepare, Setup the Demonstration
Design/preparation phase:
Materials needed: LEGO® vehicle with less than 75 parts to simplify the demonstration, additional LEGO® parts,
instructions for each department, paper cups, Styrofoam trays, quart-size plastic bags
Tasks:
1. Create assembly departments by using the instruction sheet that comes with the LEGO®s. Cluster the pictures
to create an assembly department. The demonstration works best using three to five assembly departments.
2. Place into small paper cups the Lego pieces that will be added in the respective assembly department for the
mass production demonstration. For the lean production demonstration, place the Lego pieces onto Styrofoam
trays.
3. Create materials requisitions forms for each department in the mass production demonstration. For example, if
ten vehicles will be manufactured through three departments in the demonstration, then each department
requires ten 2” by 2” cards with the department number, which will signal the need for materials.
4. Select additional LEGO® pieces to act as “bad” parts. These pieces can simply be the same part in a different
color (represents a defective part) or a different part completely (represents problems pulling parts from parts
inventory)
5. Place filled cups and trays, instructions, requisition forms, quart-size plastic bags, and application tools in a
storage box to facilitate movement to the classroom.
Setup phase for the classroom demonstration:
Materials needed: All items collected in the design/preparation phase, handouts for students
Tasks:
1. Create a production area and an inventory storage area by creating two rows of tables. Inventory table will be
behind production line tables.
2. Place inventory cups on the inventory table.
3. Replace some of the good parts in the cups with bad parts in order to create problems in the production process
that can be discussed during the debriefing session (optional).
4. Place LEGO® instructions, a prototype of the vehicle after completion in that department, indirect materials
application tool, if required, and instructions for student participation (Exhibits 2 and 3) at each assembly
department station.
5. Distribute handout on HR and Work Methods: Mass and Lean Production to all students (Exhibit 2).

Elm Street Press All Rights Reserved © 2012 www.beijournal.com 87
Exhibit 2: Student Handout: HR and Work Methods: Mass and Lean Production
The Woodlands Factory is a typical mass production assembly operation for dune buggies sold to enthusiasts
throughout the United States. Recently, an increased number of customers have complained about the quality of the
vehicles. An analysis of the production process shows that the traditional (mass) production approach is not
appropriate. Management wants you to view the new, lean production process and consider the impact of this
change on the human resources involved in the production process.
Mass production
Product is completed in batches of three in a sequential manufacturing process (see diagram below). Specific tasks
have been designed and workers have been hired based on matching their qualifications to the job descriptions.
When necessary, workers are trained to develop skills for their job. Workers are rewarded by piece rate and are paid
based on individual performance. Workers report directly to supervisor and are restricted to performing only the
tasks assigned. A bureaucratic organizational structure exists in that all workers report to the assembly supervisor.
Lean production
The workers are in a team and
empowered to complete the work
without supervision. A kanban
system provides signals that
materials are needed. Workers
collectively complete one vehicle
at a time and are responsible
for inspecting for quality
throughout the process. As the
completed vehicle moves out of
the manufacturing cell, materials
or a new vehicle are delivered
from the suppliers.
Dept 1 Assembly
Worker
Dept 2 Assembly
Worker
Dept 3 Assembly
Worker
Material Handler
Material Handler
Materials Inventory
Control
Quality Control
Assembly Supervisor
Material Handler
Finished Goods Inventory Control
Dept 1 Assembly
Worker
Dept 2 Assembly
Worker
Dept 3 Assembly
Worker
Material Handler
Material Handler
Materials Inventory
Control
Quality Control
Assembly Supervisor
Material Handler
Finished Goods Inventory Control
Cell
Raw Materials
Finished Goods
Worker Worker
Worker
Cell
Raw Materials
Finished Goods
Worker Worker
Worker

88 Business Education Innovation Journal Volume 4 Number 1 June 2012
Exhibit 3: Instructions for Student Participation: HR and Work Methods (Mass Production)
Listed below are the different roles you may be asked to play in the Woodlands Factory mass production cycle.
Please locate your role and follow the instructions that are associated with your role.
Inventory Control Person (1 person)
1. You sit behind a table located behind the production area. Your job is to issue parts in batches of three to a
material handler.
2. You need to check that the parts’ requisition forms are filled out correctly for batches of three because this
information is used in six different inventory reports that are created each month by the accounting department
for plant management.
Quality Control Person (1 person)
1. You sit next to inventory control and wait for material handler to bring you completed production from the final
assembly department.
2. You need to carefully check the completed product against the pictorial assembly instructions because it is a
well-known fact that the assembly workers work too quickly to create quality production.
3. At the completion of the production cycle, you will make an oral report to the group about how many perfect
products were created during the completed the allotted period. To the extent possible, explain any
imperfections with the completed products.
Assembly Workers (3 people)
1. You will be briefly trained by the supervisor on how to complete one sub-assembly task and attach it to the
partially completed assembly from the previous department (except the first department that begins production).
2. You need to work very quickly because you are paid on a piece-rate basis.
3. When you need parts, call for the material handler and give the handler your purchase requisition. When you
complete a batch of three assemblies, pass the batch to the next department.
4. You are not allowed to collaborate with other workers. If you complete all the work in your department, you sit
and rest.
Material Handling (3 people)
1. You stand and wait for your assigned assembly worker to call you and give you a parts’ requisition form.
2. You deliver the parts’ requisition form, one at a time, to the inventory control person who will give you the
appropriate number of parts’ cups to take back to the assembly worker.
3. When you are not busy, you stand and wait for the next call.
Assembly Supervisor (1 person)
1. You make sure everyone is acting out their roles properly.
2. If an assembly worker needs a spare part, you locate the part and deliver it to the assembly worker.
3. If the equipment breaks down, you locate a maintenance worker to fix equipment or fix it yourself.
4. If you have time, you check the completed parts’ requisition forms to ensure accuracy.

Elm Street Press All Rights Reserved © 2012 www.beijournal.com 89
Exhibit 4: Instructions for Student Participation: HR and Work Methods (Lean production)
Listed below are the different roles you may be asked to play in the Woodlands Factory lean production cycle.
Please locate your role and follow the instructions that are associated with your role.
Inventory Control Person (1 person)
1. You sit at a table placed next to the manufacturing cell table. Your job is to distribute parts to the manufacturing
cell when the completed vehicle is moved to quality control.
2. You need to inspect the parts for poor quality, incorrect quantities, or incorrect parts for the vehicle.
Quality Control Person (1 person)
1. You sit next to the manufacturing cell table to receive the completed vehicle and wait for one of the assembly
workers in the manufacturing cell to bring you completed production.
2. You need to carefully check the completed vehicle against the pictorial assembly instructions to ensure that the
team of assembly workers identified and corrected all quality problems.
3. At the completion of the production cycle, you will make an oral report to the group about how many perfect
products were created during the completed the allotted period. To the extent possible, explain any
imperfections with the completed products.
Assembly Workers (3 people)
1. You will work in a team of three in a manufacturing cell exclusively dedicated to the vehicle. You have been
cross trained to perform all tasks required to build the vehicle, but you will be primarily responsible for the
assembly tasks performed in the first demonstration.
2. You need to work very quickly because you are paid on a piece-rate basis.
3. As your teams complete a vehicle and prepares to move it to quality control, you signal the suppliers with a
card to request parts for the next vehicle. You will begin the next vehicle once the completed vehicle is removed
from the manufacturing cell.
4. You collaborate with other workers. You are empowered to request, build, and inspect parts and vehicles. If you
find any defective parts or incorrectly assembled parts you will notify your team mates to stop production. You
will discuss the problem with your team mates and decide on the corrections. Once corrections are made,
production will resume. If you have completed your tasks and another teammate needs help, you will help.
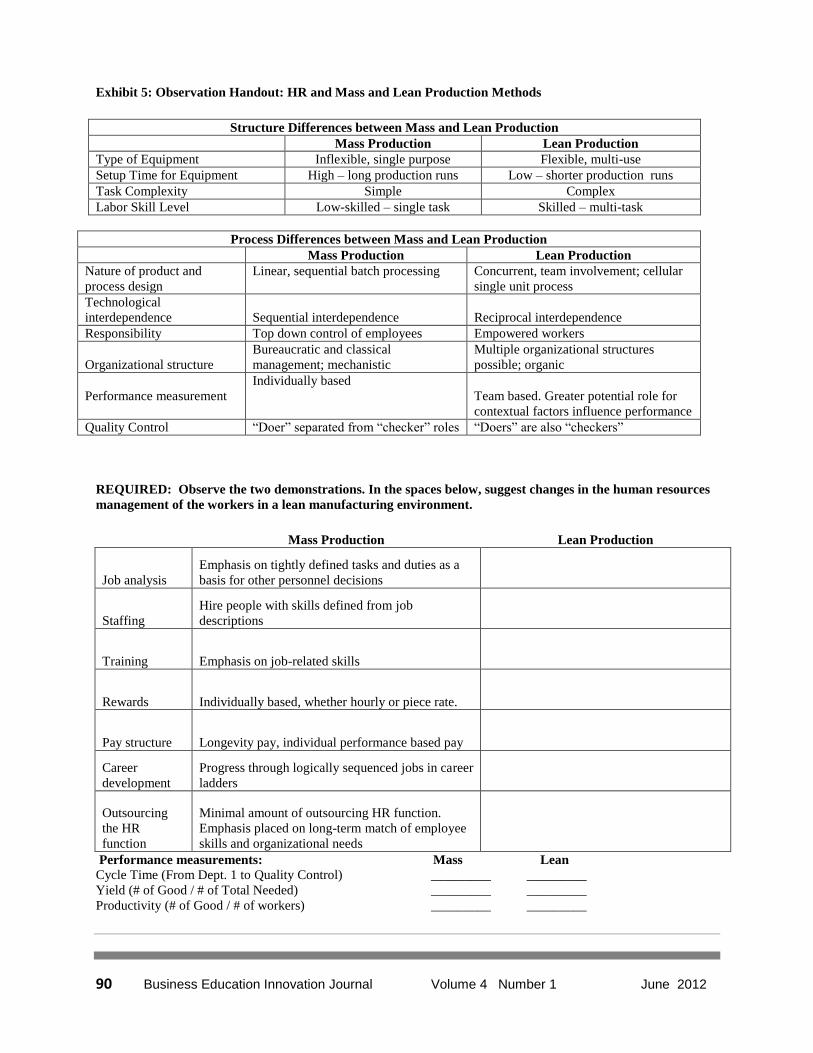
90 Business Education Innovation Journal Volume 4 Number 1 June 2012
Exhibit 5: Observation Handout: HR and Mass and Lean Production Methods
Structure Differences between Mass and Lean Production
Mass Production Lean Production
Type of Equipment Inflexible, single purpose Flexible, multi-use
Setup Time for Equipment High – long production runs Low – shorter production runs
Task Complexity Simple Complex
Labor Skill Level Low-skilled – single task Skilled – multi-task
Process Differences between Mass and Lean Production
Mass Production Lean Production
Nature of product and
process design
Linear, sequential batch processing Concurrent, team involvement; cellular
single unit process
Technological
interdependence Sequential interdependence Reciprocal interdependence
Responsibility Top down control of employees Empowered workers
Organizational structure
Bureaucratic and classical
management; mechanistic
Multiple organizational structures
possible; organic
Performance measurement
Individually based
Team based. Greater potential role for
contextual factors influence performance
Quality Control “Doer” separated from “checker” roles “Doers” are also “checkers”
REQUIRED: Observe the two demonstrations. In the spaces below, suggest changes in the human resources
management of the workers in a lean manufacturing environment.
Mass Production Lean Production
Job analysis
Emphasis on tightly defined tasks and duties as a
basis for other personnel decisions
Staffing
Hire people with skills defined from job
descriptions
Training Emphasis on job-related skills
Rewards Individually based, whether hourly or piece rate.
Pay structure Longevity pay, individual performance based pay
Career
development
Progress through logically sequenced jobs in career
ladders
Outsourcing
the HR
function
Minimal amount of outsourcing HR function.
Emphasis placed on long-term match of employee
skills and organizational needs
Performance measurements: Mass Lean
Cycle Time (From Dept. 1 to Quality Control) _________ _________
Yield (# of Good / # of Total Needed) _________ _________
Productivity (# of Good / # of workers) _________ _________
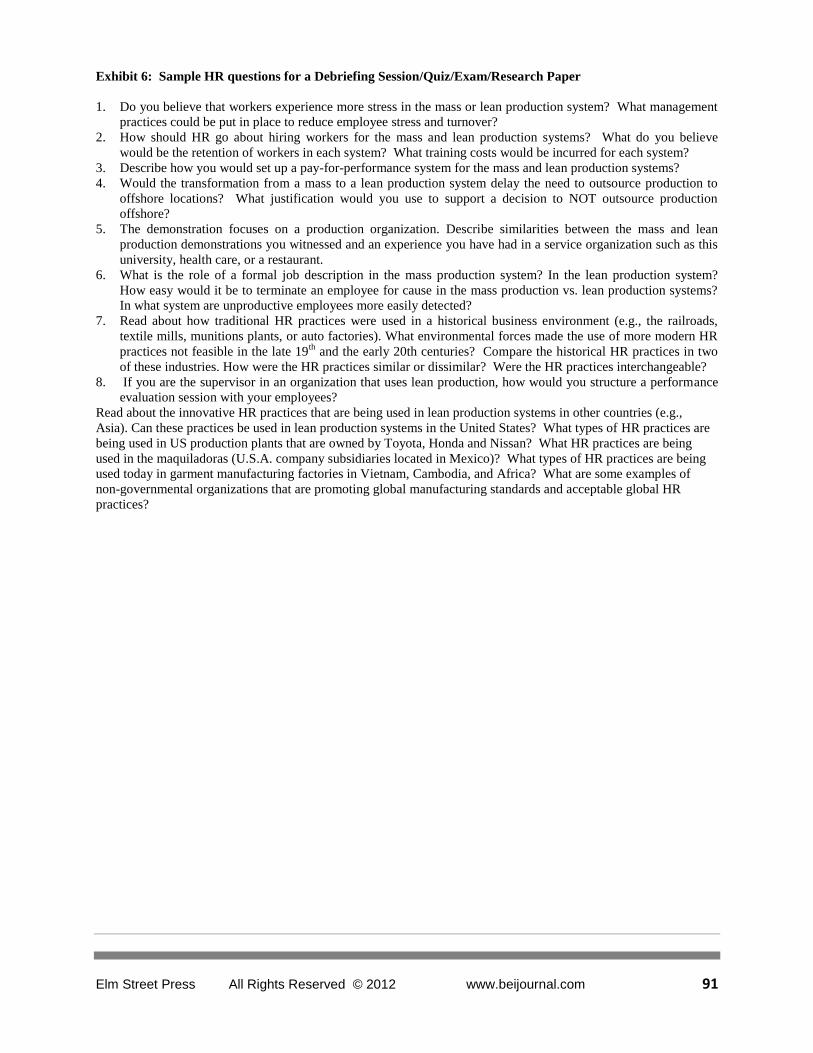
Elm Street Press All Rights Reserved © 2012 www.beijournal.com 91
Exhibit 6: Sample HR questions for a Debriefing Session/Quiz/Exam/Research Paper
1. Do you believe that workers experience more stress in the mass or lean production system? What management
practices could be put in place to reduce employee stress and turnover?
2. How should HR go about hiring workers for the mass and lean production systems? What do you believe
would be the retention of workers in each system? What training costs would be incurred for each system?
3. Describe how you would set up a pay-for-performance system for the mass and lean production systems?
4. Would the transformation from a mass to a lean production system delay the need to outsource production to
offshore locations? What justification would you use to support a decision to NOT outsource production
offshore?
5. The demonstration focuses on a production organization. Describe similarities between the mass and lean
production demonstrations you witnessed and an experience you have had in a service organization such as this
university, health care, or a restaurant.
6. What is the role of a formal job description in the mass production system? In the lean production system?
How easy would it be to terminate an employee for cause in the mass production vs. lean production systems?
In what system are unproductive employees more easily detected?
7. Read about how traditional HR practices were used in a historical business environment (e.g., the railroads,
textile mills, munitions plants, or auto factories). What environmental forces made the use of more modern HR
practices not feasible in the late 19th
and the early 20th centuries? Compare the historical HR practices in two
of these industries. How were the HR practices similar or dissimilar? Were the HR practices interchangeable?
8. If you are the supervisor in an organization that uses lean production, how would you structure a performance
evaluation session with your employees?
Read about the innovative HR practices that are being used in lean production systems in other countries (e.g.,
Asia). Can these practices be used in lean production systems in the United States? What types of HR practices are
being used in US production plants that are owned by Toyota, Honda and Nissan? What HR practices are being
used in the maquiladoras (U.S.A. company subsidiaries located in Mexico)? What types of HR practices are being
used today in garment manufacturing factories in Vietnam, Cambodia, and Africa? What are some examples of
non-governmental organizations that are promoting global manufacturing standards and acceptable global HR
practices?
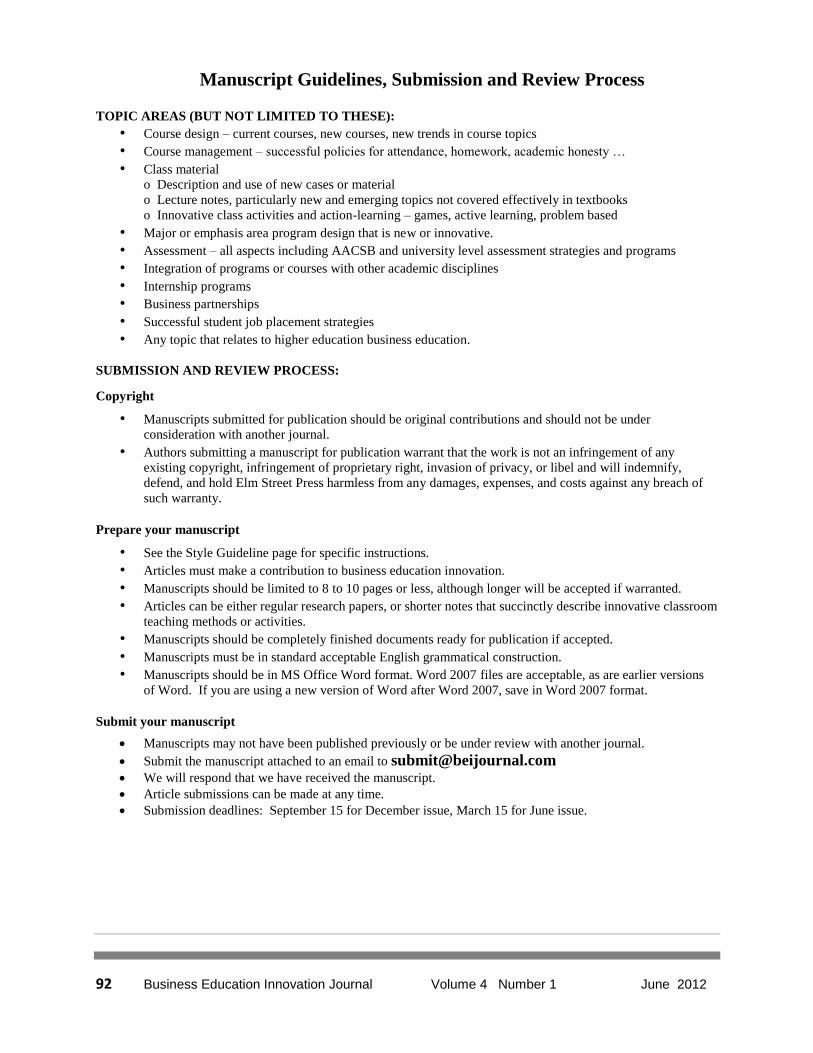
92 Business Education Innovation Journal Volume 4 Number 1 June 2012
Manuscript Guidelines, Submission and Review Process TOPIC AREAS (BUT NOT LIMITED TO THESE):
• Course design – current courses, new courses, new trends in course topics
• Course management – successful policies for attendance, homework, academic honesty …
• Class material
o Description and use of new cases or material
o Lecture notes, particularly new and emerging topics not covered effectively in textbooks
o Innovative class activities and action-learning – games, active learning, problem based
• Major or emphasis area program design that is new or innovative.
• Assessment – all aspects including AACSB and university level assessment strategies and programs
• Integration of programs or courses with other academic disciplines
• Internship programs
• Business partnerships
• Successful student job placement strategies
• Any topic that relates to higher education business education.
SUBMISSION AND REVIEW PROCESS:
Copyright
• Manuscripts submitted for publication should be original contributions and should not be under
consideration with another journal.
• Authors submitting a manuscript for publication warrant that the work is not an infringement of any
existing copyright, infringement of proprietary right, invasion of privacy, or libel and will indemnify,
defend, and hold Elm Street Press harmless from any damages, expenses, and costs against any breach of
such warranty.
Prepare your manuscript
• See the Style Guideline page for specific instructions.
• Articles must make a contribution to business education innovation.
• Manuscripts should be limited to 8 to 10 pages or less, although longer will be accepted if warranted.
• Articles can be either regular research papers, or shorter notes that succinctly describe innovative classroom
teaching methods or activities.
• Manuscripts should be completely finished documents ready for publication if accepted.
• Manuscripts must be in standard acceptable English grammatical construction.
• Manuscripts should be in MS Office Word format. Word 2007 files are acceptable, as are earlier versions
of Word. If you are using a new version of Word after Word 2007, save in Word 2007 format.
Submit your manuscript
Manuscripts may not have been published previously or be under review with another journal.
Submit the manuscript attached to an email to [email protected]
We will respond that we have received the manuscript.
Article submissions can be made at any time.
Submission deadlines: September 15 for December issue, March 15 for June issue.
Elm Street Press All Rights Reserved © 2012 www.beijournal.com 93
Manuscript review
The editor and reviewers will review your submission to determine if 1) the content makes a contribution to
innovative business education, 2) is of the proper page length, 3) is written in proper grammatical English,
and 4) is formatted ready for publication.
Submissions not meeting any of these standards will be returned. You are invited to make revisions and
resubmit.
If the submission meets the standards, the manuscript will be sent to two reviewers who will read, evaluate
and comment on your submission.
The editor will evaluate the reviews and make the final decision. There are 3 possible outcomes:
o Accept as is.
o Accept with minor revisions.
o Not accepted.
Reviews will be returned promptly. Our commitment is to have a decision to you in less than two months.
If your paper is not accepted, the evaluation may contain comments from reviewers. You are invited to
rewrite and submit again.
If your paper is accepted
Minor revision suggestions will be transmitted back to you.
Revise and send back as quickly as possible to meet printer deadlines.
Upon final acceptance, we will bill you publication fees. See www.beijournal.com for latest per page fees.
Sole author fees are discounted.
The fees include all costs of mailing a copy of the issue to each author via standard postal ground.
Delivery to locations outside the continental US will cost an additional $10 per author for 5 day delivery.
Faster delivery methods are available for US and international delivery. Contact the editor for a specific
pricing.
All publication fees should be remitted within 10 business days of acceptance, if possible.
If you decide not to publish your paper with BEI Journal after submitting payment, we will refund
publication fees less $200 to cover costs of review and processing.
Cancellation cannot occur after the paper has been formatted into the final printer’s file.
94 Business Education Innovation Journal Volume 4 Number 1 June 2012
Manuscript Style Guide and Example
An example is providing following these instructions.
This style guide represents new style guidelines in effect for future issues.
Authors are responsible for checking for correct grammar, construction and spelling. Authors are also
responsible for formatting pictures, tables, and figures such that a pdf black and white file sent to the
publisher will reproduce in a readable manner.
General Setup:
All fonts: Times New Roman. 10 point for text. Other sizes as noted below
Margins: 1 inch on all sides of 8½x11 inch paper size.
No headers or footers.
Avoid footnotes unless absolutely necessary.
Page numbering bottom centered.
No section breaks in the paper.
No color, including url’s. Format to black. No color in tables or figures. Use shading if necessary.
All pages must be portrait orientation. Tables and figures in landscape orientations should be reformatted
into portrait orientation.
All paragraphs should be justified left and right, single spaced, in 10 point Times font, no indent on first
line, l line between each heading and paragraph.
One line between each paragraph.
Titles, Authors, and Headings:
Title centered 14 point bold. One line between title and author’s name.
Authors: centered, 12 point. Name, affiliation, state, country.
One line space to ABSTRACT (title 10 point, bold, all capitalized, aligned left; text of abstract 10 point,
no bold)
After ABSTRACT, one line space, then Keywords. Followed by one line space to first major heading.
HEADINGS, MAJOR, 10 point, bold, all capitalized, aligned left.
The specific headlines will be based on the content of the paper, but major sections should at a
minimum include an abstract, keywords, introduction, conclusion, and references.
Sub-headings: 10 point, bold, first letter capitalized, no line to following paragraph. Align left.
Third level headings: Italic, 10 point, first letter capitalized, no line to following paragraph. Align left.
Keywords: heading: 10 point, bold, first letter capitalized, no line to following paragraph. Align left.
Your list of keywords in 10 point, no bold.
Tables, Figures and Graphs:
All fonts 10 point.
Numbered consecutively within each category. Table 1, Figure 1 etc.
Title: 10 point, bold, left justify title, one space, then the table, figure, etc.
Example: Table 1: Statistical Analysis
References:
APA format when citing in the text. For example (Smith, 2009).
References section: 8 point font, first line left margin, continuation lines 0.25 inch indent. Justify left and
right. No line spacing between references. List alphabetically by first author.
Specific references: Last name, First initial, middle initial (and additional authors same style) (year of
publication in parentheses). Title of article. Journal or source in italics. Volume and issue, page number
range.
Example: Clon, E. and Johanson, E. (2006). Sloppy Writing and Performance in Principles of Economics.
Educational Economics. V. 14, No. 2, pp 211-233.
For books: last name, first initial, middle initial (and additional authors same style) (year of publication in
parentheses). Title of book in italics. Publisher information.
Example: Houghton, P.M, and Houghton, T.J. (2009). APA: The Easy Way! Flint, MI: Baker College.
Elm Street Press All Rights Reserved © 2012 www.beijournal.com 95
Example (note that this example represents a change from previous style guides )
Evidence to Support Sloppy Writing Leads to Sloppy Thinking
Peter J. Billington, Colorado State University - Pueblo, Colorado, USA (12 point)
Terri Dactil, High Plains University, Alberta, Canada
ABSTRACT (10 point, bold, all capitalized, left justified)
(text: 10 point Times font, no indent, justified, single space, 150 words maximum for the abstract)
The classic phrase “sloppy writing leads to sloppy thinking” has been used by many to make writers develop
structured and clear writing. However, although many people do believe this phrase, no one has yet been able to
prove that, in fact, sloppy writing leads to sloppy thinking. In this paper, we study the causal relationship between
sloppy writing and sloppy thinking.
Keywords: sloppy writing, sloppy thinking (10 point, bold title, first letter capitalized, left justified).
INTRODUCTION (10 point, bold, all capitalized, left justified).
The classic phrase “sloppy writing leads to sloppy thinking” has been used by many to make writers develop
structured and clear writing. However, since many people do believe this phrase, no one has yet been able to prove
that in fact, sloppy writing leads to sloppy thinking. Is it possible that sloppy writing is done, even with good
thinking. Or perhaps excellent writing is developed, even with sloppy thinking.
In this paper, we study the writing of 200 students that attempts to test the theory that sloppy writing leads to sloppy
thinking.
PREVIOUS RESEARCH
The original phrase came into wide use around 2005 (Clon, 2006), who observed sloppy writing in economics
classes. Sloppy writing was observed in other economics classes (Druden and Ellias, 2003).
RESEARCH DESIGN
Two hundred students in two business statistics sections during one semester were given assignments to write
reports on statistical sampling results. The papers were graded on a “sloppiness” factor using…
Data Collection (Sub-heading, bold but not all caps, 10 point, aligned left, bold, no line after to paragraph)
The two hundred students were asked to write 2 short papers during the semester…
Data Analysis(Sub-heading, bold but not all caps, 10 point, aligned left, bold, no line after to paragraph)
The two hundred students were asked to write 2 short papers during the semester…
DISCUSSION
The resulting statistical analysis shows a significant correlation between sloppy writing and sloppy thinking. As
noted below in Figure 1, the amount of sloppy writing increases over the course of the spring semester.
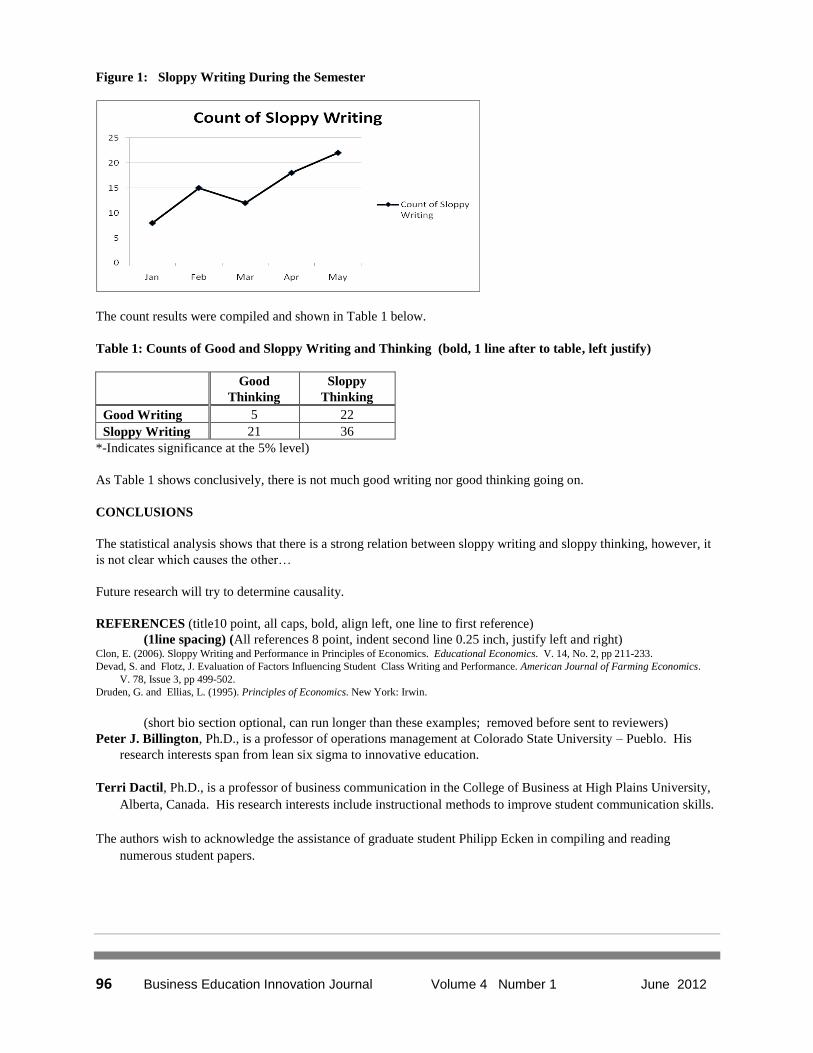
96 Business Education Innovation Journal Volume 4 Number 1 June 2012
Figure 1: Sloppy Writing During the Semester
The count results were compiled and shown in Table 1 below.
Table 1: Counts of Good and Sloppy Writing and Thinking (bold, 1 line after to table, left justify)
Good
Thinking
Sloppy
Thinking
Good Writing 5 22
Sloppy Writing 21 36
*-Indicates significance at the 5% level)
As Table 1 shows conclusively, there is not much good writing nor good thinking going on.
CONCLUSIONS
The statistical analysis shows that there is a strong relation between sloppy writing and sloppy thinking, however, it
is not clear which causes the other…
Future research will try to determine causality.
REFERENCES (title10 point, all caps, bold, align left, one line to first reference)
(1line spacing) (All references 8 point, indent second line 0.25 inch, justify left and right) Clon, E. (2006). Sloppy Writing and Performance in Principles of Economics. Educational Economics. V. 14, No. 2, pp 211-233.
Devad, S. and Flotz, J. Evaluation of Factors Influencing Student Class Writing and Performance. American Journal of Farming Economics.
V. 78, Issue 3, pp 499-502.
Druden, G. and Ellias, L. (1995). Principles of Economics. New York: Irwin.
(short bio section optional, can run longer than these examples; removed before sent to reviewers)
Peter J. Billington, Ph.D., is a professor of operations management at Colorado State University – Pueblo. His
research interests span from lean six sigma to innovative education.
Terri Dactil, Ph.D., is a professor of business communication in the College of Business at High Plains University,
Alberta, Canada. His research interests include instructional methods to improve student communication skills.
The authors wish to acknowledge the assistance of graduate student Philipp Ecken in compiling and reading
numerous student papers.