business impact visualization for information security and
TRANSCRIPT
Graduate Theses and Dissertations Iowa State University Capstones, Theses andDissertations
2013
Business impact visualization for informationsecurity and compliance eventsMark Francis TannianIowa State University
Follow this and additional works at: https://lib.dr.iastate.edu/etd
Part of the Computer Engineering Commons
This Dissertation is brought to you for free and open access by the Iowa State University Capstones, Theses and Dissertations at Iowa State UniversityDigital Repository. It has been accepted for inclusion in Graduate Theses and Dissertations by an authorized administrator of Iowa State UniversityDigital Repository. For more information, please contact [email protected].
Recommended CitationTannian, Mark Francis, "Business impact visualization for information security and compliance events" (2013). Graduate Theses andDissertations. 13050.https://lib.dr.iastate.edu/etd/13050

Business impact visualization for information security and
compliance events
by
Mark Francis Tannian
A dissertation submitted to the graduate faculty
in partial fulfillment of the requirements for the degree of
DOCTOR OF PHILOSOPHY
Major: Computer Engineering
Program of Study Committee:
Douglas W. Jacobson, Major Professor
Thomas E. Daniels
James A. Davis
Stephen Gilbert
Kevin P. Scheibe
Iowa State University
Ames, Iowa
2013
Copyright c© Mark Francis Tannian, 2013. All rights reserved.
ii
DEDICATION
I would like to dedicate this dissertation to my wife, Marcia, and my parents, Beatrix
and Francis, who encouraged, supported and inspired my return to pursue this degree.
I could not have achieved this lifelong aspiration without their love.
Although the thought is brief, my gratitude is deep for all the support and wisdom I
have received from family, friends, colleagues and faculty.

iii
TABLE OF CONTENTS
LIST OF TABLES . . . . . . . . . . . . . . . . . . . . . . . . . . . . . . . . ix
LIST OF FIGURES . . . . . . . . . . . . . . . . . . . . . . . . . . . . . . . xii
ACKNOWLEDGEMENTS . . . . . . . . . . . . . . . . . . . . . . . . . . . xiv
ABSTRACT . . . . . . . . . . . . . . . . . . . . . . . . . . . . . . . . . . . . xv
CHAPTER 1. PROLOGUE . . . . . . . . . . . . . . . . . . . . . . . . . . 1
1.1 Introduction . . . . . . . . . . . . . . . . . . . . . . . . . . . . . . . . . . 1
1.2 Problem Description . . . . . . . . . . . . . . . . . . . . . . . . . . . . . 1
1.2.1 Broader Problem . . . . . . . . . . . . . . . . . . . . . . . . . . . 2
1.2.2 Sub-problem . . . . . . . . . . . . . . . . . . . . . . . . . . . . . . 2
1.3 Potential Solution . . . . . . . . . . . . . . . . . . . . . . . . . . . . . . . 6
1.4 Research Hypothesis . . . . . . . . . . . . . . . . . . . . . . . . . . . . . 7
1.5 Research Sketch . . . . . . . . . . . . . . . . . . . . . . . . . . . . . . . . 8
1.6 Contributions Summary . . . . . . . . . . . . . . . . . . . . . . . . . . . 9
1.6.1 Iterative Field Study Methodology . . . . . . . . . . . . . . . . . 9
1.6.2 IT Incident Visualization System . . . . . . . . . . . . . . . . . . 11
1.6.3 Practitioner-Oriented Evaluation Framework . . . . . . . . . . . . 14
1.7 Document Organization . . . . . . . . . . . . . . . . . . . . . . . . . . . 15
CHAPTER 2. REVIEW OF LITERATURE . . . . . . . . . . . . . . . . 16
2.1 IT Incident Visualization System . . . . . . . . . . . . . . . . . . . . . . 16
2.2 Iterative Field Study Methodology . . . . . . . . . . . . . . . . . . . . . 19

iv
2.3 Practitioner-Oriented Evaluation Framework . . . . . . . . . . . . . . . . 25
2.4 Summation . . . . . . . . . . . . . . . . . . . . . . . . . . . . . . . . . . 28
CHAPTER 3. ITERATIVE FIELD STUDY METHODOLOGY . . . . 30
3.1 Introduction . . . . . . . . . . . . . . . . . . . . . . . . . . . . . . . . . . 30
3.2 Methodology . . . . . . . . . . . . . . . . . . . . . . . . . . . . . . . . . 32
3.2.1 Recruitment . . . . . . . . . . . . . . . . . . . . . . . . . . . . . . 34
3.2.2 Stage A. Define Problem and User Group . . . . . . . . . . . . . 38
3.2.3 Stage B. Understanding the Need . . . . . . . . . . . . . . . . . . 39
3.2.4 Stage C. Analysis of Need and Stage D. Needs Catalog . . . . . . 39
3.2.5 Stage E. Needs Prioritization and Stage F. Analysis of Priorities . 40
3.2.6 Stage G. Need/Task Selection . . . . . . . . . . . . . . . . . . . . 42
3.2.7 Stage H. Understanding Selected Task . . . . . . . . . . . . . . . 45
3.2.8 Stage I. Analysis of Task Exploration . . . . . . . . . . . . . . . . 47
3.2.9 Stage J. Identify Actors & Dynamics . . . . . . . . . . . . . . . . 48
3.2.10 Stage K. Identify Requirements . . . . . . . . . . . . . . . . . . . 59
3.2.11 Stage L. Review & Influence Requirements & Understanding . . . 61
3.2.12 Stage M. Revise Requirements and N. Prioritize Requirements . . 62
3.2.13 Stage O. Interpret Requirement Priorities . . . . . . . . . . . . . 65
3.2.14 Stage P. Develop High-Level Designs . . . . . . . . . . . . . . . . 73
3.2.15 Stage Q. Review High-Level Designs . . . . . . . . . . . . . . . . 76
3.2.16 Stage R. Analyze Design Review . . . . . . . . . . . . . . . . . . 78
3.2.17 Stage S. Develop Visualization Prototype . . . . . . . . . . . . . . 79
3.2.18 Stage T. Review Visualization Prototype . . . . . . . . . . . . . . 83
3.2.19 Stage U. Adjust Prototype . . . . . . . . . . . . . . . . . . . . . . 91
3.2.20 Stage V. Industry Public Evaluation . . . . . . . . . . . . . . . . 93
3.3 Discussion . . . . . . . . . . . . . . . . . . . . . . . . . . . . . . . . . . . 94

v
CHAPTER 4. IT INCIDENT VISUALIZATION SYSTEM . . . . . . . 98
4.1 Introduction . . . . . . . . . . . . . . . . . . . . . . . . . . . . . . . . . . 98
4.2 Iterative Field Study Methodology . . . . . . . . . . . . . . . . . . . . . 98
4.3 Visualization . . . . . . . . . . . . . . . . . . . . . . . . . . . . . . . . . 99
4.3.1 IT Incident . . . . . . . . . . . . . . . . . . . . . . . . . . . . . . 100
4.3.2 The Fit . . . . . . . . . . . . . . . . . . . . . . . . . . . . . . . . 102
4.3.3 The Gap . . . . . . . . . . . . . . . . . . . . . . . . . . . . . . . . 103
4.3.4 The System . . . . . . . . . . . . . . . . . . . . . . . . . . . . . . 104
4.3.5 Concept Model . . . . . . . . . . . . . . . . . . . . . . . . . . . . 105
4.3.6 Data Sets and Integration . . . . . . . . . . . . . . . . . . . . . . 108
4.3.7 Design and Principles . . . . . . . . . . . . . . . . . . . . . . . . . 109
4.4 Discussion . . . . . . . . . . . . . . . . . . . . . . . . . . . . . . . . . . . 130
4.4.1 Operational Adoption . . . . . . . . . . . . . . . . . . . . . . . . 130
4.4.2 Choosing Silverlight . . . . . . . . . . . . . . . . . . . . . . . . . 131
4.4.3 Understanding Cognitive Fit . . . . . . . . . . . . . . . . . . . . . 131
4.4.4 Waterfall Project Management . . . . . . . . . . . . . . . . . . . 132
4.4.5 Effort Estimate Verification . . . . . . . . . . . . . . . . . . . . . 132
4.4.6 Granularity and Type of Direction . . . . . . . . . . . . . . . . . 133
4.4.7 Response Action Evaluation . . . . . . . . . . . . . . . . . . . . . 133
4.4.8 Expressions of Extent . . . . . . . . . . . . . . . . . . . . . . . . . 134
4.4.9 IT Incident Escalation . . . . . . . . . . . . . . . . . . . . . . . . 134
4.4.10 Incident Awareness Overview Design . . . . . . . . . . . . . . . . 135
4.4.11 IT Incident Duration Timer . . . . . . . . . . . . . . . . . . . . . 135
CHAPTER 5. EVALUATION FRAMEWORK . . . . . . . . . . . . . . . 137
5.1 Introduction . . . . . . . . . . . . . . . . . . . . . . . . . . . . . . . . . . 137
5.2 Iterative Field Study Methodology . . . . . . . . . . . . . . . . . . . . . 138
5.3 IT Incident Visualization System . . . . . . . . . . . . . . . . . . . . . . 139

vi
5.4 Evaluation Strategy . . . . . . . . . . . . . . . . . . . . . . . . . . . . . . 140
5.5 Evaluation Purpose and Requirements . . . . . . . . . . . . . . . . . . . 141
5.6 Evaluation Framework . . . . . . . . . . . . . . . . . . . . . . . . . . . . 143
5.6.1 Evaluation Event Objectives . . . . . . . . . . . . . . . . . . . . . 143
5.6.2 Framework Elements . . . . . . . . . . . . . . . . . . . . . . . . . 144
5.7 Discussion . . . . . . . . . . . . . . . . . . . . . . . . . . . . . . . . . . . 161
5.7.1 Usability Testing . . . . . . . . . . . . . . . . . . . . . . . . . . . 161
CHAPTER 6. EVALUATION RESULTS . . . . . . . . . . . . . . . . . . 164
6.1 Introduction . . . . . . . . . . . . . . . . . . . . . . . . . . . . . . . . . . 164
6.2 Evaluation Event Overview . . . . . . . . . . . . . . . . . . . . . . . . . 164
6.3 Survey Results . . . . . . . . . . . . . . . . . . . . . . . . . . . . . . . . 165
6.3.1 Participation Background Data . . . . . . . . . . . . . . . . . . . 165
6.3.2 Participant Background Data Analyses and Considerations . . . . 168
6.3.3 Post–Evaluation Questionnaire Results . . . . . . . . . . . . . . . 169
6.4 Activity Log Analysis . . . . . . . . . . . . . . . . . . . . . . . . . . . . . 173
6.5 Evaluation Criteria . . . . . . . . . . . . . . . . . . . . . . . . . . . . . . 179
6.5.1 Decision Awareness Evaluation Indicator . . . . . . . . . . . . . . 183
6.5.2 Decision Comprehension Evaluation Indicator . . . . . . . . . . . 184
6.5.3 Evaluation . . . . . . . . . . . . . . . . . . . . . . . . . . . . . . . 185
6.6 Discussion . . . . . . . . . . . . . . . . . . . . . . . . . . . . . . . . . . . 186
6.6.1 Operational Glitches . . . . . . . . . . . . . . . . . . . . . . . . . 187
6.6.2 Interesting Survey Responses . . . . . . . . . . . . . . . . . . . . 188
6.6.3 Biases . . . . . . . . . . . . . . . . . . . . . . . . . . . . . . . . . 190
6.6.4 Influence of Evaluation Tasks . . . . . . . . . . . . . . . . . . . . 193
CHAPTER 7. OBSERVATIONS AND DISCUSSION . . . . . . . . . . . 194
7.1 Introduction . . . . . . . . . . . . . . . . . . . . . . . . . . . . . . . . . . 194
7.2 Research Significance . . . . . . . . . . . . . . . . . . . . . . . . . . . . . 194

vii
7.3 Solution Challenges . . . . . . . . . . . . . . . . . . . . . . . . . . . . . . 198
7.3.1 Security . . . . . . . . . . . . . . . . . . . . . . . . . . . . . . . . 198
7.3.2 Integration . . . . . . . . . . . . . . . . . . . . . . . . . . . . . . 199
7.3.3 Personnel Overload . . . . . . . . . . . . . . . . . . . . . . . . . . 199
7.4 Project Design . . . . . . . . . . . . . . . . . . . . . . . . . . . . . . . . 200
7.4.1 Repeated Involvement . . . . . . . . . . . . . . . . . . . . . . . . 200
7.4.2 Bias . . . . . . . . . . . . . . . . . . . . . . . . . . . . . . . . . . 201
7.5 Lessons Learned . . . . . . . . . . . . . . . . . . . . . . . . . . . . . . . . 202
7.5.1 Further Task Analysis and Usability Testing . . . . . . . . . . . . 202
7.5.2 Study Group Composition . . . . . . . . . . . . . . . . . . . . . . 203
7.6 Reflections . . . . . . . . . . . . . . . . . . . . . . . . . . . . . . . . . . . 205
7.6.1 Study Group Member Personality . . . . . . . . . . . . . . . . . . 205
7.6.2 IT Incident Impact & Improvement . . . . . . . . . . . . . . . . . 206
7.6.3 Evaluator Comment . . . . . . . . . . . . . . . . . . . . . . . . . 207
7.7 Summation . . . . . . . . . . . . . . . . . . . . . . . . . . . . . . . . . . 208
CHAPTER 8. FUTURE WORK . . . . . . . . . . . . . . . . . . . . . . . 209
8.1 Introduction . . . . . . . . . . . . . . . . . . . . . . . . . . . . . . . . . . 209
8.2 Business Impact Visualization . . . . . . . . . . . . . . . . . . . . . . . . 209
8.3 IT Incident Visualization System . . . . . . . . . . . . . . . . . . . . . . 210
8.4 Iterative Field Study Methodology . . . . . . . . . . . . . . . . . . . . . 212
8.5 Practitioner-Oriented Evaluation Framework . . . . . . . . . . . . . . . . 212
8.6 Discussion . . . . . . . . . . . . . . . . . . . . . . . . . . . . . . . . . . . 213
APPENDIX A. EVALUATION SURVEY INSTRUMENTS . . . . . . . 215
APPENDIX B. BUSINESS IMPACT VISUALIZATION NEEDS . . . . 220
APPENDIX C. ANALYSIS OF TASK EXPLORATION . . . . . . . . . 223
APPENDIX D. TASK STRUCTURES AND FLOW . . . . . . . . . . . 228

viii
APPENDIX E. VISUALIZATION REQUIREMENTS . . . . . . . . . . 231
APPENDIX F. REQUIREMENTS RANKING MATERIALS . . . . . . 242
APPENDIX G. REQUIREMENTS RANKING RESULTS . . . . . . . . 252
APPENDIX H. RANKING COMPARISON VISUALS . . . . . . . . . . 259
APPENDIX I. REQUIREMENT PRIORITY INTERPRETATION . . 263
APPENDIX J. HIGH-LEVEL DESIGN SEQUENCING . . . . . . . . . 269
APPENDIX K. CALL FOR PARTICIPATION . . . . . . . . . . . . . . . 273
APPENDIX L. ENVIRONMENT STATE MACHINES . . . . . . . . . 276
APPENDIX M. EVALUATION TASKS . . . . . . . . . . . . . . . . . . . 279
APPENDIX N. RECONCILIATION OF ACTIVITIES . . . . . . . . . . 291
BIBLIOGRAPHY . . . . . . . . . . . . . . . . . . . . . . . . . . . . . . . . 296

ix
LIST OF TABLES
Table 1.1 Incident Timing Analysis . . . . . . . . . . . . . . . . . . . . . . 5
Table 3.1 Methodology Stages: Tools and Related Literature . . . . . . . . 34
Table 3.2 Study Group Members - Backgrounds & Participation Summary 36
Table 3.3 Top Three Needs . . . . . . . . . . . . . . . . . . . . . . . . . . 42
Table 5.1 Dimensions of the Evaluation Strategy . . . . . . . . . . . . . . . 141
Table 6.1 Evaluation Participant Background Statistics . . . . . . . . . . . 166
Table 6.2 Evaluators’ Employers’ Businesses or Missions . . . . . . . . . . 167
Table 6.3 Incident Visualization System’s Areas of Advantage . . . . . . . 172
Table 6.4 Distribution of Outcomes Resulting from Hands-On Activity . . 174
Table 6.5 Decision Awareness Evaluation Indicator . . . . . . . . . . . . . 186
Table 6.6 Decision Comprehension Evaluation Indicator . . . . . . . . . . . 186
Table B.1 Catalog of Business Impact Visualization Needs . . . . . . . . . 220
Table B.2 Catalog of Business Impact Visualization Needs (contd.) . . . . . 221
Table B.3 Catalog of Business Impact Visualization Needs (contd.) . . . . . 222
Table C.1 Study Group Input Classified as Ideas . . . . . . . . . . . . . . . 223
Table C.2 Study Group Input Classified as Ideas (contd.) . . . . . . . . . . 224
Table C.3 Study Group Input Classified as Decisions . . . . . . . . . . . . 224
Table C.4 Analysis Results Classified as Notions . . . . . . . . . . . . . . . 225
Table C.5 Analysis Results Classified as Principles . . . . . . . . . . . . . . 226

x
Table C.6 Analysis Results Classified as Principles (contd.) . . . . . . . . . 227
Table E.1 High-Level Requirements . . . . . . . . . . . . . . . . . . . . . . 231
Table E.2 High-Level Requirements (contd.) . . . . . . . . . . . . . . . . . 232
Table E.3 1 - Incident Handling Awareness Design Requirements . . . . . . 233
Table E.4 2 - Decision Support Design Requirements . . . . . . . . . . . . 234
Table E.5 3 - Communication Capability Design Requirements . . . . . . . 235
Table E.6 4 - Coordination Capability Design Requirements . . . . . . . . 236
Table E.7 4 - Coordination Capability Design Requirements (contd.) . . . . 237
Table E.8 5 - Incident Actions Guide Design Requirements . . . . . . . . . 237
Table E.9 6 - Incident Measures Design Requirements . . . . . . . . . . . . 238
Table E.10 7 - Incident Review & Analysis Tools Design Requirements . . . 239
Table E.11 8 - Incident Handling Documentation Design Requirements . . . 240
Table E.12 9 - Visualization Usability Design Requirements . . . . . . . . . 241
Table G.1 Prioritization Results - Expected Kano Expectation . . . . . . 253
Table G.2 Prioritization Results - Expected Kano Expectation (contd.) . . 254
Table G.3 Prioritization Results - Normal Kano Expectation . . . . . . . . 255
Table G.4 Prioritization Results - Normal Kano Expectation (contd.) . . . 256
Table G.5 Prioritization Results - Exciting Kano Expectation . . . . . . . 257
Table G.6 Prioritization Results - Exciting Kano Expectation (contd.) . . 258
Table I.1 Requirements Prioritization Interpretation . . . . . . . . . . . . 264
Table I.2 Requirements Prioritization Interpretation (contd.) . . . . . . . . 265
Table I.3 Requirements Prioritization Interpretation (contd.) . . . . . . . . 266
Table I.4 Requirements Prioritization Interpretation (contd.) . . . . . . . . 267
Table I.5 Requirements Prioritization Interpretation (contd.) . . . . . . . . 268
Table M.1 Evaluation Tasks . . . . . . . . . . . . . . . . . . . . . . . . . . 280

xi
Table M.2 Evaluation Tasks (contd.) . . . . . . . . . . . . . . . . . . . . . . 281
Table M.3 Evaluation Tasks (contd.) . . . . . . . . . . . . . . . . . . . . . . 282
Table M.4 Evaluation Tasks (contd.) . . . . . . . . . . . . . . . . . . . . . . 283
Table M.5 Evaluation Tasks (contd.) . . . . . . . . . . . . . . . . . . . . . . 284
Table M.6 Evaluation Tasks (contd.) . . . . . . . . . . . . . . . . . . . . . . 285
Table M.7 Evaluation Tasks (contd.) . . . . . . . . . . . . . . . . . . . . . . 286
Table M.8 Evaluation Tasks (contd.) . . . . . . . . . . . . . . . . . . . . . . 287
Table M.9 Evaluation Tasks (contd.) . . . . . . . . . . . . . . . . . . . . . . 288
Table M.10 Evaluation Tasks (contd.) . . . . . . . . . . . . . . . . . . . . . . 289
Table M.11 Evaluation Tasks (contd.) . . . . . . . . . . . . . . . . . . . . . . 290
Table N.1 Comparison of Activities . . . . . . . . . . . . . . . . . . . . . . 292
Table N.2 Comparison of Activities (contd.) . . . . . . . . . . . . . . . . . 293
Table N.3 Comparison of Activities (contd.) . . . . . . . . . . . . . . . . . 294
Table N.4 Comparison of Activities (contd.) . . . . . . . . . . . . . . . . . 295

xii
LIST OF FIGURES
Figure 1.1 Design Approach Comparison . . . . . . . . . . . . . . . . . . . 10
Figure 1.2 Visualization’s Environmental Fit . . . . . . . . . . . . . . . . . 13
Figure 3.1 Iterative Field Study Methodology . . . . . . . . . . . . . . . . . 33
Figure 3.2 Incident Awareness Among Actors . . . . . . . . . . . . . . . . . 50
Figure 4.1 Visualization Design Objectives . . . . . . . . . . . . . . . . . . 100
Figure 4.2 IT Incident Management Cycle . . . . . . . . . . . . . . . . . . . 102
Figure 4.3 Concept Diagrams: A) Content Access, B) Primary Data Types 106
Figure 5.1 Evaluation Event Objectives . . . . . . . . . . . . . . . . . . . . 143
Figure 5.2 Design Elements for Hands-On Evaluation . . . . . . . . . . . . 144
Figure 5.3 Hands-On Environment . . . . . . . . . . . . . . . . . . . . . . . 153
Figure 5.4 Evaluator’s Experience . . . . . . . . . . . . . . . . . . . . . . . 158
Figure 5.5 Evaluator’s Progression of Thinking . . . . . . . . . . . . . . . . 159
Figure 5.6 Evaluation Room Layout . . . . . . . . . . . . . . . . . . . . . . 160
Figure 6.2 Evaluator Choices . . . . . . . . . . . . . . . . . . . . . . . . . . 175
Figure 6.3 Choice Path Durations . . . . . . . . . . . . . . . . . . . . . . . 177
Figure 6.4 Task Durations & Mean Task Duration by Task . . . . . . . . . 178
Figure A.1 Pre-Evaluation Questionnaire - Front and Back Cover . . . . . . 216
Figure A.2 Pre-Evaluation Questionnaire - Inside Pages . . . . . . . . . . . 217
Figure A.3 Post-Evaluation Questionnaire - Front and Back Cover . . . . . 218
xiii
Figure A.4 Post-Evaluation Questionnaire - Inside Pages . . . . . . . . . . . 219
Figure D.1 IT Incident Management Flow Across Roles . . . . . . . . . . . . 229
Figure D.2 Sample Task Structure and Plan . . . . . . . . . . . . . . . . . . 230
Figure F.1 Ranking Instructions - Page 1 . . . . . . . . . . . . . . . . . . . 243
Figure F.2 Ranking Instructions - Page 2 . . . . . . . . . . . . . . . . . . . 244
Figure F.3 Ranking Instructions - Page 3 . . . . . . . . . . . . . . . . . . . 245
Figure F.4 Ranking Instructions - Page 4 . . . . . . . . . . . . . . . . . . . 246
Figure F.5 Ranking Instructions - Page 5 . . . . . . . . . . . . . . . . . . . 247
Figure F.6 Ranking Instructions - Page 6 . . . . . . . . . . . . . . . . . . . 248
Figure F.7 Ranking Instructions - Page 7 . . . . . . . . . . . . . . . . . . . 249
Figure F.8 Ranking Instructions - Page 8 . . . . . . . . . . . . . . . . . . . 250
Figure F.9 Ranking Instructions - Page 9 . . . . . . . . . . . . . . . . . . . 251
Figure H.1 High-Level and Design-Level Requirements at 70% Threshold . . 261
Figure H.2 Progression of Preference over Thresholds . . . . . . . . . . . . . 262
Figure J.1 Evaluation Task Sequencing Timeline . . . . . . . . . . . . . . . 270
Figure J.2 Possible Screen Flow . . . . . . . . . . . . . . . . . . . . . . . . 272
Figure K.1 Call for Participation - Page 1 . . . . . . . . . . . . . . . . . . . 274
Figure K.2 Call for Participation - Page 2 . . . . . . . . . . . . . . . . . . . 275
Figure L.1 Evaluation Environment State Machines . . . . . . . . . . . . . . 278

xiv
ACKNOWLEDGEMENTS
This accomplishment was in large part possible from my wife’s belief in me and her
love. I am grateful for her willingness to move a thousand miles and support this nearly
six year effort. I relied heavily on her wisdom and intuition.
I would like to express my sincere gratitude to Dr. Doug Jacobson for being a steadfast
supporter of my efforts and insightful advisor as I navigated through my doubts. I would
like to thank Dr. Jim Davis, Dr. Tom Daniels, Dr. Kevin Scheibe and Dr. Stephen
Gilbert for their guidance.
This work would not have been possible without the generous support of time and
candid thoughts of the seven professionals who comprised the Study Group. Thank you.
I would like acknowledge my parents who encouraged learning and exploration while
rearing me. I also like to thank them for their interest and involvement in my efforts to
obtain this degree.
I would like to thank my Atlanta based video production team. Monica Tannian
provided copy editing support and lent her voice to the soundtrack, Harold Sellers for
his video production efforts and advice and, Daniela for sound engineering support.
I would like to the thank the company that generously provided me documentation
and materials that inspired the fictional company Zenodyne.
The list of friends and family who supported and encouraged me over the years is
long. I cannot list them all. There are two friends I would like to mention, Virginia
Anderson and Joseph Idziorek. They each helped me with the assistance they could
offer, and provided a listening ear. To Joseph, Virginia and my friends and family, thank
you very much.

xv
ABSTRACT
Business leaders face significant challenges from IT incidents that interfere with or
pose imminent risk to more than one workgroup. Communication, coordination and
monitoring are hindered by factors such as the IT incidents’ technical complexity and
unfamiliarity, distributed ad-hoc response teams, competing demands for their time,
nuanced business dependencies, the lack of reliable IT incident measures and a piecemeal
toolset to overcome these challenges. This research proposes a dynamic visual system as
a solution to overcome many of these challenges.
Starting with a broad outline of improving the awareness and comprehension of se-
curity and compliance events for business leaders, this effort enlisted the assistance of
seven experienced IT professionals in the Des Moines metropolitan area. A user-centered
design methodology was developed that enabled these individuals to influence the selec-
tion of a problem space, explore related challenges, contribute to requirements definition
and prioritization, review designs and, finally, test a prototype. The group consisted
of leaders and senior technical staff working in various industries. At the end of the
methodology, a group of unrelated IT professionals, with no prior knowledge, of the re-
search was asked to perform an objective evaluation of the prototype. That evaluation
is reported in this document and forms the basis of conclusions regarding the research
hypothesis.
1
CHAPTER 1. PROLOGUE
1.1 Introduction
This chapter provides an overview of the research presented in this document. The
next section of this chapter, “Problem Description,” summarizes the problem being ad-
dressed in this research. The following section, “Investigated Solution,” discusses the
rationale for the approach taken to address the problem. The following section specifies
the research hypothesis. A brief summary of how the research was conducted follows
in the “Research Sketch” section. Contributions resulting from this research are pre-
sented in the “Contribution Summary” section. The chapter closes with a section titled
“Document Overview,” which describes the structure of this document.
1.2 Problem Description
This research identifies two problems: the first is a broad issue related to leader-
ship’s timely understanding of security and compliance issues; the second is essentially
a sub-problem that is related to Information Technology (IT) incident management. IT
incident management is a class of security and compliance decision-making that lead-
ers must address in a timely and business-sensitive manner. This section describes the
broader problem that motivated the general inquiry into business impact visualization.
The description of the IT incident management sub-problem then follows.

2
1.2.1 Broader Problem
Today, managers depend upon subject matter experts to pre-process and pre-evaluate
the significance of activity within the enterprise environment, and raise concerns if events
surpass the analysts’ perceived threshold of risk. In this operating environment, man-
agers work at great conceptual and perceptual distance from significant events, putting
them at a marked disadvantage, as their lack of understanding, awareness of simulta-
neous risk events, and limited dynamic access to event-context data increases response
delay and uncertainty. Moreover, in less time-sensitive circumstances, business leaders
are asked to evaluate risk remediation and attest compliance to standards and regula-
tions without an intuitive understanding of the subject they are evaluating or to which
they are attesting. Development of business impact visualization has the potential of
enabling new and improving existing decision-making processes performed by business
leaders.
1.2.2 Sub-problem
While there are a number of sub-problems associated with the broad problem de-
scribed above, IT incident management is the focus of this research. Available litera-
ture and historical processes suggest that computer security incident management and
IT operational incident management are, or should be, two distinct business manage-
ment processes. Although there are significant differences between these two classes of
computer-related incidents, broader management of these incident classes has become
holistic, integrating both classes. As a result, this research draws upon literature and
experience from both sub-disciplines within IT management.
IT incident management seeks either to prevent incidents or effectively respond to
incidents that were not prevented[1]. An incident has a lifecycle that starts with symp-
toms. If the symptoms raise concerns, they are investigated to determine if a problem
truly exists. If the problem exists, it is then escalated for potential classification as an

3
incident. If an incident is declared, the incident is responded to and then closed. As
a means of process improvement, incidents are analyzed individually or in aggregate to
determine what can be done to prevent similar incidents from recurring and improve
response effectiveness. Authorized changes are implemented based on this analysis.
Although the root causes of non-malicious operational issues may not be readily
apparent, ascertaining that the related symptoms are a problem worthy of escalation is
relatively straightforward. By contrast, symptom analysis related to malicious activity
is challenging in even moderately complex IT environments.
Certain incidents are sufficiently contained and promptly addressed by an authorized
individual. Complex and wide-impact incidents, however, often involve multiple people
and multiple teams. In these cases leaders are crucial, in that they must enable and
authorize response in balance with ongoing business demands. Not all devised lines of
inquiry or interim solutions are guaranteed to work, and often the impact of an incident
increases as a result of the steps necessary to correct the problem.
Finding reliable numbers and statistics for IT incidents is a challenge. While there
have been various attempts to collect statistics related to security incidents, a general
IT incident census does not appear to have been taken. Although they have various
weaknesses, the two most recognized reports are Verizon’s annual “Data Breach Inves-
tigations Report” and Computer Security Institute’s (CSI) “CSI Computer Crime and
Security Survey.” In order to identify the frequency and impact of the class of IT in-
cidents being considered in this research, evaluators participating in this research were
asked to provide approximate statistics relative to their environments.
Respondents to a pre-evaluation survey administered in this research reported that,
on an annual basis, they had experienced a median of 62.5 IT incidents, with two re-
spondents stating as many as 8,000 IT incidents. The size of a response team varied
among respondents. The median maximum size of a response team was 25, with one
reporting as high as 100 people. The median annual cost related to IT incidents reported

4
was $325,000, with one reported to be as high as over $1 million. There are data quality
issues with these numbers, but they provide an interesting view. The survey is discussed
in further detail later in this document.
The CSI report’s scope in terms of IT incidents is restricted to security incidents,
based on voluntary replies to a survey sent to members of the institute. The focus of the
survey is on computer crime and security management. The “2010/11 CSI Computer
Crime and Security Survey” reports that, in the twelve-month period from July 2009
through July 2010, 117 respondents experienced at least one security incident[2]. Not
all attacks reported in this survey resulted in incidents. Based on 149 respondents, the
Survey reports that over 10% experienced attacks that included malware, “insider abuse
of Internet access or email,” laptop or mobile device theft, denial of service, “bots on
their networks,” password sniffing, and “system penetration by an outsider” ([2],pg. 15
& 17). Among other types of attack, these may have resulted in the security incidents
reported by the 117 respondents. The report was unable to provide information on
the financial impact of these incidents, due to what Richardson describes as “[f]ewer
respondents than ever are willing to share specific information about dollar losses they
incurred” ([2],pg. 2).
The Verizon “2012 Data Breach Investigations Report” focuses only on security in-
cidents that resulted in data breaches. The report is based on security incident data
Verizon collected from their consulting efforts, as well as incident data provided by the
Australian Federal Police, Dutch National High Tech Crime Unit, Irish Reporting and
Information Security Service, Police Central e-Crime Unit of the London Metropolitan
Police, and the United States Secret Service. The Verizon team consults on numerous
security incidents, and they note that error and misuse, as well as availability losses, are
likely more common than data breaches[3]. The report states that, within the report-
ing timeframe, 855 breach incidents occurred in IT environments hosted in 36 countries
involving 174 million compromised records. Among their analyses, the report provides

5
a timing analysis across the phases of the breach-incident lifecycle. Table 1.1 contains
the durations of lifecycle phases in orders of time magnitude as a percentage of breaches
analyzed([3],pg. 49):
Table 1.1: Verizon 2012 DBIR Data Breach Incident Timing Analysis
Phase Seconds Minutes Hours Days Weeks Months YearsInitial Attackto InitialCompromise
10% 75% 12% 2% 0% 1% 0%
InitialCompromiseto DataExfiltration
8% 38% 14% 25% 8% 8% 0%
InitialCompromiseto Discovery
0% 0% 2% 13% 29% 54% 2%
Discovery toContain-ment/Restoration
0% 1% 9% 32% 38% 17% 4%
In summary, this brief overview suggests that IT incidents occur in many environ-
ments, that there is a great variety of IT incidents, and that IT incident response is
costly. The time duration from initial attack symptoms to initial compromise is a mat-
ter of seconds or minutes for many data breaches. Moreover, closure of complicated IT
incident events can take days or weeks – possibly as long as years. IT incident prevention
is the goal, but incidents will nonetheless continue to happen. The victim of an incident
realizes no benefit from experiencing an IT incident. Response costs, productivity dis-
ruptions and possible revenue losses make incidents costly. Beyond these direct costs,
there are potential losses related to reputation damage, penalties and opportunity costs.
Therefore, improving efficiency in IT incident response is an important challenge that
needs to be addressed. One means to improve efficiency is to aid business leaders in their

6
incident-related decision-making.
1.2.2.1 Clarification of Terms
Throughout the document the incidents of interest in this research are all IT-related.
However, “incident management” in general is a problem space much broader than IT
incident management (e.g. events related to fire, medical emergency, physical security,
military activity, public health, etc.). This document uses the terms “IT incident” and
“incident” interchangeably. Except on rare occasions, the term “incident” does not refer
to non-IT incidents.
1.3 Potential Solution
Visualization geared toward IT incident management, particularly to the leaders’ spe-
cific needs, was investigated. There is a significant body of research into the usefulness
of visualization. In the introduction to a book of collected papers on information and
knowledge visualization, Keller and Tergan review a body of literature to substantiate
the value of visualization. They mention that investigations suggest that visualization
can help users manage complicated and poorly structured topics[4]. Ware writes that the
value of visualization lies in its ability to augment a person’s limited visual and verbal
memories by depicting intricate concept arrangements in an external visual presenta-
tion[5]. Moreover, Ware argues, the combination of a person’s cognitive abilities with
a computer-driven visualization is much more effective than a person left to their own
innate mental abilities. Further, Novak and Wurst suggest that visualization can be used
to bridge communities of practice that have distinct approaches to finding meaning and
significance in information and information structures[6].
There are at least two communities in IT incident management, including technical
responders and business-oriented responders. Visualization may be a means to provide
7
the necessary scaffolding with which leaders can engage in responses to IT incidents from
zero awareness. Furthermore, visualization may be able to provide convenient, albeit pos-
sibly complex, visual structures to maintain the awareness and understanding necessary
for IT incident management. Although this research is limited to investigating a means
for improving leader awareness and comprehension of security and compliance decisions,
the work done by researchers such as Novak and Wurst suggests that visualization may
be a means for achieving a common understanding of IT incident management challenges
across professional disciplines.
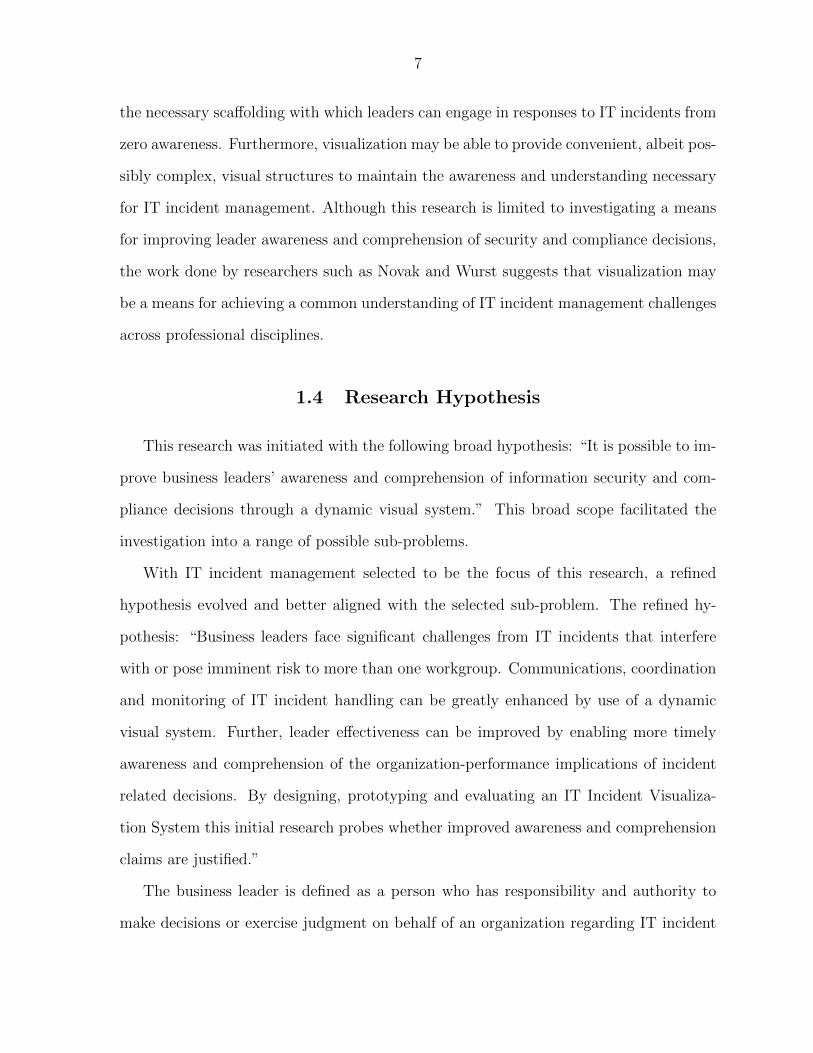
1.4 Research Hypothesis
This research was initiated with the following broad hypothesis: “It is possible to im-
prove business leaders’ awareness and comprehension of information security and com-
pliance decisions through a dynamic visual system.” This broad scope facilitated the
investigation into a range of possible sub-problems.
With IT incident management selected to be the focus of this research, a refined
hypothesis evolved and better aligned with the selected sub-problem. The refined hy-
pothesis: “Business leaders face significant challenges from IT incidents that interfere
with or pose imminent risk to more than one workgroup. Communications, coordination
and monitoring of IT incident handling can be greatly enhanced by use of a dynamic
visual system. Further, leader effectiveness can be improved by enabling more timely
awareness and comprehension of the organization-performance implications of incident
related decisions. By designing, prototyping and evaluating an IT Incident Visualiza-
tion System this initial research probes whether improved awareness and comprehension
claims are justified.”
The business leader is defined as a person who has responsibility and authority to
make decisions or exercise judgment on behalf of an organization regarding IT incident

8
management matters that affect business impact or risk. Organizations that may benefit
from this research are not limited to profit-oriented firms. Any organization, including
non-profits and government, using IT to enable their objectives should find benefit in
this research. In this context, the term “business” refers to the function or purpose of
an organization or its organizational units.
1.5 Research Sketch
In an effort to explore the potential value of business impact visualization in improving
decision awareness and comprehension, a prototype was developed informed by a user-
centered design approach. IT professionals needed a prototype for these concepts to be
sufficiently tangible in order to facilitate evaluation through interaction and application.
These professionals were asked to evaluate the prototype’s potential for improving their
decision-making, and to determine the broad potential benefit of visualization to the
selected problem space overall.
Starting with a broad outline of improving the awareness and comprehension of se-
curity and compliance events for business leaders, this effort enlisted the assistance of
seven experienced IT professionals in the Des Moines metropolitan area. These individ-
uals influenced the selection of a problem space, explored related challenges, contributed
to requirements definition and prioritization, reviewed designs and, finally, tested a pro-
totype. The group consisted of leaders and senior technical staff working in various
industries. At the end of the methodology, a group of unrelated IT professionals with
no prior knowledge of the research was asked to perform an objective evaluation of the
project. That evaluation is reported in this document and forms the basis of conclusions
regarding the research hypothesis.
9
1.6 Contributions Summary
This research makes three significant contributions to the security visualization field.
The contributions are Iterative Field Study Methodology, IT Incident Visualization Sys-
tem, and Practitioner-Oriented Evaluation Framework. The contributions are interde-
pendent, but could be decoupled and used in other security visualization contexts. This
section briefly introduces these contributions, more extensive descriptions of which will
be found in later chapters of this document.
1.6.1 Iterative Field Study Methodology
Although the adoption of user-centered design within the security visualization com-
munity is fairly common, this methodology embraced the commitment to user-centered
design by allowing the input of collective voices from a stable set of area IT profession-
als to be incorporated pervasively throughout the design process. This methodology
introduced an objective assessment of the end result by relying on a separate set of IT
professionals.

10
Iterative User Centered ApproachCommon Design Approach
Product Concept
Requirements
Design
Development&
Test
Release
Users
Users
Problem
Users
Understand
Users
Requirements
Users
Users
High LevelDesign
Release
Research TeamOr
Commercial Product Team
Users
Users
Users
Users
Development & Test
Requirements Priority
Figure 1.1: Design Approach Comparison
Figure 1.1 compares a fairly common approach to product design to the approach
taken in this research. As a point of clarification, a product release was not intended
from this research.
As shown in Figure 1.1, in a more traditional design approach product development
teams tend initially to target a market or challenge area for their product. They will
consult with customers, eliciting customer needs regarding the solution the product team
is interested in creating. The team may return to the same customers, as well as possibly
recruiting others to test preliminary versions prior to release. Customer feedback on this
preliminary testing has the potential to greatly influence the feature set early on; but
as customer testing proceeds, stability and performance become the primary objective.
After determining that it has been sufficiently tested, the product is then released to

11
all those willing to buy it or those who may have sponsored the product’s development
(e.g. in-house development projects). Further feedback on this release will influence
needs analysis for a future version of the product or initiate product corrections by the
development team.
The iterative field methodology used in this research explored the problems being
faced by users before selecting a problem on which to assist. These same users strongly
influenced the choice of a problem space. Efforts were made to explore the nature
of the chosen problem space and the challenges within it. With this understanding,
requirements were developed and reviewed with these users. In turn, these users shared
their preferences regarding these requirements, which led to requirements prioritization.
From these requirements, high-level designs were constructed and then reviewed by the
same group of users. Armed with these design insights, a prototype was developed.
These users tested the prototype and provided additional input that further motivated
prototype changes. A separate set of users tested the prototype as well. The cycle
between development and user evaluation could have multiple iterations prior to any
release to a broader audience.
This approach relies heavily on a set of users for guidance. Their guidance was
complemented by supplementary knowledge sources that included related literature and
researcher background. The objective of this approach was to reduce the likelihood that
the research hypothesis would fail to be validated due to a gross mismatch between a
design based on a researcher’s limited worldview and the intended user community.
1.6.2 IT Incident Visualization System
Business impact visualization started out as a broadly scoped research topic. The
field study directed the focus of this research toward IT incident management. The focus
was specifically on IT incident response and followup to IT incident closure. The security
visualization community has done impressive work in incident identification, but has for

12
the most part left incident response for others to address.
IT incident response is a team effort consisting of technical responders as well as
leaders who serve in various capacities. Several of the leader roles were the focus of
this IT Incident Visualization System design effort. Design efforts were devoted to the
“Incident Coordinator,” “IT Leader” and “Business Leader” roles. The implemented
functionality in a medium-fidelity prototype was directed to the IT Leader. A medium-
fidelity prototype is a software implementation of design concepts sufficiently complete
for someone to perform limited autonomous interaction with, but without the algorithms,
libraries and other functionality that would allow it to operate in a real-world setting.
Data provided was manually constructed, due in part to the absence of needed sources.
The software development necessary to integrate with real data sources was beyond the
scope of this effort.
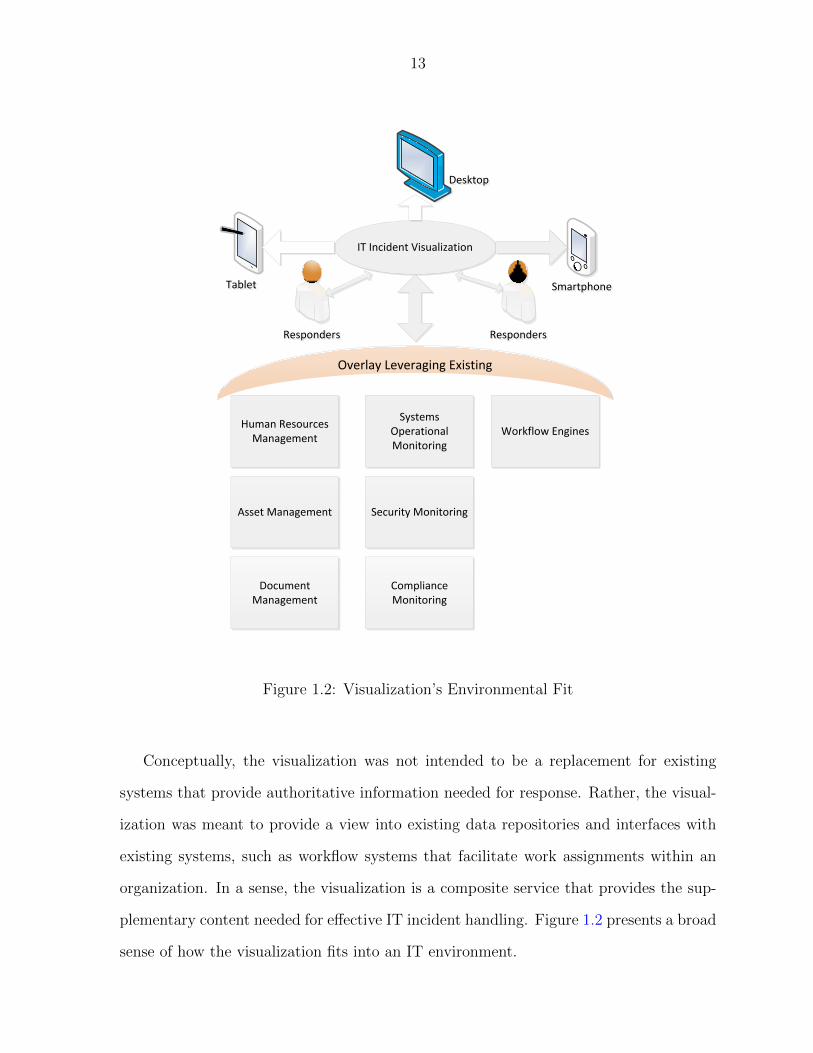
The IT Incident Visualization System was intended to provide interfaces based on the
role assigned to a particular user. A user may be assigned to multiple incidents for which
he or she is assigned a different role. The visualization provided access to information in
the areas of incident awareness, response awareness and coordination, and information
support. Field study input directed this effort to go beyond awareness and clarification
by allowing an authorized leader to influence the response from within the visualization.
13
Overlay Leveraging Existing
TabletTablet
DesktopDesktop
SmartphoneSmartphone
IT Incident Visualization
Human Resources Management
Systems Operational Monitoring
Asset Management
Workflow Engines
Security Monitoring
Document Management
Compliance Monitoring
RespondersResponders RespondersResponders
Figure 1.2: Visualization’s Environmental Fit
Conceptually, the visualization was not intended to be a replacement for existing
systems that provide authoritative information needed for response. Rather, the visual-
ization was meant to provide a view into existing data repositories and interfaces with
existing systems, such as workflow systems that facilitate work assignments within an
organization. In a sense, the visualization is a composite service that provides the sup-
plementary content needed for effective IT incident handling. Figure 1.2 presents a broad
sense of how the visualization fits into an IT environment.

14
1.6.3 Practitioner-Oriented Evaluation Framework
In order to proceed with an objective, independent validation of the research hypoth-
esis, it was necessary to build a framework to make that possible. Ideally, a sufficient
number of randomly self-chosen IT professionals, volunteer IT professionals who respond
to a general call for participation, participate in order for credible inferential statistical
analysis to be performed. This objective required evaluations to be conducted in a re-
peatable fashion in order to minimize researcher influence on the data being collected.
Time restrictions and logistical considerations required that multiple evaluators needed
to be accommodated in order to collect a large enough sample. The framework is a com-
posite of procedures, software, data-collection instruments, structured activity design
and data.
A crucial dimension to the framework is the context necessary for participants’ con-
sideration while performing their evaluations. The decision-making associated with IT
incident handling is context-sensitive. If there was one common decision to be made
during two IT incidents at the same point in the response, it would be very likely that
the differences between the incidents would prompt two different decision outcomes. The
environment in which an IT incident occurs has significant bearing on decision-making
as well. These contextual factors make up a large portion of the comprehension aspect of
decision-making. It is these contextual factors that the IT Incident Visualization System
strived to make accessible and understandable.
Although this framework was developed to facilitate the final stage of a specified
methodology for a medium-fidelity IT Incident Visualization System prototype, there is
much that can be repurposed to facilitate evaluation of other medium-fidelity prototypes
as well as high-fidelity prototypes within the security visualization field.

15
1.7 Document Organization
This document has seven chapters beyond this one. The second chapter explores the
relationship of this research to the current literature. The third chapter discusses the “It-
erative Field Study Methodology” used to develop a possible visualization approach for
assisting business leaders. The fourth chapter discusses the design of the developed “IT
Incident Visualization System.” The fifth chapter explores the “Practitioner-Oriented
Evaluation Framework” that was developed to validate the IT Incident Visualization Sys-
tem. The sixth chapter analyzes the results from the evaluations that were performed.
Chapter seven closes the discussion of the work to date with “Observations and Discus-
sion,” and the last chapter discusses areas of future exploration. Finally, a number of
appendices containing supplementary information are provided.

16
CHAPTER 2. REVIEW OF LITERATURE
This research into business impact visualization has been multidisciplinary, drawing
from various fields to design and implement the IT Incident Visualization System in
order to test a research hypothesis. The focus of this research has been to provide
substantive contributions to the field of security visualization. As such, the literature
review is focused within the body of work produced by other researchers in the security
visualization community (often referred to as “VizSec”).
The literature review is organized to align with this research’s three contributions of
IT Incident Visualization System, Iterative Field Study Methodology and Practitioner-
Oriented Evaluation Framework. The first portion of the review relates the literature
to the IT Incident Visualization System. The second subset emphasizes design method-
ologies used in security visualization research. The third area focuses on evaluation and
the structures promoting reliable assessment. The last section of this chapter provides a
synthesis and summary of how the work of others relates to this research.
Some of the work was chosen for an extended treatment based on the number of
aspects in common with the three research contributions. The discussion of these works
extends beyond the scope of the section containing them in order to avoid repetition.
2.1 IT Incident Visualization System
There are numerous papers that reference the term “incident” in many contexts. One
common use of the term connotes the meaning of an IT activity or event that is anomalous

17
and possibly malicious, and that needs further investigation in order to ascertain possible
motivations and consequences resulting from the incident to date (e.g.[7][8]). There is
a reasonable likelihood that the identified activity is non-malicious and/or of little to
no consequence. The term “incident” in this research is associated with activities or
conditions that have been confirmed as being an IT problem and that warrant a directed
response.
Many of the visualization efforts to date have been related to supporting IT personnel
in pre-incident or forensic analysis (e.g.[9][10]); support for less tactical decision-making
has come about only more recently. Up until recently, the security visualization com-
munity largely has not investigated solutions in support of leaders. An explicit attempt
to support the leader was reported by Erbacher[11], who describes a user-centered ap-
proach to improve high-level situational awareness for both network analysts and first-
line network managers. Erbacher’s design focuses on providing situational awareness by
presenting impact and vulnerability assessment. The usefulness of this solution appears
primarily related to pre-incident analysis and supporting decision-makers’ understand-
ing of environmental conditions that may influence incident declaration and response
actions. The objective of the IT Incident Visualization System was to support leaders
as well, but only after an incident is declared. Situational awareness was constructed by
providing financial, operational, compliance and security impact status of the incident,
as well as technical (e.g. systems) status.
Another recent paper sketches out an initial effort to support decision-making pro-
cesses related to computer network defense[12]. Horn and D’Amico appear to imply that
their efforts were for internal use only; however, given the strategic nature of the deci-
sions they attempted to address, their visualization certainly has the potential to support
leaders in their decision-making. They designed their tool to organize data classification
and data collection consistent with Endsley’s “Goal-Directed Task Analysis” framework.
This consulting tool initially appears intended as a process-improvement tool that allows

18
for analysis across multiple incidents, and that can inform decisions related to making
changes in future defense processes in addition to data collection and analysis. The
intention of process improvement is consistent with a requirement identified for the IT
Incident Visualization System, but the requirement was not addressed in this round of
research. Up to this point, the IT Incident Visualization System has been focused on
facilitating leaders’ response decisions related to active incidents on a per incident basis.
Rasmussen et al. presented NIMBLE (Network Intrusion Management Benefiting
from Learned Expertise), a tool designed for use in a Security Operations Center (SOC)[13].
Their visualization is an analyst’s tool intended to improve the performance of those who
keep watch on security monitors and analyze security event anomalies. The tool pro-
vides an interactive, graph-based presentation of Intrusion Detection System (IDS) alert
data, as well as presenting recommendations based on automatic matching to potentially
relevant historical analysis in order to assist with the classification of reported activity.
Like many other visualization efforts, this analyst’s tool is meant to assist in performing
triage on activities that could potentially result in reporting credible alarms of malicious
activity.
What distinguishes Rasmussen’s effort relative to others is the user-centered approach
to determine requirements by eliciting analyst feedback on low-fidelity prototypes. More-
over, the evaluation framework employed is documented. Rasmussen et al. designed
their evaluation to be a fully balanced parametric experiment, performing a comparison
between their graph-based display and a tabular view. Additionally, they tested the
effectiveness of the recommendations by varying their presence and the qualities of the
recommendations on a per-evaluation task basis. They report evaluating in structured
activities with 18 professionals, each with at least three years of experience. Evaluator
judgments made in each evaluation scenario are compared to prior established judgments
for those decisions.
There are a number of similarities between Rasmussen and the Practitioner-Oriented

19
Evaluation Framework, namely having professionals evaluate the proposed solution, re-
peatable evaluation structure, and assessing decision quality against predetermined cor-
rectness. One significant difference is in evaluation objectives. The hypothesis tested
in the IT Incident Visualization System research is a broader question than whether a
substitute design is better than an existing tool. Among other data, Rasmussen collected
qualitative data through informal verbalized feedback from those with time remaining,
as opposed to using a structured approach to collect feedback from everyone who par-
ticipated.
2.2 Iterative Field Study Methodology
When reviewing the security visualization literature, one can see that many security
visualization design teams do not utilize a user-centered methodology. There are, how-
ever, researchers who have embraced the notion that viable solutions require input from
the user at various points in the development process.
Conti’s visualization security dissertation was influential in the structure of this
project’s Iterative Field Study Methodology[14]. His user-centered approach involved
two separate populations over the course of his research. First, Conti collected user
needs through a survey completed by professionals at security trade conferences. From
this input, he generated requirements and designed a prototype. To test his prototype,
Conti used a set of master’s-level students and a set of senior undergraduates, all with
sufficient background to perform quantitative tests. The entire cycle of research was mo-
tivated by a fairly abstract research hypothesis. The use of students for evaluation may
have been expedient, but is not representative of the audience that appears to have been
the intended users of the tool. This may not have been a concern for Conti; however, for
the research being presented here, the hypothesis specifies the type of user for which the
visualization was developed. Conti did not return with intermediate results for further

20
user input beyond the initial needs collection and final evaluation. The methodology for
the present research, discussed in detail in a later chapter, avoids this shortcoming.
Although the paper written by D’Amico and Whitley does not introduce a visual-
ization concept for security visualization, they do provide a compelling report on the
results of a cognitive task analysis of the work performed by computer network defense
analysts[15]. This offers insight into the various roles and tasks these analysts performed.
Though D’Amico and Whitley’s targeted subjects were not leaders, these reported in-
sights inform the present research, filling a few gaps in the field study results. Although
the tasks of leaders are different, they have cognitive support needs in common.
In the context of the history of the Workshop on Visualization for Computer Security,
Komlodi et al. was one of the first teams to publish on attack-identification visualization
research efforts based in user-centered design. Komlodi used knowledge-elicitation tech-
niques, including in situ contextual interviews with practitioners[16], early prototype
demonstration to a focus group, and end-user usability evaluation of a later functional
system[17][18].
Komlodi’s research involved 16 professionals across the three user-centered activities.
Contextual interviews were done with nine practitioners having a variety of responsi-
bilities and backgrounds. They performed their demonstration for a focus group that
consisted of seven members of an IDS user group. The pool of four end-user usability
evaluators was made up of volunteers from among the initial nine contextual interviewees.
In essence, the group had 12 unique professional viewpoints in its study. A strict account-
ing comparison shows that, for the execution of the Iterative Field Study Methodology,
a group of seven professionals was consulted repeatedly during design efforts. After com-
pleting the development phase, a verification phase was performed with an evaluation
that elicited feedback from 17 unrelated professionals for a total of 24 unique professional
perspectives.
Although requirements were developed iteratively as a result of the initial contex-

21
tual interviews and the subsequent focus group’s response to a low-fidelity prototype,
Komlodi’s participants were not consulted either to comment directly or to prioritize
the collected requirements. Their usability study provides further insights for additional
iterations, but the participants were commenting only on manifestations of requirements
and not the requirements themselves. The Iterative Field Methodology effort followed a
similar approach to requirements collection, but the fundamental requirements that led
to the high-level design and subsequent medium-fidelity prototype were reviewed and
prioritized by members of the initial group of seven.
Fink et al. performed a multi-step, user-centered effort to develop a meta-visualization
that incorporated collections of visualization tools for presentation on numerous large
high-resolution displays in a massive interactive workspace[19]. They first interviewed
eight experienced analysts and viewed four others using the large displays within the con-
text of a sample problem. They followed this effort by designing mockups that suggested
effective uses for these large display environments, and then returned to the analysts for
feedback on the mockups. The sample data used to provide context for the interviews
and observations was fabricated by another source in preparation for the Visual Ana-
lytics Science and Technology (VAST) 2009 challenge. The researchers used a subset of
VAST data that presented the challenge of a scenario requiring analysis of multiple data
sources in order to determine whether an insider was inappropriately sending sensitive
information beyond the security perimeter of a mock embassy.
Unlike the effort by Fink et al., which assumes an initial solution, the Iterative Field
Study Methodology started with a broad inquiry and focused on a problem and sub-
sequent design approach based on participant input. Fink et al. report a number of
ergonomic challenges (e.g. snow blindness) and practical challenges (e.g. heat) associ-
ated with having eight thirty-inch panels arrayed over a desk. Their paper appears to
imply that they started with the assumption that an eight-panel array would be a viable
solution. Given the chance to influence the panel quantity and configuration, would the
22
analysts have provided input that might have suggested a different approach?
The VAST 2009 challenge data set provided mock log data that followed challenge-
specific conventions with respect to content structure and semantic significance. Al-
though the source types were fictional, the building access control and network traffic
sources that were conceptualized are reasonably common. By contrast, the Practitioner-
Oriented Evaluation Framework addressed a problem with no established conventions
beyond the isolated tools currently utilized. An implementation analysis of an IT In-
cident Visualization System leveraging the concepts presented in this research would
probably determine either that some source types do not currently exist, or that the
sources are not typically accessed or leveraged in the manner necessary for the proposed
concepts to be functional. Accordingly, this would require an uncommon assembly of
data sources and data with interrelationships not previously considered.
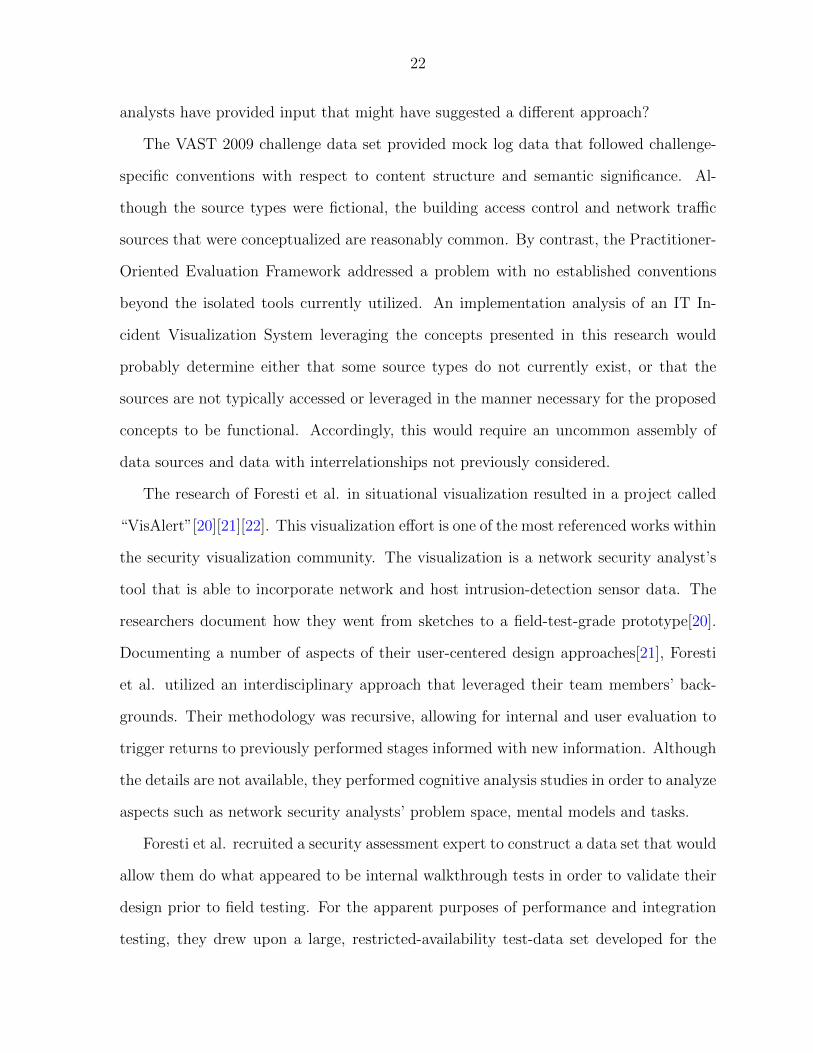
The research of Foresti et al. in situational visualization resulted in a project called
“VisAlert”[20][21][22]. This visualization effort is one of the most referenced works within
the security visualization community. The visualization is a network security analyst’s
tool that is able to incorporate network and host intrusion-detection sensor data. The
researchers document how they went from sketches to a field-test-grade prototype[20].
Documenting a number of aspects of their user-centered design approaches[21], Foresti
et al. utilized an interdisciplinary approach that leveraged their team members’ back-
grounds. Their methodology was recursive, allowing for internal and user evaluation to
trigger returns to previously performed stages informed with new information. Although
the details are not available, they performed cognitive analysis studies in order to analyze
aspects such as network security analysts’ problem space, mental models and tasks.
Foresti et al. recruited a security assessment expert to construct a data set that would
allow them do what appeared to be internal walkthrough tests in order to validate their
design prior to field testing. For the apparent purposes of performance and integration
testing, they drew upon a large, restricted-availability test-data set developed for the

23
intelligence community by Defense Advanced Research Projects Agency (DARPA). This
data set contained raw logs from network services applications, operating systems, and
network packet data, in addition to supporting context such as network topology and
scenario descriptions. Eventually, the researchers deployed a test implementation at a
military research lab, where experienced analysts used the tool and provided feedback.
The team once again returned to design and development and refined the tool based
on the analysts’ input. Formal evaluation testing was being planned, but a related
publication was not found.
As a point of comparison, the Iterative Field Study Methodology started with a user-
centered challenge analysis and ended with user input useful for further work. Foresti’s
resources and implied mandate must have been significantly larger. Starting with con-
cept and achieving deployment-grade software must have been a significant effort. When
putting development progress on an equal footing by comparing some initial design imple-
mentation of VisAlert and the medium-fidelity IT Incident Visualization System concept
prototype, there are considerably more user-centered touch points in the Iterative Field
Study Methodology. These points of user-centered influence occurred during require-
ments review, requirements prioritization, high-level design review, prototype review
and independent prototype evaluation. Foresti et al. performed a significant amount of
interpretation and design to reach their first usability test without further interaction
with the user. Reconciling their papers was somewhat challenging, but it would appear
that their first usability test took place when they implemented an “alpha test” at the
research lab[22]. Assuming conventional use of the term “alpha software,” the chosen
set of major functionality was nearly complete, although operationally unstable.
Erbacher et al. published a paper titled “A multi-phase network situational awareness
cognitive task analysis”[23]. The results of this task analysis informed the design of
the visualization reported by Erbacher in the previously mentioned paper[11]. Their
Cognitive Task Analysis process has nine steps, starting with an initial brainstorming

24
session and ending with a program manager review. This is the first task-analysis process
encountered that involved managers in addition to analysts, with both groups designated
as targeted users who were involved in five of the nine steps. The manager viewpoint was
incorporated in the first two steps, brainstorming and individual interviews, but does not
appear to be involved again until possibly the program manager review. Step 5 involves
analysts brainstorming and discussing task execution in the context of multiple prepared
scenarios. The last-mentioned user-oriented step is step 7. In this step, six low-fidelity
design alternatives developed in step 6 were presented to analysts for comment. This
led to the selection of two designs for implementation in step 8. They go so far as to
support the DARPA-sponsored restricted-use data set that Foresti et al. use. At step 9,
the program manager reviewed the outcome of step 8. It is unclear whether the assigned
federal program manager had experience as a first-line network manager. Hence, it is
not clear from the authors’ description that the targeted manager role was represented
at the review in order to contribute to the assessment of the final development outcome.
Erbacher’s research started with the much more concrete objective of improving pre-
incident situational awareness for both analysts and managers. In comparison to the It-
erative Field Study Methodology, they were able to focus their inquiry earlier and reduce
the number of steps needed to reach an equivalent independent evaluation. Although
their paper documents visualization requirements in combination with the scenarios de-
veloped in step 4, it is not clear that the user had an opportunity to directly influence
the requirements or their prioritization. The absence or lack of documented accounting
for manager participation past the initial interviews is an implied contradiction of their
objective of repeatedly returning to the user in order to seek guidance as the design pro-
gressed. By contrast, the leader role was the sole focus of the IT Incident Visualization
System, and leader roles were represented in each user-centered phase of the Iterative
Field Study Methodology. It is unclear whether those taking part in Erbacher’s program
review had the opportunity for an individualized, interactive hands-on-situated experi-

25
ence. Those independent professionals who took part in the IT Incident Visualization
System evaluation most certainly did.
Guenther et al. introduced two new ideas to the community[24]. They suggest that
multi-touch interactivity (e.g. Apple iPad interactivity) will improve network security
analysts’ ability to perform their analytical duties. They also suggest an alternative
approach to user-centered design. Instead of relying on Cognitive Task Analysis to
elicit design requirements, they suggest methods based on Activity Theory. Beyond
introducing concepts related to Activity Theory, they do not document the Activity
Theory-based method that led to their multi-touch design, nor do they report any user
testing of their solution. Discussion of the Guenther paper could have been postponed
until the later discussion of future work, as the further investigation of Activity Theory
might merit future incorporation. The purpose of having the discussion in this section
is to illustrate that design methods are an active discussion within the community.
2.3 Practitioner-Oriented Evaluation Framework
The nature of user evaluation of visualization solutions within the security visualiza-
tion community is a mixed bag. These range from informal feedback collection based on
walkthroughs to carefully designed and executed hands-on user assessments. Evaluation
goals are commonly related to collecting detailed usability feedback. There have been
evaluations that compare user performance when using a new approach against estab-
lished alternatives such as tabular views or popular network analyzers (e.g. Wireshark).
Those who attempted to obtain reliable results would formulate the evaluation tasks to
be performed and carefully managed their order of execution.
A fairly common managed-evaluation event format appears to be one in which the
participants are briefed on the research, provided training on the tool(s) to be used, and
then perform tasks using the new solution and, possibly, an established tool as well;

26
the event then ends with participants providing feedback either informally or through a
survey. Task completion time is monitored in the comparison tests, and in some cases
the expiration of allotted time results in warnings. The limited review of structured
evaluations does not make clear how participants are made aware of their tasks or how
they communicate the outcomes of their task-related efforts. Rasmussen ([13]) dedicated
a small portion of the interface to the capture of the task outcome and provided a time-
remaining indicator for the task at hand.
Beyond the previous references, there is one paper worth noting related to evaluation.
Goodall reports on a comparative evaluation designed to be of a repeated measure within
subject design[25]. At the time of writing, Goodall commented that user testing was still
unusual within the security visualization community. In context, the term “user testing”
appears to be related to the empirical testing of a visualization solution’s efficacy with
respect to improving user performance. Goodall recruited eight students for the test.
The students’ participation consisted of being briefed on the research and the two tools
to be evaluated, getting training on one of the two tools, completing a set of timed tasks
using one tool, getting training on the second tool, completing another set of timed tasks
with that alternative tool, and, finally, providing satisfaction feedback via a survey. It is
unclear how long this procedure took.
Goodall mentions that the evaluation tasks were either “well-defined” or “exploratory.”
Well-defined tasks had one possible correct answer, while exploratory tasks required par-
ticipants to draw one of many possible conclusions. Well-defined tasks consisted of
multiple questions. The mechanism used to provide the task details to the participant
is not documented, and it is unclear how the participants’ conclusions were captured.
However, Goodall mentions that a student and a researcher walked through a series of
tasks together during the training. It is likely the researcher remained to observe and
manage the task-delivery process and task-outcome collection.
The data set for the evaluation appears to have been arbitrary subsets of data origi-

27
nating from the HoneyNet Project. This approach to assembling the evaluation data set
is likely a symptom of the functional value that traffic analysis tools provide in terms of
offering environmental information in the context of what is being analyzed.
The time committed by each participant was not documented, and the training seg-
ments had no time limits, thus allowing participants to become familiar with each tool at
their own pace prior to using it. It is reasonable to think that each participant commit-
ted at least two hours to complete the entire sequence of activities. Goodall notes that
each student had taken at least one course in computer networking, but it is not clear
if the students had any background in relevant analysis strategies to complement the
functional training on each tool. Goodall explains that experts were not chosen because
they would likely have distorted the results, i.e. experts would have been exceptionally
proficient using the mainstay tool for comparison with the visualization, thus resulting
in the mainstay outperforming the visualization solution for which the experts would
have had relatively little training.
In the context of the Practitioner-Oriented Evaluation Framework, it was unreason-
able to expect independent professionals with no stake in the research to devote more
than 90 minutes. Any comparison between Goodall’s evaluation and the IT Incident
Visualization System concept evaluation is therefore inappropriate, as user performance
and concept validation are very different test objectives. Yet, some of the evaluation
tasks developed within the Practitioner-Oriented Evaluation Framework align fairly well
with Goodall’s idea of well-defined and exploratory tasks. Still, in all cases the range of
outcomes was constrained by a fixed list of options, as opposed to Goodall’s support for
a broad range of outcomes.

28
2.4 Summation
Visualization support for handling an IT incident after the incident has been declared
has not been investigated up to this point. Furthermore, business leaders have been
underserved in the security visualization research community. Of the research potentially
oriented toward business leaders, it is uncertain how involved these leaders were in design
review and evaluation processes.
The employment of user-centered design methodologies is not uncommon, but has
not been universally adopted. Among user-centered approaches, most researchers made
significant assumptions regarding viable solutions prior to their first user-centered session.
Beyond collecting sufficient user input in order to develop requirements, the requirements
were not user-evaluated until well after being implemented in mockups or prototypes.
By contrast, the methodology used in this research sought out user needs prior to making
design assumptions. Moreover, the requirements were directly influenced and prioritized
by the user community.
Many researchers did attempt to elicit user comment on their efforts prior to publica-
tion. In many cases informal feedback was sufficient for the researcher. The independence
of the users consulted is not discussed in any of the work reviewed. Some researchers do
note when they returned to people they had consulted previously, and in certain cases
it is clear that those who participated in the evaluation were different. But the lack of
transparency regarding organizational affiliations and contract relationships of the users
makes social independence a challenge to determine in many cases. Significant efforts
were made during the execution of the Iterative Field Study Methodology to ensure that
final evaluation feedback was collected from professionals with no prior connection with
the research, as well as limited ties to the Information Assurance Center.
The Practitioner-Oriented Evaluation Framework designed for this research was the
result of a combination of research objectives, including concept-oriented prototyping,

29
concept-validation evaluation objective, convenient independent professional participa-
tion in evaluation, the business leader as targeted user, the information requirements
of aiding IT incident handling, and progressive situation assessment and related task
execution. This combination of objectives had not been addressed before, thus making
a custom evaluation framework necessary.
Although each of the three main contributions are original with respect to the security
visualization community, the literature review shows that these contributions have com-
monalities with other efforts to suggest that they could be of interest to the community
and have been developed into a reasonable form.

30
CHAPTER 3. ITERATIVE FIELD STUDY
METHODOLOGY
The methodology presented in this chapter centers upon the intended user. This
chapter will delve into the details of this methodology, including some intermediate
results.
3.1 Introduction
The Iterative Field Study Methodology was designed to leverage the notion that
user-centered design results in designs that are more consistent with user expectations
and improves the likelihood of a usable human-computer interface by the intended user
group [26],[21],[27]. This methodology was iterative in that, as the research progressed
from problem definition to a resulting tangible visualization, a stable collection of user-
community representatives was repeatedly consulted. While a single researcher executed
this methodology, a team of researchers could also adopt the procedure.
This methodology hinged on the cooperation of two distinct and independent rep-
resentatives of the user community. The first group of community representatives was
called the “Study Group”; the second was called “Independent Professionals.”
The two groups had complementary purposes. The Study Group provided input that
shaped both the scope and nature of intermediate research outcomes, while the Inde-
pendent Professionals group performed the final validation role. Beyond the primary
validation of whether a resulting visualization system achieved an overall research hy-

31
pothesis, the Independent Professionals provided an indirect check on whether the Study
Group’s input was reasonable, and whether its insights were properly captured, analyzed
and integrated. By continuing beyond the validation performed by the Study Group, this
method attempted to determine the general application of the insights gleaned as well
as the resulting visualization. It also avoided the influence of any emotional investment
in the final results that may have developed between Study Group members and the
project, as well as between members and the researcher. The Study Group knew that
their ultimate objective was to assist in developing a visualization that would, in fact,
be evaluated by other professionals, thus giving them context from which to draw their
insights and feedback.
Although members from both groups broadly represented the same user community,
there were nonetheless significant differences among them. Each member of a group
met designated qualifications. With only the broad goal of improving security visualiza-
tion for business leaders initially, the backgrounds or professional roles of Study Group
members were not precisely consistent with those of the Independent Professionals. The
reductive, focusing nature of the methodology led to isolating a particular leadership role,
which meant certain members of the group spoke less authoritatively when role-sensitive
inquiries were made. Although this lack of authority did not exclude their involvement
and contribution of useful insights, it further reinforced the need for the Independent
Professionals group.
The Study Group as a population was stable at a size of seven, with the seventh
joining after the initial field stage was conducted. Their ongoing involvement was in large
part determined by the alignment between their availability and the research schedule.
The Institutional Review Board (IRB) reviewed and approved the execution plan for
this methodology.

32
3.2 Methodology
The methodology developed for this research expands upon a fairly common prod-
uct development practice described by Ulrich and Eppinger[28]. The methodology was
comprised of a number of stages, as depicted in Figure 3.1. The stages have been placed
in two columns. The left column is titled “Researcher Activity,” indicating that these
stages were performed without involving user-community representatives. There are two
stacked columns on the right side of the figure. The top right column is the set of activ-
ities involving the Study Group, while the bottom right represents those performed by
the Independent Professionals. The need to progressively reduce and narrow the scope
of research prior to investigating the next level of detail is represented by an inverted
triangle in the background of the figure, with key scope-of-research milestones indicated
on the left of the graphic.
There were additional dimensions associated with the stages involving the Study
Group and Independent Professionals. The rims of the stage objects are either solid or
dashed, indicating whether a given stage’s purpose was, respectively, either a continua-
tion of the forward progression in reaching the stage of prototype evaluation (solid) or
a touch point seeking confirmation of understanding as well as prioritization (dashed).
Most interactions with the Study Group were done in a one-on-one setting, with each
participant speaking from his or her own perspective and understanding. These isolated
meetings elicited ideas that needed to be identified, interpreted and consolidated prior to
incorporating them into the larger body of knowledge. As indicated by the stages with
dashed borders, it was necessary to return to the Study Group to ensure that the re-
searcher understood the member(s) correctly, and that there was general agreement as to
what was learned. Beyond this confirmation, it was also necessary to make choices before
moving forward. In this user-centered approach, these choices were heavily influenced
by the priorities the study participants shared with the researcher.

33
Visualization Needs for Leader Decision
Making
IT Incident Visualization for
Leaders
Visualization for Incident
Coordinators, IT Leaders, Business
Leaders
Visualization Prototype for IT
Leaders
Research Scope Milestones
Independent Professionals
Researcher Activity Study Group Participation
B. Understanding the Need
E. Prioritizing the Needs
H. Understanding Selected Task
L. Review & Influence Requirements & Understanding
N. Prioritize Requirements
Q. Review High Level Designs
T. Review Visualization Prototype
V. Industry Public Evaluation
U. Adjust Prototype
S. Develop Visualization Prototype
R. Analyze Design Review
P. Develop High Level Designs
O. Interpret Requirement Priorities
M. Revise Requirements
K. Identify Requirements
J. Identify Actors & Dynamics
I. Analysis of Task Exploration
G. Need/Task Selection
F. Analysis of Need Priorities
D. Develop a Catalog of Needs
C. Analysis of Visualization Needs
A. Define Problem and User Group
Research Scope
Figure 3.1: Iterative Field Study Methodology

34
The second and somewhat subtler dimension illustrated in Figure 3.1 is the shading
gradient in user-community stages. The shading gradient provides an indication of the
common tools used to elicit responses across the stages. Table 3.1, below, describes the
relationship of these elicitation tools to the particular stages. For the sake of brevity,
a detailed description of the tools will not be provided; further description of how the
tools were used can be found in the stage descriptions that follow. Any literature used
as guidance to develop the actual tools is listed in Table 3.1.
Table 3.1: Methodology Stages: Tools and Related Literature
Stages Tools ReferencesB, L, Q Semi-structured interview [27], [29], [30], [31]
E Informal Voting -
H, T, V Blend of Tools -H: Semi-structured interviews, concept mapsT: Pre- and Post-surveys, cognitive probe surveytesting, semi-structured interview, preparedhands-on experienceV: Pre- and Post-surveys, prepared hands-onexperience
H: [27], [29], [30],[31], [32]T: [33], [34], [35],[36], [37], [38],[39]V: [38]
N Analytical Hierarchical Process [40], [41], [42]
3.2.1 Recruitment
Although not included in Figure 3.1, recruitment was an important stage encompass-
ing two phases. The first phase was to assemble the Study Group. The second, was to
invite another set of professionals to participate in the Industrial Public Evaluation.
3.2.1.1 Study Group
Recruitment was conducted by emails sent to IT professional mailing lists, such as
InfraGuard and Information Systems Security Association (ISSA), as well as by direct

35
outreach to professionals. Criteria for participation in the Study Group required prospec-
tive participants to be technology professionals responsible for considering the effects of
information security and compliance events on their organizations. The initial commit-
ments participants were asked to take part in three to fifteen sessions over a period of
12 – 18 months, with a total time commitment of up to approximately 15 hours.
Table 3.2 shows the high-level professional characteristics of those who joined the
Study Group, as well as their levels of participation. The median number of sessions was
15, with the median time spent by Study Group participants at nearly 19.5 hours. There
were, in total, 80 distinct knowledge-gathering sessions, representing roughly 115 total
recorded hours of professional participation. The time reported in Table 3.2 was based
on interview recording lengths. Social and administrative activities such as scheduling,
greeting and miscellaneous conversations, as well as the requirements prioritization effort,
were not included. The reported professional biographical information was collected at
the first session.
Participant ID 499, who joined the study after the IT incident management topic area
was selected, was an outlier in terms of IT experience and professional role. This partici-
pant provided broader incident management context to the study, given the participant’s
firefighting, Emergency Medical Technician (EMT) and natural disaster training and re-
sponse experience. Participant 499’s contribution to the study was limited to Stages H
and Q, as indicated in Figure 3.1.
3.2.1.2 Independent Professionals
Given the research objective of independence for the final evaluation, and limiting
bias due to familiarity with the researchers and topic, members of the Independent
Professionals group were recruited indirectly using the following mechanisms:
• General calls for participation through professional mailing lists and forums, in-
cluding InfraGuard, ISSA, ISACA, and the Iowa Technology Association;
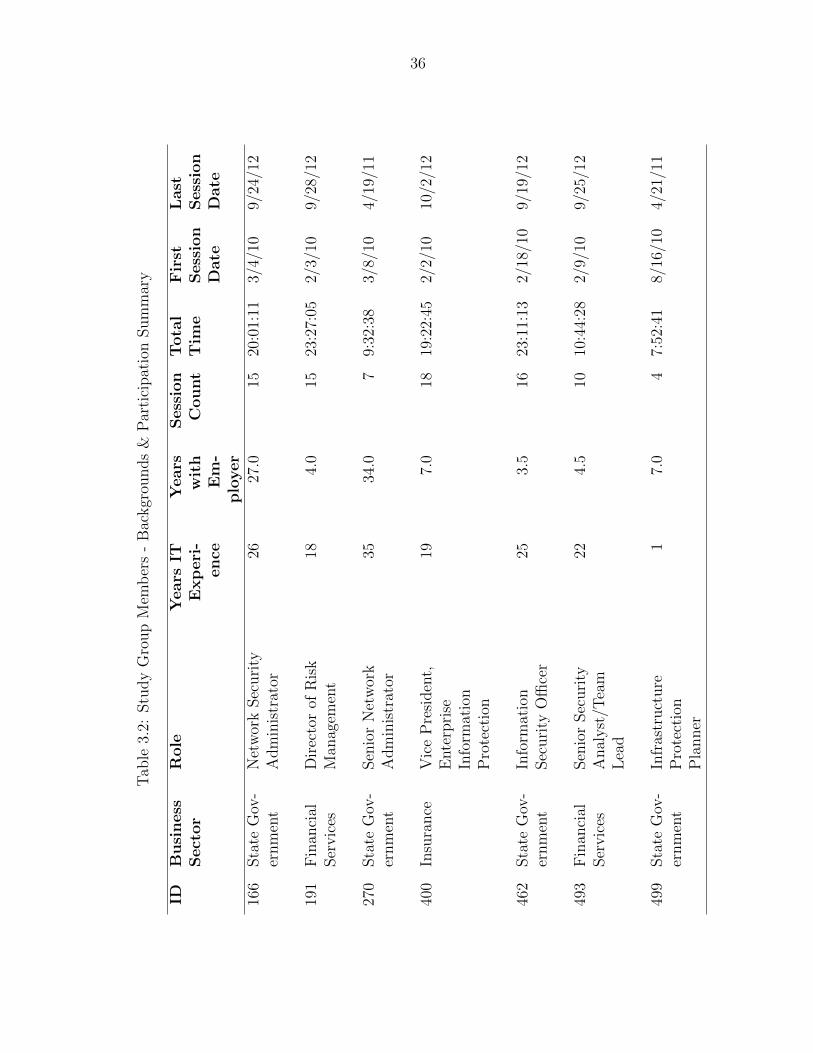
36
Tab
le3.
2:Stu
dy
Gro
up
Mem
ber
s-
Bac
kgr
ounds
&P
arti
cipat
ion
Sum
mar
y
IDB
usi
ness
Sect
or
Role
Years
ITE
xp
eri
-ence
Years
wit
hE
m-
plo
yer
Sess
ion
Count
Tota
lT
ime
Fir
stS
ess
ion
Date
Last
Sess
ion
Date
166
Sta
teG
ov-
ernm
ent
Net
wor
kSec
uri
tyA
dm
inis
trat
or26
27.0
1520
:01:
113/
4/10
9/24
/12
191
Fin
anci
alSer
vic
esD
irec
tor
ofR
isk
Man
agem
ent
184.
015
23:2
7:05
2/3/
109/
28/1
2
270
Sta
teG
ov-
ernm
ent
Sen
ior
Net
wor
kA
dm
inis
trat
or35
34.0
79:
32:3
83/
8/10
4/19
/11
400
Insu
rance
Vic
eP
resi
den
t,E
nte
rpri
seIn
form
atio
nP
rote
ctio
n
197.
018
19:2
2:45
2/2/
1010
/2/1
2
462
Sta
teG
ov-
ernm
ent
Info
rmat
ion
Sec
uri
tyO
ffice
r25
3.5
1623
:11:
132/
18/1
09/
19/1
2
493
Fin
anci
alSer
vic
esSen
ior
Sec
uri
tyA
nal
yst
/Tea
mL
ead
224.
510
10:4
4:28
2/9/
109/
25/1
2
499
Sta
teG
ov-
ernm
ent
Infr
astr
uct
ure
Pro
tect
ion
Pla
nner
17.
04
7:52
:41
8/16
/10
4/21
/11

37
• Indirect recruitment by emailing calls for participation to senior IT managers via
an alias “IAC Outreach Coordinator”; and
• Direct recruitment of organizations to host evaluations, with organization repre-
sentatives contacting prospective participants through internal communications.
The last recruitment mechanism listed was the most effective. Generic calls for par-
ticipation were, in large part, ineffective. It appears that, absent encouragement and
support by a respected champion or manager, the target audience filtered out these
calls. The general nature of the venue was implicit in the calls, with various locations
booked in West Des Moines, Des Moines and Ames, Iowa, and those responding to the
general calls were able to walk to the venue. In the general recruitment scenarios, mul-
tiple mid-day sessions were planned for Tuesdays, Wednesdays and Thursdays. Events
arranged using the last recruitment mechanism were exclusive to the organization’s em-
ployee population and held in conference rooms in their offices. Although setup logistics
might have factored into a given hosting organization’s considerations, it appeared that
in general organizations preferred to schedule private evaluation events after the lunch
hour.
Recruitment criteria for Independent Professionals were that 1. a prospective partic-
ipant was an IT professional who is an IT Leader, 2. a qualified person should have had
direct IT incident response involvement for at least one IT incident, and 3. a qualified
person should have had past experience with evaluating business risks associated with an
IT incident. Personnel management experience was not required. The time commitment
involved performing one evaluation of up to 75 – 90 minutes in a single session.
In order to collate all survey results in a common chapter, the description of the
actual professionals recruited for this group is provided in Chapter 6.

38
3.2.2 Stage A. Define Problem and User Group
3.2.2.1 Objectives and Methods
One objective of this stage was to define the research problem in a manner sufficiently
structured so as to provide boundaries on the research space for Study Group partici-
pants, but without overly constraining their considerations. A second objective was to
define the user community the visualization research was intended to serve, based on the
following criteria:
1. A community interested in the research objectives;
2. The likelihood that qualified community members could be recruited for user-
centered design activities; and
3. Size and accessibility of the user community.
3.2.2.2 Outcomes
Business impact visualization, as a topic of research, was intended to provide con-
ceptual bridging support between technical resources (both human and application) and
business leaders in order to improve awareness and understanding of security and com-
pliance events, and to support decision-making for specified tasks.
Although the specific criteria for recruiting Study Group members has been described,
a more general description might characterize the Study Group as a collection of expe-
rienced IT professionals who function as business leaders or are senior technical staff
who interact with business leaders frequently, so those user group members engaged
in communicating and understanding security and compliance events. Moreover, these
members made relevant decisions or supported those who do.

39
3.2.3 Stage B. Understanding the Need
3.2.3.1 Objectives and Methods
The first direct contact between researcher and Study Group members took place
in this stage, which had two objectives: first, to establish rapport, gather professional
background information and elicit the nature of the members’ current professional roles;
and, second, to identify possible needs this research could investigate.
While exploring possible needs, participants were asked to articulate these in the
form of tasks or business processes that could be enabled through visualization. In their
book, Dix et al. state that an interactive system is intended to assist a user in achieving
goals with respect to practical undertakings[26]. Dix defines tasks as “operations to
manipulate the concepts of a domain” ([26],pg. 125). The authors further define a goal
as “the desired output from a performed task” ([26],pg. 125). In a semi-structured
interview setting, the intention was to elicit tasks and goals that the present research
effort could investigate via visualization.
3.2.3.2 Outcomes
After executing this stage with the initial six members (IDs 166, 191, 270, 400,
462, 493), a fairly detailed collection of professional background and work environment
data was collected. Along with the members’ professional history, raw needs data were
collected as well. The professional information in Table 3.2 comes from this data.
3.2.4 Stages C. and D. Analysis of Visualization Need and Develop a Catalog
of Needs
3.2.4.1 Objectives and Methods
In these stages, interview tapes were reviewed and information transferred into text
form. Concept patterns were extracted from these interviews by reviewing the audio files

40
and assembled text. The objective was to isolate viable visualization needs, which was
consistent with the problem definition specified in Stage A (Section 3.2.2).
The method of extraction was simple lexical feature extraction, isolating concepts
not mentioned by other participants and augmenting the description of concepts held in
common. After extracting these distinct concepts, the next step was to craft a description
of each concept, thus constructing a catalog of needs.
3.2.4.2 Outcomes
The data collected in Stage B yielded a variety of complex business challenges with
the potential of being addressed, in part, through visualization. The catalog of challenge
areas and their high-level descriptions can be found in Appendix B. These needs were
sufficiently complex that no single research project could adequately address more than
one of them.
3.2.5 Stages E. and F. Prioritizing the Needs and Analysis of Needs Prior-
ities
3.2.5.1 Objectives and Methods
After identifying a collection of visualization problems, it was necessary to choose.
If the needs identified were functional issues arising from a common business problem
space, it might have been possible to address multiple needs in one research project.
As the needs reflected broader problems, it was necessary to select only one. In either
case, a selection had to be performed, thus resulting in the first stage of reducing the
scope of the research to be performed. In order for this process to be consistent with the
user-centered design philosophy, it was necessary to consult the Study Group. Beyond
establishing the priority of needs, it was necessary to confirm that these visualization
needs were identified and characterized with sufficient accuracy. Stage E was the first
followup stage in the methodology.

41
A simple voting scheme was chosen to elicit members’ input. The approach was to
distribute the catalog of needs and ask each Study Group member to pick three. Beyond
selecting three problem areas, Study Group members were asked to answer the following
questions for each task selected:
• How would you rank the general importance of the task from 1 (low) to 10 (ex-
tremely)?
• How would you rank this task relative to the others you selected? (Ties are ac-
ceptable.)
• How is this task relevant to your organization today?
• How will this task be relevant to your organization in the future?
• Although this task may be new to your organization, would you be able and willing
to answer questions related to the performance of this task?
The last question was posed because, while it was possible a member might vote for a
need, the member might be unable or unwilling to assist. After having read the catalog,
a participant could have been inspired by something they had not considered previously.
3.2.5.2 Outcomes
All six members responded to the request to vote. The respondents answered the
previously listed questions as well.
The responses were analyzed from the perspective of the number of votes and their
general importance, as well as relative rank. Responses to the questions about the current
and future relevance of a task or need to organizations added an additional perspective
to the numerical and ranking responses. The results for the top three needs can be found
in Table 3.3.

42
Table 3.3: Top Three Needs
Need Votes Avg.General
Importance
Avg.Relative
Rank
Ability &Willingness
IncidentManagement
5 8.0 1.6 100%
ComplianceManagement
4 7.0 2.0 100%
Risk Management 2 9.5 1.0 100%
Although a number of other needs received at least two votes, “Risk Management”
received the highest general importance score. The “Compliance Attestation Support”
need, by contrast, received no votes; further, the Study Group member who proposed the
idea found other needs more compelling. There were some needs that received a single
vote, but the pertinent group member felt uncomfortable answering questions related
to how the task was performed. Given the goal to return to group members in later
stages, this unwillingness to answer related questions made those needs (i.e. “Problem
Management,” “Senior Leadership Decision Support”) unusable for this research effort.
One shortcoming of this data-collection mechanism was that group members did not
answer the “ability and willingness” question for tasks they did not recommend for the
study. This meant that it was unclear whether the one person who did not recommend
“Incident Management” might be willing and able to discuss it nonetheless.
3.2.6 Stage G. Need/Task Selection
3.2.6.1 Objectives and Methods
After collecting a potentially diverse set of possible tasks, the selection process began.
The original plan for this stage of the methodology was to select three needs/tasks for
further investigation and implementation. This plan was formulated as part of the IRB

43
study proposal, which was submitted prior to executing any portion of this methodology.
Having performed Stages A – D, it was clear that only one need/task should be chosen.
As an aid to the need selection process, a set of questions was used to evaluate each
suggested task. These questions and the answers for the selected need can be found in
the next subsection for this stage.
3.2.6.2 Outcomes
Incident Management was the need chosen after considering answers to the following
questions for the other tasks. The questions and answers that follow are therefore related
to Incident Management. The bolded questions were critical. A task would have been
rejected if any these questions were answered negatively. If more than one need passed
the critical questions, the task with the most desirable sets of responses would have been
selected.
• Which decisions are relevant to the tasks and goals?
– Attack impact on the business, resource allocation, mitigation options and
mitigation option impact on business.
• Are these decisions important?
– Quotes from Study Group responses from Stage E.
∗ “This task is important because of the ongoing need for communication
and correlation of incidents.”
∗ “Incidents do occur and we need to be able [to] respond effectively.”
∗ “Incident management is vital to our org. It is how we meet both effective
security management goals and meet regulatory requirements.”
∗ “All business leaders [are] not aware of all incidents that occur or the
potential impact on the organization.”

44
∗ “This function would provide much needed incident assessment informa-
tion to be used in quickly directing agency response and priority.”
• Are these decisions likely common among business sectors in the U.S.?
– Absolutely.
• Are the participants able and willing to provide task analysis support
for the task?
– Yes, there are at least five group members willing to assist.
• Do participants consider this task important?
– Yes, this task is important in both absolute and relative terms.
• How unique is the task relative to the others suggested?
– Given only the broadest understanding of these tasks, there are some similar-
ities to Compliance Management and Risk Management.
• Can the task be subsumed by another task?
– No, the dynamics between Incident Management and Compliance Manage-
ment, as well as Risk Management, are somewhat similar; however, timeliness
is a critical aspect of Incident Management.
• Does the task now have enough definition to be investigated further?
– Yes, Incident Management appears to be sufficiently defined.
• Would its inclusion meaningfully add to the coverage of the business impact visu-
alization problem space?

45
– Yes, Incident Management appears to be important to nearly all group mem-
bers. Time constraints on decision-makers enhance the value that business
impact visualization can offer if an effective visualization approach can be
constructed.
• Does the task have a reasonable chance of being successfully supported
through visualization?
– Yes. Nothing about the Incident Management problems would indicate that
visualization would be inherently intractable to design or use.
3.2.7 Stage H. Understanding Selected Task
3.2.7.1 Objectives and Methods
The objective of this step was to explore how the selected task would be, or was being,
accomplished by the participants’ organizations. Several task-analysis approaches were
explored, including those with a cognitive orientation such as Critical Decision Making
(CDM)[29], Applied Cognitive Task Analysis (ACTA)[30] and the unnamed approach
taken by Pfautz and Roth[31], as well as approaches such as Hierarchical Task Analy-
sis (HTA) and Task Analysis for Knowledge Description (TAKD)[43][44]. There were
many challenges related to eliciting knowledge, and by adopting a credible, established
method some of these challenges were avoided or at least minimized. Tacit knowledge, as
described by Polanyi[45], was a key consideration as participants expressed their under-
standing of the challenges, goals, contributing decision factors and situational context.
Klein attempts to address tacit knowledge as well as perceptual learning in CDM.
The combination of semi-structured interviewing with a conceptual mapping ap-
proach was taken, incorporating one or more documented task-analysis approaches. The
implemented approach drew heavily from “Working minds: a practitioner’s guide to
cognitive task analysis”[32], as well as [27][29][30][31]. Selected questions used in the
46
semi-structured interviews were taken directly from these works. The concept-mapping
session execution approach was strongly influenced by Crandall et al.[32] as well as the
technical report written by Novak and Canas[46].
Thorough execution of an existing approach was complicated by the number of re-
searchers needed, level of training necessary for implementing the approach, rigor of the
output, level of useful detail, time costs and expense. Given the practical constraints of
training, time and personnel, the objective of the research methodology was to capture
the spirit of the selected amalgam of documented approaches.
The objectives of the knowledge and decision process elicitation phase in this stage
resulted in identifying incident classes, incident management expertise, incident man-
agement roles, challenges, incident frequency, information needs, the pros and cons of
leadership incident management involvement, motivations related to incident manage-
ment, and the exploration of challenging incidents. No existing system provided incident
management visualization, so participants were unable to express their needs at a func-
tional level. Therefore, the more external or behavioral aspects of task analysis regarding
activity lists, visual element design, necessary affordances, and current interface pitfalls
were not ascertainable at this stage of the research.
3.2.7.2 Outcomes
All seven Study Group members participated in this stage, yielding a significant
amount of input. Twenty-three sessions were held among the seven members, resulting
in over 27 hours of recorded discussion.
Concept mapping was performed only with those participants who had the time, incli-
nation and expertise to explore “focusing questions.” Although some focusing questions
were planned in advance, most came primarily from the first semi-structured interview
sessions. A concept map was constructed interactively between a group member and the
researcher. After the concepts were nearly complete, with ideas and relations explicit,

47
the researcher worked independently to clean up the visual layout and any apparent log-
ical inconsistencies. The member who provided the input reviewed the map. One map
was put aside after it became apparent that it was too employer-specific. The focusing
questions explored were, “What is a security incident?,” “How does a leader influence
their interest/involvement thresholds?,” and “How does integrated incident management
function?” Beyond distributing the resulting maps to the group, no session time was de-
voted to eliciting feedback from group members other than their authors. Unfortunately,
the dimensions of these maps are not conducive to this document’s format restrictions,
and therefore have not been included.
3.2.8 Stage I. Analysis of Task Exploration
3.2.8.1 Objectives and Methods
The objective of this stage was to integrate the ideas shared by group members in
Stage H and to synthesize a firm understanding of IT Incident Management based on
the varied responses to the elicitation probes. In order to achieve this understanding,
observations were gleaned from multiple passes through the group member input. Ob-
servations were sorted into “Ideas,” “Decisions” and “Notions.” Ideas were observations
participants made in the course of performing their roles as IT incident responders. De-
cisions were choices or judgments that leaders made during an IT incident. Notions were
beliefs regarding IT incident management that resulted from direct statements by one
or more participants, or logical patterns resulting from reviewing participant input and
integrating it with knowledge of the subject matter.
3.2.8.2 Outcomes
Working documentation developed over this stage collected more than 325 Ideas,
more than 90 Decisions and more than 100 Notions. After exploring logical relations
between the Notions, it was determined that Notions could be assembled into nuanced
48
perceptions of IT incident management called “Principles.” In some cases a Notion was
sufficiently significant to merit membership in the Principles category on its own. Ideally,
members in each category were sufficiently refined so as to be distinct, but in fact there
may be inflation in these. Duplication was erroneous in certain cases, but some members
were kept distinct in order to preserve nuance. A sample of each analysis category is
provided in Appendix C to assist in understanding the outcomes of this stage.
3.2.9 Stage J. Identify Actors & Dynamics
3.2.9.1 Objectives and Methods
A common practice in user-centered design is to identify the actors who will be
affected directly or indirectly by the intended system[27][26]. Having identified the actors,
the next step is to develop profiles for them. Having developed a context for the actors,
the final step is to understand the activities and objectives of the actors[32]. These
analysis activities are part of the overall task-analysis process.
After analyzing the output from Stage H, a number of actors were identified. The
concept mapping and interview responses provided insights that allowed the task struc-
tures within IT incident management to be identified and expressed in graphical layouts.
A holistic “swim lane” flowchart was developed to provide a broad overview of the IT
incident-handling lifecycle. IT incident management today is a communications and co-
ordination effort that is all but manual or enabled by communication technology with
limited integration with information systems. The few information systems that are
relevant are isolated and commonly serve only one actor class (e.g. network health mon-
itoring, security event monitoring). Due to the lack of a functioning platform on which
group members have experienced IT incident management tasks being performed, it was
necessary to superimpose tasks on a conceptual placeholder. Hierarchical Task Analysis
was used to lay out the task structures or task hierarchies and describe activity patterns
within those task hierarchies with plans[26].

49
3.2.9.2 Outcomes
Actors
As shown in Figure 3.2, a variety of roles were identified that have at least a selective
interest in the awareness of incident particulars. There were essentially five core roles to
IT incident management that became the focus of this visualization. These roles are the
“Incident Coordinator”, “Incident Response Team Member”, “IT Leader”, “Business
Leader” and “Stakeholder”. Beyond the roles within the inner core were those users
potentially affected by the incident in terms of disruptions or the unintended disclosure
of sensitive information. External parties were those entities having statutory, regulatory
or contractual obligations to know about classes of incidents. Given the broad range of
possible external parties, business relationships and classes of possible incidents, it is
reasonable to consider some of these entities as possible stakeholders on a per incident
basis. Internal affected users were considered to be potential stakeholders on a case-by-
case basis. The key difference between a stakeholder and an external party was that
the organization had an expectation of controlled secondary disclosure. In other words,
the organization could expect that, without formal approval, the details of the incident
would not be shared beyond direct external party participants.

50
Incident Awareness
Incident Coordinator
Incident Response
Team Members
IT LeadersBusiness Leaders
Stakeholders
External Parties
Level of Detail &Understanding
Level of Detail &Understanding
Access to Details
Affected Users
Figure 3.2: Incident Awareness Among Actors
Communication with affected users and external parties was conducted through con-
trolled means and included liaisons, public relations specialists and managers. Other
than being a possible source of information for designated intermediaries, data provided
by the visualization was not expected to be accessible to affected users and external
parties.
Incident Coordinator
The Incident Coordinator is responsible for the timely investigation and restoration
of normal operations of the affected systems. Timeliness was a somewhat subjective
parameter, given the complexities of determining incident impact and cost. Nonetheless,
whatever priority level an incident had been assigned, the Incident Coordinator was
responsible for meeting that expectation.
The “Event Coordinator”, not depicted in Figure 3.2, is a similar role that performs

51
external communications and coordination activities with respect to the response team.
This may be potentially either a dedicated role assigned to a designated person or the
related duties are incorporated among the responsibilities of the Incident Coordinator.
The Event Coordinator role was determined to need a current and nearly as complete
an understanding of the incident as the Incident Coordinator, because the Event Co-
ordinator was primarily responsible for communications and resource coordination with
Business and IT Leaders, “completeness” in this sense was more a description of breadth
than depth of technical understanding.
The background of the Incident Coordinator varied by organization and incident. In
certain organizations an Incident Coordinator was a senior subject matter expert who
specialized in networks, applications, databases, storage, servers or security. Though
having no management authority, these technical Incident Coordinators were nonethe-
less typically empowered to involve any other technical person within an organizational
unit. Some organizations have IT directors take charge of incident coordination upon
designation of an event as an incident, and yet others transfer coordination as an esca-
lation procedure. A managerial coordinator often relies heavily on senior subject matter
experts to provide technical advice and interpretation of incident particulars, as the cen-
tralized incident management approach results in these managers being responsible for
a full range of incident types related to operations, security and compliance.
Responsibility for incident coordination was commonly associated with operational
ownership of the affected system. If a senior technician or IT director was responsible for
a system’s operations, then any incident related to that system was their responsibility.
Information security incidents were possible exceptions in organizations with a less
unified incident management framework. Information security was a concern that cut
vertically from business operations down to bits on the wire. Further, a security incident
often has a historical dimension, in that a previously unknown incident may have been
initiated months or even years ago, and potential malicious activity may be current or

52
may have ceased. Malicious intent was not a prerequisite for a security incident. Impact
upon or risk related to the confidentiality, integrity or availability of information in or
on all forms of media and information-handling components fell within the scope of in-
formation security. Dedicated security personnel typically addressed these wide-ranging
incidents.
Incident Response Team Members
Team members came from a wide range of backgrounds. The response team consisted
of people who had competency or expertise in various technologies and business processes
affected by the incident. Members could be service provider employees or contractors
who were either already on site or called in specifically for the incident. The team could
be geographically dispersed by being separated by floor, or in different buildings, cities,
states or even countries.
Service provider members and other vendors who were not physically present on
organizational property were commonly secondary members of the team, since many
times there was little transparency to their activities, priorities and knowledge. It was
probably safe to assume that the reverse was true as well. The organization would treat
these members more like external parties than trusted core participants.
Responsibilities of the primary team included technical activities such as troubleshoot-
ing infrastructure components, root cause analysis, software fixes, computer forensics
and application administration. Less technical activities included obtaining signed agree-
ments, business process reviews, contract discussions and collecting supporting documen-
tation. Incident particulars drove the need for the type and level of expertise needed, as
well as determining the nature of the activities team members performed.

53
IT Leaders
IT Leaders came from a variety of educational and professional backgrounds. Front-
line managers direct technical staff, ensuring projects are completed within acceptable
timeframes and quality standards, and many are responsible for the availability and op-
erational integrity of the platforms entrusted to them. As one participant put it, these
managers “keep the wheels on the bus.” It was uncertain whether a common level of
understanding of technical details could be expected from frontline managers. Ideally,
they had a conceptual model not only of the contributions the systems under their care
made to their particular organizational unit, but also to the organization overall.
Continuous change in technologies and architectures raises significant challenges for
leaders to maintain some level of technical mastery as they distance themselves from
technology design and operations with each move up the leadership hierarchy. Middle
and upper managers in the IT organizational structure were less in touch with technical
knowledge, and were progressively more focused on strategic challenges. As incidents
become more severe in impact, escalation procedures commonly dictate that upper-
level managers take responsibility for making decisions with progressively greater risk to
operations and/or recovery costs. In some respects this approach matches responsibility
with pay grade, as well as taking advantage of an organizational worldview that is better
aligned to negotiate between potentially conflicting business objectives or demands. In
addition to its technical complexity, there was a real possibility that an incident that
had escalated might represent significant uncertainty in terms of root cause and time to
repair. One participant raised the point that well-known or straightforward incidents are
dealt with confidently, and typically with little if any escalation. A possible exception
was when the scope of impact was large, but the root cause had been readily identified
and recovery expedited. For example, a power outage to an office building may result in
the loss of climate controls and worker productivity. In this case, after assuring personal

54
safety and data center operations, the incident response is primarily a matter of patience
and communication with the service provider. Poor disaster planning may require service
triage in order to conserve the backup power supply.
The IT Leader’s role within incident management was varied. Some organizations
had IT Leaders directing response on site, while others had leaders external to response
efforts authorizing actions, allocation of resources, direct costs, appointment of the In-
cident Coordinator and communications with affected business units. IT Leaders were
responsible for setting priorities or complying with priorities set by upper management.
Business Leaders
Business Leaders, understandably, were focused on their businesses. Unlike IT Lead-
ers, who are familiar with the causes of operational failure and deal with incidents rou-
tinely, Business Leaders may never be involved with IT-related incidents. Any given
incident they were consulted on might have been their first in a very long time, if ever.
Simply put, IT-related incidents were not on their radar. Incidents escalating to the
point of Business Leader involvement were not just serious disruptions to processes, de-
pending upon the affected systems, but awareness of and participation in the incidents
could potentially disrupt a significant portion of the Business Leader’s day(s).
Given Business Leaders’ responsibilities and motivations, awareness of and involve-
ment in an IT-related incident must be absolutely relevant to them and their purposes.
Interest was commonly limited to impact, length of time to repair and resumption of
services. Often, impact was something Business Leaders assessed and conveyed to the
incident response team, as only they fully understood the value an affected system had
to the business. Their involvement may be sought in order for incident response plans
and possibly costs to be authorized. Also, they may be asked directly or indirectly to
contribute to any prioritization evaluation taking place within or between active inci-

55
dents.
Stakeholders
The business function of persons in this category cannot be narrowly defined. In
certain respects, some stakeholders walked a fine line between wanting to be aware of an
incident and not caring much more than a typically affected user. Stakeholders were not
commonly asked to be involved directly, but often attempted to maintain awareness of
the incident. Incident awareness helped stakeholders anticipate impacts on their respon-
sibilities as a result of the incident. As the incident evolves and response progresses, the
incident may affect interdependencies of direct concern to the stakeholder. Depending on
interest and needs, a stakeholder may want access to the complete portfolio constructed
for an incident. Compared to the rest of the core set of incident awareness participants,
stakeholder access to information in terms of detail and update frequency was not nearly
as compelling.
Affected Users
There were several classes of affected users, including customers who relied on offered
services; customers whose information was held by the organization; the general public
accessing public information resources; internal staff directly responsible for generating
revenue through sales, manufacturing, order fulfillment or providing billable services; and
internal staff who in some manner supported business operations. The class of affected
user(s) contributed to the assessment of an incident’s impact.
These users were kept distant from incident response, as organizations typically re-
strict the release of information on a need-to-know basis. The timing of their awareness
was contingent on establishment of a concrete understanding of incident details relevant

56
to a particular user class. Data breach notification timeframes, as well as the content
and methods of communication, were based upon adherence to statutory and regulatory
requirements. Business Leaders or IT Leaders informed internal users with details such
as the systems affected, loss or degradation of functionality, and time to repair.
External Parties
External parties consisted of numerous relevant entities based on attributes such as
class of organization (e.g. Securities and Exchange Commission (SEC) and publicly
traded companies), business sector, and accepted methods of payment (e.g. Payment
Card Industry (PCI) and e-commerce sites), as well as the nature of the incident. In
governmental organizations, security incidents were reported to a Computer Security
Incident Response Team (CSIRT), and possibly to a Chief Information Security Officer
(CISO) with broad oversight requirements. Law enforcement was initially external, but
could potentially become much more integral to the response. Business partnership
negotiations dictated when and how much involvement was needed by a business partner
for a particular class of incidents.
Since communications regarding incidents were often difficult, legally awkward and
even embarrassing, the inclination was not to disclose incidents, regardless of whether
the incident had been resolved or was historical. However, statutes, regulations and,
possibly, legally binding contracts required the organization to overcome its desire for
privacy and communicate to outside entities. The questions of when, how, what and
to whom to communicate information were commonly answered by those specializing in
compliance. In some cases, the person responsible for communicating with an external
party was designated prior to an incident. And in many cases, communications with
external parties required legal consultation in order to ensure a proper interpretation of
the applicable legal language, and to minimize the potential exposure to liability from

57
communicating too much information.
Dynamics
The flow chart provided in Appendix D addresses the high-level interaction among
the five core response team roles. The symbols used are those of traditional flow-charting.
The flow of response activities is not always toward closure of the IT incident, as there
are circumstances that require the return to a previously completed task. To assist
with making flow in the “forward” direction easier to distinguish from “backward” flow,
the backward flow indicators are drawn with dashed lines. Activities that straddle swim
lanes are potentially collaborative activities between the actors designated in those lanes.
The IT incident management processes across organizations appeared to have much in
common, but each organization adopted a process that had unique elements. The flow
diagram is an attempt to provide a fairly generic representation of IT incident manage-
ment. When fielded, a viable visualization solution would need sufficient flexibility to
accommodate differences in workflow.
A number of task structures were developed superimposing the concepts identified
in Stage I (Section 3.2.8) onto a yet-to-be-designed visualization system. The process of
identifying tasks was in part influenced by the requirements being drafted in Stages K
(Section 3.2.10) and M (Section 3.2.12). Performance of this stage (i.e. Stage J) did not
stop until Stage P (Section 3.2.14). Task structure diagrams were constructed for the
following tasks:
• Get started
• Achieve general awareness of business
• Achieve updated awareness of incidents
• Achieve updated awareness of a specified incident

58
• Achieve general awareness of business and explore an incident’s details
• Achieve updated awareness of incidents and explore an incident’s details
• Achieve updated awareness of a specified incident and explore the incident’s details
• Achieve updated awareness of incident and identify assigned tasks
• Perform decision/judgment task
• Achieve updated awareness and report on task status and outcomes
• Achieve updated awareness of incident while responding to notification
• Achieve updated awareness of incident and determine priority changes in assigned
tasks
• Incident assessment: cause, symptoms, time sequence of events, impact, measure-
ment, consequences, unknowns, responsible parties
• Response plan selection and approval
• Response resource acquisition
• Response role management
• Response resource tasking
• Response monitoring and logistical issue awareness
• Awareness monitoring and management
• Escalation monitoring and management
• Incident management improvement
• Control change evaluation

59
• Incident introduction
• User-directed communication
The tasks were structured from the perspective of the actors, namely Incident Coor-
dinator, IT Leader and Business Leader. A sample of task structure diagrams is provided
in Appendix D.
3.2.10 Stage K. Identify Requirements
3.2.10.1 Objectives and Methods
Requirements bridged the conceptual divide between the IT incident management
problem space and the tangible visualization system. While post-processing the in-
teractions with group members, there was an opportunity to gather rough ideas that
contributed to the requirements development process. The initial objective of this stage
was not so much to formulate fully refined requirements language as to throw a wide
net around the comments, ideas and thoughts these conversations provoked during post-
processing.
Having collected the raw set of preliminary requirements, an intense refinement pro-
cess began. One thing to note is that group members were not necessarily software or
visualization designers, and that the conversations in Stage H (Section 3.2.7) were not
designed to elicit requirements directly. While constructing the set of requirements, it
was necessary to integrate input from relevant visualization research[15][47][48] and other
authorities.
Designing a system required making choices. When choices were a matter of ad-
dressing one requirement at the expense of another, it was necessary to establish an
explicit priority. A truly user-centered design approach depended upon the users them-
selves to dictate priority. A formal requirements ranking methodology was utilized to
capture an objective and consistent ranking of requirements. Formal ranking systems

60
such as conjoint analysis[49] and Analytical Hierarchical Process (AHP)[40] are plagued
by scalability issues. Both require pairwise comparisons, which translates to (N×N−1)
comparisons. To illustrate this problem, when considering the evaluation of ten require-
ments, we find that ninety comparisons need to be made. Further, abstract conceptual
requirements anticipated for this visualization were more difficult to compare than re-
quirements or attributes for which one has an experiential understanding (e.g., “Do you
prefer the flavor of oranges or apples?”). As the cognitive load placed on a group member
needed to be minimized in order to avoid frustration and produce valid feedback, the
number of requirements formulated had to be manageable.
This requirements design constraint raised the challenge of how best to structure the
requirements and designate the level of generality. Broadly described general require-
ments covered more design space, but typically were not actionable at the developer level.
Moreover, broad language had a greater risk of comprehension errors and interpretation
inconsistencies across group members. The alternative was a set of requirements written
with precise, even “granular” language that covered a narrow partition of the design
space. To compensate for this lack of coverage, quantity quickly escalated. A compro-
mise was needed. AHP allows for requirements to be posed in a hierarchical fashion. By
leveraging the hierarchy, one could isolate more granular requirements into subsets, thus
reducing the number of pairwise comparisons, and still get the conceptual clarity needed
for high-level design.
3.2.10.2 Outcomes
The initial round of unrefined requirements yielded 85 preliminary requirements,
and consolidating those yielded 65 intermediate requirements. The 65 requirements
were clearly too many for any group member to rank, so a more philosophical approach
was taken. A set of broader, high-level requirements that addressed the conceptual
dimensions of the visualization was drafted. Given this broad scope, a second round of

61
supportive requirements was needed to provide guidance for the high-level design phase.
Leveraging the hierarchy between these two levels of requirements definition appeared to
be a reasonable compromise between quantity and level of effort for the group members.
The requirements in their final form are provided in Appendix E.
3.2.11 Stage L. Review & Influence Requirements & Understanding
3.2.11.1 Objectives and Methods
This stage represented a vital followup activity. Having processed all the various in-
puts, it was necessary to share what was learned from the “Understanding Selected Task”
stage. The researcher first needed to verify whether the resulting synthesis tracked with
reality. Moreover, the requirements resulting from the analysis needed to be validated,
corrected and supplemented, if necessary. A second objective was to discuss the inter-
pretation and intention of each requirement. The parsing and interpretation of language
is subject to contextual and subjective understanding. In order for the requirements
prioritization to be useful, then, each responding group member needed to interpret each
requirement consistently.
Another key objective of this stage was to inform the group members of the change
in research scope. Analysis to this point yielded three actors who were leaders and would
benefit from a visualization system. Up to this point, the group members knew only that
the research scope had been limited to IT incident management.
3.2.11.2 Outcomes
Five group members were available for followup sessions and the upcoming require-
ments prioritization activity in Stage N (Section 3.2.12). Overall, feedback on the broad
understanding of the nature, actors and challenges of IT incident management was pos-
itive. The discussions tended to explore the various observations a bit further, based on
what resonated with a given group member at the time.

62
Several suggestions regarding requirements language were made. In a couple of cases,
the requirements discussion yielded new features (e.g. 1.C Report, 4.D Response Role
Management, 4.E Timeline and Dependency Awareness) and isolated aspects of others
(e.g. 3.B Interactive Internal Users, 3.D Passive Non-Core Actors), thereby yielding new
requirements. The group members did not identify any requirement as superfluous, a
fact participant 493 stated explicitly. The requirements in their post-revision form are
provided in Appendix E.
3.2.12 Stage M. Revise Requirements and N. Prioritize Requirements
3.2.12.1 Objectives and Methods
With only one requirements review and discussion iteration, revising and adding re-
quirements during Stage M was challenging. It was necessary to incorporate the insights
of the group and care was needed with language revision to avoid diverging too far from
the original intentions discussed with group members. Both requirements labels and
requirements definitions were changed. The primary basis for changing a requirement’s
label was that the original label inadequately conveyed the requirement’s objective. Re-
quirement feedback that narrowed the scope of an original requirement tended to in-
troduce new requirements in order to preserve the design space coverage. New features
also yielded new requirements. As a consequence of these changes, new requirements
increased the effort group members would invest in the prioritization process. Another
consideration was that, whatever the cause for a new requirement, group members would
see them for the first time during the ranking exercise. The risk of comprehension mis-
alignment was naturally higher, so the potential benefits of the requirements had to
outweigh the dissonance that inconsistent comprehension might introduce.
Those Study Group members who participated in Stage L (Section 3.2.11) were asked
to perform the prioritization process. It was necessary that each participant review the
requirements language and context with the researcher before prioritization.

63
The requirements prioritization followup process was based on AHP[40]. Each group
member performed the pairwise comparisons at their own pace and as their schedule
permitted. This meant that a group member could spread the effort over several pri-
oritization sessions. Researcher involvement was limited to providing prioritization ma-
terials, checking on status and collecting the prioritization forms. The materials sent
consisted of the revised requirements and the instruction and prioritization forms found
in Appendix F.
The leadership actor classes of Incident Coordinator, IT Leader and Business Leader
were identified as viable targets of this research, and the prioritization process was struc-
tured to accommodate any differences in needs among them. At the risk of statistical
shortcomings within the results, group members were asked to rank requirements based
on an assigned leadership role. Leadership assignment was based on each group member’s
professional experience. Furthermore, explicitly setting the assumed role was meant to
clarify the context in which a group member should evaluate the pairwise options.
The analysis plan was to use the resulting preference value for each first-level require-
ment to weight the subordinate (i.e. second-level) requirements’ preference values. This
allowed all second-level requirements to be ranked relative to one another, and avoided
group members having to rank all second-level requirements directly (i.e. 190 pairwise
comparisons as opposed to 1332). This approach also provided greater insight into the
relative priority of the broad features (i.e. first-level requirements) and the capabilities
most needed by the leadership role.
3.2.12.2 Outcomes
The five group members who participated in Stage M participated in Stage N as
well, with the following role assignments: the Incident Coordinator was represented by
participants 166 and 462, the IT Leader by 400 and 493, and the Business Leader by
191.

64
In order to compute AHP-preference values, consistency index and consistency ratio
the program Matlab was used. In addition, MS Excel was used to prepare reciprocal
matrices and input patterns for Matlab, as well as to facilitate results analysis.
The consistency index and ratio created as part of the AHP computations showed that
some participants had trouble being logically consistent with their responses. Logical
consistency is a concept independent of variance. Logical consistency tells us that when
A is ranked higher than B, and B is ranked higher than C, then it would be logically
inconsistent to rank C higher than A. Such inconsistency occurs frequently, according to
various authors. Saaty, developer of the AHP method, recommends that a consistency
ratio of 0.10 be accepted as indicative of good logical consistency[40]. Karlsson suggests
that a much higher but unspecified ratio is common in practical evaluation contexts,
particularly with software requirements ranking[41][42].
A noticeable improvement of consistency was seen when ranking judgments were
aggregated across multiple group members. Aggregation of ranking was done using a
geometric mean, as recommended by Saaty. Aggregated ranking inputs were then pro-
cessed through the AHP method instead of attempting to average the AHP results for
each respondent. The averaged ranking across all five group members provided an ex-
ceptional level of consistency. The rankings computed from the input of all five group
members was designated the “Overall Leader,” which was treated as a composite of the
Incident Coordinator, IT Leader and Business Leader roles. The leader-based aggre-
gations (e.g. average of two IT Leader inputs) showed an improved consistency, but
typically not the same level of improvement seen when using the averaged ranking across
all five ranking responses (i.e. “Overall Leader”).
The Business Leader rankings were less logically consistent, given individual idiosyn-
crasies and the lack of additional Business Leader respondents to help yield greater con-
sistency. The logical consistency ratios for the Business Leader ranged from 0.1059 to
0.3404. (Rankings were considered acceptable if the consistency ratio was 0.35 or lower.)

65
Frankly, it was difficult to remove even the most inconsistent inputs across leader roles,
given the weaknesses associated with such small samples (e.g., one consistency ratio was
as high as 1.4). One exception was seen in the IT Leader ranking of “Incident Handling
Documentation” sub-requirements, with a ratio of 0.5053. This ratio was influenced by
the previously mentioned inconsistency represented by a ratio of 1.4. Possible reasons
for high ratios included poor appreciation for the requirements being ranked, fatigue and
attempts to voice preferences emphatically, thus causing imbalance in the ranking values.
The ranked listings by leadership role, as well as the second-level requirements, can
be found in Appendix G. The results are ranked from lowest to highest.
3.2.13 Stage O. Interpret Requirement Priorities
3.2.13.1 Objectives and Methods
The objective of this stage was to glean coherent and reliable guidance from the
prioritization results, which turned out to be challenging. Beyond the reliability issues
of consistent requirements interpretation, group member logical consistency, and small
leader-role sample sizes, there was the challenge of interpreting the numbers. It was clear
that one requirement had been ranked higher than another, but how does a ranked list
provide guidance?
Other than for the Business Leader, requirement priority interpretation was per-
formed on the aggregate inputs collected for the IT Leader, Incident Coordinator, and
Overall Leader perspectives. Even with that determined, however, AHP results interpre-
tation was nonetheless challenging. For someone with a more holistic and forward-looking
view of how incident management visualization might be used, some choices appeared
to be odd. This observation has less to do with those exceptionally high-ranked require-
ments than for those requirements given such a low preference rate that one might infer
their exclusion or dismissal. But, given that these requirements were not rejected or
combined during the requirements review discussions, one could not conclude that re-

66
quirements priority results advocated their exclusion. The current “state of the art” may
have stifled imagination, or it may have been difficult for a group member to extrapolate
value from a given feature without any experience with it in current solutions. For exam-
ple, in the 1970s, would the fact that in 2011 the number of emails sent over the Internet
surpassed letters sent through the U.S. postal system have been widely considered?
Nonetheless, the preference results did indicate the relative added value that each
requirement provided, both overall and to leader types in particular. On this basis,
then, it was decided that, based on their ranking, prioritization results would drive
design emphasis and focus.
The rest of this section discusses the approaches explored in order to interpret the
significance of the AHP results. Before proceeding, though, it is worth considering that
questions such as “Why were particular choices made?,” or “What message should be
extracted from members’ preferences?,” risk drawing false conclusions. The data may
support a given interpretation with which the participants may very well disagree, based
upon a much simpler motivation. For example, one could imagine a response such as, “I
had an hour to spend on the ranking, and my answers made sense to me at the time.”
Kano Quality
A product quality model proposed by Kano Noriaki (the “Kano Model”) categorizes
requirements or product features/qualities in terms of customer satisfaction. Zultner
suggests that the Kano Model has three types of user requirements: expected, normal
and exciting[50].
• Expected Requirements: Features a user expects, meet but do not exceed expec-
tations. The lack of these features or their poor implementation would be very
vexing.

67
• Normal Requirements: Features desired that achieve user satisfaction in relation
to the degree to which they are instantiated.
• Exciting Requirements: Features that astonish users and are very pleasing when
available and enacted deftly. Since these features are unexpected, there is no risk
of discontent if they are not present. Their successful implementation are often
what sets the product apart from the competition.
The Kano Model was considered a potential lens through which to interpret the
preferences voiced by participants. Low-priority items would simply be interpreted as
“expected” and those more widely preferred as “exciting.” In between, the requirements
would likely be labeled “normal.” Given the uniqueness of this visualization effort,
there was relatively little found to be “normal.” The most appropriate comparison
was between the visualization and the isolated processes performed today. Clearly, the
visualization must perform as well as current processes, and would be disappointing were
it not superior to current efforts.
One simple method was to assign Kano designations to each requirement by divid-
ing the requirements into three subsets of roughly equal cardinality based on preference
weights. This assumed that the rationale behind the weights was a matter of expectation,
and that bucket sizes for the Kano categories would be roughly equal. This interpretive
method did not appear to consider that any practical solution that might replace or min-
imize reliance on current isolated IT incident management processes would necessarily
be welcomed. The proverbial bar could be fairly low, thus setting expectations fairly low
in general. With expectations low, a large portion of the requirements would fall into the
“exciting” category, thereby losing the distinctions desirable for effective requirements
prioritization. As for the preference weights, the AHP comparison criterion specified was
for the participant to rank by importance, which could be interpreted to mean relevance.
Applying the Kano Model to the requirement priorities was helpful but not sufficient.

68
Requirement Dependencies
Ideally, requirements should be constructed to be independent of – and therefore
possibly substitutes for – each other. For example, an automobile needs a source of
propulsion, which is a dependency. Within an automobile’s use case there are potentially
multiple independent substitutes available, such as a four-cylinder gasoline engine, six-
cylinder diesel engine, hybrid, all electric or fuel cell. Although hybrid, all-electric and
fuel-cell propulsion have common elements such as an electric motor, these approaches
are positioned in the automotive industry as substitutes. Requirements developed for the
visualization could be viewed as a progression of added value, with many requirements
dependent on or interdependent with each other. These dependencies were based on
software design principles as well as the progressive nature of a user’s cognitive and
functional needs within IT incident management. A non-monolithic network protocol
stack such as TCP/IP is both conceived and implemented as a progression of network
services. Protocol layers have both interfaces that provide value directly to the user as
well as those upon which other layers within the stack depend to add their own value.
By articulating requirements as a progression, an evaluator and designer could see
how some of the more elaborate features and use cases came into being. This, however,
muddies the ranking evaluation and interpretation of results. A lower-ranked requirement
may not be directly relevant to a leader, but without it features of interest will not func-
tion properly. Another interpretation of the prioritization could be that a group member
may not have been able to envision a particular feature’s function without relevant de-
pendencies and, wishing to ensure their inclusion, therefore inflated a requirement’s direct
user value (DUV), i.e., the benefit a requirement provides to the user firsthand. There
were many potential nuances considered when interpreting the preference weight a group
member assigned to a requirement. The interpretive assumption established was that

69
group members ranked requirements based on the importance of a requirement’s DUV
to their AHP comparison context.
Distribution of Preference
Another approach to gaining insight and direction from the requirement ranking
results was to order by rank the sub-requirements for the purpose of analyzing the dis-
tribution of preference by leader type. This was performed by accumulating the pref-
erence weight, starting with the sub-requirement with the highest weight, then adding
the corresponding descending preference weights for each of the sub-requirements until
a cutoff threshold was reached. Those sub-requirements in the ranked list falling after
the threshold was reached were excluded from the set of preferred sub-requirements for
that threshold. The converse was true, in that sub-requirements “accumulated” prior
to the cutoff were in the preferred sub-requirements set. The threshold was then varied
in order to observe the corresponding preferred sub-requirements set. The amount of
sub-requirement rejection is inversely proportional to the threshold. The preferred sub-
requirement set for a threshold of 65% will have fewer requirements than for a threshold
of 90%. Choosing a threshold was challenging, because an overly restrictive set could
result in an unworkable or uninteresting visualization design from the perspective of the
user community. A complementary challenge was that a high threshold did not discrim-
inate as to preference, and therefore was counterproductive with respect to obtaining
guidance and insight.
In order to make analysis manageable, thresholds of 65%, 70%, 75%, 80% and 90%
were analyzed. As one would expect, nearly all sub-requirements fall within the first
90% of accumulated preference weight. Not only was there interest in understanding
the needs of the three leader roles, it was also important to understand needs that were
common across leader types. Such knowledge could potentially assist the researcher in

70
understanding both the degree and form that requirements should take in the role-based
interfaces. One possibility was that there would be so much in common that role-tailored
interfaces were unnecessary. The Venn diagram provided a convenient organizing struc-
ture with which to analyze these interrelations.
Interpretation through Consolidated Lenses
None of the dimensions or lenses of interpretation mentioned were sufficient for use
on their own; however, a combination of these provided a rational interpretation. From
the outset it was clear that the visualization needs for an Incident Coordinator, IT
Leader and Business Leader were not the same (see preference values in Appendix G).
An effective visualization would need to be tailored to the user’s incident response role.
Another important observation was that, once manifested, not all requirements would
be directly manipulated by or even visible to the user. These were called “contextual
requirements.” For example, the sub-requirement “3.A Intra Core” speaks to the need
for the core response actors, described earlier in Stage J (Section 3.2.9), to be able to
communicate with one another through the visualization. This requirement was more
relevant to a use-case or operational context than to an actual communication mechanism
the user would employ in order to effectively communicate. The use-case or contextual
requirements were essentially a second class of sub-requirements. In this visualization
research, the most relevant requirements were those that yielded features that were seen
and/or interacted with. These were called “visible requirements.”
The interpretive dimensions were integrated by applying the distribution-of-preference
lens, followed by requirement dependency and then Kano Quality. The first lens acted
as a filter that allowed the group members’ preference weights to dictate those require-
ments to be excluded. Due to requirement dependencies and basic expectations, the strict
application of a user-based weighting exclusion would have resulted in an inadequate so-

71
lution. The requirement dependency and Kano Quality lenses provided opportunities to
iterate through the “excluded” requirements and restore them based on the rationale of
requirement dependency and expectation.
In order to apply the preference distribution lens, a threshold had to be chosen.
The threshold could not be chosen based on an arbitrary numerical selection, but in-
stead only after reviewing the composition of the resulting “included” requirement sets
for each of the leadership roles. Group members were not asked to evaluate the require-
ments as “contextual” or “visible”; however, interpreting their preferences required these
attributes to be considered. Those requirements considered to be primarily contextual
displaced “visible” requirements within the preference weight distribution. This displace-
ment could possibly have sharpened the focus on those visible requirements falling within
a chosen threshold, but this focus may not be representative of the broader population of
leaders in these roles. The weighting was done only by two people at most per leadership
type.
A looser focus was considered for the sake of appealing to an audience broader than
the Study Group. In order to loosen focus, contextual requirements falling within the
chosen threshold were discounted. When choosing a threshold, it appeared to be pru-
dent to include 55% – 75% of all visible requirements on considering the union of visible
requirements preferred by the Incident Coordinator, Business Leader, IT Leader and
Overall Leader. In order to further refine the threshold selection process, the percent-
age of visible requirements by leader type was also considered. A visible requirements
coverage of less than 35% per leader role was considered too restrictive. However, the
primary rationale for this lens was to exclude sub-requirements, so thresholds in which
each leader type’s preferred requirements covered more than 35% and less than 55% of
the visible requirements were good candidates. Picking the lowest threshold that met
that criterion was considered a reasonable selection. The Overall Leader type exhibited
the greatest consistency of judgment based upon an essentially averaged preference. The

72
Overall Leader’s preferred visible requirements coverage was another good indicator for
choosing a threshold. As previously mentioned, the 35% – 55% range of visible require-
ments was considered reasonable; thus, a good threshold would be one in which the
Overall Leader’s visible requirements selection fell in the middle of that range.
Having selected and applied the threshold, the included requirements were effectively
established for both the visible and the contextual requirements. A review of these re-
quirements was necessary to ensure that dependencies and expected requirements had not
been discarded; if they were, then it was necessary to reintroduce them into the included
list. This was done not to overstate the importance of necessary or expected require-
ments, but instead because, from a design and development requirements management
perspective, basis requirements were necessary in order to justify resources needed to in-
stantiate the substance of those requirements, thus providing a means for requirements
traceability.
When developing evaluation tasks for the “Industry Public Evaluation” and high-
profile visualization features, the preference weights and Kano Quality model were help-
ful. When one considered that the requirements prioritization method forced the group
member to place one requirement over another in terms of value, there was essentially
a limited preference budget. Those requirements with greatest weight were of greatest
interest, one reason being that they were “exciting.” This preference interpretation led
the visualization design to feature those requirements, and guided definition of the eval-
uation tasks to ensure activities were crafted so that these features would be exercised
by the evaluators.
3.2.13.2 Outcomes
The final outcome of applying the method described in “Interpretation of Consoli-
dated Lenses” is listed in detail in Appendix I.
The threshold chosen was 70%. Two of several Venn diagrams used in the inter-

73
pretation analysis are provided in Appendix H. The 70% ranking threshold emphasized
visible requirement count by leader role thusly: Incident Coordinator – 10 requirements
(41.67%), IT Leader – 13 requirements (54.17%), Business Leader – 9 requirements
(37.5%), Overall Leader – 11 requirements (45.83%). The 65% ranking was rejected as
too restrictive for the Business Leader role (seven visible requirements, or 29.17%) and
the Incident Coordinator role (eight visible requirements, or 33.33%). The 75% ranking
threshold was rejected based primarily on the adequacy of the 70% threshold. In other
words, additional relaxation of the priority interpretation was not necessary.
3.2.14 Stage P. Develop High-Level Designs
3.2.14.1 Objectives and Methods
The objective of this first design step was to construct a small collection of design
alternatives in order to provide study participants the first concrete description of what
the visualization would do to facilitate IT incident management.
The requirements priorities and resulting interpretation in previous stages provided
the basis for the high-level designs, including the context for and constraints upon the
brainstorming effort. This brainstorming effort was intended to generate design archi-
tectures with sufficient variation in order to be qualitatively different. The degree of
difference was to be balanced between solution-space coverage and practical viability
within the context of time and budget for this research. Design architecture was a broad
specification that described technology components and their interactions, as well as us-
age dynamics related to executing selected tasks. This architecture was articulated from
the user’s perspective rather than from any description of the engineering necessary to
facilitate visualization.
Each design alternative was to have an emerging conceptual model. A conceptual
model is a user’s mental representation of the operational features and behaviors of a
device or system[51]. Norman argues that “[a] good conceptual model allows us to pre-

74
dict the effects of our actions” ([51],pg. 13). Further, Norman suggests that usability of
an application improves when a user is able to establish an accurate conceptual model
and the application behaves consistently with this model. The conceptual models were
expected to be abstract at this design stage, but would become more concrete in the pro-
totype stage. Although, as an emergent property, the conceptual model was consciously
considered during design, it was not the result of any one design choice.
The expected work product from this research stage was a set of three design alter-
natives. Each alternative would consist of an overview, sketches and illustrations, as well
as at least one usage scenario from the user’s perspective that incorporated the selected
tasks. These materials were to be provided to participants. As an informal means of
self-assessment, each design was evaluated against the requirements prior to participant
review. A comparison between the requirement priorities and participant feedback was
expected to be of value for design decisions made in later stages.
3.2.14.2 Outcomes
This stage was the first in which the Industry Public Evaluation stage was highly
influential in the design process. Along with understanding the IT incident management
problem space and visualization requirements, it was necessary to consider how this
visualization was going to be used. Unlike a product development effort that would seek
to satisfy variable deployment environments, the final product developed for this research
would be used to validate concepts in a controlled operating environment over a highly
restricted time period.
Up to this point, the development environment(s) and computing platforms had not
been chosen. Given the nature of form factor and differences in interaction style between
computers (e.g. desktop, laptops) and portable devices (e.g. smartphones, tablets), it
was necessary to commit to a platform. The dynamic nature of IT incident management
is ideally addressed by a visualization residing on multiple device types. Supporting

75
multiple platforms would result in considerably more time in design, design review,
development, testing and final evaluation. A single platform therefore had to be chosen.
The Windows computer environment was chosen due to the abundance of computers
available and development environments that were mature and freely available under
academic licensing.
The time available for Independent Professionals to devote to the evaluation was also
considered, and an hour was determined to be a reasonable commitment. Much more
about the evaluation can be found in Stage V (Section 3.2.20). Only a fraction of the
hour could be devoted to hands-on activity with the prototype, and the evaluation period
was estimated to be 20 minutes long. This time budget subsequently affected the nature
of the requirements that could be exercised, as well as shaping somewhat the types of
evaluation tasks that could be anticipated.
Combining these practical constraints and the limitations inherent in only one person
drafting the high-level designs, the diversity of high-level designs was severely limited.
There was essentially one design proposed for each of the three leadership roles, with an
alternative providing slight modifications. Some screens were rendered in multiple forms,
but the overall structure remained constant. Inspired by the overlap in requirements
priorities as seen in ranking requirements visuals (see Appendix H), the high-level designs
had much in common across leadership roles.
The high-level designs were primarily pencil sketches with supplemental diagrams
drawn in MS Visio. The supplemental diagrams provided screen flow as well as a break-
down of evaluator activities over the 20-minute period. Examples of these diagrams are
provided in Appendix J. Pencil sketches are not provided in this document due to their
volume and limited visual clarity.
When comparing the requirements priorities and the screen functionality indicated
by the screen names seen in Figure J.2 in Appendix J, the requirements associated
with activities a user might perform during IT incident handling were manifested many

76
times as dedicated screens (e.g. screen “9 – Response Role Management” mapped to
requirement “4D – Response Role Management”). Requirements that referenced less
active needs (e.g. access to information types) were carefully accounted for, and in some
cases significant real estate was provided on screens such as “3 – Personalized Response
Summary” or “4 – Information Support Center.”
A practical consideration was that the design requirements defined in Stage M (Sec-
tion 3.2.12) span the entire lifecycle of incident management. It is unreasonable to
consider an evaluation lasting 20 minutes as sufficient to cover handling an active IT
incident, and then proceed to perform historical analysis on that incident as well as
others. The evaluator would be overwhelmed by the pace and breadth of visualization
concepts they would be expected to employ and evaluate. Therefore, the relevant portion
of the IT incident management lifecycle had to be scoped, disregarding those require-
ments not relevant to that scope. It was decided to focus on those requirements that
address time-sensitive decision-making taking place during IT incident handling. This
means that requirements such as “7C – Control Change Evaluation” and “7A – Incident
Management Improvement” would not be addressed in the upcoming design efforts.
3.2.15 Stage Q. Review High-Level Designs
3.2.15.1 Objectives and Methods
The objective of this research stage was to elicit broad design feedback by presenting
hand-drawn sketches of proposed design alternatives. Another goal was to elicit practical
considerations that could not be incorporated into the requirement development and
prioritization stages. By providing high-level descriptions of design options, participants
had an opportunity to consider potential solution approaches. The roughed-out designs
were meant to encourage broad thinking, while not discouraging significant departures
from the current design[52]. This preliminary review process was expected to eliminate
poor design choices and properly position the design effort going forward.

77
The evaluation process involved presentation of each design alternative as well as im-
plementation of a semi-structured interview process to elicit feedback. Unlike previous
sessions with group members, the study protocol for this stage allowed for group re-
view. In other words, in circumstances in which multiple group members worked for the
same organization and knew of each other’s participation due to internal coordination,
those members were able to meet together to review the high-level designs. Assuming
these members could brainstorm and communicate effectively in the presence of their
colleagues, this allowed for feedback to trigger thoughts or provide exposure to ideas
that a single member might not otherwise consider on their own.
This stage was designed to be performed in one pass. Given the expected post-
processing overhead and limited value of additional iterations of the high-level design,
it was best to assume that concepts or suggestions offered by a group member would
not undergo any form of consensus building. The appraisal and potential acceptance of
significant suggestions would rely on the researcher’s understanding of the IT incident
management problem space, as well as the constraints of the evaluation activities in
Stage V (Section 3.2.20).
3.2.15.2 Outcomes
This review process was performed with all seven group members over twelve distinct
sessions in aggregate. This included a group of three members who met together twice,
two of whom were available to meet in a third session. Design review was done from the
role perspective. Once again, professional biographical context of the group members
would influence their assessment, so it was best to align the designs to the roles in which
each was most comfortable. In the group review session, all three members had the
Incident Coordinator perspective.
Member availability affected the consistency of the review. One member was able to
meet only for about two hours, while the others met for over three hours.

78
The members offered a number of suggestions on screen content, beyond which they
were asked to comment on the visual fidelity of the prototype that would best resonate
with Independent Professionals. Their response overwhelmingly favored a higher-fidelity
look and feel over a “sketchy” look. Microsoft’s Expression Blend allows for prototyping
to be done in high fidelity as well as a “sketchy” feel with low color content (i.e. functional
controls that appear as if drawn by hand). It was explained to the members that a simpler
look and feel had been shown to promote broader thinking by avoiding focus on relatively
minor issues such as color and font selection. The group members did not think it was
wise to commit to a sketchy look. They felt that most professionals would not appreciate
the reasoning behind the selection, and that this lack of appreciation might interfere with
their consideration of the content and the intent of the visualization.
A major architectural consideration suggested by the group was to allow the experi-
ence to be dynamic. Their rationale was that greater interest and engagement could be
stimulated if the evaluator knew that their actions would affect the outcome of the IT
incident. In essence, the suggestion was to make the evaluation a game. One suggestion
was that a “Choose Your Own Adventure” storybook structure might be an effective way
to construct this dynamic IT incident experience[53]. This suggestion was adopted and
had a major impact on both software design and context development. An additional
evaluation task (i.e. Task 6) was introduced, making what had been a casual glance
at the “Closure Report” into an actual activity. This deliberate look at the report was
meant to encourage evaluators to extract IT incident results and compare them to what
might have been possible. This indirectly allowed evaluators to assess their performance.
3.2.16 Stage R. Analyze Design Review
3.2.16.1 Objectives and Methods
The objective of this stage was to extract design guidance from the feedback collected
in the previous stage. The guidance consisted of recommendations for comparatively mi-

79
nor items such as color choice, and as major as reworking an entire screen or navigation.
As design efforts to this point were limited to sketches and a broad sense of visualiza-
tion capabilities, there was little previous investment to be lost in adopting the group’s
suggestions.
The recordings and notes were reviewed in order to identify and adopt more gran-
ular tactical requirements and visual design suggestions to identify and adopt going
forward. The initial requirements were deliberately written to avoid implying any par-
ticular design approach. Having had the freedom to explore various ways to interpret
the current requirements via high-level design proposals, and having received feedback
on those brainstorming results, it was necessary at this point to identify more actionable
requirements with less ambiguity in order to facilitate the upcoming development effort.
3.2.16.2 Outcomes
The seventeen distinct sessions, producing more than 22 hours of recordings, were
reviewed and documented by taking high-fidelity notes of the conversations. Recom-
mendations were translated into fine-grain requirements, which in turn were categorized
as either prototype or evaluation requirements. Evaluation requirements were meant to
influence development in order to ensure that the end result would be appropriate for the
Industry Public Evaluation, as well as covering logistical and execution considerations.
Inclusion of suggested requirements in these lists did not guarantee compliance. Doc-
umenting the suggestions in these lists ensured that they would not be lost and would
be considered. The result of this stage was slightly more than 100 additional prototype
requirements and roughly 25 evaluation requirements.
3.2.17 Stage S. Develop Visualization Prototype
In order to avoid duplication of content, the scope of this section is limited to dis-
cussing how the visualization development integrates with the overall methodology. Dis-

80
cussion of the visualization’s design is found in Chapter 4 and the evaluation framework
design in Chapter 5.
3.2.17.1 Objectives and Methods
The objective of this stage was to develop a visualization environment that was faith-
ful to all stages, starting with Stage B (Section 3.2.3), thus resulting in a user-centered
design. This depended on each previous step correctly interpreting and synthesizing
inputs from group members, as well as the interpretation of relevant literature.
It is important to note that this research was being conducted to investigate a re-
search hypothesis, and the prototype was to be a means to that end. The high-level
design and any resulting prototype was the manifestation of requirements interpretation
limited by the researcher’s professional history, artistic skills, usability knowledge, skills
with development tools and imagination. The same set of requirements could yield nu-
merous design outcomes. Given these considerations, a tangible manifestation of the
requirements was necessary, as it is difficult for most people to evaluate ideas in the
abstract without constructive context. If final validation proved to be inconclusive or
negative, the poor showing could in large part be the fault of a single design approach
rather than a refutation of the overall research hypothesis.
For practical purposes, it was necessary to reduce the scope of the development effort.
Developing three prototypes, or one prototype that could accommodate three roles, was
a significant undertaking. Looking forward to Stage V (Section 3.2.20), it was necessary
to consider the accessibility and size of the professional population with experiences as
Business Leader, IT Leader and Incident Coordinator. By selecting one role, the number
of screens could be reduced, with the number of requirements to be implemented limited
as a result.
In order to manage the requirements and better ensure that their influence was pro-
portional to what the group members indicated in Stage N (Section 3.2.12), practices

81
were adopted from Zultner’s writings on Software Quality Deployment[50]. In his work,
Zultner suggests the use of Quality Function Deployment (QFD) techniques in order
to integrate the “Voice of the User” into the development process. QFD was originally
developed and implemented in Japan for designing and manufacturing products. Zultner
suggests that there are several disconnects between traditional QFD and software devel-
opment, but that with minor interpretive adjustments QFD could be a valuable means
to define and embed user needs throughout the development team and development cy-
cle. The QFD process provides a structured method to convey the user’s “voice” from
the abstract levels of design to the concrete aspects of manufacturing a product. This
structure is then introduced through a collection of hierarchical matrices that facilitate
traceability. Given the limited research team size and operational expectations for this
visualization, it was not found necessary to use (by some counts) all of the 30 to more
than 150 possible matrices[50]. The key matrices used in this effort were Z1 and A1
– “House of Quality,” implemented per descriptions and instructions of Zultner, as well
as King[54] and Terninko[55].
Much of the voice of the user was expressed as requirements priorities. A second round
of AHP-based prioritization could not be performed on these extracted requirements,
as the context necessary for understanding these requirements would be challenging to
develop and difficult for group members to appreciate (except, possibly, for the person
motivating the requirement). Moreover, the requirements set was now much too large.
Instead of returning to the group for more direct guidance, the approach taken was to
consider the mapping of each second-round requirement to one or more requirements
prioritized by the group members. In the event a second-round requirement mapped to
more than one of the originally prioritized requirements, priority scores were averaged.

82
3.2.17.2 Outcomes
The selected leader role for visualization development was the IT Leader. This role
provided a conceptual and organizational bridge between the Incident Coordinator and
the Business Leader. There was also a sense that qualified Incident Coordinators were
either much too busy or relatively rare, making it difficult to perform an evaluation with a
sufficiently large sample size. Business Leaders were also considered to be less accessible,
given their likely workloads and limited interest in exploring concept-level technology.
This choice worked fairly well in terms of the alignment of professional histories of the
Study Group members. Even if the members had no experience in the IT Leader role,
they were nonetheless sufficiently familiar with it to make educated extrapolations based
on their experiences working with colleagues in similar roles.
After combining the various evaluation constraints discussed to this point, a number
of screens were removed from the development plan (e.g. “Incident Assessment & Re-
sponse Center,” “Incident Details Screens” (13.1 – 13.3), “Detailed Escalation Interface,”
“Incident Response Planning”), as well as several role-based customizations. Indepen-
dent of priority ranking, nine of both high-level and second-level requirements defined in
Stage M (Section 3.2.12), as well as roughly 25 second-round requirements resulting from
the high-level design review in Stage Q (Section 3.2.15), were struck from development
consideration.
The visualization was developed with Microsoft Expression Blend as a Sketchflow ap-
plication. Sketchflow is a development environment used for rapid prototyping for visual
designers, and offers portability that enables its targeted user community to review visual
design and return feedback. A web browser-based visualization execution environment
was chosen using Silverlight libraries and C# as the underlying programming language.
A number of limitations of Sketchflow were overcome to build a medium-fidelity pro-
totype that was state-aware and could accommodate the needed data persistence and
context. This effort took a year to build a functionally complete prototype with minimal
83
data in order to proceed with Stage T (Section 3.2.18).
Screen consolidation took place during development because, as the designed user
workflow became more concrete, having distinct screens for some functionality was nei-
ther necessary nor helpful to the user. Screens providing detailed treatment of content
areas related to the Information Support Center were cancelled, since for evaluation pur-
poses the capabilities within the Information Support Center screen itself were sufficient.
Moreover, the additional information and alternate presentation approaches would likely
overwhelm the evaluator. The “Report Repository” screen (not present in the screen
flows in Appendix J) was developed to be a shell with no content and limited functional-
ity. Reporting is a common tool in enterprise solutions, but proper functionality, as well
as populated fictional content, had the likelihood of distracting evaluators who would be
inclined to explore the depths of the prototype. Other than for the very last evaluation
task, there was no need to review reports regarding current or past IT incidents.
3.2.18 Stage T. Review Visualization Prototype
3.2.18.1 Objectives and Methods
The group’s objective at this stage was to review the assembly of evaluation-day
elements that the Independent Professionals group would be exposed to and interact
with. This was the last opportunity for group members to suggest corrections and
contribute to the research.
A number of materials were prepared prior to conducting the Industry Public Eval-
uation. The materials were a pre-evaluation survey, an introductory presentation, the
prototype and a post-evaluation survey. The survey instruments designed for the pur-
poses of collecting data from the Independent Group participants had to be pre-tested.
Group members were asked to experience the entire evaluation event and provide feed-
back. The feedback in most cases was elicited by semi-structured interviews prior to
proceeding to the next element. The exception was the minimal feedback collected be-

84
tween the hands-on prototype activity and post-evaluation survey. These two elements
were highly coupled. To best emulate the evaluation event, the transition between hands-
on activity and responding to the second survey was meant to be nearly seamless. The
second survey was the linchpin to validating this research effort, and was meant to collect
initial impressions of the research. Given the importance of the survey instruments to
this research, it was necessary that survey testing be carefully planned.
Survey Testing
By necessity, the survey testing protocol accommodated two key constraints, the first
being that the only people able to effectively test the survey instruments were within
the Study Group; thus the pre-testing sample size was quite small (i.e. seven or fewer).
This was due in part to the unique ability of Study Group members to bridge between
uninitiated professionals and the researcher who had worked with the group throughout
the field study effort. Moreover, the Study Group members were the only professionals
disqualified from the Industry Public Evaluation. Involving a new professional at this
stage would increase the Study Group, but at the expense of shrinking the Independent
Professionals population. The second key constraint was the necessity of testing in one
round, as research schedule constraints and limited availability made more than one
survey testing iteration impractical.
The questionnaires needed to be tested either by prospective respondents or reason-
able surrogates in order to determine what the challenges might be (e.g. concepts, word
choice, response design, biases, etc.). As the second questionnaire was tied to hands-on
experience with the prototype, only those who had gone through the hands-on activity
could effectively respond to the post-evaluation survey and provide reliable feedback.
The Study Group had seven people. Having looked at various sections within Presser[39]
and Dillman’s section on pretesting[38], it appeared that the cognitive interview tech-
85
nique was a very reasonable pre-testing method, given the available time and the limited
size of the Study Group. According to Conrad and Blair[34], as well as DeMaio and
Ashley[35], the cognitive interview was more a class of pre-testing technique than a
well-defined methodology or protocol.
The two most prevalent cognitive interviewing techniques that appear in the litera-
ture previously mentioned are “think-aloud” and retrospective methods. According to
Dillman[37], there could be undesirable consequences introduced by having the respon-
dent read the printed survey question and then think aloud, as the self-administered
paper survey was not inherently an oral instrument. Moreover, the group members had
become familiar with semi-structured cognitive probes in other contexts, so retrospective
methods might appear to be similar in style to past research discussions.
The degree of latency between respondents’ question response and retrospective
probes was another variable. Instead of performing retrospective probes after each ques-
tion response, a unified set of retrospective probes was performed after the questionnaire
had been completed. It was anticipated that the discussions between group members and
the researcher might influence thought processes to some degree as members continued
to fill out the survey. Like all previous sessions, these pre-testing activities took place
in members’ workplaces with limited controls, so the researcher had to be present to
observe body language and other cues that might lead to retrospective probes. Some
study members were extroverted thinkers, and it was anticipated that they might express
themselves as they completed their survey form.
Dillman[37] suggests that the interviewer should formulate debriefing probes while
the respondent is being observed. This approach is somewhat contrary to the IRB’s
need for review, so a set of primary probes was documented. However, like the semi-
structured interview, latitude was needed to allow for additional inquiry on responses
and unexpected reactions.
Beatty[33] identifies categories of utterances that cognitive interviewers made in the

86
interviews he reviewed. The surveys being pre-tested were interviewer-led, so quite a
bit more dialogue occurred compared to a paper survey. The five categories are “Cogni-
tive Probes,” “Confirmatory Probes,” “Expansive Probes,” “Functional Remarks” and
“Feedback.” Among the probe types, both cognitive and expansive probes were con-
ducted. Beatty suggests that expansive probes could cause interference, but as retro-
spective probes they are not expected to be a problem. Confirmatory probes were less
necessary, given that responses were written down directly by the respondent.
DeMaio and Rothgeb[36] mention paraphrasing survey questions as an additional
cognitive interviewing technique, with respondents asked to put the survey question into
their own words. This intriguing technique was adopted because it had the potential to
uncover both comprehension issues as well as alternatives in wording and terminology
that might better resonate with IT professionals.
Pre-testing Objectives
The fundamental goal for pre-testing was to identify needs and ensure means of
adjusting the questionnaire in order to facilitate accurate data collection. The following
were the objectives of pre-testing both the pre- and post-evaluation surveys:
1. Identify comprehension issues with question content, question structure and refer-
ence period.
2. Identify awkward word choices.
3. Identify visual formatting challenges.
4. Identify survey questions that pose judgment and evaluation challenges, as well as
likely causes.

87
5. Identify survey questions that pose retrieval-from-memory issues and possible means
to compensate.
6. Identify survey questions that would likely be skipped and likely causes.
7. Identify issues with response terminology, response units and response structure.
Introductory Presentation Review
The group member was asked to sit through a presentation after finishing the pre-
evaluation survey and related testing protocol. Since the previous survey review could
take an hour, this next review stage was expected to occur in another session. The
presentation was given in its entirety prior to any questions regarding its content being
raised. A paper copy of the slides was given to the group member during this discussion
to assist with recall. The questions asked were related to presentation clarity, and how
content could influence interest and participation.
Prototype Review
In a user-centered approach to software design, this entire stage would, ideally, have
been dedicated to a usability review. Moreover, the usability focus would have been on
the interface elements associated with the IT Incident Visualization System. This was
not feasible in the context of this research. In order to facilitate the Industry Public
Evaluation, it was necessary that dedicated user interface elements be provided for the
evaluation. Beyond reviewing the IT Incident Visualization System features and con-
tent, the group member performed the hands-on activity in a manner similar to the
Independent Professionals. Thus the group member was able to provide feedback on the
evaluation-centric interface components as well as their content. One critical content area
was the set of evaluation tasks. The description, objectives and layout of the evaluation

88
tasks, as well as the available task completion choices, were critical. Independent of how
well the IT Incident Visualization System functioned or addressed IT incident manage-
ment needs, a misalignment between the task and the IT Incident Visualization System,
or misunderstanding of the evaluation tasks, would have been detrimental. Frustration
and confusion arising from these incidental elements (i.e. evaluation interface compo-
nents and evaluation tasks) would not likely be compartmentalized from an evaluator’s
assessment of the IT Incident Visualization System.
3.2.18.2 Outcomes
Five members of the Study Group were available for this review stage. The structure
and content of the review had to accommodate member schedules. This required that
a “core” of the review be identified in order to ensure that the most critical evaluation
elements were covered. The core was determined to be the pre-testing of the two question-
naires and the hands-on activity. The core review was conducted with the five available
members. Those who had additional schedule flexibility reviewed the presentation as
well as discussing the prototype.
A number of concerns regarding the pre-evaluation survey were raised during pre-
testing. The most challenging issue involved the definition of an IT incident. Members
agreed that it was an appropriate definition on the whole, but suggested alternative
wording and punctuation to improve readability. Despite these suggestions, one antici-
pated challenge was the misalignment between this definition and those actually being
used by organizations. As there is no generally accepted definition, the one being used
was considered acceptable. It was anticipated that it would be difficult for respondents
to align their own employers’ definitions with this one. There are numerous ways to de-
fine and categorize IT incidents, and the categorization issue would cause problems with
answering survey questions regarding costs and staffing related to past IT incidents.
Other pre-testing feedback related to question wording, visual formatting and adding

89
additional questions. One challenge observed was related to scoping a respondent’s em-
ployer or firm. The group’s government members felt most highly aligned with their own
departments (e.g. “Department of Revenue”), even though they were state employees.
Another related scoping concern was a respondent’s ability to provide IT incident statis-
tical information for a scope much beyond their own workgroup. Some questions asked
for firm-wide responses, but employees of large firms may have little awareness of events
occurring at offices located in other cities and states, let alone other countries.
The post-evaluation survey raised relatively minor concerns from the group members,
the most significant being related to questions 4, 10 and 11. Question 4 asked the respon-
dent to compare their employer to “Zenodyne,” a fictional company that manufactures
composite materials. The original version of the question was somewhat ambiguous.
And though none of the group members worked for a manufacturer, some responded to
what they considered to be similarities between their own employers and Zenodyne, as
the IT operational context considered in the evaluation exercise was fairly common.
The issue with question 10 was that the question asked the respondent to evaluate
the value of having an objective calculation of the concept of urgency. In testing, it
appeared that the question was not sufficiently anchored to the evaluation experience,
making it unclear whether the visualization’s treatment of urgency was being evaluated
in their responses.
The issue with question 11 related to the response options. As opposed to a simple
numerical continuum, phrases were denoting response range. This had the advantage of
the respondent conveying a direct semantic value, as opposed to performing a numerical
translation that raised interpretive uncertainty. The challenge, however, was that con-
structing a balanced language continuum was not straightforward. The original response
options for positions two and three were much too close in degree to be semantically dis-
tinct. By contrast, the semantic distance between response options two and four, as well
as between three and four, were too wide, so no adequate response option was available

90
within that gap.
The introductory presentation was adjusted as feedback was provided. This meant
that the last member to evaluate the presentation did not see the same presentation as
the first. Although this approach is statistically treacherous, the challenges raised needed
to be accommodated immediately in order for the presentation to mature with repeated
exposure. A poor presentation that lacked realism, clarity and accuracy was anticipated
to have a significantly detrimental effect on the evaluation, whereas a good presentation
was anticipated to have only a minor effect on evaluation results.
The prototype evaluation by group members was also uneven. The fictional context
data necessary for the prototype to function properly, as well as to correspond to the
evaluation tasks, was an active work in progress during this stage of the methodology.
Unfortunately, the contextual data were difficult to prepare, while the research sched-
ule would not allow a schedule slip of the “Prototype Review” stage. The scheduling
objective was to begin the Industry Public Evaluation before the 2012 holiday season
and winter weather, which could potentially interfere with recruiting and conducting the
final stage. Members did their best to perform the evaluation tasks and complete the
evaluation activity. Feedback was directed to the evaluation task descriptions as well as
to their layout. Navigation controls within the prototype proved to be challenging to
locate, and wayfinding was hampered in part by a limited understanding of the proto-
type’s screen structure and content organization. A content-alignment issue existed with
evaluation task two, causing confusion and delaying task execution. This delay may also
be attributed to the difference in cognitive challenges between tasks one and two. The
first task was designed to be a data-finding activity, and the second task was the first to
require independent decision-making by the evaluator.

91
3.2.19 Stage U. Adjust Prototype
3.2.19.1 Objectives and Methods
The scope of this stage was broader than its name implies. The purpose of this
stage was to adjust the materials designed for the Industry Public Evaluation that were
reviewed in the previous stage by the Study Group. Adjustments were made with the
intention of improving clarity, accuracy, usability and reliability, as well as the sense of
practicality and realism of the pre-evaluation survey, introductory presentation, proto-
type and post-evaluation survey.
The pre- and post-evaluation surveys were adjusted according to the pre-testing in
the previous stage. Forsyth et al. report that adjustments stemming from pre-testing
may not yield improvements on every question[56], and they raise the possibility that
it may not be possible to overcome the problems a question might have. They also
recommend that iterative pre-testing be performed. Most “corrections” are essentially
educated conjecture, thus effectively resetting the current understanding of each adjusted
question’s quality. As mentioned in the previous stage, iterative pre-testing was not
feasible for this research project. With these realizations, as well as the limitations
of the pre-testing protocol implementation, any adjustments to the questionnaires were
simply a best effort. In addition to formulating changes to the questionnaires, the changes
were processed through the IRB for approval prior to any administration of the updated
instruments.
The introductory presentation was adjusted with regard to a given group member
with respect to clarity, realism and accuracy. The prototype and closely related evalua-
tion interfaces were adjusted per feedback from the group. Adjustments were sensitive
to the frequency an issue was raised, their significance to the overall evaluation’s success,
and the feasibility of making an appropriate correction in the time available.

92
3.2.19.2 Outcomes
Sixteen adjustments were made to the pre-evaluation survey. One adjustment in-
volved changing the order of paragraphs one and two in the instructions on the front
cover. A new question three was added to identify IT expertise that may not have been
accurately captured by the question related to tenure in a respondent’s current job. For
example, retirement and recent job changes could portray an experienced respondent as
a newcomer to the field. Various changes were made to word choice in order to ensure
the consistency of terms across questions. Question scoping was a common adjustment.
One of the more significant scoping changes was related to the breadth of the work en-
vironment being considered. The term “firm,” originally used in questions 14, 16, and
17, was replaced with “workplace.” Employees of larger employers may have found the
original scope too broad. The original response format for questions 16, 17 and 18 was
in the form of a graduated horizontal scale designed to accommodate a single response
value. The scale, which needed to accommodate a broad range of possible responses and
the visual weight of all the various lines on the scale, was found to be confusing. The
scales were replaced with fill-in boxes to accommodate a less constrained response.
Seven adjustments were made to the post-evaluation survey. The adjusted survey
questions were nos. 4, 5, 7, 8, 10 and 11. For question 5, the word “consequence” replaced
“significance.” Question 7 underwent a minor word replacement to improve clarity, and
questions 10 and 11 were adjusted to accommodate the observations discussed in the
previous stage. Overall, the adjustments to this instrument were fairly minor. The final
survey instruments can be found in Appendix A.
The prototype underwent mostly cosmetic changes to improve a user’s ability to
locate navigation controls. Context data adjustments were made to improve the tie-in
with evaluation tasks. The layout of the evaluation task description was made more
consistent, and better labeling was used for the components of the task description in
order to improve the user’s ability to discern the intention of the task description elements

93
(e.g. “Orientation – A description of what has happened between the tasks, what is to
be done and why it is to be done”). Significant changes to the prototype’s navigation
and wayfinding were not feasible in the time allotted.
3.2.20 Stage V. Industry Public Evaluation
In order to avoid significant duplication, much of the detail related to the Industry
Public Evaluation is found in Chapter 5.
3.2.20.1 Objectives and Methods
The purpose of this stage was to have Independent Professionals assess the merits of
the business impact visualization system designed in cooperation with the Study Group.
The evaluation was intended to recruit around 20 – 30 IT professionals to evaluate the
resulting visualization prototype in a prepared scenario setting. The evaluation was a
structured event planned to take not much more than an hour.
Two evaluation settings were organized. One setting was a public evaluation in which
the call for participation was made to IT professionals in the Des Moines metropolitan
area. Facilities were arranged in various locations in the metro area based on their
convenience to various concentrations of IT employment in the area. Flyers were sent by
email to various group lists to which professionals subscribe. The events were restricted in
participant numbers due primarily to the amount of computer equipment needed and the
cargo capacity of the vehicles likely to be used. An Internet service (i.e. Eventbrite.com)
was used to provide online registration. Although anonymity was preserved in data
collection, it was necessary for participants to register in order to track attendance, as
well as to ensure that the event would not be oversubscribed, thereby disappointing those
who had made time to participate.
The second evaluation setting was the private evaluation. Organizations were asked
to host evaluation sessions at their facilities and invite employees to attend. Scheduling,

94
recruitment and attendance management were performed by the host organization. The
size and structure of these private evaluations were to be consistent with the public eval-
uation. The most significant distinction from the public evaluation was that participants
in the private evaluation came from the same general organization.
The evaluation event was structured to provide an uninitiated IT professional an
overview of the research effort, explain the scope of their involvement, provide brief
training on the software, and collect data from them. This fast-paced activity was
designed to capture first reactions to visualizing IT incident management concepts and
activities that, up to this point, were managed with isolated technologies or facilitated in
limited visualization settings. The pace of this evaluation was in large part necessitated
by the practical restrictions IT professionals have on their schedules for extracurricular
activities. Some employment settings would likely require a professional either to deduct
time spent participating in the evaluation from their timecards or bill against overhead
accounts.
3.2.20.2 Outcomes
Outcomes related to Stage V are discussed in Chapter 6.
3.3 Discussion
Designing and executing this methodology over the span of the research effort resulted
in significant observations and lessons learned, some of which will be shared in this
section.
Ideally, the documented methodology would have been designed prior to starting.
However, a number of adjustments to this plan were made, as practical experience showed
some plans to be inadequate or naıve. Before starting this research, the methodology
was sketched out in the following sequence (see Figure 3.1 – Note: current stage labeling

95
used below to provide consistency):
Stage A. Define Problem and User Group
Stage B. Understanding the Need
Stage G. Need/Task Selection
Stage H. Understanding Selected Task
Stage P. Develop High-level Designs
Stage Q. Review High-level Designs
Stage S. Develop Visualization Prototype
Stage T. Review Visualization Prototype
Stage U. Adjust Prototype
Stage V. Industry Public Evaluation
All but three additional stages in the final methodology were strictly researcher ac-
tivities. One could argue that many of the additional researcher activities could be
consolidated; however, such consolidation would mask their significance. Iterating back
to the Study Group was time-consuming but, more importantly, would have been inef-
fective if improperly executed.
As relates to the initial exploration into business impact visualization, the range of
complex visualization needs could not have been anticipated. With such a diverse set
of needs, it was necessary for the Study Group to weigh in. The iterative nature of
this research required the Study Group to have a steady population. Group members’
interest in the chosen visualization was necessary for them to remain engaged.
To avoid future failure, it was necessary that “Stage E. Prioritizing the Needs” be
introduced. The requirements prioritization process was absolutely critical. It was naıve
to think that, absent input from the Study Group, requirements would be unambiguous
or relatively simple to establish and sort prior to executing Stage P. IT incident man-
agement is a complex problem. The interpretation of the task exploration in Stage H

96
was challenging. The process of distilling an understanding of IT incident management
into visualization requirements was, in part, subjective. Beyond confirming the validity
and completeness of requirements, the Study Group was needed to prioritize them.
One practical challenge of this research related to the privacy and confidentiality of
the participants in both the Study Group and Independent Professionals group, with the
greatest concern being the Study Group. The initial probes into problem areas, as well
as performance of those tasks, had the potential to expose weaknesses, deficiencies, orga-
nizational dynamics and other sensitive information. Only one non-disclosure agreement
(NDA) was signed. The other participants considered NDAs, but instead simply chose
to be discreet in how they responded to questions involving employer operations. Trust
in the researcher’s own discretion was necessary to complete this research. Due to this
trust, the recordings and notes from these discussions were closely held, and the research
team was therefore quite small. In order to maintain the confidentiality entrusted to
the researcher, the researcher performed all audio recording review and related docu-
mentation. Formal transcription was not practical, given time and resource constraints.
Detailed notes were taken that include long passages of verbatim transcription, but full
dialog transcripts were not considered practical.
The methodology would have been best executed if the Study Group members had the
opportunity to evaluate the high-level designs and final prototype with context-relevant
information. Given the complexity of establishing a coherent fictional context in which
to populate the drawn or developed screens, limited placeholder information was the best
avenue available at the time Stages Q and T were executed. During Stage T, some group
members went through the hands-on activity with inadequate visualization content for
executing the evaluation tasks, which limited the range of their feedback.
The practical and ethical requirements to isolate each Study Group member for much
of the field study was challenging from a knowledge-attainment perspective. Although
many of the same questions were asked, the responses were at times wide-ranging. This

97
provided insight into the breadth of the problem space, but without confirmation from
other members it was unclear how frequent or general any particular observation might
be. This necessitated the processing of collected inputs and returning for confirmation
at a later stage. When meeting with group members to initiate a subsequent stage, it
was necessary to review the results from processing the previous Study Group activity
stage. Many of the subsequent Study Group stages followed significant decision-making
or design efforts. Waiting for confirmation was disconcerting, but to return for further
discussion without making concrete progress toward the end goal eventually would have
met resistance by group members, as well as impeding project progress.
Execution of this methodology by a single researcher is not advised. This method-
ology was labor-intensive. The financial and personal status of the researcher must be
secure. There was significant risk in embarking on a solo research effort that took years
to reach a tangible result. Another thing to consider is change in employment status
for Study Group members: four changed jobs (three members of which remained fairly
accessible), and another was on the verge of retirement by the end of the study.

98
CHAPTER 4. IT INCIDENT VISUALIZATION SYSTEM
This chapter examines the reasoning and purpose of the visualization design resulting
from the iterative field study discussed in Chapter 3, and some of the specifics of that
design are discussed.
Also, an explanation of the relationship between the Iterative Field Study Method-
ology and visualization design is provided, followed by a section that explores the IT
Incident Visualization System. The chapter closes with some brief observations in the
“Discussion” section.
4.1 Introduction
This business impact visualization research was focused on addressing the hypothesis
that is stated in Section 1.4. In Chapter 3 and associated appendices, a number of ingre-
dients that could yield numerous different (and ideally effective) IT incident management
visualization solutions are discussed. This chapter discusses the visualization approach
developed to instantiate concepts produced by this research.
4.2 Iterative Field Study Methodology
It is not possible to separate the evolution of this visualization research from the
methodology that informs it. Beyond the initial rough shaping of the research orien-
tation around improving business leader awareness and comprehension of security and
compliance decisions, the intermediate results of the methodology provided the focus,

99
explored the problem, specified the function, and inspired the visual dimensions of the
resulting visualization. Although this visualization was crafted by a time-constrained
researcher with limited field research experience, as well as imperfect understanding of
usability, graphical and development techniques, the effectiveness of the visualization
rests to a significant degree on the power and pitfalls of this field study methodology.
4.3 Visualization
In her thesis on biological network visualization, McGarthwaite identifies five visu-
alization fields, which are “Artistic Visualization,” “Knowledge Visualization,” “Data
Visualization,” “Scientific Visualization” and “Information Visualization”[57]. Among
these fields, Card et al. would classify the visualization being undertaken by this research
as Information Visualization, as the subject and related data sets are abstract[58]. This
distinction is important because designing a usable IT Incident Visualization System
is hampered by the challenges users might have interpreting second order abstractions
(i.e., the first level of abstraction is the subject matter, the second is the visualization
construct used to present the subject matter-related data). Since the improvement of
business leaders’ awareness and comprehension of IT incident decisions is the objective
of the visualization design, a careful balance is needed to ensure that the potential of
visualization is leveraged while usability needs for task performance are met. This con-
sideration is consistent with Card et al., who state, “The purpose of visualization is
insight, not pictures” ([58],pg. 6).
This section discusses a number of important design elements and principles that
are the foundation for the reasoning and purpose of the visualization designed. Fig-
ure 4.1 illustrates how visualization design objectives relate to IT incident management
objectives, and provides an overview of the discussion that follows.

100
Evaluate Business Impact & Immediate Risk
Adjust Response Activity
Understand Response Objectives
& Progress
Incorporate Institutional Knowledge
Understand Incident’s Character
Observe Vital
Measures
Ascertain Current Status
Project Future
Policy & Procedure
Technical Controls
Business Dynamics
Business Process
Architecture
Change Management
Organization Structure
Access Response
Plan
Monitor Response Progress
Aware of AssignedPersonnel
Aware of Own
Obligation
IT Architecture
Human Resources
Objective Hierarchy
Adapt
Synthesize
Observe
Grasp
IT Incident Management Objectives
Figure 4.1: Visualization Design Objectives
4.3.1 IT Incident
There are numerous definitions of an IT incident. A widely recognized set of inter-
national IT services management practices known as the Information Technology Infras-
tructure Library (ITIL) has promoted a number of definitions. According to Brewster et
al., the current version (v3) states, “An incident is an unplanned interruption to an IT
service or reduction in the quality of an IT service. Failure of a configuration item that
has not yet impacted service is also an incident” ([59],ch.26). Another widely recognized
set of practices known as Control Objectives for Information and related Technology
(COBIT) aligns its definition to ITIL. In Appendix VII of COBIT 4.1, the definition of

101
an IT incident is given as “any event that is not part of the ordinary operation of a service
and that causes, or may cause, an interruption to, or a reduction in, the quality of that
service (aligned to ITIL)” ([60],pg. 191). These definitions cover a very large range of
events that may have operational, security and/or compliance impacts. Not only is the
range of event categories large, the impacts themselves range from an employee needing a
virus removed from their personal computer to service disruptions impacting thousands
of employees or customers. ITIL allows an organization to define the latter incident as
“major.”
For this research, an IT incident is defined as ”an event that [negatively] affects
the integrity, confidentiality and/or availability of information and information systems.
These events have sufficient impact or risk that merits the collaboration of leadership
personnel beyond the workgroup.”
Unlike the others, this definition specifies the qualities of service that, interpreted
broadly, cover security, compliance and operational events. The distinction this definition
makes is in scoping the incident in terms of the personnel dimension. The challenges
regarding leadership engagement in IT incident handling explored in this research do not
typically arise in situations in which the necessary response workforce is self-contained
within a single team. Another criterion for IT incidents of interest is when an incident’s
impact or imminent risk is sufficient to require involvement of the leadership of the
service provider and service consumer(s). The duration of the IT incident is also another
limitation on the effectiveness of a near real-time visualization solution for leaders. An
incident that is identified and resolved quickly is not likely to involve leaders during
handling of the incident, as technical staff will resolve the issue on their own. Leadership
involvement will occur only afterward in the form of incident review, or possibly when
reviewing collections of incidents for the purpose of process improvement.

102
4.3.2 The Fit
Typically, IT incident management is viewed as a continuous process-improvement
cycle. For the purposes of this discussion, an IT incident management cycle is depicted in
Figure 4.2. While leaders are a part of every phase of the IT incident management cycle,
the most noteworthy decisions are related to escalating a problem to incident status
and facilitating the ensuing response to the point of closure. And while leaders will
occasionally review significant incidents individually, decision-making commonly resumes
when reviewing a collection of incidents over a time frame. As part of the continuous
process-improvement model, lessons learned will translate to changes in administrative,
process and technical controls in order to prevent similar incidents from recurring. Due
to the impacts these changes have on the business, evaluation and approval of changes
in control practices require leadership decision-making.
Event Monitoring
& Awareness
Incident Handling
Incident Closure
Incident Review
Incidents Analysis &
Controls Changes
Incident Declaration
Figure 4.2: IT Incident Management Cycle
In Appendix E, there are a number of requirements (listed in Figure 4.2) that address

103
the “Incident Handling” and “Incidents Analysis & Controls Changes” phases of IT inci-
dent management. Requirements prioritization directed this visualization design toward
the time-sensitive aspects of supporting leaders in an active IT incident situation. An im-
portant transition from “Event Monitoring and Awareness” to Incident Handling is the
“Incident Declaration.” This visualization has an inherent process-support discontinuity
in that the decisions surrounding Incident Declaration are not supported. Moreover, the
field study did not investigate or formulate requirements for this key transition. As the
visualization design is discussed, consider that an IT incident declaration has been made,
and that the design assumes an IT incident has been fully initialized in the system by
means outside of the design.
4.3.3 The Gap
Software vendors have developed products in support of incident management and,
more specifically, IT incident management. Much of the value these products provide
is in guiding technical responders through the workflow of incident response. Major
market leaders (e.g. BMC, HP, Service-Now [61]) target their IT incident management
systems to be compliant to ITIL practices; accordingly, the IT incidents they address are
those defined by ITIL. These systems are built to support the wide array of small-scope
incidents that occur in a given year for a particular organization. The “forest” is being
addressed, but the high-value “trees” – the IT incidents, as defined in this research – are
underserved. A consequence of process improvement is that high-value or unusual IT
incidents have a greater tendency to be technically complex, and therefore will involve
an assortment of people. The field study found that response teams resort to manual
and segregated technologies to coordinate and communicate.
104
4.3.4 The System
Communications is an essential part of incident management. It is through com-
munications that problems are identified, solutions developed and approved, resources
applied, resolution and remediation achieved, and recovery known. Enterprise-oriented
IT incident management involves many people with a wide range of responsibilities, pro-
fessional backgrounds and interests. The diversity of the personnel involved reflects the
breadth of an incident’s scope. Let the people involved be called the “community of
the interested,” which consists of the five core and two secondary roles discussed in Sec-
tion 3.2.9. The assignment of actual people to roles is a function of the organization’s
culture, organizational structure, available skills and, most importantly, the incident’s
specific set of attributes. It is safe to say that incidents happen. Incidents vary widely
in their frequency and specifics, so role assignment is dynamic from one incident to
another, as well as when changes occur within a single incident. Unlike professional
communities such as paramedics and firefighters, organizations find assigning personnel
strictly to IT incident management to be prohibitively costly, especially when incidents
are infrequent, unpredictable and variable in nature. As technology commitments in-
crease, organizations experience higher IT incident frequency and business risk. As a
result, organizations with very large IT investments have personnel trained and assigned
to redirect their attention to IT incidents. And though many of their leaders are not
dedicated to incident management, they nonetheless participate in potentially dozens of
incidents a year because of their relevant skills, knowledge, authority and operational
responsibilities. By contrast, other participants may experience only one incident over
their entire careers. This results in a community of interest being assembled quickly, and
possibly with limited prior experience interacting with each other. As such, the com-
mon context necessary for effective communication, and even the lines of communication
themselves, are hastily established with varying degrees of success.
This visualization system was intended to provide the conceptual and perceptual

105
bridge between members of the community of interest. The primary audience for this vi-
sualization’s initial design was leaders within IT services and of business operations. The
goal was to allow them to establish the necessary context and understanding in order
to make incident-relevant decisions. Beyond improving awareness and understanding,
a visualization objective was to facilitate improvements in decision timeliness, incident
response coordination, response and decision error reduction, and management of the
incident response process. The secondary audience was the response team members. Re-
sponse team members should find in the visualization a means of sharing their knowledge
and understanding of incidents, as well as achieving awareness of the specific informa-
tion leaders are accessing as they evaluate the incident, its related response and, more
generally, incident management as a business process.
4.3.5 Concept Model
According to Norman, a user develops an understanding of how a device (e.g. door,
automobile, visualization program) functions from observation and experience[51]. Through
this understanding, the user achieves a level of comfort by being able to anticipate how
the device operates. In order to explain how the visualization functioned, this subsection
describes the concept model developed during high-level design and implementation to
govern use of the system.

106
Role Sensitive Views and Action Options
General Operational Awareness
&Incident Awareness
Current High Level Incident Awareness
Current High Level Response Awareness
Current Incident Details
Current Response Details
Response Actions
Screen Flow
A)
B)
Incident Description DataResponse Planning & Progress
Resource Abilities & Availability
Institutional Knowledge
VisualizationVisualization
Institutional Context
Figure 4.3: Concept Diagrams: A) Content Access, B) Primary Data Types
A fundamental principle in the visualization’s design is that awareness and context are
needed for effective decision-making[62][63][64]. Awareness is facilitated prior to enabling
any action and, if space permits, active situation status is provided in juxtaposition to
action enablement.
The visualization is composed of multiple screens that address leaders’ needs as spec-
ified in the requirements (see Appendix E). Instead of attempting to consolidate all
necessary information into a few high-dimension visual abstractions, much of the infor-
mation was presented in forms similar to those seen in common practice. Action-based
requirements, such as response role management, were facilitated in dedicated screens.
These two design choices led the design to incorporate a collection of screens organized

107
into three content groups: “Incident Awareness,” “Response Awareness & Management”
and “Information Support.”
After getting past the initial authentication screen and “legal notice” (evaluators saw
a disclaimer regarding populated content), the first screen was the “Grand Summary.”
This screen was meant to be an interactive overview of the operational status of business
processes as well as an overview of active IT incidents. Figure 4.3.A illustrates the
content and functionality flow. Having a broad sense of the operating conditions of
the organization, the user could explore the incident details. The “root” screen of the
incident specifics was an overview screen (i.e. “Incident Summary”) focusing on IT
incident characteristics. When the user selected the incident of interest, the visualization
environment was intended to adapt to the user’s assigned response role.
Support only for the IT Leader role was implemented in this prototyping effort. IT
Leaders saw an incident summary screen tailored to their role. Until the user returned
to the Grand Summary, all subsequent screens’ contents were dedicated to the chosen IT
incident and oriented to the user’s assigned role. Having the opportunity to see the high-
level view of an incident’s characteristics, the user was able either to investigate greater
incident status detail, access the Response Awareness & Management content group, or
seek out general information from Information Support. After analyzing the decisions
made by leaders, it was observed that many decisions were in part dependent upon
context that was fairly universal across IT incidents (e.g. organization structure, human
resources, regulatory concerns, policy & procedure, IT architecture). The Information
Support content group provided ready access to institutional context. The Response
Awareness & Management content group, accessible from the Incident Awareness and
Information Support content groups, started with a summary overview of response status.
One challenge for a leader with duties beyond handling the IT incident was keeping
track of tasks that might await action from them or anyone else sharing their role. The
“Response Summary” screen provided a view of actions assigned to the user. Armed

108
with a broad awareness of response efforts and responsibilities, the user could choose
greater response details or take actions to facilitate the response.
4.3.6 Data Sets and Integration
This visualization design was based on integrating and making core data sets available
in order to improve user understanding. The objective was to give leaders access to a
consistent and effective automated representation of the IT incident that replaced or
minimized the need for the Incident Coordinator to manually assemble a snapshot of
IT incident conditions, as well as to reduce the number of intermediate status updates
requested by individual leaders. Figure 4.3.B is a portrayal of the types of data sets
feeding into the visualization system.
The fundamental data sets were “Incident Description Data,” “Response Planning
and Progress” and “Institutional Knowledge.” Within Institutional Knowledge, “Re-
source Skills and Availability” was a critical subset. The data sets helped answer com-
mon questions, e.g. What is the current nature of the IT incident? What is being done
to address the incident? Is what is being done reasonable given the current and projected
nature of the incident? What do I need to be doing to assist with the response? Do we
have the right people for the job? Who has skill “X” and is available to assist? How
much longer do we think the IT incident will be active? When do we expect to have an
intermediate restoration of services?
The visualization’s concept of operations was that the visualization not be an au-
thoritative source or long-term repository of information maintained elsewhere. If, for
example, response planning and progress data were unique to the operations of the
visualization, then the system facilitating the visualization would likely house that in-
formation.

109
4.3.7 Design and Principles
Visualization design took place in two stages: first the high-level design, and then
prototype development. Much of the visual design laid out in the high-level design was
implemented in the prototype. As discussed in Chapter 3, additional scoping took place
during development, which resulted in reducing the number of screens relative to the
high-level design. Many of the navigation and interactive aspects of the visualization
were designed during the prototype development stage. As the visualization design and
related principles are discussed, distinctions between the high-level design stage and the
prototype development stage will not be maintained unless they become necessary.
4.3.7.1 Operational Platform
As mentioned in the requirements (Appendix E), thorough implementation of an IT
Incident Visualization System would best be done across multiple computing platform
types. But as multiple platform development and evaluation was not feasible, a single
platform was chosen, namely, the Windows 7 personal computer running a web browser
with Silverlight libraries. This puts the user in a stationary operational setting similar
to a user’s workspace (e.g. cubicle, office, operations center workstation). With the user
in one location, it was decided to maximize screen real estate. The screen was assumed
to be capable of 1680 x 1050 resolution, which is fairly common. No other application
was intended to share this screen space. While this was necessary for the evaluation, in
practice a second monitor would likely be necessary for this design to accommodate a
user’s other computing needs.
4.3.7.2 General in Design
Although the ultimate validation of this research was to be performed in a highly
controlled setting that would provide an evaluator a limited opportunity to utilize the
visualization’s full functionality, this did not overly impede efforts to seek general so-

110
lutions. Some requirements were discarded as the development scope narrowed, but
requirements that were in scope were explored beyond what was strictly necessary for
the evaluation. The approach was driven in part by the iterative nature of evaluation
task development, as well as the fact that the final IT incident was not specified until
after the high-level design was completed. Another reason for this approach was that
the evaluation did not seek to determine if there was strict improvement with regard
to a single IT incident type. The strict adherence of design and implementation to the
evaluation’s limitations could have jeopardized the evaluator’s ability to project the re-
search’s value and relevance beyond the planned experience. The evaluation incident was
simply a means for evaluators to appreciate how visualization might improve IT incident
management for them personally as well as for their employers.
When visual concept generalization was too difficult to implement, a manual snap-
shot approach was taken. Graphic library development was well outside the scope of
this effort, so in numerous cases static presentations were developed. However, much in
the manner of a cartoon, the illusion of dynamic presentation was achieved by replac-
ing a static presentation with a new one presenting updated narrative content. These
implemented visualization elements became tightly bound to the evaluation narrative.
4.3.7.3 Monitor and Investigate
While designing informational screens, the usage pattern of “monitor and investigate”
guided many choices. In monitor and investigate, the person scans a screen to achieve an
awareness of the topic being presented. A user may or may not have an initial goal while
scanning or browsing across the various information elements presented. In the event that
something catches the interest of the user, the user can explore further by interacting with
the screen. This is similar to the interaction pattern Tidwell characterizes as “information
browsing” [65], and is consistent with Shneiderman’s maxim of “Overview first, zoom
and filter, then details-on-demand”[66][67].

111
The “drilldown” capability was designed at a macro level in the form of supporting
detail screens accessible from the summary level. Within screens, information details
were provided in table-row expansion, populating data fields upon graphic object se-
lection, and in explanatory elements that appeared while passing the cursor over an
information item.
In order to support initial monitoring, information dimensions were carefully selected.
Care was taken to avoid having the primary information dimensions of a topic accessible
only by interacting with the screen. There were cases when the visual dimensions of
what was presented exceeded available space, a less than ideal situation. When feasible,
zoom controls were implemented in order to allow the user to view the broad pattern
and seek out details of interest. Ultimately, scrolling could not be avoided, but having
to perform an interaction pattern of “scroll-and-interact” in order to locate a primary
information attribute was avoided.
4.3.7.4 Cognitive Fit
There is a common notion that a task affects the user’s information needs, but more
subtly, the task may influence the appropriateness of the presentation style. This con-
cept was considered throughout the design. Typically, this consideration (i.e. cognitive
fit[68][69]) resulted in manifesting data in both textual and graphical forms. In many
situations the simple juxtaposition of textual elements in proximity to their graphical
counterparts was not practical. When possible, alternative views were presented in-
corporating the same information in both textual and graphical formats. This dual
representation did not override the design consideration of “Monitor and Investigate.”
Except for a few cases, the two representations could not be utilized concurrently. This
was a reasonable design choice, considering that a user performing a task sensitive to cog-
nitive fit was not likely to utilize both representations simultaneously, as the alternative
presentation is likely not needed within the field of view.

112
4.3.7.5 Familiar vs. Novel Abstraction
Information graphics for the visualization were selected for the most part to be fa-
miliar. IT incident management is an abstract-concept problem domain. This assertion
is based on an IT incident’s dimensions of extent, cost, security, and compliance, as well
as future projected costs. Additionally, there is likely to be error in calculating actual
costs. There is uncertainty with any projection, including uncertainty of future costs.
The concept of “extent” includes the effects upon business processes, organizational units,
personnel, data sets (e.g. accounts receivable, customer financial information) and phys-
ical technical components. What does a “security concern” look like? A security concern
does not lend itself to obvious representation, so attributes of the security concern are
selected for visual representation. But which attributes should be selected? Will the
attributes of interest remain constant across all security concerns? Mapping all these IT
incident characteristics into a single novel visual metaphor would take much effort by the
user to unravel and achieve sensemaking of the IT incident. “Sensemaking is a motivated,
continuous effort to understand connections (which can be among people, places, and
events) in order to anticipate their trajectories and act effectively” ([70],pg. 71). This was
a pragmatic consideration, given the nature of the impending validation stage. Further-
more, in practice it would take more research to develop appropriate visual metaphors,
as well as to provide user training before new presentation techniques would be usable.
4.3.7.6 Broad IT Incident Support
Functionality was not tailored to an incident type (e.g. server outages, data breaches,
slow networks). The design did not seek to perfect incident handling for a specific IT
incident or incident class, but rather proposed that a response plan appropriate to the IT
incident be configured during response operations. This plan provided the cornerstone
information structure on which all Response Awareness & Management was based. The
response plan could be expressed to address many IT incident classes, and the granularity

113
of the plan was not constrained by design. Incident Awareness was designed to be
consistent in presentation and functionality across incident types. Functionality of the
Information Support content group was by definition general to all incidents.
4.3.7.7 Business Process Relevance
Associating an IT incident’s impact on application architecture and related technical
components might have offered a satisfying level of relevance for a technologist. However,
technology is simply one resource contributing to the execution of business processes.
To those evaluating business impact, it is necessary to characterize an IT incident in
the context of the business operations affected. Virtualization, increased computational
capabilities, high-bandwidth communications and other technical advances have been
increasing the degree of business dependence on identifiable physical components. In
a given ecosystem, an IT incident involving a single server may affect multiple busi-
ness processes directly; and, as with dependencies between processes, an unresolved IT
incident’s impact can cascade into previously unaffected operations.
Business processes, regulatory compliance and security risk are all highly correlated.
Many business processes manipulate information in their inputs and outputs, and in
many cases the data operation adds value to the organization. Assignment of business
processes to technology resources imbues those resources with regulatory and security
risks associated with the business processes. An email server and e-commerce server
may be of the same make and model running the same operating system, but business
impact with regard to compliance and security would not be the same between them
if both were affected by an IT incident. A technology component supporting multiple
business processes will have a security and compliance profile that joins the business
process profiles it supports.
In visualization design, the business process overlaying the technical architecture is
presented when the context is relevant (e.g. an IT incident’s extent).
114
4.3.7.8 Content Group: IT Incident Awareness
IT incident awareness involves knowledge of the existence and an understanding of
the nature of an IT incident. There are several social factors that affect awareness. An
IT incident may occur that management deems too sensitive for common knowledge. Or,
an IT incident may occur that affects a part of the organization in which a leader has no
interest or that is unlikely to affect the leader in any appreciable manner. There are IT
incidents to which leaders are either obligated to respond, or at least be aware of, in order
to anticipate possible impacts on areas of the business for which they are responsible.
These high-level factors govern interest in and access to IT incident awareness.
IT incidents are significant unplanned events that negatively affect the business
through reduction of the availability, integrity and/or confidentiality of information and
information systems. IT incidents are commonly measured and characterized by their
symptoms or impacts before their root cause is established. In some cases, the root
cause is not in itself sufficient to describe the incident (e.g. power outage or malware
infiltration), yet the symptoms are useful for continued monitoring.
IT incident characterization is somewhat role-dependent. Although the same IT
incident is being characterized, the responder’s role strongly influences the lens through
which he or she interprets the nature of the IT incident. A technical responder tends
to assess the incident as an event in the domain in which they have expertise. For
example, while a “zero-day” malware outbreak with a worm component to facilitate
replication may be a nuisance to network administrators, to the PC support person it is
a vulnerability mitigation challenge, a virus signature distribution problem and, possibly,
a manual cleansing process. The network security staff sees this malware as a possible
data breach leaking information to Internet servers in other countries. Some interested
leaders may be concerned about malware incident response costs and the ongoing threat
to productivity, while others worry about regulatory compliance as the infection spreads
to computers that are used, for example, to regularly process customer financial records or

115
personal health information. The security forensics people want to know which computer
was “patient zero” and who operates that computer, as well as what information was
targeted, if any.
These are all valid points of view, albeit limited in perspective. In the long run, how-
ever, the visualization needs to support awareness of all supported response roles. There
are two aspects to consider in supporting awareness: first, the information elements
needed for awareness and, second, the form in which these information elements are
presented. This visualization was designed with different views to IT incident-awareness
attributes sensitive to response roles. During implementation, presentation ideas for the
Business Leader and IT Leader merged to some degree.
Intrinsic IT Incident Attributes
Characterization of an IT incident is contingent upon the intrinsic attributes of the
incident that can be measured, computed, forecasted or observed. The attributes iden-
tified over the course of this research were time, direct incident cost, direct incident cost
risk, extent and urgency. Of these five attributes, incident cost and extent primarily
involved measuring the incident’s past. Time was a measure that spans the incident’s
beginning to its projected ending. Direct-cost risk and urgency were measures of the inci-
dent’s future. Urgency was actually a composite measure, incorporating direct-cost risk
as well. The objective of having forecasted measures was to inform decision-making. Al-
though the damage and cost incurred to date influence decision context, decision-making
is primarily forward-looking to the point at which someone determines there is nothing
left to anticipate from the incident and decides to close it.
Time

116
Time is a fundamental measure of IT incident response that could easily be overlooked
or inadequately addressed. A visualization user’s interest in time is in the context of oc-
currence, time of cessation, duration, and time remaining before the expected initiation
or cessation of an event, action or task. Time is an essential attribute in logistics, as well
as providing context for many other decisions or judgments. In terms of duration and
delay, time can involve key thresholds for escalation and priority.
Direct Incident Costs
Direct incident costs are the actual costs incurred as a result of the incident. Cal-
culating direct incident costs involves computing a value that results from accounting
for response resources commitment, hardware replacement costs, lost productivity, mea-
surable contractual penalties and lost revenue. Labor-related costs can become difficult
to ascertain in practice and are sensitive to the time-accounting practices an organiza-
tion may follow. Costs associated with salaried workers who do not assign their time to
particular projects are difficult to measure accurately. In such cases, the “wages” ap-
plied to each resource’s time are somewhat arbitrary. Punitive costs and regulatory fines
are also direct costs, but may take years after the incident closes to determine with any
finality. Knowing the direct costs allows users to appreciate the IT incident’s true impact.
Direct Incident Cost Risk
Direct-incident cost risk is a cost-rate projection of anticipated direct-incident costs.
The objective of this measure is to allow the user to assess what a probable cost rate
would be if the incident were to continue into the future. By having an appreciation of
future costs, the user has an important measure of immediate business risk associated
with the incident. No formal algorithm was developed for this research, but a vetted

117
algorithm would be needed for this measure to be useful.
Extent
The extent of an incident involves reporting the incident’s scope-of-impact across the
business. Unlike other attributes that are largely summative values, extent is a detailed
descriptive attribute. It was treated as a highly graphical attribute because the inter-
relationships presented would be very difficult to express otherwise. This is a technical
attribute on which technical responders would likely focus most of their attention. Ex-
tent attempts to describe the literal nature of the IT incident by expressing whom and
what the incident has affected. In many cases, the cause and any ongoing activity are
occurring in an environment no person can observe firsthand, but only indirectly by their
impact on the environment. A medical analogy might be the observation of a person’s
symptoms from being infected with influenza without being able to watch the virus and
the person’s immune response in action under a microscope. Given the complexity of
the inner workings of an enterprise IT environment, it is highly challenging to express
extent in a manner sufficiently comprehensive to satisfy all users’ needs. Therefore, the
presentation and dimensions of extent (e.g. impact in relation to network infrastructure,
storage, network security controls) are role-sensitive. Extent presentation for the Inci-
dent Coordinator is oriented toward diagnosis and tracking, but toward business impact
and immediate risk for the Business Leader and IT Leader. In a non-malicious inci-
dent setting, cascading impact strongly correlates to incident duration, as well as to an
organization’s IT architecture and the controls available to provide containment.
The elements of the business addressed by extent in this research were business pro-
cesses, IT systems, metadata (types of data), and personnel. Extent presentation at the
incident summary level of the visualization provided a capsule overview of the impact
on these elements, which were treated as strata of discrete business operations strictly

118
showing impact within the layer. The detail screen for extent was designed to show the
impact of each layer, as well as how the layers interrelated. Given the cognitive and
interactive complexity of attempting to understand how the business operations strata
tied together, the capsule review in the incident summary was intended to serve the
immediate need for an initial overview that could be investigated further, if desired.
Urgency
Urgency was an attempt to measure the importance of the IT incident to the business.
Field study participants used the term “urgency” often. Urgency was a concept leaders
considered seriously when determining the level of resource commitment and the desired
pace of resolution. Though business risk was certainly a factor, up to this point urgency
was a subjective measure that did not appear to be based on established criteria. This
research proposes that urgency be computed and treated as a vital statistic. The objec-
tive was to make the urgency measure an unambiguous time-varying summative value
leaders could rely upon to form an IT incident appraisal on which to base decisions and
perform judgments. Unlike priority, this incident attribute was meant to be an objective
measure that reflects risk. Priority is a relative measure of importance across a collection
of choices and is based, in part, on subjective judgment. Urgency is meant to inform
the prioritization process. No matter what other business priorities may be occurring
simultaneously with the incident, the risk an incident poses is inherent to the incident.
Urgency was composed of three areas of contribution. The first was the response exe-
cution risk that conveyed the project management-oriented risks associated with closing
the incident. (Three subcomponents of project risk were scope, resources and sched-
ule.) The second area was direct-cost risk, and the third was an area called impact
concerns. There are three broad impact concerns that an IT incident raises, namely
brand, compliance and security. These concerns are somewhat abstract in today’s com-

119
puting environments, and would need to be assessed manually by qualified personnel.
The components of the response execution risk were rated on a nine-point scale and aver-
aged to compute the response execution risk value. The impact concerns were also rated
on a nine-point scale and averaged. For this research, a weighted geometric mean was
computed on the direct-cost risk slopes between adjacent projected-cost risk values at
five points of time in the future (i.e. +1, +2, +4, +8, +16 hours). The three contribut-
ing averages were then averaged together to produce the urgency value. A fully vetted
algorithm for urgency was beyond the scope of this research, but an interim algorithm
was needed to build coherent displays and related data.
A visualization that can adequately present these five incident attributes should pro-
vide a leader with much of the information needed to develop a functional mental image
of the IT incident. Another benefit of having these attributes presented in an acces-
sible and repeatable manner is the ability of leaders to communicate more efficiently
through the reduction of ambiguity originating from inconsistent access and description
of incident details that commonly occur during larger incidents today.
4.3.7.9 Content Group: Response Awareness and Management
Explicit vs. Implied Response Plans
Complex, unusual, costly, compromise, noncompliance, tarnished reputation, disrup-
tion, disclosure: all are terms that can be associated with the class of IT incidents being
considered in this research. One unifying element of all IT incidents, however, is that
they are unexpected. One typically prepares for the unexpected, but it is challenging
to schedule it. Dedicated first responders train for a variety of situations. In large IT
organizations some of the response team are seasoned, but some will be involved who
are not frequent responders. The composition of the team varies by the nature of an

120
incident, and response objectives can be set out in advance. But while there are patterns
of response that can provide the basis for response procedure, response actions vary with
the situation, which often is fraught with stress, uncertainty and confusion.
Prepared first responders have a “playbook” that an Incident Coordinator will work
from. If there is no procedure that fits, or if the current action plan no longer appears
appropriate, the Incident Coordinator adapts to the circumstances. A fire brigade is on
location, equipped with communication devices that allow the commander to monitor
and adjust the response[71]. But how does an ad hoc IT incident response team coordi-
nate when located on various floors, in various buildings, and across various cities and
countries? How do those with business operations responsibility gauge response progress
and prepare or compensate for disruptions to their operations? In some cases a “war
room” is established or an operations center has the necessary facilities. But that means
people have to relocate to share a common image or mental model[72] of the IT incident’s
character and corresponding response. When relocation is not feasible, web conferencing
and enterprise portals are utilized to deliver awareness updates at potentially significant
time-cost to those providing the awareness update. As the senior fire official, Davis notes
his need to witness an industrial fire firsthand in order to make critical decisions [71]. But
unless a physical event such as flood or fire causes an IT incident, the incident produces
few external stimuli that a person might assess through his senses alone. Indeed, an
IT incident may involve components hundreds of miles away from the incident response
team. The primary benefit of proximity is communication and coordination, as well as
compensation for the limited access to IT incident-monitoring software and awareness.
The sequence of response actions or response plan is a key component of the incident
context each person involved attempts to establish. Instead of verbalizing the plan, the
visualization presents a centralized, comprehensible plan of response. And, instead of
relying on every responder knowing the same playbook, and ensuring they are executing
the same play, each responder can access the “play” or plan online. If changes to the plan

121
are needed, the plan can be updated and the new information shared with the responders.
Adaptable
The response plan must be adapted to the nature of an incident. The Incident
Coordinator and others responsible for prompt remediation will assess the nature of
the incident and plan accordingly. There are overarching phases a response transitions
through, including “Assessment,” “Planning,” “Response” and “Recovery.” Assessment
is the phase in which the nature of the IT incident is characterized. Planning is the
phase in which the Response plan is formulated. Response is the phase in which the
extent of the IT incident is contained, malicious activity is halted, and available interim
solutions are implemented. And Recovery is the phase in which the affected environment
is returned to its pre-incident operating condition.
The Assessment, Planning and Response phases are typically the most time-sensitive.
However, the robustness of an interim solution implemented in Response may affect the
urgency with which the Recovery phase is executed. Closure does not occur until Recov-
ery is complete. In reality, planning is needed for every phase. An improperly executed
Assessment may result in an incomplete or erroneous understanding of the IT incident,
thus resulting in improper Planning and Response. The duration of each phase is vari-
able. The Planning phase is likely to be the shortest, and it is possible this phase may be
executed informally or within a seamless transition from Assessment to Response. Plan
design interfaces were reviewed during design, but not considered vital for the evaluation.
Approval
In cases in which IT incidents can be addressed in a straightforward manner (e.g.
hard disk failure of a server), the execution procedure involves little risk and needs no

122
implementation oversight by a leader. However, when an IT incident has had meaningful
impact or has been deemed to represent significant imminent business risk, leaders need
to know of and approve the response plan. The actions, resources and timeframe all
have the potential of both prolonging the incident’s impact and increasing its severity.
A documented plan is much easier to share, and ideally understand, compared to one
that exists solely in the mind of the response coordinator. Plan approval was part of the
workflow considered in the visualization’s design. Given the constraints of the evalua-
tion, however, it was not implemented, as it was unreasonable to expect an experienced
leader to interpret a response plan sufficiently to competently adjust, approve or deny
a plan related to an organizational environment they had only minutes to absorb, and
using interfaces on which they had received minimal training.
Progress and Projection
Having established a plan, it became practical to communicate response progress and
project response timeframes, “progress” including the status of completion of past tasks
and ongoing efforts on current activities. “Projection” involved estimating the start time
of tasks, and how much longer a phase and, subsequently, the IT incident overall was
expected to last. From progress and projection a leader may assess the effectiveness of
the response as well as consider adjustments. It may be necessary for a leader to add
additional resources, or possibly remove or reassign resources. The visualization was
designed to provide this information in various contexts. On the Incident Summary,
the user could find high-level response progress by observing which response phase had
been started. Projection was indicated in part by showing the anticipated start times of
future response phases. The “Response Resource Tasking” screen provided operational,
completion and pace status for each task within the plan. Completion indicated progress
graphically with a progress bar. Pace – the actual speed at which a task is being executed

123
compared to expected speed – was indicated by one of a set of icons (i.e. slumped figure
with a cane (slow), walking (nominal), and running (ahead)). The graphical version of the
response plan presented in the Response Summary indicated completion by accenting the
task object within the activity diagram, such as a graphic with a checkmark. Displaying
the tasks in the sequence in which they were to be executed provided logical projection.
A projected start and completion time were provided textually when a task object was
selected from the graphical layout. The “Timeline and Dependency Awareness” screen
used a task progress bar to graphically indicate progress by task. Within the timeline and
dependency graphic, projection was conveyed by the width of a task object or aggregate
width of a set of objects across the timeline.
Although formal progress forecasting models were not within the scope of this re-
search, a simple method was needed in order to populate the fields with reasonable
values. By establishing a response plan for a given phase, a critical path was established
for that phase. The projected length of the critical path was used to compute the ex-
pected duration of a phase. In addition, a task’s presence within the critical path was
indicated textually and graphically throughout the response-oriented screens.
Response Tasks
A response plan is a structured collection of tasks. Much of a response is oriented
to activities that lead to closure of the incident. There are key judgments and decisions
needed throughout the response. These decisions or judgments are essentially tasks.
Unlike the many judgments and decisions technical responders make while executing
an action task (e.g. “Does the server’s error log show unusual error entries?”), the
explicit judgment or decision task within the response plan was one that required au-
thority. Authority is necessary because the decision or judgment may have one or more
business-sensitive implications such as response costs, business operations interruption,

124
operational risks, additional incident-impact duration, regulatory compliance, or legal
liability. In some cases, these require a single person to make a decision; in others, a
group of people may share responsibility for the decision. In a dynamic situation such
as incident response, some decisions or judgments can be implicit, unless deliberately
made (e.g. the completion of a task may be at a pace slower than needed). If no explicit
decision is made regarding facilitation of the task, the implicit decision will be to not
alter the composition of the team executing the task. With response monitoring, leaders
can be vigilant to response challenges that otherwise might not be addressed.
One reason to have the decisions presented in the plan was to communicate to all
that they must be made. An explicitly planned decision can be assigned to the proper
level of authority and give that leader notice of the upcoming task. This anticipation
may allow the leader to be better prepared to execute the decision or judgment task.
In an environment in which multiple people are assigned functions, role-based decision
assignment may prevent the unavailability of one person from impeding the response.
Currently, escalation is one way to get a decision addressed if the original assignee is
unavailable. Availability-oriented escalation is reactive and usually time-based, thus
requiring a delay to occur. If another person within the role can perform the task,
then a single-queue, multiple-server condition has been established, thereby reducing the
likelihood of delayed task initiation resulting from availability constraints.
One degree of freedom within the response is the time it takes to complete precursor
tasks of a decision task. One impact of this dynamic is that the anticipated time at which
this decision is to be performed can shift. By having the decision specified in the plan,
it is feasible to update those responsible with a new timeline for making their decisions.
The response planning devised for this visualization calls out the decision and judg-
ment tasks that may be anticipated. In some cases, anticipation may be only moments
before the decision must be made. In a truly functional visualization, the response-
planning interfaces would need to be sufficiently convenient so as to quickly insert deci-

125
sions into the task flow as the need for them is foreseen.
Another benefit of formalizing the decision and judgment tasks of leaders is that the
visualization can update those who need to know the outcome of the decision or judg-
ment. This formalization of decision-making also documents these decisions, thereby
better enabling post-incident analysis and process improvement. This additional ac-
countability may hinder or alter a leader’s decision-making methodology[62] due to pro-
fessional or liability concerns, but that business management challenge will be left to
others to consider.
The response plan was presented to users as an interactive diagram oriented primar-
ily toward the logical sequencing of activities. In order to improve recognition of the
diagram’s conceptual objectives, the diagram format followed the activity diagram ap-
proach. According to Hoffer et al., the activity diagram has been used to describe the
logical sequence of activities of a business process and accommodates conditional logic
that influences activity flow[73]. Unlike Hoffer, though, the conditional or branch step
is given equal visual weight as the activity tasks themselves. The conditional step is
essentially a decision. The diamond shape used in the activity diagram was expanded
and annotated with decision-task information. For the sake of consistency across the
visualization, the diamond shape was reused to represent a decision task.
A secondary visual effect was to show progression. As the response progressed rel-
ative to the plan, the visual attributes of the activity diagram task objects changed.
The interactivity of the response plan diagram provided the user access to the many
attributes of a task that could not be presented on the activity diagram directly. In
essence, the response plan became a task directory that used task sequencing as an or-
ganizing principle. By interacting with the response plan task object, one could access
task attribute updates.
Timeline and Dependency Analysis

126
Response to an incident involves choreographing a limited set of resources in order to
execute the response plan. According to Lacey, Hulmut von Moltke, a German strate-
gist, has been known to say, “No plan survives contact with the enemy” [74]. In all but
security incidents with an active malicious actor, IT incidents tend not to compensate
in response to responders’ efforts. However, task-completion estimates may be consider-
ably inaccurate in actuality. This may cause a resource to be inadvertently assigned to
multiple simultaneous tasks as a result of a task extending beyond its anticipated com-
pletion time, thus overlapping with another task. A resource’s lack of availability may
delay start of a task. Tasks that span over a shift change could experience disruption
as exiting personnel anticipate their departure and arriving staff attempt to engage with
the task moments before the previous shift departs. These logistical challenges impact
the effectiveness of the response.
A time-based view of the response plan was designed to allow a user to see both
the logical progression of tasks as well as the tasks’ span over time. Task completion
was another attribute visible for each task. Task shapes were roughly consistent with
those used in the stylized presentation of the activity diagram previously mentioned.
The design attempted to direct the user’s attention to tasks experiencing, or those about
to experience, logistical challenges by exaggerating the object dimensions within the
interactive graphical layout. The graphical layout was strongly influenced by the Gantt
chart, due primarily to its pervasive use in project management. One modification was
to extend the Gantt metaphor to better distinguish task ordering that is due to resource
assignment from progression due to logical ordering. For simplicity, the assumption
was that a task was sufficiently engrossing to require exclusive attention of the assigned
responders. By showing resource-based progression dependency, a leader could attempt
to shorten incident duration by assigning the task to alternate resources. This metaphor
helps leaders make time-cost tradeoff evaluations. To accommodate organizations that

127
rotate responders on a shift schedule, the shift change was clearly marked on the timeline,
allowing users to see which tasks might experience shift disruption.
The timeline and dependency graphical presentation was interactive. Similar to the
interactive activity diagram previously mentioned, the task objects within the Gantt-like
diagram were controls that allowed the user to access task attribute details. Among the
details were attributes related to the logistical challenge indicators that may have been
raised for the task.
Although not implemented in software, the concept was that, as the response plan was
constructed and effort estimates assigned to tasks, the tasks would automatically be laid
out across the timeline. As the various tasks’ timing and resource attributes change, the
timeline and dependency presentation adapts. A graphical shortcoming of the Gantt-
like metaphor was that, by assigning time to the horizontal dimension and depicting
task dependency consistent with the Gantt paradigm, the graphic’s dimensions could
not be contained within the limited dimensions of the space provided. An interactive
zooming function or overview sub-screen could possibly have helped with navigation.
A conceptual shortcoming of the Gantt chart is that it follows a “waterfall” project
management metaphor, so returning to a task after it has been completed cannot be
accommodated; instead, a new instance of the task is constructed and placed further
downstream. Task iteration should be expected, especially for complex IT incidents that
have yet to be contained. These limitations prevent this display concept from being the
exclusive presentation of the response plan.
4.3.7.10 Content Group: Information Support
A number of decisions were collected from the field study investigation. When an-
alyzing the decisions for their information requirements, it was determined that well-
considered decisions needed information beyond the specific context of the IT incident
and its corresponding response. Essentially, the decision-maker needed institutional
128
knowledge. Given the ad hoc nature of team composition and the “as needed” basis
for many leaders’ participation, it was not clear that new leaders or those who respond
only intermittently have sufficient background or context for the decisions they are asked
to make. Furthermore, those who are well-versed in institutional details may not be
aware of changes that may have taken place. The Information Support content group
was designed to address gaps in a leader’s understanding of the institutional context.
Those leaders with no need for this information could simply ignore the functionality by
avoiding related screens.
The Information Support content group consisted of information related to cultural,
organizational and technical topic areas. A design consideration (not implemented in the
prototype) was that information from those topic areas presented at the top-level screen
could automatically be filtered to present information relevant to the incident being ad-
dressed. A user could then access a broader range of information if he desired a broader
context. This content group was designed with a summary-level screen and supporting
detail screens, providing richer content and interactivity for topics under focus. Only
the top-level summary was implemented, as there was little evaluation benefit beyond
allowing an initial exposure to institutional knowledge access. Although additional in-
teractivity and knowledge details would be beneficial operationally, the evaluator would
not have gained a significantly deeper appreciation for having this richer access within
the narrow time frame of the evaluation. In fact, the time spent on extraneous details
could have caused additional stress as evaluators satisfied their curiosity but made little
progress toward accomplishing the evaluation tasks assigned.
The cultural topic area was assembled to provide a view of underlying principles and
objectives the institution is seeking to achieve or uphold. This context helps the user
gauge what a “culturally correct decision” would be in the eyes of his or her superiors
and other stakeholders. The topic area consisted of two topics, “Business Dynamics”
and “Policy and Procedures.” Within the Business Dynamics content topic a user could

129
find the stated institutional values, financial considerations and institutional goals. The
Policy and Procedure topic was a convenient view into the policies, procedures, guidelines
and standards approved by the institution. This topic area may not be consulted often
as a decision is being made, but it does allow the leader to review the cultural dimensions
when needed.
The organizational topic area was assembled to provide access to the current state
of the institution’s internal organization, as well as human resource information regard-
ing those who work for it. This helps a leader understand the lines of authority, the
affiliation of personnel within organizational units, and the geographic and specific office
locations of the organizational units. In a sense, the organizational structure provides a
leader a convenient view of the “social architecture” of the institution that may influ-
ence communications and other decision-making. Human resources information provides
a leader with contact and skills information for personnel who may not be familiar to the
leader. Ideally, the human resources data set would tie into work schedules and work-
status tracking. This additional information may help a leader choose a new member
of the response team as well as understand the scope of the personnel actually affected
by the incident. Although physical safety is rarely a consideration in IT incidents, it
is nonetheless possible that personnel may need to be accounted for in an emergency
situation.
The technical topic area was assembled to provide access to the current state of the
technical aspects of the business. The topics identified were “Regulatory Profile,” “Busi-
ness Process Architecture,” “IT Architecture,” and “Change Management.” The first
three topics help a leader to determine the technical backdrop of the inner workings
and constraints governing normal operating conditions, as well as those that may influ-
ence decision-making during an IT incident. Change Management provides insight into
the decisions related to changes in IT operations. The first question of troubleshooting
is, “What changed?” Cebula and Young located the risks associated with “Actions of
130
People” as the first top-level category and “Inadvertent” (containing the “Mistakes,”
“Errors,” and “Omissions” third-level categories) as the first sub-category in their tax-
onomy of cyber-security risks[75]. Having convenient access to Change Management
records may provide insight into the possible inadvertent or procedural causes of an
IT incident. Significant doubt and stress can be dispelled when an IT incident can be
confirmed as a non-malicious event.
The top-level screen called “Information Support Center” was implemented as a
multiple-panel portal providing simultaneous access to many of these topics. The pan-
els were collapsible in an accordion control, thus allowing some flexibility in the space
available to a topic. The topics of Business Process Architecture, Policy and Procedures,
Human Resources, Business Dynamics, and Change Management were presented primar-
ily in tabular or textual form. Controls were provided that allowed data to be filtered.
The IT Architecture and “Organization Structure” topics were addressed primarily in
graphical form, with fairly traditional topology, systems and dataflow diagrams, organi-
zation charts, and site plans used to display that information.
4.4 Discussion
This section provides brief reflections on an IT incident management visualization
system, as well as a self-critique of the design.
4.4.1 Operational Adoption
A factor that may prevent adoption of an IT incident management visualization sys-
tem is a lack of necessary authoritative data sources. With integration technologies such
as web services, facilitating data feeds from diverse sources into the visualization is fea-
sible. An organization would need to invest in maintaining an accurate and detailed
institutional knowledge base, enable responders to provide progress updates, and inte-

131
grate various monitoring systems that provide operational status as well as characterizing
the IT incident. Additionally, although visualization can be shown to be of value, the
necessary organizational level and personal workflow changes would require consensus
building and steady support by upper management.
4.4.2 Choosing Silverlight
The design choice of developing the visualization in Silverlight was motivated in
part by the popular desire to avoid installing and maintaining desktop applications. By
developing a rich information application that was web browser-based, this objection to
the visualization’s benefit was avoided. One constraint of this execution environment
was that only a single screen could be displayed at a time. A developer of a proper
Windows application would have the option to support multiple windows accessible on
the screen. While introducing usability challenges, this multi-window flexibility would
also allow the limitations of one window’s content to be supplemented with another
window positioned in close proximity. In the Silverlight environment, a second browser
session is needed to achieve this effect. As facilitating multiple simultaneous sessions
by one user was outside the scope of this research, an inconvenient screen layout choice
could not be easily overcome by a user-initiated workaround.
4.4.3 Understanding Cognitive Fit
Although the concept of cognitive fit was considered throughout the design, there were
no specific IT incident-handling requirements necessitating its consideration. There is
no obvious reason to believe cognitive fit is irrelevant to the broad range of tasks leaders
perform within IT incident management. An exploration of cognitive fit within the IT
incident management task domain is needed. This exploration has been facilitated in
part by having an established baseline of visualization capabilities. Until then, it is
unclear whether the cognitive fit support provided is appropriate and effective.

132
4.4.4 Waterfall Project Management
Response planning is essentially dynamic, short-term project planning. Other than
for a bit of iterative support, the project planning technique chosen essentially followed
a linear sequence of task execution commonly called the “waterfall” model in software
development. There are other project management techniques. But unlike traditional
project planning, the scope, schedule, cost and resource dimensions of IT incident re-
sponse can change instantly. More dynamic project planning paradigms, such as agile
project management[76][77][78], may be more appropriate for IT incident handling. Re-
sponse planning is a content layer on which much of response monitoring and action en-
ablement anchors. It is possible that supporting an “agile” response plan would require
alterations to the presentation structures used to depict the various response-monitoring
dimensions.
4.4.5 Effort Estimate Verification
Estimating the effort a task may require is by nature an approximation. A non-expert
who is familiar with a task may estimate a task’s level of effort with a greater degree of
inaccuracy than an expert. Allowing for the time estimate to be qualified with a degree
of uncertainty was strongly encouraged during the field study. In essence, this is a means
to alleviate “analysis paralysis” among planners who are inexpert or otherwise unable to
anticipate the “ground truth” that may be encountered. A suggestion was that a more
qualified person could later review the estimation and adjust it accordingly, subsequently
decreasing the degree of uncertainty. In longer-running incidents, the accumulation of
poor estimations could significantly misrepresent the likely duration of the incident and
its response phase. In an operational setting where response plan approval is required,
qualified personnel could be allowed to adjust task specifications after leadership had
approved the logical sequence of the response plan.

133
4.4.6 Granularity and Type of Direction
Response planning is necessary. Beyond a certain point of sufficient guidance lies a
point of diminishing returns. Extra time spent on planning is, potentially, time not spent
by planners executing the response or performing other functions. The task granularity
at which a plan is defined is an open question.
An overly detailed plan may not align with the challenges at hand, and will likely
require more time for a leader to interpret and approve. Another consequence of fine
granularity is that technical responders will have to update more task elements to sat-
isfy communication and coordination needs. The plan will never be applicable again,
thus hindering an organization’s ability to develop reusable response patterns for future
incidents. Ideally, there is a level of sufficient granularity that gives technical responders
practical direction and coordination. Additionally, leaders who are monitoring response
assess the fit between the response and the incident. Insufficient or incomplete guidance
may prevent effective response and possibly exacerbate the incident’s impact.
In their research into hierarchical decision-making, Clancy et al. identified two com-
mand styles, i.e. “Action” and “Intention”[79]. In essence, the plan is a documented
series of commands. A response plan populated with tasks expressed in the form of
specific actions to be performed would be similar to the Action command style. A plan
containing tasks expressed as intentions or objectives would be similar to the Intention
command style. An Intention-styled plan would allow technical responders to exercise
initiative and flexibility to adapt to the actual conditions of the incident. But while an
Intention-styled plan may prove more readily reusable, it may complicate effort estima-
tion.
4.4.7 Response Action Evaluation
The current implementation of the timeline and dependency graphic presentation is
static in terms of task ordering. This is primarily a limitation resulting from development

134
resources and time constraints. Option exploration is an important part of decision-
making. A natural extension to the implementation would be to allow a user to directly
manipulate the task object in order to facilitate “what-if” analysis regarding logistical
considerations. Various logical and logistical constraints would have to be enforced to
avoid a user proposing an unreasonable alternative plan. In time, the visualization
might identify common task reordering patterns that could compensate for downstream
inconsistencies arising during “what-if” considerations.
4.4.8 Expressions of Extent
In the current design, extent has been addressed by graphically displaying the impact
of the incident across the various business elements. Summative values describing breadth
and degree of impact may be of value. It is difficult to communicate extent between
people or to develop numerical algorithms that would incorporate the extent incident
attribute while it remains a strictly graphical description. As use cases develop for the
numerical representations of extent, the form and means to produce these values will
likely become more apparent.
4.4.9 IT Incident Escalation
Incident escalation is the transfer of response control authority to a person or group
with higher organizational authority and responsibility. Business risk and visibility (e.g.
attention by employees, customers, regulators, investors or others who may adversely
affect the business) are two parameters that would influence escalation. Escalation is
an important decision in the life an incident, as a mismatch between the characteristics
of an incident and the involved leaders’ authority, business understanding and training
may lead to greater losses for the business, not to mention legal liability. Escalation
considerations were factored into the design of the Incident Coordinator screens, but
implemented support was limited to referencing escalation as a vital statistic. Given the

135
limited time available in the industry prototype evaluation for immersion in the business
context, escalation decision tasks would have been very difficult for an evaluator to
perform competently.
The field study did not explore the nuances of escalation sufficiently to compile a
reliable set of general criteria and workflow surrounding escalation and de-escalation.
Additional field study is needed to collect information regarding escalation parameters
and associated workflow. Until then, it is difficult to develop effective visualization
support for escalation and de-escalation.
4.4.10 Incident Awareness Overview Design
When laying out the IT incident attributes in the Incident Summary screen, it was a
challenge to include the entire set of incident measures on one screen. Choosing to repre-
sent IT incident extent graphically was costly in terms of screen-space consumption. This
was unfortunate, because the IT Leader cannot achieve a comprehensive understanding
of the incident without switching between screens. Thus, highly related information is, as
Tufte would describe, “stacked in time” ([80],pg. 81 ), failing to leverage the opportunity,
per Tufte, to unify words, numbers and pictures that allows the user “. . . to understand
and to reason about the materials at hand, and to appraise their quality, relevance, and
integrity” ([81],pg. 83). In a redesign of the Incident Summary screen, a priority would
be to locate all key IT incident attributes in a common field of view.
4.4.11 IT Incident Duration Timer
Time is a pervasive measure of the incident, and was reported in numerous contexts
within the visualization. Despite efforts to provide sufficient support for time, a field
study member raised a deficiency during prototype testing: the prototype lacked an
indicator showing how much time had elapsed since the incident started. The incident’s
initiation timestamp was readily available, but it would require the user to perform a

136
mental or manual calculation to determine how long the incident had been active at
the current point in time. An IT incident duration timer would have provided a vital
incident attribute. As such, it should be accessible on every screen relevant to the
incident. Unfortunately, it was not possible to accommodate this suggestion for the
industry evaluations.
137
CHAPTER 5. PRACTITIONER–ORIENTED
EVALUATION FRAMEWORK
This chapter discusses the reasoning and purpose of the evaluation framework de-
signed to facilitate validation of the research conducted in Chapter 3 and Chapter 4.
The substance of the design is presented as well. Furthermore, execution of the evalua-
tion events is described.
After a brief introduction, this chapter will begin with a description of the relationship
between the Iterative Field Study Methodology and the evaluation framework. The next
section will explain the relationship of the IT Incident Visualization System design to the
evaluation framework. An overview of the evaluation strategy is provided in the third
section. The “Evaluation Purpose and Requirements” are discussed in the fourth section,
followed by a section that explores the Practitioner–Oriented Evaluation Framework.
The chapter closes with a brief section of observations in the discussion section.
5.1 Introduction
As a matter of proper scientific inquiry, it was necessary to perform independent
observations and take appropriate measurements in order to objectively evaluate the
research accomplished in the field study stages prior to the Industry Public Evaluation
stage. The nucleus of this research presumes the hypothesis stated in Section 1.4. The
hypothesis is difficult to test directly.
A relevant problem domain containing security and compliance decisions was in-
138
vestigated, and a dynamic visual or visualization system was constructed in order for
independent observations to be performed. In this research, independent observations re-
quired human interaction and subsequent evaluation to be captured; therefore, the terms
“independent observation” and “independent evaluation” or “evaluation” are used inter-
changeably. The human in this context is a business leader experienced in the selected
problem domain. As matter of coincidence and a possible source of confusion, the prob-
lem domain research uncovered a role commonly referred to as “Business Leader,” a
description of which can be found in Chapter 3. The “business leader” referred to in the
research hypothesis should be interpreted as a generic term, which is defined as, a person
who has responsibility and authority to make decisions or exercise judgment on behalf of
an organization regarding IT incident management matters that affect business impact
or risk. As a matter of problem domain selection and investigation, as well as iterative
restrictions in research scope, the business leader determined most appropriate to per-
form an independent evaluation was one who had performed the role of an IT Leader in
one or more IT incidents. Given the cognitive nature of awareness and comprehension,
the primary measurement tool chosen was the survey instrument.
This chapter is devoted to the framework developed to conduct multiple independent
evaluations in a repeatable and reliable manner with independent IT professionals. In-
dependence was primarily a concern regarding prior knowledge or familiarity with this
research, as well as with the principal investigator. Given the nature of the sampling or
recruitment challenges, independence of judgment and anonymity between evaluators at
an evaluation location could not be assured.
5.2 Iterative Field Study Methodology
The evaluation framework was designed to facilitate execution of the final stage of
the Iterative Field Study Methodology. The goal of seeking out independent profession-

139
als required the framework to provide the context, usability and content sufficient for
someone prepared with only their personal IT incident experiences to quickly absorb the
purpose of the evaluation, perform hands-on activities, and evaluate the broader value
of the visualization.
The IT incident context and evaluation tasks selected for the evaluator were in large
part influenced by the stages that led up to the prototype development. Any potential
misalignment between evaluation tasks and the evaluators’ expectations was a concern.
This affected both the likelihood that evaluators had prior experience with executing
equivalent tasks in actual IT incident settings as well as the sense of reasonableness of
the tasks relative to the IT Leader role. The evaluation tasks were implemented so the
evaluator could perform constructive activities while interacting with the visualization.
Frustration and dissatisfaction with the tasks and task performance mechanism could
have influenced an evaluator’s ability to objectively project a sense of the visualization’s
value to their professional and employer operating contexts. Because the alternative of
either an unstructured exploration or simply “wandering” through the visualization was
likely to be far less informative to the evaluator, this risk could not be avoided.
5.3 IT Incident Visualization System
The visualization prototype design and functionality governed what could be eval-
uated as well as how[82]. The evaluation framework had to be tightly integrated with
the prototype both in terms of evaluation task objectives and task completion choices
in order for the evaluator to successfully perform each evaluation task. The interface
structures and types of data designed to facilitate task completion were subject to the
data structures and dependencies introduced in prototype development.
On the other hand, the evaluation framework strongly influenced the prototype de-
sign. In order to provide the necessary information and affordances to complete the

140
evaluation, evaluation interfaces needed to be accessible to the evaluator. This accessi-
bility introduced constraints on the prototype’s design. Fidelity with which the prototype
was developed was targeted to the evaluation audience. Operational professionals were
expected to have a greater bias against a prototype lacking the completeness and polish
that is found in their production-grade tool sets.
Overall, the cross-influences between the evaluation framework and the visualization
prototype were numerous. Despite that, these were two distinct research challenges. As
mentioned in Chapter 4, the prototype’s design was not constrained to support only the
IT incident fabricated in the evaluation framework. Among the software aspects of the
evaluation framework, the concepts introduced to facilitate evaluation were not depen-
dent on the target of evaluation being an IT Incident Visualization System prototype.
5.4 Evaluation Strategy
This section provides a synopsis of the evaluation approach explained in detail in the
sections that follow. This summary structure reflects ideas from Treu[82] and Stone et
al.[83] that suggest a concise means to describe the evaluation approach.

141
Table 5.1: Dimensions of the Evaluation Strategy
Evaluation’sPurpose
To determine if the visualization prototype is able to improvebusiness leaders’ awareness and comprehension of informationsecurity and compliance decisions.
Sources ofEvaluationData
Primarily from targeted users (i.e. IT Leaders), secondarily fromsurrogate users who were experienced IT incident handlers with noIT Leader role experience, and yet are able to emulate the IT Leaderrole.
EvaluationObjectives
Determine what aspects of decision-making, if any, were facilitatedby the visualization from personal and collective points of view.
EvaluationScope
Primarily, the visualization elements emphasized by the evaluationtasks; secondarily, the remaining elements evaluators encounteredwhile executing the evaluation.
Type ofEvaluation
The study is primarily a descriptive study to determine if and howdecision awareness and comprehension is improved.
DataCollection
Primarily, the data are subjective data self-reported inself-administered paper questionnaires. Secondary data are collectedin activity logs to provide context to the self-reported data.
EvaluationTarget
A medium-fidelity prototype with minimal graphical algorithmsupport and static pre-determined data sets.
Constraints Evaluations must be convenient, brief and engaging to the ITprofessional. They must also be relevant, reliable and repeatable,and avoid introducing data bias. Despite the quantity of potentiallytargeted users, access to them as well as their willingness andavailability will influence the size and quality of the evaluator pool.
5.5 Evaluation Purpose and Requirements
The primary purpose of the evaluations was to validate the hypothesis stated in Sec-
tion 1.4. Underlying this objective were practical requirements that had to be addressed
in order to gather information that either proved or disproved this hypothesis.
As mentioned in the “Introduction,” the targeted evaluators were independent pro-

142
fessionals with IT incident-handling leadership experience. Convenience was a significant
requirement. These people had limited availability over the course of a week, and were
easiest to access during the workday. Also, as the amount of time requested away from
work further restricted their ability to participate, limiting the time an evaluator was
asked to invest was also necessary. Engagement by each participant was essential when
they did participate in order for them to effectively respond to questionnaires, achieve an
understanding of their purpose, become familiar with the research and perform hands-on
activities on an interface they had never seen before.
Convenience, time limitation, and engagement are the three key requirements facing
the evaluator. The background requirements necessary for research data quality were
relevance, reliability, repeatability and bias avoidance. Although efforts were made to
minimize the effect of bias on the results, bias was inevitable[84]; however, not all biases
were equally detrimental to the data collected.
As a consequence of the convenience requirement, the evaluation had to be conducted
in multiple locations. This naturally resulted in portability and transportation issues.
Within computer design, portability is often a tradeoff with computing performance.
The entire ensemble of equipment and supporting materials needed to be efficiently and
safely transported to and from both an evaluation facility and the actual evaluation
room. Convenience was also a factor from the hosting entity’s perspective, with efficient
logistics in order to minimize the hosting entity’s effort.
All of these high-level objectives were considered in the evaluation framework design
elements, as well as in the evaluation execution discussed in the upcoming subsections.

143
5.6 Evaluation Framework
5.6.1 Evaluation Event Objectives
Initially, the total time allocated for evaluator participation was one hour, excluding
travel. The basis for time allocation was that an hour was a reasonable amount of time
a professional might be able to spare away from work. This was later modified slightly
to 75 minutes in order to accommodate the actual lengths of the training video and
introductory presentation. The time allocation illustrated in Figure 5.1 is a reasonable
depiction of the proportions of time allocated for the various research activities taking
place at an evaluation event.
Capture Background
Educate & Prepare
Provide Constructive
Experience
Capture Feedback
Single 75-Minute Session
Figure 5.1: Evaluation Event Objectives
Numerous components needed to be designed and integrated in order to achieve all of
the evaluation-day objectives in a reliable fashion. A self-administered survey instrument
was needed in order to capture an evaluator’s background quickly and efficiently. Also,
a couple of education approaches were needed in order to bootstrap each evaluator to
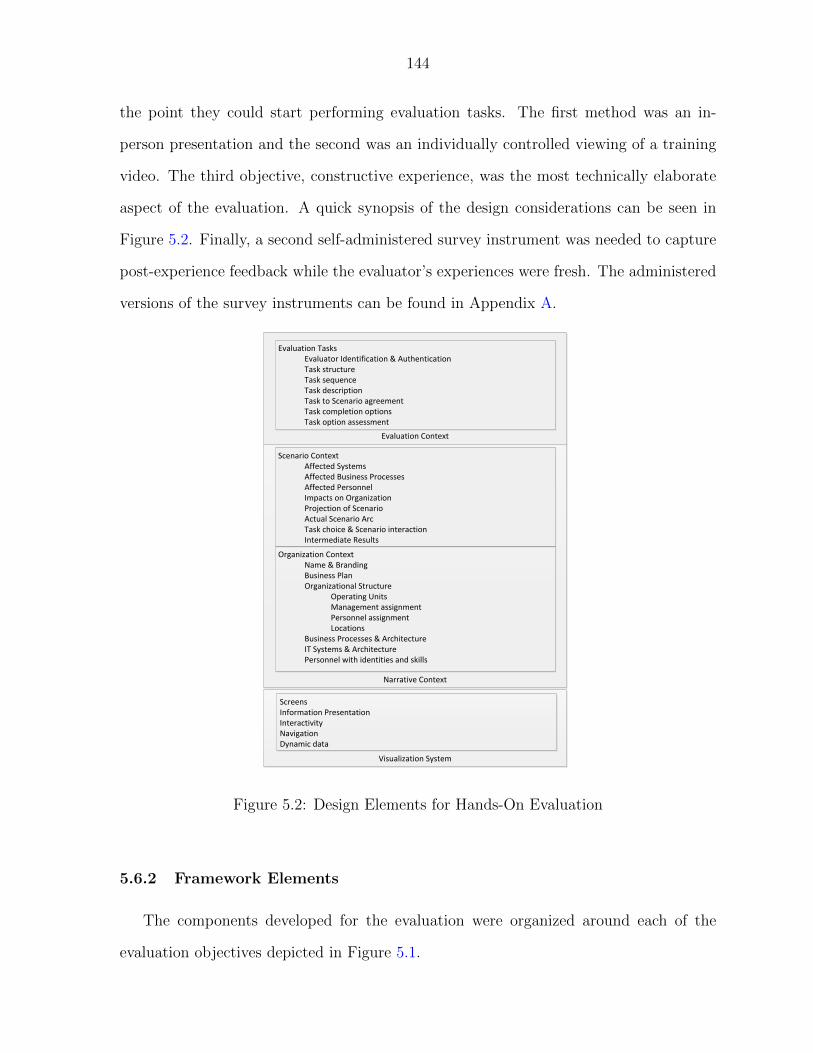
144
the point they could start performing evaluation tasks. The first method was an in-
person presentation and the second was an individually controlled viewing of a training
video. The third objective, constructive experience, was the most technically elaborate
aspect of the evaluation. A quick synopsis of the design considerations can be seen in
Figure 5.2. Finally, a second self-administered survey instrument was needed to capture
post-experience feedback while the evaluator’s experiences were fresh. The administered
versions of the survey instruments can be found in Appendix A.
Evaluation Context
Narrative Context
Visualization System
ScreensInformation PresentationInteractivityNavigationDynamic data
Organization ContextName & BrandingBusiness PlanOrganizational Structure
Operating UnitsManagement assignmentPersonnel assignmentLocations
Business Processes & ArchitectureIT Systems & ArchitecturePersonnel with identities and skills
Scenario ContextAffected SystemsAffected Business ProcessesAffected PersonnelImpacts on OrganizationProjection of ScenarioActual Scenario ArcTask choice & Scenario interactionIntermediate Results
Evaluation TasksEvaluator Identification & AuthenticationTask structureTask sequenceTask descriptionTask to Scenario agreementTask completion optionsTask option assessment
Figure 5.2: Design Elements for Hands-On Evaluation
5.6.2 Framework Elements
The components developed for the evaluation were organized around each of the
evaluation objectives depicted in Figure 5.1.

145
5.6.2.1 Capture Background
The capture of evaluator feedback on the prototype would be incomplete without
the ability to ascertain the background influencing opinions reflected in the feedback.
Although calls for participation specified the desired qualifications, it was not clear what
the actual qualifications were of each evaluator as they arrived at the evaluation. Ad-
ditionally, evaluator backgrounds were anticipated to be helpful with interpreting com-
monalities of opinion.
The survey instrument was a paper document. Paper was chosen over a computer-
based medium primarily for its simplicity of administration and subsequent reliability in
performance. So long as a functioning writing implement was available, the survey could
be completed. This also simplified the role the evaluation computers played.
The survey was administered prior to any introduction to the research beyond what
was available in the “call for participation” literature (an example is provided in Ap-
pendix K). This timing was chosen for two reasons: first, to limit the size of the second
questionnaire; second, to collect information that each evaluator could provide without
offering additional information about the research, thus eliciting responses less likely to
be influenced by the research about to be presented.
The numerous choices made in the layout of the instrument were strongly influenced
by Dillman et al.[38]. The instrument’s design could be disassembled and rationalized,
but that would take a considerable amount of space. Instead, discussion is limited to the
research contribution sought by the questions that were asked.
The questions formulated were categorized into four sections, as seen in Appendix A,
namely “Personal,” “Professional,” “Organization,” and “IT Incident Management Bi-
ography.” The Personal section requested gender and age in order to collect funda-
mental descriptive information of the evaluator as a person. The Professional section
was designed to collect information about the evaluator’s familiarity with information
technology and a broad sense of their professional responsibilities, as well as their famil-
146
iarity with their current employer. Their employer’s ZIP code was requested in order
to generally locate their workplace, which would be useful in analyzing feedback from
a geographical perspective. The Organization section was intended to characterize the
size of the evaluator’s employer in terms of personnel and the organization’s purpose
(e.g. pharmaceuticals, federal government), thus possibly providing additional insights
into their feedback. The IT Incident Management Biography section was the longest and
most complicated in terms of what the evaluator had to consider in order to respond.
This last section provided an opportunity for the evaluator to declare their expertise with
and function within IT incident handling. Additional questions asked for the magnitude
of the impact IT incidents have had from both a personal and organizational perspective.
5.6.2.2 Educate and Prepare
The primary mission of this evaluation objective was to prepare the evaluator to
successfully complete the hands-on activity and provide thoughtful feedback in the second
survey. To achieve these goals, each evaluator needed an intense introduction to the
research, an explanation of their role in the research, and training on how the hands-on
environment functioned.
These objectives were divided into two mediums. The first medium evaluators en-
countered was a presentation provided by the on-site researcher; the second was a video
that started after logging in just prior to starting the first task. The presentation was
oriented toward establishing the conceptual and emotional groundwork needed prior to
starting the hands-on activity. Research suggests that the emotional state of a person af-
fects learning and creativity[85]. In a sense, the emotional state of the evaluator affected
their engagement in the evaluation process, a consideration that was integrated into both
mediums. The video offered training on how the evaluation environment functioned, as
well as what was expected of the evaluator from an activity performance perspective.
There was overlap in content between the two mediums in order to provide multiple

147
exposures to important concepts.
The presentation covered the following topics:
• Presenter introduction
• Sponsor (Information Assurance Center) introduction
• Event purpose
• Evaluator qualifications
• Concerns regarding privacy, voluntary participation and benefits
• Research objective
• Research structure
• Field study findings
• Research purpose of the prototype
• Parameters of the hands-on experience
• Simulated context and IT incident
• Training covering broad layout, logging in, identity/function of fictional character,
how to complete an evaluation task, navigation
• Answering questions and providing final reminders and instructions
These topics helped to familiarize the evaluator with the nature of the activity, pro-
vide background leading to the subject of their evaluation, set the expectations of what
they were to do, provide the narrative context to what they would experience, and offer
an initial explanation of the workings of the evaluation environment. From an emotional
perspective, the evaluator was able to determine whether the activity was relevant and

148
worthy of their continued interest in the process. The IT incident management purpose
of the visualization’s functionality was deliberately avoided, as the limited time allot-
ment did not allow for the possible one-to-three-hour explanation necessary to cover the
concepts or intended workflows. As a usability test and capture of first impressions, it
was better that design intentions and inadvertent leakage of opinions by the researcher
be avoided.
As a medium, the video was highly effective in delivering content in a repeatable
fashion. It also can be an effective means to demonstrate functionality and provide an
opportunity to orient the viewer to the spatial layout. A personalized viewing was ar-
ranged, allowing each user to adjust volume and rewind portions they needed to repeat.
The length of the video was a major design consideration as, overall, the video delayed
the evaluator’s ability to perform the evaluation. More importantly, an overlong video
would have affected the evaluators’ ability to maintain focus on the content presented.
The design of the video was a balancing act between length and content. One challenge
was with the speed at which words could be heard on the voiceover, with some research
reporting effective listening rates of up to 300 words per minute and more[86][87]. Com-
plex ideas require reflection for effective learning, and testing showed such a pace to
sound manic to the listener. An initial completed video had pauses between ideas edited
out, and nearly all who viewed that version in dry runs found it very challenging to
glean understanding by the end. A second version was produced with pauses introduced
between thoughts, but keeping the original word rate of roughly 180 words per minute.
As a means to expand the perception of the size of the research team, as well as
set an alternative emotional tone, a woman was selected to perform the voiceover. The
voiceover was recorded in a studio and edited by a professional sound engineer. The sound
quality was considered important from both emotional and cognitive perspectives. Poor
sound quality could distract the listener from the content, as well as imply a sense of low
standards that might translate to the ensuing experience. The visual track consisted of
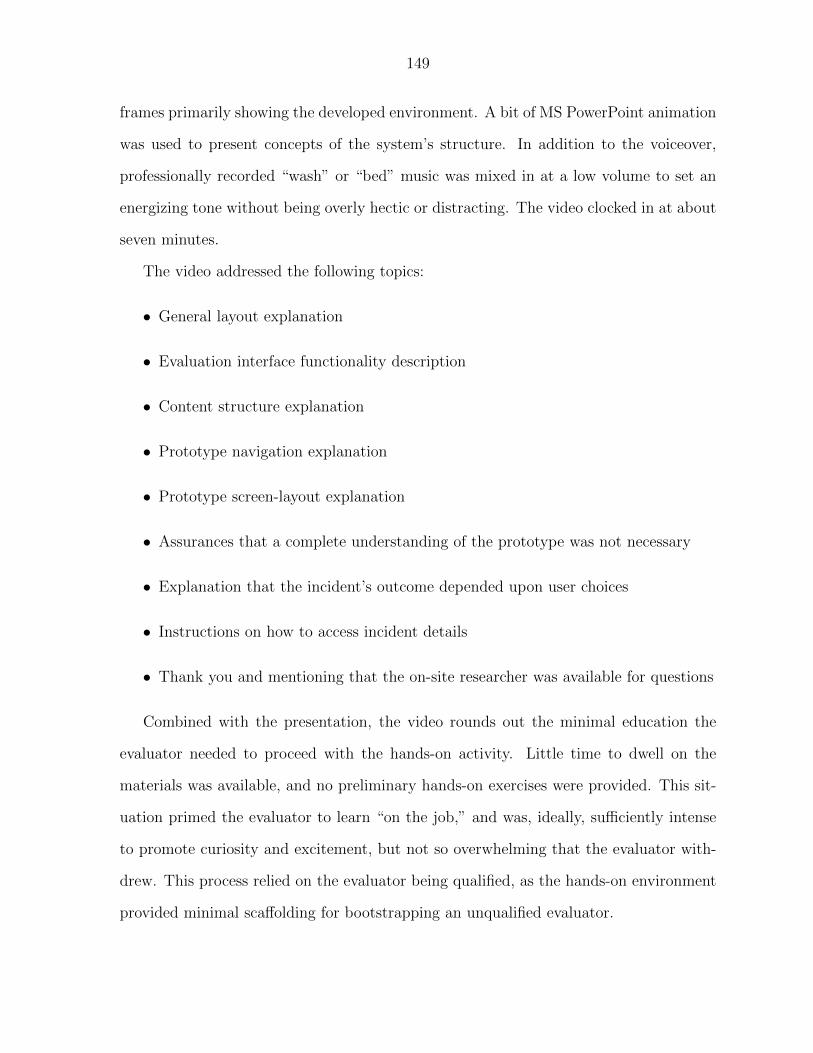
149
frames primarily showing the developed environment. A bit of MS PowerPoint animation
was used to present concepts of the system’s structure. In addition to the voiceover,
professionally recorded “wash” or “bed” music was mixed in at a low volume to set an
energizing tone without being overly hectic or distracting. The video clocked in at about
seven minutes.
The video addressed the following topics:
• General layout explanation
• Evaluation interface functionality description
• Content structure explanation
• Prototype navigation explanation
• Prototype screen-layout explanation
• Assurances that a complete understanding of the prototype was not necessary
• Explanation that the incident’s outcome depended upon user choices
• Instructions on how to access incident details
• Thank you and mentioning that the on-site researcher was available for questions
Combined with the presentation, the video rounds out the minimal education the
evaluator needed to proceed with the hands-on activity. Little time to dwell on the
materials was available, and no preliminary hands-on exercises were provided. This sit-
uation primed the evaluator to learn “on the job,” and was, ideally, sufficiently intense
to promote curiosity and excitement, but not so overwhelming that the evaluator with-
drew. This process relied on the evaluator being qualified, as the hands-on environment
provided minimal scaffolding for bootstrapping an unqualified evaluator.

150
5.6.2.3 Provide Constructive Experience
It is highly challenging to evaluate a set of visualization concepts in the abstract.
Furthermore, attempting to envision its value for personal use or, broader yet, to one’s
employer, is difficult if no value has been experienced. Even those who are comfortable
with abstract and philosophical concepts cannot respond without a long list of qualifica-
tions. For example, “Yes, the proposed idea has value, but it would have to contain/ do/
hold/ perform/ appear like this data/ function/ visual element.” This resulting equiv-
ocation has limited value, as no substantive progress would be made toward proving or
disproving the research hypothesis.
A visualization system with no data provides little value because, visually speaking,
there is nothing for a user to see. Displaying arbitrary data was an option, as the user
might possibly derive superficial value in the form of visual stimulus, but higher-order
cognitive value would be non-existent. As Card et al. state, “The purpose of visualiza-
tion is insight, not pictures” ([58],pg. 6). The data contained within the visualization
system must be relevant to some established context. The actor using the system must
also have context from which to interpret and utilize what is being presented. Without
a purpose for utilizing the visualization, there is no concerted effort to seek insight, thus
failing to discover any potential value in the research. A constructive experience was
therefore crafted in order to prepare the evaluator to respond thoughtfully to the post-
evaluation survey, and thereby thoughtfully responding to the research hypothesis as well.
The constructive experience consisted of a single IT incident scenario and six evaluation
tasks. Each evaluator experienced the same IT incident and was asked to perform six
tasks, but slight variation in task composition was facilitated through evaluator selection.
Context Hierarchy
The constructive experience was a hierarchy of context layered over a visualization

151
system, depicted in Figure 5.2. The context hierarchy was composed of two context area
categories. The first was the “Narrative Context,” which provided the basis on which
the second category, the “Evaluation Context,” was constructed. The Narrative Context
provided the logical framework on which to build coherent and consistent data that was
populated in the visualization system. There were two subcategories within the Narra-
tive Context, the first being the “Organization Context” and the second the “Scenario
Context.” The Scenario Context was dependent upon the Organization Context. The
scenario was the sequence of events the evaluator experienced that could not exist in
isolation from an underlying environment in which the events were to transpire. Having
a scenario established, the evaluation tasks were formulated to be “practical” and “rea-
sonable” in the context of addressing the scenario. Evaluation task details were relevant
to the scenario, but more broadly, each challenge the evaluator faced was something they
either could have or had encountered in practice.
Evaluation Task Completion Strategy
Although conceptually each context layer was grounded simply in the layer below,
the grounding or coupling of the Evaluation Context and Scenario Context layers within
this medium-fidelity prototyping environment was bi-directional. The scenario content
was manually generated. A consequence of this limitation was that manual effort was re-
quired to ensure reasonable alignment between content and each task, as well as between
task choices. The managed alignment required that the mechanics of task completion be
restricted, so choice options were well-defined and limited in quantity. Underlying logic
within the software environment switched data sets, images and other static layouts as
each task choice was made. A side effect of limiting the quantity of choices was that
it simplified the task-completion process without overly simplifying the experience with
visualization. In many cases, task choices could be vetted simultaneously. Having more
152
choices for each task beyond those provided would have had limited value. More choices
would have decreased the probability of random achievement of the best closure results,
but at great expense in content generation.
Narrative Time
The scenario in which the evaluator participated provided views into the IT incident
lifecycle as well as challenges faced in addressing the IT incident. Although there are IT
incidents in which an entire handling lifecycle is twenty minutes or less, this timescale
would be conceptually inconsistent with the tasks selected. Task selection was based
on the requirements ranking discussed in Chapter 3. The rationale was that if par-
ticular requirements were given preference by professionals in the field study, then the
Independent Professionals would also appreciate exercising the implementation of those
requirements. Therefore tasks were crafted to exercise those requirements, which lose
practical relevance when an IT incident is short-lived. Thus the scenario lasted longer,
narratively speaking, than the actual time allotted for the evaluation. In order to ac-
commodate the time-span mismatch, time lapse was introduced and communicated to
the evaluator.
Evaluation Interfaces
From the implementation perspective, the evaluation interface was developed first.
Since the objective was to have the visualization adapt to evaluation task choices, the
state machine that governed the visualized content was embedded into the evaluation in-
terface. A common narrative state was maintained across all of the visualization screens,
and changed only after the evaluator made a choice.
The evaluation interface was broken into two narrow regions in order to give the

153
visualization prototype a flexible aspect ratio. The interfaces can be seen in Figure 5.3.
The vertical column on the left-hand side was devoted to monitoring progress through the
evaluation as well as the narrative timeframe of the IT incident scenario. The horizontal
region on the bottom was devoted to providing information about the current task at
hand, as well as enabling the evaluator’s task completion. The prototype accepted a
range of user input, facilitating interaction with various functions simulating a system
able to support IT incident response. Prototype actions taken by the user had no bearing
on satisfying the literal interactions necessary for the evaluation to proceed to the next
task. Task completion required interaction in the bottom right corner in the “Evaluation
Task Description” region.
A. IT Incident Visualization PrototypeB. Evaluation Timer
C. Task Tracker
D. Time Elapsed Indicator
E. Incident Time F. Task Description G. Task Choice Interface
Figure 5.3: Hands-On Environment

154
The “Evaluation Interface” region had four information elements. The top two ele-
ments were related to the evaluation’s completion; the bottom two were associated with
the scenario. “Evaluation Time” was a countdown timer helping the evaluator keep track
of the time being spent performing the evaluation. The “Task Tracker” indicated, by
way of shading and animation, the current task at hand, how many tasks had been com-
pleted, and how many tasks remained. The “Time-Elapsed Indicator” was a temporary
display of the amount of total time elapsed as the evaluator started the next task. The
“Incident Time” element was a clock reflecting the current scenario time. After a task
had been initiated, the clock proceeded to track time in real time, providing a sense of
time passing in the context of the scenario as the evaluator worked through a task.
The primary elements within the Evaluation Task Description were “Task Descrip-
tion” and “Task Choices.” The Task Description updated for each task, and provided
orientation and instruction sections. The orientation was intended to provide context to
the task to be performed. With time lapsing in jumps, together with no interaction with
the other members of the response team, it was necessary to provide narrative filler in or-
der to establish context for the task. In some cases the orientation provided organization
context (e.g. policy) that would not be known by the evaluator. The instruction section
explained what the task was and clarified the significance of the choices presented in the
Task Choices area. It was clear, prior to implementation of the visualization screens, that
having many prototype screens would likely make wayfinding challenging for the first-
time user. To assist with wayfinding, screen navigation controls were provided within
the Task Description section.
Task Choices was the section of the Evaluation Task Description in which the eval-
uator’s choices were committed. Mechanically, choices were facilitated by radio button
controls, with the choice description next to them. For all but the last task, task six,
the number of choices was limited to three. This forced-choice mechanism gave the eval-
uators clues as to what the best answer might be. By implementing a choice-sensitive,
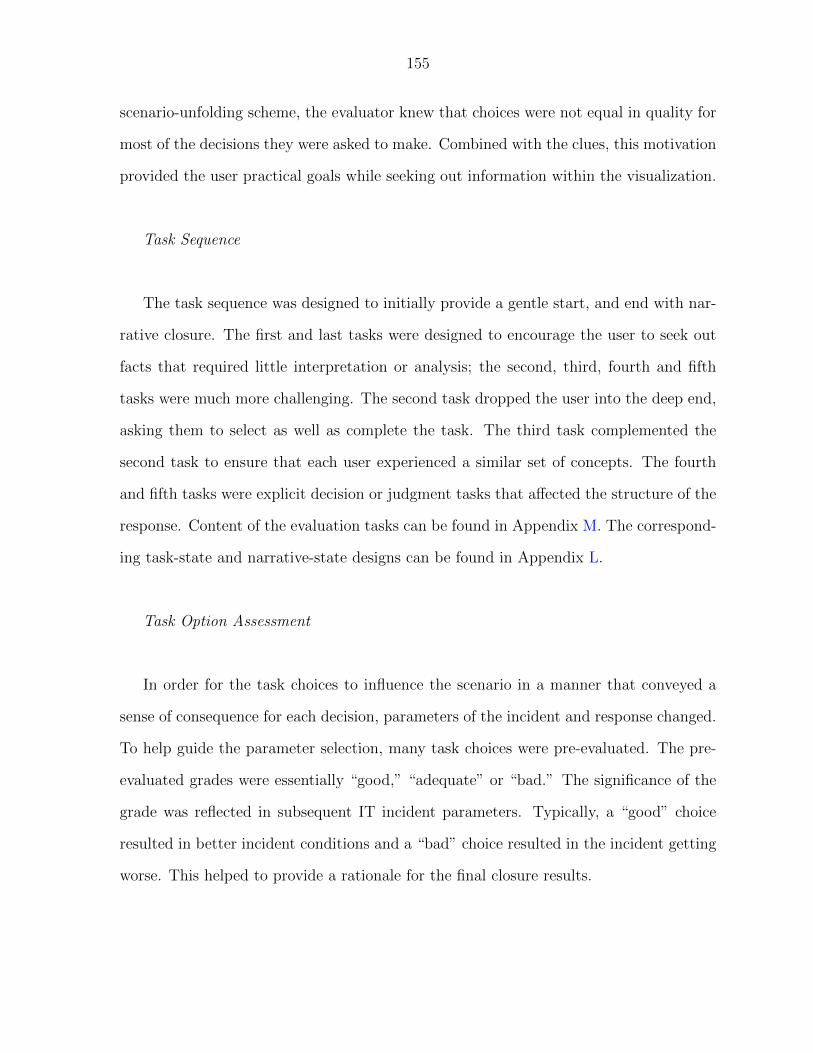
155
scenario-unfolding scheme, the evaluator knew that choices were not equal in quality for
most of the decisions they were asked to make. Combined with the clues, this motivation
provided the user practical goals while seeking out information within the visualization.
Task Sequence
The task sequence was designed to initially provide a gentle start, and end with nar-
rative closure. The first and last tasks were designed to encourage the user to seek out
facts that required little interpretation or analysis; the second, third, fourth and fifth
tasks were much more challenging. The second task dropped the user into the deep end,
asking them to select as well as complete the task. The third task complemented the
second task to ensure that each user experienced a similar set of concepts. The fourth
and fifth tasks were explicit decision or judgment tasks that affected the structure of the
response. Content of the evaluation tasks can be found in Appendix M. The correspond-
ing task-state and narrative-state designs can be found in Appendix L.
Task Option Assessment
In order for the task choices to influence the scenario in a manner that conveyed a
sense of consequence for each decision, parameters of the incident and response changed.
To help guide the parameter selection, many task choices were pre-evaluated. The pre-
evaluated grades were essentially “good,” “adequate” or “bad.” The significance of the
grade was reflected in subsequent IT incident parameters. Typically, a “good” choice
resulted in better incident conditions and a “bad” choice resulted in the incident getting
worse. This helped to provide a rationale for the final closure results.

156
5.6.2.4 Capture Feedback
Having completed the hands-on activity, the evaluator was sufficiently prepared to
evaluate the visualization from their professional perspective. Feedback was captured
using a paper-based, self-administered survey instrument. The layout of the second
questionnaire followed many of the conventions used in the first.
The questions formulated were categorized into four sections, as seen in Appendix A.
The first section, “Evaluation Experience,” captured broad qualities related to what
the evaluator had just completed. The first two questions related to how in tune the
evaluator was with the hands-on activity. The third question was meant to validate the
appropriateness of evaluation tasks selected. The fourth question determined how aligned
the evaluator felt with the fictional business established in the Narrative Context. The
last question of the section elicited the evaluator’s appreciation of the incident scenario’s
significance relative to the fictional firm. Overall, the section assesses the degree of
success of the experience. Capturing an understanding of the level of success of the
experience relative to the evaluator was meant to help interpret responses in the following
sections.
The second section, “From Your Perspective,” was designed to draw out the evalu-
ator’s thoughts beyond the limited application of the prototype they experienced. One
question sought to elicit what the potential overall value of the IT Incident Visualization
System concept might have for the evaluator in the context of their handling responsi-
bilities. The second sought to determine if the evaluator thought a visualization system
such as the prototype might be effective in assisting them with decision-making. In-
stead of simply asking them whether a visualization would be helpful in a broad sense,
the question asked the respondent to qualify how the visualization might assist by ask-
ing for confirmation of assistance with the following attributes: fact provision, option
consideration, impact evaluation across interrelated processes and organizational units,
and communicating decisions. The second question is directly related to the research

157
hypothesis.
The third section, titled “From Your Firm’s Perspective,” was designed to draw out
the evaluator’s thoughts beyond their personal benefit considerations. The first question
asked if an incident visualization system tailored to their employer might improve IT
decision-making processes related to incident handling. If they thought that an improve-
ment was possible, they were asked to rank the magnitude of advantages in terms of
awareness, understanding complexity, incident recognition, and understanding impacts.
This question provided another evaluative dimension relative to the research hypothesis
by exploring the collective aspects of awareness and comprehension of decisions. Three
questions sought to ascertain the other dimensions of potential value that visualization
could provide. These additional dimensions were reduction of IT incident duration, an
objective measure of incident urgency, and overall benefit. Despite the lack of statistical
evidence, it is reasonable to believe that, on average, improvements in decision-making
would positively correlate to a reduction in IT incident duration. The urgency-related
question addressed whether the urgency measure was perceived to be useful for IT inci-
dent awareness by professionals beyond those who participated in the field study. Overall,
this section provided a rough measure of how aligned the visualization’s functionality was
to a variety of organizations.
The last section of the questionnaire, “General Wrap-Up,” asked respondents for raw
feedback about the actual prototype. A large white space was given to accommodate
any suggestion that came to mind. The objective of this unconstrained question was to
seek out suggestions that would direct future research and development.
5.6.2.5 Purpose of Approach
The Practitioner-Oriented Evaluation Framework was carefully constructed in or-
der to efficiently elicit evaluative feedback on this research in a repeatable manner by
carefully managing what the evaluator experienced and the time invested through their
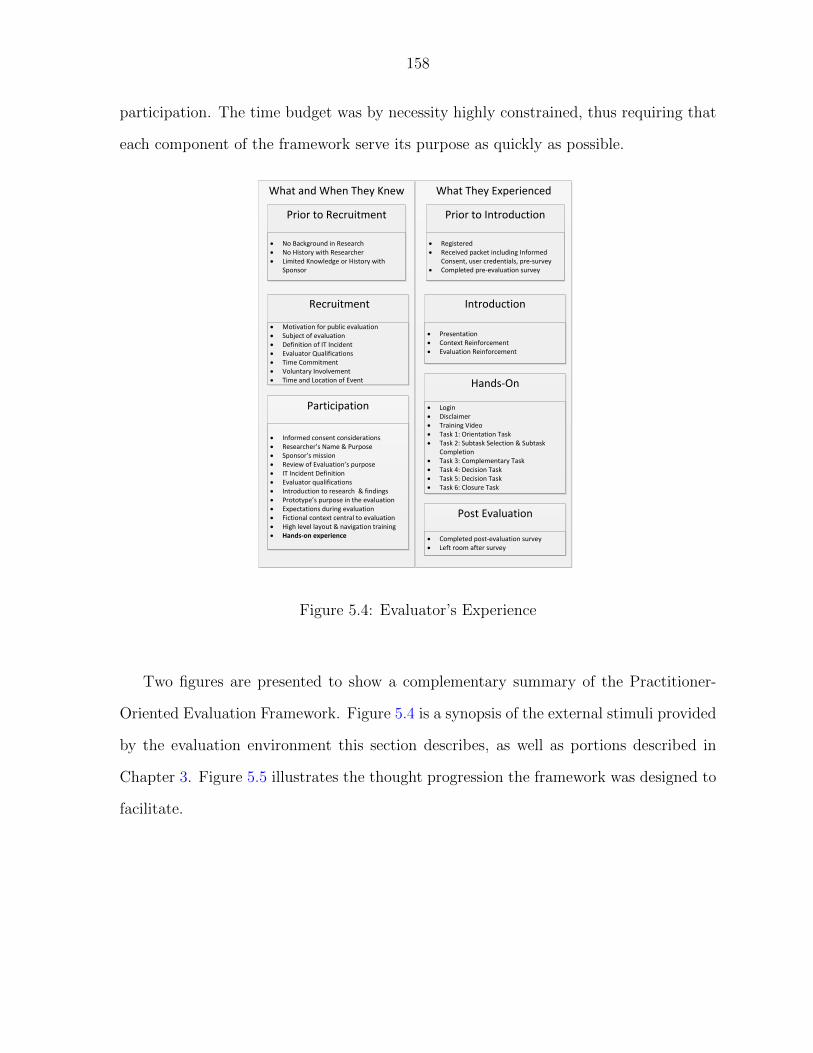
158
participation. The time budget was by necessity highly constrained, thus requiring that
each component of the framework serve its purpose as quickly as possible.
What and When They Knew
Prior to Recruitment
No Background in Research No History with Researcher Limited Knowledge or History with
Sponsor
Recruitment
Motivation for public evaluation Subject of evaluation Definition of IT Incident Evaluator Qualifications Time Commitment Voluntary Involvement Time and Location of Event
Participation
Informed consent considerations Researcher’s Name & Purpose Sponsor’s mission Review of Evaluation’s purpose IT Incident Definition Evaluator qualifications Introduction to research & findings Prototype’s purpose in the evaluation Expectations during evaluation Fictional context central to evaluation High level layout & navigation training Hands-on experience
What They Experienced
Prior to Introduction
Registered Received packet including Informed
Consent, user credentials, pre-survey Completed pre-evaluation survey
Introduction
Presentation Context Reinforcement Evaluation Reinforcement
Hands-On
Login Disclaimer Training Video Task 1: Orientation Task Task 2: Subtask Selection & Subtask
Completion Task 3: Complementary Task Task 4: Decision Task Task 5: Decision Task Task 6: Closure Task
Post Evaluation
Completed post-evaluation survey Left room after survey
Figure 5.4: Evaluator’s Experience
Two figures are presented to show a complementary summary of the Practitioner-
Oriented Evaluation Framework. Figure 5.4 is a synopsis of the external stimuli provided
by the evaluation environment this section describes, as well as portions described in
Chapter 3. Figure 5.5 illustrates the thought progression the framework was designed to
facilitate.

159
Visualizing IT Incidents?
How do IT incidents affect me?How do IT incidents affect us?
Research is consistent with my experience.That is what they want from me today.
Ah, okay I sort a see how this is going to work.
Whoa, this is a lot of stuff.How do I work this thing?
What am I supposed to do?Okay, I pick one of these choices.
Hmm, how do give a good answer to this task?Okay, I guess: I saved the day; didn’t do badly; ouch, that was a meltdown.
From what I heard and experienced today:My first impression on if and how it can help me is….My first impression on if and how it can help us is...
Eval
uatio
n Pr
ogre
ssio
n
Before registration
Completing pre-evaluation survey
Introduction Presentation
Hands-On
Completing post-evaluation survey
Figure 5.5: Evaluator’s Progression of Thinking
5.6.2.6 Evaluation Execution
Although the evaluator’s brief excursion into this research had been carefully planned
and prepared, there were still relevant details that by comparison may appear to be
embellishments. Details were considered to promote consistency between each evaluation,
as well as details meant to advance the notion that this work originated beyond the on-site
representative, thus encouraging a positive emotional response and sense of role-playing.

160
Projection Screen
Syst
emSy
stem
Syst
em
Syst
emSy
stem
Syst
em
Registration
PC
Figure 5.6: Evaluation Room Layout
One significant detail was room layout. The maximum capacity for the evaluation
event was six people. There were two primary room layout styles that were implemented
based on power outlet availability. One layout style is shown in Figure 5.6; the other
was a slight modification in which a pair of system tables was situated behind the center
section of chairs, thereby enclosing the center section with pairs of systems. No matter
how many evaluators attended, all six systems were available for their use. Participants
were encouraged to use the tables for filling out the pre-evaluation survey, and then to
move to the center section of chairs for the introductory presentation. Typically, the
participant got up briefly to move once again to a workstation for the hands-on portion.
Ideally, this brief physical stimulus helped to reset focus. Multiple rows of center chairs
in sufficient quantity allowed the six or fewer people to have a choice of where they sat.
The shape of the room and placement of the door and projection screen influenced where
the registration desk and presenter’s table were placed. While the hands-on activity took

161
place, the on-site researcher sat at the registration desk or any other place out of the
way in order to avoid distracting the evaluators.
Comfortable headphones were provided so that each evaluator could listen to the
training video. As a personal comfort consideration, disposable headphones-ear-cushion
covers and alcohol wipes were offered to ease hygiene concerns. Although these offers
may not be of interest to an evaluator, ideally the consideration was appreciated as
thoughtful and thorough.
As an added detail to the narrative context being presented in the introductory
presentation, a display with a marketing brochure layout had physical examples of the
products the fictional company manufactured. The fictional company was loosely mod-
eled after an actual company, which provided samples of products they manufacture.
The display was opened up on a stand at the presenter’s table. This added touch was
meant to reinforce the roles evaluators would be performing in the upcoming hands-on
activity.
All of these details and others helped provide inter-event consistency, displayed a
sense of competency, and assisted with executing smoothly operating evaluation events.
5.7 Discussion
This section addresses an evaluation design consideration. Other evaluation-based
reflections and self-critique can be found in the Discussion section of Chapter 6.
5.7.1 Usability Testing
Although formal usability testing would be a valuable assessment to perform on
either this prototype or a future iteration, the evaluation executed in this research did
not involve thorough usability testing. Stone et al. mention that usability has five
dimensions, namely “Effective,” “Efficient,” “Engaging,” “Error Tolerant,” “Easy to

162
Learn”, and that design objectives need not be balanced across these dimensions[83].
This truly was the case in the design of this prototype. Effectiveness and engagement
were the dominant dimensions considered during prototype design, and error tolerance
was addressed in the evaluation interfaces. The execution of assigned tasks was an
attempt for the evaluator to self-assess the prototype’s effectiveness. Evaluator interest
in both the prototype and evaluation activity can be seen in the amount of time invested
in completing each task. Chapter 6 discusses the resulting indicators of both the design’s
effectiveness and engagement.
There were several impediments to the task of effectively addressing efficiency in
the design. The first hindrance was that the Iterative Field Study Methodology did
not have another round of Study Group investigations into how the selected evaluation
tasks are performed today. The second anticipated challenge was that there is significant
task execution variation that results from organizational culture and toolset availability.
Lastly, there was the issue of the evaluation itself. Efficiency is a matter not only of how
efficiently a system supports the user, but also a matter of how efficiently the user can
use the system. In other words, efficiency is in part related to the user’s familiarity with
the interfaces and tasks. A proper measure of efficiency could not be taken until after
minimal mastery of the interfaces and tasks had been established. Accomplishing that
level of mastery would have taken more evaluator time, and the effort of developing the
necessary training materials would have been significant.
Ease of learning is a challenging dimension of usability to address in the IT incident-
handling problem space, which is challenging in its own right. Introducing a tool that
facilitates tasks that, possibly, no tools support today raises the potential that any initial
exposure to aiding these tasks may pose learning challenges. From a literal execution
of evaluation tasks, the evaluator’s ability to reach the end of the hands-on activity is
a necessary but insufficient indication of whether the environment was easy to learn.
Ideally, the IT incident-visualization interface was easy to learn, but no direct attempt

163
to measure this quality of usability was made. Ease of learning can likely be inferred in
any usability challenges evaluators might express in the post-evaluation survey. Opti-
mistically, a designer can hope their initial design succeeds in this category, but ease of
learning is one quality that will likely take many iterations to achieve.
Effective error-tolerance evaluation of the IT Incident Visualization System requires
that the visualization system be sufficiently functional so that an evaluator can actually
use the tool directly to accomplish a task. The medium-fidelity prototype was very
tolerant, as user interactions with it had no consequences for the task at hand.

164
CHAPTER 6. EVALUATION RESULTS
6.1 Introduction
This chapter provides an analysis of the evaluation event data collected from the
“Industry Prototype Evaluation.” The interpretation and appraisal of these results will
also be addressed in this chapter. Given the limitations of the sampling protocol, as
well as the resulting sample size, no inferential statistics have been computed. Instead,
statistics have been limited to summary measures.
This chapter starts with a section addressing the quantity of evaluation events and
challenges related to conducting evaluation events. The next section explores the ques-
tionnaire results obtained from these evaluation events. The third section explores the
choices and related timing resulting from the evaluators’ hands-on activities, while the
fourth lays out the criteria used to evaluate the research hypothesis in context with the
evaluation data. The fifth section documents the evaluation of the research hypothesis
as well as other aspects of the visualization. Finally, the chapter concludes with a brief
discussion in the sixth section.
6.2 Evaluation Event Overview
The evaluations took place entirely in central Iowa. Six evaluation sessions were held,
but only four were attended by qualified participants. Of the four attended sessions,
two were public access and two were held in restricted-access settings. Both of the
unproductive sessions were public sessions. One of these was conducted with a single

165
person who admitted to having no IT incident-handling experience before the event’s
hands-on activity commenced; the second was simply unattended, and was the first of
two sessions that day. An additional four evaluation sessions were coordinated but not
held, due to an anticipated lack of attendance. Two additional private sessions received
initial support by hosts, but no viable dates were forthcoming. Overall, evaluation events
were somewhat difficult both to establish and to populate with qualified attendees.
A total of eighteen people attended the four successful sessions. One of the re-
spondents refused to complete key IT incident-handling experience questions in the pre-
evaluation survey, so that person’s input was disqualified. The total sample size was
therefore seventeen. The reported self-characterization of the attendees is discussed in
the “Survey Results” section.
6.3 Survey Results
Survey results are presented in several sections. The first section will review the
demographic attributes self-reported in the pre–evaluation survey. The next subsection
will analyze the background information previously reported. The following subsection
will present the feedback reported in the post–evaluation survey.
6.3.1 Participation Background Data
Among the seventeen participants, five were female and twelve were male. Their
median age was 42, and their median IT experience was 15 years. The respondents’
median tenure with their current employer was 12.5 years.
Most evaluators had served in various roles across their IT incident-handling history,
and all but two had served in a leadership capacity during an IT incident. Twelve of the
participants had served in the IT Leader role. Of the five who did not have IT Leader role
experience, three had functioned as Incident Coordinators. Table 6.1 provides statistics,

166
collected over the evaluation events, that describe the backgrounds of the professionals
who contributed to the sample. Please refer to Appendix A for the full text of the
“Pre–Evaluation Questionnaire.”
Table 6.1: Evaluation Participant Background Statistics
Attribute Responses Median Mean Std. Dev.Age (years) 17 42.0 43.47 7.34
IT Experience (years) 17 15.0 16.41 9.38
Employment Tenure (years) 17 12.5 12.85 4.61
Direct Reports (count) 17 5.0 5.94 5.74
Indirect Influence (count) 15 24.0 6,755.00 25,796.68
Workplace Population (count) 17 800.0 3,266.70 3,680.17
Firm Population (count) 17 14,000.0 18,858.82 12,395.37
Ability to Function (count) 17 15.0 15.41 12.31
Part of Response 17 20.0 119.18 258.09
Workplace Incidents Annually(count)
16 62.5 2,066.75 3,540.75
Cumulative Staff-Hours (count) 7 800.0 902.14 790.90
Costs ($) 6 325,000.0 483,333.33 481,192.96
Min Response Team Size (count) 17 3.0 3.35 2.23
Max Response Team Size (count) 17 25.0 32.29 24.83
Percentage of Outages 16 12.5 36.00 40.51
Nearly all groups (i.e. 16) in which the participants worked were involved directly with
information technology. The degree to which the participants’ positions were committed
to IT incident handling was nearly evenly split, with eight as dedicated responders and
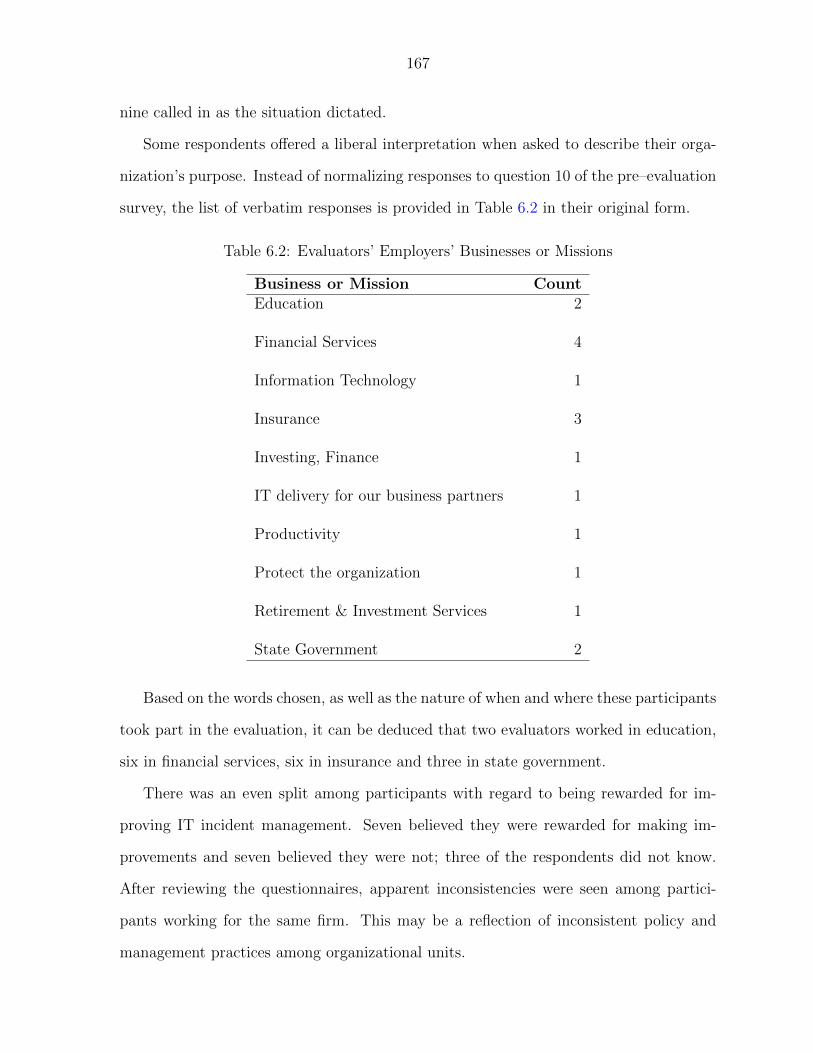
167
nine called in as the situation dictated.
Some respondents offered a liberal interpretation when asked to describe their orga-
nization’s purpose. Instead of normalizing responses to question 10 of the pre–evaluation
survey, the list of verbatim responses is provided in Table 6.2 in their original form.
Table 6.2: Evaluators’ Employers’ Businesses or Missions
Business or Mission CountEducation 2
Financial Services 4
Information Technology 1
Insurance 3
Investing, Finance 1
IT delivery for our business partners 1
Productivity 1
Protect the organization 1
Retirement & Investment Services 1
State Government 2
Based on the words chosen, as well as the nature of when and where these participants
took part in the evaluation, it can be deduced that two evaluators worked in education,
six in financial services, six in insurance and three in state government.
There was an even split among participants with regard to being rewarded for im-
proving IT incident management. Seven believed they were rewarded for making im-
provements and seven believed they were not; three of the respondents did not know.
After reviewing the questionnaires, apparent inconsistencies were seen among partici-
pants working for the same firm. This may be a reflection of inconsistent policy and
management practices among organizational units.

168
6.3.2 Participant Background Data Analyses and Considerations
It would appear that the 17 people whose input was solicited and incorporated into
this research were qualified. The business sectors represented in this sample were repre-
sentative of industries dominant in central Iowa. Twelve could be designated as target
users who had the IT Leader role experience targeted by the evaluation process; the
remaining five were accepted as surrogate users with sufficient experience to emulate the
IT Leader role.
The standard deviations of the population questions are large. This was in part due
to the diversity of the employers the participants represented. Another consideration in
the context of the “Workplace Population” question was the interpretation of the term
“workplace.” The intention for this response was to limit the response to the population
working within the confines of a building. Some respondents chose to associate their
response with the organizational unit with which they most directly identified. This in-
sight came from verbal comments as well as from deduction based on evaluation location.
Due to respondents’ affiliations within larger parent companies, similar underreporting
is suspected in the “Firm” population question.
There is a great deal of variance in the “Indirect Influence” question resulting from
an outlier of 100,000. It is unclear what this value means, since the person’s employer is
roughly one-fifth that size. Otherwise, the next largest indirect influence value is 1,000,
which is much more reasonable given that the participant’s employer is five times larger
than that value.
There were a couple of questions on the pre–evaluation survey that posed challenges
for the participants. The questions that have a respondent count lower than 17 indicate
that some questions were either skipped or the “Don’t Know” option was selected. The
most cognitively challenging questions were related to approximating the annual costs
and staff-hour commitments expended on IT incident handling over twelve months. Be-
yond the possibility of not having rough operating statistics readily accessible, a con-

169
ceptually appropriate response should have factored in an IT incident as defined by this
research. Participants were asked to keep the definition in mind for all questions related
to IT incidents.
A pair of respondents noted that they had 8,000 incidents a year and spent $135
per incident. The product of those two numbers was computed and entered for their
responses to the question regarding IT incident costs over twelve months, with a resulting
cost of more than $1 million. It is doubtful the responses to the number of IT incidents
in the workplace over a year and the cost per incident truly reflected the stated definition
of an IT incident. The IT incidents being considered in this research are complex and
involve a number of people, and should be relative outliers to the other IT incidents an
organization experiences. Nevertheless, taking their input at face value, their employer
apparently was experiencing multiple large-scale IT incidents daily.
Beyond those two respondents, maintaining the definition of the IT incident appeared
to be an issue for others as well. Three responded that the minimum size of a response
team was one, and five responded with a minimum size of two, neither of which was
consistent with the stated definition. Eight respondents indicated the minimum response
size to be four or more. Overall, the responses to questions related to annual count of
workplace incidents, cumulative staff-hour commitments, costs, minimum team size, and
percentage of outages were all suspect. These troubling responses provide at best a hazy
glimpse into the related aspects of IT incident management.
6.3.3 Post–Evaluation Questionnaire Results
The survey responses are referred to either by their question number or by an abbre-
viated name. The administered questionnaire can be found in Appendix A.
The questionnaire was designed originally to accommodate an evaluation in which
the roles of Business Leader, IT Leader and Incident Coordinator were target users. This
question was kept as a “scaffolding” question to help elicit episodic memories of what

170
the evaluator had just done. Despite the introductory presentation, as well as repeated
reminders that the targeted role was the IT Leader, two respondents said that their
evaluation role was as Incident Coordinator.
Only ten respondents said that they completed the six evaluation tasks. The question
stipulated a timeframe of 20 minutes, and it is believed that some respondents may have
responded to be consistent with that stipulation. The 20-minute phrase was another
attempt to evoke episodic memory, but it may have backfired given that a majority of the
participants needed more than 20 minutes. The next section will address logged activity
data in detail, but it is relevant to point out in advance that all but one participant was
confirmed as having completed all six evaluation tasks. All but two respondents (i.e. 15)
felt the tasks to be reasonable.
Question 4 asked about the similarity in business or mission of the fictional company
in relation to the participant’s current employer. Although the fictional company was
characterized as a manufacturer of composite materials, 8 of 17 participants felt there
were “some similarities” between the fictional company and their own firms. It appeared
that IT incident and related context were sufficiently common that these eight did not
feel that the business sector in which the fictional company was set made any significant
difference. Given the diversity of the previously identified business sectors from which
the participants came, this response was somewhat unexpected.
Question 5 asked the participant to appraise the overall consequence of the IT incident
in relation to the fictional company. For the most part, the expected response was
“moderate,” and the majority (i.e. nine) said the consequence was indeed “moderate.”
Four respondents said “low” and the remaining four said “high.” Given the potential
for the IT incident narrative to adapt to decisions, some variability of response to this
question was anticipated. “Moderate” was the assessment expected for even the best-case
outcome.
The “jury” of 17 appeared to be mostly (i.e. nine participants) undecided as to

171
whether a tailored IT Incident Visualization System would help the respondent with
their incident-handling duties; of the others, four said “no” and the remaining four said
“yes.” This curious result is discussed later in the chapter.
Every respondent noted that a visualization system could be effective for supporting
at least one aspect of facilitating decisions. Further, everyone agreed that visualization
could assist with documenting past and future actions, outcomes and decisions, both
during and after the incident. Thirteen said that the visualization could present incident-
related facts. Ten said that the visualization could assist with appraising impacts across
several interrelated business processes or departments, and nine said the visualization
could assist with awareness of options. The most skeptical respondent acknowledged only
that the visualization could assist with documentation. Four less doubtful respondents
said “yes” to all four listed aspects.
The response to question 8 had multiple steps. If an incident visualization system was
anticipated to make no improvement to decision processes, the respondent could simply
state “no.” But, if the respondent thought that a visualization system would improve
IT incident-handling decision processes, they were asked to appraise the advantages they
believed the visualization might provide. The appraisal was on a three-position scale,
with the lowest value being “very few,” “some” as a mid-point, and “many” as the highest
value. Five areas of advantage were listed for their appraisal. Three participants said
“no” to the initial question and 14 said “yes.” The breakdown of reported advantages
are listed in Table 6.3.
Question 9 asked evaluators whether an IT Incident Visualization System tailored
to their organization would reduce the average time to closure on IT incidents. The
participants overwhelmingly (i.e. 13) said that they were “not certain”; only one person
said “yes” and three said “no.” This result is discussed later in the chapter.
The incident urgency measure identified from the field study effort was put to the test
for its general value to the IT incident-handling community. Question 10 asked if having

172
Table 6.3: Evaluator Assessment of Incident Visualization System’s Areas of Advantage
Advantage Very Few Some ManyIncident Awareness 0 6 8
Understanding Complexity 1 9 4
Recognizing Range of Incidents 2 7 5
Understanding Internal Impacts 0 5 9
Understanding Outside Impacts 4 6 4
an objective measure of IT incident urgency similar to what was experienced would help
their firm assess the timeliness and adequacy of an IT incident response. The response
was that six were “not certain,” one said “no” and ten said “yes.” Thirty-five percent
is a significant portion of the respondent pool to be undecided. This result is discussed
later in the chapter.
The last question asked each respondent for a suggestion for improving the current
version of the visualization system. Although the question asked for one suggestion,
some respondents provided more than one; three participants chose not to respond. For
the most part, the suggestions did not provide new insights into aiding IT incident
handling at a conceptual level. The suggestions were normalized by way of classification.
Four comments were classified as suggestions, three as skeptical observations regarding
aspects of the visualization concept, and thirteen were essentially complaints. All but one
complaint were related to usability. The predominant usability complaint (five instances)
was related to navigation complexity. The next most frequent usability complaint (three
instances) was related to interface complexity. Workflow and screen complexity tied for
third place, with two instances each. This result is discussed later in the chapter.

173
6.4 Activity Log Analysis
Although all 17 participants performed the hands-on activity, the reporting that
follows had to accommodate two challenges. The first challenge was that the logging
originally designed for the evaluation was naıve in expecting that participants could
complete the evaluation in 20 minutes. The logging mechanism’s time reference was the
evaluation timer that counted down from 20 minutes, which failed to log the additional
time needed when an evaluator did not complete the evaluation in 20 minutes. This
deficiency was addressed midway through the Industry Public Evaluation stage. The
consequence was that the time-related data set analyzed does not contain evaluator
activity that could not be properly accounted for with respect to time. The second
challenge was that a Silverlight crash took place for one evaluator. Due to security
concerns related to Silverlight application operations, the activity log could not be written
to disk until the very end. Therefore, logging was managed in memory that was lost along
with the user’s hands-on activity session. As a result, the sample size is 16 or smaller,
depending on context.
The activity logs provided insight into the choices evaluators made as well as the tim-
ing between choices. The choices were ranked by quality during content development.
Efforts were made to reduce the ambiguity between evaluation choices and the content
being presented in the visualization. Ultimately, the researcher made a subjective judg-
ment in terms of assessing each choice option. The target of the evaluation was the
visualization and not the evaluator. If it had been a simultaneous evaluation of both the
user and the visualization, the assessment of each choice option should have been done in
consultation with experts in IT incident handling. In his research of chess players, Klein
mentions that he utilized experts to rank the quality of chess moves, thereby allowing
him to assess decision quality[62].
Despite these limitations in interpreting the significance of the choices made, ana-
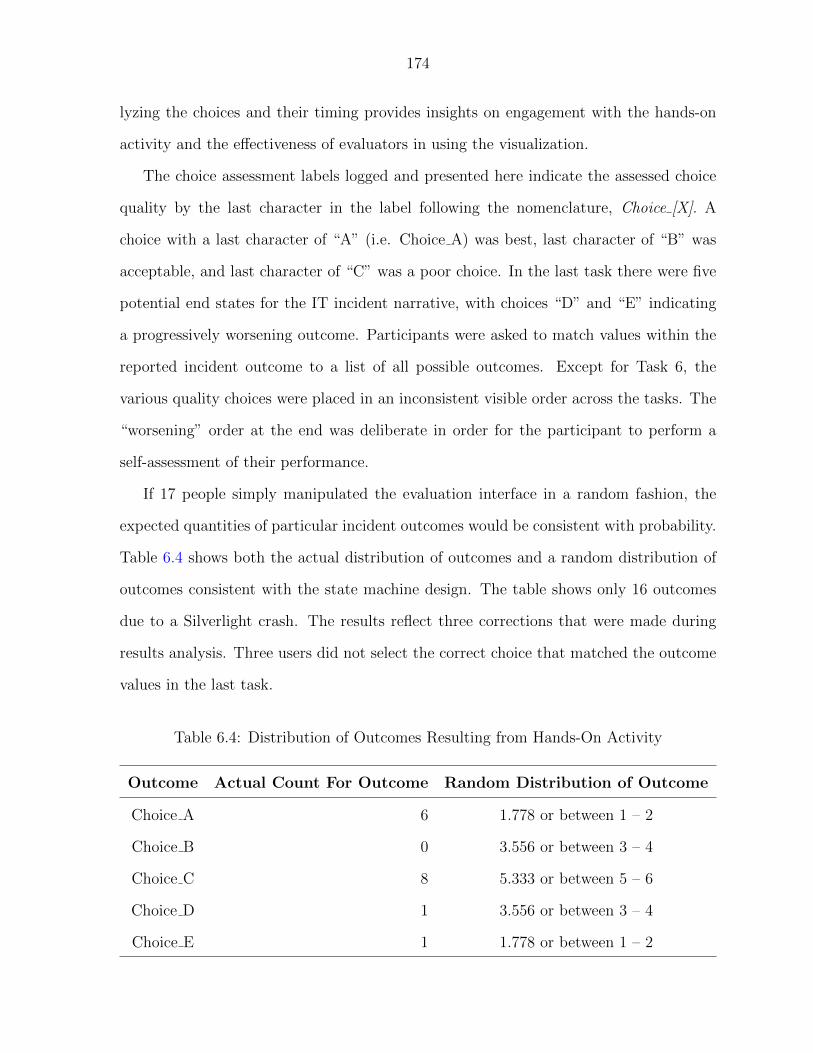
174
lyzing the choices and their timing provides insights on engagement with the hands-on
activity and the effectiveness of evaluators in using the visualization.
The choice assessment labels logged and presented here indicate the assessed choice
quality by the last character in the label following the nomenclature, Choice [X]. A
choice with a last character of “A” (i.e. Choice A) was best, last character of “B” was
acceptable, and last character of “C” was a poor choice. In the last task there were five
potential end states for the IT incident narrative, with choices “D” and “E” indicating
a progressively worsening outcome. Participants were asked to match values within the
reported incident outcome to a list of all possible outcomes. Except for Task 6, the
various quality choices were placed in an inconsistent visible order across the tasks. The
“worsening” order at the end was deliberate in order for the participant to perform a
self-assessment of their performance.
If 17 people simply manipulated the evaluation interface in a random fashion, the
expected quantities of particular incident outcomes would be consistent with probability.
Table 6.4 shows both the actual distribution of outcomes and a random distribution of
outcomes consistent with the state machine design. The table shows only 16 outcomes
due to a Silverlight crash. The results reflect three corrections that were made during
results analysis. Three users did not select the correct choice that matched the outcome
values in the last task.
Table 6.4: Distribution of Outcomes Resulting from Hands-On Activity
Outcome Actual Count For Outcome Random Distribution of Outcome
Choice A 6 1.778 or between 1 – 2
Choice B 0 3.556 or between 3 – 4
Choice C 8 5.333 or between 5 – 6
Choice D 1 3.556 or between 3 – 4
Choice E 1 1.778 or between 1 – 2
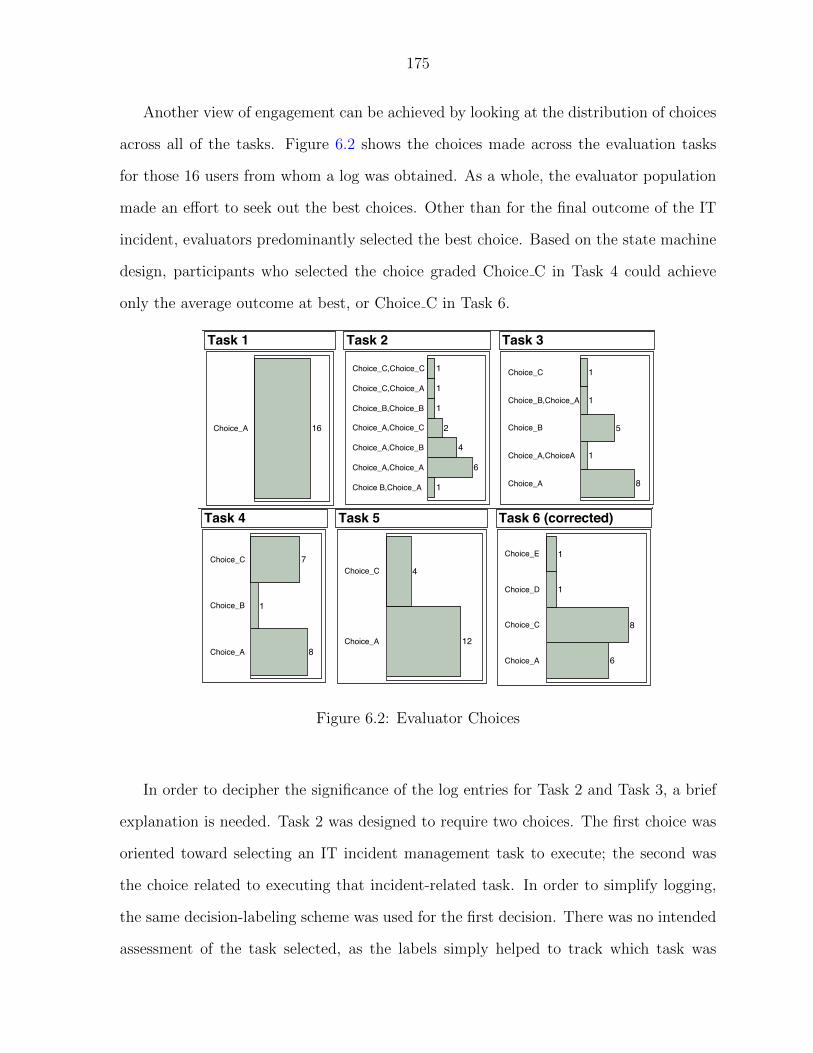
175
Another view of engagement can be achieved by looking at the distribution of choices
across all of the tasks. Figure 6.2 shows the choices made across the evaluation tasks
for those 16 users from whom a log was obtained. As a whole, the evaluator population
made an effort to seek out the best choices. Other than for the final outcome of the IT
incident, evaluators predominantly selected the best choice. Based on the state machine
design, participants who selected the choice graded Choice C in Task 4 could achieve
only the average outcome at best, or Choice C in Task 6.
Choice_A 16
Task 1
Choice B,Choice_A
Choice_A,Choice_A
Choice_A,Choice_B
Choice_A,Choice_C
Choice_B,Choice_B
Choice_C,Choice_A
Choice_C,Choice_C
1
6
4
2
1
1
1
Task 2
Choice_A
Choice_A,ChoiceA
Choice_B
Choice_B,Choice_A
Choice_C
8
1
5
1
1
Task 3Distributions
Choice_A
Choice_B
Choice_C
8
1
7
Task 4
Choice_A
Choice_C
12
4
Task 5
Choice_A
Choice_C
Choice_D
Choice_E
6
8
1
1
Task 6 (corrected)Distributions
Figure 6.2: Evaluator Choices
In order to decipher the significance of the log entries for Task 2 and Task 3, a brief
explanation is needed. Task 2 was designed to require two choices. The first choice was
oriented toward selecting an IT incident management task to execute; the second was
the choice related to executing that incident-related task. In order to simplify logging,
the same decision-labeling scheme was used for the first decision. There was no intended
assessment of the task selected, as the labels simply helped to track which task was

176
selected. The tasks presented were equally valid and valued. The choice made in the
second part was assessed a quality value. Task 3 was designed to complement Task 2,
in that it presented alternative tasks similar to those offered but not selected in the first
part of Task 2. The intention was to expose participants to the same concepts, even
though they had the flexibility to pick their activity in Task 2. There were three task
states for Task 3, and a user went into one of those states based on the activity selected
in Task 2. One of the task states asked the participant to make two choices, which were
then recorded in the activity log and assessed a quality value. Appendix M documents
the tasks and task choices, as well as providing a mapping of the actual text seen by the
evaluator and the assigned label used for logging.
When considering the “choice paths” that evaluators made during the evaluation,
there were 15 unique paths or choice patterns, with only one repeat. Given 16 docu-
mented choice patterns, diversity was expected. The combinatorics associated with the
choice options and state machine yield 360 possible choice patterns. Since choice pat-
terns are conceptually based on judgment and not random selection, some choice pattern
clustering should be seen as the evaluation sample size grows. Clustering can, to a minor
degree, be seen with the very first task in this limited sample. Since every participant
chose Choice A, there are 54 choice patterns that cannot appear.

177
Choice Path vs. Overall Duration
Overall Duration
8:00 12:0016:00 26:0030:0034:0038:00Mean
Choi
ce P
ath
Choice_A/Choice_A,Choice_A/Choice_A/Choice_A/Choice_A/Choice_A
Choice_A/Choice_A,Choice_A/Choice_A/Choice_A/Choice_C/Choice_C
Choice_A/Choice_A,Choice_A/Choice_A/Choice_C/Choice_A/Choice_C
Choice_A/Choice_A,Choice_A/Choice_B/Choice_C/Choice_A/Choice_C
Choice_A/Choice_A,Choice_A/Choice_B/Choice_C/Choice_C/Choice_E
Choice_A/Choice_A,Choice_B/Choice_A/Choice_A/Choice_A/Choice_A
Choice_A/Choice_A,Choice_B/Choice_A/Choice_A/Choice_C/Choice_C
Choice_A/Choice_A,Choice_B/Choice_A/Choice_C/Choice_A/Choice_C
Choice_A/Choice_A,Choice_C/Choice_A/Choice_A/Choice_A/Choice_A
Choice_A/Choice_A,Choice_C/Choice_B/Choice_A/Choice_A/Choice_A
_A/Choice_B,Choice_B/Choice_B,Choice_A/Choice_A/Choice_A/Choice_A
Choice_A/Choice_C,Choice_A/Choice_B/Choice_C/Choice_A/Choice_C
Choice_A/Choice_C,Choice_C/Choice_B/Choice_B/Choice_C/Choice_D
Where(5 rows excluded)
Graph Builder
Figure 6.3: Choice Path Durations
The timing analysis on overall duration showed that, on average, it took 21 minutes,
42 seconds to complete the self-paced hands-on activity. Three of the initial participants
needed more than 20 minutes as well, but the actual duration of those sessions is un-
known. Figure 6.3 shows the respective durations of 13 sessions. The symbols on the
plot represent the end state of the IT incident. The diamond represents those sessions
that ended with the best outcomes, and the simple points are those sessions that ended
with average outcomes. The plus symbol represents sessions that ended below average,
but more significant is that these outcomes had the smallest frequency of occurrence. It
appears that many of those who achieved the best outcomes were willing to invest extra
time in order to make better choices and investigate the visualization screens. The level
of engagement appears to have been fairly high. Twelve sessions, including those with
incomplete time records, lasted more than 19 minutes.

178
Mean(Task Duration) & Task Duration vs. Task
Task
Task 1 Task 2 Task 3 Task 4 Task 5 Task 6
Mea
n(Ta
sk D
urat
ion)
& T
ask
Dur
atio
n
0:00
2:00
4:00
6:00
8:00
10:00
12:00
14:00
16:00
18:00
20:00Mean Task Duration
Where(20 rows excluded)
Graph Builder
Figure 6.4: Task Durations & Mean Task Duration by Task
By assembling all of the known evaluation task-completion durations by task, one can
see the timing patterns associated with the evaluators’ progression through the hands-
on activity. Figure 6.4 presents the durations by task, with the error bars denoting the
standard deviation of duration values. The objective of Task 1’s design appears to have
been met. As this task was performed fairly quickly for a first task, and the choice
quality was uniformly good, the evaluators experienced a quick win. Task 2 took, on
average, the longest to perform. This was expected, given the lack of relative structure
to the activity as well as the newness of the environment. The remaining tasks were not
equal in complexity relative to Task 2, but a reasonably steady decline in task execution
took place. Depending on the task state for Task 3, evaluators were asked to watch a
video approximately two minutes long that demonstrated a resource request feature they
could not effectively utilize with the limited training provided. This video introduced
a minimum duration for those evaluators. With a simplistic task execution paradigm
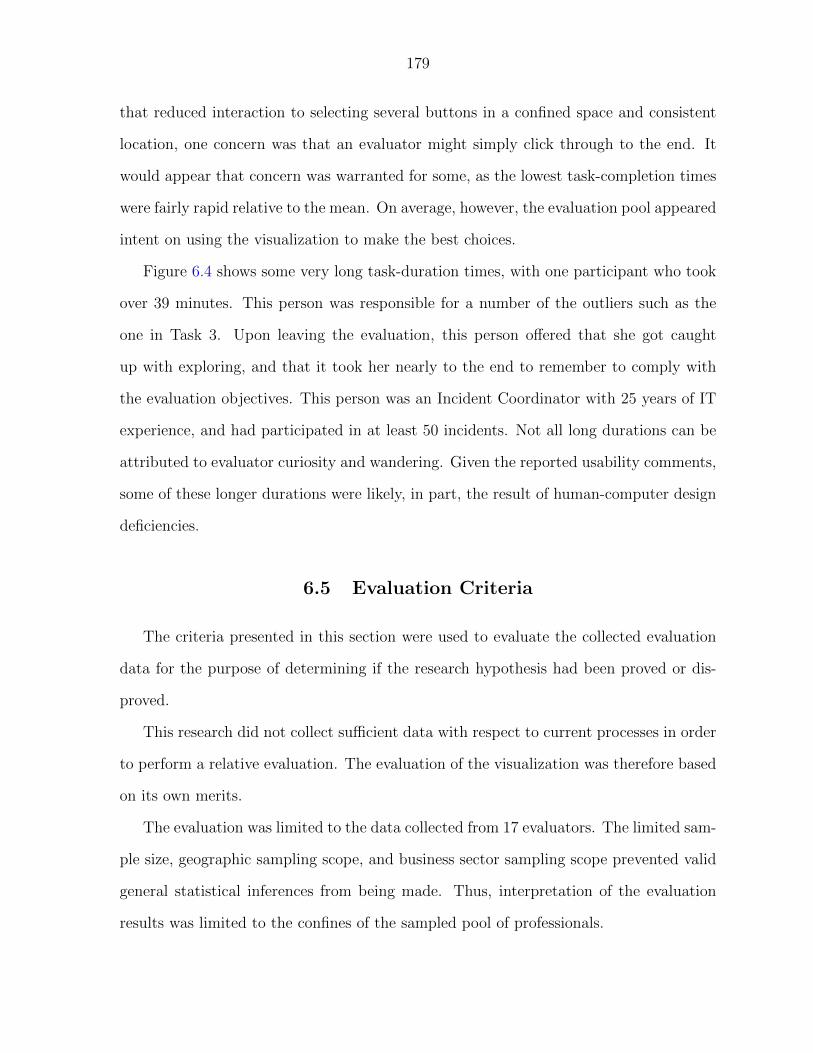
179
that reduced interaction to selecting several buttons in a confined space and consistent
location, one concern was that an evaluator might simply click through to the end. It
would appear that concern was warranted for some, as the lowest task-completion times
were fairly rapid relative to the mean. On average, however, the evaluation pool appeared
intent on using the visualization to make the best choices.
Figure 6.4 shows some very long task-duration times, with one participant who took
over 39 minutes. This person was responsible for a number of the outliers such as the
one in Task 3. Upon leaving the evaluation, this person offered that she got caught
up with exploring, and that it took her nearly to the end to remember to comply with
the evaluation objectives. This person was an Incident Coordinator with 25 years of IT
experience, and had participated in at least 50 incidents. Not all long durations can be
attributed to evaluator curiosity and wandering. Given the reported usability comments,
some of these longer durations were likely, in part, the result of human-computer design
deficiencies.
6.5 Evaluation Criteria
The criteria presented in this section were used to evaluate the collected evaluation
data for the purpose of determining if the research hypothesis had been proved or dis-
proved.
This research did not collect sufficient data with respect to current processes in order
to perform a relative evaluation. The evaluation of the visualization was therefore based
on its own merits.
The evaluation was limited to the data collected from 17 evaluators. The limited sam-
ple size, geographic sampling scope, and business sector sampling scope prevented valid
general statistical inferences from being made. Thus, interpretation of the evaluation
results was limited to the confines of the sampled pool of professionals.

180
The research hypothesis stated in Section 1.4 was not directly tested. Instead, the
evaluation explored dimensions that address this hypothesis. Those tested aspects of the
hypothesis are assembled into composite indicators[82]. Having progressively narrowed
the research scope after this hypothesis was established, the scope of the hypothesis was
effectively limited to the IT incident management problem domain, with the business
leader in this context performing the role of IT Leader.
In order for evaluator input to be incorporated into the hypothesis test process, each
evaluator must first meet a standard to establish their input as credible and relevant.
There are two acceptable types of users or evaluators. The first type is a user who
qualifies as a target user, which is someone with IT Leader experience. The second is
a user who qualifies as a surrogate user, which is someone with sufficient experience in
IT incident handling, as well as in IT generally, to be able to appreciate the needs and
activities of an IT Leader.
More specifically, a valid target user is a person who has stated that they have served
in the role of IT Leader, has been part of the response for at least one IT incident over the
past five years, and has at least five years of professional IT experience. A valid surrogate
user is a person who has stated they have served in any of the following roles: Response
Team Member, IT Incident Coordinator, IT Leader, and Business Leader. Additionally,
a valid surrogate user will have participated in at least three IT incidents over the past
five years, and will have at least five years of professional IT experience.
Another factor to consider is the relevance and reliability of the evaluation framework.
There are a number of biases and shortcomings that can be postulated, but many are
difficult to measure or observe directly due to the limitations of this research effort. One
step related to mitigating sampling biases is to limit the degree of generality of the result-
ing hypothesis validation to those 17 who participated in the evaluation. A best effort
was made to execute the evaluations in a consistent fashion. Beyond the participants,
the elements with the greatest variability were the rooms used for the evaluation, the

181
configuration of furniture and equipment, the introductory presentation, and miscella-
neous interactions between the on-site researcher and the participants. The same person
executed the evaluation events, but the introductory presentation admittedly varied be-
tween evaluation sessions. Although the prototype went through a revision to improve
logging, this change was not apparent to the users. Logging was performed entirely in
the background, and could be accessed only by a knowledgeable person.
The data collection instruments were printed, self-administered surveys. The greatest
reliability risks related to instrument design include the following:
• Based on the target and surrogate user qualifications standards, it was important
that participants understood the definition of the IT incident within the scope of
this research, and that they were able to count relevant IT incidents in which they
participated when responding to question 12. Given the relatively short visual
distance to the definition and short delay caused by responding to question 11, it
is assumed that the evaluator recalled the appropriate definition of an IT incident
and was able to apply this as a filter through their catalog of IT incident-handling
experiences.
• The most relevant post-evaluation questions to the hypothesis are numbers 7 and 8.
Pre-testing showed these questions to be reasonably designed. Question 8 experi-
enced language simplification and a gestalt-related adjustment between pre-testing
and the final version. Question 7 experienced one non-response by one evaluator
among the multiple parts. These response parts require a Boolean response, so the
absence was treated as “no.” Question 8 had one incongruent response in which
“no” was selected, but “Advantages” were specified. For the purpose of analysis,
this response was treated as “no” and the specified advantages were disregarded.
• Questions 3, 4 and 5 contribute to the assessment of relevance experienced by the
evaluator. Questions 3 and 5 tested well during pre-testing, and there were no ap-

182
parent issues among the 17 respondents. Question 4 was changed after pre-testing
in an attempt to narrow the scope of what “similar” meant to the respondent. It
appears that some evaluators focused less on the business sector of the fictional
company and more on the intention of the environment presented to them. This
muddies the interpretive value of the question, but for relevance assessment this
outcome is acceptable.
For the reasons stated, the design and execution of the evaluation process are assumed
to be reliable within the narrow interpretive scope of the collected data.
Relevance can be measured both directly in the post-evaluation questionnaire and in
the level of engagement shown in the activity logs. Given the lack of direct incentive for
participating, and with a median age of 42 years and more than 16 years of IT experience
on average, these professionals could easily have left prior to completion or simply have
clicked through the hands-on activity. Although individuals may have clicked through on
some tasks, on average the overall duration was over 21 minutes, or one minute more than
anticipated. An additional measure of relevance is directly indicated by the responses to
question 3; responses to questions 4 and 5 provide an indirect measure of relevance as
well.
Having vetted sources of the evaluation data and established the evaluation protocol
as reasonable, composite indicators were constructed based on those inputs. The hy-
pothesis was parsed into two test objectives: one was improvement of business leaders’
decision awareness ; the other was improvement of business leaders’ decision comprehen-
sion. Since this was an absolute evaluation (i.e. no comparison with current processes),
improvement could be measured only indirectly through responses to the post-evaluation
survey. A composite indicator was needed for both test objectives.

183
6.5.1 Decision Awareness Evaluation Indicator
An unambiguous composite indicator for the improvement of business leaders’ de-
cision awareness was difficult to construct. There are three dimensions to a leader’s
decision awareness. The first is associated with the initial step toward decision-making
of being mindful of an upcoming decision’s existence. The second is understanding that
the leader is responsible for making the decision. And the third dimension is related to
awareness of previous decisions and their outcomes.
An objective review of the “Post-Evaluation Questionnaire” identified few questions
that inquired into whether an evaluator noticed that decision awareness took place, or
whether they felt it was improved by using the visualization. This could be interpreted
as an error in the survey instrument’s design. Given the explicit decision prompting in
the “Evaluation Task Interface,” however, it is not clear that direct questions regarding
decision awareness could be interpreted accurately. Without addressing the first dimen-
sion of decision awareness, a business leader will not execute a particular decision. Visual
elements were presented that related expressly to the need for specific decisions to be
made in a timely manner. Decision outcomes and responsibility were presented as well.
Evaluators were exposed to the visual elements as part of the evaluation task completion
process.
Although it was logically oblique, the composite indicator consisted of inputs from
four questions. The most relevant post-evaluation question was 7D, but that question
primarily addressed the issue of awareness of past decisions. Because of the visual ele-
ments accessed to perform evaluation tasks, questions 6, 9 and 11 indirectly addressed
initial decision awareness and responsibility.
As none of the questions in the post-evaluation survey requested a direct numerical
value assignment, a convention was instituted in order to compute this indicator. For
questions such as numbers 6 and 9, each with three possible responses, a “no” was
assigned a -1, a “yes” was assigned a 1, and “not certain” was assigned 0. For question

184
7, a “no” was assigned a -1 and “yes” was assigned 1. For question 11, the responses
were assigned the following: “no benefit” = -1, “minimal benefit” = 0, “good deal of
benefit” = 1, “exceptional benefit” = 2.
The indicator was computed simply by treating the responses (rquestion) to the four
questions as a summation of values:
∑r6 +
∑r7D +
∑r9 +
∑r11 (6.1)
According to value-assignment conventions, this indicator could range from −4N to
5N , where N is the evaluator pool size. The 25% value within this range is −7N4
, the
50% value is N2
, and the 75% value is 11N4
. Any resulting value between −4N and −7N4
was interpreted as indicating no improvement of decision awareness. If the value was
between −7N4
and 11N4
, the conclusion was that the evaluation of decision awareness was
inconclusive. If the value was above 11N4
, it is reasonable to infer that decision awareness
could be improved through visualization.
6.5.2 Decision Comprehension Evaluation Indicator
Having been made aware of a decision, the leader needs to understand the decision.
Competency of the leader is a factor in understanding: if the leader does not understand
what the decision entails or how to make that type of decision, the visualization is not
designed to compensate for this lack of preparation. Assuming the leader is able to make
the decision, comprehension in this research hypothesis relates to facilitating sufficient
understanding of the relevant variables to commit to a decision outcome. Variables
include essential facts regarding the incident’s nature, available options, relationships
between environmental elements, current incident consequences, and possible incident
outcomes.
The post-evaluation survey questions 7 and 8 are the most relevant. Question 7’s
contribution is limited to parts A, B and C, which are combined to determine whether

185
question 7 as a whole was a “yes” or a “no.” Any one of the attributes associated with
A, B and C contribute to comprehension. If any of the responses to A, B and C are
“yes,” the contribution of question 7 is “yes.” But, if none of the responses provided by
an evaluator is “yes” to A, B or C, then the contribution of question 7 is “no.” Only
the primary gate question portion of question 8 is incorporated. Similar to the previous
indicator value assignment convention, a “yes” answer is assigned 1 and a “no” answer
is assigned -1, as was assigned to contributions provided by questions 7 and 8. The
indicator was constructed simply:
∑r7 +
∑r8 (6.2)
According to the value assignment, the indicator’s value could range from −2N to
2N . N is the value of the first 25%, 0 is the value of the mid-point, and N is the
value of 75% in the range. A resulting value between −2N and −N was taken to mean
that there was no improvement of decision comprehension. A value between −N and N
indicated that the evaluation of decision comprehension was inconclusive. If the value
was above N , it is reasonable to infer that decision awareness can be improved through
visualization.
6.5.3 Evaluation
The results of computing the “Decision Awareness Evaluation Indicator” may be
seen in Table 6.5. The total was 28. The 75% value was 46.75. The conclusion is that
evaluation was inconclusive regarding the improvement of decision awareness.

186
Table 6.5: Computation of the Decision Awareness Evaluation Indicator
Question Contribution Value
6 4(-1) + 4(1) + 9(0) = 0
7D 17(1) = 17
9 3(-1) + 1(1) + 13(0) = -2
11 0(-1) + 4(0) + 13(1) + 0(2) = 13
The results of computing the “Decision Comprehension Evaluation Indicator” may
be seen in Table 6.6. The total was 26. The 75% value was 17. The conclusion is that,
for those who participated, the evaluation determined that decision comprehension did
improve by using a dynamic visual system.
Table 6.6: Computation of the Decision Comprehension Evaluation Indicator
Question Contribution Value
7 1 No and 16 Yes thus contributing 15
8 3 No and 14 Yes thus contributing 11
In summary, the evaluation proved the decision comprehension aspect of the research
hypothesis, while remaining inconclusive regarding decision awareness in the context of
17 evaluators. Hence, further research is needed both to justify the general applicability
of these results as well as to replace the inconclusive outcome with a more conclusive
determination as to whether decision awareness can be improved through visualization.
6.6 Discussion
This section provides brief reflections on evaluation results as well as a self-critique
of their reliability.

187
6.6.1 Operational Glitches
Three of the 17 evaluators experienced operational issues. One issue, previously dis-
cussed, was that a Silverlight crash took place while the evaluator was either completing
Task 5 or 6, per the participant’s recollection. Further investigation into the incident
could not reliably reproduce the problem, so the cause could not be determined.
Two other issues were operationally related, but more from an operator perspective.
Strangely, the two instances were the same issue occurring in the same evaluation session
by two evaluators on the same side of the room. Since the on-site researcher stayed away
from the participants while they performed their hands-on activity, it is not clear what
actually happened. After performing post-session testing, the only plausible explanation
for the issue was, fundamentally, a usability or operator attentiveness error. As previously
mentioned, Task 3 compensated for the task choice made in the first part of Task 2. Two
of the compensatory states of Task 3 involved a video that provided an example of how
a resource request could be made. The two evaluators failed to see a large (139-pixel
wide x 99-pixel high, or 0.87% of all screen space) light-gray-to-red horizontal gradient-
filled button with a black text label that read “Close Video Player” within the prototype
portion of the user interface. Among the eight buttons within the entire screen space,
this was the largest button visible on the interface in terms of surface area. The next-
largest visible button was 139 pixels wide x 33 pixels high. Next to the “Close” button
was a button aligned on center to the right, 9 pixels away, labelled “Go back 15sec.” To
the right of that button was a button labeled “Pause.”
For whatever reasons, these two participants failed to close the player and proceeded
to complete the tasks, despite not being able to see the relevant prototype screens. This
was mechanically feasible, since actions necessary for task completion took place in the
right-most portion of the Evaluation Task Description region of the screen. The problem
became apparent to the on-site researcher at the end, when one of the two participants
suggested that there may have been a user error or software glitch that caused the video

188
player to be visible at the end of the evaluation. Naturally, their choices for Tasks 4, 5
and 6 were mere guesses. When reviewing Figure 6.3, one can identify these participants’
choice paths by their brevity (12:16 and 12:46 in duration). The second participant left
the session with the video player still visible and made no comment when handing in
the post-evaluation survey. Both participants’ Task 6 choices had to be corrected in
post-analysis to match what was actually feasible according to the state machine. One
participant was female and the other male. Red-green color blindness may have been a
partial explanation for this problem. As one can imagine, their experiences negatively
affected their post-evaluation input. With such a small sampling, it is hard to determine
if these two cases were a result of some odd situational abnormality or this was truly a
symptom of a fairly serious usability issue.
6.6.2 Interesting Survey Responses
6.6.2.1 Question 6
As mentioned previously, among the accumulated responses to question 6, nine eval-
uators could not decide whether a tailored IT Incident Visualization System would help
them with their incident-handling duties. What makes this an odd outcome is the result
of question 7, in which all evaluators indicated some value being added to decision-
making. It would seem reasonable to assume, therefore, that if they perceived decision
support was being improved, they would consider that to be helpful. If the question or-
der had been switched, would there have been a coupling effect that would have changed
the aggregate result to question 6?
This degree of uncertainty raises alignment questions regarding the evaluation. The
undecided participants clearly did not get the experiential information needed to decide.
This indecision is motivation for reviewing and adjusting the evaluation experience so
that respondents can make a decision with regard to this important question.
189
6.6.2.2 Question 9
Reducing the time to incident closure is an important objective. If an IT incident
cannot be prevented, then efficient and effective closure is the next practical objective.
Once again, exposure to the visualization provided by the evaluation environment was
not sufficient to allow evaluators to decide this question. This indecision could be based,
in part, on the enormous diversity of possible IT incidents in practice, whereas experi-
encing only one in a fairly rigid context might not provide sufficient experiential data for
evaluators to extrapolate to a broader context. Despite multiple exposures to the defi-
nition of which IT incidents were relevant to this visualization, it is very possible that
some evaluators truly did not integrate the appropriate definition into their thinking, and
therefore could not see how this visualization might be relevant to the much lower-profile
incidents. The definition was not repeated in the Post-Evaluation Questionnaire.
The usability issues many experienced with the visualization may have contributed
to their doubt. After more training and improvements in usability, future evaluators
may be able to make a definitive decision. Usability is a design and development issue,
and training issues reflect back on the evaluation design. Both of these are practical
short-term objectives for future research.
6.6.2.3 Question 10
Having 10 of 17 evaluators acknowledge the importance of having an objective mea-
sure of IT incident urgency is a welcome outcome, and in a small way validates the field
study. A formal effort is needed to construct a reliable and respected measure of IT
incident urgency.
The uncertainty of six evaluators is noteworthy. More research is needed to address
this uncertainty. This uncertainty may have resulted from the lack of a formal presen-
tation of the measure’s derivation or by not providing an accessible explanation of the
significance of the measure’s values and/or the absence of an explanation of its limitation

190
as a vital IT incident indicator. The evaluation experience’s short duration, as well as its
single IT incident, may also have been factors. Experiencing multiple IT incidents dur-
ing which urgency is consistently computed and referenced may also improve evaluator
appreciation of its significance or lack thereof.
6.6.3 Biases
6.6.3.1 Social Acceptability [88] or Social Desirability Bias [89]
Social acceptability or social desirability bias relates to respondents reporting what
they suppose the questioner wants to hear. It also relates to unwillingness to report
(i.e. underreport) things that may shame or discredit themselves. The article regarding
social desirability bias also points out that respondents will exaggerate their responses
(i.e. overreport) when doing so will present themselves in a positive light[89]. The
first aspect of this bias was of greatest concern with regard to evaluation feedback.
Overreporting and underreporting could have been factors in responses to IT incident
history provided in the pre-evaluation survey. Several mitigation steps were taken to
minimize the impact of this bias. The evaluation protocol was explicitly to collect data
anonymously, so that the respondent should not have felt exposed beyond those moments
filling out the survey and handing it to the on-site researcher. The self-administration
of a paper-based survey should have avoided the embarrassment or stigma that might
occur in an interview-based survey. Beyond that, deliberate efforts were made to avoid
the first aspect of this bias as a result of any perception that the on-site researcher was
directly affiliated with the research. The size of the research team was projected to be
greater than a single individual. Using the Information Assurance Center director’s name
in calls for participation achieved this end, as did the professionalism of the surveys’
design and production, video production quality and use of another voice, pervasive
branding using the Information Assurance Center’s logo, and the quality of the software
developed. Materials that referred to the on-site researcher made it appear that the

191
researcher’s job was to conduct outreach activities. This particular evaluation was, by
implication, simply an assignment undertaken by the on-site researcher. By constructing
the perception that there was a remote group of researchers responsible for the research,
it was easier to suggest that the on-site researcher was not necessarily associated with
efforts leading up to the evaluation.
6.6.3.2 Self-Selection[90] or Voluntary Response Bias
This bias has two significant forms in this research. First, although the call for
participation described the desired qualifications, unqualified people could have attended
by knowingly disregarding or loosely interpreting the qualifications. Because such an
unqualified participant would not be a member of the target population, this could
result in a bias. Some of the fault for this can be placed on the stated qualifications
that were intentionally imprecise so as not to alienate qualified participants with highly
detailed descriptions or overly complex recruitment specifications. Ultimately, with no
viable means to encourage participation while at the same time screening prospective
attendee qualifications, vetting could be done only after participation had concluded.
And while the pre-evaluation survey asked participants to report on their IT incident
background, thus revealing their qualifications, this attempt at mitigation could have
been thwarted by self-reporting bias.
The second form of this bias was inherent to the recruitment mechanism being a
voluntary response: only those with the time, flexibility and interest participated. In
the private evaluation settings, it was believed that an employee of some organizational
stature invited individuals to consider participating voluntarily, and that these invitees
could decline without repercussion. Beyond the supportive nature of encouraging par-
ticipation, it was unclear what cultural or relationship pressure the individuals might
have felt to participate. Assuming that in all cases prospective participants did not feel
unduly compelled, their voluntary presence introduced the risk of biasing the collected

192
data. Those who volunteered may not have been, in the aggregate, representative of the
target population. This bias is a consideration when evaluating the collected results.
6.6.3.3 Self-Reporting Bias
There are two dimensions to this bias. Although not designated as a bias within the
article on self-reported measures within “Encyclopedia of Survey Research Methods”,
the article mentions that self-reported measures assume the respondents are able and
willing to provide accurate answers[91]. The second dimension of this bias overlaps
with the social desirability bias with respect to respondents overreporting when doing so
will reflect well on them[92]. Anonymity may help alleviate this effect, but Donaldson
et al. suggest that a respondent may not be convinced that their response is truly
unattributable. This bias needs to be considered when evaluating the professional history
information provided in the pre-evaluation survey.
6.6.3.4 Non-Random Sampling Bias
Random sampling is an ideal means for collecting feedback, but, realistically, a rough
approximation was the best that could be achieved. There are several reasons for this
shortcoming. Access to independent professionals was restricted, as a comprehensive
listing of IT professionals available for random sampling does not exist. Furthermore,
interest in the topic was essential for a participant to make the time necessary. An
additional practical constraint was a prospective evaluator had to have work flexibility
or permission to participate.
The geographic scope of recruitment was limited due to logistical as well as rela-
tionship constraints. With constant demands on an IT professional’s time, motivation
beyond casual curiosity was needed. This is consistent with Treu’s observation regard-
ing recruiting prospective users[82]. Direct incentives were not provided to avoid the
incentive becoming the primary objective. Additionally, IT professionals are fairly well

193
paid, so no reasonable financial incentive would sufficiently compensate them for their
time. Altruism is a worthy motivation for volunteering, but schedule impediments and
priorities commonly overshadow altruistic impulses during the workday. Therefore, local
encouragement by coworkers and managers was typically required. Commonly, this en-
couragement originated from people with relationships or experience with the researchers,
sponsoring organization or its parent (i.e. Iowa State University). Relationships with
the researchers were a bias of great concern for those who actually evaluated, but were
less troubling when limited to those simply encouraging others to participate.
As physical convenience was a key factor for nearly all who participated, cluster-
sampling bias was necessarily introduced as a consideration. The most populated eval-
uation events took place in a conference room located within walking distance of par-
ticipants’ work areas, a factor that influenced host selection. Hosts who were willing to
facilitate an evaluation among their employees were pursued. Four key factors appeared
to influence their consent: 1) relationships, 2) size of IT organization, 3) location of IT
organization, and 4) availability of a coordinating employee to facilitate preparations.
Large companies with facilities nationwide may have a regional presence, but their IT
organizations can be located in any state.
6.6.4 Influence of Evaluation Tasks
The evaluation tasks strongly influenced the goals evaluators used for the visual-
ization. Their success in achieving these goals was likely reflected in their evaluation
feedback. The conclusions drawn from their feedback are constrained in part by the
evaluation tasks they were asked to perform. In other words, if another set of role-
relevant tasks had been developed, there could have been a different evaluation outcome.
A broader set of role-relevant tasks would need to be developed, as well as implementa-
tion of a carefully designed experiment that assigned tasks in such a way as to minimize
the effects of evaluation tasks on evaluation interpretation.

194
CHAPTER 7. OBSERVATIONS AND DISCUSSION
7.1 Introduction
This chapter is dedicated to observations and discussion to bring closure to the work
done to date. Some of the discussion spans the various facets of this research, providing
an overarching self-assessment and interpretation of what has been accomplished.
The next section, “Research Significance,” puts the contributions of this research into
context. The following section, “Solution Challenges,” discusses concerns regarding the
viability of solutions raised by professionals over the course of the research. “Project
Design,” which follows, discusses challenges in the design of the research effort. Many
lessons were learned over the course of this research, and some of these are discussed in
“Lessons Learned.” Some noteworthy observations are made in “Reflections”. The final
section, “Summation,” brings the discussion of the entire project to this point to a close.
7.2 Research Significance
Business impact visualization is a real and vital sub-category of security visualization.
The presented catalog of needs illustrates the breadth of challenges being faced. With
more focus and time, the catalog could surely be expanded. At the heart of these
challenges is problem visualization. The amount of conceptual scaffolding needed by
leaders is increasing as technologies, solutions and their business significance increase in
nuance and complexity. It does not appear that many leaders either want or can afford
to be “backseat technologists.” For these people technology is merely a means to an end,

195
and business leaders appear to need and desire tools that can simply frame technical
security and compliance issues and concerns in relation to their obligations.
IT incident management is costly and prevention imperfect. The breadth of se-
curity visualization literature shows the intense effort invested in developing tools to
search for and verify the existence of “needles” of malicious activity in the environmen-
tal “haystack.” Nearly all Study Group members would agree that routine operational
IT incidents overwhelm the number of incidents that are verifiably actionable in terms
of integrity and/or confidentiality. Time equals not just money but opportunity costs as
well: business processes affected by an incident are not adding their expected value, and
staffers reassigned to resolve the incident are not doing work that moves the business
forward.
Timely engagement, awareness and comprehension are challenges today. Improve-
ment of a business’s ability to respond effectively and efficiently to even the most complex
IT incidents is needed, and business leaders are an integral part of that response. Their
indecision or inaction, not to mention poor decision-making, can increase business risk
and drive up costs related to response. The IT Incident Visualization System developed
for this research was reasonably successful in improving decision comprehension. How-
ever, more research is needed to confirm that decision awareness can indeed be improved.
It is logical to believe that any improvement in decision awareness can be confirmed, and
that awareness precedes comprehension. So if comprehension can be improved, then it
only follows that business leader awareness can be improved as well.
User-centered design is steadily being adopted within the security visualization re-
search community. The voice of the customer needs to be trusted, but then verified as
well. Although many users are not skilled in the various disciplines within visualization
design or software development, they know their problems and can articulate many of
their needs. In this regard, solution developers are the learners and users are the teach-
ers. As with any form of education, assessment of understanding is needed, with the

196
“final grade” based upon successful adoption and use. Borrowing from constructivist
education theory, it is better to identify and correct a misunderstanding earlier rather
than later in the learning process after significant investment has already been made.
The iterative methodology undertaken in this research sought to enrich and verify
understanding of users and their needs in steps taken progressively toward a completed
prototype. Admittedly, the approach taken may have been relatively unorthodox in
allowing the Study Group effectively to choose the problem space and directly influ-
ence and prioritize requirements. Another unique element of this methodology was its
reliance upon a stable set of professionals (i.e. Study Group). Although the group’s
membership was fairly diverse with regard to employer’s business sector, job position,
professional background and company size, consensus on the problem space reflected the
common challenges organizations have with IT incident management. Understanding
the limitations of utilizing a stable group of user-consultants, this methodology set out
the challenge of independent evaluation from the outset.
Requirements review and prioritization by the user was essential. There is consider-
able interpretation and blending of requirements during development. The user would
be hard-pressed to isolate a requirement on which to provide feedback when assessing an
implementation. The designer might be equally challenged to match collected feedback
to a specific requirement. Given how humans learn and perceive, N group members’
and M researchers’ readings of a requirement are likely to result in N + M unique un-
derstandings. Shared context, concise writing and discussion will, ideally, corral and
align these understandings around the intended understanding with minimal dispersion.
Statistically, the Study Group was probably too small in general, but more specifically,
breakout by role arguably diluted the limited statistical reliability the group could pro-
vide. If, however, the group members were not instructed to apply a specific leader role,
it is reasonable to assume they would still draw from their personal experience in the
workplace, thus implicitly applying a role-oriented lens. Future efforts might determine if

197
those who work for other business sectors in different regions agree with the prioritization
performed.
The evaluation framework consisted of many parts. The overall evaluation event
design was consistent with other evaluation protocols within the security visualization
research area. The underlying “Choose Your Own Adventure”-styled evaluation encour-
aged engagement while limiting development complexity. A single path through the
evaluation would have been much simpler to develop, but that would have been essen-
tially a self-controlled demonstration, and therefore not as appealing to the evaluators
for engaging and considering the various concepts’ potential. The software interfaces
developed for the evaluation facilitated multiple independent evaluations in one session,
a circumstance that is not conducive for evaluations seeking a detailed understanding of
either usability challenges or the participants’ thinking. Conducting multiple indepen-
dent evaluations, however, is a complementary form of testing that allows for statistical
analysis and is efficient with respect to researcher effort.
Survey and human-computer interface testing have much in common. Dillman and
Redline discuss the value of field experiments and cognitive interviews for testing self-
administered, paper-based surveys[37], observing that field experiments allow one to
determine whether a design feature’s influence on response rates or data quality is sta-
tistically significant. The downside of field experiments, they note, is that they do not
provide an explanation for this change. They suggest that cognitive interviews in the
form of “think-aloud” protocols or retrospective methods are a means to explain the dif-
ference. Much of the evaluation performed by security visualization researchers has been
aligned to cognitive interviewing as opposed to field experiments. Field experiments are
needed to acquire a more generalizable understanding of the usefulness of visualization
techniques. The evaluation framework developed for this research contributes to the
body of possible approaches for conducting repeatable and reliable field experiments.
The “master-slave” relationship implemented between the prototype and evaluation in-
198
terface, as well as the forced-choice response formats, were artifacts of the desired level of
prototype fidelity. These constraints can be lifted if a high-fidelity prototype is available.
Information security has very few absolutes in practice. Risk avoidance is impractical
for most organizations, which typically are designed to assume risk. Risk profiles conform
to dimensions that include an organization’s business sector, goals, values, personnel, lo-
cations, reputation, practices and an immense number of technological variables. Having
developed a fictional entity for the evaluation allowed for merely a shadow of these di-
mensions to provide relief or context to the decisions evaluators were asked to make.
Going forward, coherent organizational constructs are needed for testing the effective-
ness of security visualization solutions, as the technology attributes of a security decision
are only one dimension of business-sensitive decision-making.
7.3 Solution Challenges
Over the course of the field study, the Study Group raised a number of likely impedi-
ments that will need to be addressed for the IT Incident Visualization System to succeed
in practice. Those mentioned were the most significant issues raised or inspired by the
group’s observations.
7.3.1 Security
A reliable solution for assisting with complex and possibly large IT incidents needs
to be resilient. In the context of a malicious IT incident, such a tool could provide an
attacker or intruder a means for injecting false information, as well as the ability to
obtain a considerable amount of useful time-sensitive intelligence. These considerations
should be incorporated as solutions transition from concepts to functional products.
“Need to know” is a security principle that must be embraced in the visualization’s
design. But, “need to know” is not time- or situation-invariant. Sensitive environmental

199
design or operational information that, during normal operations, is intentionally or
inadvertently compartmentalized may need to be shared in order to establish sufficient
context for critical time-sensitive decisions. Implemented controls on information access
should allow authorized users to temporarily relax “need to know” on an IT incident-
sensitive basis.
7.3.2 Integration
There are a number of challenges to implementing a solution today. An effective IT
visualization will, logically, encapsulate a variety of monitoring, resource management
and workflow systems. This will require extensive services-integration design and imple-
mentation. In addition to integrating these systems, new analytic capabilities are needed
to compute IT incident urgency; calculate direct-cost risk; estimate response risk; model
imminent operational/security/compliance impact; assess uncertainty; perform incident-
extent tracking; and assist with computing short-term security, compliance and brand
risk. Currently, comprehensive portfolio management that tracks and maps business
processes to relevant supporting elements (e.g. systems, personnel, data sets) is nearly
non-existent. It is therefore safe to assume that an IT Incident Visualization System will
not be practical for a while.
7.3.3 Personnel Overload
Operational awareness has its costs, one being the burden placed on those executing
response tasks to keep visualization users apprised of their progress and relevant out-
comes. Mobile interfaces are essential for these people. Where possible, their reporting
burden should be lightened through interface usability and transparency. The goal of
transparency would be to achieve information-gathering objectives without requiring the
responder to remove focus from the tasks at hand. This likely will be manifested in
eavesdropping, interactivity capture, and other techniques that will need to be aligned

200
with privacy and professional jeopardy concerns.
7.4 Project Design
The particular means by which this research was conducted introduced idiosyncrasies
that have likely influenced the outcomes. This section explores some of those peculiari-
ties.
7.4.1 Repeated Involvement
As mentioned in the literature review within Chapter 2, in many cases user-centered
design has not involved the same users consistently throughout the design cycle. While
user availability and burden are reasonable considerations, another may be the need to
seek fresh ideas or perspectives. One challenge the researchers cited in the review do
not discuss is the penalty arising from a lack of continuity. Involving the same users
allows the designer and user representatives to establish rapport, build common ground
on ideas, confirm understanding of past conversations, and build an evolving common
understanding of the design objectives. But unless a research sponsor makes many user
representatives available, accessing additional members of the user community can be
difficult. How much more general of an understanding can be achieved by seeking out
another nine or ten people? This question is more meaningful if the additional people
come from the same organization or organizations with similar operating models (e.g.
federal agencies and their contractors).
“Trust but verify” was an essential user-centered design philosophy adopted by this
research. Having repeatedly engaged the same user representatives to reach a milestone,
it was important to seek out independent assessment. Not only is this good research
methodology, it is also potentially a means to recruit others for future work.

201
7.4.2 Bias
Chapter 6 identifies a number of sources of bias that should be considered when
interpreting results. One bias not listed, but clearly relevant, is researcher bias. With
only one researcher performing data collection, design, analysis and interpretation, the
researcher has great influence on the outcome. But while self-assessing researcher bias
in this situation is not likely to be successful, it is nonetheless reasonable to believe that
it is possible.
There is, however, some advantage in having a single researcher perform the field
study interviews and independent evaluation. First, it is challenging to account for the
variance introduced by inconsistency among interviewers or evaluation facilitators. Mul-
tiple researchers present at user-centered activities certainly might improve data quality.
But to achieve a similar variance-avoidance benefit, the same team would need to execute
all instances of the same user-centered activity, performing their duties consistently.
External sources of bias are assumed to have had minimal effect on the validity of
the narrowly scoped claims of this research that 1) a population of 17 independent pro-
fessionals acknowledged improvement of decision comprehension, and 2) this same group
of 17 was undecided regarding improvements in decision awareness. The most significant
sources of bias would have been a lack of independence and objectivity. While great effort
was made to ensure independence of the evaluators from the researcher, the influence of
the Information Assurance Center and its director on any of the evaluators’ judgement
cannot be known. In spite of this, this effect is unlikely to have been significant. Ulti-
mately, additional hypothesis testing by other researchers will, in time, either refute or
support these claims.
202
7.5 Lessons Learned
Beyond the minimal experience obtained previously in a course project setting, this is
the first user-centered design effort of this magnitude undertaken by the researcher. The
industrial experiences of the researcher were helpful, but ultimately much was learned
from this initial foray into such an intensively human design effort. Some of the more
significant lessons learned are shared in this section.
7.5.1 Further Task Analysis and Usability Testing
The objectives for “Stage T. Review Visualization Prototype” (Section 3.2.18) were
a bit misguided. This stage was designed to emulate the independent evaluation by
being a “true” test run, in that group members would be dropped into a situation for
which they had little previous familiarity with the prototype or tasks to be performed.
Their lack of independence from the research made their responses to yet-to-be-finalized
survey instruments moot in terms of the final analysis, thus making evaluation emulation
less compelling and, more importantly, losing an opportunity to address usability and
perform task analysis. Executing Stage T did result in improvements in time for Stage
V, but potentially significant usability issues could not be addressed in the intervening
period.
Stage T should have been broken down into additional stages. A test run of the
independent evaluation process was absolutely essential. Nevertheless, a number of fun-
damental assumptions regarding task performance were made over the year of prototype
development. Stage H (Section 3.2.7) uncovered a great deal about the IT incident
management problem space. The tactical activities developed to be evaluation tasks,
however, were not explored from an execution perspective: the project started by look-
ing at the forest (business impact visualization), selected and examined a pine tree (IT
incident management), but failed to inspect a number of pine cones (evaluation tasks).

203
A revision of the methodology would include two additional user-centered activities
and a repurposed Stage T. After selecting the evaluation tasks and undertaking some
initial implementation, an “Evaluation Task Analysis” stage would be added in order
to walk through how Study Group members might perform the assigned tasks, with the
results informing additional development. Having nearly completed prototype develop-
ment, the researcher would then return for usability testing with regard to the evaluation
tasks. Further development refinements could result from this second additional stage.
Instead of attempting to combine usability feedback collection with an evaluation event
test run, Stage T would be strictly an evaluation event dry run and survey instrument
pre-test.
Without additional resources, these changes to the methodology would likely have
added an additional six to nine months. The possible benefit of this approach would
be to overcome initial usability pitfalls the independent evaluators might encounter.
Poor usability may have been the one obstacle that kept many from providing definitive
answers to key post-evaluation survey questions.
7.5.2 Study Group Composition
When building the group, a diverse collection of experienced professionals was sought.
But no matter what level of diversity could be achieved, there was always more diver-
sity possible. Although organizations have much in common in terms of security and
compliance objectives, their differing cultures, budgets and risk management objectives
strongly influence actual practice. Management of high-value IT incidents has yet to
be “normalized” by introducing widely recognized and adopted tooling. As flexible as
enterprise software such as BMC Remedy or SAP business management may be, they
introduce constraints that limit business process variance among those implementing
them. The semi-manual process of IT incident handling is diverse in execution between
organizations and among incidents as well. An attempt to identify all of the variations in

204
approach would have been incredibly labor-intensive, and likely would have overwhelmed
any effort to provide visualization support.
The number and variety of people available for recruitment into the Study Group
is a function of outreach. Enlisting volunteers requires that they be made aware of
the opportunity, in addition to being available and having the appropriate background.
With a research team of effectively just one person, there was a practical limit as to
how many group members could be effectively utilized. This was not simply a matter of
coordinating and conducting sessions with each member, but also of post-processing and
analysis. Seven was a reasonably manageable number. The diversity among them was
good but could have been better, and an additional leader with a business management
perspective would have been especially helpful. Although somewhat of a contradiction
exists in recruiting a business manager for a long-running investigation into technology,
as a person who has chosen a business career might not be sufficiently interested in
technology research to devote 15 hours over multiple years.
Research involving volunteers is stochastic by nature, and another sampling of volun-
teers might have yielded different insights. Many of the core findings from this research
should hold after further investigation, but greater nuance related to roles and task per-
formance is likely to be introduced. For example, the IT Leader has effectively been
defined as fulfilling a “bridge” function between Business Leaders and the technical re-
sponders, such as the Incident Coordinator and Response Team Members. As such, in
some organizations this role is effectively a substitute for the Incident or Event Coordi-
nator, while in others response coordination is not a duty of the IT Leader. Furthermore,
in some organizations the person assigned the role of Incident Coordinator may not at
the same time perform task assignment. This may be a matter of role-definition mis-
alignment, because whoever is performing task assignment is effectively coordinating the
response to the incident.
If an IT Incident Visualization System were to be implemented with the current

205
understanding of the various roles, the result would be a “normalization” among those
not using the same role names or definitions. The organization would need either to
adapt its current conventions to the tool or try to realign the built-in roles to their
culture. Ultimately, a little of both would likely occur. Ideally, the result would improve
the organization’s handling processes as well as align them to some objective measure of
best practices.
7.6 Reflections
Having invested three years into this effort, as well as considering the significance
of evaluation results, a number of observations can be made. The observations in this
section are some of the more intriguing insights.
7.6.1 Study Group Member Personality
Besides professional experience, age, employer and interests, personality is another
important aspect to consider for those providing guidance over a broad span of the de-
velopment cycle. “Personality” in this case should be considered in terms of thinking
styles. There are those quite comfortable with abstract thinking, on the one hand, and
those who speak to more tangible interests, values and concerns on the other. There are
those who can identify and articulate generalized challenges and make relevant sugges-
tions, and those who must see a logical sequence leading to a concept before considering
that concept. Yet while there may be many who are willing to take a leap of faith and
consider the concept on its own merits, their faith is not the same as blind trust. If
the concept has merit, these people will need the logical sequence articulated prior to
acceptance. In any event, each participant engages in his or her own way, thus making
consistency of execution challenging.

206
Building a long-term study group is an investment. Objective criteria such as age,
experiences, availability and current job are likely filters used for group member selection.
Given that participation is voluntary, a person’s thinking style is initially a secondary
criterion. Ultimately, the assembled group populates a portfolio of thinking styles. Un-
less you attempt to a build a group having a “monoculture” in thinking style, one can
expect a diversity of thoughtful responses to the same questions, not simply in fact (e.g.
the average duration of an incident) but regarding the nature of the thought itself. This
challenge is difficult to articulate. Still, a crude analogy might be that, if multiple peo-
ple were asked the same open-ended question, one could elicit a philosophical response,
a strictly factual response much like ideal witness testimony, a response with imagery
and analogy or, possibly, an anecdotal response. There is value in all such responses,
but it is a challenge to normalize on such a basis. Indirectly, these assembled responses
might imply confirmation with another source, but that could simply be interpretive
bias. Forcing normalized approaches to responses would make coding easier for a formal
qualitative study, but approaches to thinking are highly individualistic. Seeking nor-
malized response approaches may make some uneasy and may also jeopardize creative
and abstract thinking. Furthermore, tacit knowledge needs to be drawn out, which re-
quires triggering memory that may be accessible only by allowing other thoughts to be
retrieved first. When using a stable group for user-centered research, one should consider
the assembled portfolio of thinking styles.
7.6.2 IT Incident Impact & Improvement
It appears that practitioners do not really know what impact IT incidents might have
on their businesses. Of a pool of practitioners who have participated in a median of 20 IT
incident responses over the past five years, only seven could estimate annual cumulative
staff hours, and only eight could estimate the annual costs over a year. The respondents
were asked to approximate, but many could not. Dillman et al. would likely recommend

207
that those questions be placed on an establishment survey in order to give respondents the
time to research the answers[38]. Over 40% said they were not rewarded for improving
IT incident management, and nearly 18% did not know. IT incidents drain business
resources, and reducing this drain is difficult when those intimately familiar with them
are neither aware of their significance nor encouraged to make related improvements.
7.6.3 Evaluator Comment
At one evaluation session, an Incident Coordinator mentioned that, when IT incidents
of the severity she perceived the visualization addressed occurred in her firm’s extensive
computing services environment, the company spared no expense in responding to them.
“All hands on deck” was the operative philosophy, and the best “hands” were brought in
to remedy the problem. This “all-in” approach to IT incident response must inevitably
impact the business beyond the measurable costs associated strictly with the IT incident,
as the best people are doing high-value work when not responding. Thus the opportunity
costs of the “all-in” approach may be significant for serious IT incidents.
What motivates this approach? Is it that command and control is currently so cum-
bersome that only the “best” can manage in the vacuum of uncertainty? Another possible
explanation might be that the technical complexity would overwhelm less-qualified per-
sons. Could an established visualization system for IT incident management reduce the
number of tasks the “best” are assigned to? Could an effective visualization system allow
an organization to deploy the right-sized response team and accurately match compe-
tencies to the task at hand? It is much too soon to know the answers to these questions.
Is it not a management principle that if something can be measured, it is more likely to
be manageable?

208
7.7 Summation
Over the years of intense investigation of visualization support for business leaders,
much has been learned regarding their visualization needs, IT incident management,
user-centered design and evaluation. Only a sampling of the results of the field study
could be shared. The long-term active engagement (i.e. 80 sessions and roughly 115
hours of discussion) of a stable group of IT professionals from various organizations in
both leadership and senior technical positions shows that security visualization in support
of business leaders is needed and a promising line of inquiry. The ability to recruit 17
independent professionals to volunteer their time over a 50-day period in November and
December is an affirmation that IT incident management is a significant problem, and
that there is interest in seeing leadership supported during IT incident handling.
The findings of this research will show their significance and achieve greater clarity
over time. But for now, the project demonstrates that there is benefit in security visu-
alization research that seeks to address the significant challenges business leaders have
with IT incidents that interfere with or pose imminent risk to more than one workgroup.
This research has shown that decision comprehension related to security and compliance
events was improved through visualization among the professionals sampled. Although
the matter of improving decision awareness was left open, further research is likely to
show that this can be improved as well.

209
CHAPTER 8. FUTURE WORK
8.1 Introduction
This project has opened a number of new avenues for security visualization research.
This chapter discusses some of these possible opportunities for future investigation.
These opportunities are organized primarily around the three contributions, but the
first category is centered on business impact visualization. The next section focuses on
further research in IT Incident Visualization System design. The following section dis-
cusses potential work related to the Iterative Field Study Methodology, and the last area
of future work addresses the Practitioner-Oriented Evaluation Framework. The chapter
concludes with a final discussion section.
8.2 Business Impact Visualization
Supporting leaders in understanding the impact of security and compliance events,
as well as the effects related decisions may have on an organization, is an open field. The
catalog of problem areas identified in this document is not complete. Beyond expanding
this catalog, additional inquiries with business leaders would shed light on what the next
topics of investigation should be.

210
8.3 IT Incident Visualization System
IT incident management is a problem space teeming with challenges related to both
visualization and analysis. Additional research is needed to investigate ways to lever-
age pre-attentive processing to improve efficiency in establishing leader awareness of the
incident and ongoing response. Investigation is needed to uncover and validate poten-
tial visual metaphors to ensure there is improvement in sensemaking among the various
types of leaders. The current design of the IT Incident Visualization System proto-
type segregates many information dimensions of interest, and integrating these into a
unified presentation may improve awareness and understanding in terms of quality and
timeliness.
A related inquiry would involve investigating the relationship between cognitive needs
and information presentation techniques. Although pre-attentive processing may im-
prove, the graphical techniques needed to enable any such improvement may not be
appropriate for a significant portion of the tasks leaders typically perform.
A number of visual metaphors were introduced in the prototype. Minor modifica-
tions were made to the activity diagram and Gantt chart. For these metaphors to be
truly helpful, algorithms are needed to automate rendering and facilitate graphical in-
teractivity useful for “what-if” analysis. IT incident extent is a target-rich problem area
in finding effective ways to convey complex interrelationships among members within a
given business environment layer, as well as between these layers.
There are a number of analytical challenges related to computing reliable IT incident
measures such as IT incident urgency, direct cost, direct-cost risk, future impact on
resources and response risk.
Uncertainty is a complex problem. Many decisions business leaders make are based
on information that is either incomplete or has varying degrees of accuracy. Business
leaders need to factor uncertainty into their decision-making, but an objective rather

211
than subjective approximation would be preferred. Algorithms able to provide reliable
measures of uncertainty would provide additional reliable context to leaders as they
perform decision-making. Computing both uncertainty and the effective presentation of
this information quality attribute is a major challenge.
Usability research is needed to reduce impediments to wayfinding and sensemaking.
This topic is a necessary consideration for most of the visualization challenges previously
mentioned. In addition, the aggregate system needs to be considered. A useful system
needs to address a very large portion of the tasks leaders perform with regard to IT in-
cidents, which frequently exhibit unique characteristics relative to previous IT incidents.
An IT Incident Visualization System may therefore need to become an adaptive toolset,
allowing leaders to specify visualization needs as they arise.
Multi-platform support is another challenge. Beyond adapting visualization interfaces
to the platforms’ interaction paradigms, use cases for these platforms will also need to be
investigated. Minimal common awareness and related tools will need to be considered.
A group-wide mental model is an important objective for a multi-platform visualization.
Whether a responder buried in a server rack yanking hard drives, a middle manager in a
meeting, or the Incident Coordinator at her desk, all involved need an accurate common
understanding of the incident and its corresponding response.
Future research should look past IT Leaders, Business Leaders and Incident Coordi-
nators to support the Response Team Members and Stakeholders as well. Also, much
work is needed to build role-oriented visualization support for the Incident Coordinator
and Business Leader.
The requirements list cites a number of post-incident analysis requirements worthy
of investigation. A functional visualization system would become a large knowledge base
that could be mined in order to contribute to the process-improvement activities orga-
nizations perform.

212
Additional testing is needed to broaden and clarify the claims made in this research.
Additionally, there is much to do in the area of user testing. Goodall suggests the
following types of tests would be beneficial ([25],pg. 57):
• Controlled experiments comparing design elements
• Usability evaluation of a tool
• Controlled experiments comparing two or more tools
• Case studies of tools in realistic settings
8.4 Iterative Field Study Methodology
The methodology utilized was a single pass that sought validation of a conceptual
goal. Going forward, some aspects of this methodology will need to be adapted for
continued work toward improving the IT Incident Visualization System. Cycles will
need to be added, allowing the researcher to iterate and produce intermediate outcomes
suitable for independent evaluation. Once a problem space has been selected, researchers
can bypass the initial stages. Further broad exploration of IT incident management would
likely augment previous investigations rather than replacing completely what had been
learned previously. The process of integrating old and new IT incident management task
analysis will need to be carefully considered.
8.5 Practitioner-Oriented Evaluation Framework
Initially, the work on the framework was a means to an end. Given the limited
availability of structured field experiment platforms for security visualization, further
efforts to extend and generalize applicable use cases may be worthwhile. Investigations
are needed to determine which of the various elements could be generalized for use in
other evaluation or user-testing contexts. Consistent user-testing mechanisms and data
sets help facilitate comparison across user-testing studies. Much of the reviewed literature

213
did not suggest that the tasks were progressive in nature, meaning that the current task
was in some manner dependent upon a task previously performed in the evaluation. This
may be due to the level of granularity at which the tasks were expressed, a detail simply
left out by the author while writing, or simply a result of the tool’s scope. There is
benefit in user testing to emulate the progressive nature in which much of the actual
work is executed.
8.6 Discussion
There is enough work to occupy multiple researchers for the lengths of their careers.
Future work can be divided into strategic and design objectives.
This work is an initial investigation into the potential of a dynamic visual system as
described in Section 1.4. There are a number of unverified claims within the hypothesis.
The next strategic research objectives might be to do the following:
1. Conduct experiments that investigate the claims that communications, coordina-
tion and monitoring can be greatly enhanced by visualization.
2. Conduct experiments that measure and compare timeliness of awareness and com-
prehension relative to standard processes.
3. Conduct experiments that test the correlation of leader effectiveness with awareness
and comprehension.
If a few design objectives were to be chosen for next steps, they might include:
1. Recalibrate IT Incident Visualization System requirements and priorities with a
new Study Group, using the current effort as a baseline. Assuming no radical de-
partures from the current understanding of needs and priorities, the next objectives
would likely follow.

214
2. Develop interactive visualization of response planning, as well as resource timing
and dependencies metaphors. Interaction should be centered on direct manipu-
lation of response task objects and related sequencing for the purposes of plan
construction and “what-if” plan analysis. The interaction objectives for resource
timing and dependencies interaction would be similar.
3. Improve tracking of the extent of an incident’s impact on each business environment
layer and improve presentation of the interrelations between layers. Beyond show-
ing past progression, providing forecasted impact expansion would be very helpful.
Moreover, allow the projected extent modeling to facilitate extent-consequence as-
sessment resulting from “what-if” response-planning activities. Forecasting direct-
cost risk, project risk and the resulting urgency during these “what-if” planning
exercises would complement these achievements.
4. Develop and validate algorithms or models that compute the various IT incident
measures.
5. Develop a multi-platform visualization in support of a group mental model of IT
incidents. Beyond the challenges of conducting an evaluation on multiple platforms,
related evaluations would require support for multiple simultaneous evaluators,
with each evaluator potentially acting in various IT incident-handling roles.
Underlying these IT Incident Visualization System design objectives are ongoing im-
provements to the design methodology and evaluation framework. These efforts will need
to be refined and reused in order to achieve and validate the initial next steps.
For these reasons and others, future efforts in leader-oriented security visualization
promise to be both challenging and rewarding.

215
APPENDIX A. INDUSTRY PUBLIC EVALUATION
SURVEY INSTRUMENTS
This appendix contains the survey instruments used at the Industry Public Events.
The surveys were designed to be printed on both sides using U.S. legal-sized paper in
landscape orientation and then folded in the center.

216
Fron
t3
of 3
IT In
cide
nt V
isual
izatio
n Sy
stem
Eva
luat
ion
Pre-
Eval
uatio
n Q
uest
ionn
aire
Spon
sore
d By
:
Inst
ruct
ions
:
This
ques
tionn
aire
and
the
asso
ciat
ed P
ost-
Eval
uatio
n Q
uest
ionn
aire
are
vita
l co
mpo
nent
s to
the
asse
ssm
ent o
f the
IT In
cide
nt V
isual
izatio
n Sy
stem
rese
arch
, and
th
e pr
otot
ype
you
will
be
inte
ract
ing
with
shor
tly.
This
ques
tionn
aire
is d
esig
ned
to c
olle
ct d
emog
raph
ic in
form
atio
n ab
out y
ou a
nd y
our
orga
niza
tion.
The
Eva
luat
or ID
bei
ng re
ques
ted
in th
e to
p rig
ht h
and
corn
er a
llow
s thi
s qu
estio
nnai
re to
be
mat
ched
with
the
Post
-Eva
luat
ion
Que
stio
nnai
re y
ou w
ill b
e fil
ling
out i
n a
little
whi
le.
The
Eval
uato
r ID
will
not
be
asso
ciat
ed w
ith y
ou o
r you
r em
ploy
er.
This
ques
tionn
aire
has
bee
n de
signe
d to
be
stric
tly a
no
nym
ou
s.
Plea
se re
spon
d to
the
ques
tionn
aire
item
s to
the
best
of y
our k
now
ledg
e an
d un
ders
tand
ing.
All
resp
onse
s are
vo
lun
tary
. Pl
ease
feel
free
to sk
ip a
n ite
m to
whi
ch
you
pref
er n
ot to
resp
ond.
Plea
se re
turn
this
ques
tionn
aire
to a
n ev
alua
tion
staf
f-mem
ber p
rior t
o ev
alua
ting
the
prot
otyp
e.
Than
k yo
u,Do
ug Ja
cobs
on, P
hD, D
irect
or
Info
rmat
ion
Assu
ranc
e Ce
nter
Iow
a St
ate
Uni
vers
ity
Eval
uato
r ID:
____
____
____
__Se
ctio
n 4:
IT In
cide
nt M
anag
emen
t Bio
grap
hy (C
ontin
ued)
16. A
bout
how
man
y cu
mul
ativ
e st
aff-
ho
urs
did
you
r cur
rent
wor
kpla
ce sp
end
on IT
in
cide
nts i
n th
e la
st tw
elv
e m
on
ths?
Don’t K
now
17. W
hat i
s you
r rou
gh e
stim
ate
of th
e co
sts r
esul
ting
from
IT in
cide
nts i
n yo
ur
cur
rent
wor
kpla
ce o
ver t
he la
st tw
elv
e m
on
ths?
Don’t K
now
18. F
or y
our c
urre
nt w
orkp
lace
, abo
ut h
ow m
any
pe
op
le d
ire
ctly
par
tici
pat
e o
n a
singl
e
IT
inci
dent
cas
e? P
leas
e pr
ovid
e yo
ur re
spon
se a
s a ra
nge
cons
ider
ing
the
dive
rsity
o
f IT
inci
dent
s tha
t hav
e oc
curr
ed.
Don’t K
now
19. A
bout
wha
t per
cent
age
of IT
inci
dent
s hav
e ca
used
ope
ratio
nal s
ervi
ces o
utag
es?
%
Don’t K
now
20. A
re e
mpl
oyee
s / m
anag
ers r
ewar
ded
for m
akin
g im
prov
emen
ts to
inci
dent
m
anag
emen
t?
Yes
Don’t K
now
No
http
://w
ww
.iac.
iast
ate.
edu/
Min
:M
ax:
$
Hour
s
15. W
hat is t
he deg
ree of you
r current position
’s re
spon
sibilitie
s reg
arding
IT
inci
dent
han
dlin
g?N
one
As th
e sit
uatio
n di
ctat
esDe
dica
ted
IT in
cide
nt re
spon
der
Fig
ure
A.1
:P
re-E
valu
atio
nQ
ues
tion
nai
re-
Fro
nt
and
Bac
kC
over

217
1 of
32
of 3
Sect
ion
1: P
erso
nal
Sect
ion
2: P
rofe
ssio
nal
1. W
hat i
s you
r gen
der?
Fem
ale
Mal
e
2. W
hat i
s you
r age
?
5. H
ow lo
ng h
ave
you
wor
ked
for y
our e
mpl
oyer
?
6.
a. H
ow m
any
peop
le d
irect
ly re
port
to y
ou?
7. How
wou
ld you
describe yo
ur organ
izatio
nal u
nit’s
respon
sibilitie
s for In
form
ation
T
echn
olog
y (IT
) ser
vice
s?Di
rect
Indi
rect
Non
eyear
s
4. W
hat i
s the
ZIP
Cod
e fo
r you
r wor
kpla
ce?
peop
le
Sect
ion
3: O
rgan
izatio
n
8. A
bout
how
man
y pe
rson
nel w
ork
at y
our w
orkp
lace
?
9. A
bout
how
man
y pe
rson
nel w
ork
for y
our f
irm o
vera
ll?
10. W
hat term best d
escribes you
r firm
’s prim
ary bu
siness/
miss
ion?
Sect
ion
4: IT
Inci
dent
Man
agem
ent B
iogr
aphy
For t
he p
urpo
ses o
f thi
s res
earc
h an
d th
e re
mai
nder
of t
his q
uest
ionn
aire
, an
IT in
cide
nt is
an
even
t tha
t affe
cts t
he in
tegr
ity, c
onfid
entia
lity
and/
or a
vaila
bilit
y of
info
rmat
ion
and
info
rmat
ion
syst
ems.
The
se e
vent
s hav
e su
ffici
ent i
mpa
ct o
r risk
th
at it
mer
its c
olla
bora
tion
of le
ader
ship
per
sonn
el b
eyon
d th
e w
orkg
roup
.
11. A
bout
how
man
y IT
inci
dent
s affe
cted
you
r ab
ility
to
fu
nct
ion
in y
our w
orkp
lace
in
the
last
5 y
ears
?
peop
le
peop
le
inci
dent
s12
. Abo
ut h
ow m
any
IT in
cide
nts i
n yo
ur w
orkp
lace
hav
e oc
curr
ed w
here
you
hav
e
b
een
a p
art
of
the
re
spo
nse
in th
e la
st 5
yea
rs?
inci
dent
s
13. I
f you
hav
e be
en d
irect
ly in
volv
ed, i
n w
hat r
oles
did
you
par
ticip
ate?
A. R
espo
nse
Team
Mem
ber (
subj
ect m
atte
r exp
ert)
B. IT
Inci
dent
Coo
rdin
ator
/ M
anag
erC.
IT L
eade
rD.
Bus
ines
s Lea
der
Yes
No
Yes
No
Yes
No
Yes
No
b. How
man
y pe
ople’s w
ork activ
ities do yo
u indirectly in
fluen
ce?
peop
le
14. A
bout
how
man
y IT
inci
dent
s doe
s you
r cur
rent
wo
rkp
lace
exp
erie
nce
on a
vera
ge
annu
ally
?
inci
dent
s
3. O
ver y
our c
aree
r, w
hat i
s the
tota
l tim
e yo
u he
ld a
pro
fess
iona
l pos
ition
that
use
d
inf
orm
atio
n te
chno
logy
in so
me
man
ner? Fig
ure
A.2
:P
re-E
valu
atio
nQ
ues
tion
nai
re-
Insi
de
Pag
es
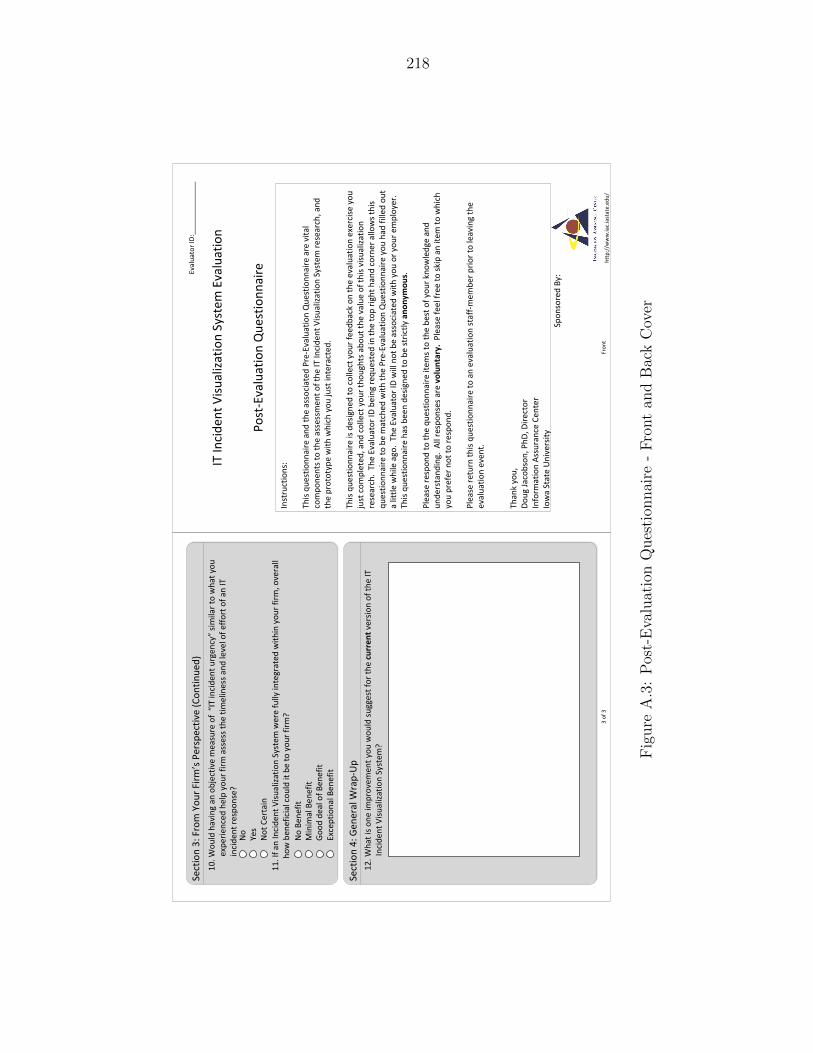
218
Fron
t3
of 3
IT In
cide
nt V
isual
izatio
n Sy
stem
Eva
luat
ion
Post
-Eva
luat
ion
Que
stio
nnai
re
Spon
sore
d By
:
Inst
ruct
ions
:
This
ques
tionn
aire
and
the
asso
ciat
ed P
re-E
valu
atio
n Q
uest
ionn
aire
are
vita
l co
mpo
nent
s to
the
asse
ssm
ent o
f the
IT In
cide
nt V
isual
izatio
n Sy
stem
rese
arch
, and
th
e pr
otot
ype
with
whi
ch y
ou ju
st in
tera
cted
.
This
ques
tionn
aire
is d
esig
ned
to c
olle
ct y
our f
eedb
ack
on th
e ev
alua
tion
exer
cise
you
ju
st c
ompl
eted
, and
col
lect
you
r tho
ught
s abo
ut th
e va
lue
of th
is vi
sual
izatio
n re
sear
ch.
The
Eval
uato
r ID
bein
g re
ques
ted
in th
e to
p rig
ht h
and
corn
er a
llow
s thi
s qu
estio
nnai
re to
be
mat
ched
with
the
Pre-
Eval
uatio
n Q
uest
ionn
aire
you
had
fille
d ou
t a
little
whi
le a
go.
The
Eval
uato
r ID
will
not
be
asso
ciat
ed w
ith y
ou o
r you
r em
ploy
er.
This
ques
tionn
aire
has
bee
n de
signe
d to
be
stric
tly a
no
nym
ou
s.
Plea
se re
spon
d to
the
ques
tionn
aire
item
s to
the
best
of y
our k
now
ledg
e an
d un
ders
tand
ing.
All
resp
onse
s are
vo
lun
tary
. Pl
ease
feel
free
to sk
ip a
n ite
m to
whi
ch
you
pref
er n
ot to
resp
ond.
Plea
se re
turn
this
ques
tionn
aire
to a
n ev
alua
tion
staf
f-mem
ber p
rior t
o le
avin
g th
e ev
alua
tion
even
t.
Than
k yo
u,Do
ug Ja
cobs
on, P
hD, D
irect
or
Info
rmat
ion
Assu
ranc
e Ce
nter
Iow
a St
ate
Uni
vers
ity
Eval
uato
r ID:
____
____
____
__Se
ctio
n 3:
From You
r Firm
’s Perspectiv
e (C
ontin
ued)
10. W
ould having an
objectiv
e mea
sure of “IT incide
nt urgen
cy”
simila
r to
wha
t you
e
xper
ienc
ed h
elp
your
firm
ass
ess t
he ti
mel
ines
s and
leve
l of e
ffort
of a
n IT
in
cide
nt re
spon
se?
Not
Cer
tain
Yes
No
Sect
ion
4: G
ener
al W
rap-
Up
12. W
hat i
s one
impr
ovem
ent y
ou w
ould
sugg
est f
or th
e cu
rre
nt
vers
ion
of th
e IT
In
cide
nt V
isual
izatio
n Sy
stem
?
11. I
f an
Inci
dent
Visu
aliza
tion
Syst
em w
ere
fully
inte
grat
ed w
ithin
you
r firm
, ove
rall
how
ben
efic
ial c
ould
it b
e to
you
r firm
?
Good
dea
l of B
enef
itM
inim
al B
enef
itN
o Be
nefit
Exce
ptio
nal B
enef
it
http
://w
ww
.iac.
iast
ate.
edu/
Fig
ure
A.3
:P
ost-
Eva
luat
ion
Ques
tion
nai
re-
Fro
nt
and
Bac
kC
over

219
1 of
32
of 3
Sect
ion
1: E
valu
atio
n Ex
perie
nce
Sect
ion
2: F
rom
You
r Per
spec
tive
1. A
s you
eva
luat
ed th
e pr
otot
ype
of th
e IT
Inci
dent
Visu
aliza
tion
Syst
em w
hat
ro
le d
id y
ou a
ssum
e?
2. H
ow m
any
task
s did
you
com
plet
e w
ithin
the
20-m
inut
e pe
riod?
of 6
task
s
Busin
ess L
eade
rIT
Lea
der
Inci
dent
Coo
rdin
ator
3. A
side
from
the
time
cons
trai
nts,
did
you
find
the
task
s rea
sona
ble
for t
he ro
le
y
ou p
laye
d du
ring
the
inci
dent
?
No
Yes
4. How
similar w
as Zen
odyn
e’s b
usiness/
miss
ion
to th
e fir
m y
ou w
ork
for n
ow?
Very
Sim
ilar
Som
e Si
mila
ritie
sVe
ry D
iffer
ent
5. Alth
ough
you
“worked” fo
r Zen
odyn
e for o
nly a short tim
e, a
ppra
ise th
e
co
nse
qu
en
ce o
f the
IT in
cide
nt o
n Ze
nody
ne?
High
Mod
erat
eLo
w
Very
Hig
h
6. W
ould having an
IT In
cide
nt Visu
aliza
tion System
tailo
red to you
r firm
’s
o
pera
tions
hel
p YO
U p
erfo
rm Y
OU
R in
cide
nt h
andl
ing
dutie
s?
Not
Cer
tain
Yes
No
Sect
ion
3: From You
r Firm
’s Perspectiv
e
Sect
ion
2: F
rom
You
r Per
spec
tive
(Con
tinue
d)7.
Mos
t inc
iden
t dec
ision
s req
uire
that
we
get a
set o
f fac
ts, a
ppra
ise re
latio
nshi
ps,
co
nsid
er a
ctio
n op
tions
, mak
e a
judg
men
t(s)
, com
mun
icat
e a
nd c
oord
inat
e w
ith
othe
rs.
Havi
ng u
sed
this
prot
otyp
e, w
ould
an
IT in
cide
nt v
isual
izatio
n sy
stem
be
effe
ctiv
e to
:A.
Pro
vide
YO
U w
ith th
e es
sent
ial f
acts
abo
ut in
cide
nts
B. M
ake
clea
r to
YOU
the
optio
ns a
vaila
ble
to ta
ke a
ctio
nC.
Ass
ist Y
OU
in a
ppra
ising
pot
entia
l im
pact
s acr
oss s
ever
al
i
nter
rela
ted
Busin
ess P
roce
sses
/ De
part
men
ts in
you
r firm
D. D
ocum
ent a
ctio
ns ta
ken
or to
be
take
n, o
utco
mes
and
dec
ision
s
dur
ing
and
afte
r the
inci
dent
Yes
No
Yes
No
Yes
No
Yes
No
8. Having worked throug
h this “fictio
nal” IT
incide
nt case,
ple
ase
resp
ond
to th
e
follo
win
g:
“I th
ink an
incide
nt visu
aliza
tion system
tailo
red to M
Y FIRM
wou
ld im
prov
e ou
r IT
inci
dent
han
dlin
g de
cisio
n pr
oces
ses.”
A. G
ener
al a
war
enes
s of I
T In
cide
nts
B. U
nder
stan
ding
IT In
cide
nt c
ompl
exity
C. R
ecog
nizin
g th
e ra
nge
of p
ossib
le k
inds
of i
ncid
ents
D. Und
erstan
ding
incide
nts’
impa
cts o
n th
e fir
m
Man
ySo
me
Man
ySo
me
Man
ySo
me
Man
ySo
me
No
Yes
If Y
es,
app
raise
pot
entia
l adv
anta
ges a
t you
r firm
:A
dva
nta
ges
Very
Few
Very
Few
Very
Few
Very
Few
E. Und
erstan
ding
incide
nts’ im
pacts o
utsid
e th
e fir
mM
any
Som
eVe
ry F
ew
9. W
ould
hav
ing
an IT
Inci
dent
Visu
aliza
tion
Syst
em ta
ilore
d to
YOUR FIRM
’S
o
pera
tions
redu
ce th
e av
erag
e tim
e to
clo
sure
on
IT in
cide
nts?
Not
Cer
tain
Yes
No
Fig
ure
A.4
:P
ost-
Eva
luat
ion
Ques
tion
nai
re-
Insi
de
Pag
es

220
APPENDIX B. CATALOG - BUSINESS IMPACT
VISUALIZATION NEEDS
This appendix contains brief descriptions of the possible business-leader-oriented vi-
sualization needs collected in Stage B of the Iterative Field Study Methodology.
Table B.1: Catalog of Business Impact Visualization Needs
Need DescriptionCompliance andInformation Risk-basedProject Prioritization
When security and compliance projects undergoresource allocation evaluation or milestone slippage,managers often must re-evaluate resource allocations,project objectives and schedules.Support for this task would be related to providingsecurity and compliance risk dimensions to projectprioritization decisions.Goal: Improve management awareness of security andcompliance risk associated with project prioritizationand associated deliverable schedules.
Compliance Management Present situational awareness regarding trending andcurrent status of compliance assessments, as well asoutstanding compliance deficiencies. Presentsystem-oriented views associating systems with theircompliance status to relevant standards and policies.Goal: Assist business leaders with routinecompliance-management decisions.
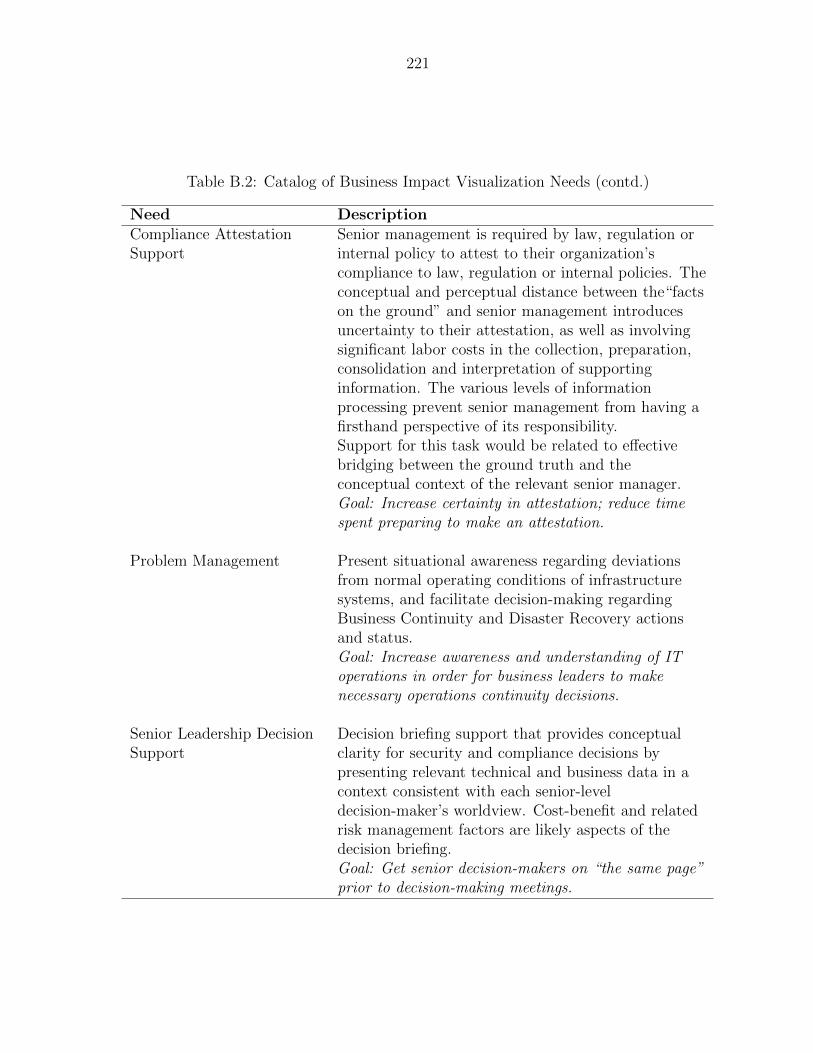
221
Table B.2: Catalog of Business Impact Visualization Needs (contd.)
Need DescriptionCompliance AttestationSupport
Senior management is required by law, regulation orinternal policy to attest to their organization’scompliance to law, regulation or internal policies. Theconceptual and perceptual distance between the“factson the ground” and senior management introducesuncertainty to their attestation, as well as involvingsignificant labor costs in the collection, preparation,consolidation and interpretation of supportinginformation. The various levels of informationprocessing prevent senior management from having afirsthand perspective of its responsibility.Support for this task would be related to effectivebridging between the ground truth and theconceptual context of the relevant senior manager.Goal: Increase certainty in attestation; reduce timespent preparing to make an attestation.
Problem Management Present situational awareness regarding deviationsfrom normal operating conditions of infrastructuresystems, and facilitate decision-making regardingBusiness Continuity and Disaster Recovery actionsand status.Goal: Increase awareness and understanding of IToperations in order for business leaders to makenecessary operations continuity decisions.
Senior Leadership DecisionSupport
Decision briefing support that provides conceptualclarity for security and compliance decisions bypresenting relevant technical and business data in acontext consistent with each senior-leveldecision-maker’s worldview. Cost-benefit and relatedrisk management factors are likely aspects of thedecision briefing.Goal: Get senior decision-makers on “the same page”prior to decision-making meetings.

222
Table B.3: Catalog of Business Impact Visualization Needs (contd.)
Need DescriptionIncident Management Present situational awareness regarding ongoing
incident triage and security controls performance.Provide central view of enterprise security status,business impact of incident, and incident-handlingstatus, and assist with evaluation between multipleincidents.Goal: Provide business leaders sufficient context andawareness of security incidents in order for them todirect resource allocation and evaluate incident andremediation impact on business operations.
Risk-management OptionEvaluation
Present “what-if” risk calculation results during riskmanagement option evaluation. Incorporate supportfor Factor Analysis of Information Risk (F.A.I.R.),adopted by The Open Group and currently beingreconciled with ISO 27005, which provides apotentially useful taxonomy to be visualized.Goal: Assist business leaders with evaluatingrisk-mitigation options by allowing them to observeand interpret the potential consequences ofrisk-mitigation option selection.
Security Planning &Change Control
Present operational impacts of planned outages,facilitate awareness of critical applications and theirdependencies, get operational change approval whenneeded at odd hours, and implement “what-if”analysis of control changes.Goal: Assist business leaders with evaluating potentialrisk associated with control changes and theoperational impacts of planned outages; streamlineapproval of operational decisions during odd hours.

223
APPENDIX C. ANALYSIS OF TASK EXPLORATION
This appendix contains samples of various types of outcomes resulting from the anal-
ysis performed in Analysis of Task Exploration (Stage I - Section 3.2.8). The content
comes from the working documents managed during this process.
Table C.1: Study Group Input Classified as Ideas
Participant Item166; 191; 270;400; 493
A majority of incidents are operational as opposed to security-related (e.g. hack, data breach, malicious insider).
270; 400 Notification is manual, time-consuming and distracting.
270 Managerial presence among responders can increase stress ifmanagers are asking questions that are distracting and annoy-ing.
270; 400 [Incident status] updates are manual and time-consuming.
270 Some [incident status] updates interfere with working the issue.
270 Some [incident status] updates are a distraction.
270 Meetings involving responders and interested parties take theresponders away from the actual response.
270 An incident situation is constantly evolving, so discussionsshould incorporate the most current possible view of the in-cident.
270; 400; 493 Usability Issue: some people will want personal or face-to-faceinteraction even if the information is available.

224
Table C.2: Study Group Input Classified as Ideas (contd.)
Participant Item270 A video briefing showing the Incident Coordinator’s face in con-
junction with the information may address this usability issueto some degree.
400 WebEx tool and Sharepoint are successful tools in communicat-ing incident information in this participant’s environment.
Table C.3: Study Group Input Classified as Decisions
Participant Item270 Whether or not the incident is malicious.
270 Do we do something now or not?
270 What it is? Or, What is going on?
270 Who is affected?
270 What are the response options?
270 Choosing a response option.
270 Locating and assigning resources to the response.
400 Upon awareness, how does this incident affect what I am responsiblefor?
400 How do we best serve the business?
166;400 Should a business unit be contacted?

225
Table C.4: Analysis Results Classified as Notions
Item Label Item1 While other organizations experience significant resource losses to large
incident response efforts, only large organizations can afford and jus-tify the need for dedicated incident management staff. These resourcelosses affect previously scheduled work and have an ongoing impacton this work after incident closure, due to compensating employees fortheir long hours and time away from home. These ongoing effects aredependent on the organization’s culture and compensation policies.
2 Incidents happen.
3 Operational incidents are much more frequent than security incidents,possibly at a 9:1 ratio or even less frequently.
4 For most personnel, incident handling or being a part of the responseprocess is an activity overlaid on top of workload laid out in advance.
5 Individual business leaders (not part of IT) experience incidents in-frequently. Security incidents are even more rare events for businessleaders.
6 Incomplete information is commonplace for significant decisions. Thiscan be the result of an incomplete presentation of available data tothe decision-maker or from an incomplete understanding due to theincident’s complexities.
7 Level of urgency drives timeliness and resource allocation for a response.
8 Business impact is a highly influential factor for urgency.
9 Financial considerations of an incident and remediation are the foun-dations of leadership decision-making during incident response.
10 Financial considerations are based on cost accounting that addressesthe direct and indirect costs of the incident. Direct costs are challengingto compute in the heat of an incident. Indirect costs such as effects onreputation may be impossible to compute within the time horizon ofan incident.

226
Table C.5: Analysis Results Classified as Principles
Notion IDs Principle76,77,87,43 A poorly planned or unduly influenced response plan may
exacerbate impact as well as delay the incident’s closure.Response planning is necessary in order to evaluate poten-tial effectiveness, timeliness, cost, required resources, actioncoordination and communication, and meeting the expecta-tions of those external to the response team. Due to unex-pected outcomes and constraints, response plans are subjectto change as incident response progresses. Response plan-ning and communication is a time investment that is pro-portional to the combination of incident clarity, complexity,scope and severity. Leaders who are unfamiliar with or lackan understanding of the response plan may find the selectedapproach to be less “direct” than they would wish and mayattempt to influence the plan. Understanding leaderships’risk-tolerance profile may allow incident-response plannersto anticipate those response options that will be approvedprior to submitting them, as well as to prioritize efforts morein alignment with leadership’s expectations. Avoiding theconstruction of suggestions that are unlikely to be approvedor that may be subject to extensive revision saves time andimproves response timeliness. Compliance, customer serviceand financial considerations are more significant factors thantechnical merits in response plan evaluation.
18,70,71,78 Mature incident management integrates responses to all inci-dent classes into a common handling framework. Each classof incident (operational, security, compliance) has a generalresponse structure. As the class of incident is determined,an appropriate response team is assembled and one of theseresponse structures is carried out.
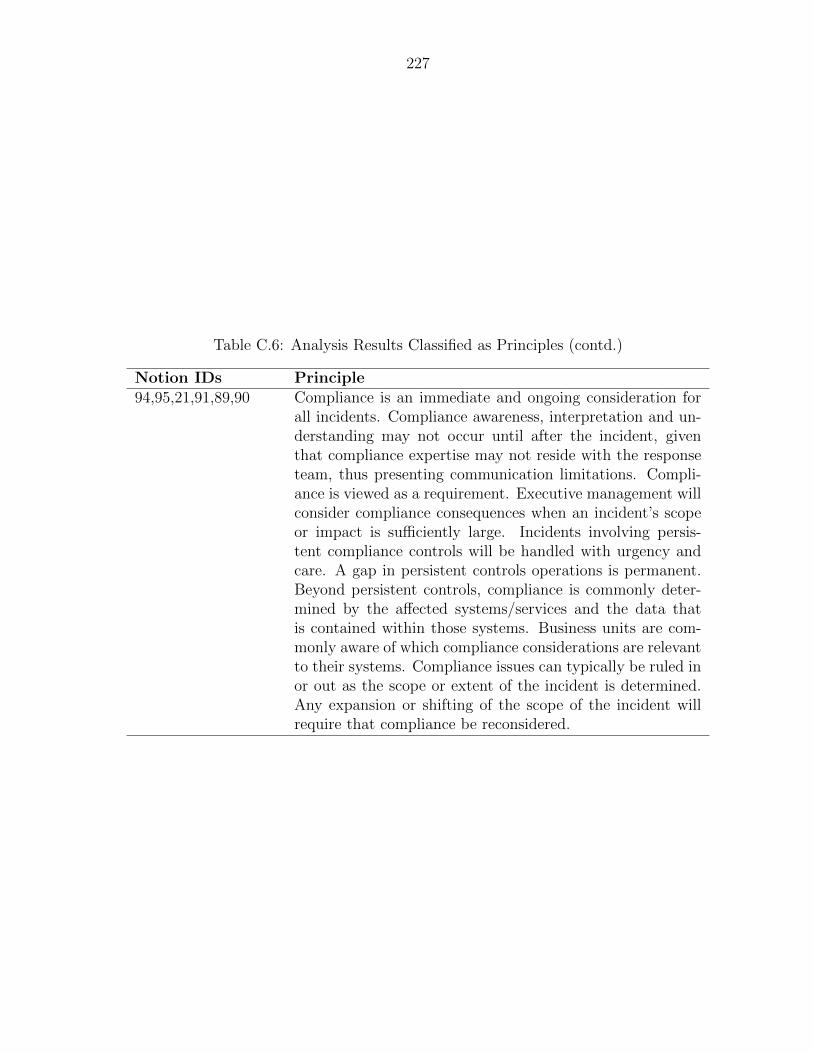
227
Table C.6: Analysis Results Classified as Principles (contd.)
Notion IDs Principle94,95,21,91,89,90 Compliance is an immediate and ongoing consideration for
all incidents. Compliance awareness, interpretation and un-derstanding may not occur until after the incident, giventhat compliance expertise may not reside with the responseteam, thus presenting communication limitations. Compli-ance is viewed as a requirement. Executive management willconsider compliance consequences when an incident’s scopeor impact is sufficiently large. Incidents involving persis-tent compliance controls will be handled with urgency andcare. A gap in persistent controls operations is permanent.Beyond persistent controls, compliance is commonly deter-mined by the affected systems/services and the data thatis contained within those systems. Business units are com-monly aware of which compliance considerations are relevantto their systems. Compliance issues can typically be ruled inor out as the scope or extent of the incident is determined.Any expansion or shifting of the scope of the incident willrequire that compliance be reconsidered.

228
APPENDIX D. IT INCIDENT MANAGEMENT TASK
STRUCTURES AND FLOW
The first diagram is a flow chart depicting how the various core IT incident response
roles interact with each other. The diagram was originally designed to span two 17”
x 11” sheets, so is a bit hard to read when printed. The image has been saved with
sufficient resolution to read labels when zoomed.
A number of task-structure diagrams were produced during Stage J (Section 3.2.9);
this is one example. The diagram was originally designed to span two 11” x 8 12” sheets,
so is a bit hard to read when printed. The image has been saved with sufficient resolution
to read labels when zoomed.

229
High
Lev
el T
ask
Anal
ysis:
Pre
sent
Inci
dent
Man
agem
ent
IT Leadership / Senior TechIncident Coordinator Business Unit
LeadershipResponse Team
MemberBusiness or IT
personnel
Phas
e
Iden
tify
an In
cide
nt
Is th
is an
in
cide
ntAs
sign
an in
cide
nt
coor
dina
tor
Beco
me
awar
e of
th
e in
icde
ntAs
sess
the
natu
re o
f th
e in
cide
ntAs
sem
ble
a re
spon
se te
am
Iden
tify
the
scop
e an
d na
ture
of t
he
inci
dent
Inci
dent
at
trib
utes
Mak
e an
initi
al
asse
ssm
ent o
f na
ture
, im
pact
and
po
tent
ial c
osts
of
the
inci
dent
Perf
orm
inci
dent
no
tific
atio
n
Esta
blish
an
initi
al
awar
enes
s of t
he
inci
dent
Who
in th
e bu
sines
s sho
uld
be n
otifi
ed
Esta
blish
an
initi
al
awar
enes
s of t
he
inci
dent
Who
in th
e bu
sines
s sho
uld
be n
otifi
ed
Perf
orm
inci
dent
no
tific
atio
n to
af
fect
ed u
sers
&
rele
vant
ext
erna
l pa
rtie
s
Dete
rmin
e va
lid
resp
onse
pla
ns
Inve
stig
ate
cour
ses o
f ac
tion
Sugg
este
d re
spon
se
plan
s
Seek
app
rova
l of
resp
onse
pla
n
Eval
uate
and
dire
ct
team
on
appr
opria
te
plan
of a
ctio
n
Asse
ss c
urre
nt
awar
enes
s of
inci
dent
Reas
sess
aw
aren
ess
of th
e in
cide
ntIn
itiat
e Re
spon
se
Plan
Acqu
ire a
ny m
issin
g re
sour
ces
Exec
ute
resp
onse
pla
nRe
spon
se
outc
omes
Asse
ss th
e re
spon
se
Asse
ss th
e re
spon
se
Is th
e pl
an
wor
king
?
Is th
e pl
an
wor
king
?
Shou
ld a
ny
adju
stm
ents
be
mad
e?
Com
mun
icat
e on
in
cide
nt &
resp
onse
st
atus
Shou
ld a
ny
adju
stm
ents
be
mad
e?
Shou
ld
requ
este
d re
sour
ce b
e ap
prov
ed?
Who
and
whe
n sh
ould
ext
erna
l st
akeh
olde
rs b
e co
ntac
ted?
Has s
ervi
ce b
een
rest
ored
or t
he
secu
rity/
com
plia
nce
issue
be
en re
solv
ed?
Dete
rmin
e th
e ro
ot
caus
eDo
cum
ent i
ncid
ent
and
resp
onse
effo
rt
Is th
e se
rvic
e st
able
/sec
ure/
com
plia
nt?
Clos
e in
cide
nt
Clos
e op
erat
iona
l ev
ent
Perf
orm
reso
lutio
n no
tific
atio
n
Reco
gnize
inci
dent
re
solu
tion
Reco
gnize
inci
dent
re
solu
tion
Inve
stig
ate
caus
e of
in
cide
nt
Prov
ide
effo
rt
deta
ils a
nd
insig
ht o
n in
cide
nt &
re
spon
se
Inci
dent
Doc
umen
t
Estim
ate
for
each
:-T
ime
to R
epai
r-R
isk to
ops
-Dire
ct c
ost
Acqu
ire a
ny m
issin
g re
sour
ces
Wha
t in
form
atio
n ge
ts
shar
ed?
Shou
ld
requ
este
d re
sour
ce b
e ap
prov
ed?
Hand
le e
vent
op
erat
iona
lly
Is th
is a
BCP
Even
t?
BCP
Even
t
Is th
is a
BCP
Even
t?
BCP
Even
t
Shou
ld In
cide
nt
be E
scal
ated
?
Adju
st In
cide
nt
stat
us to
refle
ct
esca
latio
n &
not
ify
appr
opria
te
pers
onne
l
Dete
rmin
e if
any
imm
edia
te
prod
uctiv
ity
optio
ns a
re
avai
labl
e
Fig
ure
D.1
:IT
Inci
den
tM
anag
emen
tF
low
Acr
oss
Rol
es

230
C.Achieve general awareness of business & explore an incident’s details
D.Achieve updated awareness of incidents & explore an incident’s details
E.Achieve updated awareness of a specific incident & explore the incident’s details
1.
Login into system
2.
Select “Business Status”
2.2
Observe High Level Incidents’ Status
2.1
Observe Operational Status
1.
Login into system
2.
Select “Incident and Potential Incident Listing”
2.1Observe Incident & Potential Incident Listing with Updated Status
1.
Login into system
2.
Select “Locate Incident or Potential Incident”
2.2
Observe Complete Summary of Incident & Response
2.1
Search for Specific Incident or Potential Incident
2.1.1Enter Incident Id Helpdesk ID in Search Box & Commence Search
2.1.2Select an Incident ID or Helpdesk ID from populated drop down list
Thorough Awareness Tasks
Common Actors:IT LeaderBusiness Leader
2.2.1
Select an Incident of Interest
2.2.2
Locate an Incident by Name or Date
2.2.3
Observe Complete Summary of Incident & Response
2.2
Select an Incident or potential incident of Interest
2.3
Locate an Incident or potential incident by Name or Date
2.4
Observe Complete Summary of Incident & Response
2.4.1
Select Incident Summary Information for more detail
2.4.2
Select Response Summary Information for more detail
2.4.3
Observe & Interpret selected details
2.4.4
Return to Incident Summary
Thorough Awareness TasksCommon Actors:IT LeaderBusiness Leader
PlansPlan C Do C.1 –C.2 Re-entryPlan C.2 Do C.2.1 – C.2.2, repeat as desiredPlan C.2.2 Do C.2.2.1 OR C.2.2.2 then do C.2.2.3/E.2 C.2.2.4 may substitute for C.2.2.3 if user has permissionsPlan C.2.2.3 Do D.2.4.1 OR D.2.4.2 then do D.2.4.3 - D.2.4.4, repeat as desired When done, D.2.4.4
Plan D Do D.1 – D.2 Re-entryPlan D.2 Do D.2.1 then D.2.2 OR D.2.3 then do D.2.4/E.2 D.2.5 may substitute for D.2.4 if user has permissionsPlan D.2.4 Do D.2.4.1 OR D.2.4.2 then do D.2.4.3 - D.2.4.4, repeat as desired When done, D.2.4.4Plan D.2.4.2 Do D.2.4.2.1 – D.2.4.2.4
2.4.2.1
Observe response plan and progress to plan
2.4.2.2
Observe critical response actions highlighted
2.4.2.4Observe task assignments in context of the response plan
2.4.2.3
Observe anticipated involvement based on user’s role
RE-ENTRY
Return to some point in visualization system or EXIT
RE-ENTRY
Return to some point in visualization system or EXIT
2.3
Start task K if given sufficient permission
2.2.4/D.2.5
Start task K if given sufficient permission
Plan E Do E.1 – E.2 Re-entryPlan E.2 Do E.2.1 – E.2.2 or E.2.1, E.2.3 if sufficient permissionsPlan E.2.1 Do E.2.1.1 OR E.2.1.2Plan E.2.2 Do D.2.4.1 OR D.2.4.2 then do D2.4.3 - D.2.4.4, repeat as desired When done, D.2.4.4
Figure D.2: Sample Task Structure and Plan

231
APPENDIX E. IT INCIDENT VISUALIZATION SYSTEM
REQUIREMENTS
The requirements presented in this appendix were developed in Stage K (Section 3.2.10)
and revised in Stage M (Section 3.2.12). The requirements were developed to be hierar-
chical. The first table contains the high level requirements. The remaining tables contain
more granular requirements that expand on each of the high-level requirements.
Table E.1: High-Level Requirements
Label Name and Description1 Incident Handling Awareness
Augment perception of each and all incidents’ character and response ef-forts related to those incidents through the presentation of appropriateinformation.
2 Decision SupportProvide support for decision, assessment, evaluation, and choice tasks per-formed by the visualization system user (hereafter to be referenced as theuser), so that correct judgment/decision tasks are performed in an informedand timely manner.
3 Communication CapabilityProvide an incident’s “community of interest” a means to inform and beinformed of incident attributes and corresponding response characteristics(e.g. actions, response outcomes, response resources, task assignments andplans). The ”community of interest” consists of individuals assigned to in-cident dependent roles of: Incident Coordinator, Response Team Member,IT Leader, Business Leader, Stakeholder, Internal Affected User, ExternalEntities (e.g. Customer/Client, Partner, Regulator).

232
Table E.2: High-Level Requirements (contd.)
Label Name and Description4 Coordination Capability
Provide a means to facilitate the acquisition of human and technical re-sources as well as direct these resources in order to mount and deliver aneffective and timely response in coordination with response plans, proce-dures, policy and relevant regulatory requirements.
5 Incident Actions GuideProvide incident handling process guidance to visualization system users.
6 Incident MeasuresProvision of understood, accepted and reliable incident indicators.
7 Incident Review & Analysis ToolsProvide a means to interact and visualize historical incident managementdata.
8 Incident Handling DocumentationProvide a record of incident details and response actions taken. Primaryuses are awareness among active responders and historical needs like inter-nal reporting, legal and compliance needs, cost accounting and more.
9 Visualization UsabilityExhibit the qualities of being easy to use, learnable and useful.

233
Table E.3: 1 - Incident Handling Awareness Design Requirements
Label Name and Description1 Incident Handling Awareness
Augment perception of each and all incidents’ character and response ef-forts related to those incidents through the presentation of appropriateinformation.
1.A StatusPresentation of the present state or condition of active incidents and theircorresponding responses expressed in terms of quantitative (i.e. valuesresulting from measurements or calculations), temporal (i.e. related totime), relational, conceptual and verbal (i.e. textual) information.
1.B ProgressionPresentation of the succession of status information elements for incidentsand their corresponding responses. Status is as described in requirement1.A.
1.C ReportA structured snapshot presentation of the status, as defined in 1.A, andprogression, as defined in 1.B. The structure of presented information isdictated by the awareness objectives for each report type. Snapshot meansthat once an instance of this awareness type is released the informationcontained therein is unchanging.

234
Table E.4: 2 - Decision Support Design Requirements
Label Name and Description2 Decision Support
Provide support for decision, assessment, evaluation, and choice tasks per-formed by the visualization system user (hereafter to be referenced as theuser), so that correct judgment/decision tasks are performed in an informedand timely manner.
2.A Judgment/Decision Task AwarenessProvide user awareness of a pending decision, assessment, evaluation, esti-mation, or choice task he or she is responsible to perform.
2.B Information SupportProvide user access to data that enables a pending judgment/decision task(i.e. decision, estimation, assessment, evaluation, or choice) or facilitatethe search or request for missing data.
2.C Uncertainty SupportProvide a means to gauge uncertainty through an expression of a) infor-mation incompleteness, b) reliability of measurement and calculation, orc) projected value variability of presented information.
2.D ProjectionProvide an expression of one or more possible future outcomes/values ofincident attributes and indicators based on current information, models ofincident dynamics and response team judgments.

235
Table E.5: 3 - Communication Capability Design Requirements
Label Name and Description3 Communication Capability
Provide an incident’s “community of interest” a means to inform and beinformed of incident attributes and corresponding response characteristics(e.g. actions, response outcomes, response resources, task assignments andplans). The ”community of interest” consists of individuals assigned to in-cident dependent roles of: Incident Coordinator, Response Team Member,IT Leader, Business Leader, Stakeholder, Internal Affected User, ExternalEntities (e.g. Customer/Client, Partner, Regulator).
3.A Intra CoreProvide communication capability among core incident response roles (i.e.Incident Coordinator, Response Team Members, IT Leadership, BusinessLeadership, Stakeholders). People assigned to these core incident responseroles will have interactive access to the visualization system. Access gov-ernance is outside of this requirement’s scope.
3.B Interactive Internal UsersProvide communication capability between the core incident response rolesand the affected internal user population. People assigned to the internaluser group will have interactive access to the visualization system. Accessgovernance is outside of this requirement’s scope.
3.C Interactive External EntitiesProvide communication capability between the core incident response rolesand the affected external user population and regulatory entities. Externaluser population is defined as those users who are not employees or functionon behalf of the organization (e.g. customers, partners). People assigned tothe external entity groups will have interactive access to the visualizationsystem. Access governance is outside of this requirement’s scope.
3.D Passive Non-Core ActorsProvide communication from the core incident response roles to the af-fected non-core actors. Non-core actors are defined as those assigned toincident response roles not identified in 3.A. People assigned to the non-core roles will not have interactive access to the visualization system.

236
Table E.6: 4 - Coordination Capability Design Requirements
Label Name and Description4 Coordination Capability
Provide a means to facilitate the acquisition of human and technical re-sources as well as direct these resources in order to mount and deliver aneffective and timely response in coordination with response plans, proce-dures, policy and relevant regulatory requirements.
4.A Response Resource AcquisitionProvide a means to request the acquisition of resources (e.g. internal per-sonnel, software, tools & equipment, consultants or contractors, improvedmanufacturer support) and facilitate request approval decisions.
4.B Response Resource TaskingEnable the Incident Coordinator or authorized leader to direct/assign re-sources to tasks and monitor assignment loads and completion of tasks.Enable task escalation when task completion is past due beyond a config-ured time threshold. Note: Monitoring of progress is not limited to theIncident Coordinator.
4.C Incident & Response Judgment/Decision EscalationEnable automated and manual escalation of an entire incident or specificrelated response judgments/decisions. Performance of manual escalation islimited to authorized visualization users. Escalation will manifest itself inescalation notification (both in-band and out-of-band), visual indication,role assignment adjustments, task & judgment/decision queue changes andchanges in level of concern for relevant personnel. Escalation automationwill be specified in a requirement subordinate to this requirement; however,in general this functionality will focus on triggers based on the individualincident and its related response status.
4.D Response Role ManagementProvide the Incident Coordinator or authorized visualization user the abil-ity to assign human resources to incident response roles. Provide autho-rized visualization users visibility into who has been assigned to which rolesand their contact information.

237
Table E.7: 4 - Coordination Capability Design Requirements (contd.)
Label Name and Description4.E Timeline and Dependency Awareness
Present resource availability constraints in the context of active and pend-ing tasks. Emphasize task sequences at risk of violating resource avail-ability constraints or allowing resources to idle beyond a specified thresh-old. Emphasize resource assignments that violate availability constraints.Provide a view of identified response resources with their correspondingavailability constraints, their current status and time remaining until thenext state transition (i.e. leaving the response effort, joining the responseeffort).
Table E.8: 5 - Incident Actions Guide Design Requirements
Label Name and Description5 Incident Actions Guide
Provide incident handling process guidance to visualization system users.
5.A Incident plan supportPresent the approved incident response plan accentuating a) critical pointsin the plan, b) assigned tasks of all types, c) user’s anticipated involvementbased on his or her assigned response role and d) current progress of plan.
5.B Policy and GuidelinesPresent relevant excerpts of Policy highlighting passages related to specifiedresponsibilities associated with the user’s assigned response role. Presentrelevant guidelines and highlighting passages related to responsibilities as-sociated with user’s assigned response role.
5.C Compliance concernsPresent relevant compliance concerns identified by incident attribute cor-relation as well as those suggested by compliance subject matter experts.
5.D Out-of-band notificationInitiate out-of-band communication to provide reminders of pending orpast due task assignments and upcoming critical points in the response.Out-of-band as term means using an existing communications methodother than the visualization.

238
Table E.9: 6 - Incident Measures Design Requirements
Label Name and Description6 Incident Measures
Provision of understood, accepted and reliable incident indicators.
6.A TimeTime is an attribute of the progression of events. Various devices definetime in conventional units of measure. The visualization will present: a)time of occurrence, b) time of cessation, c) duration and d) time remainingbefore expected cessation or occurrence of an event, action or task. Note:No granularity constraints are implied on events, actions or tasks referencedin this requirement.
6.B Direct Incident CostA measure of present accumulated direct accounting incident costs as-sociated with a) resources committed to incident resolution, b) hardwarereplacement costs, c) lost productivity, d) measurable contractual penaltiesand e) degraded revenue related processes. Note: Punitive and regulatoryfines and judgments are not included due to the high degree of uncertaintyof the actual associated costs will be when determined months or years inthe future. These costs are deemed to be indirect costs.
6.C Direct Incident Cost RiskThe most likely cost rate (e.g. $/hr) projection of expected direct incidentcost as defined in 6.B.
6.D ExtentIndicator of directly affected business processes, systems, data and person-nel at present. Indicator of presently unaffected business processes, sys-tems, data and personnel with known dependencies on presently affectedbusiness processes, systems, data and personnel.
6.E UrgencyA time varying incident indicator that reflects the curvature of the directincident cost risk projection, response plan execution risk, and exposure tosecurity, compliance and brand.

239
Table E.10: 7 - Incident Review & Analysis Tools Design Requirements
Label Name and Description7 Incident Review & Analysis Tools
Provide a means to interact and visualize historical incident managementdata.
7.A Incident Management ImprovementProvide an interactive capability that provides a “look-back” or detailedreview of an incident and related response for the purposes of improvingincident handling processes and incident prevention. Provide an interac-tive capability that provides analysis support for visualization user selectedcollections of incidents for the purposes of improving incident handlingprocesses and incident prevention. Note: Listing lines of inquiry for sup-port of process improvement and incident prevention will be specified insubordinate requirements.
7.B Institutional Incident Knowledge ManagementProvide management and incident responders knowledge delivery mecha-nisms of historical incident data in order to provide an interactive datapresentation of historical incident data for active incident responders, re-sponse training and to assist with incident awareness training.
7.C Control Change EvaluationProvide an interactive data presentation to assist with determining theefficacy of current technical controls and the potential consequences oftechnical control changes in the context of past managed incidents. Note:Control changes have been potentially determined to be the root cause ofpast incidents. This line of inquiry will be supported in 7.A.
7.D Business Resilience Improvement SupportProvide an interactive data presentation to assist with assessing adaptabil-ity and recovery performance of business processes, systems, and humanresource based on past incident data. Provide support for anticipatingsimilar incidents within business processes, systems, and human resourcesbased on past incident data.

240
Table E.11: 8 - Incident Handling Documentation Design Requirements
Label Name and Description8 Incident Handling Documentation
Provide a record of incident details and response actions taken. Primaryuses are awareness among active responders and historical needs like inter-nal reporting, legal and compliance needs, cost accounting and more.
8.A Decision MakingRecord decisions made along with available information and assumptionsthe decision-maker shares with the visualization system.
8.B Response ActionsChronicle tasks performed and their durations, task outcomes, and taskperformers.
8.C Response PlansArchive proposed response plans, chosen plans and any later adjustmentsto plans. Management sign-off on plan acceptance and changes will berequired and recorded. Rationale for choices and later adjustments arerecorded as well.
8.D Incident NatureJournal incident attributes and measures periodically and at key events.

241
Table E.12: 9 - Visualization Usability Design Requirements
Label Name and Description9 Visualization Usability
Exhibit the qualities of being easy to use, learnable and useful.
9.A ConvenienceProvide centralized access to authoritative incident management data aswell as easy to use task relevant data access and submission mechanisms.
9.B Information RelevanceProvide information the visualization user considers relevant or has a “de-sire to know” based on established level-of-concern or the current responserole of the user. This requirement applies to all forms of information pre-sentation delivered or initiated by the visualization system. “Desire toknow” will govern information presentation priorities of information drawnfrom the pool of information authorized for user access. This informationpool is managed by the “need to know” security principle. Informationauthorization will be manageable by authorized visualization users.
9.C AccessibleProvide support for multiple platform types (e.g. desktop/laptop, tabletcomputer, smart phone) with at least one able to support the visualizationuser away from his or her desk. At least one platform type will be resilientto the lack of a nearby source of electrical power and support multiple com-munication paths (e.g. wired/WI-FI Ethernet, mobile phone carrier dataservices) in the event of LAN unavailability. All visualization platformswill have a user interface sensitive to human factors and work environmentlimitations.
9.D Functional RelevanceProvide an interaction experience that is sensitive to a) the user’s trainingwith the visualization (i.e. “competency to perform”) and b) the user’s“need to perform” that is a consideration of both response role responsi-bilities and the context of visualization task objectives. This requirementapplies to all visualization platforms. The notions of “need to perform”and “competency to perform” will govern access priorities to functions orcapabilities drawn from the pool of authorized actions, capabilities andfunctions. This pool is managed by the “least privilege” security princi-ple. Action, capability and function authorization will be manageable byauthorized visualization users.

242
APPENDIX F. REQUIREMENTS RANKING MATERIALS
Several documents were sent to Study Group members in an email. One document
contained the requirements listed in Appendix E. The second document contained in-
structions as well as the forms Group members used to indicate their pairwise ranking
preferences.
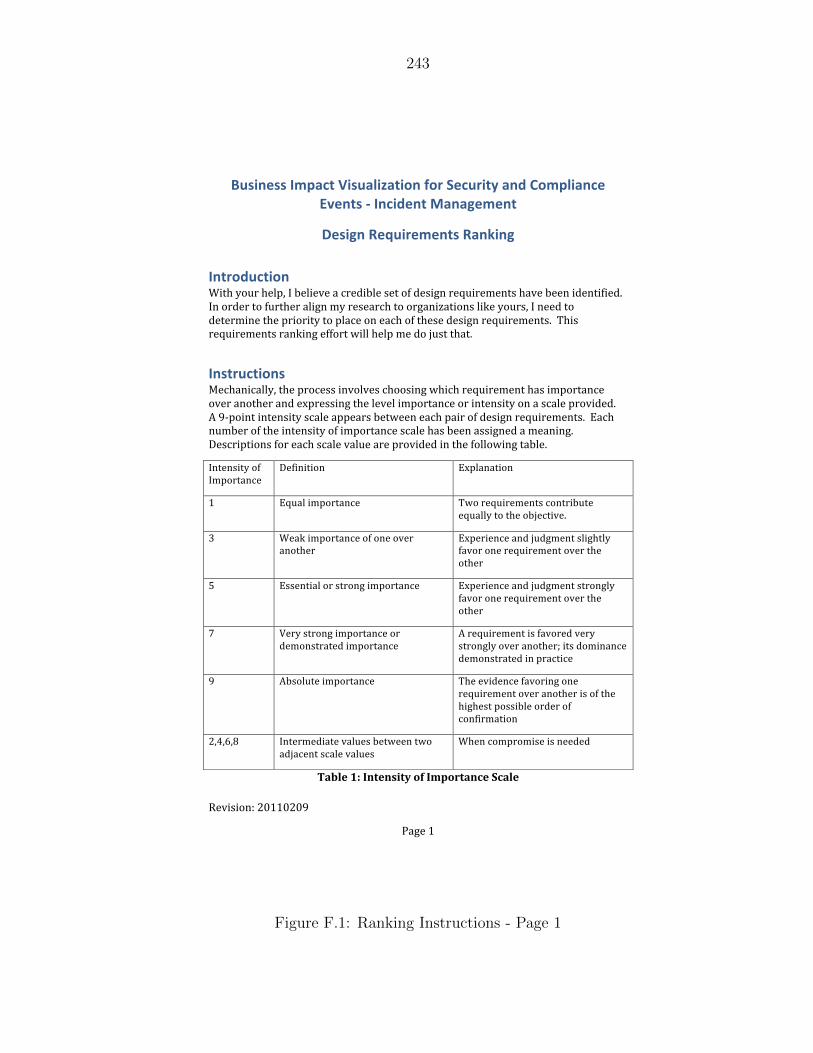
243
!
"#$%&%'()!*+,,+*+-!
./0#!,!!
!"#$%&##'()*+,-'.$#"+/$0+-$1%'213'4&,"3$-5'+%6'71)*/$+%,&'89&%-#':'(%,$6&%-';+%+<&)&%-''
=&#$<%'>&?"$3&)&%-#'>+%@$%<'
(%-316",-$1%'1%23!4'56!3#789!:!;#7%#$#!/!<6#=%;7#!!'>!=#&%0(!6#?5%6#@#(2&!3/$#!;##(!%=#(2%>%#=A!!:(!'6=#6!2'!>5623#6!/7%0(!@4!6#&#/6<3!2'!'60/(%B/2%'(&!7%C#!4'56&9!:!(##=!2'!=#2#6@%(#!23#!86%'6%24!2'!87/<#!'(!#/<3!'>!23#&#!=#&%0(!6#?5%6#@#(2&A!!D3%&!6#?5%6#@#(2&!6/(C%(0!#>>'62!E%77!3#78!@#!='!F5&2!23/2A!
(%#-3",-$1%#'G#<3/(%</7749!23#!86'<#&&!%($'7$#&!<3''&%(0!E3%<3!6#?5%6#@#(2!3/&!%@8'62/(<#!'$#6!/('23#6!/(=!#H86#&&%(0!23#!7#$#7!%@8'62/(<#!'6!%(2#(&%24!'(!/!&</7#!86'$%=#=A!!I!-J8'%(2!%(2#(&%24!&</7#!/88#/6&!;#2E##(!#/<3!8/%6!'>!=#&%0(!6#?5%6#@#(2&A!!K/<3!(5@;#6!'>!23#!%(2#(&%24!'>!%@8'62/(<#!&</7#!3/&!;##(!/&&%0(#=!/!@#/(%(0A!!L#&<6%82%'(&!>'6!#/<3!&</7#!$/75#!/6#!86'$%=#=!%(!23#!>'77'E%(0!2/;7#A!
:(2#(&%24!'>!:@8'62/(<#!
L#>%(%2%'(! KH87/(/2%'(!
,! K?5/7!%@8'62/(<#! DE'!6#?5%6#@#(2&!<'(26%;52#!#?5/774!2'!23#!';F#<2%$#A!
M! 1#/C!%@8'62/(<#!'>!'(#!'$#6!/('23#6!
KH8#6%#(<#!/(=!F5=0@#(2!&7%03274!>/$'6!'(#!6#?5%6#@#(2!'$#6!23#!'23#6!
N! K&&#(2%/7!'6!&26'(0!%@8'62/(<#! KH8#6%#(<#!/(=!F5=0@#(2!&26'(074!>/$'6!'(#!6#?5%6#@#(2!'$#6!23#!'23#6!
O! P#64!&26'(0!%@8'62/(<#!'6!=#@'(&26/2#=!%@8'62/(<#!
I!6#?5%6#@#(2!%&!>/$'6#=!$#64!&26'(074!'$#6!/('23#6Q!%2&!='@%(/(<#!=#@'(&26/2#=!%(!86/<2%<#!
-! I;&'752#!%@8'62/(<#! D3#!#$%=#(<#!>/$'6%(0!'(#!6#?5%6#@#(2!'$#6!/('23#6!%&!'>!23#!3%03#&2!8'&&%;7#!'6=#6!'>!<'(>%6@/2%'(!
*9R9S9T! :(2#6@#=%/2#!$/75#&!;#2E##(!2E'!/=F/<#(2!&</7#!$/75#&!
13#(!<'@86'@%&#!%&!(##=#=!
!"#$%&'(&)*+%*,-+.&/0&)12/3+"*4%&54"$%&
Figure F.1: Ranking Instructions - Page 1

244
!
"#$%&%'()!*+,,+*+-!
./0#!*!!
&
U'5!/6#!E#7<'@#!2'!6#$%&#!4'56!6#&8'(&#&!86%'6!2'!&5;@%22%(0!23#@!2'!@#A!!U'5!/6#!/7&'!E#7<'@#!2'!8#6>'6@!23#!6#?5#&2#=!<'@8/6%&'(&!%(!/(4!'6=#69!;52!87#/&#!6#&8'(=!2'!/77!'>!23#@A!!.7#/&#!=%&2%(<2%$#74!@/6C!4'56!<3'%<#&!=%6#<274!'(!23#!<'@8/6%&'(!>'6@&!2'!#(&56#!=/2/!%(2#06%24A!!!
!
.7#/&#!#(2#6!4'56!&25=4!8/62%<%8/(2!:L!(5@;#6!'(!#/<3!8/0#!&'!23/2!#/<3!&5;@%&&%'(!6#@/%(&!86'8#674!<'77/2#=A!!U'56!8/62%<%8/(2!:L!</(!;#!>'5(=!%(!23#!<'$#6!#@/%7!2'!E3%<3!23%&!='<5@#(2!E/&!/22/<3#=A!!!
!
V#4'(=!23#!@#<3/(%<&!'>!23#!<'@8/6%&'(!86'<#&&9!23#6#!/6#!@/(4!8'%(2&!'>!$%#E!'(#!</(!2/C#!E3#(!8#6>'6@%(0!23#!<'@8/6%&'(&A!!I723'503!#/<3!@/4!;#!0#(#6/774!$/7%=9!/(!5(<''6=%(/2#=!!'>!$%#E8'%(2&!E%77!6/%&#!5(<#62/%(24!E%23!23#!6/(C%(0!6#&572&!/(=!6#=5<#!23#!6#7%/;%7%24!'>!23#&#!6#&#/6<3!6#&572&A!!U'56!6/(C%(0!#>>'62&!E%77!;#!@'&2!5&#>57!E3#(!4'5!@/C#!4'56!<3'%<#&!>6'@!23#!8#6&8#<2%$#!'>!E3/2!:!</77!23#!W'@8/6%&'(!W6%2#6%/A!!!
!
71)*+3$#1%'73$-&3$+'.7#/	!<'(&%=#6!23/2!23#!>'<5&!'>!23%&!$%&5/7%B/2%'(!6#&#/6<3!%&!2'!/(&E#6!23#!?5#&2%'(!'>!E3#23#6!%2!%&!8'&&%;7#!2'!%@86'$#!7#/=#6&X!Y%A#A!%(<%=#(2!7#/=#69!:D!7#/=#69!;5&%(#&&!7#/=#6Z!/E/6#(#&&!/(=!<'@86#3#(&%'(!'>!%(<%=#(2!@/(/0#@#(2!=#<%&%'(&!236'503!/!=4(/@%<!$%&5/7!&4&2#@A!
245
!
"#$%&%'()!*+,,+*+-!
./0#!M!!
!
!"#$%&'()*+*,%-#+&'.%(*/(*012+'$*./%6E%&#!<'@8/6%&'(!%&!/(!#$/75/2%'(!'>!%@8'62/(<#!'>!'(#!6#?5%6#@#(2!'$#6!/('23#6!#H86#&&#=!/&!/!7#$#7!'>!%@8'62/(<#!%(2#(&%24A!!K/<3!8/%6!'>!6#?5%6#@#(2&!/88#/6&!'(74!/*4%!%(!23#!<'@8/6%&'(!>'6@&!/22/<3#=A!!
D3#!#H/@87#!;#7'E!&3'E&!3'E!23#!W'@8/6%&'(!W6%2#6%/!/(=!23#!8/%6E%&#!<'@8/6%&'(!E'6C!2'0#23#6A!
8A+)*/&'!"#$%&'(")*!&'+,&'%-*.(*%*$%&,)+*/'+0')*1"2&*0"2(,0"34*4,+,&#'),*+0,*'#$"&+%)5,*"6*+0,*6"33"/')7*%++&'82+,(*"6*'5,*5&,%#*1"2*5")('4,&*/0,)*(,3,5+')7*'5,*5&,%#*%+*+0,*7&"5,&1*(+"&,*6"&*1"2&*6%#'319*

246
!
"#$%&%'()!*+,,+*+-!
./0#!R!!
3145'&1-1(2*61+('()*I!=#&<6%82%'(!'>!#/<3!6#?5%6#@#(2!4'5!/6#!<'@8/6%(0!%&!86'$%=#=!%(!/(!/<<'@8/(4%(0!='<5@#(2A!!G/(4!6#?5%6#@#(2!(/@#&!/(=!=#&<6%82%'(&!3/$#!<3/(0#=!;/&#=!'(!4'56!%(852!=56%(0!23#!"#?5%6#@#(2&!"#$%#EA!!]'9!87#/&#!;/&#!4'56!6/(C%(0!'>!#/<3!6#?5%6#@#(2!'(!E3/2!%&!<566#(274!E6%22#(!>'6!#/<3!6#?5%6#@#(2!/(=!23#!$%&5/7%B/2%'(!<'(2#H2!E#!=%&<5&&#=A!!:(!@'&2!</&#&!23#!0#(#6/7!0%&2!6#@/%(&!23#!&/@#!>'6!#/<3!6#?5%6#@#(29!/(=!3'8#>5774!23#!7/(05/0#!<3/(0#&!/==#=!86#<%&%'(!/(=!<7/6%24A!!\##7!>6##!2'!<'(2/<2!@#!Y@2/((%/(^%/&2/2#A#=5Z!%>!4'5!(##=!/(423%(0!<7/6%>%#=A!
!
31.#%(.1*758-'..'%(*D3#6#!/6#!&#$#6/7!E/4&!E#!</(!<''6=%(/2#!&5;@%&&%'(!'>!4'56!6/(C%(0!#>>'62&)!,Z!23#!>'6@&!</(!;#!&</((#=!/(=!#@/%7#=9!*Z!23#!>'6@&!</(!;#!@/%7#=!2'!@#!Y/!>J/==6#&&#=!&2/@8#=!#($#7'8#!%&!/$/%7/;7#!58'(!6#?5#&2Z!'6!MZ!:!</(!&2'8!;4!4'56!'>>%<#!2'!8%<C!58!4'56!&5;@%&&%'(A!
!
9'-1*:&+-1*I723'503!4'56!_@%7#/0#!@/4!$/64`9!:!3'8#!23#!<'@8/6%&'(!86'<#&&!E%77!2/C#!4'5!/(!3'56!2'!<'@87#2#A!!:!E'57=!7%C#!2'!0#2!4'56!&5;@%&&%'(&!,!E##C!>6'@!E3#(!4'5!6#<#%$#=!23%&!>'6@A!
!
,%-#+&'.%(*;&)+('<+2'%(*D3#!<'@8/6%&'(&!3/$#!;##(!'60/(%B#=!%(2'!,+!%(=#8#(=#(2!&!'>!<'@8/6%&'(&A!!D3#!>%6&2!!<'(&%&2&!'>!<'@8/6%&'(&!;#2E##(!3%03J7#$#7!=#&%0(!6#?5%6#@#(2&A!!D3#!6#@/%(%(0!(%(#!06'58%(0&!/6#!&!'>!=#<'@8'&#=!6#?5%6#@#(2&!23/2!/7%0(!2'!#/<3!'>!23#!3%03J7#$#7!=#&%0(!6#?5%6#@#(2&A!!D3#!86%'6%24!/&&%0(#=!2'!#/<3!3%03!7#$#7!=#&%0(!6#?5%6#@#(2!E%77!E#%032!23#!86%'6%24!'>!#/<3!'>!23#!6#7/2#=!@'6#!=#2/%7#=!6#?5%6#@#(2&A!!!
!
,%-#+&'.%(*;52=%-1*D3#!6#7/2%$#!%@8'62/(<#!%(2#(&%2%#&!4'5!/&&%0(!E%77!;#!/(/74B#=!236'503!/!@/23#@/2%</7!2#<3(%?5#A!!D3#!6#&572&!E%77!;#!23#!86%'6%24!4'5!/&&%0(#=!2'!#/<3!'>!23#!6#?5%6#@#(2&A!!D3#&#!6#&572&!E%77!23#(!;#!<'@;%(#=!E%23!23#!86%'6%24!F5=0@#(2&!@/=#!;4!23#!'23#6!&25=4!8/62%<%8/(2&!2'!=#2#6@%(#!/!&25=4JE%=#!86%'6%24!'>!6#?5%6#@#(2&A!!
!
Figure F.4: Ranking Instructions - Page 4

247
Stu
dy P
artici
pant
ID
: __
____
__Pa
ge 1
of 5
Plea
se w
rite
you
r as
sign
ed le
ader
con
text
her
e:
Pairw
ise
Com
pariso
n Set
: H
igh
Leve
l Des
ign
Req
uire
men
ts
No.
1In
cide
nt H
andl
ing
Aw
aren
ess
98
76
54
321
23
45
67
89
Inci
dent
Rev
iew
& A
naly
sis
Tool
s N
o. 2
Coo
rdin
atio
n Cap
abili
ty9
87
65
43
21
23
45
67
89
Inci
dent
Rev
iew
& A
naly
sis
Tool
s
No.
3Com
mun
icat
ion
Cap
abili
ty9
87
65
43
21
23
45
67
89
Coo
rdin
atio
n Cap
abili
ty
No.
4In
cide
nt A
ctio
ns G
uide
98
76
54
321
23
45
67
89
Inci
dent
Han
dlin
g Aw
aren
ess
No.
5D
ecis
ion
Sup
port
98
76
54
321
23
45
67
89
Vis
ualiz
atio
n U
sabi
lity
No.
6Coo
rdin
atio
n Cap
abili
ty9
87
65
43
21
23
45
67
89
Inci
dent
Han
dlin
g Aw
aren
ess
No.
7In
cide
nt H
andl
ing
Aw
aren
ess
98
76
54
321
23
45
67
89
Com
mun
icat
ion
Cap
abili
ty
No.
8Coo
rdin
atio
n Cap
abili
ty9
87
65
43
21
23
45
67
89
Inci
dent
Act
ions
Gui
de
No.
9In
cide
nt A
ctio
ns G
uide
98
76
54
321
23
45
67
89
Dec
isio
n Sup
port
No.
10
Com
mun
icat
ion
Cap
abili
ty9
87
65
43
21
23
45
67
89
Inci
dent
Act
ions
Gui
de
No.
11
Dec
isio
n Sup
port
98
76
54
321
23
45
67
89
Coo
rdin
atio
n Cap
abili
ty
No.
12
Vis
ualiz
atio
n U
sabi
lity
98
76
54
321
23
45
67
89
Inci
dent
Han
dlin
g Aw
aren
ess
No.
13
Vis
ualiz
atio
n U
sabi
lity
98
76
54
321
23
45
67
89
Com
mun
icat
ion
Cap
abili
ty
No.
14
Inci
dent
Act
ions
Gui
de9
87
65
43
21
23
45
67
89
Vis
ualiz
atio
n U
sabi
lity
No.
15
Inci
dent
Mea
sure
s9
87
65
43
21
23
45
67
89
Inci
dent
Han
dlin
g Aw
aren
ess
No.
16
Com
mun
icat
ion
Cap
abili
ty9
87
65
43
21
23
45
67
89
Inci
dent
Rev
iew
& A
naly
sis
Tool
s
No.
17
Inci
dent
Han
dlin
g Aw
aren
ess
98
76
54
321
23
45
67
89
Inci
dent
Han
dlin
g D
ocum
enta
tion
No.
18
Dec
isio
n Sup
port
98
76
54
321
23
45
67
89
Inci
dent
Han
dlin
g Aw
aren
ess
No.
19
Inci
dent
Rev
iew
& A
naly
sis
Tool
s9
87
65
43
21
23
45
67
89
Inci
dent
Han
dlin
g D
ocum
enta
tion
No.
20
Inci
dent
Mea
sure
s9
87
65
43
21
23
45
67
89
Inci
dent
Act
ions
Gui
de
No.
21
Vis
ualiz
atio
n U
sabi
lity
98
76
54
321
23
45
67
89
Inci
dent
Rev
iew
& A
naly
sis
Tool
s
No.
22
Com
mun
icat
ion
Cap
abili
ty9
87
65
43
21
23
45
67
89
Dec
isio
n Sup
port
No.
23
Coo
rdin
atio
n Cap
abili
ty9
87
65
43
21
23
45
67
89
Inci
dent
Han
dlin
g D
ocum
enta
tion
No.
24
Inci
dent
Act
ions
Gui
de9
87
65
43
21
23
45
67
89
Inci
dent
Rev
iew
& A
naly
sis
Tool
s
No.
25
Inci
dent
Han
dlin
g D
ocum
enta
tion
98
76
54
321
23
45
67
89
Vis
ualiz
atio
n U
sabi
lity
No.
26
Vis
ualiz
atio
n U
sabi
lity
98
76
54
321
23
45
67
89
Inci
dent
Mea
sure
s
No.
27
Vis
ualiz
atio
n U
sabi
lity
98
76
54
321
23
45
67
89
Coo
rdin
atio
n Cap
abili
ty
No.
28
Inci
dent
Han
dlin
g D
ocum
enta
tion
98
76
54
321
23
45
67
89
Inci
dent
Act
ions
Gui
de
!"#$
%&'()*+
!"#$
%&'()*+
Fig
ure
F.5
:R
ankin
gIn
stru
ctio
ns
-P
age
5

248
Stu
dy P
artici
pant
ID
: __
____
__Pa
ge 2
of 5
No.
29
Inci
dent
Rev
iew
& A
naly
sis
Tool
s9
87
65
43
21
23
45
67
89
Inci
dent
Mea
sure
s
No.
30
Dec
isio
n Sup
port
98
76
54
321
23
45
67
89
Inci
dent
Han
dlin
g D
ocum
enta
tion
No.
31
Inci
dent
Rev
iew
& A
naly
sis
Tool
s9
87
65
43
21
23
45
67
89
Dec
isio
n Sup
port
No.
32
Dec
isio
n Sup
port
98
76
54
321
23
45
67
89
Inci
dent
Mea
sure
s
No.
33
Inci
dent
Mea
sure
s9
87
65
43
21
23
45
67
89
Com
mun
icat
ion
Cap
abili
ty
No.
34
Inci
dent
Han
dlin
g D
ocum
enta
tion
98
76
54
321
23
45
67
89
Inci
dent
Mea
sure
s
No.
35
Coo
rdin
atio
n Cap
abili
ty9
87
65
43
21
23
45
67
89
Inci
dent
Mea
sure
s
No.
36
Com
mun
icat
ion
Cap
abili
ty9
87
65
43
21
23
45
67
89
Inci
dent
Han
dlin
g D
ocum
enta
tion
Pairw
ise
Com
pariso
n Set
: In
cide
nt H
andl
ing
Aw
aren
ess
Req
uire
men
ts
No.
1Pr
ogre
ssio
n9
87
65
43
21
23
45
67
89
Rep
ort
No.
2Sta
tus
98
76
54
321
23
45
67
89
Rep
ort
No.
3Pr
ogre
ssio
n9
87
65
43
21
23
45
67
89
Sta
tus
Pairw
ise
Com
pariso
n Set
: Com
mun
icat
ion
Cap
abili
ty R
equi
rem
ents
No.
1In
tera
ctiv
e Ex
tern
al E
ntitie
s9
87
65
43
21
23
45
67
89
Inte
ract
ive
Inte
rnal
Use
rs
No.
2In
tera
ctiv
e In
tern
al U
sers
98
76
54
321
23
45
67
89
Intr
a Cor
e
No.
3In
tra
Cor
e9
87
65
43
21
23
45
67
89
Inte
ract
ive
Exte
rnal
Ent
itie
s
No.
4Pa
ssiv
e N
on-C
ore
Act
ors
98
76
54
321
23
45
67
89
Intr
a Cor
e
No.
5Pa
ssiv
e N
on-C
ore
Act
ors
98
76
54
321
23
45
67
89
Inte
ract
ive
Inte
rnal
Use
rs
No.
6In
tera
ctiv
e Ex
tern
al E
ntitie
s9
87
65
43
21
23
45
67
89
Pass
ive
Non
-Cor
e Act
ors
!"#$
%&'()*+
!"#$
%&'()*+
!"#$
%&'()*+
!"#$
%&'()*+
Fig
ure
F.6
:R
ankin
gIn
stru
ctio
ns
-P
age
6

249
Stu
dy P
artici
pant
ID
: __
____
__Pa
ge 3
of 5
Pairw
ise
Com
pariso
n Set
: Coo
rdin
atio
n Cap
abili
ty R
equi
rem
ents
No.
1Res
pons
e Rol
e M
anag
emen
t9
87
65
43
21
23
45
67
89
Tim
elin
e an
d D
epen
denc
y Aw
aren
ess
No.
2Ti
mel
ine
and
Dep
ende
ncy
Aw
aren
ess
98
76
54
321
23
45
67
89
Res
pons
e Res
ourc
e Ta
skin
g
No.
3Res
pons
e Res
ourc
e Acq
uisi
tion
98
76
54
321
23
45
67
89
Inci
dent
& R
espo
nse
Judg
men
t/D
ecis
ion
Esca
lation
N
o. 4
Res
pons
e Res
ourc
e Acq
uisi
tion
98
76
54
321
23
45
67
89
Res
pons
e Rol
e M
anag
emen
t
No.
5In
cide
nt &
Res
pons
e Ju
dgm
ent
Esca
lation
98
76
54
321
23
45
67
89
Tim
elin
e an
d D
epen
denc
y Aw
aren
ess
No.
6Res
pons
e Res
ourc
e Ta
skin
g9
87
65
43
21
23
45
67
89
Inci
dent
& R
espo
nse
Judg
men
t/D
ecis
ion
Esca
lation
No.
7Res
pons
e Rol
e M
anag
emen
t9
87
65
43
21
23
45
67
89
Inci
dent
& R
espo
nse
Judg
men
t/D
ecis
ion
Esca
lation
N
o. 8
Res
pons
e Res
ourc
e Acq
uisi
tion
98
76
54
321
23
45
67
89
Res
pons
e Res
ourc
e Ta
skin
g
No.
9Ti
mel
ine
and
Dep
ende
ncy
Aw
aren
ess
98
76
54
321
23
45
67
89
Res
pons
e Res
ourc
e Acq
uisi
tion
No.
10
Res
pons
e Res
ourc
e Ta
skin
g9
87
65
43
21
23
45
67
89
Res
pons
e Rol
e M
anag
emen
t
Pairw
ise
Com
pariso
n Set
: D
ecis
ion
Sup
port
Req
uire
men
ts
No.
1In
form
atio
n Sup
port
98
76
54
321
23
45
67
89
Judg
men
t/D
ecis
ion
Task
Aw
aren
ess
No.
2U
ncer
tain
ty S
uppo
rt9
87
65
43
21
23
45
67
89
Info
rmat
ion
Sup
port
N
o. 3
Proj
ection
98
76
54
321
23
45
67
89
Unc
erta
inty
Sup
port
N
o. 4
Info
rmat
ion
Sup
port
98
76
54
321
23
45
67
89
Proj
ection
No.
5U
ncer
tain
ty S
uppo
rt9
87
65
43
21
23
45
67
89
Judg
men
t/D
ecis
ion
Task
Aw
aren
ess
No.
6Ju
dgm
ent/
Dec
isio
n Ta
sk
Aw
aren
ess
98
76
54
321
23
45
67
89
Proj
ection
!"#$
%&'()*+
!"#$
%&'()*+
!"#$
%&'()*+
!"#$
%&'()*+
Fig
ure
F.7
:R
ankin
gIn
stru
ctio
ns
-P
age
7

250
Stu
dy P
artici
pant
ID
: __
____
__Pa
ge 4
of 5
Pairw
ise
Com
pariso
n Set
: In
cide
nt A
ctio
ns G
uide
Req
uire
men
ts
No.
1Com
plia
nce
Con
cern
s9
87
65
43
21
23
45
67
89
Out
-of-
Ban
d N
otifi
cation
N
o. 2
Polic
y an
d G
uide
lines
98
76
54
321
23
45
67
89
Com
plia
nce
Con
cern
s
No.
3In
cide
nt P
lan
Sup
port
98
76
54
321
23
45
67
89
Com
plia
nce
Con
cern
s
No.
4O
ut-o
f-Ban
d N
otifi
cation
98
76
54
321
23
45
67
89
Polic
y an
d G
uide
lines
No.
5Po
licy
and
Gui
delin
es9
87
65
43
21
23
45
67
89
Inci
dent
Pla
n Sup
port
No.
6In
cide
nt P
lan
Sup
port
98
76
54
321
23
45
67
89
Out
-of-
Ban
d N
otifi
cation
Pairw
ise
Com
pariso
n Set
: In
cide
nt M
easu
res
Req
uire
men
ts
No.
1D
irec
t In
cide
nt C
ost
98
76
54
321
23
45
67
89
Tim
e N
o. 2
Exte
nt9
87
65
43
21
23
45
67
89
Direc
t In
cide
nt C
ost
No.
3Ti
me
98
76
54
321
23
45
67
89
Exte
nt
No.
4Ex
tent
98
76
54
321
23
45
67
89
Urg
ency
No.
5U
rgen
cy9
87
65
43
21
23
45
67
89
Tim
e
No.
6D
irec
t In
cide
nt C
ost
Ris
k9
87
65
43
21
23
45
67
89
Direc
t In
cide
nt C
ost
No.
7U
rgen
cy9
87
65
43
21
23
45
67
89
Direc
t In
cide
nt C
ost
Ris
k
No.
8Ti
me
98
76
54
321
23
45
67
89
Direc
t In
cide
nt C
ost
Ris
k
No.
9D
irec
t In
cide
nt C
ost
98
76
54
321
23
45
67
89
Urg
ency
No.
10
Direc
t In
cide
nt C
ost
Ris
k9
87
65
43
21
23
45
67
89
Exte
nt
!"#$
%&'()*+
!"#$
%&'()*+
!"#$
%&'()*+
!"#$
%&'()*+
Fig
ure
F.8
:R
ankin
gIn
stru
ctio
ns
-P
age
8

251
Stu
dy P
artici
pant
ID
: __
____
__Pa
ge 5
of 5
Pairw
ise
Com
pariso
n Set
: In
cide
nt R
evie
w &
Ana
lysi
s To
ols
Req
uire
men
ts
No.
1In
cide
nt M
anag
emen
t Im
prov
emen
t9
87
65
43
21
23
45
67
89
Con
trol
Cha
nge
Eval
uation
No.
2Con
trol
Cha
nge
Eval
uation
98
76
54
321
23
45
67
89
Inst
itut
iona
l Inc
iden
t Kno
wle
dge
Man
agem
ent
No.
3In
stitut
iona
l Inc
iden
t Kno
wle
dge
Man
agem
ent
98
76
54
321
23
45
67
89
Inci
dent
Man
agem
ent
Impr
ovem
ent
No.
4Bus
ines
s Res
ilien
ce I
mpr
ovem
ent
Sup
port
98
76
54
321
23
45
67
89
Inst
itut
iona
l Inc
iden
t Kno
wle
dge
Man
agem
ent
No.
5In
cide
nt M
anag
emen
t Im
prov
emen
t9
87
65
43
21
23
45
67
89
Bus
ines
s Res
ilien
ce I
mpr
ovem
ent
Sup
port
N
o. 6
Bus
ines
s Res
ilien
ce I
mpr
ovem
ent
Sup
port
98
76
54
321
23
45
67
89
Con
trol
Cha
nge
Eval
uation
Pairw
ise
Com
pariso
n Set
: In
cide
nt H
andl
ing
Doc
umen
tation
Req
uire
men
ts
No.
1D
ecis
ion
Mak
ing
98
76
54
321
23
45
67
89
Inci
dent
Nat
ure
No.
2Res
pons
e Act
ions
98
76
54
321
23
45
67
89
Dec
isio
n M
akin
g
No.
3In
cide
nt N
atur
e9
87
65
43
21
23
45
67
89
Res
pons
e Act
ions
No.
4Res
pons
e Pl
ans
98
76
54
321
23
45
67
89
Inci
dent
Nat
ure
No.
5D
ecis
ion
Mak
ing
98
76
54
321
23
45
67
89
Res
pons
e Pl
ans
No.
6Res
pons
e Pl
ans
98
76
54
321
23
45
67
89
Res
pons
e Act
ions
Pairw
ise
Com
pariso
n Set
: Vis
ualiz
atio
n U
sabi
lity
Req
uire
men
ts
No.
1In
form
atio
n Rel
evan
ce9
87
65
43
21
23
45
67
89
Acc
essi
ble
No.
2Fu
nction
al R
elev
ance
98
76
54
321
23
45
67
89
Con
veni
ence
No.
3In
form
atio
n Rel
evan
ce9
87
65
43
21
23
45
67
89
Func
tion
al R
elev
ance
No.
4Fu
nction
al R
elev
ance
98
76
54
321
23
45
67
89
Acc
essi
ble
No.
5Acc
essi
ble
98
76
54
321
23
45
67
89
Con
veni
ence
No.
6Con
veni
ence
98
76
54
321
23
45
67
89
Info
rmat
ion
Rel
evan
ce
!"#$
%&'()*+
!"#$
%&'()*+
!"#$
%&'()*+
!"#$
%&'()*+
!"#$
%&'()*+
!"#$
%&'()*+
Fig
ure
F.9
:R
ankin
gIn
stru
ctio
ns
-P
age
9

252
APPENDIX G. ANALYTICAL HIERARCHICAL PROCESS
ANALYSIS RESULTS
This appendix contains averaged prioritization scores for the three leader roles, as
well as the composite ranking across all five contributing group members. The Kano
expectation assignment is noted above each table. Only design requirements of the same
Kano expectation are in the same table. The AHP weights are sorted in ascending order.
The last table contains the top five design requirements per their weights by leader role.

253
Tab
leG
.1:
AH
PP
rior
itiz
atio
nR
esult
s-
Exp
ect
ed
Kan
oE
xp
ecta
tion
Inci
dent
Coord
inato
rIT
Leader
Busi
ness
Leader
Overa
llR
equir
emen
tW
eigh
tR
equir
emen
tW
eigh
tR
equir
emen
tW
eigh
tR
equir
emen
tW
eigh
tD
irec
tIn
ciden
tC
ost
0.00
385
Rep
ort
0.00
545
Inst
ituti
onal
Inci
den
tK
now
ledge
Man
agem
ent
0.00
387
Inci
den
tN
ature
0.00
886
Dir
ect
Inci
den
tC
ost
Ris
k0.
0038
8C
omplian
ceC
once
rns
0.00
591
Inte
ract
ive
Exte
rnal
Enti
ties
0.00
563
Inst
ituti
onal
Inci
den
tK
now
ledge
Man
agem
ent
0.00
953
Busi
nes
sR
esilie
nce
Impro
vem
ent
Supp
ort
0.00
491
Inst
ituti
onal
Inci
den
tK
now
ledge
Man
agem
ent
0.00
686
Pas
sive
Non
-Cor
eA
ctor
s0.
0056
3P
assi
veN
on-C
ore
Act
ors
0.01
006
Chan
geC
ontr
olE
valu
atio
n0.
0051
8P
olic
yan
dG
uid
elin
es0.
0077
3E
xte
nt
0.00
607
Rep
ort
0.01
038
Inci
den
tN
ature
0.00
639
Inte
ract
ive
Exte
rnal
Enti
ties
0.00
793
Inci
den
tN
ature
0.00
809
Dir
ect
Inci
den
tC
ost
Ris
k0.
0105
3
Exte
nt
0.00
656
Pas
sive
Non
-Cor
eA
ctor
s0.
0092
1T
ime
0.00
833
Inte
ract
ive
Exte
rnal
Enti
ties
0.01
056
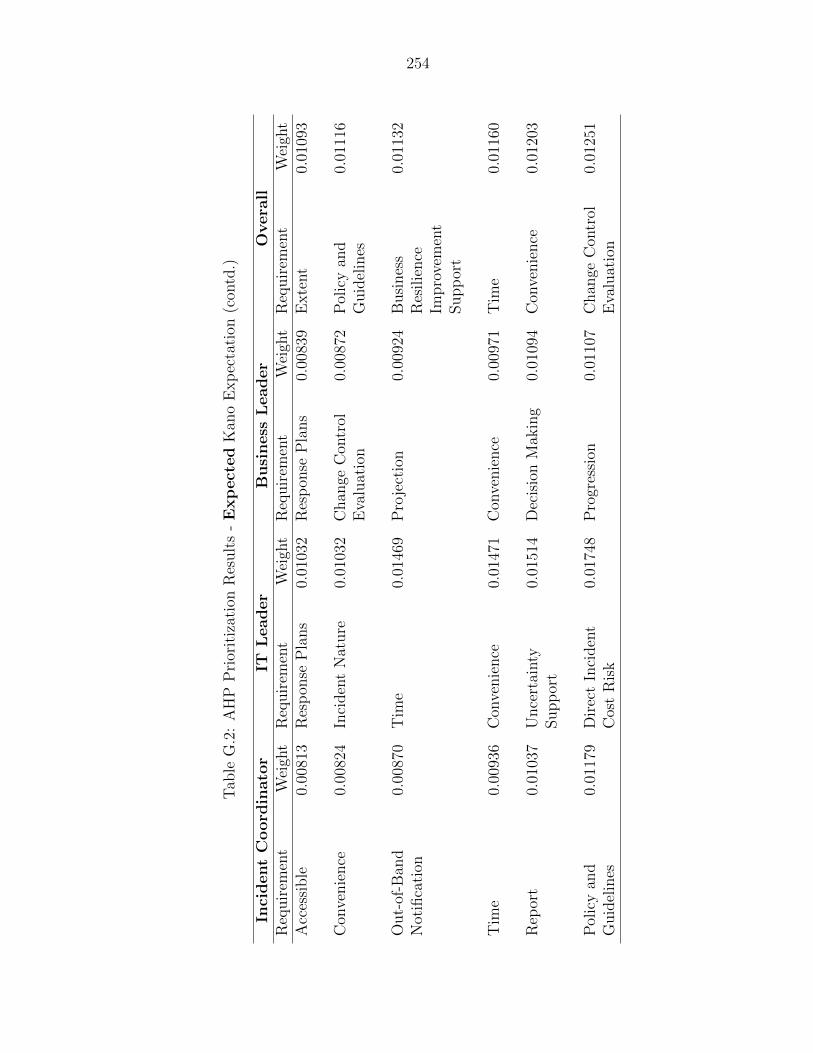
254
Tab
leG
.2:
AH
PP
rior
itiz
atio
nR
esult
s-
Exp
ect
ed
Kan
oE
xp
ecta
tion
(con
td.)
Inci
dent
Coord
inato
rIT
Leader
Busi
ness
Leader
Overa
llR
equir
emen
tW
eigh
tR
equir
emen
tW
eigh
tR
equir
emen
tW
eigh
tR
equir
emen
tW
eigh
tA
cces
sible
0.00
813
Res
pon
seP
lans
0.01
032
Res
pon
seP
lans
0.00
839
Exte
nt
0.01
093
Con
venie
nce
0.00
824
Inci
den
tN
ature
0.01
032
Chan
geC
ontr
olE
valu
atio
n0.
0087
2P
olic
yan
dG
uid
elin
es0.
0111
6
Out-
of-B
and
Not
ifica
tion
0.00
870
Tim
e0.
0146
9P
roje
ctio
n0.
0092
4B
usi
nes
sR
esilie
nce
Impro
vem
ent
Supp
ort
0.01
132
Tim
e0.
0093
6C
onve
nie
nce
0.01
471
Con
venie
nce
0.00
971
Tim
e0.
0116
0
Rep
ort
0.01
037
Unce
rtai
nty
Supp
ort
0.01
514
Dec
isio
nM
akin
g0.
0109
4C
onve
nie
nce
0.01
203
Pol
icy
and
Guid
elin
es0.
0117
9D
irec
tIn
ciden
tC
ost
Ris
k0.
0174
8P
rogr
essi
on0.
0110
7C
han
geC
ontr
olE
valu
atio
n0.
0125
1

255
Tab
leG
.3:
AH
PP
rior
itiz
atio
nR
esult
s-
Norm
al
Kan
oE
xp
ecta
tion
Inci
dent
Coord
inato
rIT
Leader
Busi
ness
Leader
Overa
llR
equir
emen
tW
eigh
tR
equir
emen
tW
eigh
tR
equir
emen
tW
eigh
tR
equir
emen
tW
eigh
tP
roje
ctio
n0.
0121
4In
tera
ctiv
eIn
tern
alU
sers
0.01
813
Busi
nes
sR
esilie
nce
Impro
vem
ent
Supp
ort
0.01
125
Res
pon
seP
lans
0.01
253
Pas
sive
Non
-Cor
eA
ctor
s0.
0130
8B
usi
nes
sR
esilie
nce
Impro
vem
ent
Supp
ort
0.01
908
Inci
den
tM
anag
emen
tIm
pro
vem
ent
0.01
343
Dir
ect
Inci
den
tC
ost
0.01
293
Urg
ency
0.01
528
Pro
gres
sion
0.01
939
Pol
icy
and
Guid
elin
es0.
0149
0A
cces
sible
0.01
544
Res
pon
seP
lans
0.01
573
Exte
nt
0.01
991
Unce
rtai
nty
Supp
ort
0.01
518
Com
plian
ceC
once
rns
0.01
664
Inst
ituti
onal
Inci
den
tK
now
ledge
Man
agem
ent
0.01
588
Info
rmat
ion
Rel
evan
ce0.
0206
4C
omplian
ceC
once
rns
0.01
559
Dec
isio
nM
akin
g0.
0191
0

256
Tab
leG
.4:
AH
PP
rior
itiz
atio
nR
esult
s-
Norm
al
Kan
oE
xp
ecta
tion
(con
td.)
Inci
dent
Coord
inato
rIT
Leader
Busi
ness
Leader
Overa
llR
equir
emen
tW
eigh
tR
equir
emen
tW
eigh
tR
equir
emen
tW
eigh
tR
equir
emen
tW
eigh
tIn
ciden
tM
anag
emen
tIm
pro
vem
ent
0.01
643
Dec
isio
nM
akin
g0.
0206
5A
cces
sible
0.01
635
Pro
ject
ion
0.01
925
Inte
ract
ive
Exte
rnal
Enti
ties
0.01
645
Res
pon
seA
ctio
ns
0.02
065
Res
pon
seA
ctio
ns
0.01
780
Urg
ency
0.01
943
Dec
isio
nM
akin
g0.
0199
6U
rgen
cy0.
0213
0U
rgen
cy0.
0180
7O
ut-
of-B
and
Not
ifica
tion
0.02
158
Judgm
ent/
Dec
isio
nT
ask
Aw
aren
ess
0.02
172
Acc
essi
ble
0.02
203
Dir
ect
Inci
den
tC
ost
Ris
k0.
0187
7R
esp
onse
Act
ions
0.02
203
Info
rmat
ion
Rel
evan
ce0.
0224
5Sta
tus
0.02
299
Funct
ional
Rel
evan
ce0.
0187
7In
ciden
tM
anag
emen
tIm
pro
vem
ent
0.02
430
Res
pon
seA
ctio
ns
0.02
284
Dir
ect
Inci
den
tC
ost
0.02
536
Res
pon
seR
esou
rce
Tas
kin
g0.
0219
4P
rogr
essi
on0.
0251
4
Res
pon
seR
esou
rce
Acq
uis
itio
n
0.02
451
Funct
ional
Rel
evan
ce0.
0261
3D
irec
tIn
ciden
tC
ost
0.02
720
Info
rmat
ion
Rel
evan
ce0.
0251
6

257
Tab
leG
.5:
AH
PP
rior
itiz
atio
nR
esult
s-
Exci
ting
Kan
oE
xp
ecta
tion
Inci
dent
Coord
inato
rIT
Leader
Busi
ness
Leader
Overa
llR
equir
emen
tW
eigh
tR
equir
emen
tW
eigh
tR
equir
emen
tW
eigh
tR
equir
emen
tW
eigh
tR
esp
onse
Rol
eM
anag
emen
t0.
0307
0C
han
geC
ontr
olE
valu
atio
n0.
0275
9R
esp
onse
Res
ourc
eA
cquis
itio
n
0.02
842
Unce
rtai
nty
Supp
ort
0.02
526
Inci
den
tP
lan
Supp
ort
0.03
145
Res
pon
seR
ole
Man
agem
ent
0.02
930
Rep
ort
0.02
964
Funct
ional
Rel
evan
ce0.
0334
2
Com
plian
ceC
once
rns
0.04
042
Inci
den
tM
anag
emen
tIm
pro
vem
ent
0.03
509
Judgm
ent/
Dec
isio
nT
ask
Aw
aren
ess
0.03
222
Inte
ract
ive
Inte
rnal
Use
rs0.
0336
6
Pro
gres
sion
0.04
355
Pro
ject
ion
0.03
576
Info
rmat
ion
Rel
evan
ce0.
0339
4In
ciden
tP
lan
Supp
ort
0.03
723
Inci
den
t&
Res
pon
seJudgm
ent/
Dec
isio
nE
scal
atio
n
0.04
399
Out-
of-B
and
Not
ifica
tion
0.03
619
Out-
of-B
and
Not
ifica
tion
0.03
444
Judgm
ent/
Dec
isio
nT
ask
Aw
aren
ess
0.03
753
Unce
rtai
nty
Supp
ort
0.04
451
Inci
den
tP
lan
Supp
ort
0.03
646
Inte
ract
ive
Inte
rnal
Use
rs0.
0353
3R
esp
onse
Rol
eM
anag
emen
t0.
0378
6
Sta
tus
0.04
889
Tim
elin
ean
dD
epen
den
cyA
war
enes
s
0.04
112
Inci
den
tP
lan
Supp
ort
0.03
699
Res
pon
seR
esou
rce
Acq
uis
itio
n
0.04
221

258
Tab
leG
.6:
AH
PP
rior
itiz
atio
nR
esult
s-
Exci
ting
Kan
oE
xp
ecta
tion
(con
td.)
Inci
dent
Coord
inato
rIT
Leader
Busi
ness
Leader
Overa
llR
equir
emen
tW
eigh
tR
equir
emen
tW
eigh
tR
equir
emen
tW
eigh
tR
equir
emen
tW
eigh
tF
unct
ional
Rel
evan
ce0.
0499
1In
form
atio
nsu
pp
ort
0.05
171
Info
rmat
ion
supp
ort
0.04
621
Sta
tus
0.04
370
Inte
ract
ive
Inte
rnal
Use
rs0.
0547
8Judgm
ent/
Dec
isio
nT
ask
Aw
aren
ess
0.05
590
Res
pon
seR
ole
Man
agem
ent
0.05
224
Res
pon
seR
esou
rce
Tas
kin
g0.
0603
5
Res
pon
seR
esou
rce
Tas
kin
g0.
0560
9In
ciden
t&
Res
pon
seJudgm
ent/
Dec
isio
nE
scal
atio
n
0.05
877
Tim
elin
ean
dD
epen
den
cyA
war
enes
s
0.07
808
Inci
den
t&
Res
pon
seJudgm
ent/
Dec
isio
nE
scal
atio
n
0.06
656
Tim
elin
ean
dD
epen
den
cyA
war
enes
s
0.07
685
Res
pon
seR
esou
rce
Acq
uis
itio
n
0.06
427
Intr
aC
ore
0.08
324
Tim
elin
ean
dD
epen
den
cyA
war
enes
s
0.06
719
Intr
aC
ore
0.08
168
Intr
aC
ore
0.06
734
Sta
tus
0.09
921
Info
rmat
ion
supp
ort
0.07
055
Info
rmat
ion
supp
ort
0.09
337
Res
pon
seR
esou
rce
Tas
kin
g0.
0784
9In
ciden
t&
Res
pon
seJudgm
ent/
Dec
isio
nE
scal
atio
n
0.10
511
Intr
aC
ore
0.08
147

259
APPENDIX H. REQUIREMENTS RANKING
COMPARISON VISUALS
As mentioned in the discussion of Stage O (Section 3.2.13), the 70% ranking was
chosen to determine which requirements to emphasize. The first figure (Figure H.1) shows
both requirement levels. In the foreground are the nine highest-level requirements. The
various pie charts indicate the percentages of related second-level requirements present
in a particular region. The pie wedges have various colors in order to indicate how
many second-level requirements were descendants of a particular high-level requirement.
The darkest color is associated with a high-level requirement having three second-level
requirements. The next darkest color wedge indicates that the high-level requirement has
four second-level requirements. The lightest color wedge indicates the presence of five
second-level requirements for the associated high-level requirement. A bolded high-level
requirement label indicates that all related second-level requirements met the ranking
threshold, and that these second-level requirements are located within one of the other
leader role regions.
The second figure (Figure H.2) is focused on the second-level requirements. Due to the
density of placed objects, it was necessary to reference the second-level requirements by
their number-letter code. The number following the requirements label is the percentage
threshold relevant to the object’s placement within the figure. Second-level requirement
placement has been done for the 65%, 70%, 75% and 80% thresholds. As a visual aid,
requirement objects highlighted in yellow are those associated with the 70% ranking
threshold. The bolded labels indicate threshold agreement with the “Overall Leader”

260
ranking computed by averaging all group member ranking inputs for a requirement. For
example, the second-level requirement 4.A (Response Resource Acquisition) meets the
65% threshold for the IT Leader as well as the 65% threshold of the Overall Leader after
combining all ranking input for that requirement. The rays are intended to point out
changes in agreement as the threshold increases. Where space permitted, if a requirement
did not change in agreement, then the object for that threshold was placed horizontally
from the previous instance of that requirement. The border around an object indicates
whether the requirement was visible or directly apparent to the user. A user may find
some requirements that influence software characteristics (i.e. borderless requirement
objects) difficult to identify because they are either diffused, emergent, foundational, or
systems interfaces that were not user-accessible through the visualization interface.
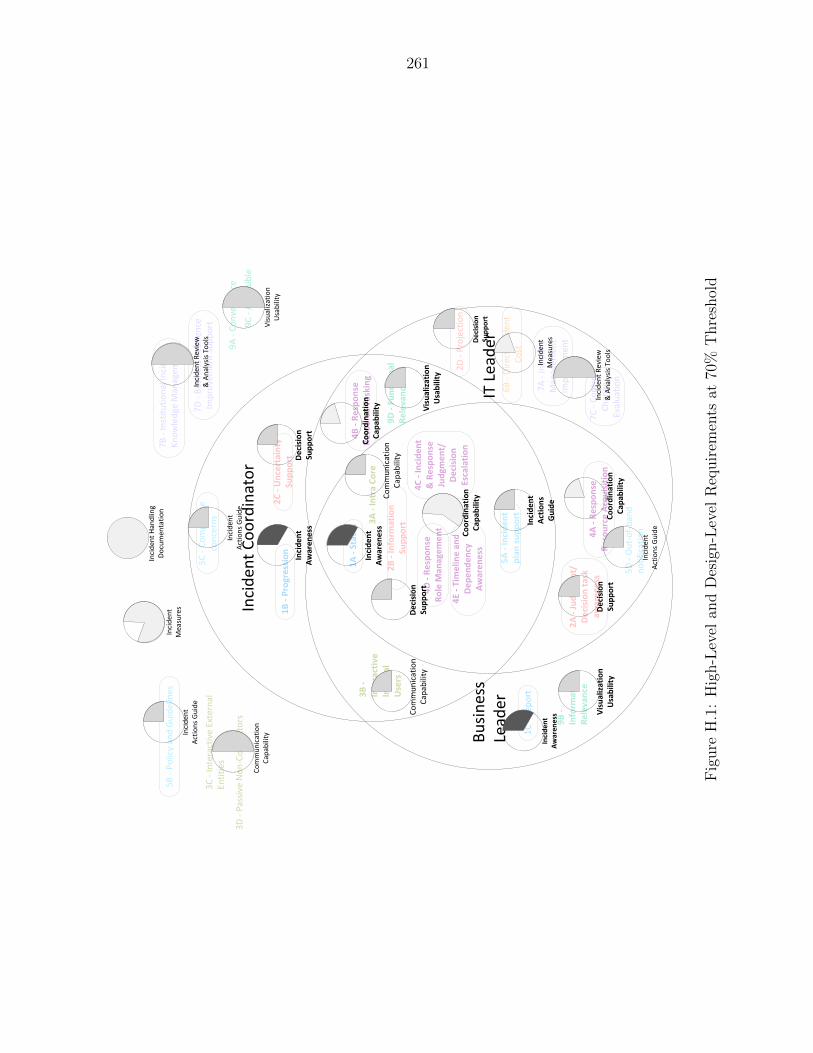
261
9D -
Func
tiona
l Re
leva
nce
4C -
Inci
dent
&
Res
pons
e Ju
dgm
ent/
Deci
sion
Es
cala
tion
5A -
Inci
dent
pl
an su
ppor
t
9B -
Info
rmat
ion
Rele
vanc
e
2B -
Info
rmat
ion
Supp
ort3A
- In
tra
Core
2A -
Judg
men
t/
Deci
sion
task
aw
aren
ess
4A -
Resp
onse
Re
sour
ce A
cqui
sitio
n
4B -
Resp
onse
Re
sour
ce T
aski
ng
4D -
Resp
onse
Ro
le M
anag
emen
t
1A -
Stat
us
4E -
Tim
elin
e an
d De
pend
ency
Aw
aren
ess
3B -
Inte
ract
ive
Inte
rnal
U
sers
5D -
Out
-of-b
and
notif
icat
ion
6B -
Dire
ct In
cide
nt
Cost
7A -
Inci
dent
M
anag
emen
t Im
prov
emen
t
1B -
Prog
ress
ion
2D -
Proj
ectio
n
2C -
Unc
erta
inty
Su
ppor
t
9C -
Acce
ssib
le
7C -
Cont
rol
Chan
ge
Eval
uatio
n
5C -
Com
plia
nce
conc
erns
1C -
Repo
rt
3C -
Inte
ract
ive
Exte
rnal
En
titie
s
3D -
Pass
ive
Non
-Cor
e Ac
tors
5B -
Polic
y an
d Gu
idel
ines
9A -
Conv
enie
nce
7B -
Inst
itutio
nal I
ncid
ent
Know
ledg
e M
anag
emen
t
7D -
Busin
ess R
esili
ence
Im
prov
emen
t Sup
port
Inci
dent
Coo
rdin
ator
Busin
ess
Lead
erIT
Lea
der
359.
9
Inci
dent
Han
dlin
g Do
cum
enta
tion
Inci
dent
M
easu
res
Inci
dent
M
easu
res
Inci
dent
Rev
iew
&
Ana
lysis
Too
ls
Inci
dent
Rev
iew
&
Ana
lysis
Too
ls
Visu
aliza
tion
Usa
bilit
y
Visu
aliz
atio
n U
sabi
lity
Visu
aliz
atio
n U
sabi
lity
Coor
dina
tion
Capa
bilit
y
Coor
dina
tion
Capa
bilit
y
Coor
dina
tion
Capa
bilit
y
Deci
sion
Su
ppor
t
Deci
sion
Su
ppor
t
Deci
sion
Su
ppor
t
Deci
sion
Su
ppor
t
Inci
dent
Ac
tions
Gui
de
Inci
dent
Ac
tions
Gui
de
Inci
dent
Ac
tions
Gu
ide
Inci
dent
Ac
tions
Gui
de
Com
mun
icat
ion
Capa
bilit
y
Com
mun
icat
ion
Capa
bilit
y
Com
mun
icat
ion
Capa
bilit
y
Inci
dent
Aw
aren
ess
Inci
dent
Aw
aren
ess
Inci
dent
Aw
aren
ess
Fig
ure
H.1
:H
igh-L
evel
and
Des
ign-L
evel
Req
uir
emen
tsat
70%
Thre
shol
d

262
Inci
dent
Coo
rdin
ator
Busin
ess
Lead
er
2D_8
02D
_75
2D_7
0
IT L
eade
r
6A_8
0
9D_8
04C_8
0
5A_8
0
9B_8
02B_8
0
3A_8
0
2A_8
04A
_80
4B_8
0
4D_8
0
1A_8
0
4E_8
0
3B_8
0
5D_8
0
8B_8
0
6E_8
0
8A_8
0
6B_8
0
7A_8
0
1B_8
0
2C_8
0
9C_8
07C_8
0
5C_8
0
6C_8
0
1C_8
0
3C_8
0
3D_8
0
5B_8
0
6D_8
0
9A_8
0
8D_8
0
8C_8
0
7B_8
0
7D_8
0
6A_7
5
9D_7
5
4C_7
5
5A_7
5
9B_7
5
2B_7
5 3A_7
5
2A_7
5
4A_7
5
4B_7
5
4D_7
5
1A_7
5
4E_7
5
3B_7
5
5D_7
5
8B_7
5
6E_7
5
8A_7
56B
_75
7A_7
5
1B_7
5
2C_7
5
9C_7
57C_7
5
5C_7
5
6C_7
5
1C_7
5
3C_7
5
3D_7
5
5B_7
5
6D_7
5
9A_7
5
8D_7
5
8C_7
5
7B_7
5
7D_7
5
6A_7
0
9D_7
0
4C_7
0
5A_7
0
9B_7
0
2B_7
0 3A_7
0
2A_7
04A
_70
4B_7
0 4D_7
0
1A_7
0
4E_7
0
3B_7
0
5D_7
0
8B_7
0
6E_7
0
8A_7
06B
_70
7A_7
0
1B_7
0
2C_7
0
9C_7
0
7C_7
0
5C_7
0
6C_7
0
1C_7
0
3C_7
0
3D_7
0
5B_7
0
6D_7
0
9A_7
0
8D_7
0
8C_7
0
7B_7
0
7D_7
0
6A_6
5
9D_6
5
4C_6
5
5A_6
5
9B_6
5
2B_6
5
3A_6
5
2A_6
5
4A_6
5
4B_6
5
4D_6
5
1A_6
5
4E_6
5
3B_6
5
5D_6
5
8B _
65
6E_6
5
8A_6
5
6B_6
5
7A_6
5
1B_6
5
2D_6
5
2C_6
5
9C_6
5
7C_6
5
5C_6
5
6C_6
5
1C_6
5
3C_6
5
3D_6
5
5B_6
5
6D_6
5
9A_6
5
8D_6
5
8C_6
5
7B_6
5
7D_6
5
Fig
ure
H.2
:P
rogr
essi
onof
Pre
fere
nce
over
Thre
shol
ds

263
APPENDIX I. REQUIREMENT PRIORITY
INTERPRETATION
This appendix contains the requirements handling plan that resulted from the re-
quirements prioritization interpretation discussed in Stage N (Section 3.2.12).
Notation Explanations
• All indicates that the requirement fell within the specified cutoff for the Overall
user group.
• The two-letter abbreviations in the Inclusion Status column represent leader roles:
– “IT” is short for “IT Leader”
– “IC” is short for “Incident Coordinator”
– “BL”is short for “Business Leader”
• Bolded requirement labels indicate they are visible requirements.
• The Comment field contains the phrase “Non-visible context requirement.” This
phrase means that the requirement would not manifest itself as a specific feature or
screen element, but would be relevant to the use-case and content present during
the evaluation.

264
Table I.1: Requirements Prioritization Interpretation
High-LevelRequirement
DesignRequirement
Inclusion Status Comment
IncidentHandlingAwareness
1.A Status All with equalemphasis by role
Within 70% pref-erence threshold
1.B Progression All with IC emphasis Within 70% pref-erence threshold
1.C Report BL Within 70% pref-erence threshold
Decision Support
2.A Judgment/Decision TaskAwareness
All with BL & ITemphases
Within 70% pref-erence threshold
2.B InformationSupport
All with equalemphasis by role
Within 70% pref-erence threshold
2.C UncertaintySupport
All with IC emphasis Within 70% pref-erence threshold
2.D Projection IT Within 70% pref-erence threshold
CommunicationCapability
3.A Intra Core All Within 70% pref-erence threshold.Non-visible con-text requirement
3.B InteractiveInternal Users
All with IC & BLemphasis
Within 70% pref-erence threshold.Non-visible con-text requirement
3.C InteractiveExternal Entities
OUT
3.D PassiveNon-Core Actors
OUT

265
Table I.2: Requirements Prioritization Interpretation (contd.)
High-LevelRequirement
DesignRequirement
Inclusion Status Comment
CoordinationCapability
4.A ResponseResourceAcquisition
All with BL & ITemphases
Within 70% pref-erence threshold
4.B ResponseResource Tasking
All with IC & ITemphases
Within 70% pref-erence threshold
4.C Incident &ResponseJudgment/DecisionEscalation
All with equalemphasis by role
Within 70% pref-erence threshold
4.D ResponseRole Management
All with equalemphasis by role
Within 70% pref-erence threshold
4.E Timeline andDependencyAwareness
All with equalemphasis by role
Within 70% pref-erence threshold
Incident ActionsGuide
5.A Incident PlanSupport
All with equalemphasis by role
Within 70% pref-erence threshold
5.B Policy andGuidelines
OUT
5.C ComplianceConcerns
IC Within 70% pref-erence threshold.Not clear if lack ofpreference weightis indicative ofreality for otherroles.
5.D Out-of-bandnotification
BL & IT Within 70% pref-erence threshold.Non-visible con-text requirement

266
Table I.3: Requirements Prioritization Interpretation (contd.)
High-LevelRequirement
DesignRequirement
Inclusion Status Comment
IncidentMeasures
6.A Time All with equalemphasis by role
Dependency &necessary require-ment
6.B DirectIncident Cost
All with emphasiswith IT
Dependency &necessary require-ment
6.C DirectIncident Cost Risk
All with equalemphasis by role
Dependency &necessary require-ment
6.D Extent All with equalemphasis by role
Dependency &necessary require-ment
6.E Urgency All with equalemphasis by role
Dependency &necessary require-ment. Steadilygains priority withhigher cutoffs

267
Table I.4: Requirements Prioritization Interpretation (contd.)
High-LevelRequirement
DesignRequirement
Inclusion Status Comment
Incident Review& Analysis Tools
7.A IncidentManagementImprovement
IT Within 70% pref-erence threshold.Unclear whetherevaluation con-straints will allowan “after-action”scenario extension
7.B InstitutionalIncident KnowledgeManagement
OUT
” 7.C ControlChangeEvaluation
IT Within 70% pref-erence threshold.Unclear whetherevaluation con-straints will allowan “after-action”scenario extension
7.D BusinessResilienceImprovementSupport
OUT
IncidentHandlingDocumentation
8.A Decision Making All Non-visible con-text requirement& dependency for7.A and 7.C
8.B ResponseActions
All Non-visible con-text requirement& dependency for7.A and 7.C

268
Table I.5: Requirements Prioritization Interpretation (contd.)
High-LevelRequirement
DesignRequirement
Inclusion Status Comment
IncidentHandlingDocumentation
8.C Response Plans All Non-visible con-text requirement& dependency for7.A and 7.C
8.D Incident Nature All Non-visible con-text requirement& dependency for7.A and 7.C
VisualizationUsability
9.A Convenience All with equalemphasis by role
Non-visible con-text requirement& necessaryrequirement
9.B InformationRelevance
All with emphasiswith BL
Within 70% pref-erence threshold.System behaviorrequirement
9.C Accessible All with equalemphasis by role
Non-visible con-text requirement& necessaryrequirement
9.D FunctionalRelevance
All with emphasiswith IC & IT
Within 70% pref-erence threshold.System behaviorrequirement

269
APPENDIX J. HIGH-LEVEL DESIGN OF EVALUATION
ACTIVITY AND SCREEN SEQUENCING
Figure J.1 describes one possible sequence of tasks and evaluation objectives consid-
ered for the allotted 20-minute period. This task sequencing was used to ensure that
an evaluator experienced the features related to the “highly preferred” requirements in
the requirement prioritization that took place in Stage N (Section 3.2.12). This timeline
approach helped with determining the number, complexity, sequencing and objectives of
the evaluation tasks. Although the objective of this research was to introduce general
visualization concepts for IT incident management, it was necessary that the tangible
implementation of the research findings (i.e. the prototype) be developed with strict
focus on the actual validation use-case.

270
2 4 6 8 10 12 14 16 18 20min
2 4 6 8 10 12 14 16 18 20min
Overall
Business Leader
Achieve a 4th and final objective (Obj 5) of the situational
objectives
Recognize the value or contribution leader-oriented
visualization with rich business context like this could have
Establish a level of comfort with the prototype (navigation,look & feel, limited functionality) & evaluation environment
Establish a level of comfort with the situational context (time lapse, nature of the incident)
Achieve a minor situational objective (Obj 1) and build self-confidence
Establish a positive semi-conscience impression of the prototype
Achieve a significant situational objective (Obj 2) and experience a central or common role based requirement
Achieve a 2nd significant situational objective (Obj 3) and experience a 1st role prioritized
requirement
Achieve a 3rd significant situational objective (Obj 4)and experience a 2nd central or common role based requirement
Recognize the part they play in the broader scheme of
incident handling
Recognize where to find out what they
should be doing
Arrive at a sense of closure with the situation
Recognize the significance of the incident
Recognize the part they play in the broader scheme of
incident handling
Recognize where to find out what they should be
doing
Recognize the significance of the incident
5: Perform a task that involves response role management and incident & response judgment/
decision escalation
1: A simple task of reading an incident status report and determining who &
what is affected within a personal scope of responsibilities
2: Review the incident response and determine when incident closure can be expected and communicate with affected users regarding the incident and response
3: Identify an assigned judgment/decision task and perform it using information support and
incident details
4: Perform a task involving timeline and dependency awareness and response resource acquisition
Observe the situation has ended, final summary of incident & response and their contribution – A
Report
3 Min1 Min4 Min 2 Min 4 Min
Observations:2: Assumption is that the incident response plan was selected & approved prior to this task5: This task should involve decision makingPer the high level task analysis this timeline is reasonable. Tasks 4,5 are not represented in the task analysis, but task analysis has holes.
2 4 6 8 10 12 14 16 18 20minIT Leader
2 4 6 8 10 12 14 16 18 20minIncident Coordinator
Recognize the part they play in the broader scheme of
incident handling
Recognize where to find out what they should be
doing
Recognize the significance of the incident
5: Perform a task that involves timeline and dependency awareness as well as incident &
response judgment/decision escalation & assessing cost1:A simple task that requires awareness of the
affected systems, urgency, current level of staffing and projected cost, affected business
unit(s) & processes
2: A task that involves incident plan support
and response role management
3: A task that involves resource acquisition and response resource
tasking
4: Identify and perform a judgment/decision task using incident details and information support as well as timeline and dependency awareness
Observe the situation has ended, final summary of incident & response and their contribution – A
Report
Recognize the part they play in the broader scheme of
incident handling
Recognize where to find out what they should be
doing
Recognize the significance of the incident
6: Task of assessing whether the incident can be placed in
the closed state
1: A simple task of assessing the affected systems, initial compliance & security concerns, urgency, extent and
initial systems
2: A task that requires the use of incident plan selection, customization and plan approval request & response role management
4: task that involves information support, incident & response judgment/decision
escalation
5: Task that involves information support,
timeline and dependency
awareness and communications
capability
Observe the situation has ended, final summary of incident & response and their contribution – A
Report
3: A task that requires use of timeline and dependency awareness, response resource
tasking, response resource acquisition
1 Min 3 Min 2 Min 4 Min 4 Min
1 Min
3 Min 3 Min 2 Min 2 Min3 Min
Observations:2: Assumes the response plan has been selected and approved prior to this task4. Need a practice-consistent reason for this task if I.C. has been calling the shots up to now.
Observations:Viz prototype will need to provide expedited feedback in order for the user to proceed to the next tasks.Make sure to elapse the scenario clock appropriately
Figure J.1: Evaluation Task Sequencing Timeline

271
Figure J.2 was one of two screen patterns developed for the high-level design and was
presented to the Study Group members. The other pattern was a slight modification
made possible by consolidating screens such as the “Personalized Incident Summary” and
“Personalized Response Summary.” The number in the top right corner was the screen’s
numeric label. This allowed for easier tracking between the hand-drawn sketches and
this overall navigation blueprint. The numbers were unique across all three patterns.
Cases in which the screens’ labels across patterns are the same indicate that a particular
screen was in large part being reused. In some cases, role-specific presentations were
suggested as substitute elements within a screen. The dim screen objects within the
Incident Coordinator pattern were presented for the purpose of completeness, but there
was no intention to implement this navigation sub-pattern for the evaluation.

272
Incident Details Screens (3?)Incident Details Screens (3?)
Business Leader
Log In
Grand Summary
Personalized Incident Summary
Personalized Response Summary
Response Role Management
Judgment/Decision Task Interface
Incident Details Screens (3?)
Detailed Task Escalation Interface
Information Support Center
Incident Details Screens (3?)Incident Details Screens (3?)Information Support Details
(3?)
Timeline and Dependency Awareness
Evaluation Task Interface? Communications Capability Interface
Incident Closure Report
Navigation Pattern 1:
1
2
3
4
4.14.2
4.3
712
5
6
3.13.2
3.3
8
9
10
11
Incident Assessment & Response Center
IT Leader
Log In
Grand Summary
Incident Details Screens (3?)Incident Details Screens (3?)
Personalized Incident Summary
Personalized Response Summary
Response Role Management
Incident Details Screens (3?)
Information Support Center
Incident Details Screens (3?)Incident Details Screens (3?)Information Support Details
(3?)
Timeline and Dependency Awareness
Evaluation Task Interface? Judgment/Decision Task Interface
Response Resource Tasking
Detailed Task Escalation Interface
Incident Closure Report
Navigation Pattern 1:
1
2
3
4
4.14.2
4.3
12
5
6
3.13.2
3.3
8
9
10
11
14
13
Incident Coordinator
Log In
Evaluation Task Interface?
Incident Assessment & Response Center
Information Support Center
Incident Details Screens (3?)Incident Details Screens (3?)Information Support Details
(3?)
Incident Details Screens (3?)Incident Details Screens (3?) Timeline and Dependency
Awareness
Judgment/Decision Task Interface
Response Resource Tasking
Incident Details Screens (3?)
Personalized Response Summary View as seen by
others
Incident Response Planning
Response Resource Acquistion
Response Role Management
Detailed Escalation Interface
Communications Capability Interface
Incident Closure Report
Grand Summary
Personalized Incident Summary View as seen by
others
1
2
4 4.14.2
4.3
12
6
13.113.2
13.3
8
9
11
13
7
16
15
14
17
Navigation Pattern 1:
Figure J.2: Possible Screen Flow

273
APPENDIX K. CALL FOR PARTICIPATION
The document below was sent through professional mailing lists as well as to people
interested in supporting the research effort. The actual locations have been stripped from
the document to ensure the privacy of both the hosts and the participants. However,
the locations listed were in the Des Moines, Iowa metropolitan area.

274
Revision: 20120926 Page 1 of 2
I NFORMATION A SSURANCE C ENTER
Come Evaluate IT Visualization Research The Information Assurance Center (IAC) of Iowa State University is pleased to announce the opportunity to learn about and evaluate research in visualization of IT incidents. This public evaluation is conducted as part of a research project being performed by the IAC. For this research, an IT incident is an event that affects the integrity, confidentiality and/or availability of information and information systems. These events have sufficient impact or risk that they merit collaboration of leadership personnel beyond the workgroup. A research team of the IAC has been developing an IT Incident Visualization System in cooperation with IT professionals in the Greater Des Moines metropolitan area. This work is approaching a key milestone at which a prototype needs to be evaluated by a broader IT professional audience before proceeding to the next stage of research and development. IAC is looking for IT professionals who are IT leaders. Personnel management experience is not necessary. A qualified person should have direct IT incident response involvement for at least one IT incident. Finally, a qualified person will have experience with evaluating business risks associated with an IT incident. Multiple evaluation events will be conducted at various locations in the Greater Des Moines metropolitan area. Each event will have limited number of seats available. Please connect to http://www.iac.iastate.edu/content/outreach/ipe to obtain a free ticket. If you have problems with online registration or questions regarding registration please write to [email protected]. The only cost is your time and energy. An evaluator will attend one evaluation event that will last approximately 75 minutes. All aspects of these evaluation events are absolutely voluntary. You may withdraw at anytime or refuse to answer any question. Data collected from your participation will be anonymous. The online registration will collect identifiable information for facility security purposes. Contact information will allow us to provide you with event updates. Registration records will not be used beyond these purposes.
Figure K.1: Call for Participation - Page 1

275
Revision: 20120926 Page 2 of 2
I NFORMATION A SSURANCE C ENTER
Below, you will find the start times and locations for these events. Multiple events have been scheduled at each location. Additional times and locations may be scheduled between October 22 and November 16, 2012 if interest merits. Please check with the [email protected] for potential additions to the schedule. Location Date and Room Information Start Times Location 1 Wednesday, October 24, 2012
Room: Conference Center 4
10:00 AM 1:00 PM
Location 2 Thursday, November 1, 2012 Room: A Level, Conference Room 7
10:00 AM 1:00 PM
Location 3 Thursday, November 8, 2012 Room: 3041
11:00 AM 1:00 PM
Any questions regarding these events should be directed to:
Mark Tannian [email protected] 515.494.1014
Doug Jacobson [email protected] 515.294.8307
Thank you for you time and consideration. We look forward to seeing you at one of these events. Dr. Doug Jacobson Information Assurance Center, Director Iowa State University
Figure K.2: Call for Participation - Page 2
276
APPENDIX L. EVALUATION ENVIRONMENT STATE
MACHINES
Two state machines were developed to facilitate the “Choose Your Own Adventure”
evaluation experience. One state machine was developed to accommodate changes to
the narrative content as task choices were made. The second state machine gave the
evaluator flexibility to pick an evaluation task to perform.
The labeling within the state machine diagrams consists of a prefix for the state
machine to which the state belonged, followed by either a number or number-letter
combination. The significance of the number portion of the label is common across the
two state machines and represents the evaluation task within the sequence; the letters
were a means of uniquely labeling the alternatives.
Evaluation task 2 provided the evaluator an option to pick a task to perform. The
task state machine branched out to accommodate that task selection when the evaluator
transitioned to task 3. As the objective was to ensure that each evaluator experienced
a similar set of task experiences, task 3 was a means to normalize the experience across
evaluators.
Each evaluation task choice option was given a label to facilitate the narrative state
transitions. One can see that not all choices resulted in a relative divergence in narrative
state. Each narrative state consisted of numerous IT incident indicators and response
status attributes. The state machine was kept relatively simple in order to avoid narrative
content design complexity and complications. Each letter assigned in the number-letter
pairs within the narrative state machine tracked with the label assigned to each choice

277
in the software. The label “A” was assigned to a choice considered the best choice. The
label “B” was assigned to a choice considered satisfactory. The label “C” was assigned
to the worst choice among the three presented in tasks 1 – 5.

278
Nar
rati
ve S
tate
Dia
gram
Eval
uat
ion
Tas
k St
ate
Dia
gram
Eval
uat
ion
Exp
erie
nce
Sta
te
Tran
siti
on
Dia
gram
sTa
sk P
lan
: Seq
uen
ce 1
BR
evis
ion
: 20
11
10
03
NS_
0
TS_0
NS_
1N
S_2
NS_
6A
NS_
6B
NS_
6C
NS_
6D
NS_
6E
NS_
5A
NS_
5B
NS_
5C
NS_
4A
NS_
4B
NS_
4C
NS_
3A
NS_
3B
NS_
3C
Bes
t
Go
od
Ave
rage
Wo
rst
Fair
Ou
tco
me
Task
ou
tco
me
has
n
ot
affe
ct o
n t
he
nar
rati
ve
Task
sel
ecti
on
af
fect
s n
arra
tive
fl
ow
TS_1
TS_2
TS_3
A
TS_3
B
TS_3
C
TS_4
TS_5
TS_6
Task
ou
tco
me
has
n
o c
on
seq
uen
ce o
n
nar
rati
ve
Dec
isio
n c
ho
ices
will
be
easi
er t
o
just
ify
bas
ed o
n n
arra
tive
co
nte
xt.
Ch
oic
es w
ill a
ffec
t th
e o
ngo
ing
nar
rati
ve.
Dec
isio
n c
ho
ices
will
be
easi
er t
o
just
ify
bas
ed o
n n
arra
tive
co
nte
xt.
Ch
oic
es w
ill a
ffec
t th
e o
utc
om
e o
f th
e in
cid
ent.
Task
sel
ecti
on
af
fect
s w
hat
th
e n
ext
task
will
be.
Fig
ure
L.1
:E
valu
atio
nE
nvir
onm
ent
Sta
teM
achin
es

279
APPENDIX M. EVALUATION TASKS
In the table below, the “Task Descriptions” and “Task Choices” listed are those the
evaluators worked with during the evaluation events. The text surrounded by square
brackets within the Task Description field is a placeholder for the actual button the user
could select to set the prototype to the screen indicated by the text.
The “Quality Assessment” listed next to each task choice is the assessed quality of
the decision used to influence the narrative outcome of the IT incident. The activity
log showed these values in the form of “Choice X,” where“X” is a placeholder for the
assessed quality. This same convention was used to indicate the task selected in the
first part of Task 2, but in this case the letters “A,” “B” or “C”simply denote the task
selected and do not indicate an assessed quality for the task chosen. The order in which
the task choices have been listed is consistent with the choice order presented to the
evaluators.

280
Table M.1: Evaluation Tasks
TaskID
Task Description Task Choices
1 Orientation:You are starting with the [Grand Summary] visible.You will see a number of incidents are active. Asmentioned in the briefing, an incident has beenopened for systems that your team is responsiblefor maintaining.
Instructions:Select the incident to which you have been assignedand review the incident details on the [IncidentSummary].
Select one of Task Choices (just to the right) afterfinding the following incident details:A) the primary affected system,B) the name of the Incident Coordinator,C) the current cumulative direct costs,D) urgency level,E) current state of the incident.
A) OrderPortal1, B)Matthew Rich, C)$15,179, D) 3, E) Plan-ningQuality Assessment = B
A) OrderPortal1, B)Matthew Rich, C)$7,621, D) 3, E) Assess-mentQuality Assessment = A
A) IAAuth1, B) KevinNelson, C) $7,621, D) 3,E) AssessmentQuality Assessment = C

281
Table M.2: Evaluation Tasks (contd.)
TaskID
Task Description Task Choices
2 Orientation: As you can see on [ResponseSummary] , the urgency for this incident haschanged. The response plan for this incidenthas several response tasks assigned to you.There is a collection of tasks of concern(1501, 1502, 1503). These tasks are related tofacilitating response efforts during the currentAssessment phase.
Your fictional character has been addressing1501, 1502 and 1503 since you logged in. Youidentified 3 possible actions to take. Thisevaluation task starts with you selecting oneof those actions.
There will be no negative consequencefor picking any of these actions. EvaluationTask 3 will cover the two actions you did notselect here.
Instructions:Select one of three pending actions associatedwith tasks 1501 and 1503 in Task Choices(just to the right).
This Task Description window will update af-ter you select the response action to perform.
Approve resource requestLogging Label = A
Request an additional re-sourceLogging Label = B
Manage task completion tar-dinessLogging Label = C

282
Table M.3: Evaluation Tasks (contd.)
TaskID
Task Description Task Choices
2A Action Selected: Approve resource request
Orientation:Besides you, the Incident Coordinator isworking on expediting response efforts. Re-cent cost and productivity loss containmentpolicy has introduced the need for leadershipto approve resources assigned to incidentresponse. A resource acquisition request,RAR-0015, has been opened for an additionalsystem administrator from your team.
Approve the request by assigning the personyou feel is the best choice for response needmentioned in RAR-0015.
Instructions:You can see the mechanics of request approvalon the Approve sub-screen of [ResponseResource Acquisition] .
Completing this Evaluation Task is a matterof selecting a name from the list in TaskChoices (just to your right).
You might want to do a “By Skill” lookup ofemployees in the Human Resources section ofthe [Information Support Center] to help makeyour choice.
Steve Roy with restrictionson availabilityQuality Assessment = A
Chris Tuttle with restric-tions on availabilityQuality Assessment = B
Leo Campbell with restric-tions on availabilityQuality Assessment = C

283
Table M.4: Evaluation Tasks (contd.)
TaskID
Task Description Task Choices
2B Action Selected: Request an additionalresource
Orientation:Several upcoming tasks (1240, 1320, 1420)have not been staffed. Currently there is noone on the team who can perform these tasksdue to the skills required.
This Evaluation Task is matter of identifyingthe response role this additional resourcewould likely have to satisfy the needs of thesetasks. Ideally you could request this resourceto be available throughout the incidentresponse timeframe. However, if you hadto limit their involvement what availabilitytimeframe would you specify?
The resourcing issues associated with 1240,1320 and 1420 can be seen on [Timeline &Dependency Awareness] and a bit differ-ently on [Response Summary] Graphical Viewsub-screen or on [Response Resource Tasking].
Instructions:In preparation for making a resource request,select from the Task Choices (just to theright) one of the possible pairs of needed roleand availability time frame for the missingresource you are requesting.
Beyond the screens previously mentioned, youmight find a “By Skills” lookup in the HumanResources section of the [Information SupportCenter] screen helpful to see how the neededskills align with skill groups.
Server Administrator avail-able from 16:00 - 19:00todayQuality Assessment = C
Business Leader availablefrom 16:00 - 19:00 todayQuality Assessment = B
Business Analyst availablefrom 16:00 - 20:00 todayQuality Assessment = A

284
Table M.5: Evaluation Tasks (contd.)
TaskID
Task Description Task Choices
2C Action Selected: Manage task completiontardiness
Orientation:Although task ID 1110 is not in the criticalpath, it clearly is important to resolving thisincident. If this task delays much longer itwill be in the critical path.
An additional resource billet has been openedfor skills not previously allocated to thistask. This billet was opened with hopes theseskills will pick up the pace on completing 1110.
This Evaluation Task is for you to assign anappropriate acquired resource to the task.
Instructions:You can see on [Timeline & DependencyAwareness] or on the [Response ResourceTasking] screen that the task ID 1110 is likelyto be late in completion.
Make your assignment by selecting a personfrom the Task Choices list (just to the right).
Note: A “By Skill” search in the HumanResources section of the [Information Sup-port Center] and [Response Role Management]screen may be helpful in choosing from the 3people listed.
John ChangQuality Assessment = A
Evaluation User (That’sYou)Quality Assessment = C
Kevin NelsonQuality Assessment = B

285
Table M.6: Evaluation Tasks (contd.)
TaskID
Task Description Task Choices
3A Orientation:No definitive cause for the problems relatedto OrderPortal1 has been found. Troubles arebeing reported on OrderMgmt1.
Response procedure requires that secondarysystems be inspected.
IAAuth1 is a crucial secondary system respon-sible for authentication and authorization.
Instructions:This task has 2 parts.Part 1: When you look at the response planin the Graphical View sub-screen of the[Response Summary], a recently added taskof ID 1130: “Investigate IAAuth1” requiresresources. Click on “Initiate Request” buttonin Task Choices (just to the right) and watcha request process tutorial.
Part 2: While that request is being processedby a different person, go to [Response Re-source Tasking] to see who you would directto function as an available network admin. tolook at IAAuth1’s network infrastructure fortask ID 1130. Pick a person listed in Part 2(just to the right) you think will meet this needfor task 1130.
Part 1:[Initiate Request]
Part 2:Zhao ShiQuality Assessment = A
Evaluation User (That’sYou)Quality Assessment = C
Kevin NelsonQuality Assessment = B

286
Table M.7: Evaluation Tasks (contd.)
TaskID
Task Description Task Choices
3B Orientation:With no definitive cause for the problems re-lated to OrderPortal1 identified and troublesbeing reported on OrderMgmt1, the responsepolicy requires that secondary systems beinspected.
IAAuth1 is a crucial secondary system respon-sible for authentication and authorization.IAAuth1 is based on CA SiteMinder.
Zhao Shi has been approved to inspect theauthentication and entitlement service.
Instructions:This task has 2 parts.
Part 1: Since Zhao Shi is a new memberof the team, a response role needs to beassigned. One way to determine the role thatshould be assigned is to go to [Response RoleManagement]Go to the “Manage Roles” sub-screen tosee the role management interface. SelectResponse Member role category and hoverover the three roles mentioned in Task Choices(just to the right). Decide what role to assignand indicate your choice in Task Choices Part1.
Part 2: Now that Zhao has a role. You need toassign Zhao the task of executing the inspec-tion of IAAuth1 by going to [Response Re-source Tasking]. Identify the appropriate taskID and indicate your choice of task ID in TaskChoices Part 2 (just to the right).
Part 1:Application Security Con-trols SpecialistQuality Assessment = A
Customer ApplicationsDeveloperQuality Assessment = C
Network AdministratorQuality Assessment = B
Part 2:Task ID 1110Quality Assessment = C
Task ID 1311Quality Assessment = B
Task ID 1130Quality Assessment = A

287
Table M.8: Evaluation Tasks (contd.)
TaskID
Task Description Task Choices
3C Orientation:No definitive cause for the problems relatedto OrderPortal1 has been found. Troubles arebeing reported on OrderMgmt1.
Response procedure requires that secondarysystems be inspected.
IAAuth1 is a crucial secondary systemresponsible for authentication and authoriza-tion.
Instructions:This task has 2 parts.Part 1: Looking at the response plan in theGraphical View sub-screen of the [ResponseSummary], you will see a recently added taskof ID 1130: “Investigate IAAuth1” requiresresources. Click on “Initiate Request” buttonin Task Choices (just to the right) and watcha request process tutorial.
Part 2: Your request has been instantly ap-proved. Zhao Shi has been approved to inspectthe authentication and entitlement services(IAAuth1) based on CA SiteMinder. Havingjust been approved, Zhao does not have a roleassigned for this response effort. You need toassign him the role you feel is most appropri-ate given he is going to be assigned to task ID1130 to investigate the CA SiteMinder imple-mentation. In order to determine which roleto assign Zhao, you may find looking at theGraphical View of the [Response Summary]useful. Another screen that can assist youis the [Response Resource Tasking] screen. Ifyou were to actually manage Zhao’s role as-signment, you would go to the Manage Rolessub-screen of the [Response Resource Tasking]screen.
Part 1:[Initiate Request]
Part 2:Customer ApplicationsDeveloperQuality Assessment = C
Network AdministratorQuality Assessment = B
Application Security Con-trols SpecialistQuality Assessment = A

288
Table M.9: Evaluation Tasks (contd.)
TaskID
Task Description Task Choices
4 Orientation:
Response team members assigned to taskID 1130 have been working on isolatingthe issue within IAAuth1. After inspectingconfiguration files, operational statistics andlog entries, the team feels it is necessaryto restart the router module of the switchF-RTR-SEC0X. The ACL caches may becorrupted.
The task of approving the timing of therestart is your decision. By going to the[Judgment & Decision Interface] screen yousee the judgment & decision entry for task ID1130. There are mechanisms that allow youto transfer this decision to someone else, butyou are going to make the call.
Instructions:Go to the [Judgment & Decision Interface]screen and pull up the entry for task ID 1130to see the available details. Your decisionoptions are listed in Task Choices (just to theright). The request as prepared essentiallyasks for an immediate restart. However, youcan choose to approve a delayed restart. Partof the justification for your decision is thecurrent urgency of the incident. You can seeon the [Urgency Details] screen various con-tributing factors into the urgency calculation.The referenced change management recordcan be seen in the Change Managementmodule of [Information Support] screen.
[Note: In an actual incident management set-ting, the task relationships and resourcingchallenges presented on [Timeline & Depen-dencies] screen may also contribute to your de-cision and related justification.
Immediate module restartafter notice release. Furtherdelay is unacceptable forthe given urgency level.Urgency = 3 or 5Quality Assessment = BUrgency = 7Quality Assessment = A
Provide immediate warn-ing and restart in 1 hour.Urgency justifies minimaldelay that is necessary forstakeholders to prepare forservice loss of OrderPortal1and OrderMgmt1.Urgency = 3 or 5Quality Assessment = AUrgency = 7Quality Assessment = B
Provide immediate warningand restart at 20:00 CST(start of light system loadperiod). Urgency does notjustify a more immediaterestart. OrderPortal1 andOrderMgmt1 users arestruggling but there arevalid transactions beingcompleted.Quality Assessment = C
Note: The assessed qual-ity was narrative-sensitive.Depending on the urgencyvalue for the state of the nar-rative, the assessed qualitymay have changed.

289
Table M.10: Evaluation Tasks (contd.)
TaskID
Task Description Task Choices
5 Orientation:The router module (F-RTR-SEC0X) restart fromthe last Evaluation Task had little long termimpact on the problem being experienced withOrderPortal1 and OrderMgmt1.
Although the specific cause for IAAuth1’s inconsis-tent behavior has not been pinned down, it is clearthat OrderPortal1 and OrderMgmt1 performancehas been negatively affected by their reliance onIAAuth1 for authentication and authorization.
The Assessment phase is nearing the end. Theincident scoping activities during the 1200 seriestasks and judgments up to this point have pointedto no additional incident scope creep beyond the3 systems already mentioned. It is time for theincident to be characterized in order to set thetone for the remainder of the incident. There arethree characterizations of Operational, Security andCompliance. Each of which will affect the policies,procedures, personnel and communications thatapply to this incident.
Instructions:When looking at the [Judgment Decision Interface]screen and retrieving the judgment task 1781, youhave been asked to participate in the process of char-acterizing this incident. This judgment is ultimatelythe IT Director’s. The judgment task record you seeon the [Judgment Decision Interface] screen showsthe list of people contributing to the judgment. Theinformation security lead has offered his opinion. Itis now up to you to pass on your characterizationof this incident. In Task Choice (just to the right),you will see 3 possible responses. Choose one andclick on “Commit Choice.”
Simply an operationalincident. Someoneapplied or made anill-advised configurationchange within IAAuth1.Quality Assessment = A
Could be a securityincident. Someone mayhave rooted the PolicyServer and is throttlingauthentication and au-thorization responses.Quality Assessment = C
Contractual complianceissue. Customers havenegotiated a quality ofservice for systems Or-derPortal1 and Order-Mgmt1.Quality Assessment = B
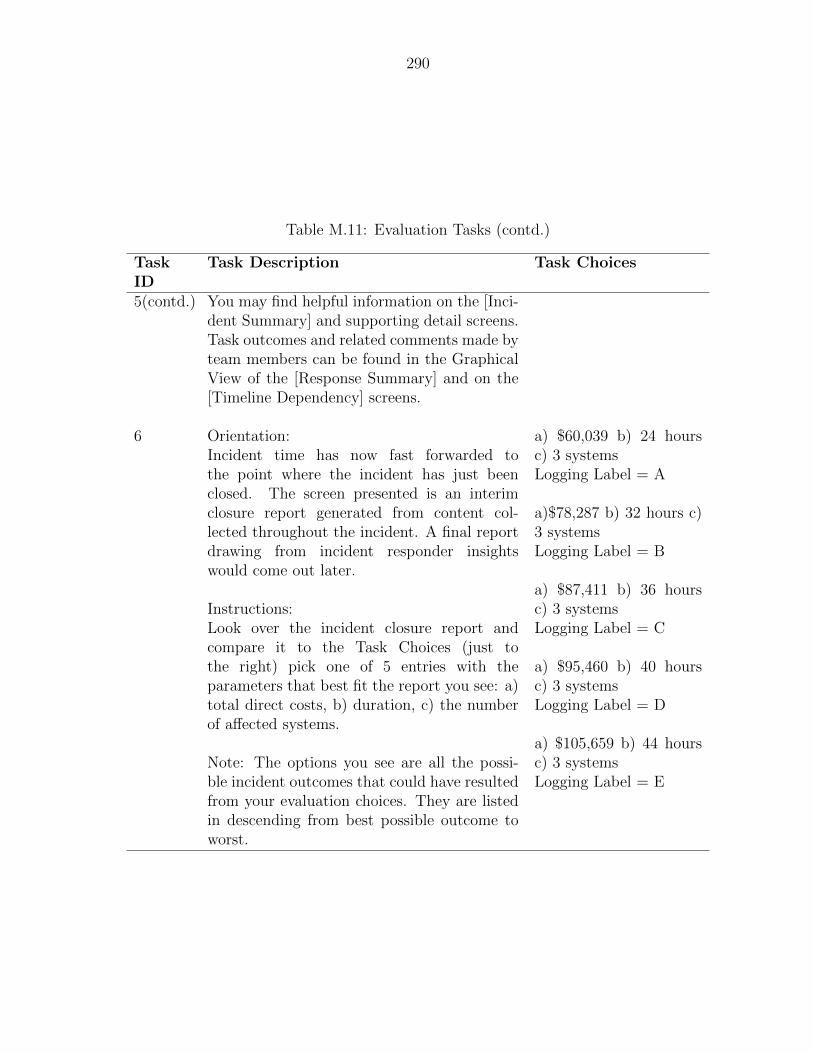
290
Table M.11: Evaluation Tasks (contd.)
TaskID
Task Description Task Choices
5(contd.) You may find helpful information on the [Inci-dent Summary] and supporting detail screens.Task outcomes and related comments made byteam members can be found in the GraphicalView of the [Response Summary] and on the[Timeline Dependency] screens.
6 Orientation:Incident time has now fast forwarded tothe point where the incident has just beenclosed. The screen presented is an interimclosure report generated from content col-lected throughout the incident. A final reportdrawing from incident responder insightswould come out later.
Instructions:Look over the incident closure report andcompare it to the Task Choices (just tothe right) pick one of 5 entries with theparameters that best fit the report you see: a)total direct costs, b) duration, c) the numberof affected systems.
Note: The options you see are all the possi-ble incident outcomes that could have resultedfrom your evaluation choices. They are listedin descending from best possible outcome toworst.
a) $60,039 b) 24 hoursc) 3 systemsLogging Label = A
a)$78,287 b) 32 hours c)3 systemsLogging Label = B
a) $87,411 b) 36 hoursc) 3 systemsLogging Label = C
a) $95,460 b) 40 hoursc) 3 systemsLogging Label = D
a) $105,659 b) 44 hoursc) 3 systemsLogging Label = E

291
APPENDIX N. RECONCILIATION OF ACTIVITIES
The field study methodology described in Chapter 3 used research activity terminol-
ogy not consistent with the documentation submitted to the IRB for review and approval.
Moreover, the quantity of activities does not align between this document and the IRB
documentation. This was in large part due to hindsight. Greater clarity was achieved
by looking back at what was accomplished as opposed to referring to previous planning
terminology, thus providing more informative documentation.

292
Table N.1: Comparison of Activities
Chapter 3 Activities IRB Proposal Activities CommentsA. Define Problem andUser Group
1. Define Problem andUser Group
Chapter 3 and the IRBproposed activities align.
B. Understanding theNeed
2. Understanding theNeed/Verifying theProblem Exists
Chapter 3 and the IRBproposed activities align.Label for Chapter 3 isonly simplified.
C. Analysis ofVisualization Needs
This Chapter 3 activitywas added to clarify theneed for post-processing of“B.”
D. Develop a Catalog ofNeeds
This Chapter 3 activitywas added to clarify theadditional post-processingneeded for “B.”
E. Prioritizing the Needs This Chapter 3 activitywas added as a followupactivity with the StudyGroup. The variety andlack of overlap expressedin “B” necessitated a callfor confirmation andprioritization.

293
Table N.2: Comparison of Activities (contd.)
Chapter 3 Activities IRB Proposal Activities CommentsF. Analysis of NeedPriorities
This Chapter 3 activitywas added to clarify theneed for post-processing ofthe feedback elicited in“E.”
G. Need/Task Selection 3. Select a Task from theTask Pool Collected forPrototyping / PreliminaryExam
Chapter 3 and the IRBproposed activities align.Label for Chapter 3 isonly simplified.
H. Understanding SelectedTask
4. Develop DeeperUnderstanding of SelectedTasks
Chapter 3 and the IRBproposed activities align.Label for Chapter 3 isonly simplified.
5. Identify AppropriateTheoretical Foundationsfrom Relevant Fields
This IRB proposedactivity is not referencedin Chapter 3, since thisacademic activity issomewhat obvious andhad no distinct endpoint.
I. Analysis of TaskExploration
This Chapter 3 activitywas added to clarify theneed for this type ofpost-processing of H.
J. Identify Actors &Dynamics
This Chapter 3 activitywas added to clarify theneed for this type ofpost-processing of H.
K. Identify Requirements This Chapter 3 activitywas added to clarify theneed for this type ofpost-processing of H.

294
Table N.3: Comparison of Activities (contd.)
Chapter 3 Activities IRB Proposal Activities CommentsL. Review & InfluenceRequirements &Understanding
This followup activity wasnecessary to verify thatwhat was learned from theprevious analysis stepswas reasonable andrelevant across the StudyGroup. Requirementsdevelopment wasnecessary for upcomingdesign activities. Therequirements were basedon the synthesis ofliterature and taskunderstanding. It wasnecessary for the StudyGroup to agree torequirement definitionsand their merit, as well asto influence theircomposition.
N. Prioritize Requirements This followup activity wasnecessary for upcomingdesign activities. It isimpossible to give eachrequirement equal weightin the design.
O. Interpret RequirementPriorities
This Chapter 3 activitywas added to clarify theneed for this type ofpost-processing of O.
P. Develop High-LevelDesigns
6. Develop DesignAlternatives
Chapter 3 and the IRBproposed activities align.Label for Chapter 3 isonly slightly modified forthe purposes of clarity.

295
Table N.4: Comparison of Activities (contd.)
Chapter 3 Activities IRB Proposal Activities CommentsQ. Review High-LevelDesigns
7. Design AlternativesReview
Chapter 3 and the IRBproposed activities align.Label for Chapter 3 isonly slightly modified forthe purposes of clarity.
R. Analyze Design Review This Chapter 3 activitywas added to clarify theneed for this type ofpost-processing of “Q.”
S. Develop VisualizationPrototype
8. Medium-fidelityPrototyping
Chapter 3 and the IRBproposed activities align.Label for Chapter 3 ismodified only slightly forthe purposes of clarity.
T. Review VisualizationPrototype
9. Medium-fidelityPrototype Evaluation
Chapter 3 and the IRBproposed activities align.Label for Chapter 3 ismodified only slightly forthe purposes of clarity.
U. Adjust Prototype 10. Prototype andevaluation experiencemodification per feedbackcollected in step 9
Chapter 3 and the IRBproposed activities align.Label for Chapter 3 isonly simplified.
V. Industry PublicEvaluation
11. Industry PrototypeEvaluation
Chapter 3 and the IRBproposed activities align.
12. Dissertation/ Design& Evaluation Report
This IRB proposal activityis not listed in Chapter 3.This document is theexecution of this activity.
13. Final/ Presentation ofDesign & Evaluationresults, Self-assessmentand Future Work
This IRB proposalactivity is not listed inChapter 3. The final oralexam will be the executionof this activity.

296
BIBLIOGRAPHY
[1] K. Scarfone, T. Grance, and K. Masone, “Computer security incident handlingguide,” National Institute of Standards and Technology, Tech. Rep. Publ. 800-61Rev. 1, 2008.
[2] R. Richardson, “2010/11 csi computer crime and security survey,” Computer Se-curity Institute, Tech. Rep., 2010.
[3] Verizon, “2012 data breach investigations report,” Verizon, Online paper, 2012.
[4] T. Keller and S.-O. Tergan, “Visualizing knowledge and information: an introduc-tion,” in Knowledge and Information Visualization, S.-O. Tergan and T. Keller,Eds., ser. Lecture Notes in Computer Science. Springer Berlin Heidelberg, 2005,vol. 3426, ch. 1, pp. 1–23.
[5] C. Ware, “Visual queries: the foundation of visual thinking,” in Knowledge andInformation Visualization, S.-O. Tergan and T. Keller, Eds., ser. Lecture Notes inComputer Science. Springer Berlin Heidelberg, 2005, vol. 3426, ch. 2, pp. 27–35.
[6] J. Novak and M. Wurst, “Collaborative knowledge visualization for cross-communitylearning,” in Knowledge and Information Visualization, S.-O. Tergan and T. Keller,Eds., ser. Lecture Notes in Computer Science. Springer Berlin Heidelberg, 2005,vol. 3426, ch. 6, pp. 95–116.
[7] P. Ren, “Ensuring the continuing success of vizsec,” in Proceedings of the 3rd Inter-national Workshop on Visualization for Computer Security, ACM, 2006, pp. 67–70.
[8] F. Fischer, F. Mansmann, D. A. Keim, S. Pietzko, and M. Waldvogel, “Large-scale network monitoring for visual analysis of attacks,” in Proceedings of the 5thInternational Workshop on Visualization for Computer Security, Springer-Verlag,2008, pp. 111–118.
[9] P. Hertzog, “Visualizations to improve reactivity towards security incidents insidecorporate networks,” in Proceedings of the 3rd International Workshop on Visual-ization for Computer Security, ACM, 2006, pp. 95–102.
[10] T. J. Jankun-Kelly, D. Wilson, A. S. Stamps, J. Franck, J. Carver, and J. E.Swan, “A visual analytic framework for exploring relationships in textual contentsof digital forensics evidence,” in 6th International Workshop on Visualization forCyber Security, 2009. VizSec 2009, IEEE, 2009, pp. 39–44.

297
[11] R. F. Erbacher, “Visualization design for immediate high-level situational assess-ment,” in Proceedings of the Ninth International Symposium on Visualization forCyber Security, ACM, 2012, pp. 17–24.
[12] C. Horn and A. D’Amico, “Visual analysis of goal-directed network defense de-cisions,” in Proceedings of the 8th International Symposium on Visualization forCyber Security, ACM, 2011, pp. 1–6.
[13] J. Rasmussen, K. Ehrlich, S. Ross, S. Kirk, D. Gruen, and J. Patterson, “Nimble cy-bersecurity incident management through visualization and defensible recommen-dations,” in Proceedings of the Seventh International Symposium on Visualizationfor Cyber Security, ACM, 2010, pp. 102–113.
[14] G. Conti, “Countering network-level denial of information attacks using informa-tion visualization,” Ph.D. dissertation, 2006.
[15] A. DAmico and K. Whitley, “The real work of computer network defense analysts,”in VizSEC 2007: Proceedings of the Workshop on Visualization for Computer Se-curity. Springer-Verlag, 2008, pp. 19–37.
[16] J. R. Goodall, W. G. Lutters, and A. Komlodi, “The work of intrusion detection:rethinking the role of security analysts,” in AMCIS, vol. Proceedings of the TenthAmericas Conference on Information Systems, 2004, pp. 21–28.
[17] A. Komlodi, J. R. Goodall, and W. G. Lutters, “An information visualizationframework for intrusion detection,” in CHI ’04 Extended Abstracts on Human Fac-tors in Computing Systems, ACM, 2004, pp. 1743–1746.
[18] A. Komlodi, P. Rheingans, A. Utkarsha, J. R. Goodall, and J. Amit, “A user-centered look at glyph-based security visualization,” in Visualization for ComputerSecurity, 2005. (VizSEC 05). IEEE Workshop on, 2005, pp. 21–28.
[19] G. A. Fink, C. L. North, A. Endert, and S. Rose, “Visualizing cyber security: usableworkspaces,” in 6th International Workshop on Visualization for Cyber Security,2009. VizSec 2009, IEEE, 2009, pp. 45–56.
[20] S. Foresti and J. Agutter, “Visalert: from idea to product,” in VizSEC 2007: Pro-ceedings of the Workshop on Visualization for Computer Security. Springer-Verlag,2008, pp. 159–174.
[21] S. Foresti, J. Agutter, Y. Livnat, S. Moon, and R. Erbacher, “Visual correlation ofnetwork alerts,” Computer Graphics and Applications, IEEE, vol. 26, no. 2, pp. 48–59, 2006.
[22] Y. Livnat, J. Agutter, M. Shaun, and S. Foresti, “Visual correlation for situationalawareness,” in Information Visualization, 2005. INFOVIS 2005. IEEE Symposiumon, 2005, pp. 95–102.
[23] R. F. Erbacher, D. A. Frincke, P. Chung Wong, S. Moody, and G. Fink, “A multi-phase network situational awareness cognitive task analysis,” Information Visual-ization, vol. 9, no. 3, pp. 204–219, 2010.

298
[24] J. Guenther, F. Volk, and M. Shaneck, “Proposing a multi-touch interface for in-trusion detection environments,” in Proceedings of the Seventh International Sym-posium on Visualization for Cyber Security, ACM, 2010, pp. 13–21.
[25] J. R. Goodall, “Visualization is better! a comparative evaluation,” in 6th Inter-national Workshop on Visualization for Cyber Security, 2009. VizSec 2009, IEEE,2009, pp. 57–68.
[26] A. Dix, Human-computer interaction, 3rd. Harlow, England ; New York: Pearson/Prentice-Hall, 2004, xxv, 834 p.
[27] J. Stoll, D. McColgin, M. Gregory, V. Crow, and W. K. Edwards, “Adaptingpersonas for use in security visualization design,” in VizSEC 2007: Proceedings ofthe Workshop on Visualization for Computer Security, J. R. Goodall, G. Conti,and K.-L. Ma, Eds. Berlin: Springer-Verlag, 2008, pp. 39–52.
[28] K. T. Ulrich and S. D. Eppinger, Product design and development, 2nd. Boston:Irwin/McGraw-Hill, 2000, xxvi, 358 p.
[29] G. A. Klein, R. Calderwood, and D. MacGregor, “Critical decision method foreliciting knowledge,” Systems, Man and Cybernetics, IEEE Transactions on, vol.19, no. 3, pp. 462–472, 1989.
[30] L. G. Militello and R. J. B. Hutton, “Applied cognitive task analysis (acta): apractitioner’s toolkit for understanding cognitive task demands,” Ergonomics, vol.41, no. 11, pp. 1618–1641, 1998.
[31] J. Pfautz and E. Roth, “Using cognitive engineering for system design and evalua-tion: a visualization aid for stability and support operations,” International Journalof Industrial Ergonomics, vol. 36, no. 5, pp. 389–407, 2006.
[32] B. Crandall, G. A. Klein, and R. R. Hoffman, Working Minds : A Practitioner’sGuide to Cognitive Task Analysis. Cambridge, Mass.: MIT Press, 2006, xii, 332 p.
[33] P. Beatty, “The dynamics of cognitive interviewing,” in Methods for Testing andEvaluating Survey Questionnaires, S. Presser, J. M. Rothgeb, M. P. Couper, J. T.Lessler, E. Martin, J. Martin, and E. Singer, Eds. Hoboken, NJ: John Wiley &Sons, 2004, ch. 3, pp. 45 –66.
[34] F. G. Conrad and J. Blair, “Data quality in cognitive interviews: the case of verbalreports,” in Methods for Testing and Evaluating Survey Questionnaires, S. Presser,J. M. Rothgeb, M. P. Couper, J. T. Lessler, E. Martin, J. Martin, and E. Singer,Eds. Hoboken, NJ: John Wiley & Sons, 2004, ch. 4, pp. 67 –87.
[35] T. J. DeMaio and L. Ashley, “Do different cognitive interview techniques producedifferent results?” In Methods for Testing and Evaluating Survey Questionnaires,S. Presser, J. M. Rothgeb, M. P. Couper, J. T. Lessler, E. Martin, J. Martin, andE. Singer, Eds. Hoboken, NJ: John Wiley & Sons, 2004, ch. 5, pp. 89 –108.
[36] T. J. DeMaio and J. M. Rothgeb, “Cognitive interviewing techniques: in the laband in the field,” in Answering Questions : Methodology for Determining Cognitiveand Communicative Processes in Survey Research, N. Schwarz and S. Sudman,Eds. San Francisco: Jossey-Bass Publishers, 1996, ch. 8, pp. 177 –195.

299
[37] D. A. Dillman and C. D. Redline, “Testing paper self-administered questionnaires:cognitive interview and field test comparisons,” in Methods for Testing and Evalu-ating Survey Questionnaires, S. Presser, J. M. Rothgeb, M. P. Couper, J. T. Lessler,E. Martin, J. Martin, and E. Singer, Eds. Hoboken, NJ: John Wiley & Sons, 2004,ch. 15, pp. 299 –317.
[38] D. A. Dillman, J. D. Smyth, and L. M. Christian, Internet, Mail, and Mixed-ModeSurveys: The Tailored Design Method, 3rd. Hoboken, N.J.: Wiley & Sons, 2009.
[39] S. Presser, Methods for Testing and Evaluating Survey Questionnaires, ser. Wileyseries in survey methodology. Hoboken, NJ: John Wiley & Sons, 2004, xvi, 606 p.
[40] T. L. Saaty, The Analytic Hierarchy Process : Planning, Priority Setting, ResourceAllocation. New York ; London: McGraw-Hill International Book Co., 1980, xiii,287 p.
[41] J. Karlsson, “Software requirements prioritizing,” in Requirements Engineering,1996., Proceedings of the Second International Conference on, IEEE, 1996, pp. 110–116.
[42] J. Karlsson and K. Ryan, “Supporting the selection of software requirements,”in Software Specification and Design, 1996., Proceedings of the 8th InternationalWorkshop on, IEEE, 1996, pp. 146–149.
[43] D. Diaper and C. Sanger, “Tasks for and tasks in human-computer interaction,”Interacting with Computers, vol. 18, no. 1, pp. 117–138, 2006.
[44] D. Diaper, “Scenarios and task analysis,” Interacting with Computers, vol. 14, no.4, pp. 379–395, 2002.
[45] M. Polanyi, The tacit dimension, 1st, ser. Terry lectures. Garden City, N.Y.: Dou-bleday & Company, 1966, xi, 108 p.
[46] J. D. Novak and A. J. Canas, “The theory underlying concept maps and how toconstruct and use them,” Florida Institute for Human and Machine Cognition,Tech. Rep. Technical Report IHMC CmapTools 2006-01 Rev 01-2008, 2008.
[47] A. D’Amico and M. Kocka, “Information assurance visualizations for specific stagesof situational awareness and intended uses: lessons learned,” in Visualization forComputer Security, 2005. (VizSEC 05). IEEE Workshop on, IEEE, 2005, pp. 107–112.
[48] W. A. Pike, C. Scherrer, and S. Zabriskie, “Putting security in context: visualcorrelation of network activity with real-world information,” in VizSEC 2007: Pro-ceedings of the Workshop on Visualization for Computer Security. Springer-Verlag,2008, pp. 203–220.
[49] P. E. Green and V. Srinivasan, “Conjoint analysis in marketing: new developmentswith implications for research and practice,” The Journal of Marketing, vol. 54,no. 4, pp. 3–19, 1990.
[50] R. Zultner, “Qfd and designing software,” in The QFD Handbook, J. B. ReVelle,J. W. Moran, and C. A. Cox, Eds. New York: Wiley, 1998, ch. 11, pp. 163–184.

300
[51] D. A. Norman, The Design of Everyday Things. New York: Basic Books, 1988, xi,257 p.
[52] H. Sharp, Y. Rogers, and J. Preece, Interaction Design: Beyond Human-ComputerInteraction, 2nd. Chichester ; Hoboken, NJ: Wiley, 2007, xxvi, 773 p.
[53] C. Swinehart. (2009). One book, many readings, [Online]. Available: http://
samizdat.cc/cyoa/ (visited on 12/12/2012).
[54] B. King, Better designs in half the time : implementing QFD quality functiondeployment in America, 3rd. Methuen, MA: GOAL/QPC, 1989.
[55] J. Terninko, Step-by-step QFD : customer-driven product design, 2nd. Boca Raton,Fla.: St. Lucie Press, 1997, vii, 224 p.
[56] B. Forsyth, J. M. Rothgeb, and G. B. Willis, “Does pretesting make a difference? anexperimental test,” in Methods for Testing and Evaluating Survey Questionnaires,S. Presser, J. M. Rothgeb, M. P. Couper, J. T. Lessler, E. Martin, J. Martin, andE. Singer, Eds. Hoboken, NJ: John Wiley & Sons, 2004, ch. 25, pp. 525 –546.
[57] L. McGarthwaite, “Bion: a novel interface for biological network visualization,”Thesis, 2008.
[58] S. K. Card, J. D. Mackinlay, and B. Shneiderman, Readings in Information Vi-sualization: Using Vision to Think, ser. Morgan Kaufmann series in interactivetechnologies. San Francisco: Morgan Kaufmann Publishers, 1999.
[59] E. Brewster, R. Griffiths, A. Lawes, and J. Sansbury, IT Service Management - Aguide for ITIL Foundation Exam candidates (ePub Version), 2nd Edition. Swindon,United Kingdom: British Informatics Society Limited, 2012, p. 240.
[60] I. G. Institute, “Cobit 4.1,” IT Governance Institute, Tech. Rep., 2007, p. 213.
[61] (2013). State of the itsm market, [Online]. Available: http://www.itsmuniversity.net/state-of-the-itsm-market-release-7/ (visited on 01/06/2013).
[62] G. Klein, Sources of Power: How People Make Decisions. Cambridge, Massachusetts:The MIT Press, 1998, p. 321.
[63] G. A. Klein, “A recognition-primed decision (rpd) model of rapid decision making,”in Decision Making in Action: Models and Methods, G. A. Klein, J. Orasanu, R.Calderwood, and C. Zsambok, Eds. Norwood, N.J.: Ablex Pub., 1993, ch. 6, pp. 138–147.
[64] R. Lipshitz, “Converging themes in the study of decision making in realistic set-tings,” in Decision Making in Action: Models and Methods, G. A. Klein, J. Orasanu,R. Calderwood, and C. Zsambok, Eds. Norwood, N.J.: Ablex Pub., 1993, ch. 5,pp. 103 –137.
[65] J. Tidwell, Designing Interfaces, Second Edition, Second. Sebastopol: O’Reilly Me-dia, 2011, p. 547.
[66] B. Shneiderman, “The eyes have it: a task by data type taxonomy for informa-tion visualizations,” in Visual Languages, 1996. Proceedings., IEEE Symposiumon, 1996, pp. 336–343.

301
[67] B. Shneiderman and C. Plaisant, Designing the User Interface: Strategies for Ef-fective Human-Computer Interaction, 5th ed. Boston: Addison-Wesley, 2010.
[68] I. Vessey, “Cognitive fit: a theory-based analysis of the graphs versus,” DecisionSciences, vol. 22, no. 2, pp. 219 –240, 1991.
[69] I. Vessey and D. Galletta, “Cognitive fit: an empirical study of information acqui-sition,” Information Systems Research, vol. 2, no. 1, pp. 63–84, 1991.
[70] G. Klein, B. Moon, and R. R. Hoffman, “Making sense of sensemaking 1: alternativeperspectives,” Intelligent Systems, IEEE, vol. 21, no. 4, pp. 70–73, 2006.
[71] D. Davis, “Fire commander,” in Incident command: tales from the hot seat, R. H.Flin and K. Arbuthnot, Eds. Aldershot: Ashgate, 2002, ch. 6, pp. 88 –104.
[72] J. Orasanu and E. Salas, “Team decision making in complex environments,” in De-cision Making in Action: Models and Methods, G. A. Klein, J. Orasanu, R. Calder-wood, and C. Zsambok, Eds. Norwood, N.J.: Ablex Pub., 1993, ch. 19, pp. 327–345.
[73] J. A. Hoffer, J. F. George, and J. S. Valacich, Modern Systems Analysis and Design,3rd. Upper Saddle River, N.J.: Prentice Hall, 2002, xxxii, 733 p.
[74] J. Lacey. (2003). Nothing went according to plan, [Online]. Available: http://www.time.com/time/nation/article/0,8599,443808,00.html (visited on01/14/2013).
[75] J. J. Cebula and L. R. Young, “A taxonomy of operational cyber security risks,”The Software Engineering Institute, Tech. Rep., 2010.
[76] B. Boehm and R. Turner, “Using risk to balance agile and plan-driven methods,”Computer, vol. 36, no. 6, pp. 57–66, 2003.
[77] T. Dyba and T. Dingsoyr, “What do we know about agile software development?”Software, IEEE, vol. 26, no. 5, pp. 6–9, 2009.
[78] M. Molhanec, “The agile methods - an innovative approach in the project man-agement,” in Electronics Technology, 30th International Spring Seminar on, IEEE,2007, pp. 304–307.
[79] J. M. Clancy, G. C. Elliott, T. Ley, M. M. Omodei, A. J. Wearing, J. McLen-nan, and E. B. Thorsteinsson, “Command style and team performance in dynamicdecision-making tasks,” in Emerging Perspectives on Judgment and Decision Re-search, S. L. Schneider and J. Shanteau, Eds. Cambridge; New York: CambridgeUniversity Press, 2003, ch. 18, pp. 586 –619.
[80] E. R. Tufte, Visual Explanations: Images and Quantities, Evidence and Narrative.Cheshire, Conn.: Graphics Press, 1997, 156 p.
[81] ——, Beautiful Evidence. Cheshire, Conn.: Graphics Press, 2006, 213 p.
[82] S. Treu, User Interface Evaluation : A Structured Approach, ser. Languages andinformation systems. New York: Plenum Press, 1994, xvii, 282 p.

302
[83] D. L. Stone and O. University., User Interface Design and Evaluation, ser. MorganKaufmann series in interactive technologies. Amsterdam ; Boston, Mass.: Elsevier: Morgan Kaufmann, 2005, xxviii, 669 p.
[84] G. T. Sica, “Bias in research studies,” Radiology, vol. 238, no. March 2006, pp780–789, 2006.
[85] D. A. Norman, Emotional Design : Why We Love (or Hate) Everyday Things. NewYork: Basic Books, 2004, x, 257 p.
[86] C. Asakawa, H. Takagi, S. Ino, and T. Ifukube, “Maximum listening speeds for theblind,” in Proceedings of the 2003 International Conference on Auditory Display,International Community For Auditory Display, 2003, pp. 276 –279.
[87] C. Wasylyshyn, B. McClimens, and D. Brock, “Comprehension of speech presentedat synthetically accelerated rates: evaluating training and practice effects,” in Pro-ceedings of the 16th International Conference on Auditory Display (ICAD2010),International Community for Auditory Display, 2010, pp. 133–136.
[88] M. J. Rosenfeld. (2012). Research terminology, [Online]. Available: http://www.stanford.edu/~mrosenfe/research_terminology.htm (visited on 01/31/2013).
[89] P. Lavrakas, Ed., Encyclopedia of Survey Research Methods, Social Desirability,SAGE Publications, 2008.
[90] P. Lavrakas, Ed., Encyclopedia of Survey Research Methods, Self-Selection Bias,SAGE Publications, 2008.
[91] P. Lavrakas, Ed., Encyclopedia of Survey Research Methods, Self-Reported Measure,SAGE Publications, 2008.
[92] S. I. Donaldson and E. J. Grant-Vallone, “Understanding self-report bias in orga-nizational behavior research,” Journal of Business and Psychology, vol. 17, no. 2,pp. 245–260, 2002.