business intelligence in the construction industry
TRANSCRIPT

Presented by:
Bruce Vanderzyde, CA
Anterra
Business Intelligencein the Construction Industry

• Review Business Intelligence concepts
• Evaluate report effectiveness against best practices
• Review the purpose and use of Excel
• Understand Construction Key Performance Indicators
• Review dashboards and scorecards
Goals for this Session

BI is the intersection between
• Processes
• Data Quality
• Data Governance
• Cross System Reporting
Business Intelligence is Information

Business intelligence (BI) is an umbrella term that includes the applications, infrastructure and tools, and best practices that enables access to and analysis of information to improve and optimize decisions and performance.
Gartner Group
Fancy Definition of Business Intelligence

Business intelligence (BI) is an umbrella term that includes the applications, infrastructure and tools, and best practices that enables access to and analysis of information to improve and optimize decisions and performance.
Gartner Group
Fancy Definition of Business Intelligence
Business intelligence (BI) is an umbrella term that includes the applications, infrastructure and tools, and best practices that enables access to and analysis of information to improve and optimize decisions and performance.
Gartner Group
Fancy Definition of Business Intelligence
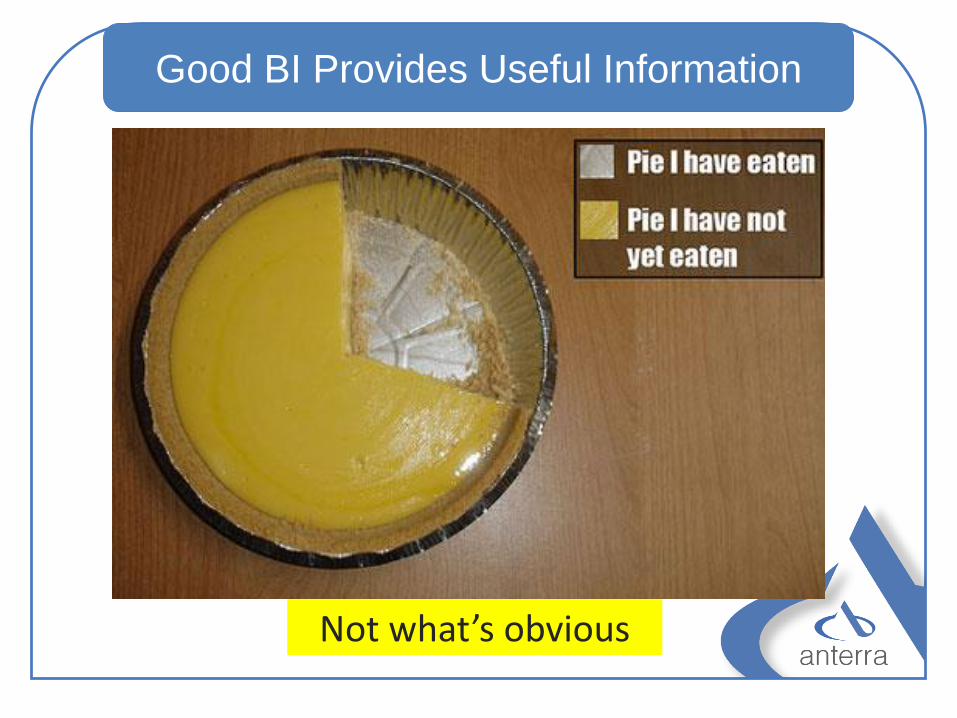
Not what’s obvious
Good BI Provides Useful Information
Construction Business Intelligence –
Provides information across multiple systems
to allow each person to succeed in their role.
Anterra
Construction Business Intelligence
Construction Business Intelligence
Construction Business Intelligence –
Provides information across multiple systems
to allow each person to succeed in their role.
Anterra
• CEO/ President / Family• CFO / Controller / Finance Staff• VP Construction• Project Manager• Site Super
Each role has “customers” with information requirements
Construction Roles

Current Reporting Technology
• Hard to read!• Can’t tell what is important• Can’t sort columns• Often have to run more reports to dive in• No color• Need a highlighter to use
Each role has “customers” that require information.
Current Report Challenges
Reporting Challenges
• Reporting across multiple databases & systems
• Reporting technology –• Speed• Complexity of reporting tools• Time to develop• Testing
• Access to reports – vpn’s, remote desktops slow users down when they are on site.
Why Improve Reporting?
• Make your organization more proactive• Consistent monitoring of KPI’s• Empower people to investigate variances on
their own• Automatic notification of off plan situations• Alignment of results to plan
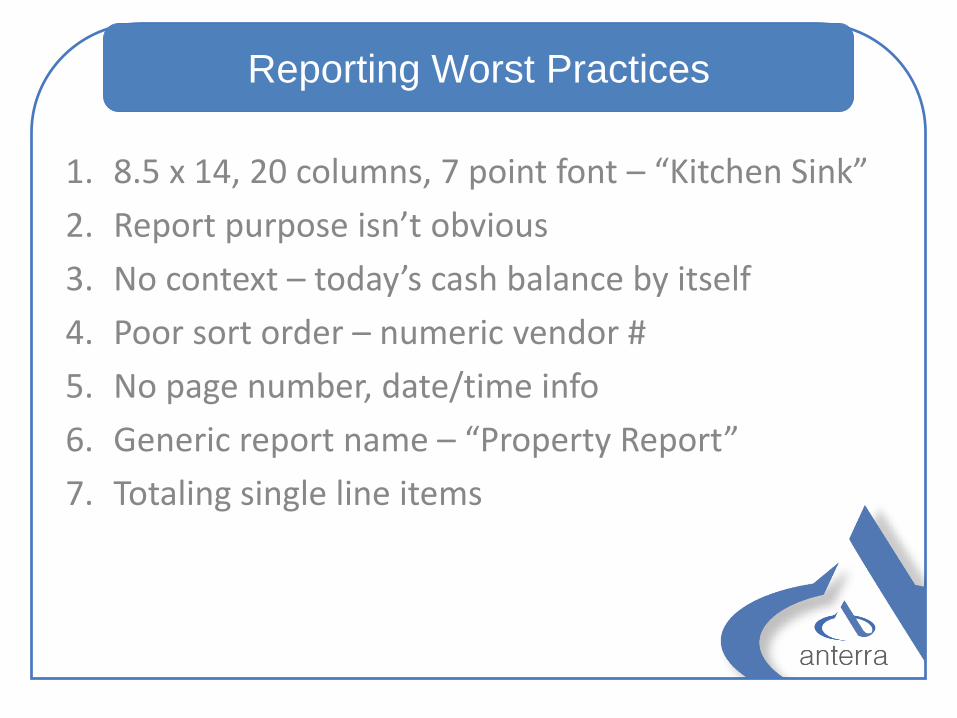
Reporting Worst Practices
1. 8.5 x 14, 20 columns, 7 point font – “Kitchen Sink”
2. Report purpose isn’t obvious
3. No context – today’s cash balance by itself
4. Poor sort order – numeric vendor #
5. No page number, date/time info
6. Generic report name – “Property Report”
7. Totaling single line items
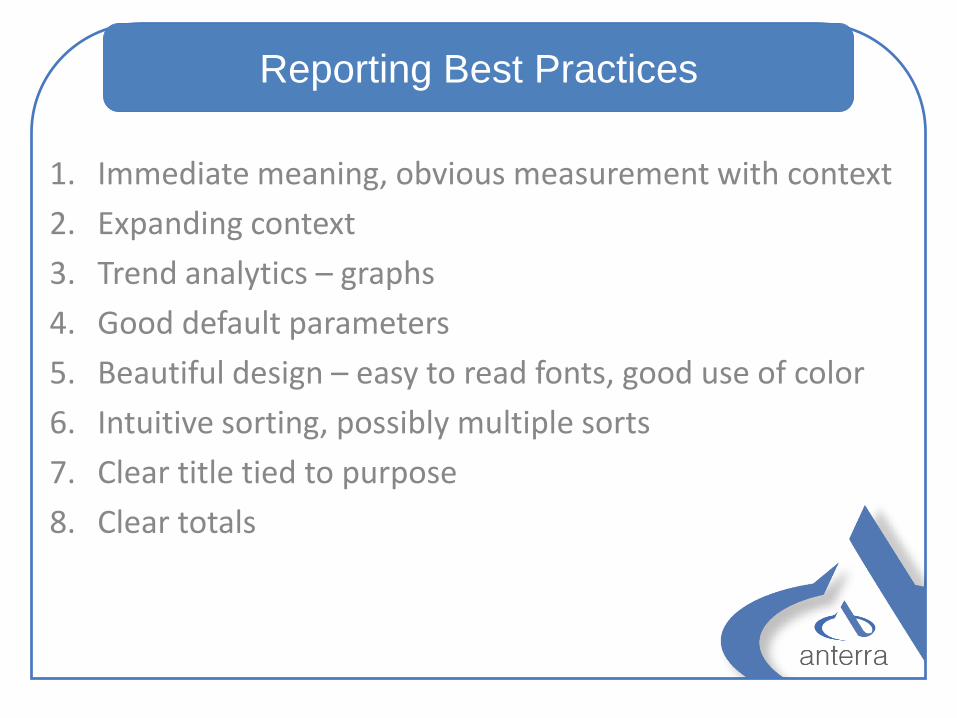
Reporting Best Practices
1. Immediate meaning, obvious measurement with context
2. Expanding context
3. Trend analytics – graphs
4. Good default parameters
5. Beautiful design – easy to read fonts, good use of color
6. Intuitive sorting, possibly multiple sorts
7. Clear title tied to purpose
8. Clear totals
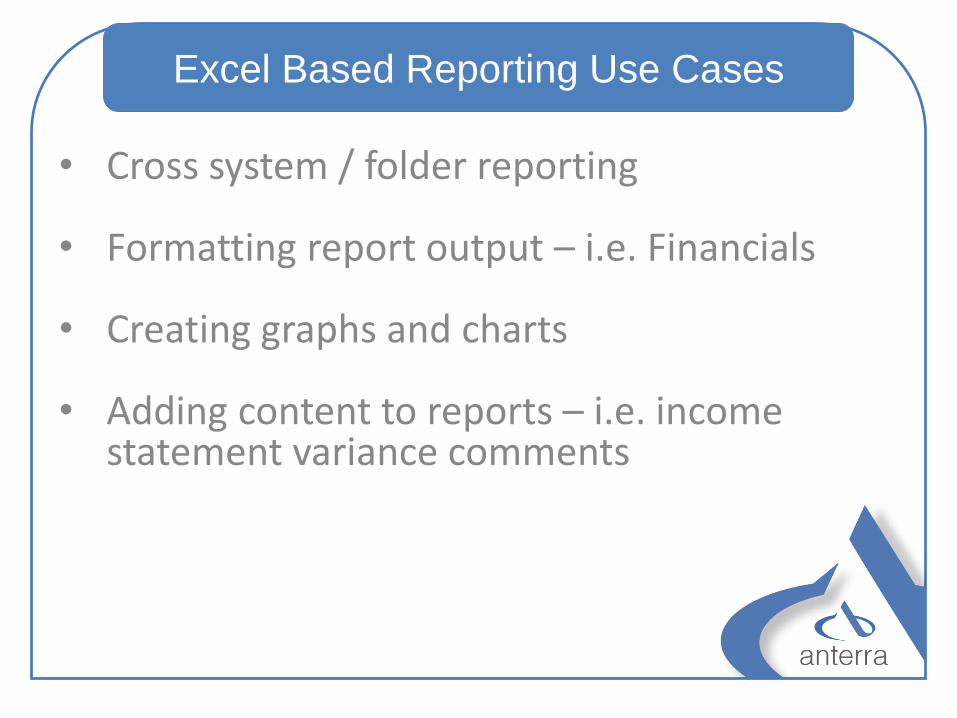
Excel Based Reporting Use Cases
• Cross system / folder reporting
• Formatting report output – i.e. Financials
• Creating graphs and charts
• Adding content to reports – i.e. income statement variance comments

1. Google “Excel Error Cost” www.google.com
2. Overwriting formulas
3. Building and maintaining data connections
4. 2 dimensional, not a database
5. Can be the most expensive program you own
Excel Challenges

Excel Challenges
• Excel spreadsheet calculations are complex
• Typically only understood by the creator of the spreadsheet
• Act as a computer program but not typically independently tested or documented
• Very expensive system if you count staff time to prepare spreadsheets

Reducing Use / Risk of Excel
• Understand where spreadsheets go and what is really used
• Build in control totals – have a home tab with conditionally colored red cells if cross tab totals do not agree
• Lock down spreadsheet formulas
• Improve reporting technology
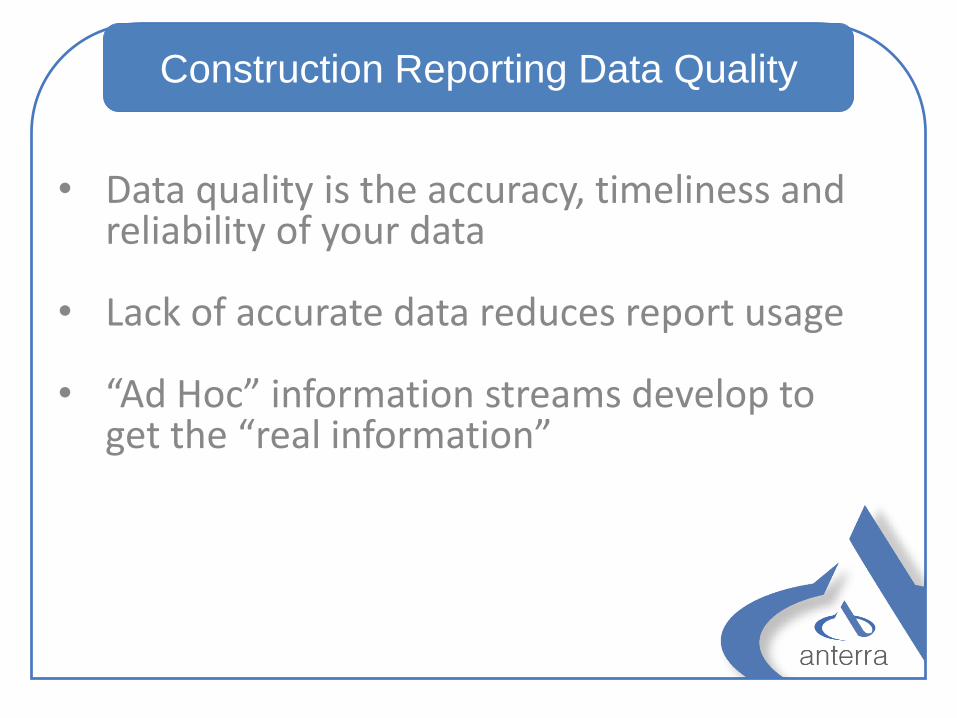
Construction Reporting Data Quality
• Data quality is the accuracy, timeliness and reliability of your data
• Lack of accurate data reduces report usage
• “Ad Hoc” information streams develop to get the “real information”

Construction Reporting Data Quality
Garbage In – Garbage Out
Garbage AnterraBI
Accurate Data AnterraBI
Ordered, Drillable
Garbage
Actionable Insight

5 Tips for Improving Data Quality
1. Executive sponsorship to support processes
2. Make people responsible for their submissions
3. Schedule data clean ups regularly
4. Review data entered to ensure it is used
5. Review form design to ensure it supports efficient and accurate data entry
Construction KPI’s
• Forecast Margin - $, %
• Margin Erosion
• Work Backlog
• % Committed
• Construction Gross Margin
• Selling, General and Admin % of Revenue
• NOI, % of revenue

Putting it all together
Let’s review these concepts in action.
• Look for productivity gains and risk reduction first
• Eliminate Excel as a “report production” system
• Financial statements, statement of cash flow, WIP, margin reporting are often done first
• Ad hoc inquiry – spreadsheets, pivots
How to Implement BI

• Pro active organization
• Consistent monitoring of KPI’s
• Automatic notification of off plan situations
• Common language of performance
Results of a Successful BI Implementation

Contact Information
Bruce Vanderzyde
Anterra
(832) 342 1575
www.anterratech.com