business intelligence @ life technologies · sap back orders sales quotas edw data roadmap - 2010...
TRANSCRIPT

Business Intelligence @ Life Technologies
Balancing Strategic & Tactical BI Programs across the Enterprise
John Armentrout
Business Intelligence Leader

Agenda• Life Technologies – where are we currently?
• How did we get here?
• How do we approach/manage projects?
• Where are we going
• Processes
• Cognos – predictive analytics / dashboards
• Mobility
• Technical architecture
• Best Practices

The Creation of Life Technologies
2003-20051
Aggressive investment
through acquisitions
$750M
1987
Invitrogen founded
$2.4K
2006-20081
Solidified foundation
$1.15B
2009
Life Technologies created
through merger of Applied
Biosystems and Invitrogen
Note: 1) Revenue numbers in circles are at beginning of period 2) Consensus revenue estimates as of May 17, 2010
$3.3B
$3.6B+
20102+
Profitable growthWith over 9000 employees, 50,000 products and $3.3B in sales,
Life Technologies is a leader in the biotech tools industry….

Where are we currently?• The multi-terabyte EDW database is utilized worldwide by over 2,500 users
• 500 Powercube users
• 1500 Business Authors
• 500 Report Authors
• 2500 Consumers
• System of Record for Revenue reporting
• There are at least four distinct ETLs occurring on a daily basis, one from each of the major regions of the world (North America, Europe, Asia, and Japan), bringing together data sources from some of the largest applications used in business (SAP, E1, Siebel, Agile)
• Over 1,000 reports are executed on a daily basis, including extracts, reports, ad-hoc queries, and cube-based
• 55 cubes
• Over 600 scheduled reports daily – 350 report studio reports, 250 cube views
• Over 5,000 reports total
• Cognos 8.4
• Core BI – Report Studio, Analysis Studio
• Metric Studio
• Go Office, Go Dashboard, Go Mobile, Go Search
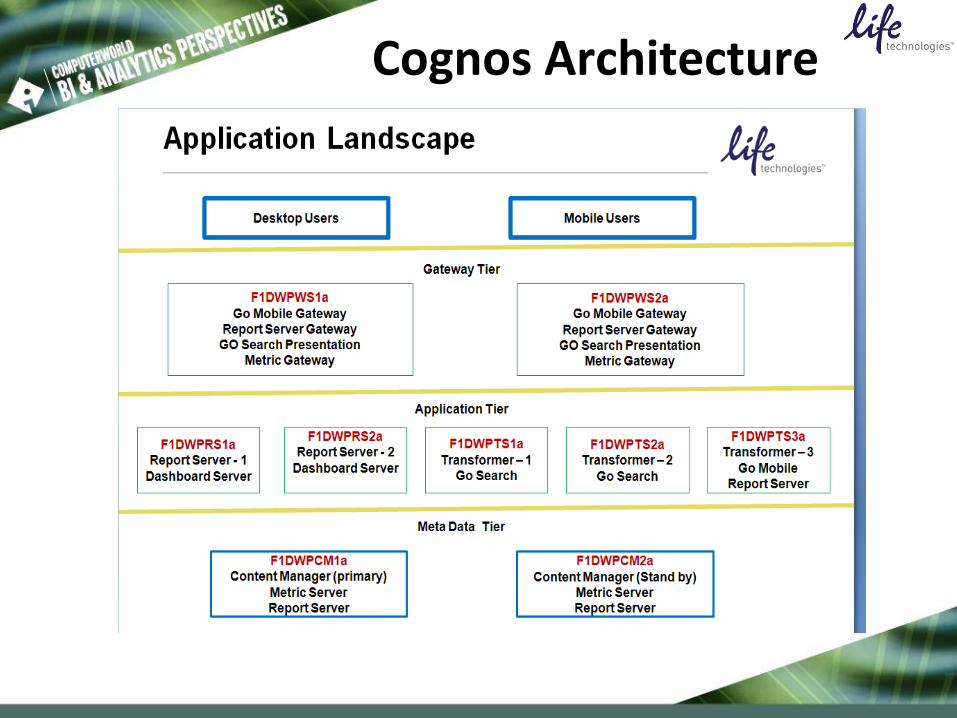
Cognos Architecture

Cognos Architecture

Customer Service Scorecard
How did we get here?• Strong executive sponsorship
• Finance leadership was key in driving the creation of the EDW as a source of reporting/analytics for revenue
• Standardized reporting solution across the enterprise
• Acquisition leveraged EDW as the consolidation engine for revenue reporting – helped solidify the use of Cognos
• The “BOB” cube (Best of Breed) – summary cube of revenue (current plus prior year) – SLA every day, as main reporting tool of CFO
• “DSR” reports – daily sales reports, that show run-rates compared to last year, week-to-date, quarter-to-date, year-to-date
• Shows sales through prior day

How do we approach projects• BI council
• Manage Strategic Direction – chaired by CIO
• BI Landscape & Architecture
• Tools
• Processes
• Align with Corporate and IT Strategy
• Prioritize
• Projects
• Funding (as required)
• Manage Business Conflicts
• BI Steering Committee
• Ensure one empowered, engaged participant per business area
• Will consider IT-submitted projects
• Release Management function will need to be carefully considered, it is clear there will be a lot of simultaneous projects in the coming months
• All BI projects will be prioritized and resourced by the PPC
• BI Steering committee will prioritize the enhancements, special projects and smaller initiatives

Business Intelligence Steering
Committee (BISC)
BI Enhancement
Proposal Definition BISC review
<160 hours
Single user groups
No PM necessary
No new resources req’d
Service
Request
PPC Prep PPC Process
Data evaluation
EDW Impact Analysis
Justification Prep
Post-production support
CAR Creation (if needed)
PPC Justification Prep

Project Process
• Project requests
– Project requests should come through BISC
• BIC sets strategic direction for BI projects
• BISC approval
– Committee will approve or reject based on expected business value, alignment with BIC direction
• BI Team to estimate LOE
• PMO process
– If LOE is greater than 160 hours, will be submitted to PMO as a project request
– If LOE is less than 160 hours, will be tracked in Serena as “support” project
• Resource availability to determine delivery
– Both types of projects have resource allocations
• Enhancements vs. projects - priority
– In general, enhancements are lower in priority than projects

IT
BI Team Structure
Project Management /
Production Support
John ArmentroutBI Team Lead
Data Architecture
ETL Cognos / Business Objects
Finance
Ops /Services
Sales /Marketing
Support
Manufacturing
Business TeamsApplicationTeams
BA Teams

Users
User Collaboration
Super Users
BI Team
Co
mm
un
ica
tio
n
New Features
Functionality
New requirements,
Enhancements, etc.

Where are we going?• EDW – “Enterprise”
• Historically, EDW data model does not support the enterprise – mainly finance focused
• Because of this, the reporting and analytics do not support all of the teams
• New subject areas
• Operations (procurement, supplier analysis, key metrics (cycle time, fill rate, inventory turns, back-orders)), Manufacturing costs
• “Cash to Cash”
• Standard global processes

Data Road Map
Q2/Q3 2010 *
Q4 2010 *
* per PMO PPC approval
Q1 2011 *
Backorders
Products
Customers
Suppliers
Sales
Orders /
Invoices
Inventory
Manufacturing
Work Orders
Sales
Territories
Companies
/ Branches
Customer
Quotes
Purchase
Orders /
Receipts /
APCustomer
Shipments
Customer
Complaints /
Returns
Sales
Opportunities
Customer
Contacts
Marketing
Campaigns
Contact
Profiles
GL
Accounts
Operating
Expenses
Carriers
Bill Of
Materials /
Configurator
Freight
Costs
Sales
Forecast
Demand
Forecast
Standard
Labor
Routings
Manufacturing / Ops:
SAP Work Orders
SAP Inventory
Bill Of Materials
Configurator
Standard Routings
Supply Chain / Planning:
Demand Forecast
Shipping
Customer Shipments
Deliveries
Delivery Addresses
Carriers
Freight
Procurement:
Suppliers
Purchase Orders
Purchase Receipts
AP Vouchers
Commercial Ops:
Sales Forecast
Additional Quote data
SAP Backorders
Sales Quotas
EDW Data Roadmap - 2010Thursday December 17, 2009
Existing
EDW
(IVGN only)
Existing
EDW
(future ABI
addition)
Future
EDW
Service
Contracts /
Transactions
Existing
EDW
(includes
ABI)
Deliveries
Marketing
Preferences
Product
Costs
Sales
Quotas
Sales
Team
2010 Planned Additions
Q1:
SAP Operating Expenses
SAP GL Accounts
SAP Work Orders
E1 Bill of Materials
Q1 2010 *
SAP Operating Expenses
SAP GL Accounts
SAP Work Orders
E1 Bill of Materials
Sales Quotas

Where are we going?• Cognos evolution
• Greater focus on predictive analysis and dashboards
• Put greater feature/functionality in the hands of the users
• Additions to Cognos portfolio under consideration: Business Viewpoint, TM1, SPSS
• Drive analytics and forecasting – “what if” scenarios
• Dashboarding – standardized “views” (or snapshots) of data for specific teams
• Mobility
• Go Mobile / RoamBI
• Technical Architecture
• SOA – evolution of ETL
• In memory computing – move toward dimensional modeling done in memory, less focus on physical data models
• Federated solutions built directly within Cognos


RoamBI - Sample

RoamBI - Sample

Best Practices• How do we create strategic initiatives
• How do we manage tactical needs
• Partnership with Finance and other functions
• Executive sponsorship and involvement
