business intelligence, portals, dashboards and operational matrix with sharepoint 2010
TRANSCRIPT

Business Intelligence
Portals, Dashboards, and
Operational Matrix
SharePoint 2010
Current State of BI1
2
3
4
5
6
7
Challenges – The Opportunity of Growth
Trends That Drive BI
The Vision
Role of SharePoint in BI
Our Concepts – Screenshots of our Work
What’s Next? - Reference Roadmap
Agenda
Current State of BI1
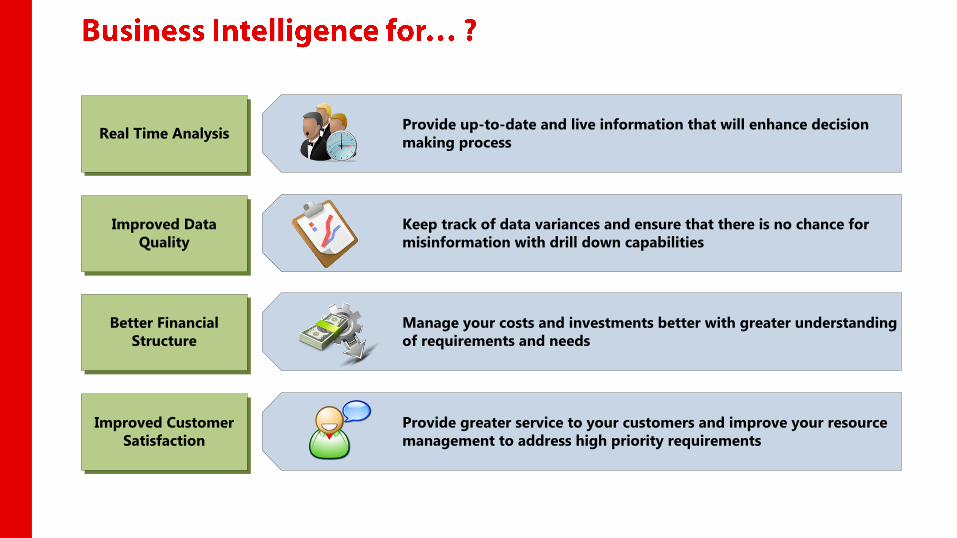
Real Time AnalysisProvide up-to-date and live information that will enhance decision
making process
Improved Data
Quality
Keep track of data variances and ensure that there is no chance for
misinformation with drill down capabilities
Improved Customer
Satisfaction
Provide greater service to your customers and improve your resource
management to address high priority requirements
Better Financial
Structure
Manage your costs and investments better with greater understanding
of requirements and needs
Current State of BI1
2
3
4
5
6
7
Challenges – The Opportunity of Growth
Trends That Drive BI
The Vision
Role of SharePoint in BI
Our Concepts – Screenshots of our Work
What’s Next? - Reference Roadmap
Agenda
Challenges – The Opportunity of Growth2


The Business Initiatives
The lack of a proper strategy between business requirements and infrastructure capabilities often
leads to value and credibility of information being questioned.
Data structure, design, and business process requirements are rarely considered when setting up
Business Intelligence initiatives – tools and applications can only be an enabler and never the process.
Cross Organizational Collaboration
The ability to put in place a cross organizational collaboration structure that can leverage
information across the enterprise.
BI initiatives for collaboration is not restricted to just departments in the organization but also caters
to knowledge regarding customers, competition, market conditions, vendors, partners, products,
and employees at all levels.
Data Source Integration
Often Business Intelligence initiatives are driven by business requirements that pulls data from
disparate sources with no opportunity for consolidation.
Data merging and standardization is a process in itself that requires strategic and technological
evaluation to ensure that the sources are scrutinized for identifying information needs.
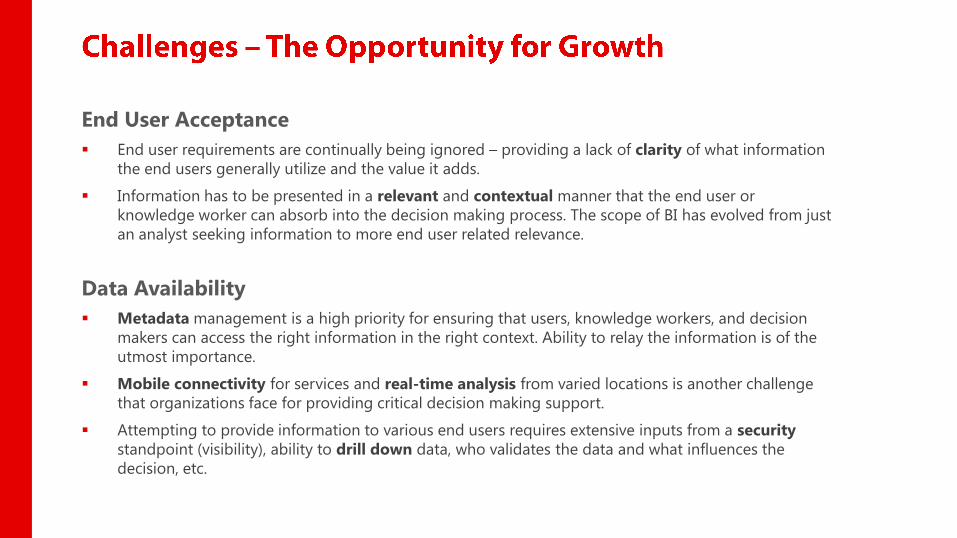
End User Acceptance
End user requirements are continually being ignored – providing a lack of clarity of what information
the end users generally utilize and the value it adds.
Information has to be presented in a relevant and contextual manner that the end user or
knowledge worker can absorb into the decision making process. The scope of BI has evolved from just
an analyst seeking information to more end user related relevance.
Data Availability
Metadata management is a high priority for ensuring that users, knowledge workers, and decision
makers can access the right information in the right context. Ability to relay the information is of the
utmost importance.
Mobile connectivity for services and real-time analysis from varied locations is another challenge
that organizations face for providing critical decision making support.
Attempting to provide information to various end users requires extensive inputs from a security
standpoint (visibility), ability to drill down data, who validates the data and what influences the
decision, etc.
Current State of BI1
2
3
4
5
6
7
Challenges – The Opportunity of Growth
Trends That Drive BI
The Vision
Role of SharePoint in BI
Our Concepts – Screenshots of our Work
What’s Next? - Reference Roadmap
Agenda
Trends That Drive BI3
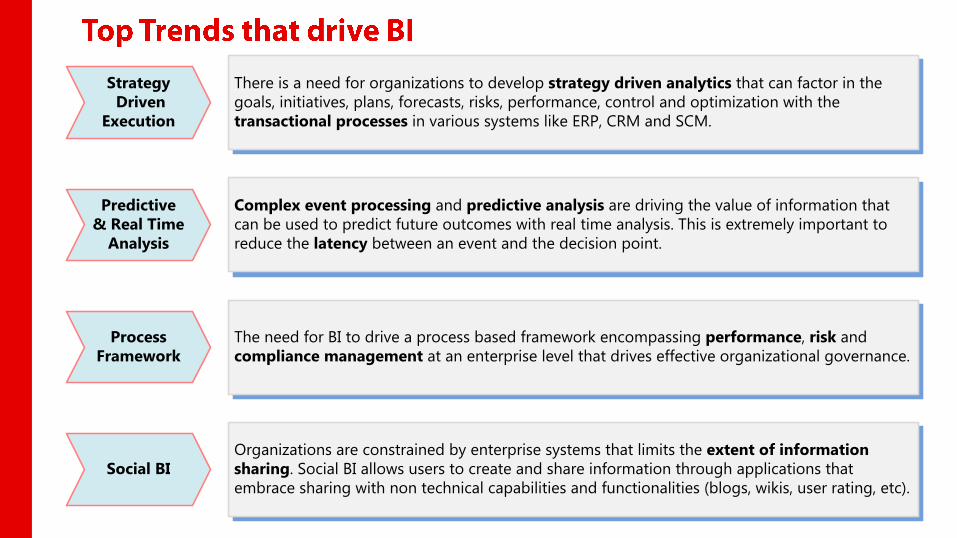
There is a need for organizations to develop strategy driven analytics that can factor in the
goals, initiatives, plans, forecasts, risks, performance, control and optimization with the
transactional processes in various systems like ERP, CRM and SCM.
Strategy
Driven
Execution
Complex event processing and predictive analysis are driving the value of information that
can be used to predict future outcomes with real time analysis. This is extremely important to
reduce the latency between an event and the decision point.
Predictive
& Real Time
Analysis
The need for BI to drive a process based framework encompassing performance, risk and
compliance management at an enterprise level that drives effective organizational governance.
Process
Framework
Organizations are constrained by enterprise systems that limits the extent of information
sharing. Social BI allows users to create and share information through applications that
embrace sharing with non technical capabilities and functionalities (blogs, wikis, user rating, etc).
Social BI
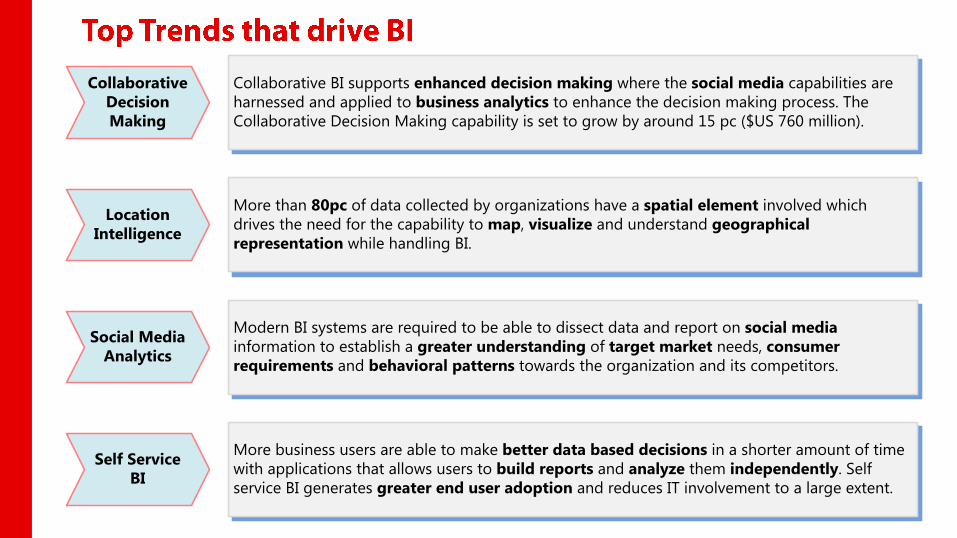
Collaborative BI supports enhanced decision making where the social media capabilities are
harnessed and applied to business analytics to enhance the decision making process. The
Collaborative Decision Making capability is set to grow by around 15 pc ($US 760 million).
Collaborative
Decision
Making
More than 80pc of data collected by organizations have a spatial element involved which
drives the need for the capability to map, visualize and understand geographical
representation while handling BI.
Location
Intelligence
Modern BI systems are required to be able to dissect data and report on social media
information to establish a greater understanding of target market needs, consumer
requirements and behavioral patterns towards the organization and its competitors.
Social Media
Analytics
More business users are able to make better data based decisions in a shorter amount of time
with applications that allows users to build reports and analyze them independently. Self
service BI generates greater end user adoption and reduces IT involvement to a large extent.
Self Service
BI

Business users and organizations are looking to leverage an unified Information Platform that
will cater to Data Quality, Data Integration and Virtualization for both structured and
unstructured data.
Master Data
Management
Mobile BI capabilities for devices like iPad, Blackberry, and Android provides executives access
to information and allows for faster, critical decision making processes. This leads to
pervasive BI deployments with increased productivity and a greater competitive advantage.
Mobile BI
Organizations are identifying the need to ensure that BI deployments go beyond the technology
requirements and create an environment of cultural transformation to meet the notion of
Intelligent Business driven by BI enhancements.
People,
Process &
Technology
With increased user adoption, executives are feeling the need to ensure that data
interpretations are more accurate, with quick and simple graphics that can aid in intelligent
decision making instead of having to go through lots of raw data.
Improved
Visualization
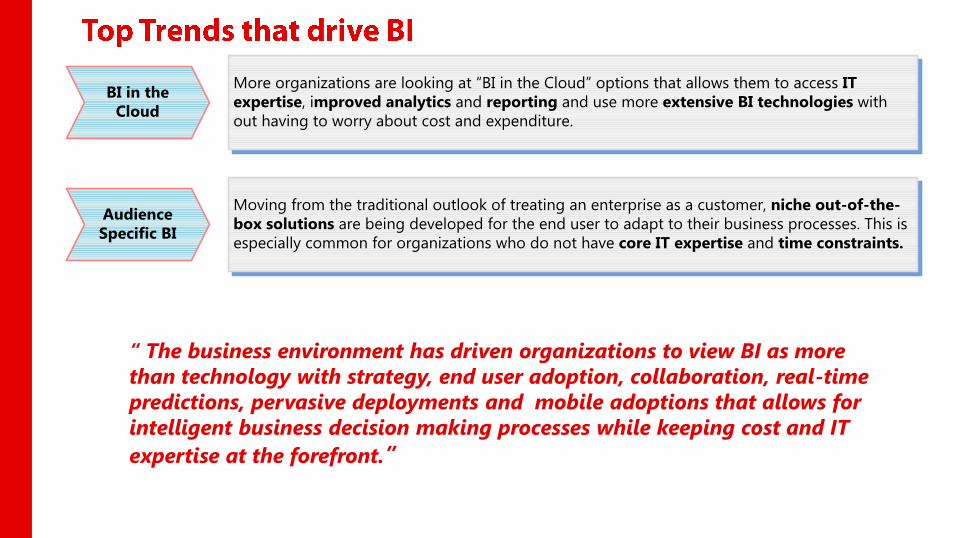
“ The business environment has driven organizations to view BI as more
than technology with strategy, end user adoption, collaboration, real-time
predictions, pervasive deployments and mobile adoptions that allows for
intelligent business decision making processes while keeping cost and IT
expertise at the forefront.”
More organizations are looking at “BI in the Cloud” options that allows them to access IT
expertise, improved analytics and reporting and use more extensive BI technologies with
out having to worry about cost and expenditure.
BI in the
Cloud
Moving from the traditional outlook of treating an enterprise as a customer, niche out-of-the-
box solutions are being developed for the end user to adapt to their business processes. This is
especially common for organizations who do not have core IT expertise and time constraints.
Audience
Specific BI
Current State of BI1
2
3
4
5
6
7
Challenges – The Opportunity of Growth
Trends That Drive BI
The Vision
Role of SharePoint in BI
Our Concepts – Screenshots of our Work
What’s Next? - Reference Roadmap
Agenda
The Vision4
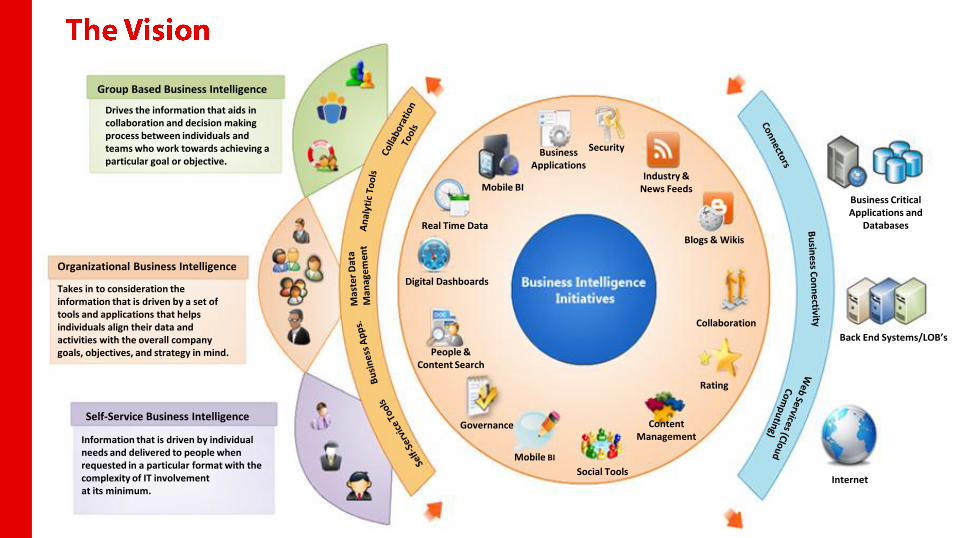
Group Based Business Intelligence
Drives the information that aids in collaboration and decision making process between individuals and teams who work towards achieving a particular goal or objective.
Organizational Business Intelligence
Takes in to consideration the information that is driven by a set of tools and applications that helps individuals align their data and activities with the overall company goals, objectives, and strategy in mind.
Self-Service Business Intelligence
Information that is driven by individual needs and delivered to people when requested in a particular format with the complexity of IT involvement at its minimum.
Mobile BI
Real Time Data
Digital Dashboards
People & Content Search
Governance
Mobile BI
Social Tools
Content Management
Rating
Collaboration
Blogs & Wikis
Industry & News Feeds
SecurityBusiness Applications
Business Critical Applications and
Databases
Back End Systems/LOB’s
Internet
Current State of BI1
2
3
4
5
6
7
Challenges – The Opportunity of Growth
Trends That Drive BI
The Vision
Role of SharePoint in BI
Our Concepts – Screenshots of our Work
What’s Next? - Reference Roadmap
Agenda
Role of SharePoint in BI5
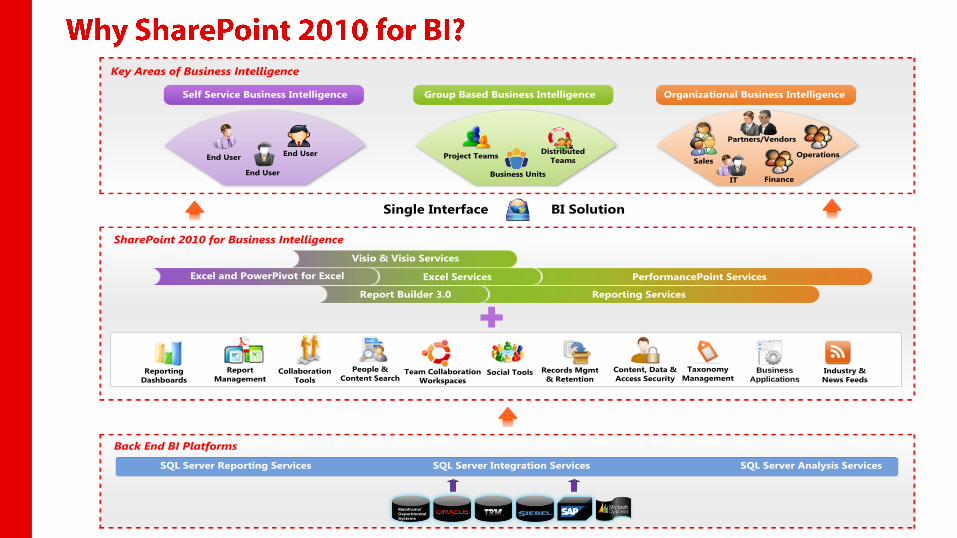
Key Areas of Business Intelligence
SharePoint 2010 for Business Intelligence
Back End BI Platforms
Self Service Business Intelligence Group Based Business Intelligence Organizational Business Intelligence
Visio & Visio Services
Excel and PowerPivot for Excel Excel Services PerformancePoint Services
Report Builder 3.0 Reporting Services
Business
Applications
Records Mgmt
& Retention
Report
ManagementCollaboration
Tools
Reporting
DashboardsSocial Tools Content, Data &
Access SecurityTeam Collaboration
Workspaces
Taxonomy
Management
People &
Content SearchIndustry &
News Feeds
Single Interface BI Solution
SQL Server Analysis ServicesSQL Server Integration ServicesSQL Server Reporting Services
Mainframe/ Departmental Systems
End User
End UserEnd User Project Teams
Business Units
Distributed
Teams Sales
Partners/Vendors
Operations
IT Finance
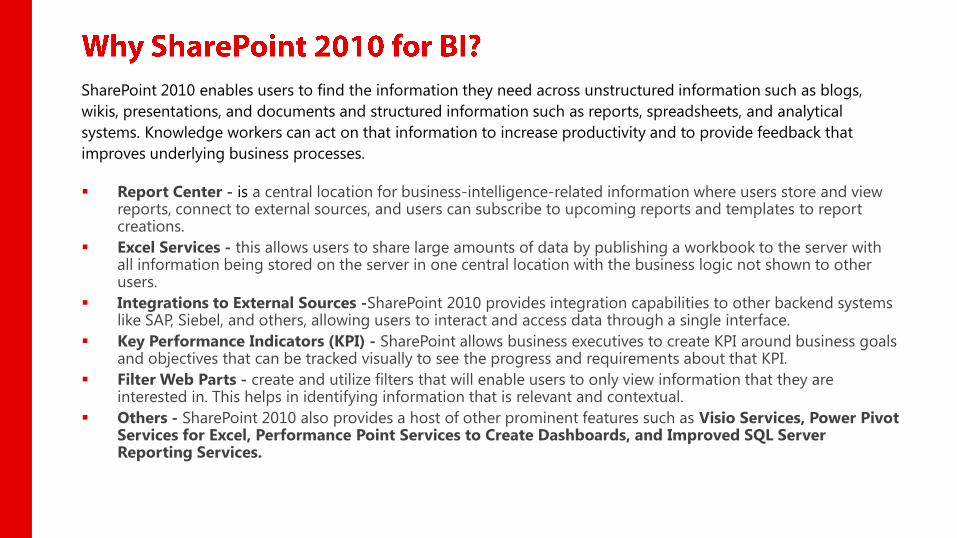
SharePoint 2010 enables users to find the information they need across unstructured information such as blogs,
wikis, presentations, and documents and structured information such as reports, spreadsheets, and analytical
systems. Knowledge workers can act on that information to increase productivity and to provide feedback that
improves underlying business processes.
Report Center - is a central location for business-intelligence-related information where users store and view reports, connect to external sources, and users can subscribe to upcoming reports and templates to report creations.
Excel Services - this allows users to share large amounts of data by publishing a workbook to the server with all information being stored on the server in one central location with the business logic not shown to other users.
Integrations to External Sources -SharePoint 2010 provides integration capabilities to other backend systems like SAP, Siebel, and others, allowing users to interact and access data through a single interface.
Key Performance Indicators (KPI) - SharePoint allows business executives to create KPI around business goals and objectives that can be tracked visually to see the progress and requirements about that KPI.
Filter Web Parts - create and utilize filters that will enable users to only view information that they are interested in. This helps in identifying information that is relevant and contextual.
Others - SharePoint 2010 also provides a host of other prominent features such as Visio Services, Power Pivot Services for Excel, Performance Point Services to Create Dashboards, and Improved SQL Server Reporting Services.
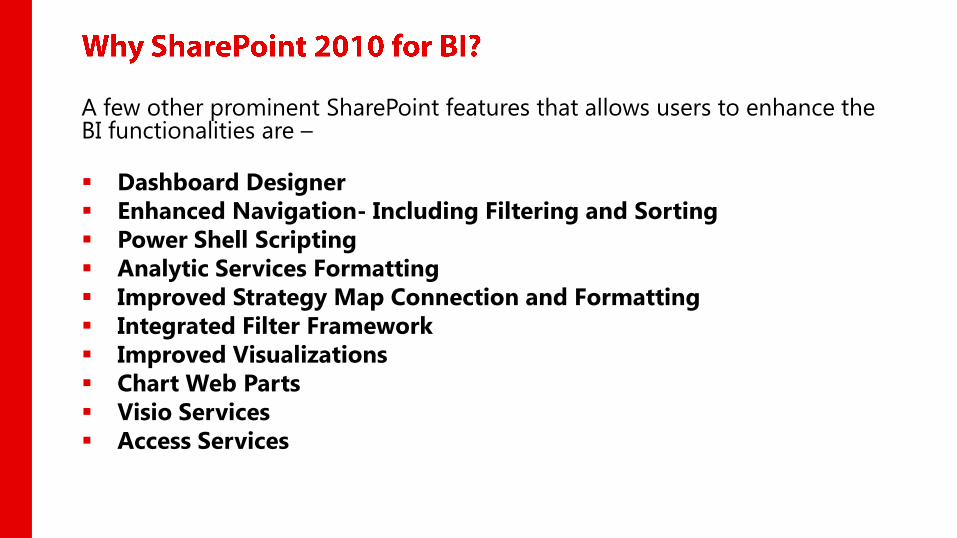
A few other prominent SharePoint features that allows users to enhance the BI functionalities are –
Dashboard Designer
Enhanced Navigation- Including Filtering and Sorting
Power Shell Scripting
Analytic Services Formatting
Improved Strategy Map Connection and Formatting
Integrated Filter Framework
Improved Visualizations
Chart Web Parts
Visio Services
Access Services
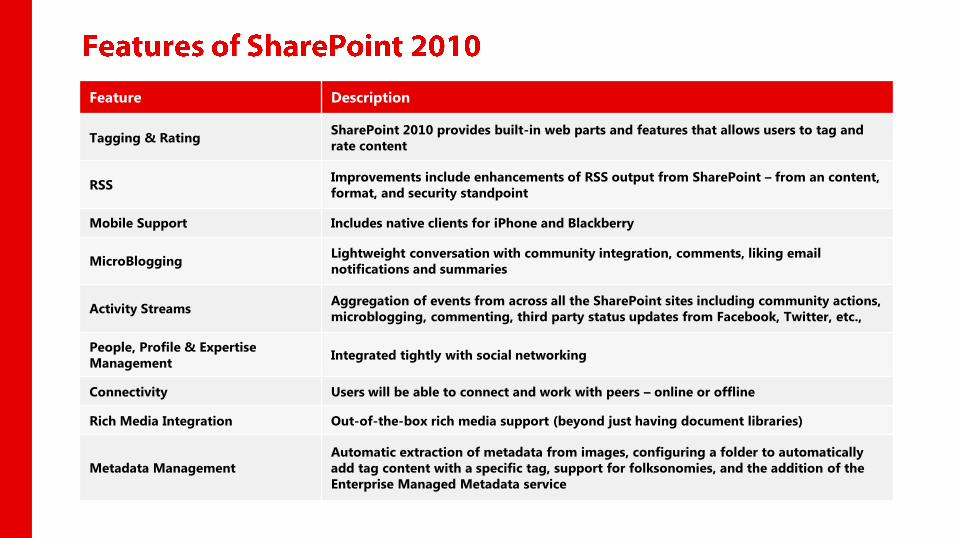
Feature Description
Tagging & RatingSharePoint 2010 provides built-in web parts and features that allows users to tag and
rate content
RSSImprovements include enhancements of RSS output from SharePoint – from an content,
format, and security standpoint
Mobile Support Includes native clients for iPhone and Blackberry
MicroBloggingLightweight conversation with community integration, comments, liking email
notifications and summaries
Activity StreamsAggregation of events from across all the SharePoint sites including community actions,
microblogging, commenting, third party status updates from Facebook, Twitter, etc.,
People, Profile & Expertise
ManagementIntegrated tightly with social networking
Connectivity Users will be able to connect and work with peers – online or offline
Rich Media Integration Out-of-the-box rich media support (beyond just having document libraries)
Metadata Management
Automatic extraction of metadata from images, configuring a folder to automatically
add tag content with a specific tag, support for folksonomies, and the addition of the
Enterprise Managed Metadata service
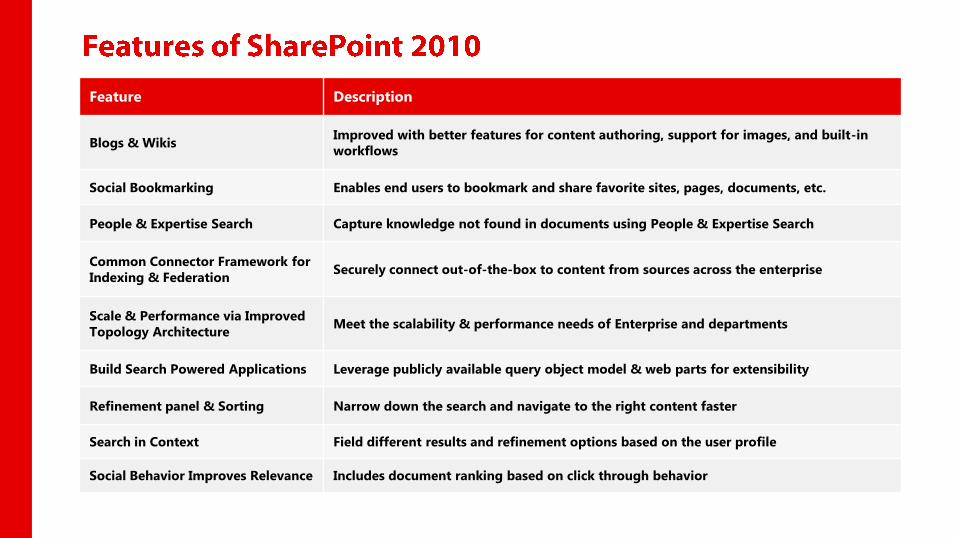
Feature Description
Blogs & WikisImproved with better features for content authoring, support for images, and built-in
workflows
Social Bookmarking Enables end users to bookmark and share favorite sites, pages, documents, etc.
People & Expertise Search Capture knowledge not found in documents using People & Expertise Search
Common Connector Framework for
Indexing & FederationSecurely connect out-of-the-box to content from sources across the enterprise
Scale & Performance via Improved
Topology ArchitectureMeet the scalability & performance needs of Enterprise and departments
Build Search Powered Applications Leverage publicly available query object model & web parts for extensibility
Refinement panel & Sorting Narrow down the search and navigate to the right content faster
Search in Context Field different results and refinement options based on the user profile
Social Behavior Improves Relevance Includes document ranking based on click through behavior
Current State of BI1
2
3
4
5
6
7
Challenges – The Opportunity of Growth
Trends That Drive BI
The Vision
Role of SharePoint in BI
Our Concepts – Screenshots of our Work
What’s Next? - Reference Roadmap
Agenda
Our Concepts – Screenshots of our Work6
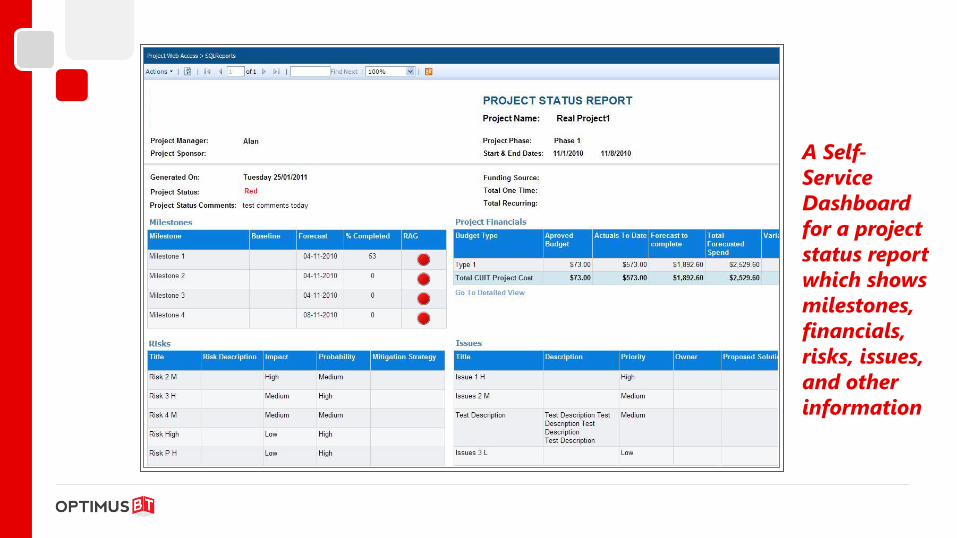
A Self-
Service
Dashboard
for a project
status report
which shows
milestones,
financials,
risks, issues,
and other
information
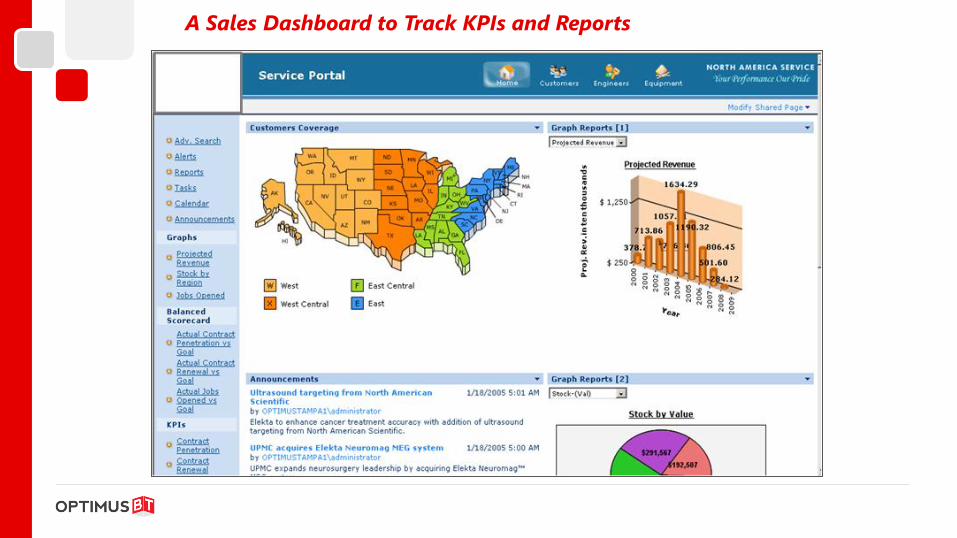
A Sales Dashboard to Track KPIs and Reports
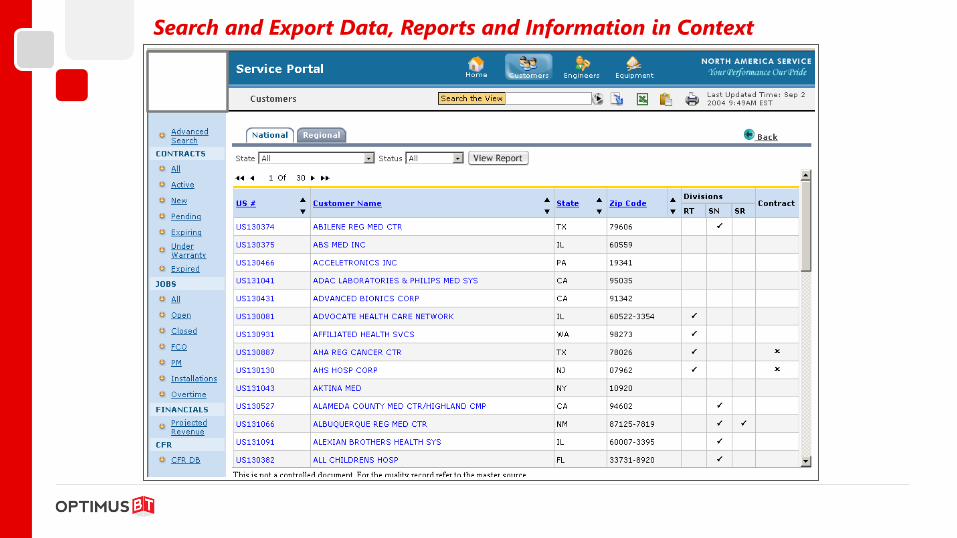
Search and Export Data, Reports and Information in Context
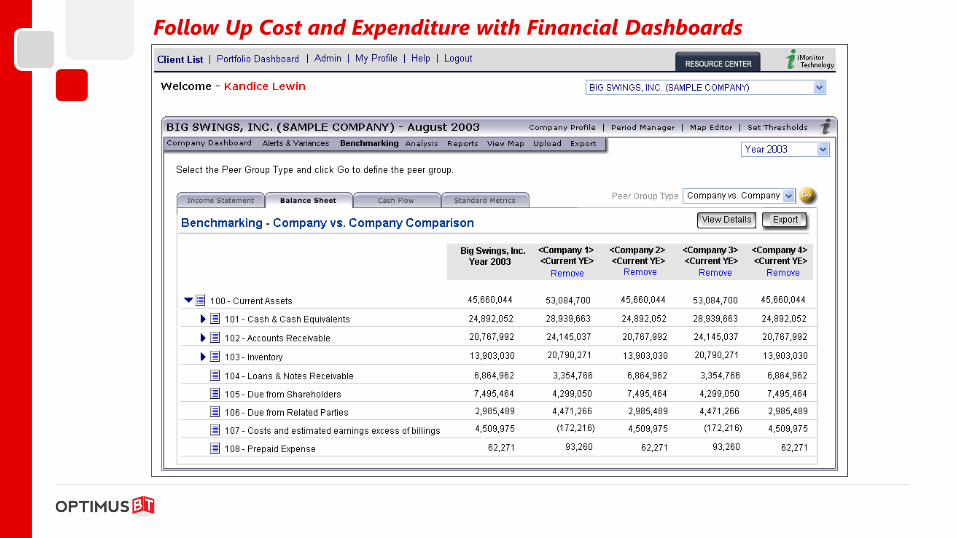
Follow Up Cost and Expenditure with Financial Dashboards

Provide Top Level Executive Dashboards for Quick Decision Making
Current State of BI1
2
3
4
5
6
7
Challenges – The Opportunity of Growth
Trends That Drive BI
The Vision
Role of SharePoint in BI
Our Concepts – Screenshots of our Work
What’s Next? - Reference Roadmap
Agenda
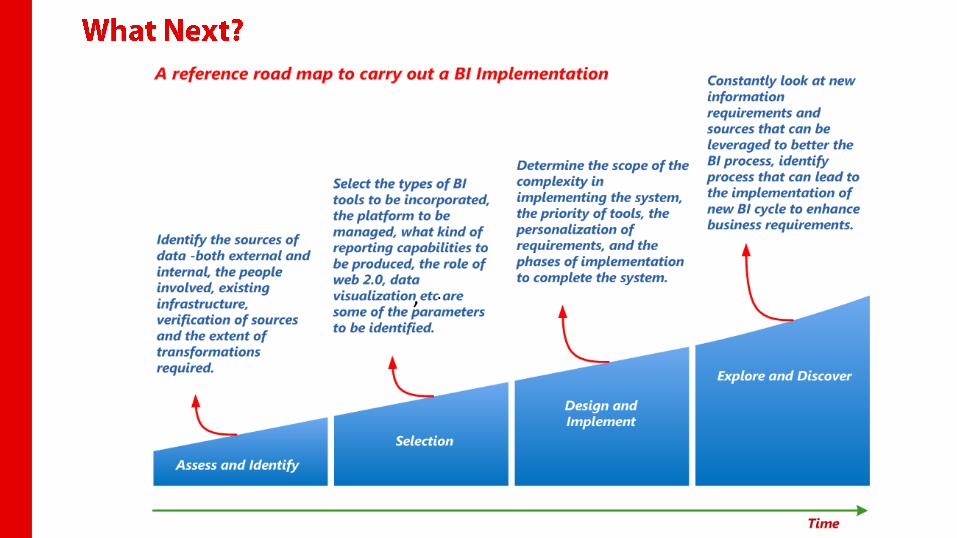
What’s Next? - Reference Roadmap7
, .

Thank YouOptimus BT, 2550 Northwinds Parkway, Suite 140, Alpharetta GA 30009, USA Phone: (770) 569 1240 Fax: (770) 569 1242 Email: [email protected]: www.optimusbt.com
Follow us on
Gain insights from the Optimus BT perspective
Business Intelligence Portals, Dashboards and Operational Matrix