business: management - retail
TRANSCRIPT

1
Business: Management - Retail
March 2012 Needs Assessment
Prepared by Elisa Lewis
Date: March 12, 2012 Business: Management - Retail

2
Scope Data compiled in this report covers San Bernardino, Riverside, Orange, and Los Angeles counties. Data were drawn from external sources, including the Employment Development Department’s California Labor Market Information and the U.S. Department of Education’s Integrated Postsecondary Education Data System (IPEDS), as well as Chaffey College’s Colleague Administrative database. Data Sources and Calculations Educational Program Data TOP Code Program of Study
0506.50 Retail Store Operations and Management The Taxonomy of Programs (TOP) is a standardized system used at the state level to classify programs and courses at California Community Colleges that are intended to achieve the same outcome. The Business: Management - Retail program at Chaffey College is classified under the Retail Store Operations and Management TOP code. CIP Code Program of Study
52.1803 Retailing and Retail Operations The Classification of Instructional Programs (CIP) is a standardized coding system used at the federal level to facilitate accurate tracking, assessment, and reporting of fields of study and program completion at educational institutions throughout the country. This report draws on the Retailing and Retail Operations CIP code, which maps to the Retail Store Operations and Management TOP code, to compare Chaffey College to other institutions and examine employment trends. Completions Data Degree and certificate data regarding students at Chaffey College were collected from the Colleague Administrative database. Degree and certificate data for all comparison schools were collected from the U.S. Department of Education’s Integrated Postsecondary Education Data System (IPEDS). All comparison institutions included in this report are postsecondary and have provided data to IPEDS. IPEDS defines postsecondary education as a formal program designed primarily for students beyond high school age. These include academic, vocational, and continuing professional education, and exclude avocational and adult basic education programs. Occupational Data SOC Code Occupational Title
411011 First-Line Supervisors/Managers of Retail Sales Workers
412011 Cashiers
412012 Gaming Change Persons and Booth Cashiers
412031 Retail Salespersons
413099 Sales Representatives, Services, All Other
419011 Demonstrators and Product Promoters
3
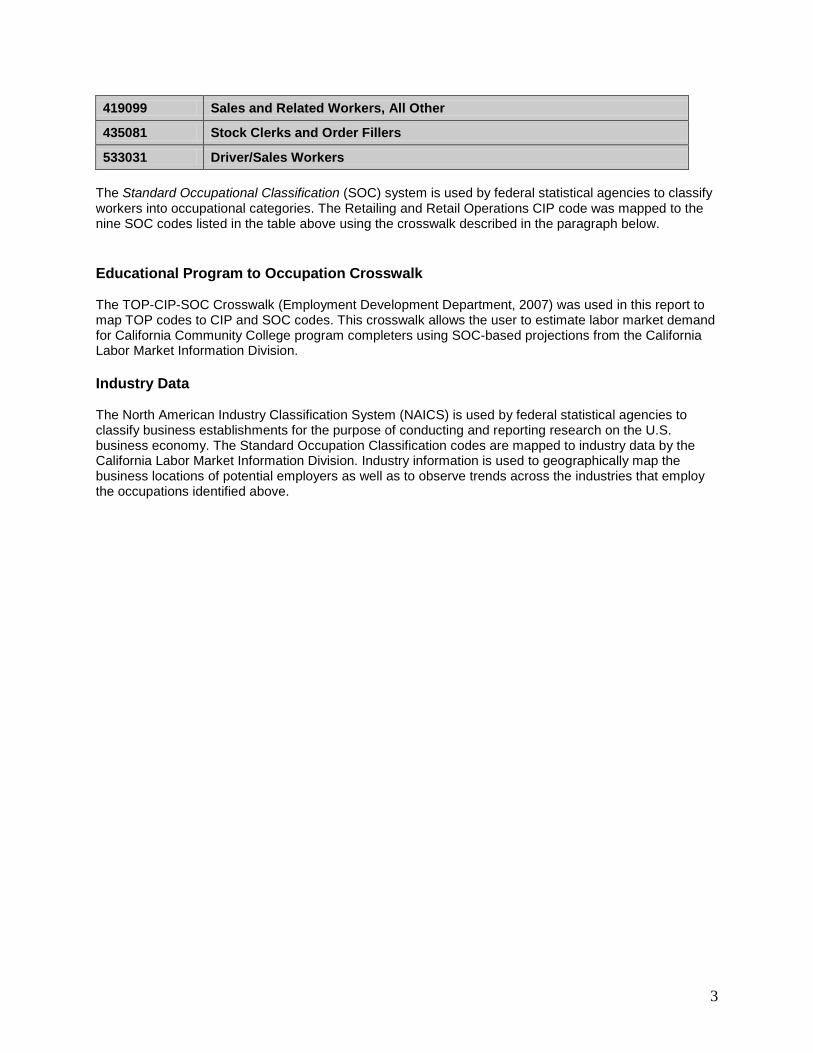
419099 Sales and Related Workers, All Other
435081 Stock Clerks and Order Fillers
533031 Driver/Sales Workers The Standard Occupational Classification (SOC) system is used by federal statistical agencies to classify workers into occupational categories. The Retailing and Retail Operations CIP code was mapped to the nine SOC codes listed in the table above using the crosswalk described in the paragraph below. Educational Program to Occupation Crosswalk The TOP-CIP-SOC Crosswalk (Employment Development Department, 2007) was used in this report to map TOP codes to CIP and SOC codes. This crosswalk allows the user to estimate labor market demand for California Community College program completers using SOC-based projections from the California Labor Market Information Division. Industry Data The North American Industry Classification System (NAICS) is used by federal statistical agencies to classify business establishments for the purpose of conducting and reporting research on the U.S. business economy. The Standard Occupation Classification codes are mapped to industry data by the California Labor Market Information Division. Industry information is used to geographically map the business locations of potential employers as well as to observe trends across the industries that employ the occupations identified above.

4
Introduction and Contents Contents Background Information 5 Regional Job Outlook 14 Largest and Fastest Growing Industry Employers 20 Regional Graduation Summary 31 Chaffey College’s Performance on Core Indicators 32 Map of Competitor Institutions 33 Purpose and Goals Chaffey College currently offers a Business: Management – Retail Associate in Science Degree and Certificate, both consisting of 29-30 units. The following is a description of the Business: Management - Retail program as outlined in the 2011-12 Catalog: “Retail Management prepares students for employment in all aspects of retailing related to merchandise buying and management. Other career avenues are sales representatives for manufacturers, visual display, distribution, importing and exporting, and sales promotions.” The purpose of this report is to integrate and analyze data from multiple sources to determine labor market needs for the Business: Management – Retail program at Chaffey College.
Regional Definitions Inland Empire includes the Riverside-San Bernardino-Ontario Metropolitan Statistical Area (MSA) Los Angeles County includes the Los Angeles-Long Beach-Glendale Metropolitan Division Orange County includes the Santa Ana-Anaheim-Irvine Metropolitan Division Key Terms and Concepts Replacement Jobs: Replacement jobs refer to the number of job openings due to workers leaving an occupation. Annual Openings: Annual openings are calculated by adding the number of new jobs to the number of replacement jobs, divided by the number of years in the projection period. Projections: Projections of employment are calculated by the Employment Development Department and are based on a mathematical formula that includes historical employment and economic indicators along with national, state, and local trends. Occupation: Jobs are grouped into occupations using the federal Standard Occupational Classification (SOC) system. Industry: Occupations are grouped into industries using the North American Industry Classification System (NAICS). Wages: Hourly wages are reported in percentiles and averages. The 25th percentile is a useful proxy of entry-level wages and the 75th percentile of experienced-level wages.

5
Background Information 1 California Community Colleges, Chancellor’s Office, Taxonomy of Programs, Sixth Edition (Corrected Version). 2 O*Net Online: http://online.onetcenter.org/find
Business: Management - Retail Business: Management - Retail programs in California Community are instructional programs that study the principles and methods of retail store operations and management, including department stores and supermarkets.1 The descriptions of job duties for Business: Management - Retail-related occupations are provided by the Occupational Information Network.2
First-Line Supervisors/Managers of Retail Sales Workers2 First-Line Supervisors/Managers of Retail Sales Workers directly supervise sales workers in a retail establishment or department. Duties may include management functions, such as purchasing, budgeting, accounting, and personnel work, in addition to supervisory duties. Typical Tasks
♦ Provide customer service by greeting and assisting customers, and responding to customer inquiries and complaints.
♦ Direct and supervise employees engaged in sales, inventory-taking, reconciling cash receipts, or in performing services for customers.
♦ Monitor sales activities to ensure that customers receive satisfactory service and quality goods.
♦ Inventory stock and reorder when inventory drops to a specified level. ♦ Instruct staff on how to handle difficult and complicated sales. ♦ Hire, train, and evaluate personnel in sales or marketing establishments, promoting or
firing workers when appropriate. ♦ Assign employees to specific duties. ♦ Enforce safety, health, and security rules. ♦ Examine merchandise to ensure that it is correctly priced and displayed and that it
functions as advertised. ♦ Plan budgets and authorize payments and merchandise returns.

6
2O*Net Online: http://online.onetcenter.org/find
Cashiers2 Cashiers receive and disburse money in establishments other than financial institutions. May use electronic scanners, cash registers, or related equipment. May process credit or debit card transactions and validate checks. Typical Tasks
♦ Receive payment by cash, check, credit cards, vouchers, or automatic debits. ♦ Issue receipts, refunds, credits, or change due to customers. ♦ Assist customers by providing information and resolving their complaints. ♦ Establish or identify prices of goods, services or admission, and tabulate bills using
calculators, cash registers, or optical price scanners. ♦ Greet customers entering establishments. ♦ Answer customers' questions, and provide information on procedures or policies. ♦ Sell tickets and other items to customers. ♦ Process merchandise returns and exchanges. ♦ Maintain clean and orderly checkout areas and complete other general cleaning duties,
such as mopping floors and emptying trash cans. ♦ Stock shelves, and mark prices on shelves and items.
7
2O*Net Online: http://online.onetcenter.org/find
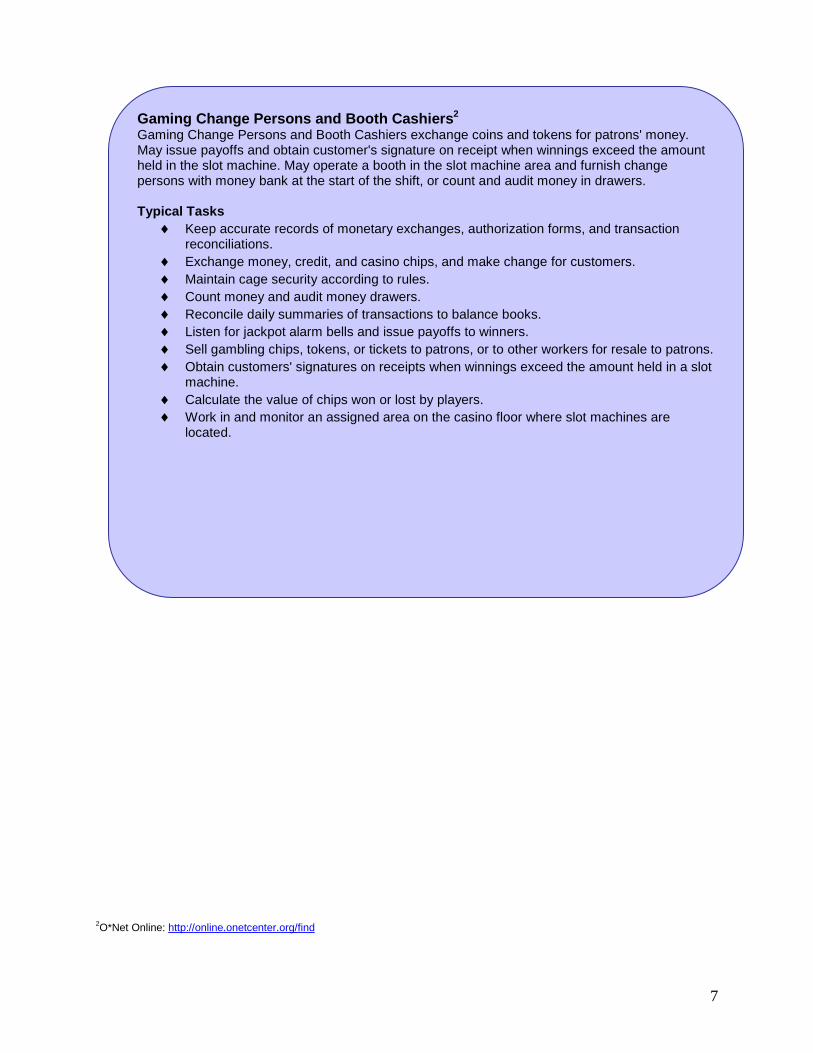
Gaming Change Persons and Booth Cashiers2 Gaming Change Persons and Booth Cashiers exchange coins and tokens for patrons' money. May issue payoffs and obtain customer's signature on receipt when winnings exceed the amount held in the slot machine. May operate a booth in the slot machine area and furnish change persons with money bank at the start of the shift, or count and audit money in drawers. Typical Tasks
♦ Keep accurate records of monetary exchanges, authorization forms, and transaction reconciliations.
♦ Exchange money, credit, and casino chips, and make change for customers. ♦ Maintain cage security according to rules. ♦ Count money and audit money drawers. ♦ Reconcile daily summaries of transactions to balance books. ♦ Listen for jackpot alarm bells and issue payoffs to winners. ♦ Sell gambling chips, tokens, or tickets to patrons, or to other workers for resale to patrons. ♦ Obtain customers' signatures on receipts when winnings exceed the amount held in a slot
machine. ♦ Calculate the value of chips won or lost by players. ♦ Work in and monitor an assigned area on the casino floor where slot machines are
located.

8
2O*Net Online: http://online.onetcenter.org/find
Retail Salespersons2 Retail Salespersons sell merchandise, such as furniture, motor vehicles, appliances, or apparel to consumers. Typical Tasks
♦ Greet customers and ascertain what each customer wants or needs. ♦ Describe merchandise and explain use, operation, and care of merchandise to
customers. ♦ Recommend, select, and help locate or obtain merchandise based on customer needs
and desires. ♦ Compute sales prices, total purchases and receive and process cash or credit
payment. ♦ Answer questions regarding the store and its merchandise. ♦ Prepare sales slips or sales contracts. ♦ Maintain knowledge of current sales and promotions, policies regarding payment and
exchanges, and security practices. ♦ Maintain records related to sales. ♦ Demonstrate use or operation of merchandise. ♦ Place special orders or call other stores to find desired items.

9
2O*Net Online: http://online.onetcenter.org/find
Sales Representatives, Services, All Other2 Occupational description and typical tasks not available.

10
2O*Net Online: http://online.onetcenter.org/find
Demonstrators and Product Promoters2 Demonstrate merchandise and answer questions for the purpose of creating public interest in buying the product. May sell demonstrated merchandise. Typical Tasks
♦ Demonstrate or explain products, methods, or services to persuade customers to purchase products or use services.
♦ Provide product samples, coupons, informational brochures, or other incentives to persuade people to buy products.
♦ Keep areas neat while working and return items to correct locations following demonstrations.
♦ Record and report demonstration-related information, such as the number of questions asked by the audience or the number of coupons distributed.
♦ Sell products being promoted and keep records of sales. ♦ Set up and arrange displays or demonstration areas to attract the attention of prospective
customers. ♦ Suggest specific product purchases to meet customers' needs. ♦ Transport, assemble, and disassemble materials used in presentations. ♦ Identify interested and qualified customers to provide them with additional information. ♦ Practice demonstrations to ensure that they will run smoothly.

11
2O*Net Online: http://online.onetcenter.org/find
Sales and Related Workers, All Other2 Occupational description and typical tasks not available.

12
2O*Net Online: http://online.onetcenter.org/find
Stock Clerks and Order Fillers 2 Receive, store, and issue sales floor merchandise, materials, equipment, and other items from stockroom, warehouse, or storage yard to fill shelves, racks, tables, or customers' orders. May mark prices on merchandise and set up sales displays. Typical Tasks
♦ Answer customers' questions about merchandise and advise customers on merchandise selection.
♦ Itemize and total customer merchandise selection at checkout counter, using cash register, and accept cash or charge card for purchases.
♦ Take inventory or examine merchandise to identify items to be reordered or replenished.
♦ Pack customer purchases in bags or cartons. ♦ Stock shelves, racks, cases, bins, and tables with new or transferred merchandise. ♦ Receive, open, unpack and issue sales floor merchandise. ♦ Clean display cases, shelves, and aisles. ♦ Compare merchandise invoices to items actually received to ensure that shipments are
correct. ♦ Requisition merchandise from supplier based on available space, merchandise on
hand, customer demand, or advertised specials. ♦ Transport packages to customers' vehicles. ♦ Read orders to ascertain catalog numbers, sizes, colors, and quantities of
merchandise. ♦ Obtain merchandise from bins or shelves. ♦ Compute prices of items or groups of items. ♦ Complete order receipts. ♦ Keep records of out-going orders. ♦ Place merchandise on conveyors leading to wrapping areas. ♦ Requisition additional materials, supplies, and equipment.

13
2O*Net Online: http://online.onetcenter.org/find
Driver/Sales Workers2 Drive truck or other vehicle over established routes or within an established territory and sell or deliver goods, such as food products, including restaurant take-out items, or pick up or deliver items such as commercial laundry. May also take orders, collect payment, or stock merchandise at point of delivery. Includes newspaper delivery drivers. Typical Tasks
♦ Collect money from customers, make change, and record transactions on customer receipts.
♦ Listen to and resolve customers' complaints regarding products or services. ♦ Inform regular customers of new products or services and price changes. ♦ Write customer orders and sales contracts according to company guidelines. ♦ Drive trucks to deliver such items as food, medical supplies, or newspapers. ♦ Collect coins from vending machines, refill machines, and remove aged merchandise. ♦ Call on prospective customers to explain company services or to solicit new business. ♦ Record sales or delivery information on daily sales or delivery record. ♦ Review lists of dealers, customers, or station drops and load trucks. ♦ Arrange merchandise and sales promotion displays or issue sales promotion materials to
customers.

14
Regional Job Outlook
Projected Regional Job Outlook The table below displays 2008 employment estimates and 2018 projections for Business: Management - Retail-related jobs. Job openings for Cashiers, Retail Salespersons, Stock Clerks and Order Fillers are plentiful across all regions of interest. Job openings for Supervisors of Retail Sales Workers and Sales Reps are available as well, though in lesser numbers. Sales and Driver/Sales Workers jobs are smaller in number, while Gaming Change Persons and Booth Cashiers jobs are on the decline in all regions of interest. Demonstrators and Product Promoters have fewer opportunities in the Los Angeles area only.
Total Estimated 2008 Jobs
Total Projected 2018 Jobs
Projected Growth (%)
Ave. Annual New Job Openings
Ave. Annual Replacement
Job Openings
Ave. Annual Total Job Openings
First-Line Supervisors/Managers of Retail Sales Workers State of California 177,800 185,500 7,700 (4.3%) 770 3,820 4,590
Inland Empire 18,940 20,070 1,130 (6.0%) 113 406 519
Los Angeles CO 43,630 46,110 2,480 (5.7%) 248 936 1,184
Orange CO 16,140 17,310 1,170 (7.2%) 117 346 463
Cashiers State of California 363,300 388,700 25,400 (7.0%) 2,540 16,320 18,860
Inland Empire 36,110 38,430 2,320 (6.4%) 232 1,622 1,854
Los Angeles CO 94,220 100,730 6,510 (6.9%) 651 4,232 4,883
Orange CO 31,890 32,240 2,350 (7.4%) 235 1,432 1,667
Gaming Change Persons and Booth Cashiers State of California 1,800 1,600 -200 (-11.1%) -20 100 80
Inland Empire 540 460 -80 (-14.8%) -8 32 24
Los Angeles CO 230 210 -20 (-8.7%) -2 12 10
Orange CO N/A N/A N/A N/A N/A N/A
Retail Salespersons State of California 499,400 559,100 59,700 (12.0%) 5,970 13,930 19,900
Inland Empire 48,360 53,580 5,220 (10.8%) 522 1,349 1,871
Los Angeles CO 125,130 136,410 11,280 (9.0%) 1,128 3,490 4,618
Orange CO 48,980 54,420 5,440 (11.1%) 544 1,366 1,910
Sales Representatives, Services, All Other State of California 82,500 89,900 7,400 (9.0%) 740 2,050 2,790
Inland Empire 5,020 5,420 400 (8.0%) 40 124 164

15
Los Angeles CO 23,660 25,140 1,480 (6.3%) 148 587 735
Orange CO 10,650 11,420 770 (7.2%) 77 264 341
Demonstrators and Product Promoters State of California 18,600 19,000 400 (2.2%) 40 540 580
Inland Empire 2,210 2,210 0 (0.0%) 0 64 64
Los Angeles CO 4,400 4,530 130 (3.0%) 13 127 140
Orange CO 1,620 1,570 -50 (-3.1%) -5 52 47
Sales and Related Workers, All Other State of California 30,000 32,600 2,600 (8.7%) 260 670 930
Inland Empire 2,290 2,400 110 (4.8%) 11 51 62
Los Angeles CO 9,720 10,370 650 (6.7%) 65 217 282
Orange CO 3,110 3,270 160 (5.1%) 16 69 85
Stock Clerks and Order Fillers State of California 207,700 237,100 29,400 (14.2%) 2,940 4,780 7,720
Inland Empire 24,870 28,480 3,610 (14.5%) 361 573 934
Los Angeles CO 56,890 63,650 6,760 (11.9%) 676 1,310 1,986
Orange CO 19,140 21,080 1,940 (10.1%) 194 442 636
Driver/Sales Workers State of California 38,700 41,400 2,700 (7.0%) 270 690 960
Inland Empire 3,680 3,910 230 (6.3%) 23 66 89
Los Angeles CO 9,240 10,120 880 (9.5%) 88 165 253
Orange CO 3,390 3,640 250 (7.4%) 25 60 85
Source: Labor Market Information Division, Employment Development Department, Occupation Profile, on the Internet at: http://www.labormarketinfo.edd.ca.gov/ (visited March 12, 2012).
16
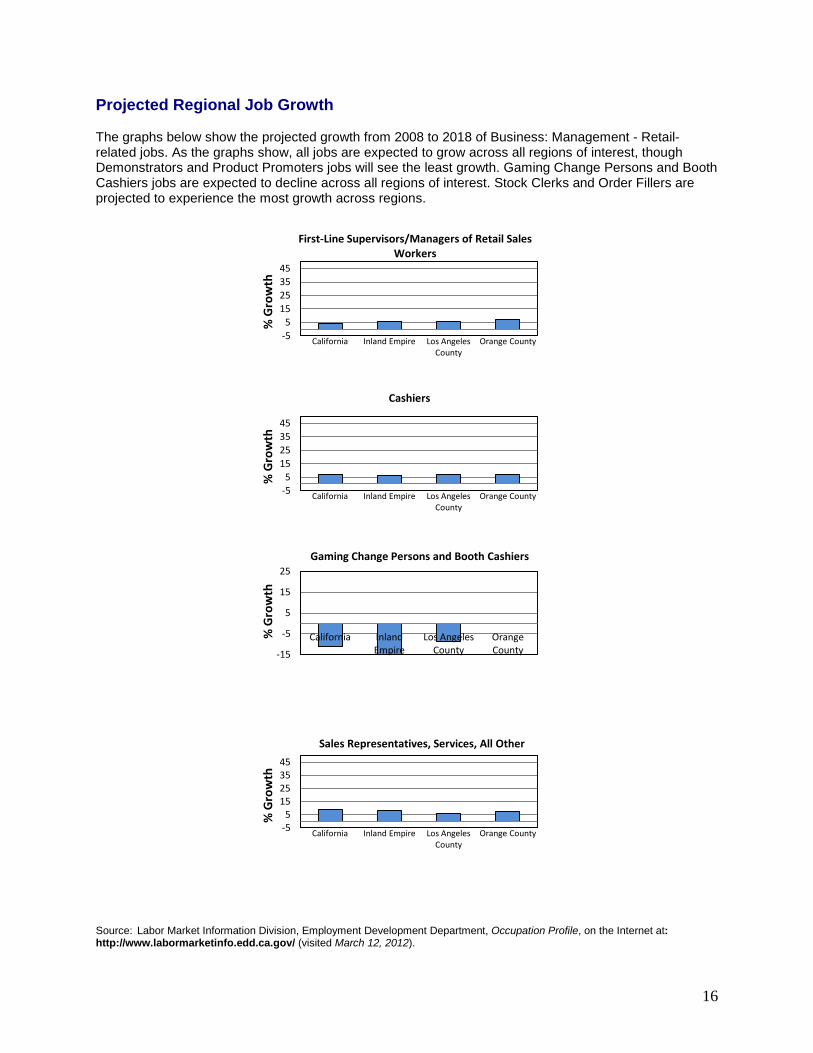
Projected Regional Job Growth The graphs below show the projected growth from 2008 to 2018 of Business: Management - Retail-related jobs. As the graphs show, all jobs are expected to grow across all regions of interest, though Demonstrators and Product Promoters jobs will see the least growth. Gaming Change Persons and Booth Cashiers jobs are expected to decline across all regions of interest. Stock Clerks and Order Fillers are projected to experience the most growth across regions.
-55
15253545
California Inland Empire Los Angeles County
Orange County
% G
row
th
First-Line Supervisors/Managers of Retail Sales Workers
-55
15253545
California Inland Empire Los Angeles County
Orange County
% G
row
th
Cashiers
-15
-5
5
15
25
California Inland Empire
Los Angeles County
Orange County
% G
row
th
Gaming Change Persons and Booth Cashiers
-55
15253545
California Inland Empire Los Angeles County
Orange County
% G
row
th
Sales Representatives, Services, All Other
Source: Labor Market Information Division, Employment Development Department, Occupation Profile, on the Internet at: http://www.labormarketinfo.edd.ca.gov/ (visited March 12, 2012).

17
-55
15253545
California Inland Empire Los Angeles County
Orange County
% G
row
th
Demonstrators and Product Promoters
-55
15253545
California Inland Empire Los Angeles County
Orange County
% G
row
thStock Clerks and Order Fillers
-55
15253545
California Inland Empire Los Angeles County
Orange County
% G
row
th
Driver/Sales Workers
Source: Labor Market Information Division, Employment Development Department, Occupation Profile, on the Internet at: http://www.labormarketinfo.edd.ca.gov/ (visited March 12, 2012).
18
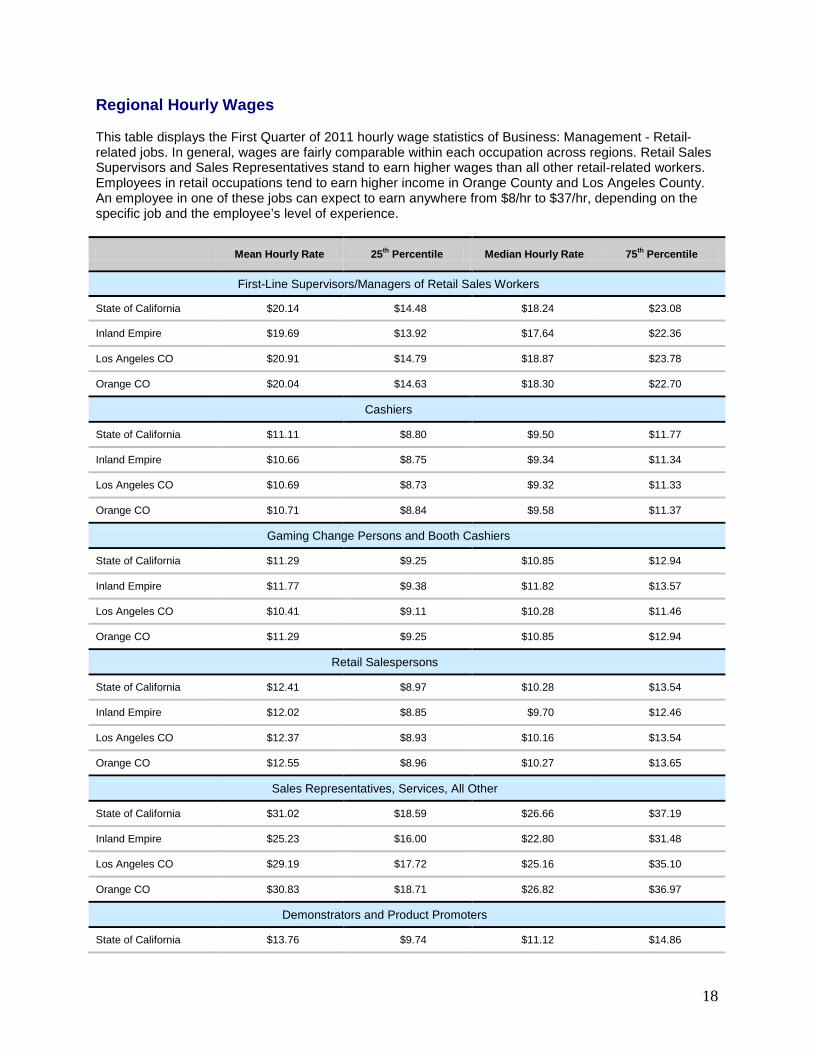
Regional Hourly Wages This table displays the First Quarter of 2011 hourly wage statistics of Business: Management - Retail-related jobs. In general, wages are fairly comparable within each occupation across regions. Retail Sales Supervisors and Sales Representatives stand to earn higher wages than all other retail-related workers. Employees in retail occupations tend to earn higher income in Orange County and Los Angeles County. An employee in one of these jobs can expect to earn anywhere from $8/hr to $37/hr, depending on the specific job and the employee’s level of experience.
Mean Hourly Rate 25th Percentile Median Hourly Rate 75th Percentile
First-Line Supervisors/Managers of Retail Sales Workers
State of California $20.14 $14.48 $18.24 $23.08
Inland Empire $19.69 $13.92 $17.64 $22.36
Los Angeles CO $20.91 $14.79 $18.87 $23.78
Orange CO $20.04 $14.63 $18.30 $22.70
Cashiers
State of California $11.11 $8.80 $9.50 $11.77
Inland Empire $10.66 $8.75 $9.34 $11.34
Los Angeles CO $10.69 $8.73 $9.32 $11.33
Orange CO $10.71 $8.84 $9.58 $11.37
Gaming Change Persons and Booth Cashiers
State of California $11.29 $9.25 $10.85 $12.94
Inland Empire $11.77 $9.38 $11.82 $13.57
Los Angeles CO $10.41 $9.11 $10.28 $11.46
Orange CO $11.29 $9.25 $10.85 $12.94
Retail Salespersons
State of California $12.41 $8.97 $10.28 $13.54
Inland Empire $12.02 $8.85 $9.70 $12.46
Los Angeles CO $12.37 $8.93 $10.16 $13.54
Orange CO $12.55 $8.96 $10.27 $13.65
Sales Representatives, Services, All Other
State of California $31.02 $18.59 $26.66 $37.19
Inland Empire $25.23 $16.00 $22.80 $31.48
Los Angeles CO $29.19 $17.72 $25.16 $35.10
Orange CO $30.83 $18.71 $26.82 $36.97
Demonstrators and Product Promoters
State of California $13.76 $9.74 $11.12 $14.86

19
Inland Empire $10.78 $8.95 $9.60 $11.07
Los Angeles CO $14.83 $9.34 $10.78 $14.81
Orange CO $12.74 $10.18 $11.12 $13.69
Sales and Related Workers, All Other
State of California $21.62 $12.15 $18.17 $27.41
Inland Empire $16.37 $9.61 $12.04 $18.96
Los Angeles CO $21.64 $11.83 $17.93 $27.35
Orange CO $21.30 $12.59 $18.06 $28.43
Stock Clerks and Order Fillers
State of California $12.41 $9.28 $10.93 $14.28
Inland Empire $11.93 $9.30 $10.83 $13.62
Los Angeles CO $12.09 $9.21 $10.63 $13.54
Orange CO $12.13 $9.29 $10.83 $13.83
Driver/Sales Workers
State of California $13.94 $8.95 $9.98 $17.10
Inland Empire $12.83 $9.33 $11.05 $14.90
Los Angeles CO $13.12 $8.89 $10.05 $15.25
Orange CO $15.22 $8.88 $9.54 $20.08
Source: Labor Market Information Division, Employment Development Department, Occupation Profile, on the Internet at: http://www.labormarketinfo.edd.ca.gov/ (visited March 12. 2012).

20
Largest and Fastest Growing Industry Employers
Largest Industry Employers of Business: Management – Retail-Related Occupations The graphs below display the 2008 staffing patterns of the largest industries employing Business: Management - Retail-related occupations across the state of California.
0
2,000
4,000
6,000
8,000
10,000
12,000
14,000
16,000
Num
ber o
f Em
ploy
ees
First-Line Supervisors/Managers of Retail Sales Workers
0
20,000
40,000
60,000
80,000
100,000
120,000
Num
ber o
f Em
ploy
ees
Cashiers

21
0
500
1,000
1,500
2,000
Local Government
Num
ber o
f Em
ploy
ees Gaming Change Persons and Booth Cashiers
0
20,000
40,000
60,000
80,000
100,000
120,000
Num
ber o
f Em
ploy
ees
Retail Salespersons
0500
1,0001,5002,0002,5003,0003,5004,0004,5005,000
Num
ber o
f Em
ploy
ees
Sales Representatives, Services, All Other

22
0
1,000
2,000
3,000
4,000
5,000
6,000
7,000
Num
ber o
f Em
ploy
ees
Demonstrators and Product Promoters
0200400600800
1,0001,2001,4001,6001,8002,000
Num
ber o
f Em
ploy
ees
Sales and Related Workers, All Other
Source: Labor Market Information Division, Employment Development Department, Staffing Patterns, on the Internet at: http://www.labormarketinfo.edd.ca.gov/iomatrix/staffing-patterns1.asp (visited March 12, 2012).

23
0
10,000
20,000
30,000
40,000
50,000
60,000
Num
ber o
f Em
ploy
ees
Stock Clerks and Order Fillers
0
2,000
4,000
6,000
8,000
10,000
12,000
14,000
16,000
Num
ber o
f Em
ploy
ees
Driver/Sales Workers
Source: Labor Market Information Division, Employment Development Department, Staffing Patterns, on the Internet at: http://www.labormarketinfo.edd.ca.gov/iomatrix/staffing-patterns1.asp (visited March 12, 2012).

24
Change Over Time of the Largest Industry Employers of Business: Management – Retail -Related Occupations The graphs below display projections of staffing changes from 2008-2018 of the largest industries employing Business: Management - Retail-related occupations in the state of California.
-30%
-20%
-10%
0%
10%
20%
30%
40%
50%
Perc
ent C
hang
eFirst-Line Supervisors/Managers of Retail Sales Workers
-30%-20%-10%
0%10%20%30%40%50%
Perc
ent C
hang
e
Cashiers
Source: Labor Market Information Division, Employment Development Department, Staffing Patterns, on the Internet at: http://www.labormarketinfo.edd.ca.gov/iomatrix/staffing-patterns1.asp (visited March 12, 2012).

25
-14-12-10
-8-6-4-20
Local Government
Perc
ent C
hang
e
Gaming Change Persons and Booth Cashiers
-20
-10
0
10
20
30
40
Perc
ent C
hang
e
Retail Salespersons
-30
-20
-10
0
10
20
30
40
50
Perc
ent C
hang
e
Sales Representatives, Services, All Other
Source: Labor Market Information Division, Employment Development Department, Staffing Patterns, on the Internet at: http://www.labormarketinfo.edd.ca.gov/iomatrix/staffing-patterns1.asp (visited March 12, 2012).

26
-120
-100
-80
-60
-40
-20
0
20
40
Perc
ent C
hang
e
Demonstrators and Product Promoters
-40-30-20-10
01020304050
Perc
ent C
hang
e
Sales and Related Workers, All Other
Source: Labor Market Information Division, Employment Development Department, Staffing Patterns, on the Internet at: http://www.labormarketinfo.edd.ca.gov/iomatrix/staffing-patterns1.asp (visited March 12, 2012).

27
05
1015202530354045
Perc
ent C
hang
e
Stock Clerks and Order Fillers
-30-20-10
0102030405060
Perc
ent C
hang
e
Driver/Sales Workers
Source: Labor Market Information Division, Employment Development Department, Staffing Patterns, on the Internet at: http://www.labormarketinfo.edd.ca.gov/iomatrix/staffing-patterns1.asp (visited March 12, 2012).

28
Other Industries with Growth in Business: Management – Retail-Related Occupations Aside from the industries that were displayed in the graphs above, six of the Business: Management - Retail-related occupations is associated with growth in an additional industry. The table below displays the industry along with its numeric change and percent growth from 2008 to 2018.
Industry Employment in California
2008 2018 Numeric Change Percent Growth
First-Line Supervisors/Managers of Retail Sales Workers
Furniture Stores 1,200 1,400 200 16.7%
Used Merchandise Stores 1,100 1,200 100 9.0%
Beverage & Tobacco Product Manufacturing 500 600 100 20.0%
Business Support Services 300 400 100 33.3%
Business Support Services 300 400 100 33.3%
Office Administrative Services 100 200 100 100.0%
Employment Services 100 200 100 100.0%
Electronic Markets and Agents/Brokers 100 200 100 100.0%
Electronic Shopping & Mail-Order Houses 100 200 100 100.0%
Cashiers
Sporting Goods/Musical Instrument Stores 6,100 6,200 100 1.6%
Motion Picture and Video Industries 4,400 4,700 300 6.8%
Other Miscellaneous Store Retailers 3,500 3,600 100 2.9%
Full-Service Restaurants 2,900 3,300 400 13.8%
Automobile Dealers 2,800 3,000 200 7.1%
Other Amusement & Recreation Industries 2,600 2,800 200 7.7%
Local Government 2,200 2,300 100 4.5%
Amusement Parks and Arcades 2,100 2,500 400 19.0%
Accommodation 1,600 1,900 300 18.8%
General Medical and Surgical Hospitals 1,300 1,500 200 15.4%
Other Personal Services 1,000 1,200 200 20.0%
Museums, Parks and Historical Sites 900 1,000 100 11.1%
Employment Services 900 1,100 200 22.2%
Spectator Sports 600 700 100 16.7%
Grocery Product Merchant Wholesalers 500 600 100 20.0%
Personal Care Services 400 500 100 25.0%
Colleges and Universities 400 500 100 25.0%
Other Motor Vehicle Dealers 400 500 100 25.0%
Misc Nondurable Goods Merchant Whsle 100 200 100 100.0%
Residential Building Construction 0 100 100 100.0%
Retail Salespersons
Jewelry, Luggage & Leather Goods Stores 10,900 11,400 500 4.6%
Furniture Stores 9,900 11,800 1,900 19.2%
Auto Parts, Accessories, and Tire Stores 6,700 7,000 300 4.5%

29
Grocery Stores 5,800 7,000 1,200 20.7%
Specialty Food Stores 4,200 4,400 200 4.8%
Employment Services 3,800 4,700 900 23.7%
Other Motor Vehicle Dealers 3,600 4,300 700 19.4%
Used Merchandise Stores 3,200 3,700 500 15.6%
Other Amusement & Recreation Industries 1,900 2,100 200 10.5%
Personal Care Services 800 1,000 200 25.0%
Accommodation 700 800 100 14.3%
Civic and Social Organizations 600 700 100 16.7%
Electronic Markets and Agents/Brokers 400 500 100 25.0%
Misc Nondurable Goods Merchant Whsle 400 500 100 25.0%
Commercial Goods Merchant Wholesalers 300 400 100 33.3%
Local Government 200 300 100 50.0%
Full-Service Restaurants 100 200 100 100.0%
Lumber and Supply Merchant Wholesalers 100 200 100 100.0%
Grocery Product Merchant Wholesalers 100 200 100 100.0%
Professional and Similar Organizations 0 100 100 100.0%
Sales Representatives, Services, All Other
Building Foundation/Exterior Contractors 1,000 1,100 100 10.0%
Building Finishing Contractors 900 1,000 100 11.1%
ISPs, Search Portals, & Data Processing 800 900 100 12.5%
Accounting and Bookkeeping Services 700 800 100 14.3%
Specialized Design Services 700 900 200 28.6%
Electronic Markets and Agents/Brokers 700 1,000 300 42.9%
Professional and Similar Organizations 700 800 100 14.3%
Architectural and Engineering Services 500 600 100 20.0%
Activities Rel to Credit Intermediation 500 600 100 20.0% Waste Management and Remediation Service 500 600 100 20.0%
Cable and Other Subscription Programming 400 500 100 25.0%
Electronic Shopping & Mail-Order Houses 400 500 100 25.0%
Medical and Diagnostic Laboratories 400 600 200 50.0%
Home Health Care Services 400 500 100 25.0%
Automobile Dealers 300 400 100 33.3%
Investigation and Security Services 300 400 100 33.3%
Software Publishers 200 300 100 50.0%
Personal Care Services 200 300 100 50.0%
Automotive Repair and Maintenance 200 300 100 50.0%
Offices of Physicians 100 200 100 100.0%
Warehousing and Storage 100 200 100 100.0%
Radio and Television Broadcasting 0 100 100 100.0%
Other Motor Vehicle Dealers 0 100 100 100.0%
Sales and Related Workers, All Other

30
Management & Technical Consulting Svc 400 600 200 50.0%
Software Publishers 400 500 100 25.0%
Other Information Services 400 500 100 25.0% Hardware & Plumbing Merchant Wholesalers 400 500 100 25.0%
Computer Systems Design and Rel Services 300 400 100 33.3%
Automobile Dealers 200 300 100 50.0%
Grocery Product Merchant Wholesalers 200 300 100 50.0%
Social Advocacy Organizations 200 300 100 50.0%
Elementary and Secondary Schools 100 200 100 100.0%
Building Finishing Contractors 0 100 100 100.0%
Stock Clerks and Order Fillers
Building Material and Supplies Dealers 3,600 4,100 500 13.9%
Local Government 3,100 3,300 200 6.5%
General Medical and Surgical Hospitals 2,700 3,100 400 14.8%
Electronics and Appliance Stores 2,500 2,700 200 8.0% Commercial Goods Merchant Wholesalers 2,500 2,700 200 8.0%
Home Furnishings Stores 2,100 2,300 200 9.5% Hardware & Plumbing Merchant Wholesalers 2,000 2,300 300 15.0%
Used Merchandise Stores 2,000 2,200 200 10.0%
Electronic Markets and Agents/Brokers 1,900 2,800 900 47.4%
Sporting Goods/Musical Instrument Stores 1,400 1,500 100 7.1% Apparel/Piece Goods Merchant Wholesalers 1,200 1,500 300 25.0%
Electric Goods Merchant Wholesalers 1,100 1,200 100 9.1%
Advertising and Related Services 1,100 1,200 100 9.1%
Automobile Dealers 800 900 100 12.5%
Furniture Stores 800 1,000 200 25.0%
Building Equipment Contractors 700 800 100 14.3%
Automotive Repair and Maintenance 600 700 100 16.7%
Furniture & Furnishings Merchant Whsle 600 700 100 16.7%
Lumber and Supply Merchant Wholesalers 600 700 100 16.7%
Electronic Shopping & Mail-Order Houses 600 800 200 33.3%
Elementary and Secondary Schools 500 600 100 20.0%
Other Support Services 500 600 100 20.0%
Office Administrative Services 400 500 100 25.0%
Medical Equipment and Supplies Mfg 400 500 100 25.0%
Pharmaceutical & Medicine Manufacturing 300 400 100 33.3%
Home Health Care Services 200 300 100 50.0%
Building Finishing Contractors 200 300 100 50.0%
Nursing Care Facilities 100 200 100 100.0%
Scientific Research and Development Svc 100 200 100 100.0%
Outpatient Care Centers 0 100 100 100.0% Source: Labor Market Information Division, Employment Development Department, Staffing Patterns, on the Internet at: http://www.labormarketinfo.edd.ca.gov/iomatrix/staffing-patterns1.asp (visited March 12, 2012).
31
Regional Graduation Summary
Education and Training3
Education and training requirements for Business: Management - Retail-related occupations vary. First-Line Supervisors/Managers of Retail Sales Workers occupations usually require a high school diploma. Some previous work-related skill, knowledge, or experience is usually needed. Employees in these occupations need anywhere from a few months to one year of working with experienced employees. A recognized apprenticeship program may be associated with these occupations. Cashiers, Gaming Change Persons and Booth Cashiers, Retail Salespersons, Sales Representatives, Demonstrators and Product Promoters, Stock Clerks and Order Fillers, and Driver/Sales Workers occupations may require a high school diploma or GED certificate. Little or no previous work-related skill, knowledge, or experience is needed for these occupations. Employees in these occupations need anywhere from a few days to a few months of training. Usually, an experienced worker could show you how to do the job.
Regional Completers in Business: Management – Retail Programs Data for Business: Management - Retail-related program completers at Chaffey College are not currently available. There are no institutions offering degrees or certificates below the baccalaureate level for this program across the four county region of interest.
Source: National Center for Education Statistics, U.S. Department of Education, Integrated Postsecondary Education Data System, on the Internet at: http://www.nces.ed.gov/collegenavigator/ (visited March 12, 2012)
3Labor Market Info, Employment Development Department, California Occupational Guides, on the Internet at: http://www.labormarketinfo.edd.ca.gov/occguides/ (visited March 12, 2012).

32
Chaffey College’s Performance on Core Indicators The Perkins IV Career and Technical Education Improvement Act of 2006 mandates that all state and local postsecondary institutions provide data on six core performance indicators for their career and technical education programs. These indicators are: 1) Technical Skill Attainment; 2) Completions; 3) Persistence and Transfer; 4) Employment; 5) Non-traditional Participation; and 6) Non-traditional Completion. Performance goals are set at the state and local levels and progress is monitored based on a comparison between the actual percentage of students who master each performance area and the negotiated levels of performance. 2010-2011 Chaffey College Performance on Core Indicators The table below displays negotiated and actual core performance indicator levels for all Chaffey College students classified under the Retail Store Operations and Management TOP code. These students performed above district negotiated levels on Core Indicators 1 and 5a.
Core Performance Indicators Negotiated Level
Chaffey College Performance
Percent Above or Below District
Negotiated Level State District
Business: Management - Retail
Core 1 – Technical Skill Attainment 88.82% 88.82% 100.00% N/A
Core 2 – Completions- Credential, Certificate, Degree, or Transfer Ready 80.93% 76.88% 67.67% N/A
Core 3 – Persistence and Transfer 85.86% 85.86% 75.00% N/A
Core 4 – Employment 81.48% 81.48% DR N/A
Core 5a – Non-traditional Participation 22.08% 20.53% 25.00% N/A
Core 5b – Non-traditional Completions 25.00% 22.75% 0.00% N/A
Source: CA Community Colleges Reporting Services, Retail Store Operations and Management, College Core Indicator Information by 6-Digit TOP (2010-2011).

33
Map of Competitor Institutions
Grocery Stores employ the largest numbers of First-Line Supervisors/Managers of Retail Sales Workers in the state of California. Across the four counties of interest, there are 6,684 Grocery Store employers listed by the California Labor Market (4,257 in Los Angeles County, 1,008 in Orange County, 657 in Riverside County, and 762 in San Bernardino County). This map illustrates the location of the largest 5% of all Grocery Stores in each county.