business math - dealersedge · business math for service managers with ray branch, president, keeps...
TRANSCRIPT

BUSINESS MATH for
SERVICE MANAGERS
With Ray Branch, President, KEEPS CorpModerated by Mike Bowers, Editorial Director, DealersEdge
presented by
1
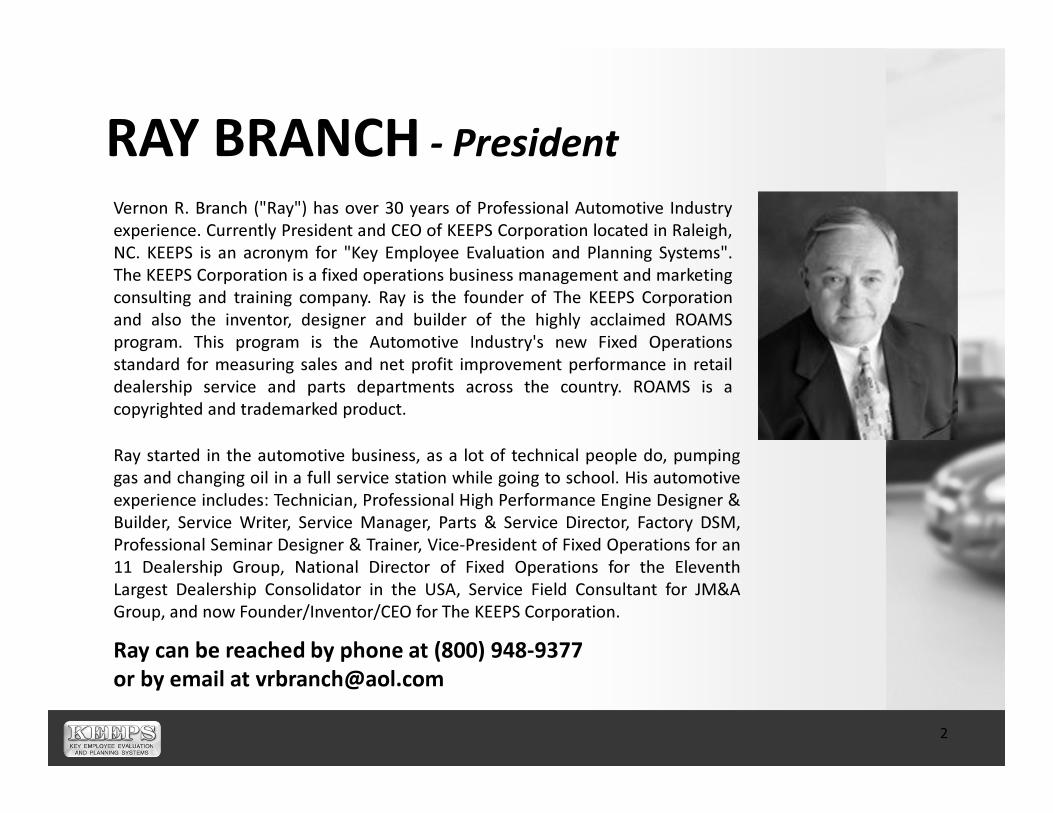
RAY BRANCH - PresidentVernon R. Branch ("Ray") has over 30 years of Professional Automotive Industryexperience. Currently President and CEO of KEEPS Corporation located in Raleigh,NC. KEEPS is an acronym for "Key Employee Evaluation and Planning Systems".The KEEPS Corporation is a fixed operations business management and marketingconsulting and training company. Ray is the founder of The KEEPS Corporationand also the inventor, designer and builder of the highly acclaimed ROAMSprogram. This program is the Automotive Industry's new Fixed Operationsstandard for measuring sales and net profit improvement performance in retaildealership service and parts departments across the country. ROAMS is acopyrighted and trademarked product.
Ray started in the automotive business, as a lot of technical people do, pumpinggas and changing oil in a full service station while going to school. His automotiveexperience includes: Technician, Professional High Performance Engine Designer &Builder, Service Writer, Service Manager, Parts & Service Director, Factory DSM,Professional Seminar Designer & Trainer, Vice-President of Fixed Operations for an11 Dealership Group, National Director of Fixed Operations for the EleventhLargest Dealership Consolidator in the USA, Service Field Consultant for JM&AGroup, and now Founder/Inventor/CEO for The KEEPS Corporation.Ray can be reached by phone at (800) 948-9377 or by email at [email protected]
2

AGENDA1. Fixed Absorption2. Net to Gross Profit Ratio3. Gross Profit (Dollars and Percentages)4. Cost of Sale (COS)5. Effective Labor Rate (Customer Pay)6. Mark-Up Factors7. Personnel Expense8. Repair Order to Service Consultant Ratio9. Repair Order to Tech Ratio10. Tech Value11. Semi Fixed Expense12. Fixed Expense13. Parts to Labor Ratio14. Service Consultant Share Value (ALL Repair Orders)15. Customer Pay Hours per Repair Order16. Putting It All Together/Work Exercise - What does it take to be at 20%+ Net to Gross Profit Ratio
3

FIXED ABSORPTIONBe Careful Here
Several “Absorption” calculations floating around
It is easy to be talking apples and footballs and not know it
4
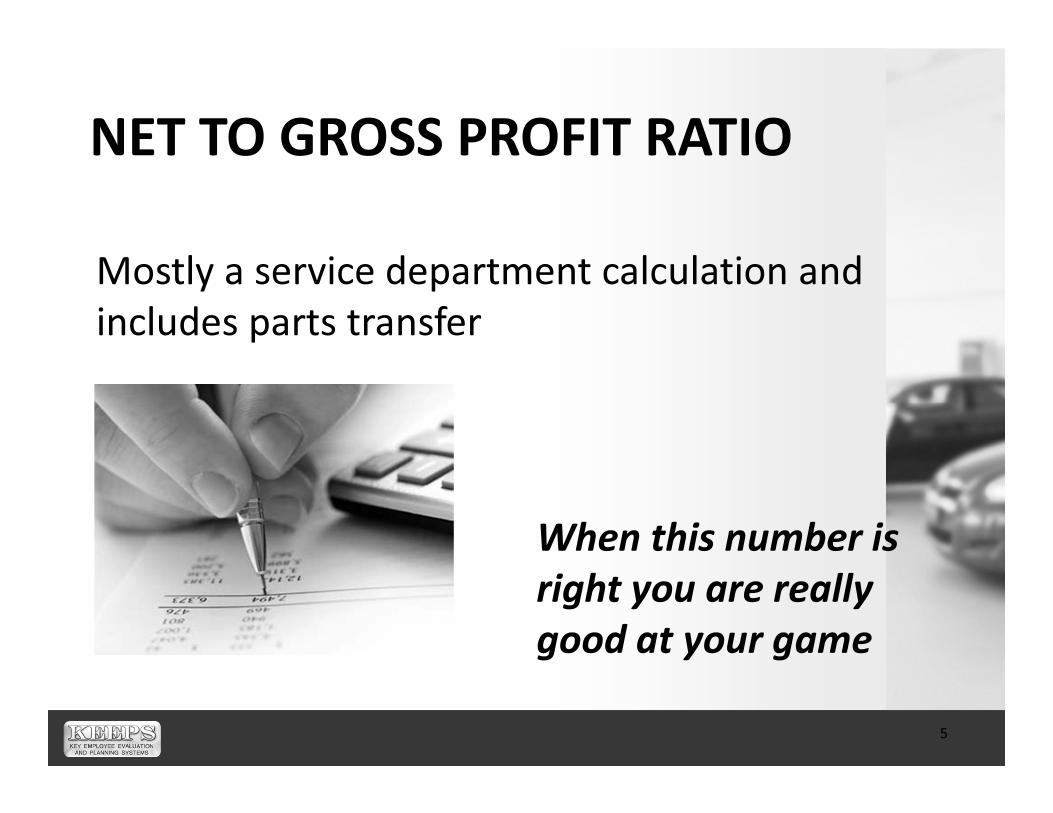
NET TO GROSS PROFIT RATIOMostly a service department calculation and includes parts transfer
When this number is right you are really good at your game
5
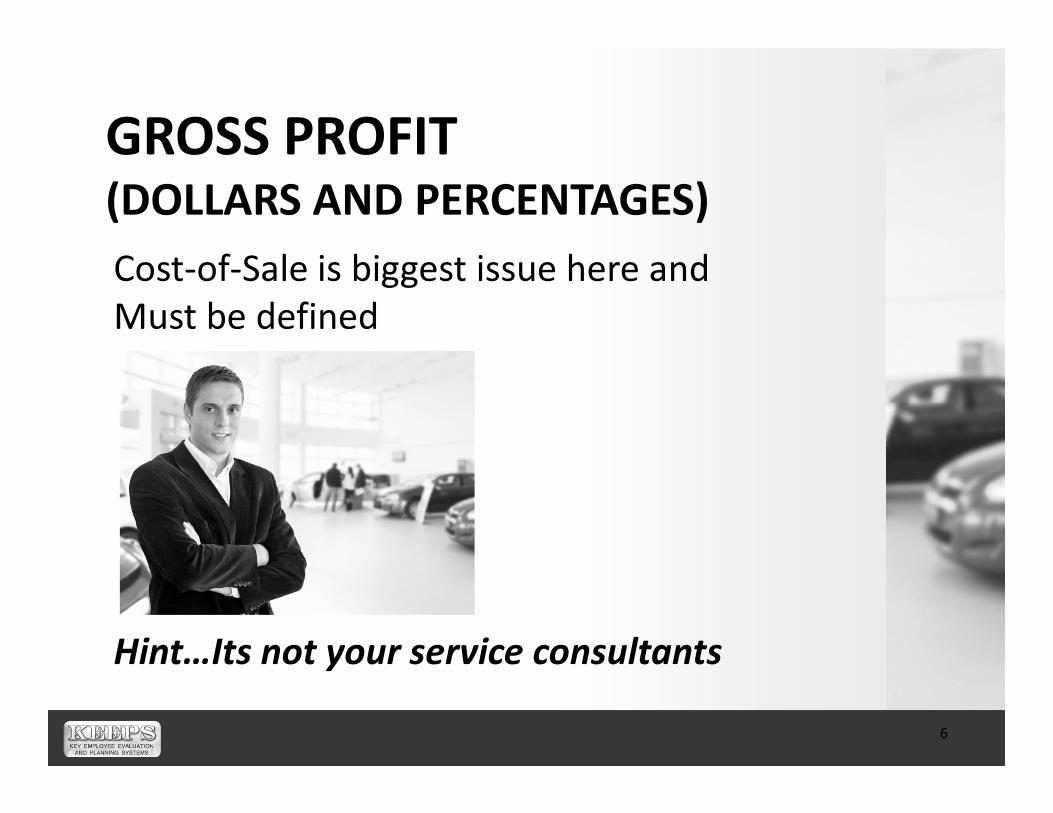
GROSS PROFIT (DOLLARS AND PERCENTAGES)Cost-of-Sale is biggest issue here and Must be defined
Hint…Its not your service consultants6

COST OF SALE (COS)
Now we will get to the exact details
7

EFFECTIVE LABOR RATE (CUSTOMER PAY)Much more than meets the eye
Lots of discussion regarding the one ELR you must know and track
Now we can put the numbers all together
8

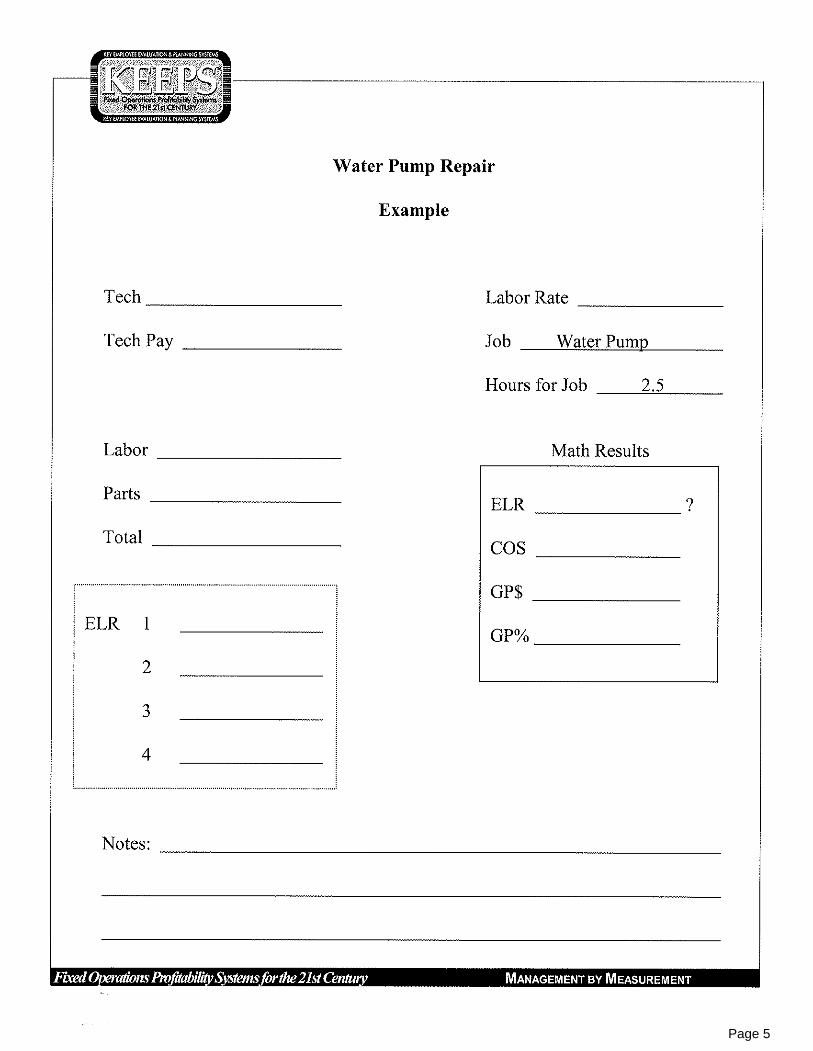
EXAMPLE: WATER PUMP REPAIR
Tech Labor Rate Tech Pay Job Water Pump
Hours for Job 2.5
Labor Math ResultsParts Total
ELR 1 2 3 4
9
ELR COS GP$ GP%

MARK-UP FACTORSNow you can “discover” the sales price with your profit margins built in (protected)
Lots of GOLD hiding in this discussion10

PROFIT MARGIN MARK-UP FACTOR TABLEGP% Desired
Mark-Up Factor
GP% Desired
Mark-Up Factor
GP% Desired
Mark-Up Factor
GP% Desired
Mark-Up Factor
GP% Desired
Mark-Up Factor
10% 1.11 27% 1.37 44% 1.79 61% 2.56 78% 4.55
11% 1.12 28% 1.39 45% 1.82 62% 2.63 79% 4.76
12% 1.14 29% 1.41 46% 1.85 63% 2.70 80% 5.00
13% 1.15 30% 1.43 47% 1.89 64% 2.78
14% 1.16 31% 1.45 48% 1.92 65% 2.86
15% 1.18 32% 1.47 49% 1.96 66% 2.94
16% 1.19 33% 1.49 50% 2.00 67% 3.03
17% 1.20 34% 1.52 51% 2.04 68% 3.13
18% 1.22 35% 1.54 52% 2.08 69% 3.23
19% 1.23 36% 1.56 53% 2.13 70% 3.33
20% 1.25 37% 1.59 54% 2.17 71% 3.45
21% 1.27 38% 1.61 55% 2.22 72% 3.57
22% 1.28 39% 1.64 56% 2.27 73% 3.70
23% 1.30 40% 1.67 57% 2.33 74% 3.85
24% 1.32 41% 1.69 58% 2.38 75% 4.00
25% 1.33 42% 1.72 59% 2.44 76% 4.17
26% 1.35 43% 1.75 60% 2.50 77% 4.35
11

CALCULATING AND USING MARK-UP FACTORS
100 Standard- Minus Gross Profit Margin % desired= Division factor needed to find mark-up factor
100 Standard÷ Division factor= Mark-up factor needed to find retail selling price
Cost of itemX Mark-up factor= Retail selling price that will produce the desired
gross profit margin %12

PERSONNEL EXPENSELet’s make sure we are counting the heads correctly
Techs not included –you’re kidding!!!
13

REPAIR ORDER SERVICE CONSULTANT RATIOCSI is hiding within this calculationMORE is not always good!!!
14

REPAIR ORDER TO TECH RATIONow we can talk “work mix”
Think…LOF tech vs transmission specialist
15

TECH VALUEUsually calculated MonthlyForecasting “Gross” for your Dealer just got real specific
16

SEMI FIXED EXPENSEYou have more control than you thinkAre you walking around with a list of last months “expenses” in you pocket?
It’s that important
17

FIXED EXPENSEYou can HELP reduce fixed expense
Give it some extra thought…You will be surprised how you can influence this area
18

PARTS TO LABOR RATIOOldie but a Goldie and still relevantLet’s discuss why a $1.40 parts to $1.00 labor ratio is not good…
19

SERVICE CONSULTANT SHARE VALUE (ALL REPAIR ORDERS)New term and critical to CSIWe must think “Work Load”
20

CUSTOMER PAY HOURS PER REPAIR ORDERIts important …But is it really??What does this number really measure?What makes it tick?
Deep Dive into the “behind the scene” math
21

SERVICE DEPARTMENT “WHAT DOES IT TAKE” TO BE AT 20% + NET TO GROSS PROFIT RATIO ANALYSISStep 1
Your Net-to-GP% GOAL (should be 20%+)- Current Net-to-GP Ratio (ROI)
(*if positive subtract from goal, if negative add to goal)= Your Net-to-GP% needed to hit your GOAL
Step 2Average Month Total Gross Profit Dollars
X Your Net-to-GP% needed to hit your monthly GOAL= Additional GP Dollars needed monthly to hit you GOAL
22

Step 3 How many more Customer Pay Gross Profit Dollars per Repair Order do you need to hit your Net-to-GP% GOALAdditional GP Dollars needed monthly to hit your GOAL
÷ Average Month Number of Customer Pay Repair Orders= Additional CP Gross Profit Dollars per Repair Order needed to hit
your Net-to-Gross Profit % Goal.(Is this believable & achievable?)
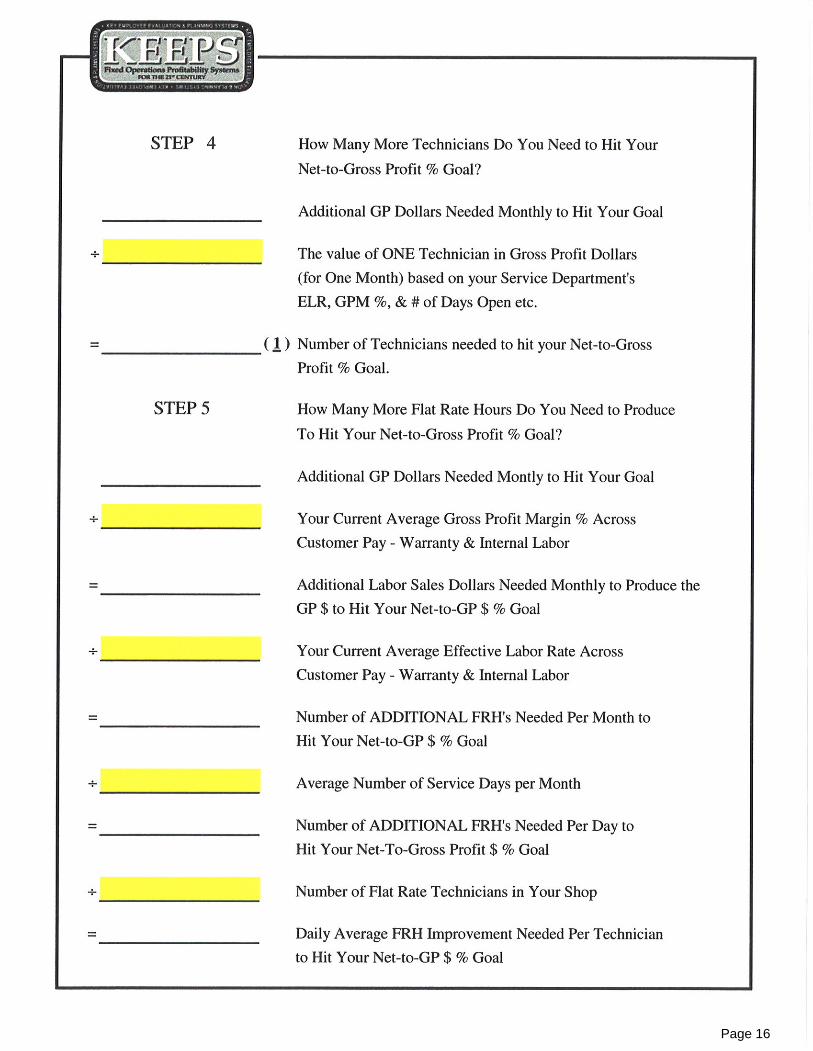
Step 4 How many more technicians Do you need to hit your Net-to-Gross Profit % GoalAdditional GP Dollars needed monthly to hit your goal
÷ The value of ONE technician in Gross Profit Dollars (for one month) based on your Service Department’s ELR, GPM%, & # of days open etc.)
= Number of Technicians needed to hit your Net-to-Gross Profit % Goal.
23

Step 5 How many more flat rate hours do you need to produce to hit your Net-to-Gross Profit % GoalAdditional GP Dollars needed monthly to Hit your Goal
÷ Your Current Average Gross Profit Margin % Across Customer Pay –Warranty & Internal Labor
= Additional Labor Sales Dollars needed monthly to produce the GP$ to hit your Net-to-GP$ % Goal
÷ Your Current Average Effective Labor Rate Across Customer Pay –Warranty & Internal Labor
= Number of additional FRH’s needed per month to hit your Net-to-GP$ % Goal
÷ Average number of service days per month= Number of additional FRH’s needed
per day to hit your Net-to-Gross Profit $ % Goal
÷ Number of Flat Rate Technicians in your shop= Daily Average FRH improvement needed
per technician to hit you Net-to-GP$ % Goal
24

25

26

Page 1
Page 2

Page 3

Page 4
Page 5

Page 6

Page 7

Page 8

Page 9

Page 10

Page 11

Page 12

Page 13

Page 14

Page 15
Page 16