business overview -...
TRANSCRIPT

B U S I N E S S O V E R V I E W
1
Basic Description of the Company
Spicer Driveshaft, an operating unit of Dana Corporation
(NYSE: DCN), is a global leader in the design,
production, assembly, and application of driveshafts and
related components and services. It was Dana's founder
and Spicer Driveshaft's namesake, Clarence Spicer, who
introduced the first universal joint of practical value to the
automotive industry in 1904. Today, Spicer Driveshaft
(SD) is the largest independent supplier of driveshafts and
related components to Original Equipment Manufacturers
(OEM's) and aftermarket customers in North America.
Our products are also manufactured and distributed
around the world by a global network of Dana affiliates
and subsidiaries. SD provides driveshafts and related
components and services to OEM's in the following
vehicular markets:
LIGHT VEHICLEPassenger cars, light- and medium- duty trucks, vans, and
sport utility vehicles
HEAVY VEHICLEClass 6, 7, and 8 trucks, used for freight transportation
OFF-HIGHWAY/INDUSTRIALConstruction and agricultural vehicles, and industrial
equipment, such as material handling systems, hydraulic
pumps, and power take-offs
In addition to original equipment, we also provide
replacement parts for each market through our OEM
customers' service organizations and through Dana's
distribution networks -primarily Dana's Drivetrain Service
Group.
We support our products with engineering services,
including Finite Element Analysis (FEA), product testing,
metallurgical analysis, prototype development, three
dimensional design, and electronic transmission of
drawings. We also provide Advanced Shipping Notices
(ASN's) and Electronic Data Interchange (EDI) to
support our customers' assembly logistics.
Corporate StructureDana Corporation is structured according to seven
Strategic Business Units (SBU's). Within each SBU are
several Product Groups that have responsibility for a
particular product on a global basis. Within each Product
Group are one or more operating units which function as
subunits of the SBU. Each operating unit has a separate
management staff consisting of a general manager,
controller, and managers for each key discipline. For
example, Spicer Driveshaft is a member of the
Automotive Systems Group SBU, and is responsible for
establishing its own business plan in line with the SBU's
objectives, as well as for its own financial performance.
Global Councils in key disciplines (Purchasing,
Manufacturing, Engineering, Sales & Marketing and
Information Technology) facilitate information and
resource sharing, and maximize efficiencies and
economies of scale.
Spicer Driveshaft consists of 17 manufacturing, assembly
and administrative facilities, including our World Center
of Engineering and Technology (WCET).
Our sales/engineering offices and
manufacturing/assembly plants are strategically located to
ensure rapid, uninterrupted supply of product to our
customers and sister facilities.
Our Regional Driveshaft Centers (RDC's) provide Just-in-
Time (JIT) assembly, delivery and line-set service to

B U S I N E S S O V E R V I E W
2
customers. They operate under the direction of a single
staff member and share common goals, processes, and
QS-9000 procedures to assure consistency of quality.
Spicer Driveshaft's Information Technology (IT) systems
are administered by our Information Technology
Resource Center which supports real-time communication
between our facilities and our customers.
As our customers expand globally, Spicer Driveshaft and
Dana are prepared to support them.
Key People Approaches
Spicer Driveshaft employs more than 3,000 people,
including representation by the United Autoworkers and
by the Paper, Allied-Industrial, Chemical and Energy
Workers.
Our culture and values are driven by "The Dana Style of
Management," a philosophy whose primary tenets include
a commitment to:
> GLOBAL MARKET LEADERSHIP AND
CONTINUED GROWTH
> DEVELOPMENT, EMPOWERMENT AND
PARTICIPATION OF ALL EMPLOYEES
> EMPLOYEE IDENTIFICATION WITH, AND PRIDE
AND INVESTMENT IN, DANA
> LEADERSHIP WITH URGENCY, INTEGRITY,
AND RESPECT FOR ALL PEOPLE
> MINIMIZATION OF COMPANY-WIDE
PROCEDURES AND REPORTING LEVELS
> A CROSS-DISCIPLINE WORK EXPERIENCE AND
PROMOTION FROM WITHIN
> CONTINUED, MEASURABLE IMPROVEMENT IN
ALL ASPECTS OF QUALITY
> GOOD GLOBAL CITIZENSHIP, DIVERSITY, AND
RESPECT FOR THE ENVIRONMENT
Our dedication to our people is evident in the tenure of
our employees and the low turnover rates. Our dedication
to communication is evident in the commitment to utilize
our document management system to share ideas,
problems and solutions on real-time basis, allowing such
useful tools as our:
> CONSOLIDATED HUMAN RESOURCES
ACTIVITIES REPORT DATABASE WHICH
ALLOWS COLLECTION, AGGREGATION, AND
ANALYSIS OF KEY HUMAN RESOURCE DATA
> QS-9000 POLICIES, PROCEDURES AND WORK
INSTRUCTIONS
> SHARING OF MANAGEMENT REVIEW M EETING
MINUTES
> PROGRAM MANAGEMENT APPROACH
> DEVELOPMENT OF INTERNET-BASED
TECHNOLOGIES WHICH PROVIDE
INFORMATION ACCESS TO OUR GLOBAL
PARTNERS

B U S I N E S S O V E R V I E W
3
Health & Safety
Dana Environmental Compliance Services (DECS) or
other third-party assessments ensure that all Spicer
Driveshaft facilities meet or exceed applicable health,
safety and environmental requirements. Health and safety
programs are evaluated through audits conducted by
Dana's Risk Management Services. In addition, leadership
has challenged all facilities to achieveISO-14001
registration by the end of 2001.
Customer and Market Requirements
Our customers expect continual improvement in product
and performance characteristics in order to remain
competitive. These include:
> PRODUCT QUALITY
> PRODUCT PERFORMANCE
> ON-TIME DELIVERY
> COMPETITIVE PRICING
> SALES AND ENGINEERING SUPPORT
We also interact with our sister operating units to serve
customer and/or market requirements that cannot be fully
addressed by a single operating unit.
We support end-users' service parts requirements for our
products through the OEM's aftermarket program or
through Dana's Drivetrain Service Group's distribution
network. Our Customer Platform Teams (CPT's) ensure
that customers' needs are anticipated and addressed early
by becoming a part of the customers' application
development systems. By participating with customers in
the Advanced Product Quality Planning (APQP) process
as an integrated team, Spicer Driveshaft is able to
facilitate rapid product development and launches.
Our global resources enable us to serve as a single source
of driveshaft products and services for many of our
customers, and to support global development programs
at worldwide locations. A robust information system
allows us to interface with our global customers in their
desired formats for drawings, order entry, document
response and mail.
Our assembly facilities are located in close proximity to
many customers' assembly plants, allowing us to provide
them with world-class delivery and the capability of line-
set sequencing of components from a variety of suppliers
which may include competitors. As part of our JIT
delivery service, we accept customer order changes within
24 hours of the requested delivery.
Supplier and Partner Relationships
Our primary processes center on the machining and
assembly of components. We rely on a well-developed
supply base for the raw materials required to manufacture
driveshafts. Working together with our suppliers
significantly expands our technology capabilities,
resulting in improvements in quality, productivity, and
cost control, as well as the implementation of new
technologies.
In order to provide JIT delivery to our customers, we
must work closely with our suppliers-whose raw material
lead times are often weeks or months-while maintaining
low inventory levels.
Competitive Situation
Pressures on OEM's to reduce costs and improve
productivity through increased economies of scale have
created an industry trend toward mergers and acquisitions.
This trend continues to reduce the supplier base, while
increasing the demand for price reductions, design and

B U S I N E S S O V E R V I E W
4
sub-assembly services from those suppliers that survive.
In this increasingly complex marketplace, our direct
competitors include several customer ventures, as well as
global independent companies.
Business Directions
During the last year, Spicer Driveshaft has implemented
changes in strategy, some of which include:
> ESTABLISHING VALUE MANAGEMENT
COORDINATORS TO MANAGE OUR
PARTICIPATION IN CUSTOMER-DRIVEN VALUE
ANALYSIS/VALUE ENGINEERING (VA/VE)
PROGRAMS
> INCREASING THE FREQUENCY OF OUR
STRATEGIC BUSINESS COUNCIL MEETINGS TO
INCREASE AGILITY
> CONTINUED ENHANCEMENT OF OUR QUALITY
SYSTEMS ACCORDING TO THE FORMAT AND
REQUIREMENTS OF QS-9000
To further assist our customers in satisfying their
customers, we offer many specialized services, including:
> NVH ANALYSIS OF PROBLEMATIC VEHICLE
PLATFORMS
> JIT DELIVERY TO CUSTOMER ASSEMBLY
FACILITIES
> LINE-SET OF ASSEMBLIES AND COMPONENTS
> ASSEMBLY PROCESS TRAINING
> EVALUATION FOR CUSTOMER ASSEMBLY
OPERATIONS
Customer-focused teams allow us to provide common
products to a globally diverse customer base, setting the
standards and maintaining our position as the industry
leader for driveshafts and related components.

C A T E G O R Y 1 . 0 : L E A D E R S H I P
. 5
Organizational LeadershipSince 1992, Spicer Driveshaft has participated in the
Dana Quality Leadership Process (DQLP)-an internal
corporate program based on the Malcolm Baldrige
National Quality Award criteria. Each year, every Dana
operating unit is expected to submit an application to the
Dana Board of Examiners. The applications are subjected
to a rigorous review, and each operating unit is provided
with written feedback to be used in its continuous
improvement efforts. Cross-functional DQLP teams are a
primary vehicle for analyzing and improving our business
processes.
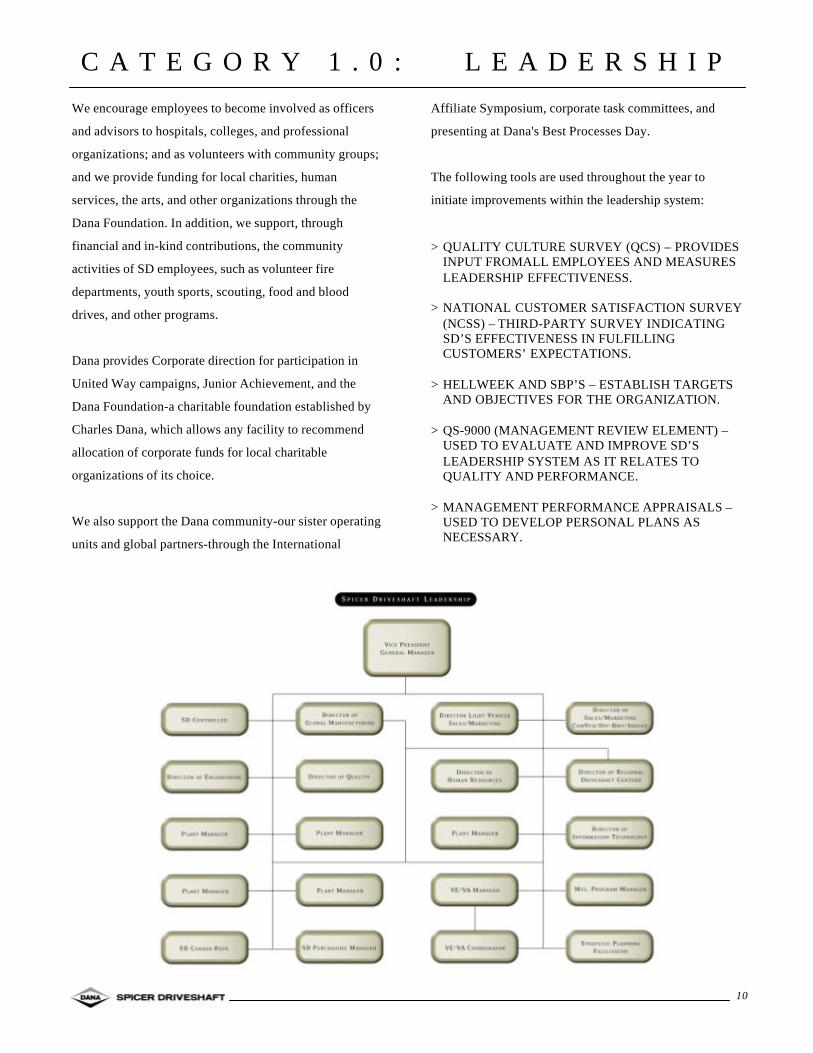
Senior Leadership DirectionSpicer Driveshaft's senior leadership consists of the vice-
president and general manager of our company, and the
SD staff. Together, these individuals make up the SD
Quality Council, the core of SD's leadership system. The
Quality Council is also supported by the Manufacturing
Council and Strategic Business Council (SBC), which
focus on operational and strategic issues respectively.
The Quality Council enumerates its goals, objectives and
action plans in the Strategic Business Plan (SBP). This
plan is translated into specific performance expectations
that are reviewed regularly by the Quality Council, SBC,
Manufacturing Council, and at plant and functional
discipline levels, and adjusted as necessary.
Our total quality policy, vision, and mission statement are
communicated through facility postings and formal
presentations by leadership. They are updated annually
through the Strategic Planning Process. Key Business
Drivers (KBD's) and strategic objectives are deployed
through action plans and our performance management
system, which provides measurable feedback for
continuous improvement.
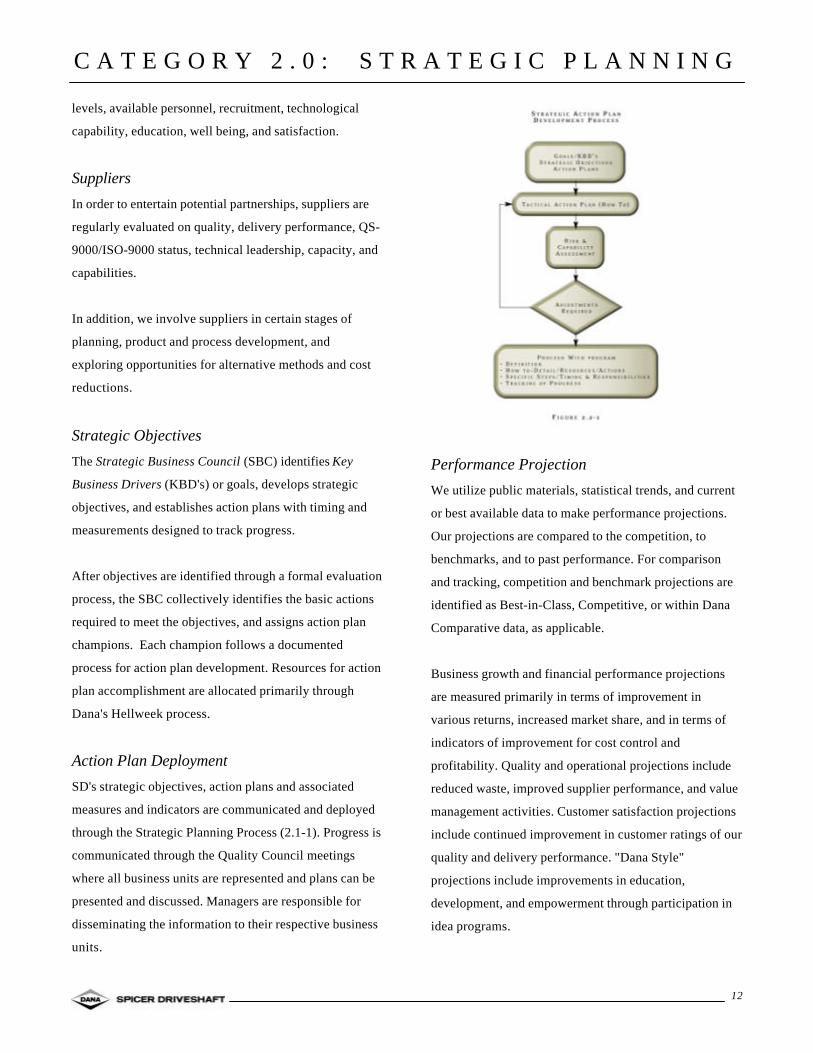
Spicer Driveshaft's vision and mission are translated into
performance requirements through our Strategic Action
Plan Development Process (Figure 2.2-1), KBD's, and
associated *TQM Indicators. Our *TQM Indicators
provide us with a common focus on quality and
performance objectives.
(See Figure 1.1-2)
Spicer Driveshaft leadership creates a consistent customer
focus through the use of Market Strategy Teams (MST's)
and Customer Platform Teams (CPT's), which are
dedicated to specific markets and/or customers. Feedback
from these teams to the Quality Council ensures
continued emphasis on meeting customer expectations.

C A T E G O R Y 1 . 0 : L E A D E R S H I P
. 6
Our quality policy and mission statement are deployed
through the *TQM Control Plan, which translates our
values and expectations into performance requirements.
Customer, quality, and performance data are
communicated company-wide daily via e-mail. As a
result, bulletin boards, Corrective Action Reports
(CAR's), supplier information, and a variety of project
information is available throughout the company.
Because leadership recognizes that Spicer Driveshaft's
primary purpose is to positively affect the eight
stakeholders, the company's performance is reviewed at
monthly Quality Council meetings. Each council member
submits an operations report to the chairman, outlining
the activities in his or her operation relative to key areas
of impact on stakeholders. This information is then
communicated throughout the company via regular staff
and facility meetings. (See Figure 1.1-3)
A Learning EnvironmentOur senior managers establish and reinforce an
environment for empowerment, innovation, and
organizational and employee learning through a variety of
approaches. Each is designed to encourage learning, and
to improve quality, customer satisfaction, and
performance levels. The successful implementation of
ideas and projects are recognized in a variety of ways,
including rewards of money, gift certificates, identity
items, and facility-wide lunches.
Because we believe that continuous learning is essential
to the achievement of performance objectives, education
is a key indicator of our progress toward our KBD of
deploying the Dana Style. Innovation comes from
educated and empowered people, and is evident through
the success of our ideas program, increased productivity,
and technological advancements as reflected in such
indicators as patents granted. Focus on these areas is
assured through their inclusion in our *TQM
measurements.
As a way of reinforcing Spicer Driveshaft's values and
expectations, senior managers recognize teams and
individuals for their contributions, either by mention in

C A T E G O R Y 1 . 0 : L E A D E R S H I P
. 7
group meetings or newsletters, or with awards, such as
Good Performance meals or gift certificates. These types
of recognition are enhanced by more structured programs,
such as a patent award program, stock options, gain
sharing, bonuses, and service awards.
The Quality Council provides a blueprint for our
direction, including future opportunities for growth;
expectations of our eight stakeholders; and corporate
values, goals and expectations through the Strategic
Business Plan (SBP). The SBP outlines specific
objectives-each of which is supported by strategic action
plans.
The Strategic Business Council regularly reviews the SBP
and related action items. This is both to ensure that the
wants and needs of our customers are balanced with
company and corporate objectives, and to explore new
opportunities for growth. The resulting action items are
championed by the appropriate disciplines within the
Quality Council.
For example, the Engineering discipline ensures future
growth opportunities with goal-oriented research and
development activities that consider customer wants,
technological innovations, and operating unit and
corporate expectations.
Organizational Performance ReviewThe Quality Council reviews organizational performance
according to KBD's, Performance Indicators, and *TQM
indicators from our strategic business plan and other
pertinent customer information. This information is then
disseminated by the senior managers to their respective
areas of responsibility, and action plans are established as
required. This process ensures deployment throughout the
company and its comprehensive nature keeps a focus on
maintaining strong organizational health.
In addition, Manufacturing Council meetings, consisting
of select Quality Council members and key operational
personnel and lead by the Director of Manufacturing, are
held to assess organizational needs, competitive
performance, and operational issues on a facility-wide
basis. When organizational performance requirements are
not met, or operational data falls outside expectations,
action plans are implemented by the Manufacturing
Council and then reviewed for effectiveness at the next
meeting.
Recently, a third council activity has been added. The
Strategic Business Council (SBC) is a sub-committee of
the Quality Council and is responsible for strategic
planning, plan reviews, and business condition reviews as
new opportunities are identified.
Through this review process, trends and current levels of
performance are evaluated. Flat or unfavorable indicators
are candidates for improvement actions, and priorities are
set based on the impact on, and the expectations of,
various stakeholders. Once priorities are established, a
champion is assigned to oversee improvement and report
on progress at each council meeting until the desired level
of performance is achieved.
Opportunities for InnovationSince improvement actions normally involve change,
opportunities for innovation become a natural component
of the improvement process. As part of this process,
teams and individuals are encouraged to explore new
technologies, alternative methods and processes, and to
submit ideas. Employee innovation has yielded cost

C A T E G O R Y 1 . 0 : L E A D E R S H I P
. 8
savings, enhanced efficiencies and other performance
improvements.
The structure of these leadership councils ensures that all
areas of Spicer Driveshaft's performance are subject to
review. The Quality and Manufacturing Councils include
representatives from all functional disciplines and Spicer
Driveshaft facilities. The SD general manager leads the
Quality Council meetings, and the Director of Global
Manufacturing leads the Manufacturing Council
meetings. The council members are responsible for
communication and deployment of review findings,
priorities for improvement, and opportunities for
innovation to our people, our customers, and our suppliers
through their respective areas of responsibility.
Improving LeadershipThe Quality Council evaluates and improves the
effectiveness of our leadership system by reviewing
organizational performance and employee feedback, and
by communicating findings and plans for improvement.
In addition, the Dana Quality Leadership Process (DQLP)
is used annually to audit and provide specific feedback on
the entire leadership system. Using the Baldrige criteria as
a benchmark, our DQLP Advisors work with category
teams to implement improvements as necessary.
As a result, we have made several recent improvements to
the leadership system. The Strategic Business Council
provides a consistent focus on direction and improved
linkage to our Strategic Business Plan throughout the
organization. A communications roadmap facilitates
communication, and a new monthly operations report
focuses attention equally on all eight stakeholders.
Public Responsibility and Citizenship"The Philosophies and Policies of Dana" is a one-page
document that addresses our responsibilities to all of our
stakeholders, including the general public and the
communities in which we operate. This document shapes
our approach to public responsibility and provides each
Dana operating unit with the core principles that guide its
practices.
Key ResponsibilitiesAs a manufacturing organization, providing a robust and
durable product is a key public responsibility. Throughout
the design phase, we use a variety of reliability tests
designed to verify required performance characteristics,
including the structural integrity of the product. Safety
information is also included in our service manuals to
ensure that service people have information available to
properly service and maintain our products.
To ensure that Dana's high standards of ethical behavior
and business practices are being met, our corporate audit
staff performs an exhaustive financial systems audit of
each facility each year.
Dana Environmental ComplianceServices (DECS) and other independent organizations
review each facility's safety and environmental
compliance on a regular basis. The general manager and
SD environmental coordinator monitor environmental
audit reports, review the results with the appropriate
manager and address any areas that have fallen short of
expectations. They also track audit results and follow up
monthly with each manager to ensure all items are
resolved. We participate in Dana's Corporate
environmental recognition program with the goal of
having each SD facility meet its award criteria. To further
enhance our environmental management systems, we

C A T E G O R Y 1 . 0 : L E A D E R S H I P
. 9
have challenged each SD facility to become ISO-14001
certified by December of 2001.
Anticipating ConcernsEach SD facility designates a representative to attend
internal and external seminars and regulatory update
meetings. Areas addressed at the facility level include
applicable local environmental issues, hazardous material
awareness and monitoring, and OSHA and EPA
requirements. The facility manager is then responsible
for integrating these activities into operational
requirements and Hellweek planning.
To underscore the designer's responsibility to the public in
terms of product safety, our product engineering
managers attend product liability seminars sponsored by
Dana's law department.
Tools such as Finite Element Analysis (FEA) are used to
anticipate potential design problems and structural
weaknesses, allowing engineering to make product
improvements prior to production.
These approaches enable us to anticipate concerns when
planning facility expansions, equipment purchases,
product designs, or changes to work systems and to
incorporate this information into the business unit's
operational requirements.
Ethics StandardsAll SD units are expected to perform business operations
in a professional and ethical manner. Dana's "Standards of
Business Conduct" brochure provides direction for ethical
conduct in all areas of our business, and is inclusive of all
stakeholders. This document has been distributed to SD
employees and is included in new employee orientation.
The "Dos and Don'ts" of ethics are posted in each SD
facility to help guide behavior. Presentations on corporate
ethics are conducted in facility meetings at various times
throughout the year. SD managers further reinforce our
values through:
> DISCUSSION OF ETHICS AT SD CONTROLLER'S
MEETING
> DISTRIBUTION OF CORPORATE "CODE OF
CONDUCT" CARDS TO SENIOR MANAGEMENT
> DISCUSSION OF SENIOR MANAGEMENT
"STANDARDS OF CONDUCT" EXPECTATIONS
DURING ANNUAL REVIEWS
Support of Key CommunitiesKey communities are those in which our facilities are
located. Each facility is empowered to establish programs
based on the needs of its surrounding communities.
The Spicer Driveshaft general manager and senior
managers consider community involvement to be an
important part of their job responsibilities.
In addition, SD encourages participation in, provides
funding for, and allows time off for participation in civic
and professional organizations at all levels of the
company. Some of these include:
> SOCIETY OF AUTOMOTIVE ENGINEERS> AMERICAN SOCIETY OF ENGINEERS> AMERICAN SOCIETY FOR QUALITY> SOCIETY OF MANUFACTURING ENGINEERS> INSTITUTE OF MANAGEMENT ACCOUNTANTS> SOCIETY OF HUMAN RESOURCE MANAGERS> UNITED WAY> JUNIOR ACHIEVEMENT> THE JAYCEES> CHAMBER OF COMMERCE
C A T E G O R Y 1 . 0 : L E A D E R S H I P
. 10
We encourage employees to become involved as officers
and advisors to hospitals, colleges, and professional
organizations; and as volunteers with community groups;
and we provide funding for local charities, human
services, the arts, and other organizations through the
Dana Foundation. In addition, we support, through
financial and in-kind contributions, the community
activities of SD employees, such as volunteer fire
departments, youth sports, scouting, food and blood
drives, and other programs.
Dana provides Corporate direction for participation in
United Way campaigns, Junior Achievement, and the
Dana Foundation-a charitable foundation established by
Charles Dana, which allows any facility to recommend
allocation of corporate funds for local charitable
organizations of its choice.
We also support the Dana community-our sister operating
units and global partners-through the International
Affiliate Symposium, corporate task committees, and
presenting at Dana's Best Processes Day.
The following tools are used throughout the year to
initiate improvements within the leadership system:
> QUALITY CULTURE SURVEY (QCS) – PROVIDESINPUT FROMALL EMPLOYEES AND MEASURESLEADERSHIP EFFECTIVENESS.
> NATIONAL CUSTOMER SATISFACTION SURVEY(NCSS) – THIRD-PARTY SURVEY INDICATINGSD’S EFFECTIVENESS IN FULFILLINGCUSTOMERS’ EXPECTATIONS.
> HELLWEEK AND SBP’S – ESTABLISH TARGETSAND OBJECTIVES FOR THE ORGANIZATION.
> QS-9000 (MANAGEMENT REVIEW ELEMENT) –USED TO EVALUATE AND IMPROVE SD’SLEADERSHIP SYSTEM AS IT RELATES TOQUALITY AND PERFORMANCE.
> MANAGEMENT PERFORMANCE APPRAISALS –USED TO DEVELOP PERSONAL PLANS ASNECESSARY.

C A T E G O R Y 2 . 0 : S T R A T E G I C P L A N N I N G
11
Strategy Development ProcessThe strategic planning process is divided into two phases.
First, the Strategic Business Plan, produced by the SBC,
provides long-term direction: goals and objectives for the
next three to five years. Then, during Dana's Hellweek
process, we prepare a detailed, one-year business plan for
making short-term progress in line with the long-term
goals and objectives established by Dana and SD.
Hellweek plans are available within each business unit,
allowing cross-functional planning with shop floor,
supervisory, and unit staff personnel. This process also
allows each of our business units to request and plan
resources to support innovation and new technologies as
identified through ongoing improvement efforts.
The long-term planning process is evaluated through
objective measurements derived from sales, profit, and
market position; from participation in the DQLP process;
and via the cross-functional Category 2 team that now
includes the SBC, which reviews the process and initiates
improvements.
Incorporating Key FactorsFactors considered during planning include customer and
market requirements, market expectations, future business
trends, pricing considerations and new opportunities.
Planning input concerning customers begins with the
Customer Platform Teams (CPT's), which provide
specific information relative to their customers'
expectations and requirements; Market Strategy Teams
(MST's) which develop a specific strategy for each of our
designated markets; and our National Customer
Satisfaction Survey (NCSS), which provides direct
evaluations of SD and our competitors in several
categories.
In addition, risk and capability, required investment for
new products or processes, and competitive pricing are all
assessed. Financial risk factors, including program/
product development costs, profit margins, and corporate
objectives are also evaluated. Societal risk factors are
addressed in terms of environmental impact, recyclability,
product liability, and safety.
As SD develops action plans to meet its long- term
strategic objectives, each action plan "champion" is
expected to complete a risk assessment. This information
is then used to modify plans as necessary.
Human ResourcesThe HR Planning Process is designed to support our
strategic planning efforts. A database aggregates key
human resource capability data, while our annual Quality
Culture Survey (QCS) provides direct input from SD
employees. As strategic plans become more detailed,
human resource capabilities are assessed in terms of skill
C A T E G O R Y 2 . 0 : S T R A T E G I C P L A N N I N G
12
levels, available personnel, recruitment, technological
capability, education, well being, and satisfaction.
SuppliersIn order to entertain potential partnerships, suppliers are
regularly evaluated on quality, delivery performance, QS-
9000/ISO-9000 status, technical leadership, capacity, and
capabilities.
In addition, we involve suppliers in certain stages of
planning, product and process development, and
exploring opportunities for alternative methods and cost
reductions.
Strategic ObjectivesThe Strategic Business Council (SBC) identifies Key
Business Drivers (KBD's) or goals, develops strategic
objectives, and establishes action plans with timing and
measurements designed to track progress.
After objectives are identified through a formal evaluation
process, the SBC collectively identifies the basic actions
required to meet the objectives, and assigns action plan
champions. Each champion follows a documented
process for action plan development. Resources for action
plan accomplishment are allocated primarily through
Dana's Hellweek process.
Action Plan DeploymentSD's strategic objectives, action plans and associated
measures and indicators are communicated and deployed
through the Strategic Planning Process (2.1-1). Progress is
communicated through the Quality Council meetings
where all business units are represented and plans can be
presented and discussed. Managers are responsible for
disseminating the information to their respective business
units.
Performance ProjectionWe utilize public materials, statistical trends, and current
or best available data to make performance projections.
Our projections are compared to the competition, to
benchmarks, and to past performance. For comparison
and tracking, competition and benchmark projections are
identified as Best-in-Class, Competitive, or within Dana
Comparative data, as applicable.
Business growth and financial performance projections
are measured primarily in terms of improvement in
various returns, increased market share, and in terms of
indicators of improvement for cost control and
profitability. Quality and operational projections include
reduced waste, improved supplier performance, and value
management activities. Customer satisfaction projections
include continued improvement in customer ratings of our
quality and delivery performance. "Dana Style"
projections include improvements in education,
development, and empowerment through participation in
idea programs.

CATEGORY 3 .0 : CUSTOMER & MARKET FOCUS
13
Customer and Market KnowledgeEach year, SD sales and marketing departments classify
all potential and existing customers within each market
segment. Dana Corporation's defined market (Strategic
Business Unit) segments-light vehicular, heavy vehicular,
off-highway, and aftermarket-directly correspond with
industry standards for weight classification and vocation.
SD provides larger customers with the high volume
production and custom-engineered products they require,
while the Drivetrain Service Group helps customers with
lower-volume, "off the shelf" needs.
The physical proximity of our facilities is just one way we
are able to work closely with our customers to serve the
needs of the highly dynamic and increasingly demanding
automotive industry.
Listening and LearningWithin each of our markets, sales, manufacturing, quality,
and engineering people are assigned to Customer
Platform Teams (CPT's) and are members of a Market
Strategy Team (MST). These groups employ a variety of
listening and learning strategies (3.1-1) to understand key
purchase decision drivers for existing, potential, and
former customers.
The Listening & Learning Processes supply Engineering
with information that is used to generate long-term
Strategic Business Plans. Once these plans are in place,
the Sales & Marketing Department uses this information
to guide its future marketing strategies.
Our sales and engineering personnel gather input from
customers, from other Dana operating units, and from
professional associations and trade shows. Our
understanding of our customers is further enhanced by
dedicated CPT's, Dana's Directors of Business
Development (DBD's), value management activities,
customer training programs and frequent personal contact.
A variety of indirect inputs offer additional perspectives
on the needs and purchase decision drivers of current and
potential customers.
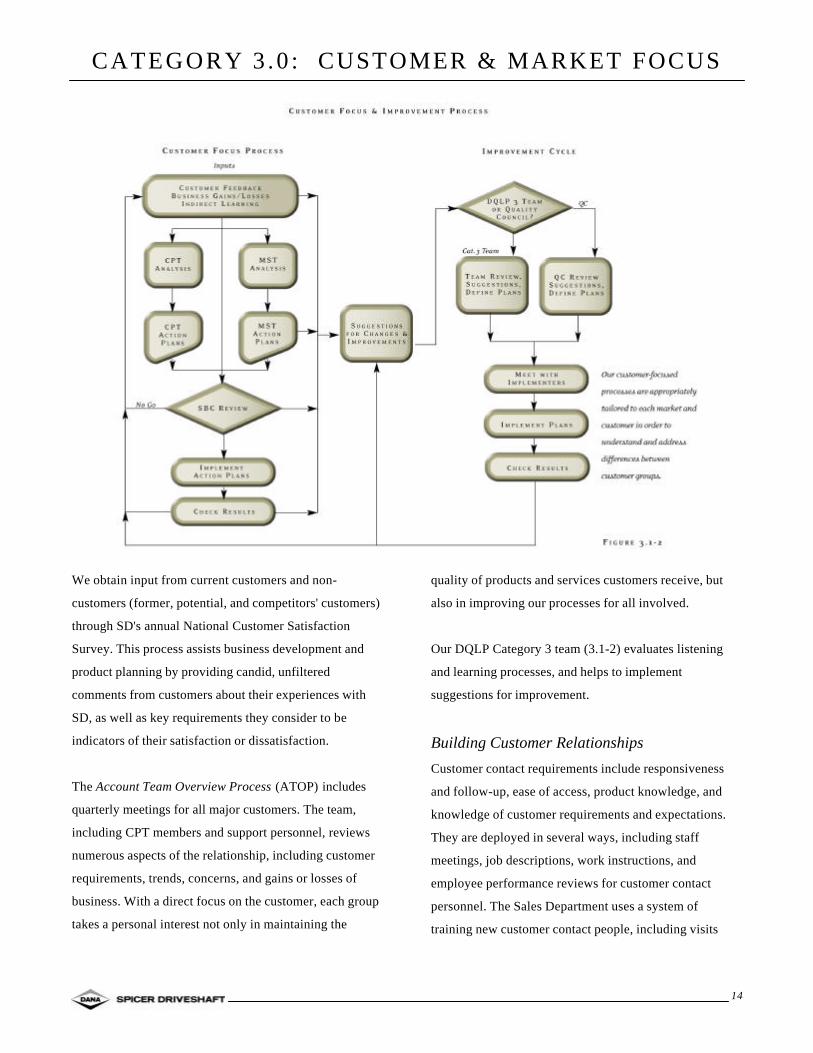
Both the Customer Focus Process (3.1-2) and program
management techniques, such as the APQP process (6.1-
1) provide clear direction regarding customer expectations
and current product planning development. Members of
customer platform teams also use quality system
requirements such as QS-9000, customer quality award
criteria, feedback from customer, engineering and design
meetings, Quality Council, and facilities to fully
understand customers' expectations.
CATEGORY 3 .0 : CUSTOMER & MARKET FOCUS
14
We obtain input from current customers and non-
customers (former, potential, and competitors' customers)
through SD's annual National Customer Satisfaction
Survey. This process assists business development and
product planning by providing candid, unfiltered
comments from customers about their experiences with
SD, as well as key requirements they consider to be
indicators of their satisfaction or dissatisfaction.
The Account Team Overview Process (ATOP) includes
quarterly meetings for all major customers. The team,
including CPT members and support personnel, reviews
numerous aspects of the relationship, including customer
requirements, trends, concerns, and gains or losses of
business. With a direct focus on the customer, each group
takes a personal interest not only in maintaining the
quality of products and services customers receive, but
also in improving our processes for all involved.
Our DQLP Category 3 team (3.1-2) evaluates listening
and learning processes, and helps to implement
suggestions for improvement.
Building Customer RelationshipsCustomer contact requirements include responsiveness
and follow-up, ease of access, product knowledge, and
knowledge of customer requirements and expectations.
They are deployed in several ways, including staff
meetings, job descriptions, work instructions, and
employee performance reviews for customer contact
personnel. The Sales Department uses a system of
training new customer contact people, including visits

CATEGORY 3 .0 : CUSTOMER & MARKET FOCUS
15
with experienced customer contact people, to become
familiar with each customers' own personnel, policies,
procedures, and expectations. Contact management
performance measures include response to problems,
sales representation and engineering support.
THE CORRECTIVE ACTION PROCESS
A standardized Corrective Action Report (CAR) process
communicates customer complaints throughout the
operating unit and ensures prompt follow-up. Complaints
are logged into the system, which automatically assigns
due dates and monitors resolution time. A built-in
escalation mechanism notifies the affected parties of
outstanding CAR's, reassuring the customer that we are
addressing the problem while incentivizing SD people to
resolve the problem.
The CAR system is a closed loop corrective action
system, meaning the person who initiates the CAR is the
only person who can close it out. Whenever possible, the
first contact person receiving the complaint resolves the
problem and then communicates the complaint and
resolution to pertinent parties. The system models
customer-preferred problem-solving methods which place
heavy emphasis on root cause analysis. Short- and long-
term corrective and preventive actions are implemented
and verified. CAR's are reviewed at quarterly ATOP
meetings to ensure that they have been addressed
appropriately.
Because the CAR process is database-driven, information
and results are available electronically throughout Spicer
Driveshaft for use by senior executives, sales, marketing,
engineering, and manufacturing people in all facilities.
Complaint data is then aggregated at the company level
and monitored for adverse trends in terms of frequency,
repetitiveness, PPM rejected, and external failure trends.
The aggregated data are reviewed at monthly Quality
Council meetings, enabling the Council to initiate overall
improvements as necessary.
The CAR process itself is evaluated, improved and
reviewed for effectiveness via management reviews as
required by our Management Responsibility procedure.
ENSURING CUSTOMER ACCESS
SD's customer-focused platform structure provides an
efficient vehicle for generating repeat business and
positive referral. The MST's maintain focus on each of
our key markets, while the CPT's within them maintain an
even narrower focus on particular customers. This
approach allows team members to develop a one-to-one
business relationship with their counterparts at the
customer's various locations.
This approach is augmented by SD manufacturing and
assembly personnel who make periodic visits to customer
assembly facilities, meeting the people who handle and
install our products. These visits allow customers to
express concerns, offer ideas for improvement, and have
their issues (if any) addressed on site. A variety of other

CATEGORY 3 .0 : CUSTOMER & MARKET FOCUS
16
customer-focused activities help to promote goodwill and
encourage positive business relationships by building
loyalty, positive referral, and repeat business with our
customers.
Our approaches to customer access and relationships are
kept current with business needs and directions through
the Customer Focus Process (Figure 3.1-2). The DQLP
Category 3 Team meets throughout the year to review
NCSS results, DQLP feedback, benchmarks, gains/losses
of customers, and complaints relative to customer
contacts.
Customer Satisfaction DeterminationOur approaches for determining customer satisfaction and
dissatisfaction (Figure 3.2-3) are determined by listening
and responding to customer feedback (including
complaint data), monitoring customer-generated ratings of
our performance, studying both internal and external sales
figures, as well as market share numbers, and surveys.
These methods provide valid and reliable feedback on
customer expectations and on satisfaction with products
and services.
Our annual NCSS gathers data from a statistically
significant sample of decision-makers involved in the
specification, procurement, and quality certification of
driveshaft products at existing and potential customers
across all market segments.
The survey questions are designed to meet the following
objectives:
> IDENTIFY CUSTOMER SATISFACTION,
ATTRIBUTE IMPORTANCE BY MARKET
> PROVIDE HIGHLY RELIABLE DATA AND
INFORMATION TO BE USED IN PLANNING AND
DECISION MAKING
> MEASURE CUSTOMER SATISFACTION AND
DISSATISFACTION WITH SD PRODUCTS AND
SERVICES
> MEASURE CUSTOMER SATISFACTION AND
DISSATISFACTION WITH COMPETITORS
> IDENTIFY CUSTOMER RE-PURCHASE
INTENTIONS FOR SD PRODUCTS AND
SERVICES
Validity and reliability are ensured through strict
confidentiality, as well as the use of a third party to
conduct the survey and tabulate the results. Customers
rate eight common attributes in terms of importance, our
performance, and our competitors' performance.
The results are statistically analyzed to assess the need for
improvement and to initiate the continuous improvement
cycle. (See Figure 3.1-2)
An additional customer survey, the Bi-Annual Brand
Survey, focuses on brand loyalty and satisfaction levels
with the individuals responsible for specifying which

CATEGORY 3 .0 : CUSTOMER & MARKET FOCUS
17
driveshaft is used in a particular vehicle. It is segregated
by market and provides additional information on
customer satisfaction with SD and our competitors.
Many customers also employ their own performance
rating systems. These Customer Ratings measure our
performance according to various quality and delivery
indices, as well as cost savings submissions, and other
criteria. We carefully monitor each of these, as well as our
delivery performance to our service customers, tracking
performance and initiating improvement plans as
necessary.
In addition to measuring customer satisfaction, we utilize
several measurement tools that offer an early warning of
potential dissatisfaction. These tools enable us to take a
proactive approach to resolving customer complaints
rather than waiting for them to surface through other
channels.
THE IMPORTANCE OF DIRECT CONTACT
Due to the nature of our business, we are in frequent
contact with our customers. We ship product to and
communicate with our customers several times per day.
This constant interaction occurs electronically, in person,
and by phone, fax and other methods, facilitating
customer access to SD people and providing them
frequent feedback opportunities.
Our account managers and account application engineers
work continually with their customers, providing a natural
medium for follow-up and an almost uninterrupted flow
of actionable customer feedback.
Finally, reciprocal visits provide the invaluable input that
can only face to face contact can produce. We conduct
assembly line audits of customer facilities to ensure the
proper installation of our products in their vehicles, assess
potential problem areas, and identify improvement
opportunities. In turn, our customers are encouraged to
visit our facilities to share their ideas on product designs,
handling, shipping, and packaging requirements.
MEASURING PERFORMANCE
SD collects reliable objective information on competitors
through various market research channels. The NCSS is
our principal source of this information, allowing us to
compare first-hand data on our competitors' level of
customer satisfaction relative to our own. We believe that
the most critical measure is not a comparison to historical
performance, but rather a gap in performance between our
company and the competitor of focus. If we trail a
competitor, we want to close the gap as much as possible.
Conversely, if we are ahead, we want to widen the gap as
much as we are able.
The Customer Focus Process keeps our approaches to
satisfaction determination up to date. Each year the DQLP
Category 3 Team reviews several inputs, including the
feedback reports and data from both the NCSS and the
DQLP process. The team then develops recommendations
for improvement and presents them to the Quality
Council.
The Quality Council periodically reviews customer
satisfaction/dissatisfaction and performance trends,
customer contact attribute measurements, and feedback
from MST's, CPT's, and customers.
Using these inputs, the Quality Council reviews current
processes and approves recommendations for
improvements.

C A T E G O R Y 4 . 0 : I N F O R M A T I O N & A N A L Y S I S
18
Performance MeasurementTwo documents, "The Philosophy and Policies of Dana"
and the Spicer Driveshaft Mission Statement, form the
foundation for our business. The guiding principles they
contain are deployed through our quality policy, Strategic
Business Plan, and Key Business Drivers (KBD's). They
also form the basis for the *TQM Selection Process
(Figure 4.1-1).
The *TQM process drives our activities, determines the
indicators used to measure performance in our daily
operations, and allows us to track organizational
performance overall.
Our performance measurement system consists of the
*TQM Control Plan (Figure 4.1-3), which identifies
principal types of data and additional support
measurement systems. Performance targets for key
measurements are deployed through the Strategic
Business Plan, Hellweek Plan, and *TQM Control Plan.
Results and trends are deployed to users through a variety
of reports, often electronically, for easy user access.
KEY PERFORMANCE INDICATORS
Measures and indicators for tracking overall
organizational performance are determined using the
process depicted in Figure 4.1-1, in conjunction with the
Strategic Planning Process (SPP). Performance
measurement data are integrated and aligned as illustrated
in Figure 4.1-2, providing vertical linkage between
performance data to the Strategic Business Plan (SBP)
and Key Business Drivers (KBD's), as well as our vision
and mission statements. The *TQM Control Plan allows
us to effectively communicate and deploy the
relationships between our mission statement, KBD's, and
associated *TQM Indicators. It also aligns our operations
with goals and priorities by assigning individual and/or
facility responsibilities for each performance
measurement. These key performance measurements are
reviewed by the Quality Council and by each facility's
management staff.
To ensure the completeness of the performance data, each
business unit monitors numerous support measurements.
These measurements are used by various departments and
work areas within our business to support the
achievement of our objectives in the critical performance
areas (Figure 4.1-2). In addition, our measurement
summit employs a cross-functional team review of all
indicators to ensure the data are complete.

C A T E G O R Y 4 . 0 : I N F O R M A T I O N & A N A L Y S I S
19
The Category 4 Team helps to align goals by distributing
the "pyramid" to all facilities, and more recently, by
implementing a mentoring process. Through this process,
team members visit facilities to review the measurement
system with management and to review local site
measurements for alignment with senior-level
management data.
USING COMPARATIVE DATA
Our needs and priorities for comparative information are
determined primarily through the DQLP process and
those in Figure 4.1-1. We use industry averages, best-in-
class, and competitive data to establish our relative
position, both within and outside the industry.
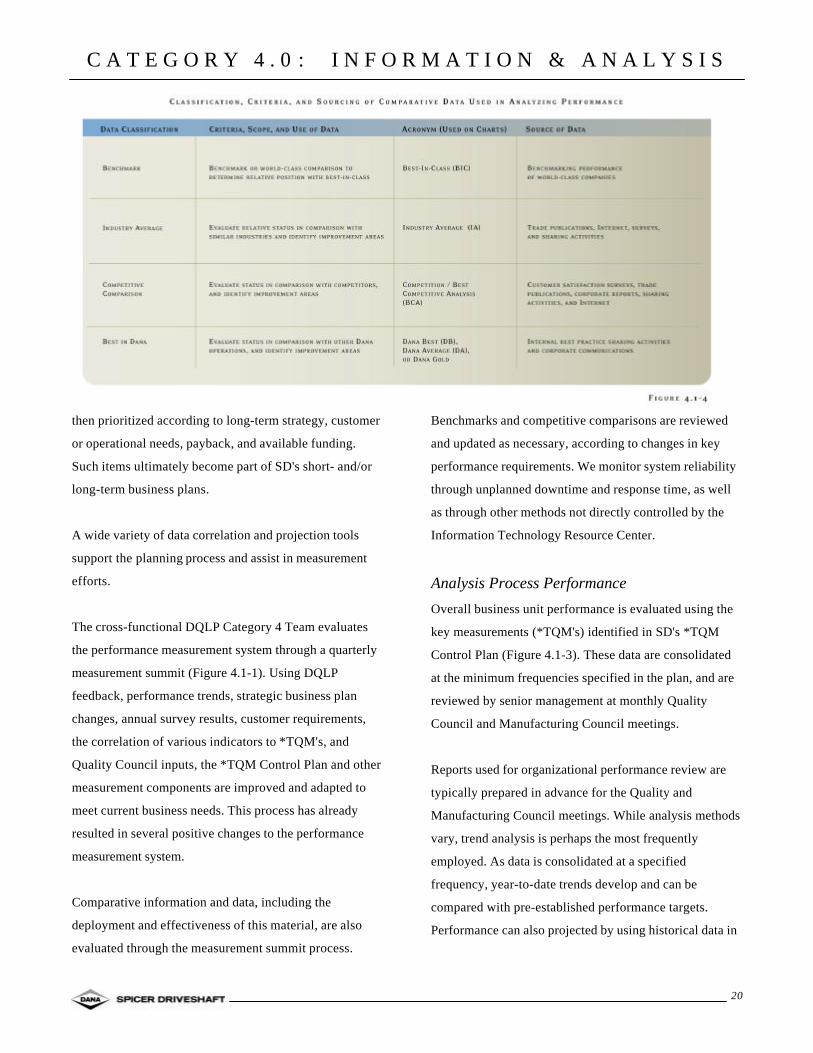
As outlined in Figure 4.1-4, SD includes comparative data
on performance measurement charts (as appropriate) to
ensure deployment. Stretch targets are established by
using comparisons, corporate objectives, and business
unit goals, while gap analysis identifies opportunities for
improvement. These opportunities are prioritized to
generate action plans for improvement and assigned to a
cross-functional team, a single discipline, or an
individual, as appropriate.
ALLOCATING RESOURCES FOR IMPROVEMENT
Each month, SD Quality and Manufacturing Councils
review performance measurement data as reported by
each business unit. These councils evaluate and compare
the cost and financial aspects of improvement options as
they relate to performance targets. The Strategic Business
Council is also involved in similar activities throughout
the year.
The primary vehicle for resource allocation for
improvement projects is SD's annual Hellweek process.
Each business unit prepares a capital plan, requesting
monies for projects such as improving machine capability,
production output, or reducing cycle time. Projects are
C A T E G O R Y 4 . 0 : I N F O R M A T I O N & A N A L Y S I S
20
then prioritized according to long-term strategy, customer
or operational needs, payback, and available funding.
Such items ultimately become part of SD's short- and/or
long-term business plans.
A wide variety of data correlation and projection tools
support the planning process and assist in measurement
efforts.
The cross-functional DQLP Category 4 Team evaluates
the performance measurement system through a quarterly
measurement summit (Figure 4.1-1). Using DQLP
feedback, performance trends, strategic business plan
changes, annual survey results, customer requirements,
the correlation of various indicators to *TQM's, and
Quality Council inputs, the *TQM Control Plan and other
measurement components are improved and adapted to
meet current business needs. This process has already
resulted in several positive changes to the performance
measurement system.
Comparative information and data, including the
deployment and effectiveness of this material, are also
evaluated through the measurement summit process.
Benchmarks and competitive comparisons are reviewed
and updated as necessary, according to changes in key
performance requirements. We monitor system reliability
through unplanned downtime and response time, as well
as through other methods not directly controlled by the
Information Technology Resource Center.
Analysis Process PerformanceOverall business unit performance is evaluated using the
key measurements (*TQM's) identified in SD's *TQM
Control Plan (Figure 4.1-3). These data are consolidated
at the minimum frequencies specified in the plan, and are
reviewed by senior management at monthly Quality
Council and Manufacturing Council meetings.
Reports used for organizational performance review are
typically prepared in advance for the Quality and
Manufacturing Council meetings. While analysis methods
vary, trend analysis is perhaps the most frequently
employed. As data is consolidated at a specified
frequency, year-to-date trends develop and can be
compared with pre-established performance targets.
Performance can also projected by using historical data in

C A T E G O R Y 4 . 0 : I N F O R M A T I O N & A N A L Y S I S
21
conjunction with knowledge of how upcoming events
affect particular trends. Statistical methods are also used,
including correlation analysis, Statistical Process Control
limits and other analysis methods to evaluate performance
data.
Analysis can accurately assess overall organizational
health when used within a strategically aligned
measurement system. At SD, we ensure that all
measurement data are aligned with the strategic direction.
ALIGNING PERFORMANCE WITH VISION
Our Vision and Mission Statements give rise to five key
KBD's, which are also the drivers of our Strategic
Business Plan. *TQM's and other TQM's are aligned with
each KBD (Figure 4.1-2). Local site and departmental
indicators support each KBD. This structured method of
aligning performance data with overall strategic direction
ensures that analysis and review is available to the entire
organization, as well as its various components. In
addition, part of the measurement summit process is
devoted to a review of work group or functional level
measures to ensure alignment to our vision, mission, and
KBD's.
As identified in Figure 4.1-2, various levels of SD's
organization review and analyze certain types and levels
of data. Data pertaining to work groups and/or functional-
level operations is primarily analyzed and reviewed by
plant or facility managers and departmental managers or
supervisors. As illustrated in the pyramid, there is an
overlap between those individuals involved at the middle
level and the levels above or below. This overlap, coupled
with the vertically integrated data structure, ensures that
overall performance is directly linked to work group
performance.
Because our total business unit data is aggregated from
plant or department-level data, our measurement reporting
structure can be linked to work group performance. This
structure allows us to segregate and analyze customer
data, quality and operational data, and employee data in a
wide variety of combinations.
Designated personnel at each location report key
performance data to SD to consolidate, analyze, and
prepare it for review. Formal consolidated reports and
charts are maintained for ongoing measurement of
company performance. Many of these reports are
communicated through the various electronic conferences
available on our client server network.
Key senior-level performance measurements and
supporting data are also analyzed annually for causal
connections and those performance data with strong linear
relationships are prioritized for further investigation. By
analyzing data in this manner, SD is better able to
understand the influence of certain indicators on key
results, allowing us to further improve the usefulness of
our measurement systems.
In addition to the measurements identified in Figure 4.1-3,
we monitor numerous additional characteristics in support
of our KBD's. For instance, plant-or facility-level
performance tracking is aligned with the *TQM Control
Plan and KBD's in support of overall performance. All
data and associated action plans are consolidated,
analyzed and reviewed by the individual, department,
discipline or facility, as appropriate.
Additionally, analysis used at the work group level may
also include other more specific techniques, including
root cause analysis or 8D problem-solving, Pareto
analysis, SPC or other statistical tools, measurement
C A T E G O R Y 4 . 0 : I N F O R M A T I O N & A N A L Y S I S
22
system analysis (Gage Repeatability & Reproducibility
studies), and Weibull analysis - a statistical tool used to
evaluate and predict useful life of new products during the
development phase. These and other techniques are
typically used in support of daily operations.
Typically, organizational-level and work group-level
analysis will identify trends and conditions that require
action at the operational level. For example, SD monitors
all customer ratings as key indicators of customer
satisfaction. If SD's overall delivery performance rating
shows an unfavorable trend, additional analysis is
required to understand the root cause. This will typically
lead to a specific action plan required at the operational
level of one or more locations to improve performance,
ultimately resulting in improvement of the group's overall
rating, as well as that of each facility.
Through the structure illustrated in Figure 4.1-2, SD is
able to analyze performance data at any level within the
organization, and by moving up or down the pyramid to
the appropriate level, develop action plans to improve
both organizational- and operational-level performance.
Because our measurement system is aligned with our
KBD's and strategic objectives, data analysis at any level
remains aligned with our strategic action plans.

C A T E G O R Y 5 . 0 : H U M A N R E S O U R C E F O C U S
23
Work SystemsOur culture and values are driven by a management
philosophy known as The Dana Style. "People are our
most important asset" is one of the core values upon
which this philosophy is based. Spicer Driveshaft's human
resource focus is driven from this belief and philosophy.
Designing, organizing, and managing SD's work and jobs
is a dynamic process, involving multiple disciplines and
various levels of management and employees, with input
from empowered employees who actually perform the
work. (See Figure 5.1-1)
HR planning results in action plans and associated
employee performance management indicators such as
ideas per person per month, ideas implementation rate,
Quality Culture Survey results (empowerment category),
QCS overall results, and productivity. With the exception
of the annual Quality Culture Survey, these items are
compiled monthly as part of the HR Activity Report
database that tracks all facilities in the organization and
facilitates performance management.
REWARDS AND INCENTIVES
We use both group and individual compensation and
reward programs to reinforce high performance. Some of
the various programs used include compensation,
gainsharing and incentive plans, bonuses, promote-from-
within, tuition reimbursement, and reward and recognition
approaches.
Managers at each facility evaluate characteristics and
skills needed by potential employees in accordance with
departmental and organizational requirements that support
the strategic plan. Inputs to the evaluation include the
performance requirements of the job (i.e., job
descriptions, educational levels, skill levels, etc.);
customer needs; strategic planning; and regulatory
requirements. We use many recruiting approaches to
ensure that the diversity plan is deployed and that our
hiring practices reflect the diversity of our communities.
Effective communication, cooperation, knowledge, and
skills are shared to meet customer and/or operational
requirements that are included in Figure 5.1-2.
Effectiveness of these approaches is evaluated annually
through the results of the Quality Culture Survey. (See
Figure 5.1-2)

C A T E G O R Y 5 . 0 : H U M A N R E S O U R C E F O C U S
24
Employee Education, Training and
DevelopmentCorporate office and plant human resource managers, in
conjunction with the Training and Education Council
(TEC), are responsible for the assessment of our
education and training needs. We use inputs from
individual, departmental, and organizational assessments,
performance appraisal feedback, the QCS, and strategic
objectives to design and implement our training and
education plans.
A diversity awareness program was conducted with an
outside source as a pilot program for our Strategic
Business Council and office supervisory staff. A diversity
plan has been approved that includes a diversity training
program, which will be deployed to all Spicer Driveshaft
people by the end of the second quarter of 2002.
Our annual education and training process is depicted in
Figure 5.1-1.
EDUCATION AND TRAINING PROCESS
The Spicer Driveshaft training approach also supports
employee development, learning and career progression.
Figure 5.2-2 on the following page details programs and
processes in these areas.

C A T E G O R Y 5 . 0 : H U M A N R E S O U R C E F O C U S
25
We use several approaches to address performance
excellence in education and training in the areas of
performance and skill standards, quality control and
benchmarking as depicted in Figure 5.2-4 on the
following page.
Figure 5.2-3 represents our approaches reinforcing
knowledge and skills on the job.
LEARNING AND CAREER PROGRESSION
APPROACHES
Spicer Driveshaft is proactive in maintaining a safe and
healthy environment. All plants have safety and
ergonomic teams with cross-functional and varied
organizational levels of membership. Members of those
teams provide inputs and identify factors for improving
workplace health, safety, and ergonomics. Also, the
annual Quality Culture Survey provides feedback
pertaining to workplace health, safety, and ergonomics.
Safety and ergonomic improvements are also considered
during Process Improvement Team and Blitz activities.
Employee Well-Being and SatisfactionHuman resource and facility management are responsible
for determining the key factors that affect employee well-
being, satisfaction and motivation. These are primarily
determined through use of our Quality Culture Survey
(QCS), which is conducted regularly at each SD facility.
The QCS consists of 57 specific questions that are
grouped into 18 categories. These categories are:
> PRODUCTIVITY
> COMPANY SATISFACTION
> SAFETY & WORKING CONDITIONS
> CUSTOMER SATISFACTION
> COMMUNICATION
> PERSON REPORTING TO
> DANA STYLE DEPLOYMENT
> EMPOWERMENT
> LEADERSHIP / MANAGEMENT
> GROWTH / DEVELOPMENT
> FAIR TREATMENT
> PAY AND BENEFITS
> QUALITY
> TRAINING & EDUCATION
> JOB SECURITY
> TEAMWORK
> RECOGNITION
> INVOLVEMENT
The QCS results are used annually to identify those
factors that affect employee well-being, satisfaction, and
motivation, as well as provide a forum for anonymous
comments. Additional inputs include ideas programs,
open door policy, grievances, and inputs from various
teams and committees at each facility. Results are
compared (via a third-party source) to worldwide norms
and best-in-class values for the survey categories. To
assess satisfaction levels within our workforce, the survey
results are segmented by facility, years of service, payroll
type, department, and shift. Plant managers and staff must
form action plans to address areas for improvement within
six weeks after receiving the results.
Human Resource managers review the findings and
initiate action plans, while cross-functional task forces
redirect efforts for employee well-being and satisfaction.
We measure action plan effectiveness through the annual
survey and continuous monitoring of human resource
TQM data. Statistical analyses of TQM indicators such as
education hours, ideas, and QCS results are reviewed
annually for correlation with certain key business
performance measurements, enabling us to focus on areas
that impact overall company performance.

C A T E G O R Y 5 . 0 : H U M A N R E S O U R C E F O C U S
26

C A T E G O R Y 6 . 0 : P R O C E S S M A N A G E M E N T
27
Work Product & Service ProcessesThe Advanced Product Quality Planning (APQP) process
ensures that all products and services and related
production and delivery processes are aligned with the
needs of the markets we serve.
DESIGN PROCESSES
Product design begins early in the process and produces
engineering drawings, specifications, and any special
processing or customer requirements. Production and
delivery process design begin only slightly later, allowing
us to simultaneously develop or modify production
process flowcharts, work instructions, process control
plans, and delivery requirements and standards, including
packaging, labeling, and shipping instructions.
Customers and selected suppliers are an integral part of
the APQP process. Customer-driven product development
programs are based on a customer's particular needs for a
vehicle or platform, and customers typically participate as
active team members. We employ a variety of other
methods to solicit customer input and communicate
requirements to the APQP team.
We track supplier activities as part of our overall project
plan to assure timely delivery of newly developed
products. We also review and respond to changing
customer and market requirements at specific steps in the
process, although they can also be addressed at any time.
Changes are implemented through specific engineering
change procedures, and result in drawing and
specification updates. Changes in production or delivery
requirements are implemented through modifications to
purchase orders, process control plans, SOP's, work
instructions, and packaging and shipping instructions.
New technology is continually incorporated into products,
services, and production/delivery systems. Inputs include
trade shows, benchmarking, competitive product analysis,
customer and supplier inputs and developmental programs
with universities. Outputs include improved products and
processes, as well as production and delivery
requirements. Specific groups and task forces present and
recommend implementation yearly in Hellweek plans and
on an ongoing basis to the Strategic Business Council for
approval.
Production and Delivery Processes
QUALITY AND PRODUCT PERFORMANCE
REQUIREMENTS
We employ Design Failure Modes and Effects Analysis
(DFMEA) and Process Failure Mode and Effects
Analysis (PFMEA), to ensure that all appropriate
specifications and performance requirements are
incorporated into the manufacturing, production and
assembly processes. Significant Characteristics (SC)
identify special processing requirements or controls where
required. These requirements are deployed through
procedures, work instructions, FMEA's, control plans,
inspection instructions, process control sheets, and similar
methods.
Delivery Performance RequirementsDelivery performance requirements and expectations are
communicated to our production facilities through direct
customer contact, contract review procedures, APQP team
meetings, and/or our sales personnel. Requirements are
deployed through purchase orders or contracts, customer
packaging and shipping specifications, written or
electronic work instructions, and other media based upon
customer needs.

C A T E G O R Y 6 . 0 : P R O C E S S M A N A G E M E N T
28
PERFORMANCE REQUIREMENTS
Our sales personnel and direct customer input provide
projected volumes, daily scheduling requirements, target
costs, and other related information that our production
facilities use to establish productivity and other
efficiency-related requirements. These inputs are balanced
with capacity and production capabilities, desired profit
margins, and manufacturing costs. Facility management
then establishes performance standards and associated
measurements necessary to meet performance targets.
COORDINATION AND TESTING
Our Design Verification Plan and Report process helps to
coordinate and document testing activity and ensure
timely, trouble-free introduction of products. The APQP
team also develops a test plan that includes design and
production process validation testing.
Once Design Validation (DV) testing verifies the integrity
of the product design, Engineering releases the details
needed for prototype parts to be built. Parts are evaluated
using applicable industry, or regulatory required tests, as
well as internal lab testing according to our Joint Testing
Specifications and Joint Testing Procedures. DV testing is
performed on lab samples, as well as pre-production
prototypes, and is often followed by field-testing the
product in the intended application.
Production Trial Runs (PTR's) assure that product designs
can be produced at the required volumes and to the
required level of process capability. Customers are often
involved in PTR planning and are present on site during
the actual process.
During the PTR, production-ready processes are used to
produce a predetermined quantity of parts, and process
capability is assessed, including packaging and labeling
requirements. Parts are measured for conformance to all
specifications as part of the Production Part Approval
Process, and samples are sent to our engineering lab for
Production Validation (PV) testing.
EVALUATING AND IMPROVING PROCESSES
The overall APQP process is evaluated during annual
internal audits and formal third-party assessments of our
quality systems. At the end of a major program launch,
we hold "lessons learned" sessions with our customers
and APQP teams. Any ideas for improvement are then
shared at Dana's Best Processes Day, Technology
Roundtable sessions, corporate quality councils, and
various methods of sharing with team members, including
our program management database.
To monitor and maintain process integrity, our facilities
develop process control plans, Standard Operating
Procedures (SOP's), work instructions, inspection
instructions, and packaging/shipping instructions. Control
plans indicate those characteristics that contribute to form,
function, and fit and are derived from FMEA's. Where
appropriate, engineering identifies potential Key Control
Characteristics (KCC's) or SC's for products.
Measurement system reliability is ensured through
traceability to recognized international standards, and
through the performance of measurement system variation
studies (GR&R's). SPC or other approved control
methods are used in facilities to monitor quality
characteristics. Operators and cell technicians are
empowered to correct out of control conditions or to shut
down an operation if necessary. In addition, our
production planning system is available in all production
locations to address scheduling and inventory
management.
C A T E G O R Y 6 . 0 : P R O C E S S M A N A G E M E N T
29
INCORPORATING FEEDBACK AND
IMPROVEMENTS
Customer input is continually solicited from all customer
disciplines in the form of verbal requests, CAR's,
performance ratings, or, more commonly now, through
APQP meetings. Our customers' performance requirement
rating feedback is tracked locally and reported monthly.
Every quarter, each operating unit's performance is
reviewed in corporate Continuous Improvement Meetings
where general managers are held accountable for
customers' perceptions of their operating unit's
performance.
In addition, QS-9000 registration and semi-annual
surveillance audits have also proven to be beneficial in
the evaluation and improvement of Spicer Driveshaft
product and service processes.
Part of the process improvement cycle is evaluating the
effectiveness of our business process implementation. We
receive this information through various means, including
customer feedback and customer satisfaction surveys
(primarily the NCSS).
On a regular basis, an SC task force evaluates process
capabilities for significant characteristics comparing
performances at different plants and processes. Best
practices are exchanged and future processes are
determined. Management review meetings are held at
both company and facility levels. Quality and operational
performance are reviewed, and corrective actions are
initiated per defined procedures.
Our processes are systematically evaluated and improved
to achieve better performance. Evaluation is
accomplished through TQM and other measurements
previously discussed. Improvement is accomplished
through a variety of activities. Some of these include
Process Improvement team and Blitz team activities,
benchmarking, alternative technology, process analysis,
and information sharing. Teams are active in process
simplification, waste reduction, research and
development, and exploration of alternative materials and
technologies.
Support ProcessesKey support process requirements are determined by their
process owners and in accordance with the following:
> KBD'S & SD OBJECTIVES
> GOVERNMENT REQUIREMENTS
> CUSTOMER REQUIREMEN TS
(INTERNAL AND EXTERNAL)
> CORPORATE, STRATEGIC BUSINESS UNIT, AND
COMPANY POLICY
> COMPANY BELIEFS AND VALUES
MEETING KEY REQUIREMENTS
We employ in-process and end-of-process measurements
to maintain support process performance, thus ensuring
results that will meet operational and customer
requirements. These measurements are reviewed at staff
and departmental meetings, and to ensure effectiveness,
they are analyzed relative to an expected performance
level. Areas of concern and negative deviations are
addressed and improved by the process owners and
department teams through the corrective action process as
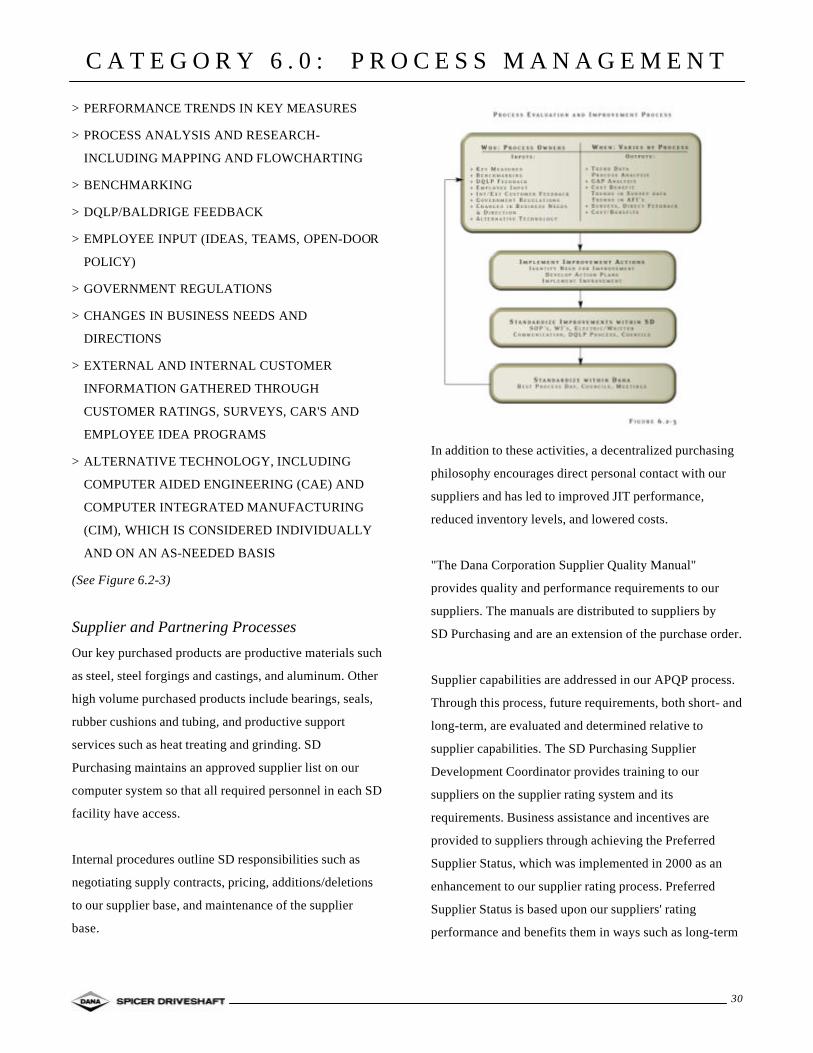
required. Support Process owners and cross-functional
process improvement teams use the Process Evaluation
and Improvement Process (Figure 6.2-3) to evaluate and
improve performance. Inputs to the evaluation include:
C A T E G O R Y 6 . 0 : P R O C E S S M A N A G E M E N T
30
> PERFORMANCE TRENDS IN KEY MEASURES
> PROCESS ANALYSIS AND RESEARCH-
INCLUDING MAPPING AND FLOWCHARTING
> BENCHMARKING
> DQLP/BALDRIGE FEEDBACK
> EMPLOYEE INPUT (IDEAS, TEAMS, OPEN-DOOR
POLICY)
> GOVERNMENT REGULATIONS
> CHANGES IN BUSINESS NEEDS AND
DIRECTIONS
> EXTERNAL AND INTERNAL CUSTOMER
INFORMATION GATHERED THROUGH
CUSTOMER RATINGS, SURVEYS, CAR'S AND
EMPLOYEE IDEA PROGRAMS
> ALTERNATIVE TECHNOLOGY, INCLUDING
COMPUTER AIDED ENGINEERING (CAE) AND
COMPUTER INTEGRATED MANUFACTURING
(CIM), WHICH IS CONSIDERED INDIVIDUALLY
AND ON AN AS-NEEDED BASIS
(See Figure 6.2-3)
Supplier and Partnering ProcessesOur key purchased products are productive materials such
as steel, steel forgings and castings, and aluminum. Other
high volume purchased products include bearings, seals,
rubber cushions and tubing, and productive support
services such as heat treating and grinding. SD
Purchasing maintains an approved supplier list on our
computer system so that all required personnel in each SD
facility have access.
Internal procedures outline SD responsibilities such as
negotiating supply contracts, pricing, additions/deletions
to our supplier base, and maintenance of the supplier
base.
In addition to these activities, a decentralized purchasing
philosophy encourages direct personal contact with our
suppliers and has led to improved JIT performance,
reduced inventory levels, and lowered costs.
"The Dana Corporation Supplier Quality Manual"
provides quality and performance requirements to our
suppliers. The manuals are distributed to suppliers by
SD Purchasing and are an extension of the purchase order.
Supplier capabilities are addressed in our APQP process.
Through this process, future requirements, both short- and
long-term, are evaluated and determined relative to
supplier capabilities. The SD Purchasing Supplier
Development Coordinator provides training to our
suppliers on the supplier rating system and its
requirements. Business assistance and incentives are
provided to suppliers through achieving the Preferred
Supplier Status, which was implemented in 2000 as an
enhancement to our supplier rating process. Preferred
Supplier Status is based upon our suppliers' rating
performance and benefits them in ways such as long-term
C A T E G O R Y 6 . 0 : P R O C E S S M A N A G E M E N T
31
contracts, volume buying and preference for new or
additional business. Another approach to supplier
assistance is the availability of VA/VE assistance in cost
savings proposals, along with engineering support with
design and rapid prototyping. Also, beginning in 2000,
our suppliers are eligible to participate in the Dana
University Supplier Development Program.
We evaluate our key suppliers in a variety of areas, as
outlined by internal operating procedures. These elements
are scored by all locations purchasing from the top 50
suppliers to the company. Evaluations are reviewed each
quarter by plant and company purchasing personnel, as
well as supplier development, for unacceptable trends or
patterns. ISO/QS-9000 Registrations and SD cost index
vs. producer price index measurements provide additional
evaluation and improvement of supplier performance. In
addition, SD Purchasing employs a computer system to
track material costs and provide a report on this
information.
Suppliers receive a performance report each quarter and
are expected to initiate corrective actions when
performance objectives are not met or are trending in the
wrong direction.
MINIMIZING COSTS
Our Supplier Quality Manual requires suppliers to work
toward QS-9000 requirements. (Currently 41 of our top
50 key suppliers are QS-9000 or ISO-9000 registered.)
The third-party audits associated with QS-9000/ISO-9000
registration reduce or eliminate the need for our facilities
to perform incoming product inspections and supplier site
verification audits, thus reducing cost. Material
certification requirements, SPC, and supplier self-audit
surveys reduce incoming inspection at SD facilities, and
various Just-In-Time delivery methods throughout the
company help keep inventory to a minimum.
IMPROVING SUPPORT PROCESSES
Purchasing managers at each facility support a core SD
purchasing group. This cross-functional team is
responsible for the continuous improvement of our
supplier processes. Our purchasing managers, led by the
SD Purchasing Department, meet to review and validate
our supplier system. The group analyzes survey feedback
along with supplier performance ratings, current business
needs and directions, DQLP feedback reports, industry
publications and input from supplier conferences. Based
on their analysis, the group identifies opportunities for
improvement and submits its suggestions to the Quality
Council or the SD Supplier Development Coordinator.
The appropriate supplier management manual, procedures
and processes are then revised and implemented
throughout the company.
Our annual key supplier conference allows us to
communicate changes, including updated supplier
requirements, performance reviews, technology changes,
and future business directions, as well as customer
concerns, plans and feedback. Cross-functional quality
improvement teams review current programs and
processes, identifying opportunities for improvement, and
the SD Purchasing Department uses an annual supplier
survey to solicit input for improving our procurement
process.
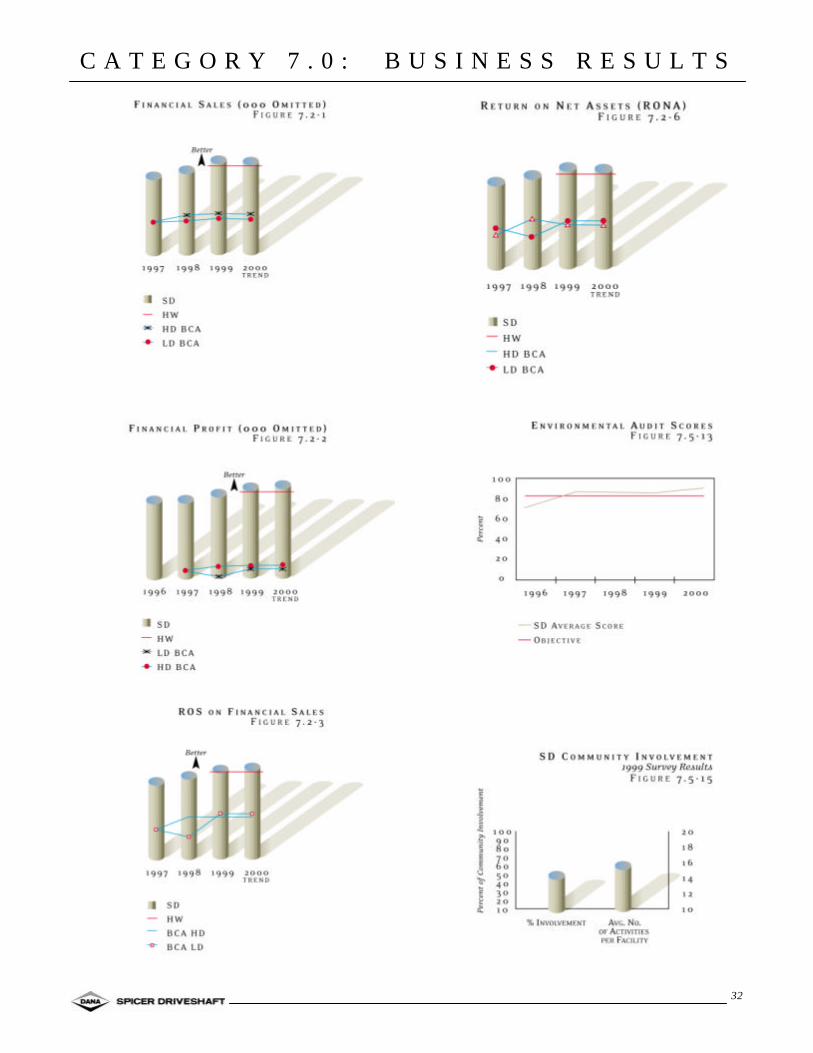
C A T E G O R Y 7 . 0 : B U S I N E S S R E S U L T S
32

C A T E G O R Y 7 . 0 : B U S I N E S S R E S U L T S
33

C A T E G O R Y 7 . 0 : B U S I N E S S R E S U L T S
34
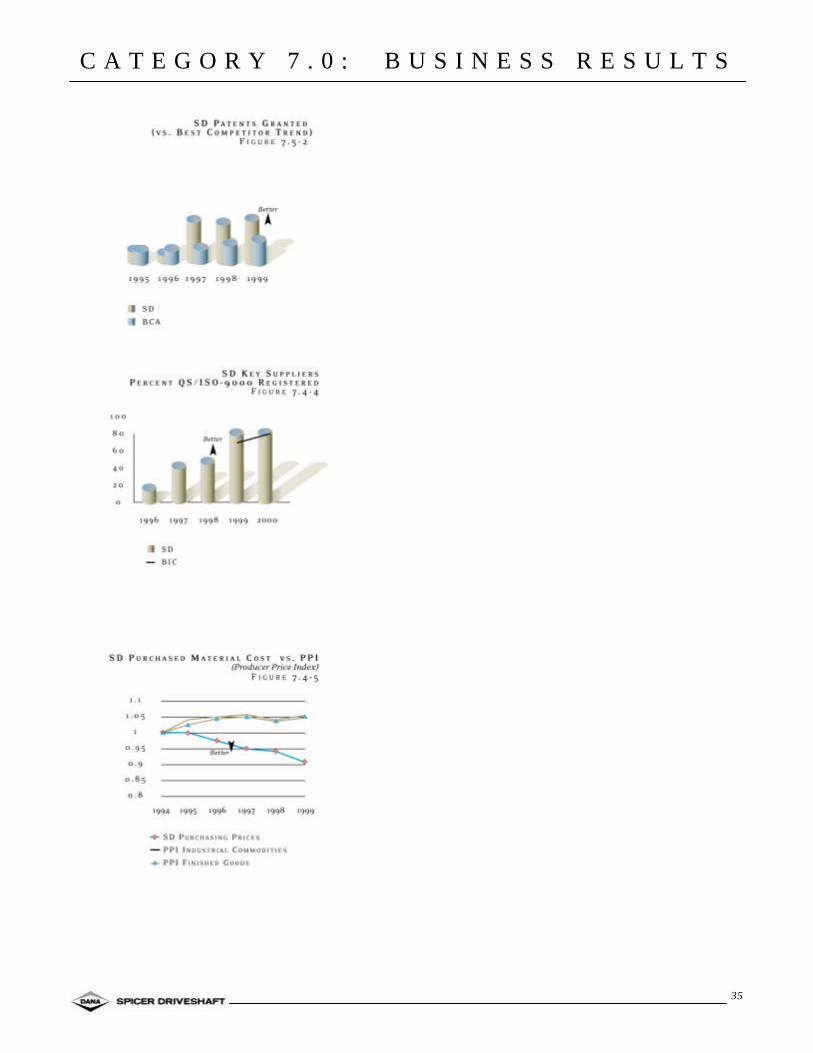
C A T E G O R Y 7 . 0 : B U S I N E S S R E S U L T S
35