business plan for myt control period fy 2015 16 to fy...
TRANSCRIPT

CED- Business Plan for f f ifT Control Period: FY1.6 to
Business Plan for MYT Control Period FY 2015
16 to FY 2017-18
Submitted to:
Joint Electricity Regulatory Commission for the State of
Goa & Union Territories
Submitted By:
Electricity Department of UT Chandigarh
CFD- Business Plan for MYT Control Period: FY16 to FY1S
TABLE O f Co n t e n t s
Chapter 3: Introduction...................................................
Background .................................................................
Objective of Business Plan................ - .....................
Chapter 2: About Electricity Department Chandigarh,
Area Served.................................................................
Organisation Structure: Roles and Responsibilities.
Grid d e ta ils .........................................................*..............
Future Power Allocation ...........................................■
Chapter 3: Sales and toad Growth...............................
Load Growth...............................................................
Consumer Growth.....................................................
Energy Sales G row th.................................................
Chapter 4: Loss trajectory And Energy Balance.........
Chapter 5: Capital Investment Plan............................
66 KV Ongoing Schemes.......................................... .
66 KV New Schemes.................................................
11 KV Schemes.........................................................
Capitalization Schedule...........................................
Chapter 6: Financing of the Capital Schemes.............
........ 3
.........3
...... „4
........5
........ S
.......... 6
............9
.......... 9
..........11
..........11
.......... 12
.......... 12
.....14
...... ;M .
......... IS
........... 19
.......22
......... 25
........... 28
l 1 P a g e

CFD- Business Plan for MYT Control Period: FY1G to FY1S
L ist o f T a ble s
............................ ....3Table i ; Present In frastru ctu re ............... .......................... ........... ............................................... 7
Table 2: Presen l Em ployee Strength........................... ................................................................................................. |Table 3: Phase-1 manpower (Till retirement of existing employees)........ ........................................................gTable 4: Phase-11 manpower (Final approval)....................................... ...............................Table 5. Substation Details......................................................................................................................... lQTable 6: Future Power Allocation.......................... ............ .......................... ............................................... 11Table 1\ Past Load Growth..............................................................................................................................Table 8: Projected Load G rowth................... ............................. ........................... ~.................................... i2Table 9: Past Consumer G ro w th ............................................................................................................................ i2
Table 10: Projected Consumer Growth........................................................................................................Table 11: Past Sales Growth........................................................................................................................... ^Table 12: Projected Sales Growth...................................... -.......................................................................... 14Table 13: D istribution Loss Tra jectory fo r the con tro l p e riod ................................................................ ^
Table 14: Energy Balance............................................................................. ...................................................Table IS: 66 KV Ongoing Capital Expenditure Works for the Control Period............................................Table 16: 66 KV New Schemes Capital Lxpenditure WorKs for the Control Period......................................^Table 17:11 KV Capital Lxpenditure Works for the Control Period........................................ ............ ^Table 18: Capitalization Schedule..................... .............................................................................................
2 ! P a g e

CED- Business Plan for MVT Control Period:' FY16 to FY1S
Ch a p t e r 1 : I n t r o d u c t io n
B a c k g r o u n d
1 , Chandigarh is a union territory in indra which spreads over a il area of 114 sq km The total
population 0. Chandigarh as per 2011 census was 1055450 with population density being 92,2
persons per sq. km; The Electricity Department of Chandigarh is deemed licensee unde, Section
14 o[ Electricity Act 2003 and is responsible for supply of uninterrupted 6 quality power lo d.i
categones of consumers in Chandigarh al the m o s t economical rates The department is engaged
in the procurement, transmission and distribution of electricity to the various consumer categones
in the Union Territory of Chandigarh. It does nol have its own power general,oh station and
completely rely on the Central Sector Generating Statons (CSGS) to meet Its energy demand.
1 2 The table below gives an overview of present transmission and distribution infrastructure of
Chandigarh electricity department as of 31.03. M
Table ! - Present Infract ru c ivre
Particulars220 KV Feeders
Length (Kms)
66 KV Feeders
1081232B889125918S5192451315
33 KV Feeders11 KV Feeders LT LinesDistribution Transformers (NgsJ Street Light Points (Nos)66 KV S/S (Nos)220 KV SfS (Nos)33 KV SfS (Nos)
1 3 The key duties being discharged by Chandigarh Electricity Department are.
, Laying and operating of such electric line, sub-station and electrical plant that is p w i l y
maintained fcr the purpose of distributing electricity in the area of supply of Chandigarh Electricity
Department, notwithstanding that such line, sub-staton or electrical plant are high pressure cables
a overhead lines or associated with such high pressure cables or overhead lines; or used
incidentally fpr the purpose of .re m itt in g electricity for others, in accordance with Electricity Act
2003 or the Rules framed there under.. operating and maintaining sub-stations and dedicated transmission lines connected there with as
per the provisions of the Act a^d the Rules framed there under

CED Business Plan for MVT Control Period: FY16 W FY1S
1 4
Arranging in-coordrnation with the G e n e v a Company(ies). lor Ihe supply of electricity required
within Ihe boundaiy o' t* UT a"d f° r ,he W ̂ 11 ■ *
efficient manner;Supplying electricity. as seen as R a tea b le to any person requiring such supply, within *
competency to do so under the said Actpreparing and carrying out schemes tor distribution and generally tor promoting the use o
e lectricity with i n the Sta te.The present power allocation of Chandigarh is approximately 305 MW from various generating
stations including 46 MW Iron, BBMB The current demand is primarily dependent on the domestic
and commercial c o n fu t in g appro*. 74% of the total sales in FY 13-14.
O b je c t iv e of B u s in e s s P la n
, 5 The Joint Electricity Regulatory Commission <JERC> for the State bf Goa and Union Territories in
exarcse of powers conferred by sub section <D of section 16! and clauses (zd). ,ze) and (zf of
sub section (2) ol section 181. raad with sections 61. 62.83 and 86, of the Electricity Act 2003 (
r f 2003) and all other powers enabling it in this behalf, has issued the Join, Electricity Regulatory
commrssion for the Stale of Goa and Union Territories (Multi Vaar Distribution Tariff) Regulations.
2014 hereinafter referred to as "MY7 Regulations., 6 As per the Regulations, the Distribution Licensee shall file Business Plan, for Contro. Period ,
three financial years from April 1. 2016 to March 31. 2018, which shall comprise but no. be limited to detailed category-wise sales and demand proiections, power procurement plan, capitol
investment plan, financing plan and physical targets before the Hon'ble Comm,as,ion as par . .
Tariff Filing before the beginning of the Control Period , ? Accordingly, the Chand,garh Electncty Department la hereby Png the Business B - or
Control Penod (FV 2015-16 to FY 2017-13) based on the available data for the FY 2013-14 and
data of previous years, 8 The Chandigarh Electricity Department has prepared the Business Plan taking into he
consideration the various existing internal factors and external business environment affecting
business.1 9 The key objectives of this business plan are.
' . providing a toot for strategy ptanning and management - The primary ob,ec ve of theBusiness Plan is to analyze and anticipate the future requirements and strategically plan -
the requisite capital investments, means of financing the schemes and various assoca.ed
costs and document then, which would serve as an effective tool for monitoring and execution
of future works It is important to project the growth in transmission ana distribution newer,
,n(restructure commensurate with the energy demand required to, fuelling the economic
growth targets of the UT. , w ,. Meeting the regulatory compliance ol submission of a business plan as mandated by the Joint
Electricity Regulatory Commission, MYT Regulalions, 2014
4 [ P a % e
CED- Business Plan for MYf Control Period: FY16 to I-VIS
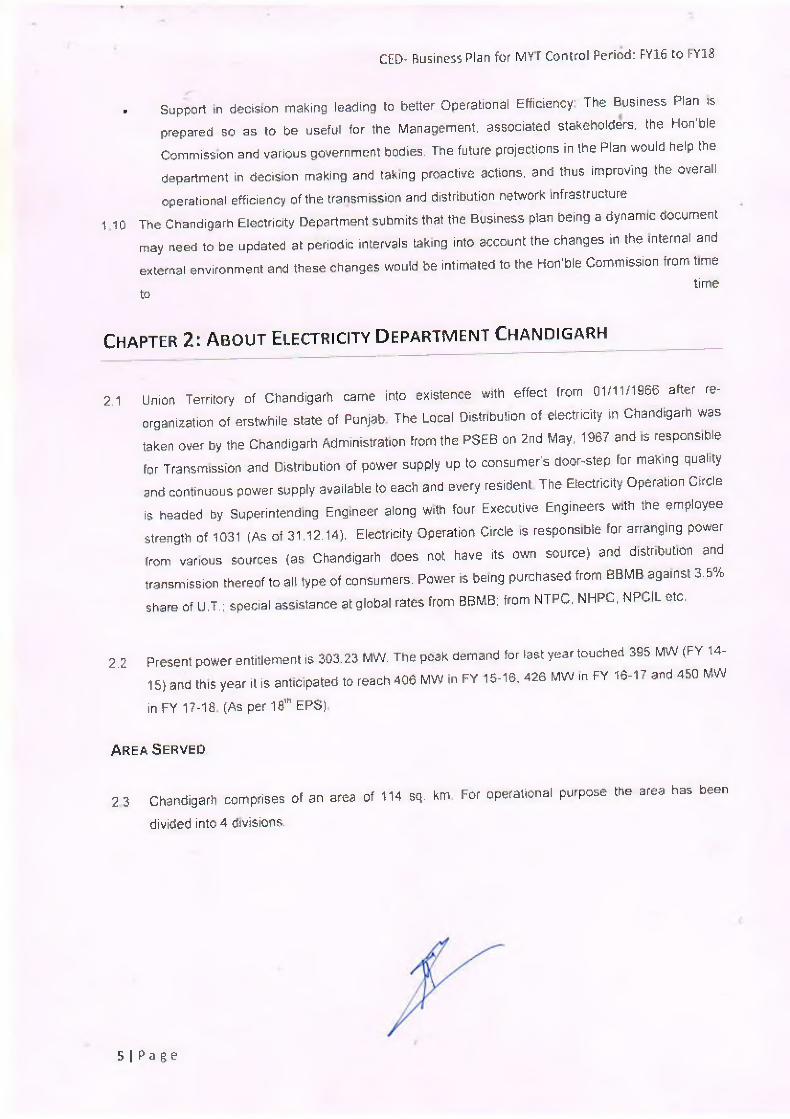
. Support in decision making leading to better Operational Efficiency The Business Plan is
prepared so as to be useful for the Management, associated stakeholders, the Hon'ble
Commission and various government bodies. The future projections in the Plan would help the
department in decision making and taking proactive actions, and thus improving the overall
operational efficiency of the transmission and distribution network infrastructure
1 ■ 4'p The Chandigarh Electricity Department submits that the Business plan being a dynamic document
may need to be updated at periodic intervals taking into account the changes in the internal and
external environment and these changes would be intimated to the Hon'ble Commission from timetime
to
Ch a p te r 2 i A b o u t Ele c tr ic ity D e p a r t m e n t C h a n d ig a r h
2.1 Union Territory of Chandigarh came into existence with effect from 01/11/1966 after re
organization of erstwhile state of Punjab The Local Distribution of electricity in Chandigarh was
taken over by the Chandigarh Administration from the PSEB on 2nd May, 1967 and is responsible
for Transmission and Distribution of power supply up to consumer's doorstep for making quality
and continuous power supply available to each and every resident The Electricity Operation Circle
is headed by Superintending Engineer along with four Executive Engineers with the employee
strength of 1031 (As of 31.12.14). Electricity Operation Circle is responsible for arranging power
from various sources (as Chandigarh does not have its own source) and distribution and
transmission thereof to all type of consumers. Power is being purchased from 6BMB against 3.5%
share of U.T.; special assistance at global rates from BBMB; from NTPC. NHPC, NPC1L etc.
2 2 Present power entitlement is 303.23 MW. The peak demand for last year touched 395 MW (FY 14
' 15} and this year ft is ant.cipated to reach 406 MW in FY 15-16, 426 MW in FY 16-17 and 450 MW
in FY 17-1 fi (As peMS1h EPS)
A r e a S e r v ed
2 3 Chandigarh comprises of an area of 114 sq. km For operational purpose the area has been
divided into 4 divisions.
5 S P a ge

CED- Business Plan for MYT Control Period; FY16 to TY1S
figure 1: Map o f Area Served
fi*FFU RF; tDivision 1 Division 2 Division 3 Division 4
I
■-
EHJUNOAin
O r g a n iza tio n S t r u c t u r e ; Ro l e s a n d R e s p o n s ib il it ie s
2.4 Electricity Department is part of the Administration of Union Territory of Chandigarh & headed by
the Superintending Engineer. Day to day work related to functioning of the Department is looked
by the Executive Engineer (Elect.) at Division level Under Division there are 10 Sub Division
headed by the Assistant Executive Engineer/Assistan! Engineer Executive Engineer at Division
Office is also helped by Technical Section. Establishment Section and Account Section headed by
the Accountant At lower level there are Junior Engineers who look after the Operation &
Mamtenarsce work of their respected assigned areas end report to itieir respected Assistanl
Executive Engineer
6 | P a g e

CEO- Business Plan for MYT Control Period: FY16 to TYIS
Figure 2: Organization Structurei
ORGANIZATION STRUCTURE
i c r H [ D 1 )
I< I i 1 1
£S
■Sv> i F II Js : .
VI;
ChiirF Ipr>p. 11
vt (fhhcWitrtyl
xxiin in n
“ 3
mi iV*-*£L iwqi
kin in i|
t r*F7 =i56 I *rr v.t f 1 D Ll 'fD EF1 -LJ* V T id
30
f-i:i■ ii
■ ; i p- >' m)
U U L .1 '■
Cl
2,5 Theiable below presents the cists nt status of tnatemployde strength.
Table 2: Present Employee Strength
Sr. No. Particulars Previous Year (Actual} FY 2013-14
Current Year Up to 31.12.14
1 Mo of employees as on 1st April 1031 10052 Mo. of employees added during the year 46 0
3 Mo. of employees on deputation/ Foreign service as on 1st Aoril 3 0
4 Total number of employees (1+2+3) 1080 1065
5 Number of employees re tired/retiring during the year 15 34
6 Number of employees at the end of the year J4-5). 1005 1031
2 5 Currently there are 1780 sanctioned posts of different categories in the Chandigarh Electricity
department In 1997, a case for ADDlTlOMAL 287 posts was sent to Govt, of India which
sanctioned 1855 posts for CEO However being financial matter, the approval of Joint Electricity
Regulatory Commission for Goa & UTs (JERC) was sought by the CED JERC directed the CED
to carry out detailed manpower study according to future load growth in Chandigarh Accordingly,
M/s Deloitte Touche Tohmaisu Pv|. Ltd. was appointed as Consultant to conduct the Manpower
Study and delegation of power. The Manpower Study was challenged by UT Powermen Union and
7 | P a g e

CFO- B u s in g Plan for MVT Control Period: hVl6 to FV18
the Electricity Department which has been dismissed by the Hon'ble Commission The
Commission has approved the following manpower for Chandigarh Electricity Department
Fable 3; Phaie-i manpower (Till re-iire^ent o f existing employees)
Manpower Requirement for CED
Sanctioned As-IsManpower at CEO
Totalproposed
Proposed In house
ProposedOutsourced
Executives (AEE/AE & above)
30 22 59 59 0
Non-Fxecutives (JE & below)
15S4 903 1317 991 326
Non-Exccutivcs - Group D
166 114 114 114 0
Total 1780 1039 1490 1164 326
Table ■*: Phase-n mpnpower (fina l opflwvol)
Manpower Requirement for CED
Sanctioned As-IsManpower at CED
TotalProposed
Proposed In* house
ProposedOutsourced
Executives (A EE/AG & above}
30 22 59 59 0
NonExecutives (JE & below)
1564 903 1323 756 567
NonExecutives - Group D
166 114 10S :4 104
Total 1780 1039 1490 319 j__ 671
2.7 Existing post under Phase-1 Manpower will continue till the retirement of existing employees and
ultimately the future posts should be filled as per Phase-11 manpower. The organizational structure
is to be divided into three verticals i.e. Commercial Distribution [operation &. maintenance), Power
System (33KV & above) head by SE Finance & Administration along with three verticals is to be
put under one Chief Engineer Number of posts of Executives (Assistant Engineer & above) is to
be increased from 30 to 59 on regular basis and number of posts of Non-executive (JE & below)
including Group-D is to be reduced from 1750 to 1431 with further direction that 760 posts should
be filled up on regular basis and 671 on outsource basis
2.B Further the Commission has approved one more post of Chief Engineer to implement the National
Policy on Renewable energy as generation From solar system is getting thrust nation wise
moreover the Electricity department need to implement SCADA system The CED has moving

CLD- Business Plan for MYT Control Period: FV16 to FV1S
towards the process of hiring the staff as approved by the Commission and desired to have the Employees as approved by the Commission above
G rid d e ta ils
2.9 Power supply to the Chandigarh is received mainly through three lines, namely, 220 kv Sub Station at Kjshangarh Manimajra through 22GKV double circu:l Chandjgarh-Nalagarh ime of Power
Grid, the second source is 66 KV Chandigarh-Mohali line at 65 KV Substation Sector-52 and
Sector-33 and the third source is Chandigarh-Dhulkot 66 KV line at Sector-28 Substation. There
are 13 nos 66kv, Sub-station rn Chandigarh and 5 nos. 33KV substations
Transmission Substation Details:
Table 5 f Substation Details
S. No Substation Voltage Level (KV) Installed Capacity (MVA)220 KV Substationsv Kishangarg 220/65 KV 300 MVA66 KV Substations2. B B.M B Sector-28 66/33/11 KV 93.5 MVA3. Sector-52 66/33/11 KV 107.5 MVA4. Sector-56 66/11 KV 40 MVA5. Sector-39 66/11 KV 52.5 MVA6. Sector-12 66/11 KV 50 MVA7. Sector-1 66/11 KV 25 MVA8. Ind. Area Ph. 1 66/11 KV 57.5 MVA9. Ind. Area Ph. 2 66/11 KV 45 MVA10. Sector-32 66/11 KV 45 MVA11. I.T. Park M/Majra 66/11 KV 60 MVA12. Sector-47 66/11 KV 40 MVA13. Mam-Majra 66/11 KV 4DMVA14. Sector-18 66/11 KV 45 MVA33 KV Substations15, Sector-17 33/11 KV 43.5 MVA16. Sector-18 33/11 KV 24 5 MVA17, Sector-34 33/11 KV 25 MVA18. Sector-37 33/11 KV 10 MVA19. Ind Area Ph. 1 33/11 KV 12 MVA
F uture P o w er A l lo c a t io n
2 10 During the control period, it is expected that capacity from the following plants will atso be
allocated Chandigarh. The details of the plants and the capacity to be allocated to Chandigarh are
as given below:
9 | P 3 g e

CED- Business Plan for MYT Contro! Period: FY16 to FY1S
ft
Table 6; i-uture Power Allocation
S. No Organisation Name Of Projcct Type Capacity Avg Entitlement In % Entitlement in MW 1
1 An la? Gas 419.33 1.700 7.13
2 Aurafya Gas 663.00 1 100 7.29
3 Dadri GPP Gas H29.73 0.850 7.05
4 Dadri ll TPP Coal 980.00 0.210 2.06
5 Kahalgaon II Coal 1.500.00 0.200 3.00
6 Rihand I Coal 1,000.00 1.180 11. ao
1 NTPC Rihand II Coal t.OCU.OO to oo 10.00
S Rihand ill Coal 1,000.00 0.765 7.65
9 Singrauli Coal 2,000.00 0.190 3.BO
10 UnchaharI Coal 420.00 0.550 2 31
11 Unchahar II Coal 420.00 0.930 3.91
12 Unchahar III Coal 210.00 0.700 1.47
13 Jhajjar ( Aravali) Coal 1.500.00 0.260 3.90
14 Chamera I Hydel 540.00 3.900 21.06
15 Chamera I! Hyde! 300.00 1 280 3,&4
16 Chamera 111 Hydel 120.00 1.1 11 1.33
17 Dhauliganga Hydel 290.00 1.230 3.57
18 □ultiasti Hydel 390.00 0.9&0 3.82
19 NHPC Parbalhi 111 Hydel 520.00 1.110 5.77
20 Salal Hydel 690.00 0.270 1 86
21 Sewa II Hydel 120.00 1.340 1 61
22 TanaXpur Hydel 94.00 1.280 1.20
23 Uri-I Hydel 480.00 0.620 2.98
24 Uri ll Hydel 240,00 0.80B 2.45
25 NA.PP Nuclear 440.00 1.630 7.19
25 npcil KAPP (#3 and #4) Nuclear 440.00 0.663 2,92
27 RAPP{#5 and #6) Nuclear 440.00 1.190 6.28
23 NATHPA JHAKRI Hydel 1,500.00 0.B70 13.05
29SJVNL. RAMPUR Hydel 412.00 0.310 1.28
30 BBMB 3.5% Hydel 1,325.00 3.500 46.38
31 BBMB 1 LU Hydel - - 41.67
32 BRMB BRMB 10 LU Hydel - 4.17
33 PONG Hydel 896.00 3.500 12.60
34 DEHAR Hydel 990 00 3.500 34.05
35 Koteshwar Hydel 40000 0.700 2.80
36THDC Tehri Hydel 1,000.00 0.940 9.40
10 | P 3 g e»

CED- Business Plan for MYT Control Period: FY16 to FY1S
Ch a p te r 3 : Sales a n d Lo a d G r o w t h
L o ad G r o w th
3.1 The Table given below summarizes the growth in sanctioned load over the past 6 years Tnc
highest growth of 6.64% (CAGR) from 2009-10 to 2014^15 has been observed in the Commercial
category Overall growth for the UT has been 5.01%.
Jable 7: Past l oad Grow!It
A ll Figures ore in k w*>MA 1 ̂ ■
Category 2009-10 2010-11 2011-12 2012-13 2013-14
Domestic 609933 609,926 658.690 731236 773459 7922/9
Commercial 274628 301,758 313,272 326156 360345 378826
Large Supply 65937 65026 65763 64023 69671 70127
Medium Suoply 53566 55564 57603 59811 62011 64467
Small Power 18484 18500 18652 18754 19015 19244
Agriculture 1006 737 675 . 707 715 719
Public Lighting 2966 5039 5455 5583 5791 5912
Bulk Supply 4297V 28745 30378 41303 41299 41298
Others Temporary Supply 3763 24741 27840 5672 4229 4187
Total 1078260 1110036 11S332B 1253245 1336538 1377060
3.2 To project the bad growth for the different consumer categories 5 year CAGR has been
considered for the domestic, commercial large supply. Medium supply and small power and public
lighting. However, for the agriculture and public lighting nominal growth rale of 2% and 3% has
been considered The CAGR along with projected load for the control period has been given In the
table below:
Table $: Projected Load
All figures in kW
CAGR 2014-15 2015-16 2016-17 2017-18Category Used Estimated Projected Projected Projected
Domestic 5% 792279.B48 831893.8 373488.5 917163
Commercial 6% 378826.028 401555.6 425648.9 451187.9
Large Supply 2% 70127.01 71529 55 72960.14 74419.34
Medium Supply 4% 64466.926 67045.6 69727.43. . . ------------------- 1—
72516.52
Small Power 1% 19244.389 19436 33 19631.2 19827 51
Agriculture 2% 719 733.38 748.0476 763 0086
Hpublic Lighting 3% 5912 6089.36 6272 041 6460.202
Bulk Supply 10% 41298 45427.8 49970.58 54967.64
Others Temporary Supply 0% 4186.536 4186.536 4186.536 4186 536
Total 1377059 1447093 1522633 1601492
11 I P a ,g e

C o n su m er G r o w th
3.3 The Table below summarizes the category wise growth in consumers over the past 5 years
CFD- Business Plan for MYT Contra! Period: FY16 to FY1S
Table O' Past Consumer Growth
2008-09 2009-10 2010-11 2011-12 2012-13 2013-14
Actual Actual Actual Actual Actual Actual
Domestic 165,121 167,208 168,429 170,364 172,549 174407Commercial 24r066 24,420 24,837 25,359 20,309 21447
Large Supply 103 102 102 104 101 105Medium Supply 8 /9 884 1,042 1,076 1,116 1154Small Power 1.371 1,409 1,286 1,291 1,285 1285Agriculture 163 167 133 122 123 122Public Lighting 554 568 678 775 807 846liuik Supply 219 258 286 348 503 529
Others Temporary Supply 265 266 fbi 903 922 737Total 192,741 195,282 1975441
200342 197715 20063Z
3.4 The CAGR along with the projected consumer growth for the control period has been given in the
table below
Jolifi' JO; Projcctcd Consumer Growth
Category CAGR 2014-15 (9 Months) 2014-15 2015 “16 2016-17 2017-18
Used Actual Estimated Projected Projected Projected
Domestic 1% 181204 181204 133166 185152 187131Commercial 1% 21938 21938 21970 22000 22060Large Supply 0% 104 104 105 105 105Medium Supply 5% 1176 1176 1235 1297 1361Small Power 0% 1231 1281 1281 1231 1281Agriculture 0% 120 120 120 120 120Public Lighting 8% 87 A 874 941 1013 1091Bulk Supply 10% 564 564 620 682 7S1
Others Temporary Supply
0% 628 623 628 628 628
Total 207SS9 207839 210066 212278 214528
E n ergy S a le s G r o w th
3.5 The Table below presents the category-wise energy sales for the pasS 6 years. The overall growth
in sales has been 3.56% p.a . mainly contributed by increase in the bulk supply and domestic
category.
12 | P a g e
CED Business Plan for MVT Control Period: FY16 to FY1B
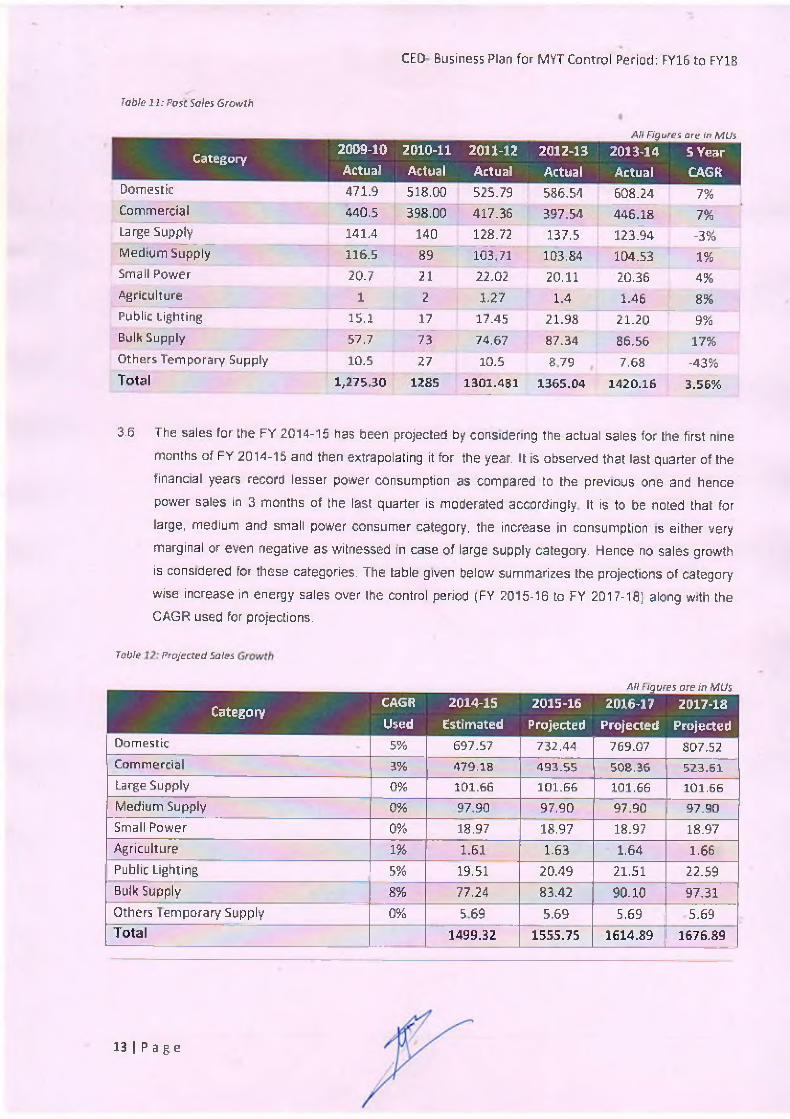
Table 11: Post Sales Growth
All Figures are in MUs
Category2009-10 2010-11 2011-12 2012-13 2013-14 5 YearActual Actual Actual Actual Actual CAGR:
Domestic 471.9 518.00 525.79 586,51 608.24 7%
Commercial 440.5 398.00 417.36 397.54 446,18 7%
Large Supply 141,4 140 128.72 137.5 123.94 -3%
Medium Supply 116.S 89 103,71 103.84 104 .S3 1%Small Power 20.7 21 22,02 20.11 20.36 4%Agriculture 1 2 1,27 1.4 1,46 8%Public Lighting 1S.1 17 17.45 21.98 21.20 9%Bulk Supply 57.7 73 74.67 87.34 86.56 17%Others Temporary Supply 10,5 27 10,5 8 79 7.68 -43%Total 1,27530 1285 1301.4B1 1365.04 1420.16 3.56%
3.6 The sales for the FY 2014-15 has been projected by considering the actual sales for the first nine
months of FY 2014-15 and then extrapolating it for the year. It is observed that fast quarter of the
financial years record lesser power consumption as compared to the previous one and hence
power sales in 3 months of the last quarter is moderated accordingly ft is to be noted that for
Sarge, medium and small power consumer category, the increase In consumption fs either very
marginal or even negative as witnessed in case of large supply category. Hence no sales growth
is considered for these categories. The table given below summarizes the projections of category
wise increase in energy sales over ihe control period (FY 2015-16 to FY 2D17-16) along with the CAGR used for projections.
Table Projected iota
AH figures ore in MUs
CategoryCAGR 2014-15 2015-16 2016-17 2017-18Used Estimated Projected Projected Projected
Domestic 5% 697.57 732.44 769.07 307.52Commercial 3% 479.18 493.5S 508.36 523.61Large Supply 0% 101.66 101.66 101.66 101.66Medium Supply 0% 97,90 97.90 97,90 97.90Small Power 0% IS.97 18.97 18.97 18.97Agriculture 1% 1.61 1.63 1.64 1.66Public Lighting 5% 19.51 20.49 21.51 22.59Bulk Supply 8% 77.24 83.42 90.10 97,31Others Temporary Supply 0% 5 69 5.69 5.69 5,69Total 1499.32 1555.75 1614.89 1676,89
13 | P a g e

C h a p te r 4: Loss T r a je c t o r y A n d E n e rg y B a la n c e
CFD Business Plan for MYT Control Period: FY1B to FVIS
4 1 The CED would like to submit that the system improvement works executed every year under the
planned schemes as well as increase in energy sales quantum have resulted in the reduction of T
& D losses in its distribution area
4.2 CED has achieved Distribution loss level of 15.27% for the FY 2013-14. The loss reduction
trajectory for the Control Period is as given in the table below. The loss trajectory for the control
period is taken as per Hon'ble Commission Order dated 5th may 2014 in petition no 76/301? Suo
Moto Petition
Table 13: D istribu tion Jois Trajectory fo r the con lro l period
Loss% FY 13-14 (Actual) FY 14-15 FY 15-16 FY 16-17 FY 17-13
Distribution
Losses15 .27% 15% 1-1.50% 14% 13,75%
4.3 Based on the proposed loss levels and projected energy requirement and availability with;n the
slate. Ihe Energy Balance is presented in the following (able-
Table 14: fn e t qy Bo lance
Particulars 2013-14 2014-15 2015-16 2016-17 2017-18
Actual Estimated Projected Projected Projected
Energy Sales 1420.16 1499.32 1555.75 1614.89 1676.89Distribution Loss{%) 15,27% 15% 14.50% 14.00% 13.75%Loss 255.39 264.59 263.84 262,89 267.33Total Energy Required for retail sales l r676,05Total Fnergy Required at U7 Periphery 1,676.05 1763,91 1819.59 1S77.7S 1944.23Transmission Loss (fvlUs) 43.68 54.55 56,28 58.08 60.13Net Energy Requirement 1,719-73 1818.46 1875.86 1935.86 2004.36
14 | P a g e

CED Business Plan for MYT Control Period: FY16 to FY18
Ch a p t e r 5 : Ca p it a l I n v e s t m e n t P lan
5.1 As per the MYT Regulations 2014. the Distribution Licensee shall file Business Plan, for Control
Period of three financial years from April 1. 2015 to March 31. 2013. which shall comprise but net
be limited to detailed category-wise sales and demand projections, power procurement plan,
capital investment plan, financing plan and physical targets before the Hon'ble Commission as pari
of the Tariff Filing before the beginning of the Control Period.
5.2 Based upon the above mandate the CAPEX Plan proposals (scheme wise} for FY 15-15 to FY 17
13 under the MYT Control Period FY 2015-18 have been formulated by Chandigarh Electricity
Department in order to effect belter planning, budgeting and monitoring at macro & micro levels
The capital expenditure plan has been separately prepared into two categories:
r Capital Investment Plan for GG KV and above works > Capital Investment Plan for 11 KV and below works
5.3 Chandigarh Electricity Department has prepared the capex plan taking into consideration all the
factors which would affect the operations of the department The capex plan includes the details of
various capital expenditure schemes in the idenlified areas and their respective estimates for each
year of the MYT control period from FY 2015-16 to FY 2017-18.
5.4 The capital investments oF Chandigarh Electricity Department can largely be categorized in
following areas
• Investments in New Distribution Infrastructure to support the demand requirements or power evacuation from generation projects.
■ System augmentation and strengthening including renovation and modernization to maintain the performance of the existing system and to deter mvestments.
5.5 Accordingly the schemes are divided under the followings two categories viz. On*gomg schemes
and new schemes.
66 KV O ng o in g S c h e m e s
5.6 The table below provides the information about ongoing works The fable provides details about
original cost of the project, estimated expenditure to be incurred during the control period and
further segregation of expenditure in each year of the control period
Table 15: 66 KV Ongoing Capital Expenditure Works fa r the Control Period
Sr. Name of Scheme Mo.
15 1 P a g e
OriginalProjectCost{Rs
Total estimated amount for the control period
Proposed Expenditure (Rs Lakh)
2015-16 2016-17 2017-18

CED- Business Plan for MYT Control Period: FY16 to FY18
“ " Lacs) {Rs. Lacs)
A 66 KV Works1 Turnkey execution of 66 KV
Transmission Line from T off point to the proposed 66 KV Grid Substation in Institutional Area. Village Sarangpur, Chandigarh
311 75 260.00 60. DO 100.00 100.00
2 Turnkey Execution for 2 Nos. 66 KV Line bays at 66/11 KV Grid Substation in Institutional Area, Village Sarangpur, U.T., Chd
117.75 120.00 40.00 50.00 30.00
3 Providing 2x20MVA 66/11KV Grid Sub-Station in the Institutional Area of Village Sarangpur in UT Chandigarh.
969.01 60.00 40.00 20.00 0.00
4 Providing 2x20MVA. 66/11KV Grid Sub-Stetton at Raipur Kalan
974.15 150.00 100 00 50.00 0.00
5 Up-gradation of Transformation Capacity at 66/11 KV S/ Stn. by replacing existing 2X12.5 MVA with 2 X 20 MVA T/F, 66/11 KV T/F and shifting and re-installation of 2X12.5 MVA T/S at existing 66/11 KV S/Stn. at Civil Sectt. Sec 1 and Sec. 12. Chd
712.10 40.00 20.00 20 0.00
6 Up gradation of existing 33 KV Grid Sub Station to 65 KV voltage level by providing 1 X 30 MVA. 66/11 KV power transformer alongwith associated transmission line Sec. 34-C Chandigarh
722.11 115.00 50.00 65.00 0.00
7 Prov. New 66/11 KV 16/20 MVA Power Transformer on existing bay at 66Kv/11KV Grid S/Stn. Sector-47, Chd
213.90 80.00 60.00 ooo 0.00
3 Providing 1 1 KV automatic- capacitor bank at various existing 66KVGrid S/Stn , m Chandigarh
979.65 50.00 30.00 20.00 0.00
Total 876.00 420,00 325.00 130.00
Scheme Wise Detailed Description
5 7 The objective/salient features of various ongoing works for the control period 2015-2018 is
provided as under-
66 kV WORKs
1, Turnkey execution of 66 KV Transmission Line from T-off point to the proposed 66 KV Grid
Substation in institutional Area, Village Sarangpur, Chandigarh,
16 | P a g l'

CED- Business Plan for MVT Control Period: FY16 to FY IS
To meet the rising load demand and to provide better and reliable service to the consumers of
Rural Area of Viil Sarangpur. it has been proposed that 66 KV Transmission Line from T-off point
to the proposed 65 KV Grid Substation in Institutional Area. Village Sarangpur. Chandigarh. 1 ne
total scheme expenditure ifr expected to be Rs 311.75 Lakhs out of which unutilized amount of Rs.
260 Lacs has been proposed to be utilized in the control period The Scheme is ex peered to
capitalize in third year of the control period.
2. Turnkey Execution for two Nos. 66 KV Line bays at 66/11 KV Grid Substation in institutional
Area, Village Sarangpur, U.T., Chandigarh.
To meet the rising load demand and to provide better and reliable service to the consumers of
Rural Area of Village Sa rang pur. it has been proposed that two Nos. 66 KV Line bays at 66/" 1 KV
Grid Substation in Institutional Area, Village Sarangpur. U.T Chandigarh ihe total scheme
expenditure is expected to be Rs 120 Lakhs which is proposed to be utilized in the control period
The Scheme is expected to capitalize in third year of the control period.
3 Providing 2x20MVA 66/11KV Grid Sub-Station in the Institutional Area o f Village Sarangpur
in UT Chandigarh
In order to meet the increase in load demand due to upcoming Housing/Institutions I Projects fn
area and to provide better and reliable service to the consumers of adjoining sectors of Vill.
Sarangpur. Chandigarh it has been proposed to provide 2x20 MVA T/F 66/11 KV Grid Substation
at the total scheme expenditure of Rs 969.01 Lakhs out of which unutilized amount of Rs. 60 Lacs
has been proposed to be utilized in the control period. The Scheme is expected to capitalize in
second yea? of the control period
4 . Providing 2x20MVA, 66/11KV Grid Sub-Station at Raipur Katan.
It is proposed to provide 2x20MVA 66/11KV Grid S/Stn at Raipur Kalan to meet the increased
load demand. The total scheme expenditure is expected to be Rs 974.15 Lakhs out of which
unutilized amount of Rs. 150 Lacs has been proposed to be utilized in the control period. The
Scheme is expected to capitalize in second year of the control period.
5. Up-gradation o f Transformation Capacity at 66/11 KV S/ Stn. by replacing existing 2X12.5
MVA with 1 X 20 MVA T/F, 66/11 KV T/F and shifting and re-installation of 2X12,5 MVA T/S
at existing 66/11 KV S/Stn. at Civil Sectt. See. 1 and Sec.12. Chd,
!t is proposed to Up-grade transformation capacity at 66/11KV Grid Sub-Station. Information
Technology Park by replacing existing 2x12.5MVA 5 6 /1 1KV Transformers with 2*20MVA.
17 | P a g e

CED- Business Plan for MYT Control Period: FY16 to FY18
66/11KV Trans-formers and shifting & re installation of 2x12 5MVA Transformer at existing 66KV
Grid Sub-StationL Civil Secretariat. Sector 1 & Sector 12, Chandigarh, th e total scheme
expenditure is expected to bo Rs 712.1 Lakhs out of which unutilized amount of Rs. 40 Lacs has
been proposed to be utilized in the control period. The Scheme is expected to capitalize in second
year of the control period.
Llp-gradation of existing 33 KV Grid Sub Station to GS KV voltage tevci by providing 1 X 30
MVA, 66M1 KV power transformer along with associated transm ission line Sec. 34-C
Chandigarh.
It is proposed to Upgrade the existing 33KV find Substation to 66KV voltage level by providing
1x30MVA, 6#11KV power transformer along with associated transmission line m Sector 34-C.
Chandigarh This is a necessity to meet he increase in commercial 'oad because of the
modernization. The total scheme expenditure is expected to be Rs 722.11 Lakhs out of which
unutilized amount of Rs. 115 Lacs has been proposed to be utilized in the control period l he
Scheme is expected to capitalize in second year of the control period
Prov. New 66J11 KV 16/20 MVA Power Transformer on existing bay at 66KW11KV Grid S/Stn,
Sector-47, Chd
To meet the rising load demand and to provide better and reliable service to the consumers of
Sector-46. 47, 43. 49. 30. 31 etc. Chandigarh it has been proposed to provide new 66/11 KVA,
/ft0/20 MVA T/F on existing bay at 66KV S/Stn. Sec.47, Chandigarh and an amount of Rs flO
Lakhs is proposed to be utilized in control period which is due to some additional work included in
existing scope. The additional works is expected to be capitalized in first year of the control period.
Providing 11KV automatic capacitor bank at various existing 66KV Grid S^Stn., in
Chandigarh.
It is proposed to maintain the power factor and for this purpose automatic power factor control
relays has to be installed and an amount of Rs.50 lac has been proposed in the second control
period.
IS | P a g e
66 KV New S c h e m e s
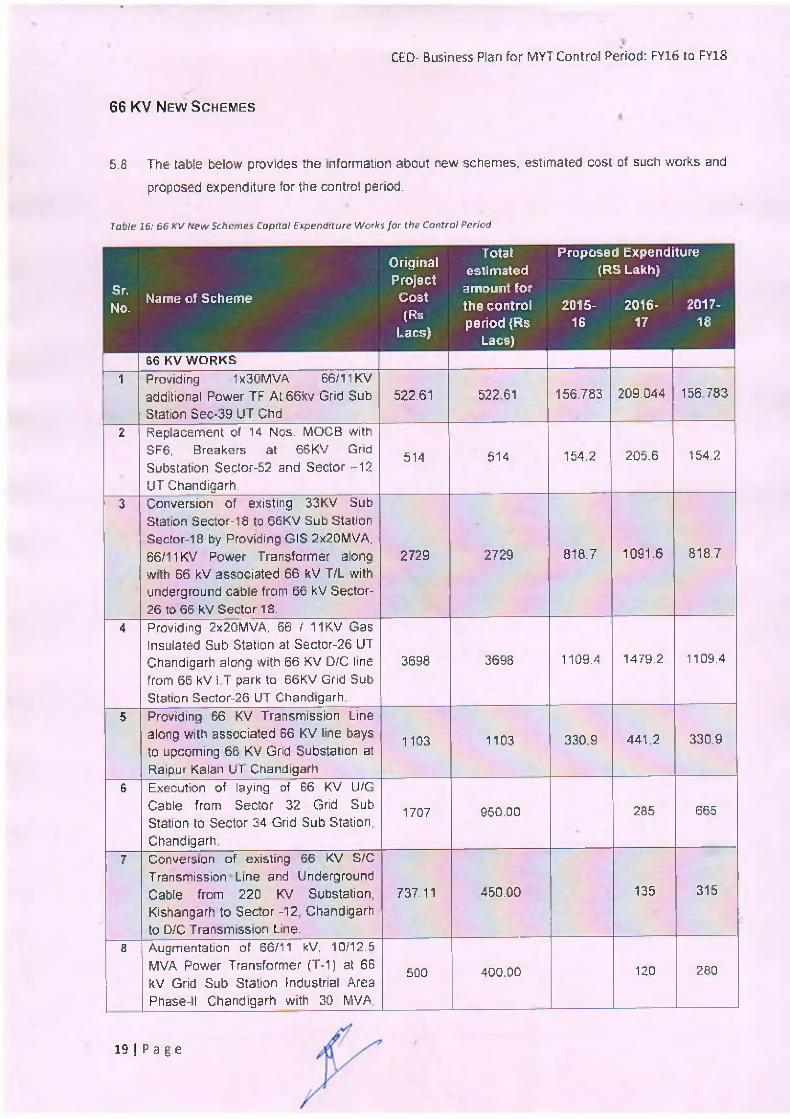
5.a The table below provides the information about new schemes, estimated cost of such works and
proposed expenditure for the control period.
CED- Business Plan for MYT Control Period: FY16 to FY1S
7able 16.' 65 KV New Schemes Capital Expenditure Works fo r the Control Period
Sr,No.
Name of Scheme
OriginalProject
Cost(Rs
Lacs)
Total estimated
amount for the control period (Rs
Lacs)
Proposed Expenditure (RS Lakh)
2016- 2016- 201716 17 18
66 KV WORKS1 Providing 1X 30M V A 66/11 KV
additional Power TF At66Kv Grid Sub Station SeC'39 UT Chd
522.61 52261 156 7S3 209.044 156 7S3
2 Replacement of 14 Nos. MOCB with SF6, Breakers at 66KV Grid Substation Sector-52 and Sector -12 UT Chandigarh.
514 614 154.2 206.6 154 2
3 Conversion of existing 33KV Sub Station Sector-18 to 66KV Sub Station Sector-18 by Providing GlS 2x20MVA, 66/11KV Power Transformer along with 66 kV associated 66 kV T/L with underground cable from 66 kV Sector- 26 to 65 kV Sector 18.
2729 2729 818.7 1091.6 818.7
4 Providing 2x2GMVA. 66 I 11KV Gas Insulated Sub Station at Sector-26 UT Chandigarh along with 66 KV D/C line from 66 kV 1 T park to 66KV Grid Sub Station Sector-26 UT Chandigarh
3698 3696 1109.4 1479.2 1109.4
5 Providing 66 KV Transmission Line along with associated 66 KV line bays to upcoming 66 KV Grid Substation at Raipur Kalan UT Chandigarh
1103 1103 330.9 441.2 330.9
6 Execution of laying of 66 KV U/G Cable from Sector 32 Grid Sub Station to Sector 34 Grid Sub Station, Chandigarh
1707 950.00 285 665
7 Conversion of existing 66 KV S/C Transmission Line and Underground Cable from 220 KV Substation, Kishangarh to Sector -12 Chandigarh to D/C Transmission Line.
737.11 450.00 135 315
0 Augmentation of 66/11 kV, 10/12.5 MVA Power Transformer (T-1) at 66 kV Grid Sub Stalion industrial Area Phase-H Chandigarh with 30 MVA.
500 400.00 120 280
19 1 P a g e

CED Business Plan for MYT Control Period; FY16 to FY18
Power along with replacement of 18 Nos. VCB installed at T-1 and T-2 Transformer of 66 kV Grid Sub Station Industrial Area Phase-ll, UT ChandigarhTotal 11510.61 10366.61 3956.64 3629.93 2569,93
Scheme Wise Detailed Description
5.9 The oojective/salient features of various ongoing works for the control period 2015-2013 is
provided as under:-
1. Providing 1x30MVA 66/11KV additional Rower TF At 6Gkv Grid Sub Station Sec-39 UT Chd
along with swjtchgears.
In order ro cope up with present as well as future load demand of area and to meet emergency
break down conditions, a new 66/1-1 KV Power Transformer of rating 30 MVA has been proposed
to be installed in place of damaged Power transformer^T-1). The scheme wilt help in providing a
reliable and continuous source of power supply to residents of surrounding area arsd to meet the
Standards of Performance notified by JERC An amount of Rs. 522.&1 Lacs has been proposed
to be utilized for the scheme The Scheme would be capitalized m the third year of the Control
period.
2. Replacement of 14 Nos. M0CB with SF6, Breakers at SSKV Grid Substation Sector-52 and
Sector -12 UT Chandigarh.
To replace the existing SSKV MOCBs with SF6 Breaker installed at SSKV Grid Substa!ior, at
Sector 52 and Sector 12, Chandigarh for reliability and uninterrupted power supply to the
residence of U.T , Chandigarh Total Expenditure of Rs514 Lacs has been proposed for the
control period The 50% scheme would be capitalized in second year and rest 50% in third year of
the control period
3. Conversion of existing 33KV Sub Station Sector-18 to 66KV Sub Station Sector-18 by
Providing GIS 2*20MVA, 66/11KV Power Transformer along with 66 kV associated 66 kV TIL
with underground cable from 66 kV Sector-26 to 66 kV Sector 13,
To help in providing a reliable and continuous source of power supply to residential/commercial
consumers of nearby area rt has been proposed to convert existing 33 kV GSS Sector 18 to 66 kV
GIS GSS along with 66 kV associated 66 kV TyL with underground cable from 66 kV Sectcr-26 to
20 | P a g e

CED- Business Plan for MYT Control Period: FY16 to FY13
66 KV Sector 10 Chd and to meet with the Standards of Performance notified by JERC Tola I
Expenditure of Rs, 2729 Lacs has been proposed for the scheme for the control period. The entire scheme would be capitalized in the third year of the control period
Providing 2x2GMVA, S61 11KV Gas Insulated Sub Station at Sector-26 UT Chandigarh along
with 66 KV D/C fine from 66 kV I.T park to 6&KV Grid Sub Station Sector-2& UT Chandigarh.
To help in providing a reliable and continuous source of power supply to residential/commercial
consumers of nearby area of upcoming Grid Substation Sector-26 and to meet with the Standards
of Performance notified by JERC an amount of Rs. 3698 Lacs has been proposed for control
period. The scheme would be capitalized in the third year of the control period.
Providing 66 KV Transmission Line along with associated 66 KV line hays to upcoming 66 KV Grid Substation at Raipur Kalan UT Chandigarh.
To providing a reliable and conlinuous source of power supply to upcoming 66 KV Gr.d S/tn
Raipur Kafan U T. Chandigarh so as feed residential/ commercial/ Industrial consumers of nearby
area of Grid Substation and upcoming Industrial Area Phase II!. at Raipur Kalan U T Chandigarh
and to meet with the Standards of Performance notified by JERC an amount of Rs, 1103 Lacs
has been proposed The 50% expenditure under the scheme would be capitalized in second year and rest 50% in third year of the control period
Execution o f laying o f 6G KV U/G Cable from Sector 32 Grid Sub Station to Sector $4 Grid Sub Station, Chandigarh.
To providing a reliable and continuous source of power supply to Sec. 34 G/Stn so as feed
residential/commercial consumers of nearby area of Grid Substation Sector 34 and further to
meet wrth the Standards of Performance notified by JERC an amount of Rs, 1707 Lacs has been
proposed out of whicii works amounting Rs 950 Lakhs will be carried out over 3 years of MYT
period and rest of the works will be carried over beyond MYT period No expenditure under the
Scheme is expected to be capitalized in next three years.
Conversion o f existing 66 KV S/C Transmission Line and Underground Cable from 220 KV
Substation. Kishangarh to Sector -12, Chandigarh to D/C Transmission Line.
To meet the upcoming load of 65 KV G/Stn Sarangpur. 66 KV Sector 12 G/Stn and 66 KV Sector
1 GvStn and for reliable power supply to PGl, High Court and other important offices of
21 | P a ge
CED- B u s in g Plan for MYT Control Period: FY16 to FY18
Chandigarh Administration. Punjab a Haryana Govt an amount of RSr 737.11 Lacs has been
proposed out of which works amounting Rs 450 Lakhs will be earned out over 3 years of MYT
period and rest of the works will be earned over beyond MYT period. No expenditure under the
Scheme is expected to be capitalized in next three years
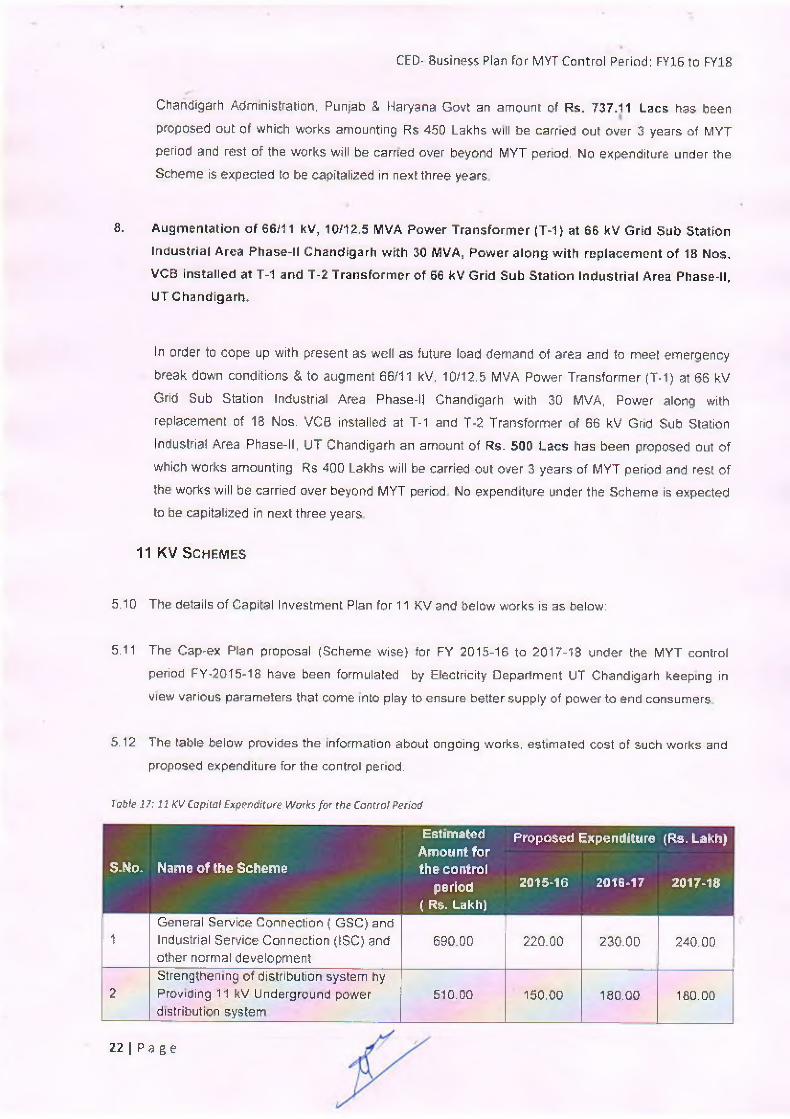
8. Augmentation o f 66yl 1 kV, 10/12.5 MVA Power Transformer <T-1) at SB kV Grid Sub Station
industrial Area Phase-ll Chandigarh with 30 MVA, Power along with replacement of 18 Nos,
VCB installed at T-1 and T-2 Transformer o f 66 kV Grid Sub Station Industrial Area Phase-ll, UT Chandigarh.
In order to cope up with present as well as future load demand of area and to meet emergency
break down conditions & to augment 66/11 kV. 10/12.5 MVA Power Transformer (T-1) at 66 kV
Grid Sub Station Industrial Area Phase-ll Chandigarh with 30 MVA, Power aiong with
replacement of 18 Nos. VC8 installed at T-1 and T-2 Transformer of 66 kV Grid Sub Station
Industrial Area Phase-ll, UT Chandigarh an amount of Rs. 500 Lacs has been proposed out of
which works amounting Rs 400 Lakhs will be carried out over 3 years of MYT period and rest of
the works will be carried over beyond MYT period No expenditure under the Scheme is expected to be capitalized in next three years
11 KV S c h e m e s
5.10 The details of Capital Investment Plan for 11 KV and below works is as below:
5.11 The Cap^ex Plan proposal (Scheme wise} for FY 2015-16 to 2017-13 under the MYT control
period FY’2015-18 have been formulated by Electricity Department UT Chandigarh keeptng in
view various parameters that come into play to ensure better supply of power to end consumers
5.12 The table below provides the information about ongoing works, estimated cost of such works and
proposed expenditure for the control period.
Table .17:14 KV Capital Expendilvf% Works fo r the Control Period
S-No* Name of the Scheme
Estimated Amount for the control
period ( Rs. Lakh)
Proposed Expenditure (Rs. Lakh)
2015-16 2018*17 2017-18
1General Service Connection ( GSC) and Industrial Service Connection (ISC) and other normal development
690.00 220.00 230.00 240.00
2Strengthening of distribution system hy Providing 11 kV Underground power distribution system
510.00 150.00 leo.oo 180.00
22 I P a g e

CED- Business Plan for MYT Control Period: FY1G to FYlS
3
Strengthening of distribution system by p ra y id ing/Aun mentation 11/.400 KV, 315/200/100 KVA Distribution Transformers along with I T ACB
640 00 200.00
,
220.00 220 00
4 Providing and Augmentation of the LT G/H ACSR conductors SO. 00 60.00 10.00 10.00
5 Providing 11 kV /LT Aerial Bunched Cables 390.00 120.00 130.00 140.00
e
Providing improved metering system, communication , Special tools , testing equipment, Vehicles, sky lift, safety devices office equipment etc,
245.00 65.00 90 00 90.00
7improvement and augmentation of 66/11 kV existing Substations and 11 kV Indoor substations
220.00 100.00 eo.oo 60.00
3 Installation of LT Shunt Capacitors on the existing distribution transformers 140.00 30.00 50.00 60.00
9 Replacement of the electro mechanical meters to static meters. 175.00 115.00 60.00 0.00
Total 3090.00 1060,00 1030.00 1000.00
Scheme Wise Detailed Description
5.13 The ob jec tive ^ lient features of various schemes mention in above table, for the control period 2015-2010 is provided as under: -
1. Name o f the scheme: General Service Connection (GSC} and industrial Service Connection (ISC) and other normal development
Objective of the scheme
Provide additional distribution network with transformer centers & associated HT/LT service lines for arranging power supply to various categories of HT< consumers.
Salient Features.
The scheme for Normal Development Works & Release of Service connection is basically scheme for ihe additions made m the existing electrical network to cope with the loads on the system due to release of various type of service connections (GSC/ISCjto the consumers in the UT.
The Department receives several applications from Domestic. Commercial, Industrial and other electricity connections throughout the year and releases these loads from existing system. Due to above growth in the existing system, the voltage regulation and loading of the system constantly goes on increasing up ro limits beyond which it cannot carer the loads without erecting transformer centre, lines and other related accessories Therefore, hie main objective of works p re posed is to provide service connection lines, meters etc.. to cope with prospective loads coming during the year The works under this scheme are earned out on the basis of 15% return per annum as per its terms
23 | P a g e
CEO- Business Plan for MYT Control Period: FY16 to FY18
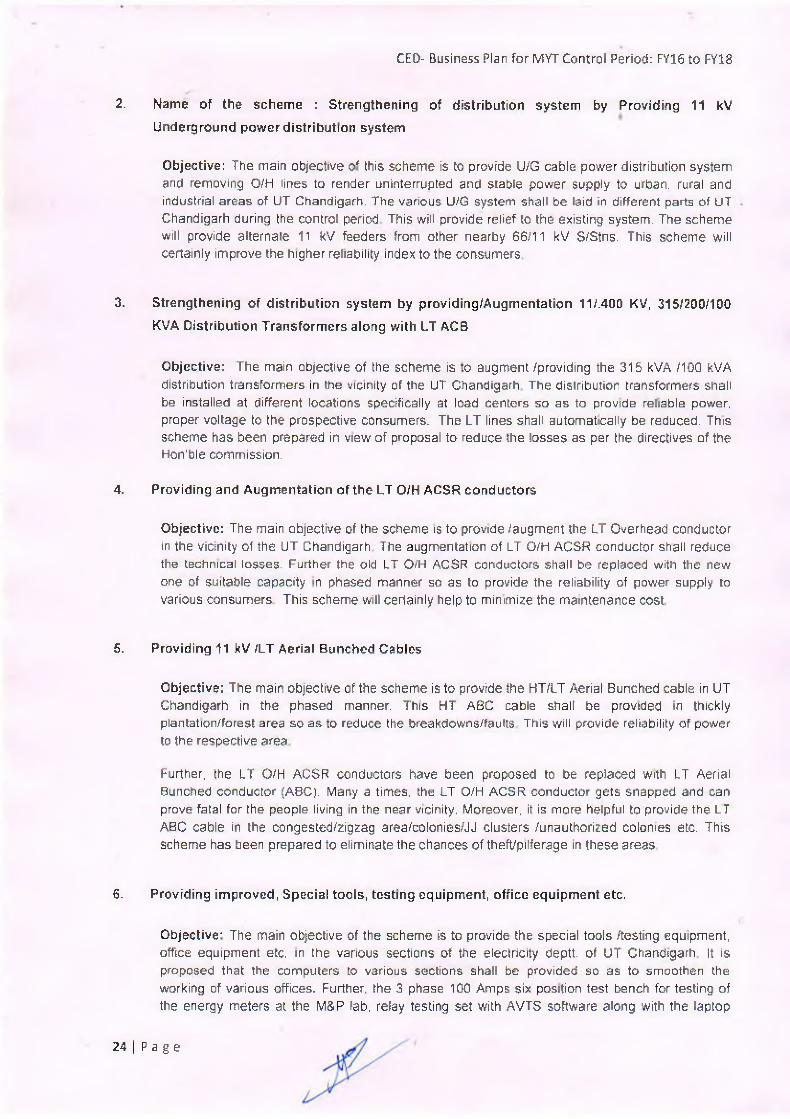
2. Marne of the scheme : Strengthening of distribution system by Providing 11 kV
Underground power distribution system
Objective: The main objective o' this scheme is to provide U/G cablc power distribution system and removing O/H lines to render uninterrupted and stable power supply to urban, rural and industrial areas of UT Chandigarh. The various U/G system shall be laid in different parts of UT Chandigarh during the control period This will provide relief to the existing system. The scheme will provide alternate 11 kV feeders from other nearby 66/11 kV S/Stn s. This scheme will certainly improve the higher reliability index to the consumers
3. Strengthening o f distribution system by providing/Augmentation 11/.4Q0 KV, 315/200/100
KVA Distribution Transformers along with LT ACB
Objective: The main objective of the scheme is to augment /providing the 315 kVA /10Q kVA distribution transformers in the vicinity of the UT Chandigarh The distribution transformers shall be installed at different locations specifically at load centers so as to provide reliable power, proper voltage to the prospective consumers.. The LT lines shall automatically be reduced. This scheme has been prepared in View of proposal to reduce the iosses as per the directives of the Hon'ble commission.
4. Providing and Augmentation o f the LT O/H ACSR conductors
Objective: The main objective of the scheme is to provide /augment the LT Overhead conductor in the vicinity of the UT Chandigarh The augmentation of LT O/H ACSR conductor shall reduce the technical losses. Further the old LT O/H ACSR conductors shall be replaced with the new one of suitable capacity n phased manner so as to provide the reliability of power supply to various consumers This scheme will! cerlainly help to minimize the maintenance cost
5. Providing 11 W /LT Aerial Bunched Cables
Objective: The main objective of the scheme is to provide the HT/LT Aerial Bunched cable in UT Chandigarh in the phased manner. This HT ABC cable shall be provided in thickly plantation/forest area so as to reduce the breakdown s/fa u tts This will provide reliability of power to the respective area
Further, the LT O/H ACSR conductors have been proposed to be replaced with LT Aerial Bunched conductor (ABC). Many a times, the LT O/H ACSR conductor gets snapped and can prove fatal for the people living in the near vicinity, Moreover, it is more helpful to provide the LT ABC cable in the conges ted/zigzag area/colonies/JJ clusters /unauthorized colonies etc. This scheme has been prepared to eliminate the chances of theft/pilferage in these areas
6- Providing improved, Special tools, testing equipment, office equipment etc.
Objective' The main objective of the scheme is to provide the special tools /testing equipmenL office equipment etc, in the various sections of the electricity deptt. of UT Chandigarh It is proposed that the computers to various sections shali be provided so as to smcothen the working of various offices. Further, the 3 phase 100 Amps six position test bench for testing of the energy meters at the MSP lab, relay testing set with AVTS software along with the laptop
24 | P a g e

CLU- Business Plan for MYT Control Period: FY16 to FY1S
computer system and essential accessories and testing software CDs/DVDs for MSP wing, has been proposed to be completed The primary injection set 1000 Amps, 6 KVA along with cable, accessories, testing software CDs/DVDs for the M&P has also been proposed to be procured and capitalized. Besides this, the vehicles safety devices, sky lift etc. are also proposed to be procured during the control period
7. Improvement by augmentation and development of 66/11 kV existing Substations and 11 kV
Indoor substations
Objective: The main objective of the scheme is to provide various improvement by way of augmentation and development works in various 66 kV S/Statfons. of UT Chandigarh. The scheme will provide the replacement of o!d MOCB with SF6 breakers, Replacement of old and obsolete panels, and ether allied equipment etc, The battery charger along with battery bank (VRLA) and DCDB at 66 kV Grid Substations at Ind Area Phase I Phase II and Secto? 47 has also been proposed to be replaced as the same has com pie ted their usefuJ life
Further, the 11 kv indoor substations equipment are getting old and obsolete and requires augmentation and improvement of the 11 kv Indoor sub stations by way of replacement of LT Panels. HT breakers along with allied equipment etc. so as to provide adequate protection to the costly equipment in the substations scheme also include (he erection and commissioning work of the ime bay between 66 kV phase I and phase II so as to strengthen the 66 kV system in U1 Chandigarh.
8. Installation o f LT Shunt Capacitors on the existing distribution transformers
Objective. The mam objective of the scheme is to provide the LT Shunt capacitors on the existing distribution transformers keeping in view the reactive power drawl so as to improve upon the voltage profile and power factor which further will reduce the distribution losses to some extent. The LT shunt capacitors shall be provided in different areas keeping m view the load profile as welt as power factor in the respective areas.
9. Replacement of the electro mechanical meters to static meters
Objective: As per the directive of the Hon'ble JERC. the electricity department. Intends to replace all the electro mechanical meters with the static meters as per the guidelines of Central Electricity Authority (CEA) The replacement program has been scheduled during the control period
C a p it a l iz a t io n Sc h e d u l e
5.14 100% capitalization of the amount proposed in the concerned year itself for of 11 KV schemes
such as General service connections and industrial service connections, augmentation distribution
transformers and I.T OH conductors installation of shunt capacitors and replacement of electro
mechanical meters has been considered.
5.15 The 66 kV ongoing schemes are expected to be capitalized ?n second and third year of the control
penod except scheme at Serial no 7 and which are expected to be capitalized tn first year and
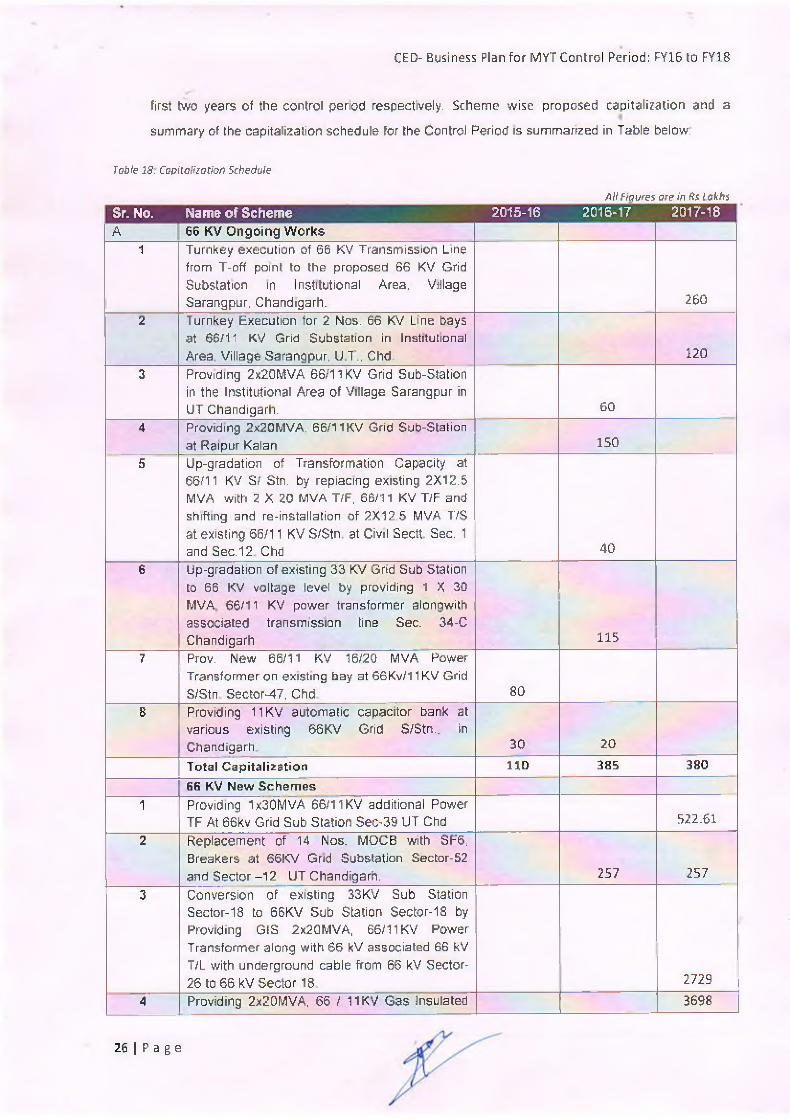
CED- Business Plan for MYT Control Period: FY16 to FY18
first two /ears of the control period respectively. Scheme wise proposed capitalisation and a
summary of the capitalization schedule for the Control Period is summarized in Table below.
Table 18. Capitalization Schedule
A ll Figures are in ftf I gkftsSr. No. Name of Scheme 2015-16 2016-17 2017-18A 66 KV Ongoing Works
1 Turnkey execution of 66 KV Transmission Line from T-off point to the proposed 66 KV Grid Substation in Institutional Area, Village Sarangpur, Chandigarh. 260
2 Turnkey Execution for 2 Nos. 66 KV Line bays at 66/11 KV Grid Substation in Institutional Area, Village Sarangpur, UT., Chd. 120
3 Providing 2x20MVA 66/11KV Grid Sub-Station in the Institutional Area of Village Sarangpur in UT Chandigarh. 60
4 Providing 2x20MVA. 66/11KV Grid Sub-Station at Raipur Kalan 150
5 Up-gradation of Transformation Capacity at 66/11 KV SI Stn. by repiacmg existing 2X12.5 MVA with 2 X 20 MVA T/F, 66/11 KV T/F and shifting and re-installation of 2X12.5 MVA TVS at existing 66/11 KV S/Stn at Civil Sectt Sec. 1 and Sec.12 Chd 40
6 Up-gradation of existing 33 KV Grid Sub Station to 66 KV voltage level by providing 1 X 30 MVA 66/11 KV power transformer alongwith associated transmission tine Sec. 34-C Chandigarh 115
7 Prov. New 66/11 KV 16/20 MVA Power Transformer on existing bay at 66Kv/11KV Gfid S/Stn Sector-47, Chd 80
8 Providing 11KV automatic capacitor bank at various existing 66 KV Grid S/Stn.. in Chandigarh 30 20
Total Capitalization HD 385 38066 KV New Schemes
1 Providing 1x30MVA 66/11KV additional Power TF At 66kv Grid Sub Station Sec~39 UT Chd 522.61
2 Replacement of 14 Nos. MOCB with SF6. Breakers at 66KV Gnd Substation Sector-52 and Sector-12 UT Chandigarh. 257 257
3 Conversion of existing 33KV Sub Station Sector-18 to 66KV Sub Station Sector-18 by Providing GfS 2x20MVA, 66/11KV Power Transformer along with 66 kV associated 66 kV T/L with underground cable from 66 kV Sector- 26 to 66 kV Sector 18 2729
4 Providing 2x20MVA, 66 / 11KV Gas Insulated 3698
26 | P a g e

CED- Business Plan for MYT Control Period: FY16 to FY18
Sub Station at Sector-26 U f Chandigarh along with 66 KV D/C line from 66 kV §T park to 66 KV Grid Sub Station Sector-26 UT Chandigarh.
5 Providing 66 KV Transmission Line along with associated 66 KV line bays to upcoming 66 KV Grid Substation at Raipur Kalan UT Chandigarh 551.5 551.5
6 Execution of laying of 66 KV U/G Cable from Sector 32 Grid Sub Station to Sector 34 Grrd Sub Station. Chandigarh.
7 Conversion of existing 66 KV S/C Transmission Line and Underground Cable from 220 KV Substation, Kishangarh to Sector -12, Chandigarh to D/C Transmission Line.
8 Augmentation oF 66/11 kV 10/12.5 MVA PoWer Transformer (T-1) at 66 KV Grid Sub Station Industrial Area Phase-ll Chandigarh with 30 MVA, Power along with replacement of 10 Nos VCB installed at T-1 and T-2 Transformer of 66 kV Grid Sub Station Industrial Area Phase-ll UT Chandigarh.Total Capitalisation 0 B08.5 775811 kV Schemes
1General Service Connection ( GSCJ and Industrial Service Connection (ISC) and other normal development 220.00 230.00 240.00
2Strengthening of distribution system by Profiling 11 kV Underground power distribution system 90 168 180
3
Strengthening of distribution system by pro vid in g/Aug me nta I i a n 11 /. 4 0 0 KV 315/200/100 KVA Distribution Transformers along wrth LT ACS 200.00 220.00 220.00
AProviding and Augmentation of the LT O/H ACSR conductors 60.00 10.00 10.00
5 Providing 11 kV/LT Aerial Bunched Cables 72 126 136
6
Providing improved metering system, communication , Special tools . testing equipment, Vehicles, sky lift, safety devrces office equipment etc 39 SO 90
7Improvement and augmentation of 66/11 KV existing Substations and 11 kV Indoor substatrons 60 76 60
0 Installation of I.T Shun I Capacitors on the existing distribution transformers 30,00 50.00 60.00
9Replacement of the electro mechanical meters to static meters 115.00 60.00 0.00Total 11 kV Schemes Capitalization S3 6.00 1020.00 996,00Grand Total Capitalization 2213.50 9134.11
27 ! P a g e
CED- Business Plan for MYT Control Period: FY16 to FY18
C h a p t e r 6: F in a n c in g o f t h e Ca p it a l S c h e m e s
6.1 The entire capital expenditure incurred by CED had keen funded through equity infusion by G0I
through budgetary support without any external borrowings. There is no loan borrowings by the
Chandigarh electricity department for the capital expenditure.
6.2 As per the MYT Regulations the |§'EQ has considered normative debt equity ratio of 70 30 for
projecting normative loan for the control period The Repayment has been considered to be equal
to the depreciation amount The interest at the SRI PLR rate has been applied on the average
normative deb) in order to project the amount of normative interest. The average depreciation rate
of 5 28 % as approved by the CERC is considered for computing the depreciation on the fixed
assets The Return of Equity on 30% normative equity is claimed as per JERC MYT tariff
regulations.
28 | P a g e