business plan template: business plan play place€¦ · web viewbusiness plan template by savetz...
TRANSCRIPT
[COMPANY NAME]
[NAME][ADDRESS]
Cell: [PHONE]Fax: [FAX]
E-Mail: [EMAIL]Website: [WEBSITE]
Confidentiality Agreement
The undersigned reader acknowledges that the information provided by [COMPANY] in this business plan is confidential; therefore, reader agrees not to disclose it without the express written permission of [COMPANY].
It is acknowledged by reader that information to be furnished in this business plan is in all respects confidential in nature, other than information which is in the public domain through other means and that any disclosure or use of same by reader may cause serious harm or damage to [COMPANY].
Upon request, this document is to be immediately returned to [COMPANY].
___________________ Signature
___________________Name (typed or printed)
___________________Date
This is a business plan. It does not imply an offering of securities.
Table of Contents
1.0 Executive Summary......................................................................................................................1Chart: Highlights............................................................................................................................2
1.1 Objectives.....................................................................................................................................21.2 Mission...........................................................................................................................................21.3 Keys to Success..........................................................................................................................3
2.0 Company Summary......................................................................................................................32.1 Company Ownership................................................................................................................42.2 Start-up Summary.....................................................................................................................4
Table: Start-up...............................................................................................................................4Chart: Start-up...............................................................................................................................5
3.0 Products and Services.................................................................................................................54.0 Market Analysis Summary.........................................................................................................6
4.1 Market Segmentation..............................................................................................................6Table: Market Analysis................................................................................................................6Chart: Market Analysis (Pie)......................................................................................................7
4.2 Target Market Segment Strategy........................................................................................74.3 Service Business Analysis......................................................................................................7
4.3.1 Competition and Buying Patterns................................................................................75.0 Web Plan Summary......................................................................................................................8
5.1 Website Marketing Strategy..................................................................................................85.2 Development Requirements.................................................................................................8
6.0 Strategy and Implementation Summary..............................................................................86.1 SWOT Analysis............................................................................................................................9
6.1.1 Strengths..............................................................................................................................96.1.2 Weaknesses.......................................................................................................................106.1.3 Opportunities.....................................................................................................................106.1.4 Threats.................................................................................................................................10
6.2 Competitive Edge....................................................................................................................106.3 Marketing Strategy.................................................................................................................116.4 Sales Strategy...........................................................................................................................11
6.4.1 Sales Forecast...................................................................................................................13Chart: Sales Monthly..............................................................................................................14Chart: Sales by Year...............................................................................................................14
6.5 Milestones..................................................................................................................................15Table: Milestones........................................................................................................................15
7.0 Management Summary.............................................................................................................167.1 Personnel Plan..........................................................................................................................16
Table: Personnel..........................................................................................................................168.1 Start-up Funding......................................................................................................................17
Table: Start-up Funding............................................................................................................188.3 Break-even Analysis...............................................................................................................19
Table: Break-even Analysis.....................................................................................................198.4 Projected Profit and Loss......................................................................................................20
Table: Profit and Loss................................................................................................................20Chart: Profit Monthly..................................................................................................................21Chart: Profit Yearly.....................................................................................................................21Chart: Gross Margin Monthly..................................................................................................22
Table of Contents
Chart: Gross Margin Yearly......................................................................................................228.5 Projected Cash Flow...............................................................................................................23
Table: Cash Flow.........................................................................................................................23Chart: Cash....................................................................................................................................24
8.6 Projected Balance Sheet.......................................................................................................24Table: Balance Sheet.................................................................................................................25
8.7 Business Ratios........................................................................................................................25Table: Ratios.................................................................................................................................26
Table: Sales Forecast...........................................................................................................................1Table: Personnel....................................................................................................................................2Table: Profit and Loss..........................................................................................................................3Table: Cash Flow...................................................................................................................................4Table: Balance Sheet...........................................................................................................................5
[COMPANY] 2010
1.0 Executive Summary
[COMPANY] L.L.C.[NAME][ADDRESS]Cell: [PHONE]Fax: [FAX] E-Mail: [EMAIL]Website: [WEBSITE]
[COMPANY] is a sole proprietorship 100% owned by [NAME]. Currently, the Company operates out of [NAME]'s home. [COMPANY] has tentatively signed a lease for a building to house the operation at [ADDRESS], [CITY], [STATE].
[COMPANY] is a children's entertainment center offering a safe, clean stimulating entertainment and recreation for families with young physically active children, toddler -14 years. The main objective is to appeal to the cognitive, emotional, physical, special and social development of this population. The children entertainment industry is a rapidly growing industry. The focus on the well being of our children to participate in safe, clean exciting places becomes more important as the world around us becomes less stable. Parents look for places to entertain their youngsters that involve fun, active, social environments.
The focus of this business plan is to put forth objectives to launch operations, work efficiently and effectively, expand internal operations giving the Company the opportunity to grow with sales growth in the [COUNTY] area. [COMPANY] is ready to elevate to the next step. The Company is seeking grant funding in the amount of $585,000. The grant funding will be used to launch operations including: Build-out Leasehold Improvements, Purchase Amusement Area Equipment, Purchase Non-Amusement Area Equipment, Purchase Furniture & Fixtures, Purchase Concession and Retail Equipment and Displays, Purchase opening Inventory for Concession and Retail, Install Interior and Exterior Signage and Hire Employees. Additionally, Grant Funds will be used to launch our advertising campaign for our grand opening and introducing our facility and services to the residents of [COUNTY].
1
[COMPANY] 2010
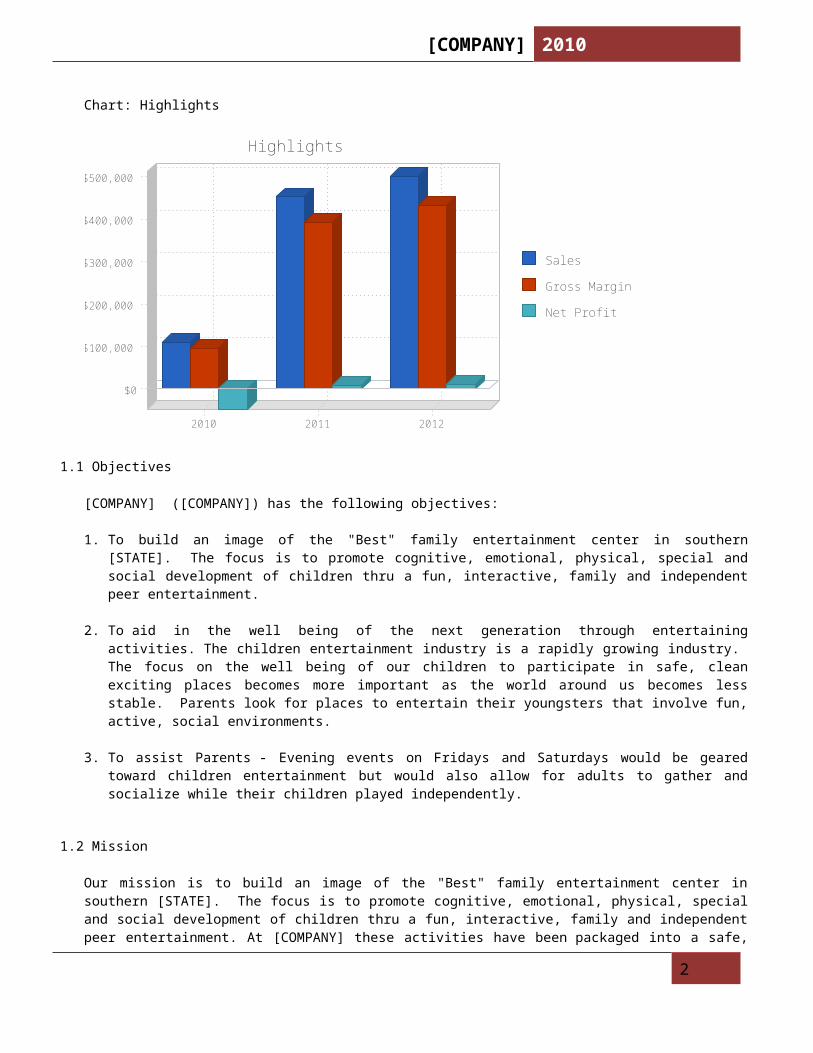
Chart: Highlights
Sales
Gross Margin
Net Profit
$0
$100,000
$200,000
$300,000
$400,000
$500,000
2010 2011 2012
Highlights
1.1 Objectives
[COMPANY] ([COMPANY]) has the following objectives: 1. To build an image of the "Best" family entertainment center in southern [STATE]. The focus is
to promote cognitive, emotional, physical, special and social development of children thru a fun, interactive, family and independent peer entertainment.
2. To aid in the well being of the next generation through entertaining activities. The children entertainment industry is a rapidly growing industry. The focus on the well being of our children to participate in safe, clean exciting places becomes more important as the world around us becomes less stable. Parents look for places to entertain their youngsters that involve fun, active, social environments.
3. To assist Parents - Evening events on Fridays and Saturdays would be geared toward children
entertainment but would also allow for adults to gather and socialize while their children played independently.
1.2 Mission
Our mission is to build an image of the "Best" family entertainment center in southern [STATE]. The focus is to promote cognitive, emotional, physical, special and social development of children thru a fun, interactive, family and independent peer entertainment. At [COMPANY] these activities have been packaged into a safe, clean, climate-controlled environment for children 14 and under to exercise and have fun while stimulating their imagination and challenging them physically. The indoor play park is based on the premise that if you set a large number of children inside a safe, yet challenging, imaginative soft playground area, they are going to have fun. They are also going to develop basic motor skills, muscle tone, self-confidence and social development through peer interaction. Furthermore, parents can enjoy close interaction with their children in a safe, secure, and stimulating environment. [COMPANY] is a place where everyone can play and have fun together; a missing link within in the family unit today.
2
[COMPANY] 2010
1.3 Keys to Success
[COMPANY] Key’s to success are: 1. Variety of entertainment and activities offered to keep children engaged.
2. Expanding activities and keeping up with market trends in children's entertainment.
3. Growth in size of our operations and offerings; keep our services fresh and new to keep
children wanting to come back as they advance in age.
2.0 Company Summary
[COMPANY][NAME][ADDRESS]Cell: [PHONE]Fax: [FAX] E-Mail: [EMAIL]Website: [WEBSITE]
[COMPANY] ([COMPANY]) is a children's entertainment center offering a safe, clean stimulating entertainment and recreation for families with young physically active children, toddler -14 years. The main objective is to appeal to the cognitive, emotional, physical, special and social development of this population. Activities will consist of, but are not limited to, a giant Soft Contained Play Structure for children 3 and older and a smaller play area for toddlers under the age of 3, an area with several interactive skill games, a snack bar to accommodate seating for 100 - 125 persons at a time, a small physically interactive gaming room and a small merchandise and souvenir stand.
A Market Opportunity exists in the Central Southern [STATE] area to serve children aged 14 and under with an indoor exercise and recreation facility. [COMPANY] is themed like the tropics. The colors will be bright, with accents of palm trees, sand and water colored flooring with music that will keep a beat lasing long after the visit. [COMPANY] is an invigorating, bright and exciting place for parents to enjoy time spent with their young ones or to allow for their children to play independently with other children their age while enjoying the chance to observe their children, work, or converse with other adults.
2.1 Company Ownership
[COMPANY] ([COMPANY]) is a sole proprietorship 100% owned by [NAME]. Mrs. [NAME] has managerial Sales, HR, A/P, A/R and operational experience. Prior to the operations, HR, A/P, A/R position held in the last 7 years, for Underground Testing & Services, she was an east cost sales representative for an international software company. Mrs. [NAME] holds a bachelors degree in Marketing and a Masters of Business Administration. Currently, the Company operates out of [NAME]'s home. [COMPANY] has tentatively signed a lease for a building to house the operation at [ADDRESS], [CITY], [STATE].
3
[COMPANY] 2010
2.2 Start-up Summary
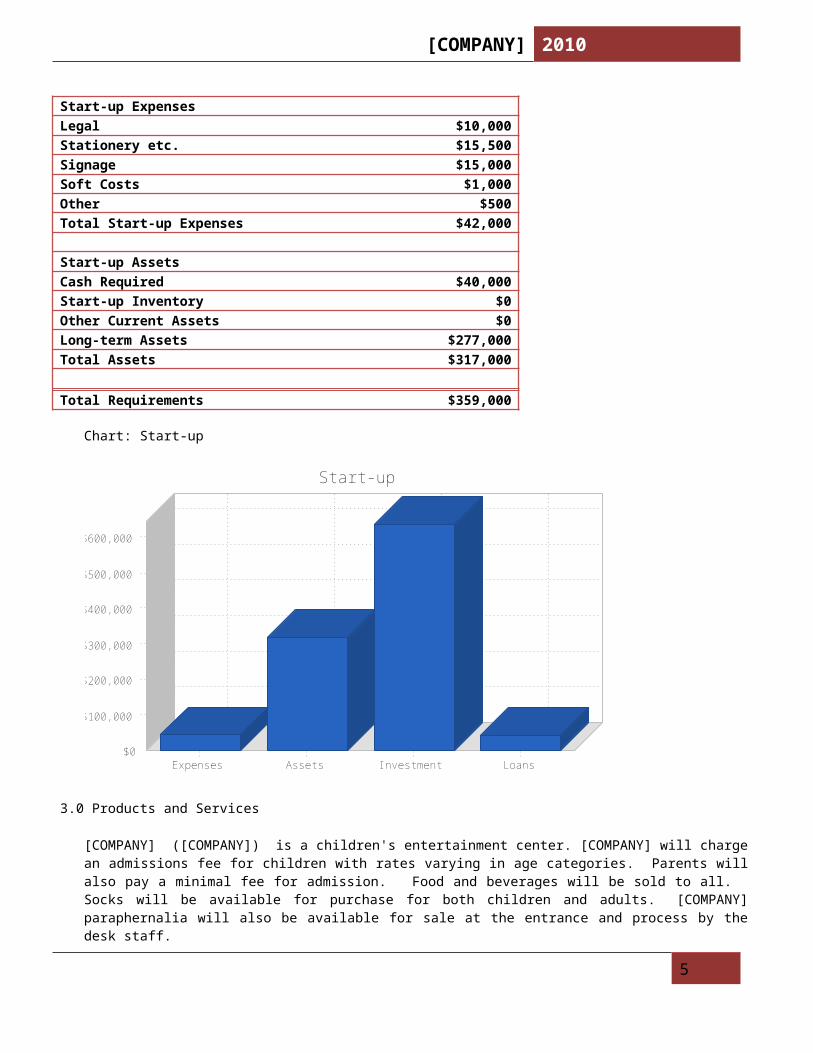
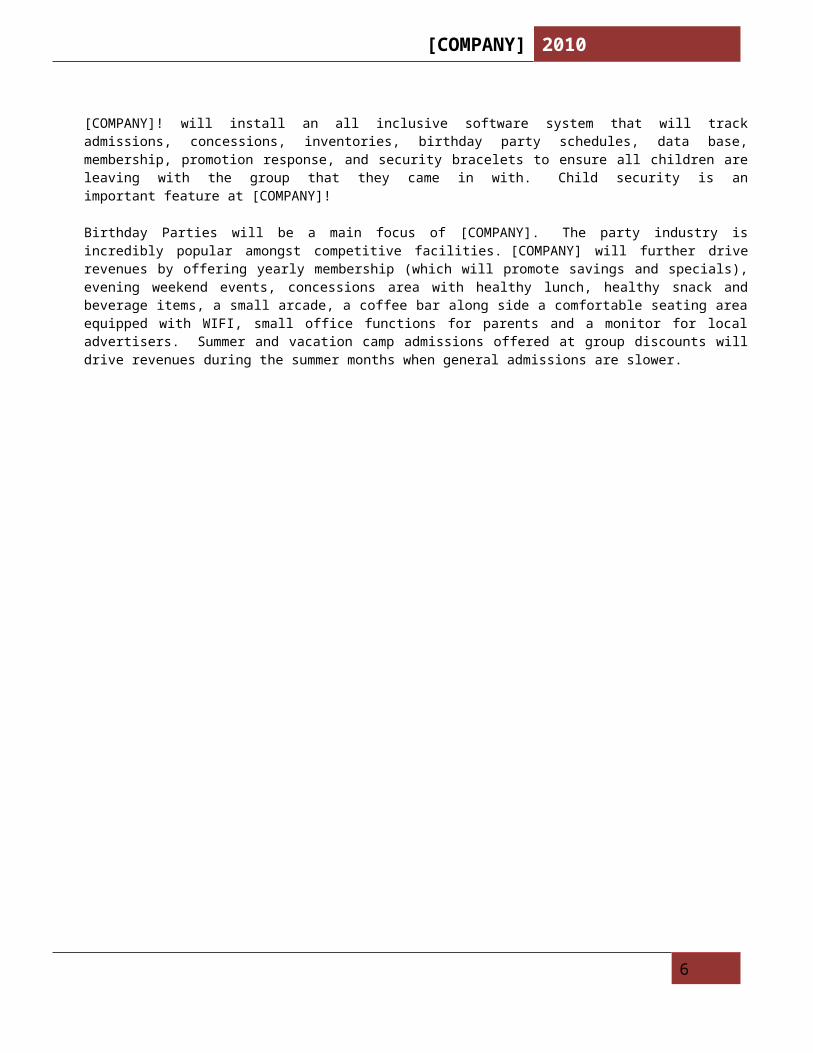
[COMPANY] ([COMPANY]) was established in 2009 as a sole proprietorship. The Company is anticipating receiving Grant Funding in the amount of $585,000 in July 2010. Start-up expenses will occur in July with the facility opening October 1, 2010. The Company will have start-up expenses totaling $42,500. The Company will have a Concession and Retail area that will require an opening inventory of $6000. The following long term assets will be required prior to our opening as follows: Amusement Area Equipment - $158,000Leasehold Improvements - $41,000Non-Amusement Area Equipment - $47,000Furniture & Fixtures - $18,000Concession & Retail Equipment - $13,000Total Long Term Assets - $277,000 The following table and chart shows the start-up costs for [COMPANY].
Table: Start-up
Start-upRequirementsStart-up ExpensesLegal $10,000 Stationery etc. $15,500 Signage $15,000 Soft Costs $1,000 Other $500 Total Start-up Expenses $42,000
Start-up AssetsCash Required $40,000 Start-up Inventory $0 Other Current Assets $0 Long-term Assets $277,000 Total Assets $317,000
Total Requirements $359,000
4
[COMPANY] 2010
Chart: Start-up
$0
$100,000
$200,000
$300,000
$400,000
$500,000
$600,000
Expenses Assets Investment Loans
Start-up
3.0 Products and Services
[COMPANY] ([COMPANY]) is a children's entertainment center. [COMPANY] will charge an admissions fee for children with rates varying in age categories. Parents will also pay a minimal fee for admission. Food and beverages will be sold to all. Socks will be available for purchase for both children and adults. [COMPANY] paraphernalia will also be available for sale at the entrance and process by the desk staff.
[COMPANY]! will install an all inclusive software system that will track admissions, concessions, inventories, birthday party schedules, data base, membership, promotion response, and security bracelets to ensure all children are leaving with the group that they came in with. Child security is an important feature at [COMPANY]!
Birthday Parties will be a main focus of [COMPANY]. The party industry is incredibly popular amongst competitive facilities. [COMPANY] will further drive revenues by offering yearly membership (which will promote savings and specials), evening weekend events, concessions area with healthy lunch, healthy snack and beverage items, a small arcade, a coffee bar along side a comfortable seating area equipped with WIFI, small office functions for parents and a monitor for local advertisers. Summer and vacation camp admissions offered at group discounts will drive revenues during the summer months when general admissions are slower.
5
[COMPANY] 2010
4.0 Market Analysis Summary
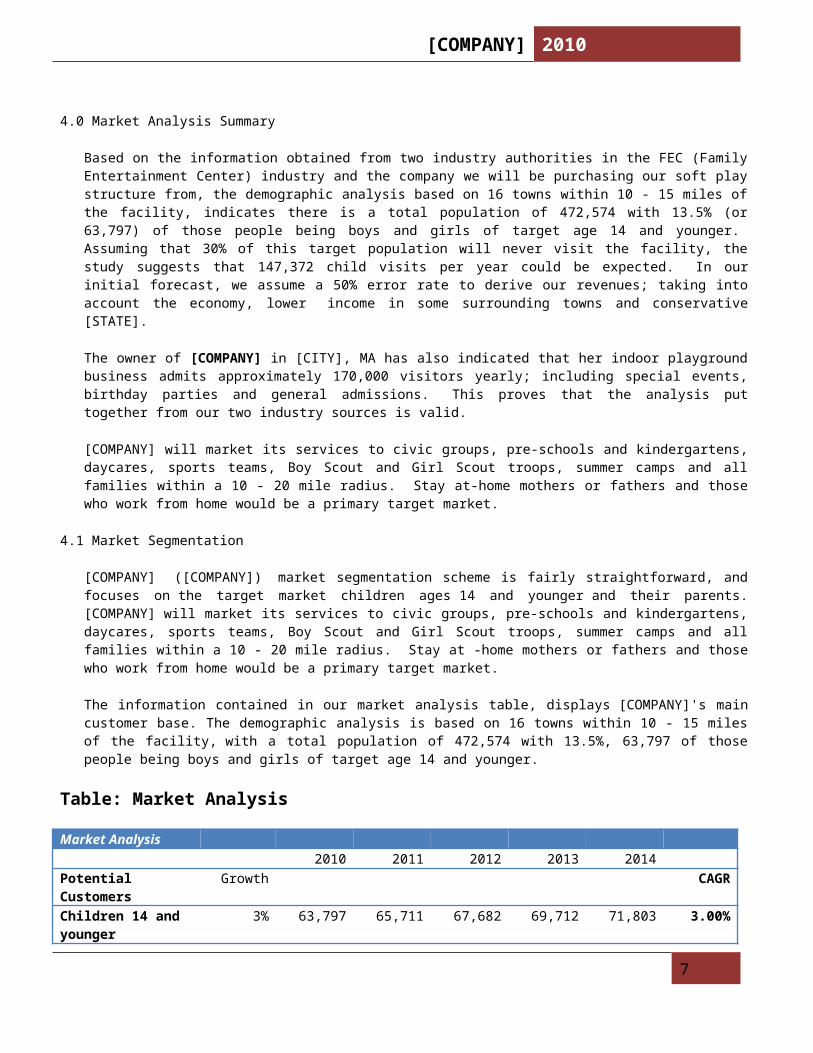
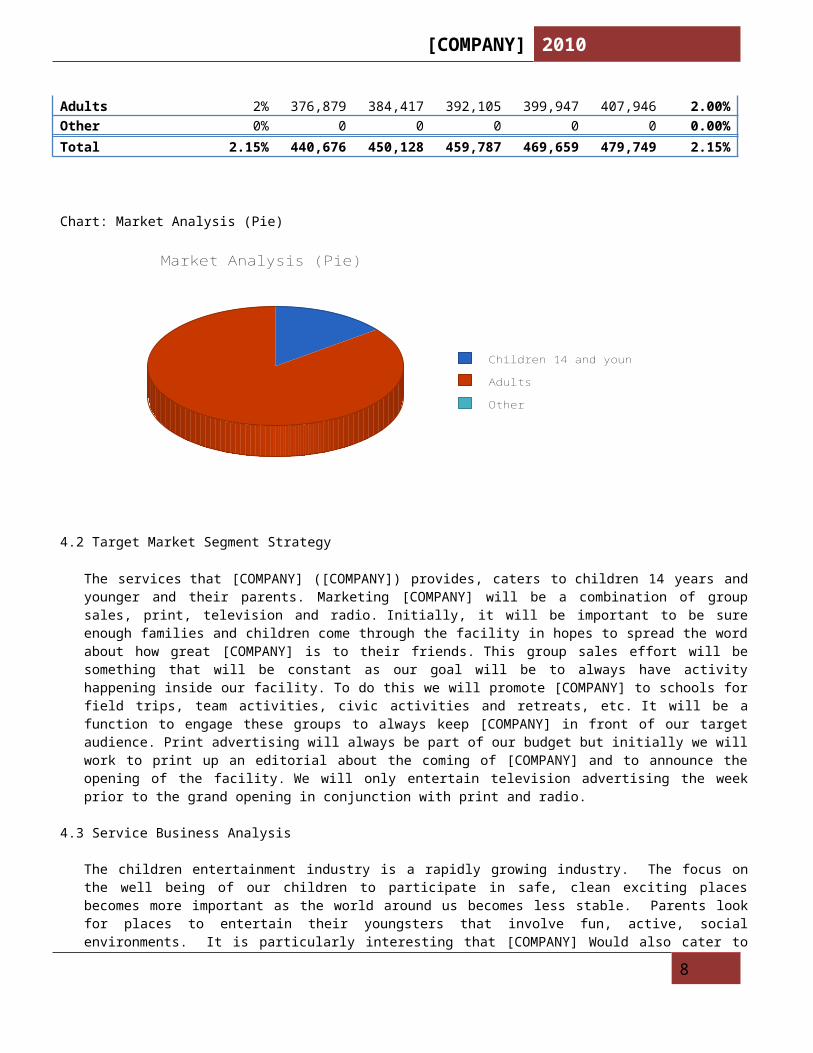
Based on the information obtained from two industry authorities in the FEC (Family Entertainment Center) industry and the company we will be purchasing our soft play structure from, the demographic analysis based on 16 towns within 10 - 15 miles of the facility, indicates there is a total population of 472,574 with 13.5% (or 63,797) of those people being boys and girls of target age 14 and younger. Assuming that 30% of this target population will never visit the facility, the study suggests that 147,372 child visits per year could be expected. In our initial forecast, we assume a 50% error rate to derive our revenues; taking into account the economy, lower income in some surrounding towns and conservative [STATE].
The owner of [COMPANY] in [CITY], MA has also indicated that her indoor playground business admits approximately 170,000 visitors yearly; including special events, birthday parties and general admissions. This proves that the analysis put together from our two industry sources is valid.
[COMPANY] will market its services to civic groups, pre-schools and kindergartens, daycares, sports teams, Boy Scout and Girl Scout troops, summer camps and all families within a 10 - 20 mile radius. Stay at-home mothers or fathers and those who work from home would be a primary target market.
4.1 Market Segmentation
[COMPANY] ([COMPANY]) market segmentation scheme is fairly straightforward, and focuses on the target market children ages 14 and younger and their parents. [COMPANY] will market its services to civic groups, pre-schools and kindergartens, daycares, sports teams, Boy Scout and Girl Scout troops, summer camps and all families within a 10 - 20 mile radius. Stay at -home mothers or fathers and those who work from home would be a primary target market.
The information contained in our market analysis table, displays [COMPANY]'s main customer base. The demographic analysis is based on 16 towns within 10 - 15 miles of the facility, with a total population of 472,574 with 13.5%, 63,797 of those people being boys and girls of target age 14 and younger.
Table: Market Analysis
Market Analysis2010 2011 2012 2013 2014
Potential Customers Growth CAGRChildren 14 and younger
3% 63,797 65,711 67,682 69,712 71,803 3.00%
Adults 2% 376,879 384,417 392,105 399,947 407,946 2.00% Other 0% 0 0 0 0 0 0.00% Total 2.15% 440,676 450,128 459,787 469,659 479,749 2.15%
6
[COMPANY] 2010
Chart: Market Analysis (Pie)
Children 14 and younger
Adults
Other
Market Analysis (Pie)
4.2 Target Market Segment Strategy
The services that [COMPANY] ([COMPANY]) provides, caters to children 14 years and younger and their parents. Marketing [COMPANY] will be a combination of group sales, print, television and radio. Initially, it will be important to be sure enough families and children come through the facility in hopes to spread the word about how great [COMPANY] is to their friends. This group sales effort will be something that will be constant as our goal will be to always have activity happening inside our facility. To do this we will promote [COMPANY] to schools for field trips, team activities, civic activities and retreats, etc. It will be a function to engage these groups to always keep [COMPANY] in front of our target audience. Print advertising will always be part of our budget but initially we will work to print up an editorial about the coming of [COMPANY] and to announce the opening of the facility. We will only entertain television advertising the week prior to the grand opening in conjunction with print and radio.
4.3 Service Business Analysis
The children entertainment industry is a rapidly growing industry. The focus on the well being of our children to participate in safe, clean exciting places becomes more important as the world around us becomes less stable. Parents look for places to entertain their youngsters that involve fun, active, social environments. It is particularly interesting that [COMPANY] Would also cater to the adult social segment with the offering of adult seating, WIFI and small office functions to cater to those who need to work but who would like for their children to have play time as well.
4.3.1 Competition and Buying Patterns
Competition on the children's recreation and entertainment industry consist of a highly diverse group of children's activities, including television, libraries, health clubs, parks and other recreation centers, movies, the zoo, and related activities. All of these activities provide for enjoyment by both the parents and the children.
However, an indoor playground offers a safe, clean indoor environment for physical activity that is specifically designed for children. It provides children with the security and the skill development opportunities that parent’s desire.
7
[COMPANY] 2010
Currently, there are no other indoor children playgrounds in the Central Southern [STATE] area. [COMPANY] will be able to immediately fill this void in the market by providing extensive recreation, entertainment, and restaurant facilities for children to play in and explore. Within one year, [COMPANY] will be known as the primary recreation facility for children aged 14 and younger, and the destination of choice for children to enjoy themselves and host birthday parties with friends
5.0 Web Plan Summary
Currently, [COMPANY] L.L.C. ([COMPANY]) has a web page up. The web page gives customers contact information and programs that will be provided.
[COMPANY]'s website is currently under construction. The Company will have an attractive, simple and informative internet focused website. The website will give customers contact information, programs provided, specials and discounts. Additionally, [COMPANY]'s website will be interactive giving parents the ability to book parties and events online. The website will be another method to generate steady business for our business.
5.1 Website Marketing Strategy
Our website will be promoted on all of our marketing materials and during our advertising campaigns. We will advertise our site on our business cards as well as in other industry related publications.
As numerous studies have documented, most people buy or use services based on the conversation and recommendations of trusted friends, family and colleagues. Finding the people that influence their peers' decisions where to shop and what to buy and services to use has long been viewed as the Holy Grail of marketing. Increasingly, online social networks are being seen as venues for locating these influencers. The Company plans to tie-into social media sites to expand our presence on the web to our targeted customers.
5.2 Development Requirements
The Company will increase its presence on the web by promoting the site during the Advertising Campaigns and giving parents the ability to book parties and events online. The Company plans to tie-into social media sites to expand our presence on the web to our targeted customer base.
6.0 Strategy and Implementation Summary
[COMPANY] has clearly defined the target market and has differentiated itself by offering a solid solution to fulfilling its customers' needs. Reasonable sales targets have been established with an implementation plan designed to ensure the goals set forth below are achieved.
6.1 SWOT Analysis
The SWOT analysis aids in displaying the internal strengths and weaknesses that [COMPANY] ([COMPANY]) must address. It allows us to examine the opportunities presented to the Company as well as potential threats. The company's strengths will help it to succeed. These strengths are: the facility and its location, a single admission fee, healthy food choices at reasonable cost, evening events for children and their parents, and engaging children in high quality physical and social activities. Strengths are valuable, but it is also important to realize the weaknesses the Company must address. [COMPANY]'s main weakness is lacking the funds to launch and grow the business.
8
[COMPANY] 2010
The Companies strengths will help it capitalize on emerging opportunities. These opportunities include, but are not limited to, increase services to current customers, expand the facilities from 9000 sq ft to 15,000 sq ft using the current land available, enter strategic alliances offering sources for referrals and joint marketing activities and expanding product selections and categories sold at our retail store and concession area.
Threats that the company should be aware of include, a lack of funding to open the facility and launch our programs. Additionally, the owner and managers need to keep up with current market trends in Children's Entertainment Services.
6.1.1 Strengths
The strengths of [COMPANY] is evident; there is no other facility in southern [STATE] that will have the multi-physical attributes that [COMPANY] will have. There are arcades, there are bounce places, but there is not a place, currently that will have a circuit of physical activities that will allow our children to play independently with other children for hours for one admission fee.
A single admission fee will allow all admittance to play for as long as they choose. Unlike the other entertainment centers in the area that require several dollars to stay entertained, [COMPANY] will provide hours of physical engaging fun for children and adults if they so choose to engage themselves.
[COMPANY] will provide healthy food choices for reasonable costs. You will not find candy or sugar filled snack choices at [COMPANY]! With all the unhealthy choices available to our children and adults at the entertainment places we all frequent, [COMPANY]! will only choose healthy food offerings for our clients. Parents appreciate this, as many are more health conscious today as in prior years.
[COMPANY]! will be the only place we know if that will host evening events for children. There is not a place for the under 14 group during evening hours. While the older kids can go out to the mall, the movies or school dances, the under 14 target market is left with no place to go and nothing to do. Our hope is to "rescue" this age group and engage them in some organized, chaperoned, fun and activity. [COMPANY]! will be a place that adults can hang out with their friends while their kids have fun with theirs.
[COMPANY]! will not have much of an arcade component as our goal is to reel children away from video games, televisions and from other stationary settings; engaging them into some high quality, physical activity that will cater to social and cognitive development while independently playing.
6.1.2 Weaknesses
[COMPANY] ([COMPANY]) weaknesses come from the lack of funding to launch and grow the business. Grant funds will be used to; Build-out Leasehold Improvements, Purchase Amusement Area Equipment, Purchase Non-Amusement Area Equipment, Purchase Furniture & Fixtures, Purchase Concession and Retail Equipment and Displays, Purchase opening Inventory for Concession and Retail, Install Interior and Exterior Signage and Hire Employees.
Additionally, Grant Funds will be used to launch our advertising campaign for our grand opening and introducing our facility and services to the residents of [COUNTY].
9
[COMPANY] 2010
6.1.3 Opportunities
[COMPANY] ([COMPANY]) has the following Opportunities for future growth: 1. Increase services to current customers - The Company would like to institute a daily summer
camp program for children in the [COUNTY] area.
2. Currently plans call for a 9000 sq ft facility. The Company will look to expand the facilities to 15,000 sq ft using the current land available.
3. Strategic alliances offering sources for referrals and joint marketing activities.
4. Expanding product selections and categories sold at our retail store and concession area.
6.1.4 Threats
The only threat [COMPANY] has is a lack of funding to open the facility and launch our programs. Additionally, the owner and managers need to keep up with current market trends in Children's Entertainment Services.
6.2 Competitive Edge
Competition on the children's recreation and entertainment industry consist of a highly diverse group of children's activities, including television, libraries, YMCS's health clubs, parks and other recreation centers, movies, the zoo, and related activities. Our research has shown that even though the current economy would lead you to believe that these children specific places would suffer; in fact is not true. The children entertainment industry is thriving! [COMPANY] ([COMPANY]) has the following competition within the [COUNTY] Area: [LIST OF COMPETITORS]. All of these places concentrate on a few activities. Although there is competition in the area, [COMPANY] will distinguish itself by its facility and services offered. Currently, there are no other indoor children playgrounds in the Central Southern [STATE] area. [COMPANY] will be able to immediately fill this void in the market by providing extensive recreation, entertainment, and restaurant facilities for children to play in and explore. Within one year, [COMPANY] will be known as the primary recreation facility for children aged 1 to 14, and the destination of choice for children to enjoy themselves and host birthday parties with friends. [COMPANY]’s safe, secure and clean environment will assure parents while providing opportunities for their children to have fun in a stimulating environment. The Company will build a loyal base of customers to draw business from as word of mouth is an important factor in the Children's recreation business. The Company plans to tie-into social media sites to expand our presence on the web to our targeted customer base.
6.3 Marketing Strategy
[COMPANY] ([COMPANY]) marketing strategy will be to introduce facility and children's programs throughout the [COUNTY] area. We will launch an aggressive advertising campaign utilizing a combination of print, television and radio ads.
6.4 Sales Strategy
The Company's Sales Strategy will be a combination of group sales, print, television and radio. Initially, it will be important to be sure enough families and children come through the facility in
10
[COMPANY] 2010
hopes to spread the word about how great [COMPANY] is to their friends. This group sales effort will be something that will be constant as our goal will be to always have activity happening inside our facility. To do this we will promote [COMPANY]! to schools for field trips, team activities, civic activities and retreats, etc. It will be a function to engage these groups to always keep [COMPANY]! in front of our target audience. Print advertising will always be part of our budget but initially we will work to print up an editorial about the coming of [COMPANY]! and to announce the opening of the facility. We will only entertain television advertising the week prior to the grand opening in conjunction with print and radio.
During our introductory phase, the first 4-6 weeks of business, [COMPANY]! will call all groups and clubs (civic, daycares, scouting, sports teams, camps, etc.) to invite them into the facility for discounted pricing. As each patron leaves the facility, we will offer a discount card for them to use if they return with a friend. The goal would be to fill the place for all hours of the day by staggering invitations and arrival times.
During the month of opening, [COMPANY]! will put an ad in the local newspapers for 1 week advertising the opening of the facility while looking for 200 children to enter the facility FREE of charge to appear in a commercial. [COMPANY]! will work with a local film crew to put together a short commercial to air on TV during the week of the Grand Opening. The air time and the making of this commercial will cost under $2000 if we utilize the film crew available to our partners and we air at random time slots on channel 9. The local advertisement would cost $1000 - $1500 and would be placed in 2 major Newspapers.
In addition, during the same time, [COMPANY]! will work with FREE tabloids such as Parenting [STATE], school newsletters and church bulletins for stories and editorials about the newest "Hot Spot" for children and parents. Advertising with Parenting [STATE] for one year would range in price from $5,000 - $6,500 annually, depending on the monthly choice of advertisement.
Brochures will be distributed to all of the daycare centers, pre-schools and kindergartens. Elementary schools will also be a target but require special permission. We may have to capture this group through other creative methods. (This cost would be part of the budget for printed material shown on the start up costs).
Color leaflets will be printed to put into the local town papers as The [NAME], [NAME], etc. This color leaflet would be part of the town papers for the one to two months prior to the opening of [COMPANY]! announcing the opening of, location, web site and a birthday party booking promotion.
We will team up with local businesses for advertising; we will ask that they place our brochures in their place of business or in merchandise bags as their customers leave their shops with purchases. We will also put together some kind of promotion for them at our end that will add to their exposure. This is projected to be of minimal cost and more of a barter or trade in advertising.
Moms groups will be formed to bring in younger children during the week. This group will be dominant with stay at home mom's that are looking for an alternative to the instructional, participatory classes. A Mom's group at [COMPANY]! will also offer the opportunity to socialize with other mothers in a relaxed, nurturing environment. These groups would be advertised within; thru membership propaganda and monthly add material. These groups would have a fee each 6 weeks, however, the fee would include unlimited coffee or tea, bagels and / muffins and admission.
As our membership grows, we will make use of a new method of advertising. Jitter Gram, provides cell phone promotional coupons. [COMPANY]! will utilize their service to offer discounts for events,
11
[COMPANY] 2010
concessions or admissions. Monthly subscription starts at $75.00 and allows for up to 500 text coupon messages. This will be a base level until memberships reach over 100 people; allowing for 1 text per week.
[COMPANY]! will also have an electronic newsletter that we will offer our customers to receive. They will have to provide us with their e-mail addresses (also captures through membership). In conjunction, we will capture mailing addresses upon entrance once their liability waiver is authorized. Our choice of newsletter will be Constant Contact, which has a monthly membership fee of $15.00 for up to 500 contacts and $30.00 for up to 2,500 contacts, etc. This newsletter will be simple but will reflect the weekend events and all things happening and changing in and around [COMPANY]
[COMPANY]! will become a member of the local Chamber of Commerce. We will host an after- hours every so often to help heighten our exposure to those professionals who may have young children and are looking for a physically active environment for them. We would have this event lightly catered. This would be very nominal in cost.
All vehicles associated with [COMPANY]! will either be lettered appropriately with logo and contact information or wrapped. Signage, road side will be sizable based upon the allowances of the town. It will be bright, eye catching and informative. As the building is along the highway, we will look to add signage on the building highway side that will be bright and expressive.
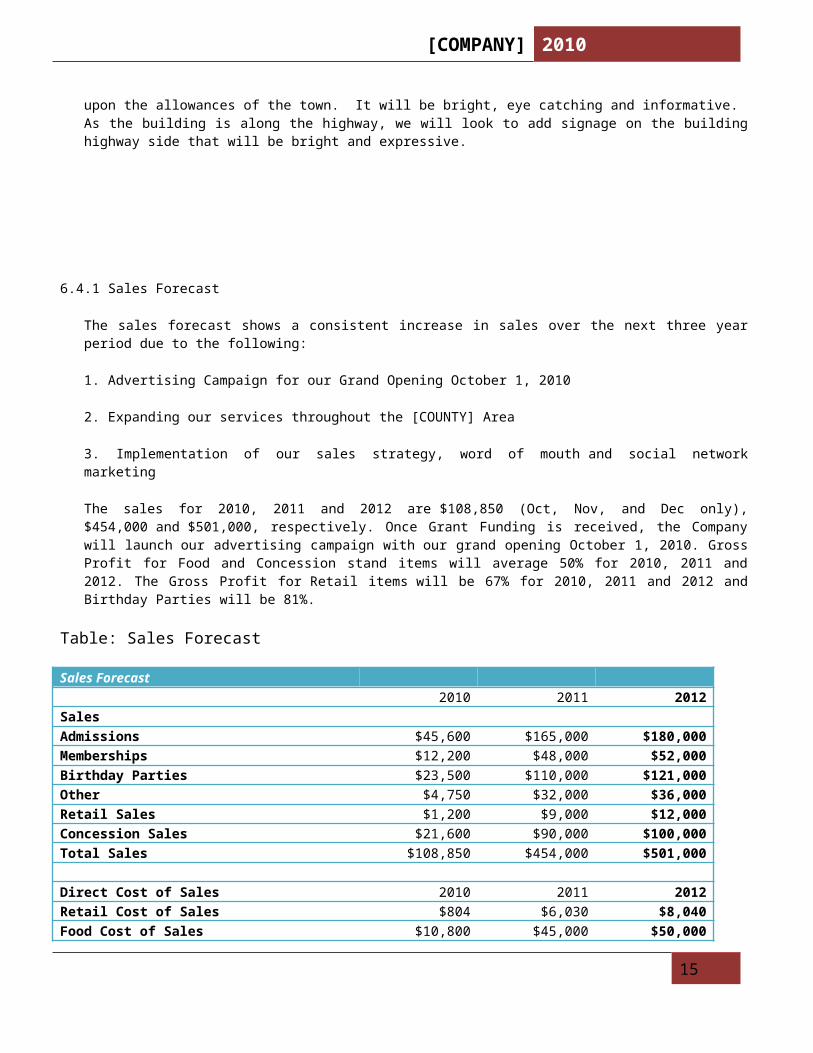
6.4.1 Sales Forecast
The sales forecast shows a consistent increase in sales over the next three year period due to the following:
1. Advertising Campaign for our Grand Opening October 1, 2010
2. Expanding our services throughout the [COUNTY] Area
3. Implementation of our sales strategy, word of mouth and social network marketing
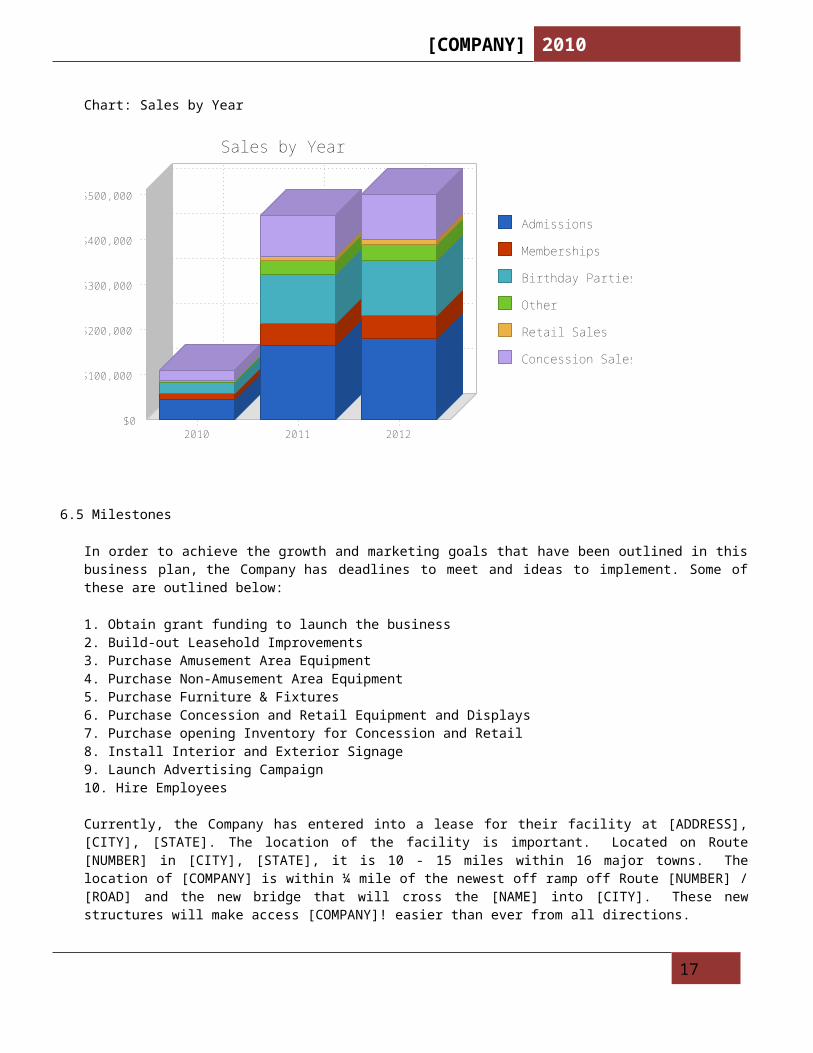
The sales for 2010, 2011 and 2012 are $108,850 (Oct, Nov, and Dec only), $454,000 and $501,000, respectively. Once Grant Funding is received, the Company will launch our advertising campaign with our grand opening October 1, 2010. Gross Profit for Food and Concession stand items will average 50% for 2010, 2011 and 2012. The Gross Profit for Retail items will be 67% for 2010, 2011 and 2012 and Birthday Parties will be 81%.
Table: Sales Forecast
Sales Forecast2010 2011 2012
SalesAdmissions $45,600 $165,000 $180,000 Memberships $12,200 $48,000 $52,000
12
[COMPANY] 2010
Birthday Parties $23,500 $110,000 $121,000 Other $4,750 $32,000 $36,000 Retail Sales $1,200 $9,000 $12,000 Concession Sales $21,600 $90,000 $100,000 Total Sales $108,850 $454,000 $501,000
Direct Cost of Sales 2010 2011 2012Retail Cost of Sales $804 $6,030 $8,040 Food Cost of Sales $10,800 $45,000 $50,000 Birthday Party Supplies $2,318 $9,120 $9,880 Subtotal Direct Cost of Sales $13,922 $60,150 $67,920
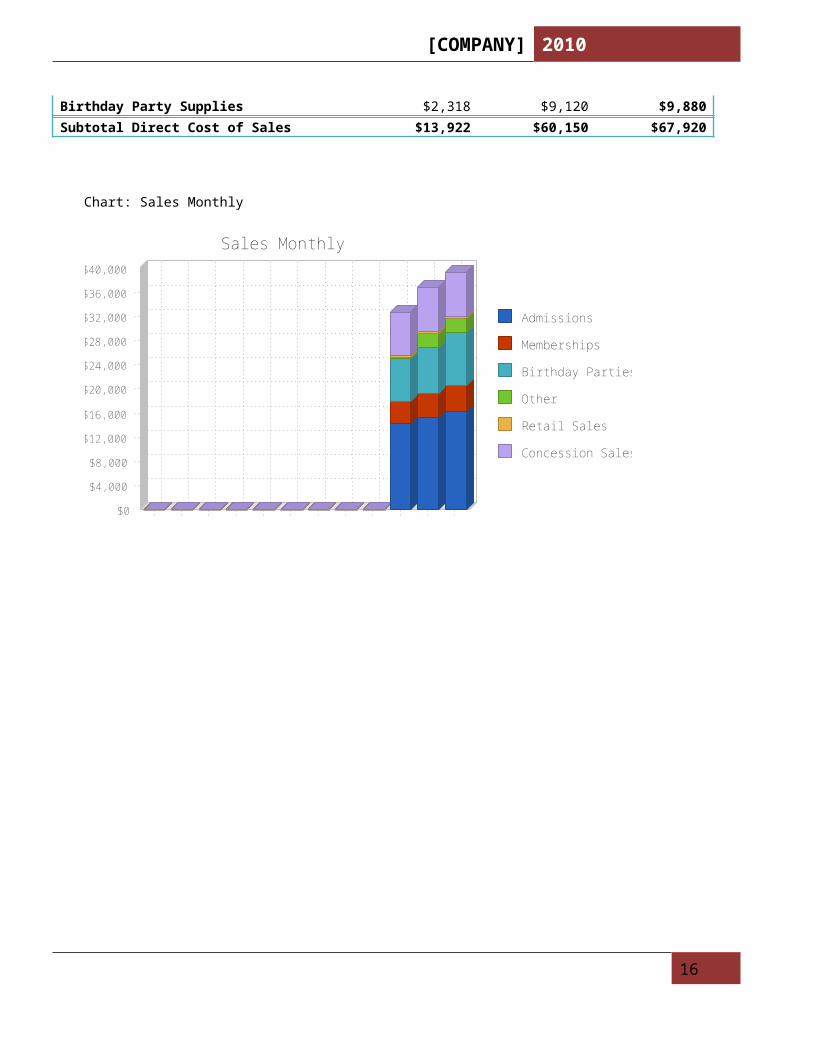
Chart: Sales Monthly
Admissions
Memberships
Birthday Parties
Other
Retail Sales
Concession Sales
$0
$4,000
$8,000
$12,000
$16,000
$20,000
$24,000
$28,000
$32,000
$36,000
$40,000
Jan
Feb
Mar
Apr
May
Jun
Jul
Aug
Sep
Oct
Nov
Dec
Sales Monthly
13
[COMPANY] 2010
Chart: Sales by Year
Admissions
Memberships
Birthday Parties
Other
Retail Sales
Concession Sales
$0
$100,000
$200,000
$300,000
$400,000
$500,000
2010 2011 2012
Sales by Year
6.5 Milestones
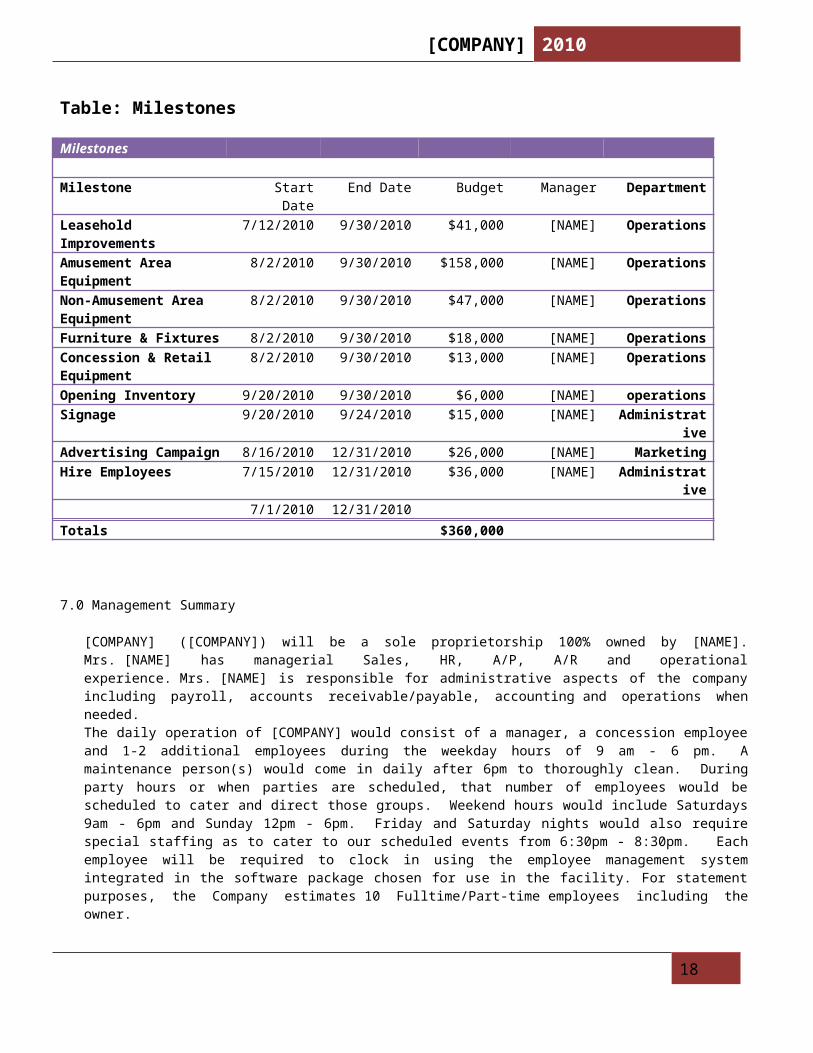
In order to achieve the growth and marketing goals that have been outlined in this business plan, the Company has deadlines to meet and ideas to implement. Some of these are outlined below:
1. Obtain grant funding to launch the business2. Build-out Leasehold Improvements3. Purchase Amusement Area Equipment4. Purchase Non-Amusement Area Equipment5. Purchase Furniture & Fixtures6. Purchase Concession and Retail Equipment and Displays7. Purchase opening Inventory for Concession and Retail8. Install Interior and Exterior Signage9. Launch Advertising Campaign10. Hire Employees
Currently, the Company has entered into a lease for their facility at [ADDRESS], [CITY], [STATE]. The location of the facility is important. Located on Route [NUMBER] in [CITY], [STATE], it is 10 - 15 miles within 16 major towns. The location of [COMPANY] is within ¼ mile of the newest off ramp off Route [NUMBER] / [ROAD] and the new bridge that will cross the [NAME] into [CITY]. These new structures will make access [COMPANY]! easier than ever from all directions.
Table: Milestones
Milestones
Milestone Start Date End Date Budget Manager Department
14
[COMPANY] 2010
Leasehold Improvements
7/12/2010 9/30/2010 $41,000 [NAME] Operations
Amusement Area Equipment
8/2/2010 9/30/2010 $158,000 [NAME] Operations
Non-Amusement Area Equipment
8/2/2010 9/30/2010 $47,000 [NAME] Operations
Furniture & Fixtures 8/2/2010 9/30/2010 $18,000 [NAME] OperationsConcession & Retail Equipment
8/2/2010 9/30/2010 $13,000 [NAME] Operations
Opening Inventory 9/20/2010 9/30/2010 $6,000 [NAME] operationsSignage 9/20/2010 9/24/2010 $15,000 [NAME] AdministrativeAdvertising Campaign 8/16/2010 12/31/2010 $26,000 [NAME] MarketingHire Employees 7/15/2010 12/31/2010 $36,000 [NAME] Administrative
7/1/2010 12/31/2010Totals $360,000
7.0 Management Summary
[COMPANY] ([COMPANY]) will be a sole proprietorship 100% owned by [NAME]. Mrs. [NAME] has managerial Sales, HR, A/P, A/R and operational experience. Mrs. [NAME] is responsible for administrative aspects of the company including payroll, accounts receivable/payable, accounting and operations when needed. The daily operation of [COMPANY] would consist of a manager, a concession employee and 1-2 additional employees during the weekday hours of 9 am - 6 pm. A maintenance person(s) would come in daily after 6pm to thoroughly clean. During party hours or when parties are scheduled, that number of employees would be scheduled to cater and direct those groups. Weekend hours would include Saturdays 9am - 6pm and Sunday 12pm - 6pm. Friday and Saturday nights would also require special staffing as to cater to our scheduled events from 6:30pm - 8:30pm. Each employee will be required to clock in using the employee management system integrated in the software package chosen for use in the facility. For statement purposes, the Company estimates 10 Fulltime/Part-time employees including the owner.
All employees will have the title of "Team Member"; as it will be important to have everyone's input for a successful business. The front desk team member will be the first line of superior customer service our customers come in contact with. It will be important that they are well trained on the admission software, the facility and party planning.
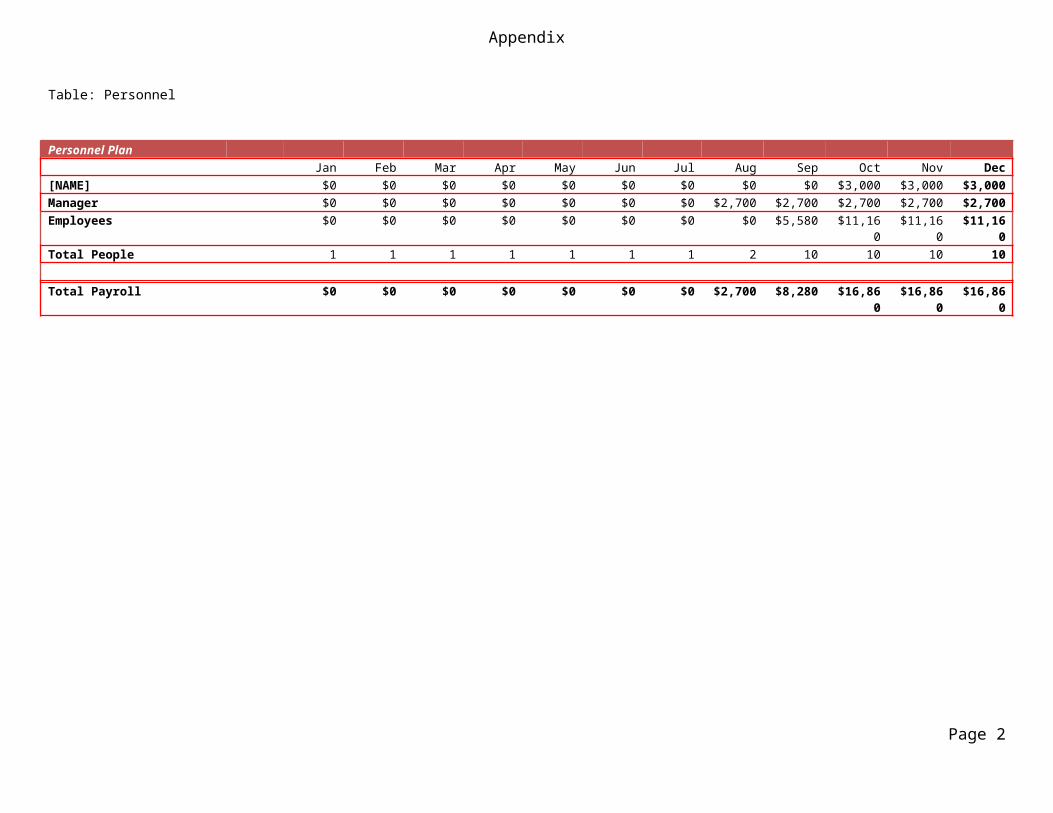
7.1 Personnel Plan
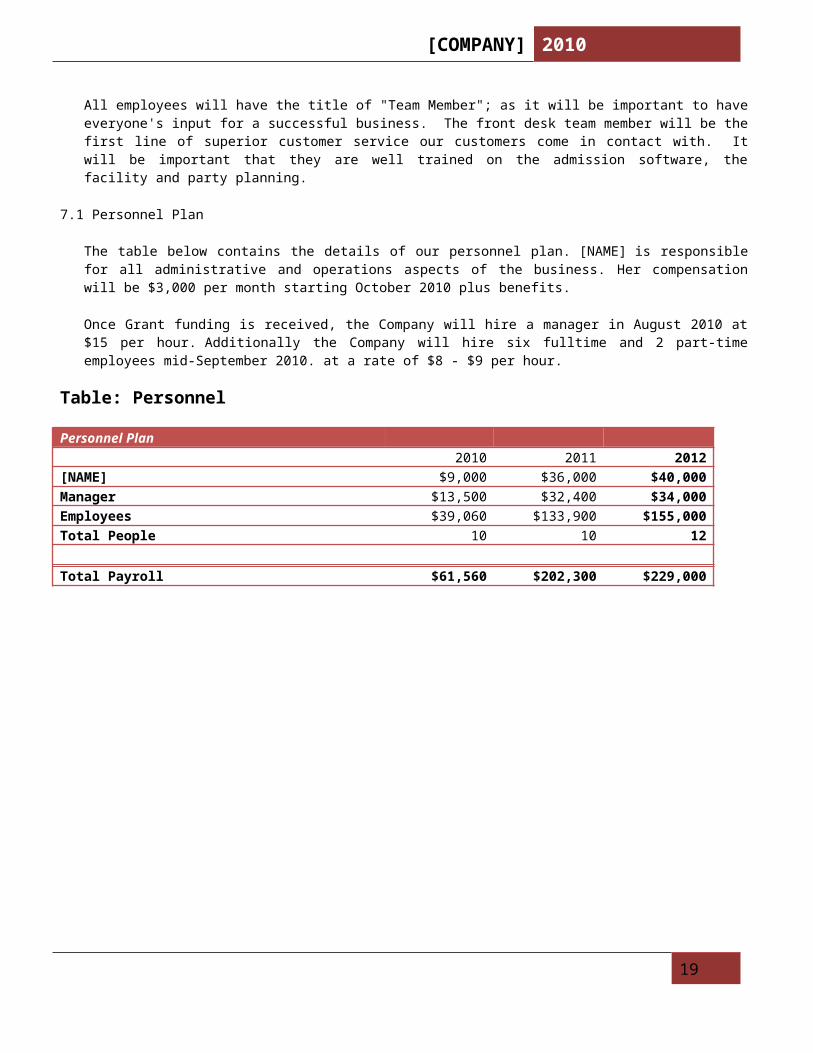
The table below contains the details of our personnel plan. [NAME] is responsible for all administrative and operations aspects of the business. Her compensation will be $3,000 per month starting October 2010 plus benefits.
Once Grant funding is received, the Company will hire a manager in August 2010 at $15 per hour. Additionally the Company will hire six fulltime and 2 part-time employees mid-September 2010. at a rate of $8 - $9 per hour.
Table: Personnel
Personnel Plan
15
[COMPANY] 2010
2010 2011 2012[NAME] $9,000 $36,000 $40,000 Manager $13,500 $32,400 $34,000 Employees $39,060 $133,900 $155,000 Total People 10 10 12
Total Payroll $61,560 $202,300 $229,000
16
[COMPANY] 2010
8.0 Financial Plan
The current financial plan for [COMPANY] is to obtain grant funding in the amount of $585,000. The grant will be used to launch operations including: Build-out Leasehold Improvements, Purchase Amusement Area Equipment, Purchase Non-Amusement Area Equipment, Purchase Furniture & Fixtures, Purchase Concession and Retail Equipment and Displays, Purchase opening Inventory for Concession and Retail, Install Interior and Exterior Signage and Hire Employees. Additionally, Grant Funds will be used to launch our advertising campaign for our grand opening and introducing our facility and services to the residents of [COUNTY].
The following sections of this plan will serve to describe [COMPANY] financial plan in more detail:
General Assumptions Break-even Analysis Profit and Loss Cash Flow Balance Sheet Ratios
8.1 Start-up Funding
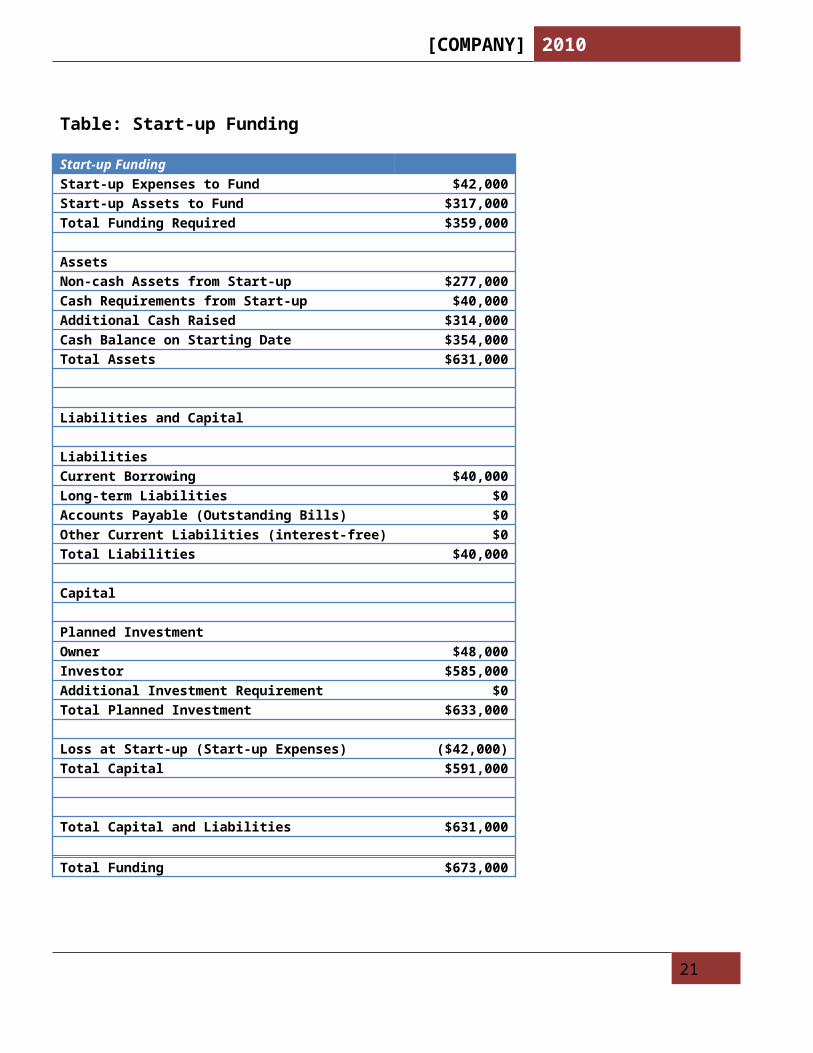
[COMPANY] start-up costs are detailed in the Start-up Table. The following table shows how these start-up costs will be funded.
17
[COMPANY] 2010
Table: Start-up Funding
Start-up FundingStart-up Expenses to Fund $42,000 Start-up Assets to Fund $317,000 Total Funding Required $359,000
Assets Non-cash Assets from Start-up $277,000 Cash Requirements from Start-up $40,000 Additional Cash Raised $314,000 Cash Balance on Starting Date $354,000 Total Assets $631,000
Liabilities and Capital
LiabilitiesCurrent Borrowing $40,000 Long-term Liabilities $0 Accounts Payable (Outstanding Bills) $0 Other Current Liabilities (interest-free) $0 Total Liabilities $40,000
Capital
Planned InvestmentOwner $48,000 Investor $585,000 Additional Investment Requirement $0 Total Planned Investment $633,000
Loss at Start-up (Start-up Expenses) ($42,000)Total Capital $591,000
Total Capital and Liabilities $631,000
Total Funding $673,000
18
[COMPANY] 2010
8.2 Important Assumptions
The table below presents the assumptions used in the financial calculations of this business plan.
[COMPANY] is a Sole Proprietorship owned by [NAME] and is taxed accordingly, estimated at a 25% tax rate. The average Gross Profit % is estimated to be 50% for Concession sales, 33% for Retail item sales and 81% for Birthday Parties in 2010, 2011 and 2012.
Depreciation expense is based on the scheduled additions in the Milestones Table. Insurance, utilities and all other expenses assume a 5% increase due to inflation & other cost variables during 2012.
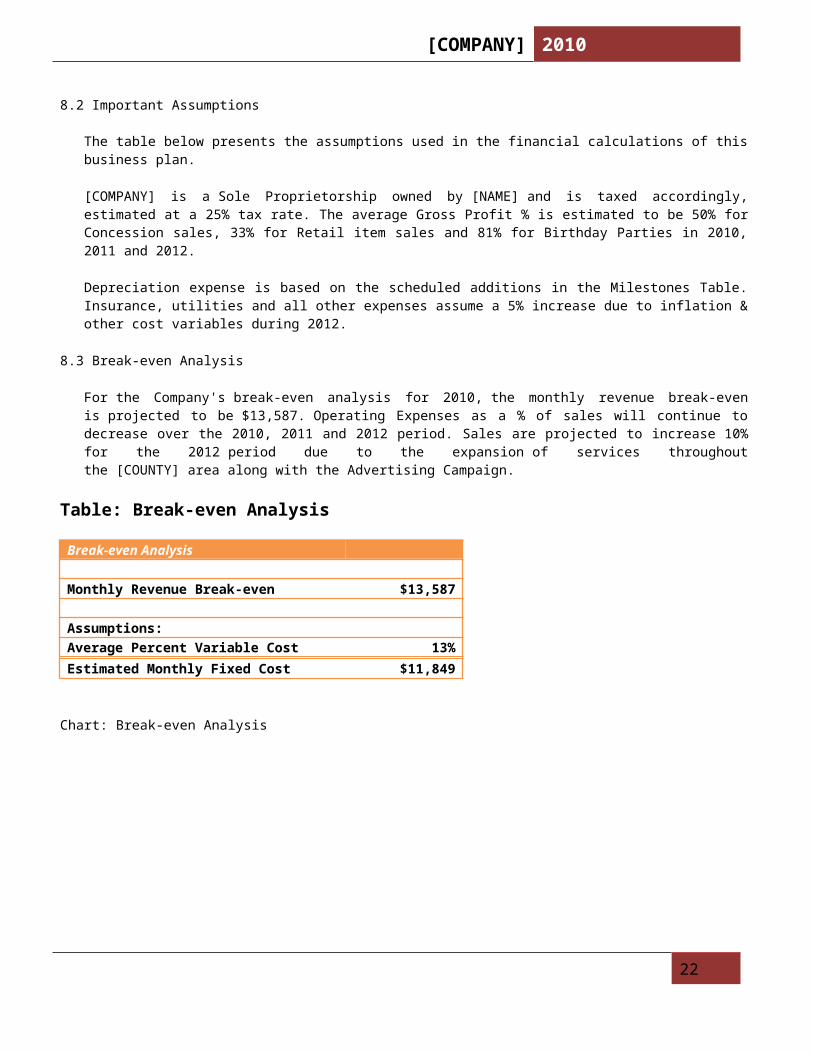
8.3 Break-even Analysis
For the Company's break-even analysis for 2010, the monthly revenue break-even is projected to be $13,587. Operating Expenses as a % of sales will continue to decrease over the 2010, 2011 and 2012 period. Sales are projected to increase 10% for the 2012 period due to the expansion of services throughout the [COUNTY] area along with the Advertising Campaign.
Table: Break-even Analysis
Break-even Analysis
Monthly Revenue Break-even $13,587
Assumptions:Average Percent Variable Cost 13% Estimated Monthly Fixed Cost $11,849
Chart: Break-even Analysis
$0
$2,000
$4,000
$6,000
$8,000
($2,000)
($4,000)
($6,000)
($8,000)
($10,000)
$0$2,000
$4,000$6,000
$8,000$10,000
$12,000$14,000
$16,000$18,000
$20,000$22,000
Break-even Analysis
19
[COMPANY] 2010
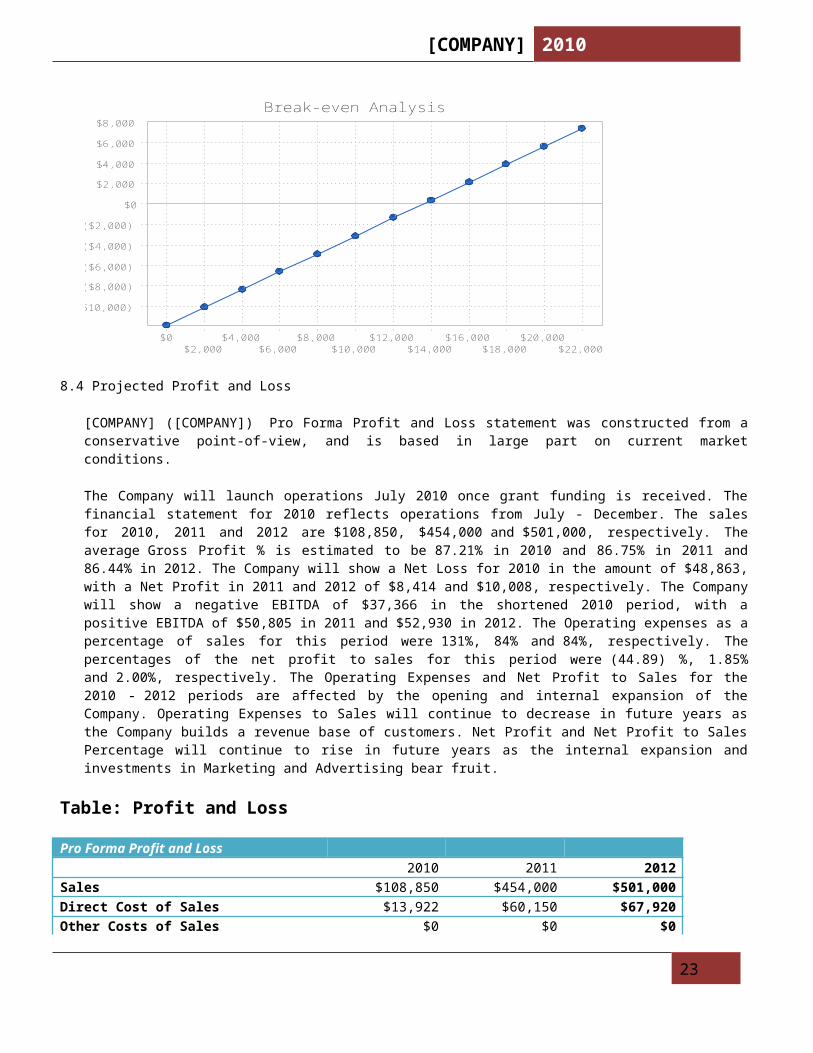
8.4 Projected Profit and Loss
[COMPANY] ([COMPANY]) Pro Forma Profit and Loss statement was constructed from a conservative point-of-view, and is based in large part on current market conditions.
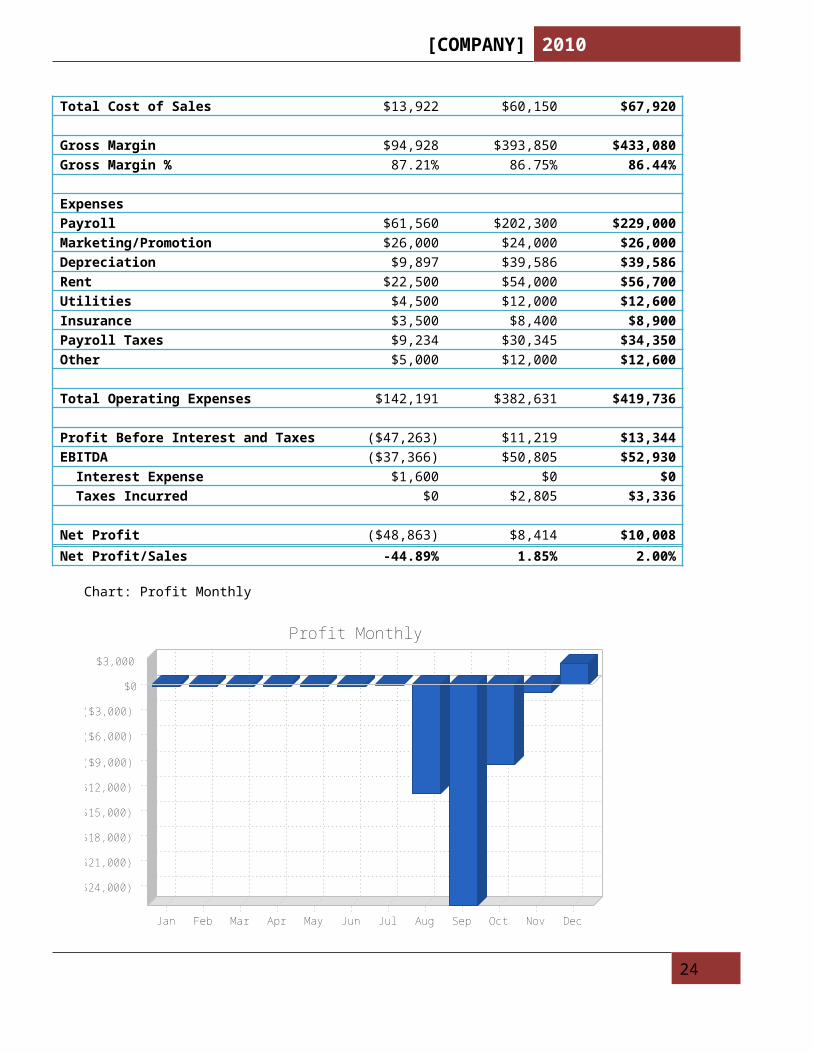
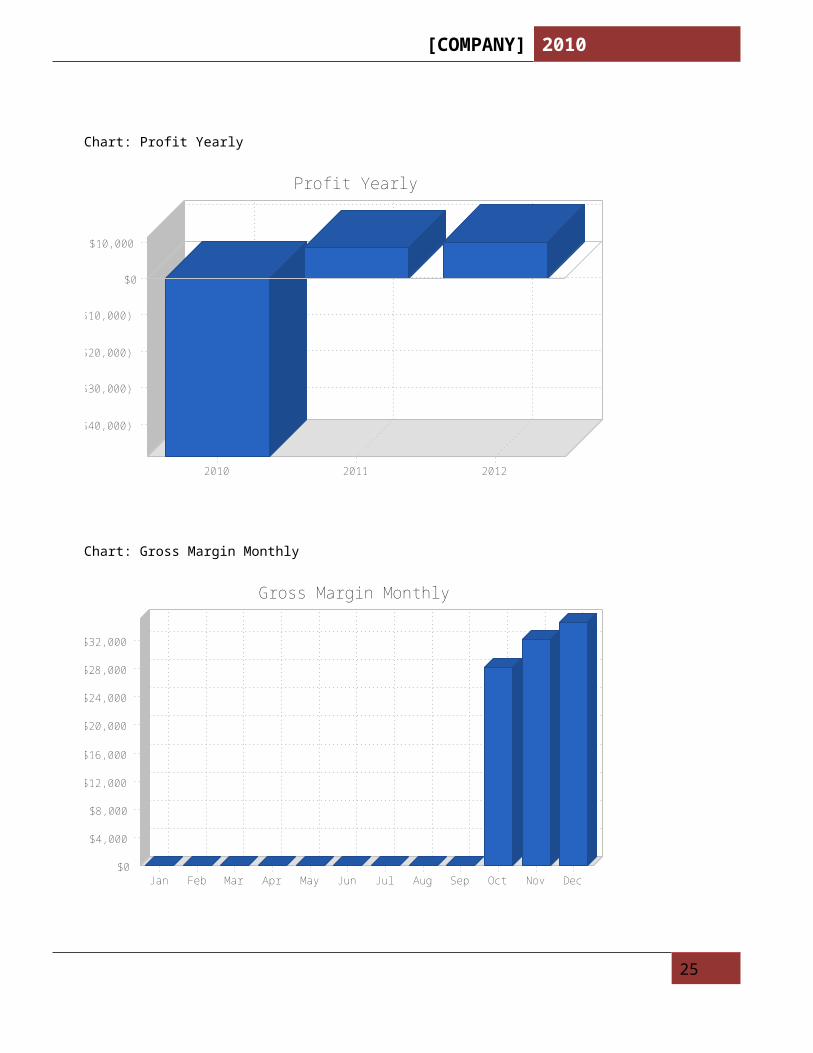
The Company will launch operations July 2010 once grant funding is received. The financial statement for 2010 reflects operations from July - December. The sales for 2010, 2011 and 2012 are $108,850, $454,000 and $501,000, respectively. The average Gross Profit % is estimated to be 87.21% in 2010 and 86.75% in 2011 and 86.44% in 2012. The Company will show a Net Loss for 2010 in the amount of $48,863, with a Net Profit in 2011 and 2012 of $8,414 and $10,008, respectively. The Company will show a negative EBITDA of $37,366 in the shortened 2010 period, with a positive EBITDA of $50,805 in 2011 and $52,930 in 2012. The Operating expenses as a percentage of sales for this period were 131%, 84% and 84%, respectively. The percentages of the net profit to sales for this period were (44.89) %, 1.85% and 2.00%, respectively. The Operating Expenses and Net Profit to Sales for the 2010 - 2012 periods are affected by the opening and internal expansion of the Company. Operating Expenses to Sales will continue to decrease in future years as the Company builds a revenue base of customers. Net Profit and Net Profit to Sales Percentage will continue to rise in future years as the internal expansion and investments in Marketing and Advertising bear fruit.
Table: Profit and Loss
Pro Forma Profit and Loss2010 2011 2012
Sales $108,850 $454,000 $501,000 Direct Cost of Sales $13,922 $60,150 $67,920 Other Costs of Sales $0 $0 $0 Total Cost of Sales $13,922 $60,150 $67,920
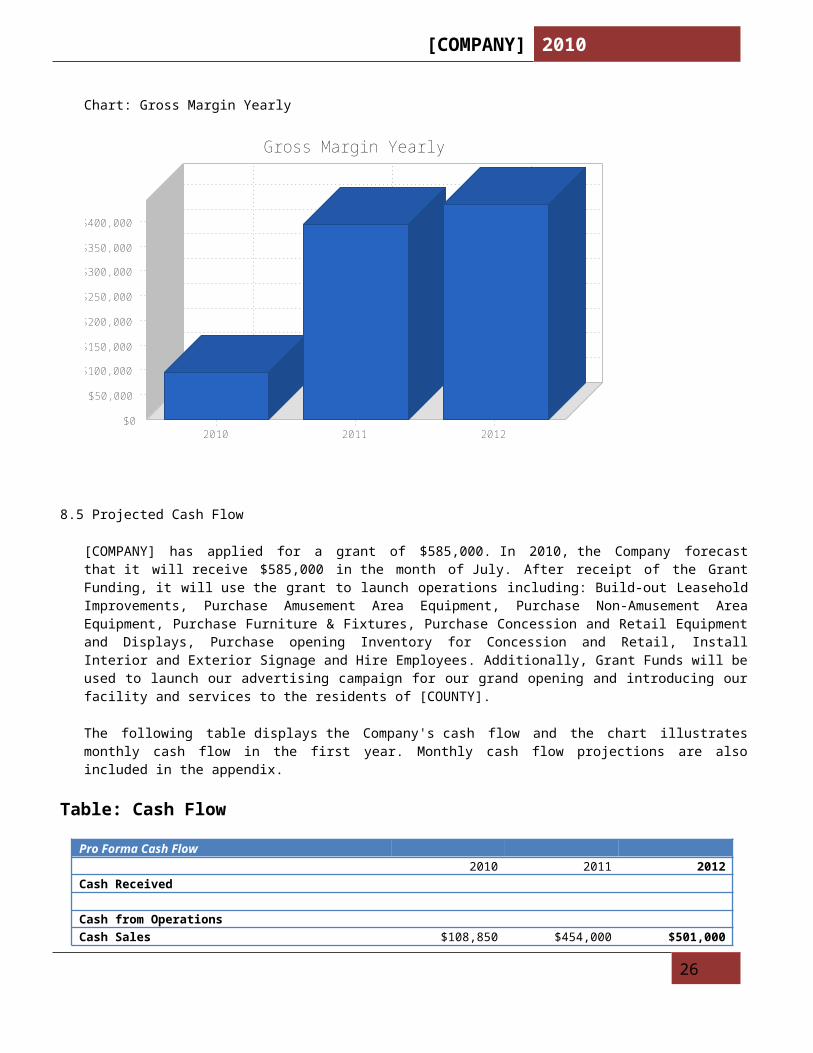
Gross Margin $94,928 $393,850 $433,080 Gross Margin % 87.21% 86.75% 86.44%
ExpensesPayroll $61,560 $202,300 $229,000 Marketing/Promotion $26,000 $24,000 $26,000 Depreciation $9,897 $39,586 $39,586 Rent $22,500 $54,000 $56,700 Utilities $4,500 $12,000 $12,600 Insurance $3,500 $8,400 $8,900 Payroll Taxes $9,234 $30,345 $34,350 Other $5,000 $12,000 $12,600
Total Operating Expenses $142,191 $382,631 $419,736
Profit Before Interest and Taxes ($47,263) $11,219 $13,344 EBITDA ($37,366) $50,805 $52,930 Interest Expense $1,600 $0 $0 Taxes Incurred $0 $2,805 $3,336
Net Profit ($48,863) $8,414 $10,008 Net Profit/Sales -44.89% 1.85% 2.00%
20
[COMPANY] 2010
Chart: Profit Monthly
$0
$3,000
($3,000)
($6,000)
($9,000)
($12,000)
($15,000)
($18,000)
($21,000)
($24,000)
Jan Feb Mar Apr May Jun Jul Aug Sep Oct Nov Dec
Profit Monthly
Chart: Profit Yearly
$0
$10,000
($10,000)
($20,000)
($30,000)
($40,000)
2010 2011 2012
Profit Yearly
21
[COMPANY] 2010
Chart: Gross Margin Monthly
$0
$4,000
$8,000
$12,000
$16,000
$20,000
$24,000
$28,000
$32,000
Jan Feb Mar Apr May Jun Jul Aug Sep Oct Nov Dec
Gross Margin Monthly
Chart: Gross Margin Yearly
$0
$50,000
$100,000
$150,000
$200,000
$250,000
$300,000
$350,000
$400,000
2010 2011 2012
Gross Margin Yearly
22
[COMPANY] 2010
8.5 Projected Cash Flow
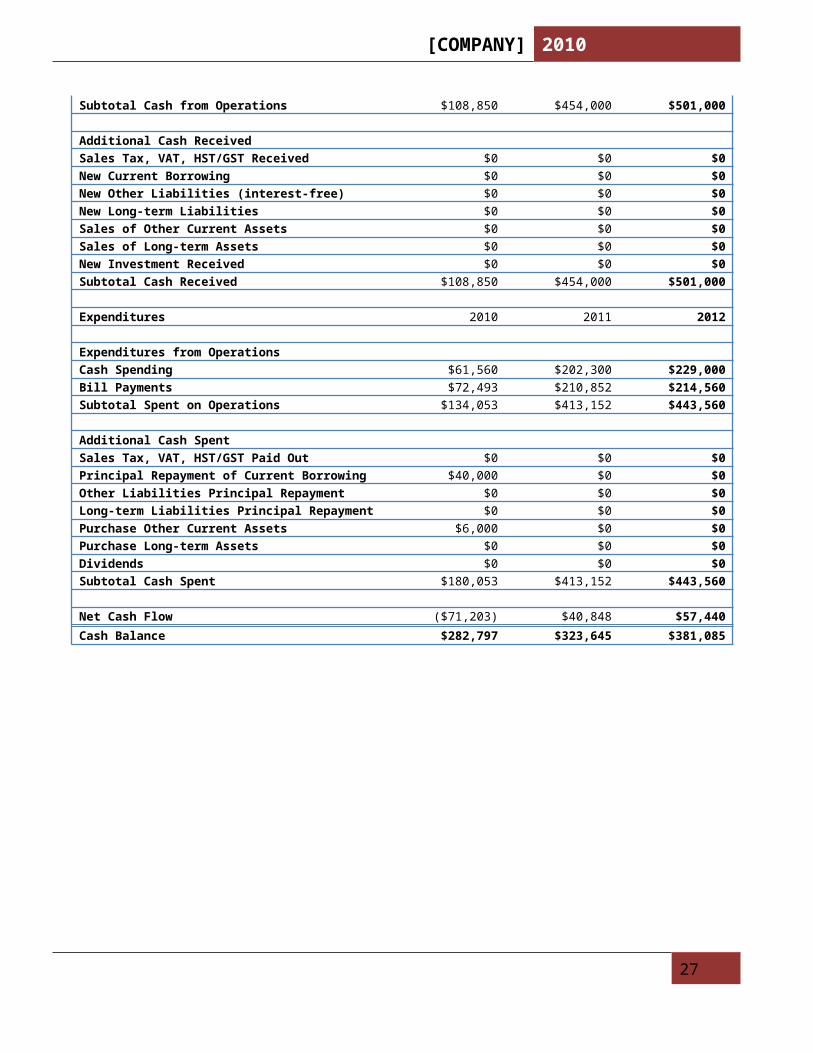
[COMPANY] has applied for a grant of $585,000. In 2010, the Company forecast that it will receive $585,000 in the month of July. After receipt of the Grant Funding, it will use the grant to launch operations including: Build-out Leasehold Improvements, Purchase Amusement Area Equipment, Purchase Non-Amusement Area Equipment, Purchase Furniture & Fixtures, Purchase Concession and Retail Equipment and Displays, Purchase opening Inventory for Concession and Retail, Install Interior and Exterior Signage and Hire Employees. Additionally, Grant Funds will be used to launch our advertising campaign for our grand opening and introducing our facility and services to the residents of [COUNTY].
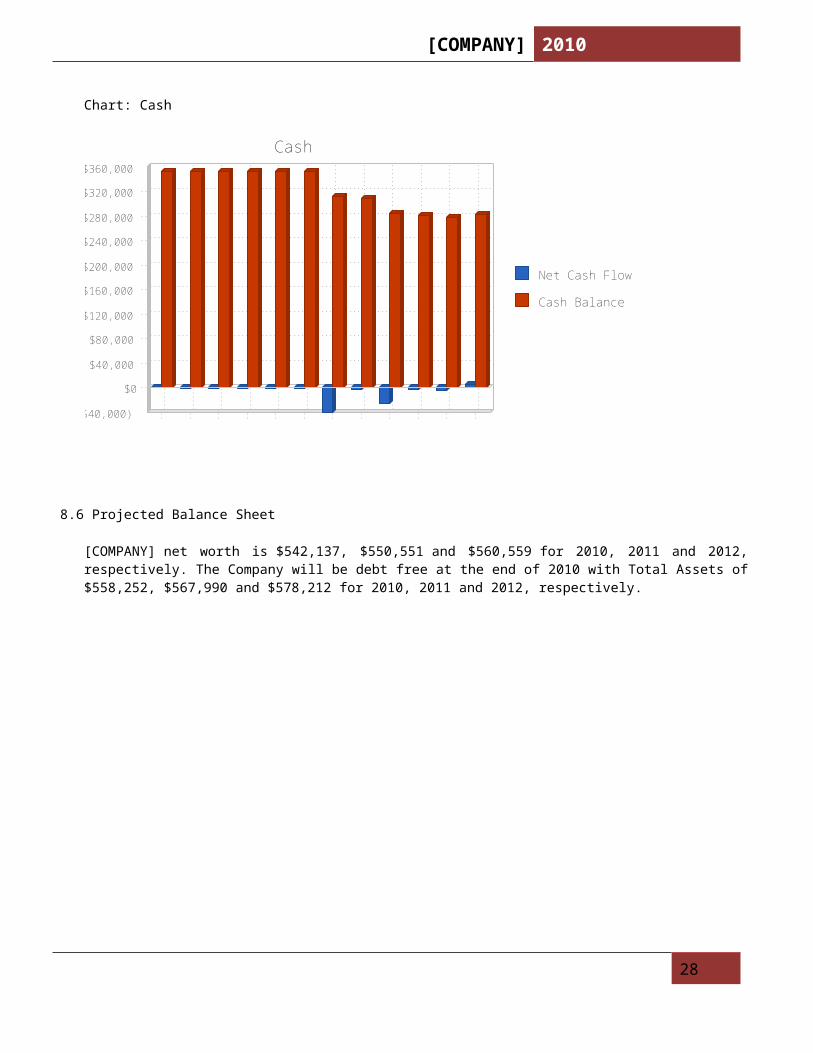
The following table displays the Company's cash flow and the chart illustrates monthly cash flow in the first year. Monthly cash flow projections are also included in the appendix.
Table: Cash Flow
Pro Forma Cash Flow2010 2011 2012
Cash Received
Cash from OperationsCash Sales $108,850 $454,000 $501,000 Subtotal Cash from Operations $108,850 $454,000 $501,000
Additional Cash ReceivedSales Tax, VAT, HST/GST Received $0 $0 $0 New Current Borrowing $0 $0 $0 New Other Liabilities (interest-free) $0 $0 $0 New Long-term Liabilities $0 $0 $0 Sales of Other Current Assets $0 $0 $0 Sales of Long-term Assets $0 $0 $0 New Investment Received $0 $0 $0 Subtotal Cash Received $108,850 $454,000 $501,000
Expenditures 2010 2011 2012
Expenditures from OperationsCash Spending $61,560 $202,300 $229,000 Bill Payments $72,493 $210,852 $214,560 Subtotal Spent on Operations $134,053 $413,152 $443,560
Additional Cash SpentSales Tax, VAT, HST/GST Paid Out $0 $0 $0 Principal Repayment of Current Borrowing $40,000 $0 $0 Other Liabilities Principal Repayment $0 $0 $0 Long-term Liabilities Principal Repayment $0 $0 $0 Purchase Other Current Assets $6,000 $0 $0 Purchase Long-term Assets $0 $0 $0 Dividends $0 $0 $0 Subtotal Cash Spent $180,053 $413,152 $443,560
Net Cash Flow ($71,203) $40,848 $57,440 Cash Balance $282,797 $323,645 $381,085
23
[COMPANY] 2010
Chart: Cash
Net Cash Flow
Cash Balance
$0
$40,000
$80,000
$120,000
$160,000
$200,000
$240,000
$280,000
$320,000
$360,000
($40,000)
Jan
Feb
Mar
Apr
May
Jun
Jul
Aug
Sep
Oct
Nov
Dec
Cash
8.6 Projected Balance Sheet
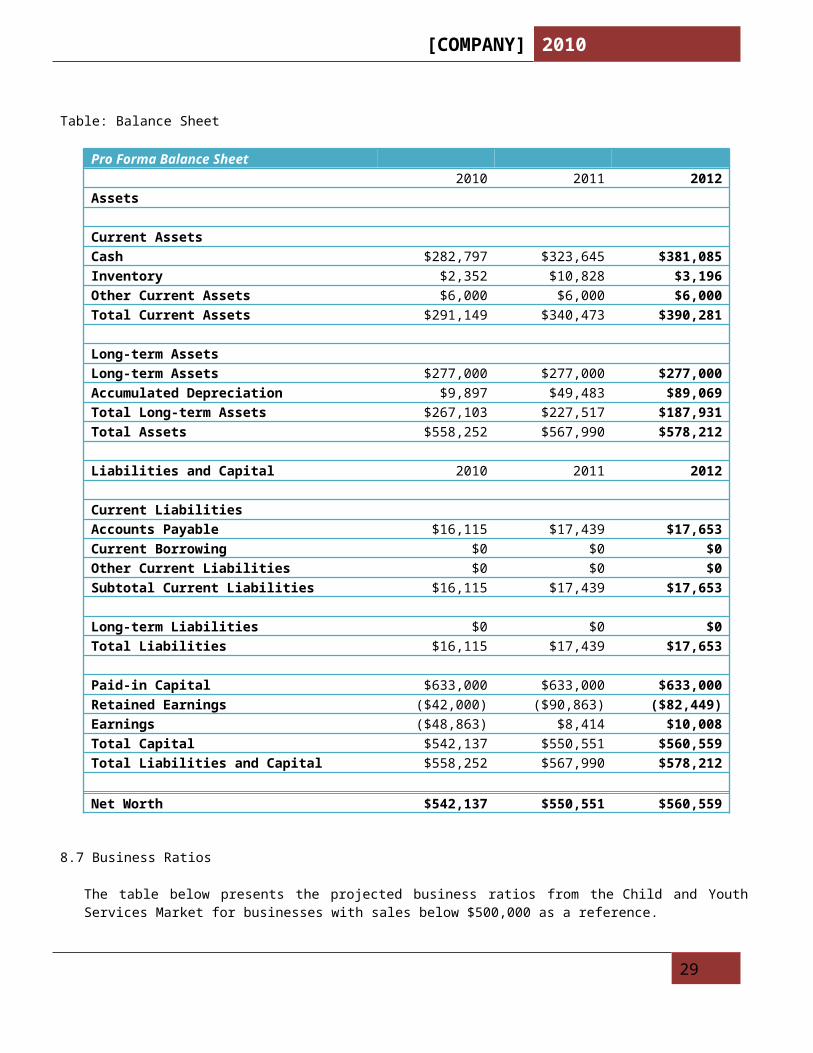
[COMPANY] net worth is $542,137, $550,551 and $560,559 for 2010, 2011 and 2012, respectively. The Company will be debt free at the end of 2010 with Total Assets of $558,252, $567,990 and $578,212 for 2010, 2011 and 2012, respectively.
24
[COMPANY] 2010
Table: Balance Sheet
Pro Forma Balance Sheet2010 2011 2012
Assets
Current AssetsCash $282,797 $323,645 $381,085 Inventory $2,352 $10,828 $3,196 Other Current Assets $6,000 $6,000 $6,000 Total Current Assets $291,149 $340,473 $390,281
Long-term AssetsLong-term Assets $277,000 $277,000 $277,000 Accumulated Depreciation $9,897 $49,483 $89,069 Total Long-term Assets $267,103 $227,517 $187,931 Total Assets $558,252 $567,990 $578,212
Liabilities and Capital 2010 2011 2012
Current LiabilitiesAccounts Payable $16,115 $17,439 $17,653 Current Borrowing $0 $0 $0 Other Current Liabilities $0 $0 $0 Subtotal Current Liabilities $16,115 $17,439 $17,653
Long-term Liabilities $0 $0 $0 Total Liabilities $16,115 $17,439 $17,653
Paid-in Capital $633,000 $633,000 $633,000 Retained Earnings ($42,000) ($90,863) ($82,449)Earnings ($48,863) $8,414 $10,008 Total Capital $542,137 $550,551 $560,559 Total Liabilities and Capital $558,252 $567,990 $578,212
Net Worth $542,137 $550,551 $560,559
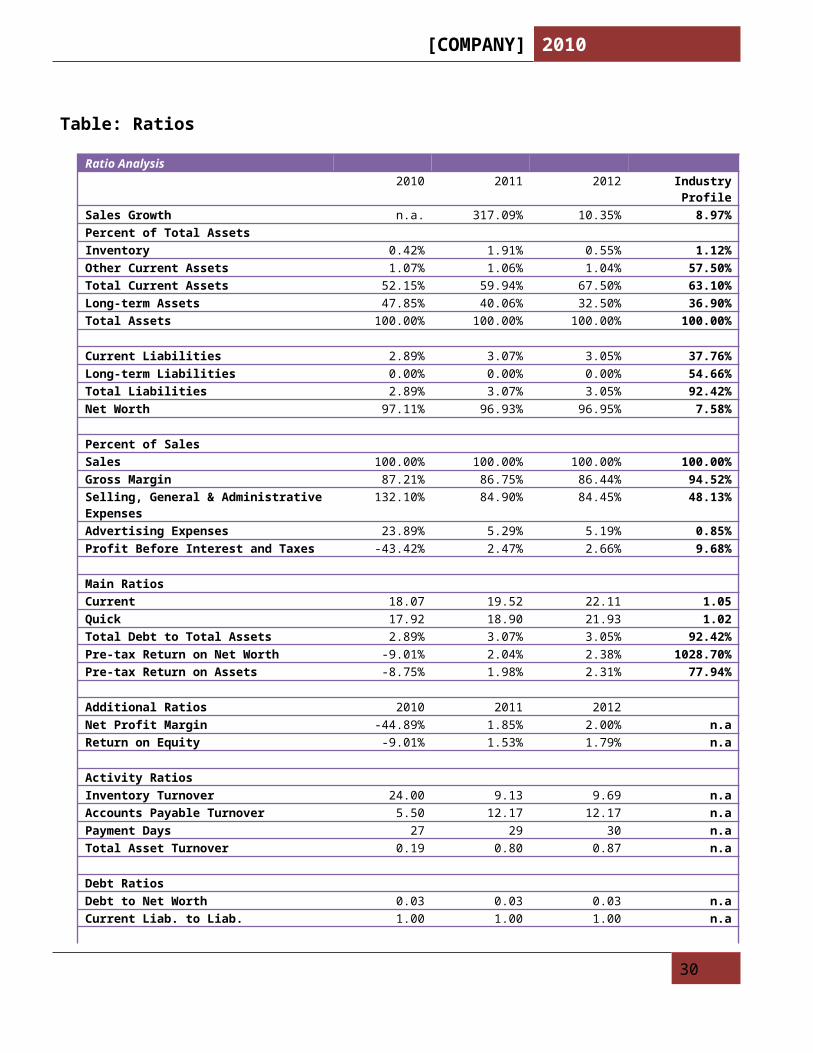
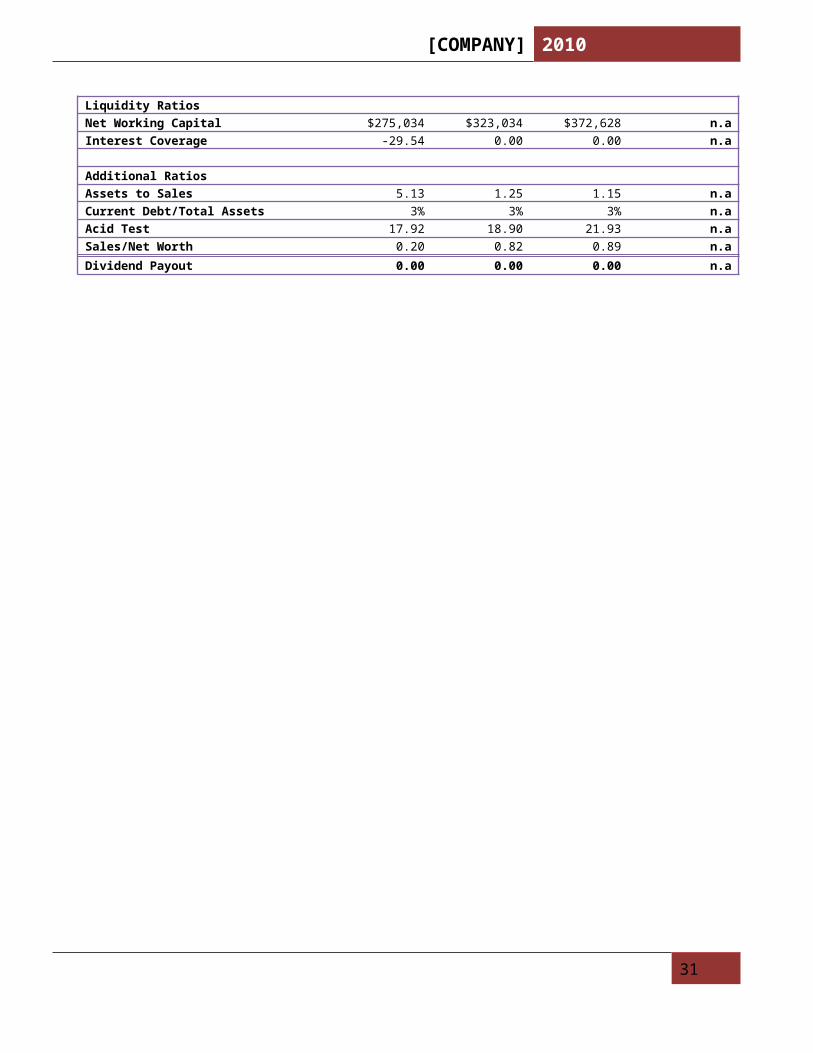
8.7 Business Ratios
The table below presents the projected business ratios from the Child and Youth Services Market for businesses with sales below $500,000 as a reference.
25
[COMPANY] 2010
Table: Ratios
Ratio Analysis2010 2011 2012 Industry Profile
Sales Growth n.a. 317.09% 10.35% 8.97% Percent of Total AssetsInventory 0.42% 1.91% 0.55% 1.12% Other Current Assets 1.07% 1.06% 1.04% 57.50% Total Current Assets 52.15% 59.94% 67.50% 63.10% Long-term Assets 47.85% 40.06% 32.50% 36.90% Total Assets 100.00% 100.00% 100.00% 100.00%
Current Liabilities 2.89% 3.07% 3.05% 37.76% Long-term Liabilities 0.00% 0.00% 0.00% 54.66% Total Liabilities 2.89% 3.07% 3.05% 92.42% Net Worth 97.11% 96.93% 96.95% 7.58%
Percent of SalesSales 100.00% 100.00% 100.00% 100.00% Gross Margin 87.21% 86.75% 86.44% 94.52% Selling, General & Administrative Expenses
132.10% 84.90% 84.45% 48.13%
Advertising Expenses 23.89% 5.29% 5.19% 0.85% Profit Before Interest and Taxes -43.42% 2.47% 2.66% 9.68%
Main RatiosCurrent 18.07 19.52 22.11 1.05 Quick 17.92 18.90 21.93 1.02 Total Debt to Total Assets 2.89% 3.07% 3.05% 92.42% Pre-tax Return on Net Worth -9.01% 2.04% 2.38% 1028.70% Pre-tax Return on Assets -8.75% 1.98% 2.31% 77.94%
Additional Ratios 2010 2011 2012Net Profit Margin -44.89% 1.85% 2.00% n.aReturn on Equity -9.01% 1.53% 1.79% n.a
Activity RatiosInventory Turnover 24.00 9.13 9.69 n.aAccounts Payable Turnover 5.50 12.17 12.17 n.aPayment Days 27 29 30 n.aTotal Asset Turnover 0.19 0.80 0.87 n.a
Debt RatiosDebt to Net Worth 0.03 0.03 0.03 n.aCurrent Liab. to Liab. 1.00 1.00 1.00 n.a
Liquidity RatiosNet Working Capital $275,034 $323,034 $372,628 n.aInterest Coverage -29.54 0.00 0.00 n.a
Additional RatiosAssets to Sales 5.13 1.25 1.15 n.aCurrent Debt/Total Assets 3% 3% 3% n.aAcid Test 17.92 18.90 21.93 n.aSales/Net Worth 0.20 0.82 0.89 n.a
26
[COMPANY] 2010
Dividend Payout 0.00 0.00 0.00 n.a
27
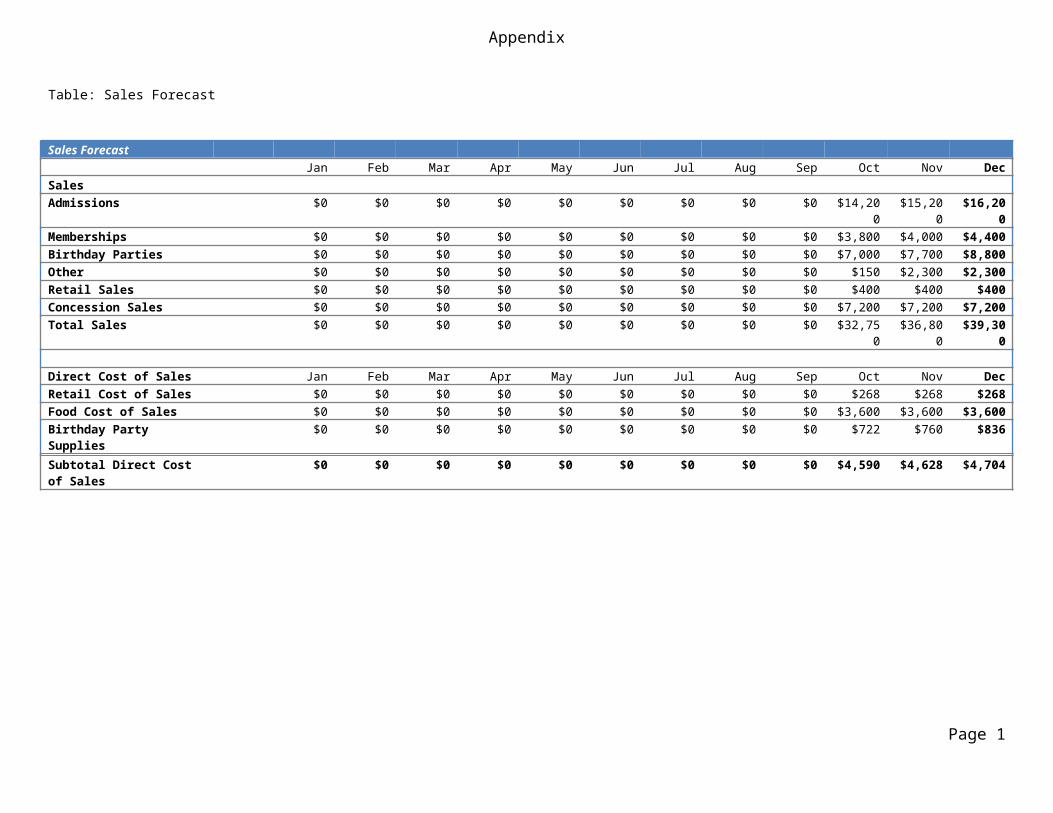
Appendix
Table: Sales Forecast
Sales ForecastJan Feb Mar Apr May Jun Jul Aug Sep Oct Nov Dec
SalesAdmissions $0 $0 $0 $0 $0 $0 $0 $0 $0 $14,200 $15,200 $16,200 Memberships $0 $0 $0 $0 $0 $0 $0 $0 $0 $3,800 $4,000 $4,400 Birthday Parties $0 $0 $0 $0 $0 $0 $0 $0 $0 $7,000 $7,700 $8,800 Other $0 $0 $0 $0 $0 $0 $0 $0 $0 $150 $2,300 $2,300 Retail Sales $0 $0 $0 $0 $0 $0 $0 $0 $0 $400 $400 $400 Concession Sales $0 $0 $0 $0 $0 $0 $0 $0 $0 $7,200 $7,200 $7,200 Total Sales $0 $0 $0 $0 $0 $0 $0 $0 $0 $32,750 $36,800 $39,300
Direct Cost of Sales Jan Feb Mar Apr May Jun Jul Aug Sep Oct Nov DecRetail Cost of Sales $0 $0 $0 $0 $0 $0 $0 $0 $0 $268 $268 $268 Food Cost of Sales $0 $0 $0 $0 $0 $0 $0 $0 $0 $3,600 $3,600 $3,600 Birthday Party Supplies $0 $0 $0 $0 $0 $0 $0 $0 $0 $722 $760 $836 Subtotal Direct Cost of Sales
$0 $0 $0 $0 $0 $0 $0 $0 $0 $4,590 $4,628 $4,704
Page 1
Appendix
Table: Personnel
Personnel PlanJan Feb Mar Apr May Jun Jul Aug Sep Oct Nov Dec
[NAME] $0 $0 $0 $0 $0 $0 $0 $0 $0 $3,000 $3,000 $3,000 Manager $0 $0 $0 $0 $0 $0 $0 $2,700 $2,700 $2,700 $2,700 $2,700 Employees $0 $0 $0 $0 $0 $0 $0 $0 $5,580 $11,160 $11,160 $11,160 Total People 1 1 1 1 1 1 1 2 10 10 10 10
Total Payroll $0 $0 $0 $0 $0 $0 $0 $2,700 $8,280 $16,860 $16,860 $16,860
Page 2
Appendix
Table: Profit and LossPro Forma Profit and Loss
Jan Feb Mar Apr May Jun Jul Aug Sep Oct Nov DecSales $0 $0 $0 $0 $0 $0 $0 $0 $0 $32,750 $36,800 $39,300 Direct Cost of Sales $0 $0 $0 $0 $0 $0 $0 $0 $0 $4,590 $4,628 $4,704 Other Costs of Sales $0 $0 $0 $0 $0 $0 $0 $0 $0 $0 $0 $0 Total Cost of Sales $0 $0 $0 $0 $0 $0 $0 $0 $0 $4,590 $4,628 $4,704
Gross Margin $0 $0 $0 $0 $0 $0 $0 $0 $0 $28,160 $32,172 $34,596 Gross Margin % 0.00% 0.00% 0.00% 0.00% 0.00% 0.00% 0.00% 0.00% 0.00% 85.98% 87.42% 88.03%
ExpensesPayroll $0 $0 $0 $0 $0 $0 $0 $2,700 $8,280 $16,860 $16,860 $16,860 Marketing/Promotion $0 $0 $0 $0 $0 $0 $0 $3,000 $10,000 $8,000 $3,000 $2,000 Depreciation $0 $0 $0 $0 $0 $0 $0 $0 $0 $3,299 $3,299 $3,299 Rent $0 $0 $0 $0 $0 $0 $0 $4,500 $4,500 $4,500 $4,500 $4,500 Utilities $0 $0 $0 $0 $0 $0 $0 $650 $650 $800 $1,200 $1,200 Insurance $0 $0 $0 $0 $0 $0 $0 $700 $700 $700 $700 $700 Payroll Taxes 15% $0 $0 $0 $0 $0 $0 $0 $405 $1,242 $2,529 $2,529 $2,529 Other $0 $0 $0 $0 $0 $0 $0 $1,000 $1,000 $1,000 $1,000 $1,000
Total Operating Expenses
$0 $0 $0 $0 $0 $0 $0 $12,955 $26,372 $37,688 $33,088 $32,088
Profit Before Interest and Taxes
$0 $0 $0 $0 $0 $0 $0 ($12,955) ($26,372) ($9,528) ($916) $2,508
EBITDA $0 $0 $0 $0 $0 $0 $0 ($12,955) ($26,372) ($6,229) $2,383 $5,807 Interest Expense $267 $267 $267 $267 $267 $267 $0 $0 $0 $0 $0 $0 Taxes Incurred $0 $0 $0 $0 $0 $0 $0 $0 $0 $0 $0 $0
Net Profit ($267) ($267) ($267) ($267) ($267) ($267) $0 ($12,955) ($26,372) ($9,528) ($916) $2,508 Net Profit/Sales 0.00% 0.00% 0.00% 0.00% 0.00% 0.00% 0.00% 0.00% 0.00% -29.09% -2.49% 6.38%
Page 3
Appendix
Table: Cash FlowPro Forma Cash Flow
Jan Feb Mar Apr May Jun Jul Aug Sep Oct Nov DecCash ReceivedCash from OperationsCash Sales $0 $0 $0 $0 $0 $0 $0 $0 $0 $32,750 $36,800 $39,300 Subtotal Cash from Operations
$0 $0 $0 $0 $0 $0 $0 $0 $0 $32,750 $36,800 $39,300
Additional Cash ReceivedSales Tax, VAT, HST/GST Received
0.00% $0 $0 $0 $0 $0 $0 $0 $0 $0 $0 $0 $0
New Current Borrowing $0 $0 $0 $0 $0 $0 $0 $0 $0 $0 $0 $0 New Other Liabilities $0 $0 $0 $0 $0 $0 $0 $0 $0 $0 $0 $0 New Long-term Liabilities $0 $0 $0 $0 $0 $0 $0 $0 $0 $0 $0 $0 Sales of Other Current Assets
$0 $0 $0 $0 $0 $0 $0 $0 $0 $0 $0 $0
Sales of Long-term Assets $0 $0 $0 $0 $0 $0 $0 $0 $0 $0 $0 $0 New Investment Received $0 $0 $0 $0 $0 $0 $0 $0 $0 $0 $0 $0 Subtotal Cash Received $0 $0 $0 $0 $0 $0 $0 $0 $0 $32,750 $36,800 $39,300
Expenditures Jan Feb Mar Apr May Jun Jul Aug Sep Oct Nov DecExpenditures from OperationsCash Spending $0 $0 $0 $0 $0 $0 $0 $2,700 $8,280 $16,860 $16,860 $16,860 Bill Payments $9 $267 $267 $267 $267 $267 $258 $342 $10,516 $18,303 $24,186 $17,546 Subtotal Spent on Operations
$9 $267 $267 $267 $267 $267 $258 $3,042 $18,796 $35,163 $41,046 $34,406
Additional Cash SpentSales Tax, VAT, HST/GST $0 $0 $0 $0 $0 $0 $0 $0 $0 $0 $0 $0 Principal Repayment of Current Borrowing
$0 $0 $0 $0 $0 $0 $40,000 $0 $0 $0 $0 $0
Other Liabilities Principal Repayment
$0 $0 $0 $0 $0 $0 $0 $0 $0 $0 $0 $0
Long-term Liabilities Principal Repayment
$0 $0 $0 $0 $0 $0 $0 $0 $0 $0 $0 $0
Purchase Other Current Assets
$0 $0 $0 $0 $0 $0 $0 $0 $6,000 $0 $0 $0
Purchase Long-term Assets $0 $0 $0 $0 $0 $0 $0 $0 $0 $0 $0 $0 Dividends $0 $0 $0 $0 $0 $0 $0 $0 $0 $0 $0 $0 Subtotal Cash Spent $9 $267 $267 $267 $267 $267 $40,258 $3,042 $24,796 $35,163 $41,046 $34,406 Net Cash Flow ($9) ($267) ($267) ($267) ($267) ($267) ($40,258) ($3,042) ($24,796) ($2,413) ($4,246) $4,894
Page 4
Appendix
Cash Balance $353,991 $353,724 $353,458 $353,191 $352,924 $352,658 $312,400 $309,358 $284,562 $282,149 $277,903 $282,797
Page 5
Appendix
Table: Balance SheetPro Forma Balance Sheet
Jan Feb Mar Apr May Jun Jul Aug Sep Oct Nov DecAssets Starting
BalancesCurrent AssetsCash $354,000 $353,991 $353,724 $353,458 $353,191 $352,924 $352,658 $312,400 $309,358 $284,562 $282,149 $277,903 $282,797 Inventory $0 $0 $0 $0 $0 $0 $0 $0 $0 $0 $2,295 $2,314 $2,352 Other Current Assets
$0 $0 $0 $0 $0 $0 $0 $0 $0 $6,000 $6,000 $6,000 $6,000
Total Current Assets
$354,000 $353,991 $353,724 $353,458 $353,191 $352,924 $352,658 $312,400 $309,358 $290,562 $290,444 $286,217 $291,149
Long-term AssetsLong-term Assets $277,000 $277,000 $277,000 $277,000 $277,000 $277,000 $277,000 $277,000 $277,000 $277,000 $277,000 $277,000 $277,000 Accumulated Depreciation
$0 $0 $0 $0 $0 $0 $0 $0 $0 $0 $3,299 $6,598 $9,897
Total Long-term Assets
$277,000 $277,000 $277,000 $277,000 $277,000 $277,000 $277,000 $277,000 $277,000 $277,000 $273,701 $270,402 $267,103
Total Assets $631,000 $630,991 $630,724 $630,458 $630,191 $629,924 $629,658 $589,400 $586,358 $567,562 $564,145 $556,619 $558,252
Liabilities and Capital
Jan Feb Mar Apr May Jun Jul Aug Sep Oct Nov Dec
Current LiabilitiesAccounts Payable
$0 $258 $258 $258 $258 $258 $258 $0 $9,913 $17,489 $23,600 $16,990 $16,115
Current Borrowing
$40,000 $40,000 $40,000 $40,000 $40,000 $40,000 $40,000 $0 $0 $0 $0 $0 $0
Subtotal Current Liabilities
$40,000 $40,258 $40,258 $40,258 $40,258 $40,258 $40,258 $0 $9,913 $17,489 $23,600 $16,990 $16,115
Long-term Liabilities
$0 $0 $0 $0 $0 $0 $0 $0 $0 $0 $0 $0 $0
Total Liabilities $40,000 $40,258 $40,258 $40,258 $40,258 $40,258 $40,258 $0 $9,913 $17,489 $23,600 $16,990 $16,115
Paid-in Capital $633,000 $633,000 $633,000 $633,000 $633,000 $633,000 $633,000 $633,000 $633,000 $633,000 $633,000 $633,000 $633,000 Retained Earnings
($42,000) ($42,000) ($42,000) ($42,000) ($42,000) ($42,000) ($42,000) ($42,000) ($42,000) ($42,000) ($42,000) ($42,000) ($42,000)
Earnings $0 ($267) ($533) ($800) ($1,067) ($1,333) ($1,600) ($1,600) ($14,555) ($40,927) ($50,455) ($51,371) ($48,863)Total Capital $591,000 $590,733 $590,467 $590,200 $589,933 $589,667 $589,400 $589,400 $576,445 $550,073 $540,545 $539,629 $542,137 Total Liabilities and Capital
$631,000 $630,991 $630,724 $630,458 $630,191 $629,924 $629,658 $589,400 $586,358 $567,562 $564,145 $556,619 $558,252
Net Worth $591,000 $590,733 $590,467 $590,200 $589,933 $589,667 $589,400 $589,400 $576,445 $550,073 $540,545 $539,629 $542,137
Page 6