business resource efficiency guide self … resource efficiency guide self-assessment review for...
TRANSCRIPT

Business Resource Efficiency Guide
Self-assessment Review forFood and Drink Manufacturers
1 IntroductionHome
2 What is wastereally costingyou?
3 Calculate thecost of waste
4 Benchmarkingand KPIs
5 Make anaction plan
6 Cost of wastecase study
7 Furtherinformation
Appendices

Our vision is a world without waste, where resources are used sustainably.
We work with businesses andindividuals to help them reap thebenefits of reducing waste, developsustainable products and useresources in an efficient way.
Find out more from the WRAPResource Efficiency Helpline on 0808 100 2040 or atwww.wrap.org.ukContents
1 Introduction 2
2 What is waste really costing you? 32.1 Understanding the waste hierarchy 32.2 Identifying your wastes 42.3 Waste mapping 42.4 The walk-around 5
3 Calculate the cost of waste 63.1 Map out the process 63.2 Create waste-tracking sheets 63.3 Collect data 73.4 Estimate missing data 8
4 Benchmarking and Key Performance Indicators 94.1 Benchmarking 94.2 Key Performance Indicators 9
5 Make an action plan 10
6 Cost of waste case study 116.1 Calculating the total cost of waste 116.2 Going into more detail 176.3 Identifying potential savings 206.4 Developing an action plan 22
7 Further information 24
Appendix A Data locator 25Appendix B Conversion factors 27Appendix C Walk-around sheets 29
1 IntroductionHome
2 What is wastereally costingyou?
3 Calculate thecost of waste
4 Benchmarkingand KPIs
5 Make anaction plan
6 Cost of wastecase study
7 Furtherinformation
Appendices

WRAP Self-assessment Review for Food and Drink Manufacturers 1
1 IntroductionHome
2 What is wastereally costingyou?
3 Calculate thecost of waste
4 Benchmarkingand KPIs
5 Make anaction plan
6 Cost of wastecase study
7 Furtherinformation
Appendices
Summary
All food and drink manufacturers producewaste, but how many know the true cost ofwaste to the company? Many companiesunderestimate how much waste is costing; itcould be as high as 4% of turnover. The truecost of waste isn’t limited to the charges fordisposal. It also includes wasted raw materials,energy and labour – which can be between 5and 20 times more than the cost of disposal.
It is estimated that the savings opportunitieswithin the UK food and drink sector are around720,000 tonnes and, assuming average savingsof £561 per tonne, the value of savings for thewhole UK food and drink manufacturing sectoris estimated at £404 million.
This guide is intended to help companies inthe food and drink sector review their wastemanagement practices. The guide describesa straightforward procedure for completing aself-assessment review of current practiceswhich should enable you to identify wherewaste is arising at each stage of a processand take steps to reduce it. Breaking thework into logical steps, the guide:
� asks what the inefficient use of resourcesis really costing;
� describes a waste ‘walk-around’, to identifyissues on the site and key areas forimprovement;
� explains how to calculate the true cost ofwaste;
� outlines the use of benchmarking and KeyPerformance Indicators;
� suggests input for an action plan;� contains a worked example of completing a
review in a fictional pie factory; and� includes guidance on the issues you need
to check when conducting a walk-aroundto identify sources of waste and key areasfor improvement.
Throughout the guide, we provide usefulpointers to solutions that will maximise thebenefits of the review.

WRAP Self-assessment Review for Food and Drink Manufacturers 2
1 IntroductionHome 2 What is waste
really costingyou?
3 Calculate thecost of waste
4 Benchmarkingand KPIs
5 Make anaction plan
6 Cost of wastecase study
7 Furtherinformation
Appendices
1 Introduction
This guide will help companies in the foodand drink sector review their wastemanagement practices in terms of:
� identifying the true cost of waste;� measuring waste;� understanding processes from a mass
balance perspective;� identifying key projects and setting up Key
Performance Indicators (KPIs);� completing an overall mass balance and
calculating the cost of waste; and� identifying key issues affecting resource
efficiency.
This process should form part of a widerproject which looks at waste across yoursupplier chain, identifying how your process,product and packaging affect waste in yourcustomers’ and final consumers’ operations.
This guide splits the work involved in a self-assessment review into five sections:
� Section 2 asks what waste is really costingyou, and explains why you should find out!It also leads you through a ‘walk-around’,which should help you identify issues onyour site and find out where you can makeimprovements.
� Section 3 shows how you can use datafrom the walk-around and other sources tocalculate the true cost of waste in yourcompany.
� Section 4 outlines benchmarking and theuse of KPIs, enabling you to find out howyour waste performance compares withthat of your competitors.
� Finally, Section 5 takes you throughcreating an action plan based on yourfindings.
If you get stuck at any point, Section 6contains a case study detailing theassessment process for a fictional pie factory.Each stage of the work is fully explained, andtables and graphs are included, which youcan modify to accommodate the datacollected in your walk-around.
Got a problem? Find the appropriate skills
The review must be carried out by peoplewith appropriate skills and knowledge. To getthe most from reviewing your site, you don’tneed to be a resource efficiency expert, butyou do need to have a good understanding ofthe site’s processes and access to financial,production and ordering information. If youfind that the necessary skills do not existwithin your organisation, contact WRAP’sResource Efficiency Helpline on 0808 1002040 or visit the website (www.wrap.org.uk)for more advice.
This process shouldform part of a widerproject which looksat waste across yoursupplier chain,identifying how yourprocess, product andpackaging affectwaste in yourcustomers’ and finalconsumers’operations.
WRAP Self-assessment Review for Food and Drink Manufacturers 3
2 What is waste really costing you?
Do you know what your true waste costs areand how they affect your competitivenessand profitability?
Many companies underestimate how muchwaste is costing; it could be as high as 4% ofturnover. The true cost of waste isn’t limitedto the charges for disposal. It also includeswasted raw materials, energy and labour –which can be between 5 and 20 times morethan the cost of disposal. It could cost moreto throw resource away than to purchase it inthe first place.
Through simple, no-cost or low-costmeasures, companies can identify wherewaste is arising at each stage of a processand take steps to reduce it. This will help yourenvironmental performance, reduce yourcarbon footprint and help to build brand value.
A recent WRAP report1 estimates that thesavings opportunities within the UK food anddrink sector are around 720,000 tonnes and,assuming average savings of £561 per tonne,the value of savings for the whole UK foodand drink manufacturing sector is estimatedat £404 million.
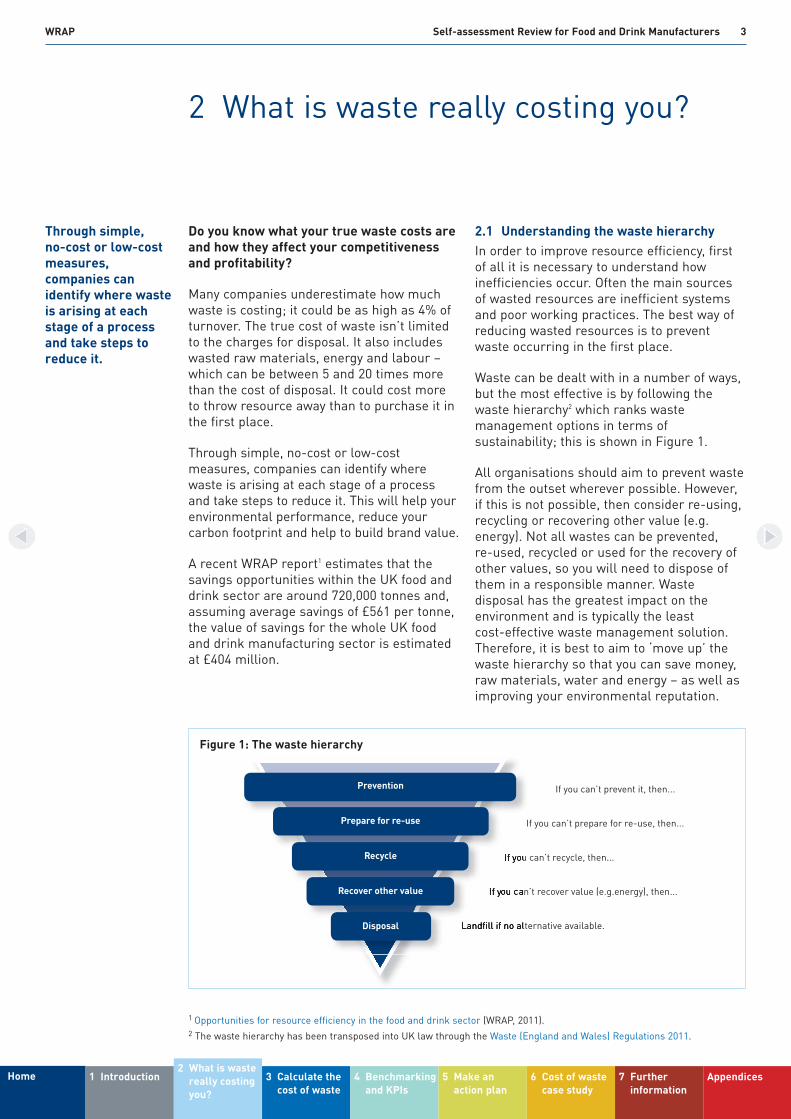
2.1 Understanding the waste hierarchyIn order to improve resource efficiency, firstof all it is necessary to understand howinefficiencies occur. Often the main sourcesof wasted resources are inefficient systemsand poor working practices. The best way ofreducing wasted resources is to preventwaste occurring in the first place.
Waste can be dealt with in a number of ways,but the most effective is by following thewaste hierarchy2 which ranks wastemanagement options in terms ofsustainability; this is shown in Figure 1.
All organisations should aim to prevent wastefrom the outset wherever possible. However,if this is not possible, then consider re-using,recycling or recovering other value (e.g.energy). Not all wastes can be prevented, re-used, recycled or used for the recovery ofother values, so you will need to dispose ofthem in a responsible manner. Wastedisposal has the greatest impact on theenvironment and is typically the least cost-effective waste management solution.Therefore, it is best to aim to ‘move up’ thewaste hierarchy so that you can save money,raw materials, water and energy – as well asimproving your environmental reputation.
Through simple, no-cost or low-costmeasures,companies canidentify where wasteis arising at eachstage of a processand take steps toreduce it.
1 IntroductionHome2 What is waste
really costingyou?
3 Calculate thecost of waste
4 Benchmarkingand KPIs
5 Make anaction plan
6 Cost of wastecase study
7 Furtherinformation
Appendices
If you can’t prevent it, then...
If you can’t prepare for re-use, then...
If you can’t recycle, then...
If you can’t recover value (e.g.energy), then...
Landfill if no alternative available.
Prevention
Prepare for re-use
Recycle
Recover other value
Disposal
Figure 1: The waste hierarchy
1 Opportunities for resource efficiency in the food and drink sector (WRAP, 2011).2 The waste hierarchy has been transposed into UK law through the Waste (England and Wales) Regulations 2011.

WRAP Self-assessment Review for Food and Drink Manufacturers 4
The WRAP Waste Hierarchy Guide is designedto help you understand the waste hierarchyand allow you to select the information on thewastes your business produces and whatmeasures are available to you in applying thehierarchy.
2.2 Identifying your wastesMost of the costs associated with waste andthe inefficient use of resources such as water,energy or materials are hidden andcompanies simply do not consider them asreal costs.
As a business looking to establish andoperate an effective waste management andresource efficiency programme, it is essentialthat you are able to identify the various solidand liquid wastes within your organisation.
Any inputs or outputs in the productionprocess that do not make it into the finalproduct or service can be classified as waste.Food or food processing by-products make up4.1 million tonnes of waste every year. Themajority of food waste returns to the supplychain for further processing, but about1.9 million tonnes of the sector’s waste goesdirectly to landfill3. If you re-use half of yourfood waste and dispose of the other half tolandfill or as effluent you’re on a par with therest of the industry... but what’s so good
about being average? Reducing waste willincrease profits and put you ahead of thegame.
2.3 Waste mappingThe process flow chart is an important toolfor helping to detail the inputs and outputs ofany manufacturing process, and in so doingestablish where wastes are created. Figure 2shows a process flow chart for a typical foodand drink production process.
A good basic principle to adopt is the massbalance approach, identifying and quantifyingthe process inputs and outputs, such that allinputs are accounted for as outputs in theform of product or waste. Once you knowwhere wastes are created, you can begin tocollect data and assign figures to each stage.
The cost of waste is defined as the cost ofpurchasing, processing and disposing of all thenon-product outputs. Improvements inresource efficiency will reduce waste and costs.
Completing this self-assessment review willhelp you to identify potential savings fromimprovements in the underlying process.More information on waste mapping isavailable from WRAP in the guide ‘WasteMapping: Your Route to More Profit’, availablefrom www.wrap.org.uk
1 IntroductionHome2 What is waste
really costingyou?
3 Calculate thecost of waste
4 Benchmarkingand KPIs
5 Make anaction plan
6 Cost of wastecase study
7 Furtherinformation
Appendices
Food & drinkprocessing
Input:Ingredients
Output:Food & drink
product
■ Labour■ Heating & lighting■ Water■ Cleaning materials■ Rinse water
■ Rejected product■ Heat■ Wasted time■ Breakages■ Transit packaging■ Out-of-date product■ Damaged product■ Water/effluent
Figure 2: Process flow chart for a typical food and drink production process
3 Waste Strategy for England 2007, Defra.
WRAP Self-assessment Review for Food and Drink Manufacturers 5
2.4 The walk-aroundThe first step towards improved resourceefficiency is to identify the waste currentlybeing generated as part of your business’sactivities, and the best way to do this is tocarry out a waste ‘walk-around’.
A walk-around will allow you to gain anoverview of the main processes, and willprobably identify areas in which rapid, no-cost or low-cost improvements can bemade to increase resource efficiency andsubsequently save money.
Don’t put off the walk-around. Waste ishappening now and is costing your businessmoney now. Take an unannounced walkaround the site mid-shift. It may also beworth touring the premises when noproduction is being carried out. Always lookin skips as a first step – they are an excellentstarting point for locating waste and thesource of waste can also usually be identified.
The walk-around sheets in Appendix C offerguidance, listing key issues to check whenthinking about all the waste produced on yoursite. Not all of these issues will be relevant,but where they do apply to your business, doyou know the answer? If not, why not and whomight know? Try to be objective about theissues and, where you can assign figures,mark whether they are absolute or realisticestimates. Remember, the aim is to identifywhere waste is occurring so that you canmove on to look at quantities, costs and cost-effective solutions.
2.4.1 Gaining commitmentYou may find it difficult to gain commitmentfrom senior management within theorganisation. Try to explain that the review is
not just paperwork that you plan to completeand file away, simply to be able to say youhave looked into resource efficiency: itprovides a reliable indicator of theeffectiveness of your waste managementsystem and, as such, requires reliable dataand a commitment to change. Mention thatthe review will probably identify and bringabout realistic changes that will save bothresources and money.
2.4.2 Time constraintsShifting production deadlines and timeconstraints may mean frequent breaks in thereviewing procedure, to maintain adequateproduction levels. To optimise the process, tryto plan the review in advance, aiming tocomplete it during a steady production run,but be prepared to be flexible.
2.4.3 Lack of staff commitmentStaff may feel that the review is aiming tocatch them at fault and may try to concealproblems. In most factories, staff are unlikelyto look upon a review as a fact-findingexercise designed to foster a culture ofimprovement. By planning ahead, you shouldbe able to tell staff when you will be in theirarea, which is common courtesy, and topublicise what you are really trying to do. As aresult, you should find people more open andwelcoming. Make sure you also publicise anyimprovements, to motivate staff to bereceptive to future reviews.
Have a look at the WRAP guide, ‘ResourceEfficiency for Managers’, at www.wrap.org.ukfor more ideas on motivating and trainingstaff for your resource efficiency programme.
1 IntroductionHome2 What is waste
really costingyou?
3 Calculate thecost of waste
4 Benchmarkingand KPIs
5 Make anaction plan
6 Cost of wastecase study
7 Furtherinformation
Appendices

WRAP Self-assessment Review for Food and Drink Manufacturers 6
3 Calculate the cost of waste
Calculating your current waste costs will giveyou a baseline figure that you can use forbenchmarking and against which you cancompare future performance. The procedureshould also identify key areas forimprovement, allowing you to prioritiseactions and maximise savings.
3.1 Map out the processStart by trying to map out the information yougathered on the walk-around sheets for yourprocess, creating a mass balance processflow chart that identifies all the inputs andoutputs, both solid and liquid, where theyoccur, and how to measure them.
Figure 3 shows an example of a more detailedprocess flow chart, with inputs on the left andsolid and liquid waste products on the right.Product flows from top to bottom.
The mass balance study can take place atdifferent levels of detail. A good place to startis the whole process, to gain a sense of theoverall costs and savings potential. The studycan then be reworked in greater levels ofdetail, looking at individual processes,production lines or even products, to identifyspecific opportunities.
3.2 Create waste-tracking sheetsFrom the process flow chart, you should beable to create a waste-tracking sheet foreach individual step. These sheets list,quantify and assign a cost to each wasteoccurring, and also provide an accuratepicture of the total cost of waste for the step.
Raw materialsRaw material packaging
Raw material waste
Other waste
Cleaning loss,inc container cleaning
Product and packaging waste
Product write-offs
Productwaste,spills
Evaporation,cooking loss
Purchasing
Ingredient water
Cleaning water
Packaging
Preparation
Processing
Product sales
Packaging/filling
ETP
Recovery and recycling
Landfill
Tradeeffluent
Storage/dispatch
Wastemanagement
Figure 3: Food and drink manufacture: process flow chart
1 IntroductionHome 2 What is wastereally costingyou?
3 Calculate thecost of waste 4 Benchmarking
and KPIs5 Make an
action plan6 Cost of waste
case study7 Further
informationAppendices

WRAP Self-assessment Review for Food and Drink Manufacturers 7
Table 1 shows an example sheet. Where wastecosts are high, there is most opportunity forimprovement. The ‘resource/material/utility’column contents will change depending on theprocess, what was seen during the walk-around, and the level of detail at whichyou are examining the process or process step.
Combining the details for the individual stepswill give you the overall cost of waste to thecompany. The results can also be used to seeif there are any discrepancies in overall values,(i.e. between the identified and actual valuesfor raw material and energy consumption, andwater usage). You can then investigate furtherif there are major discrepancies.
Try to note where the inputs, outputs, wastesand transfers between processes occur. Forexample, where applicable, can you identify:
� Whether the amounts of inputs, outputs,wastes and transfers are being measured?
� Where ingredient water is entering theprocess and whether it is metered?
� Whether and where cooking or evaporationlosses are occurring?
� Washing losses to drain from vesselcleaning, cleaning-in-place (CIP) systems,mobile tank washing, etc, and where theyare going, as liquid waste (sludge), directto drain or to the effluent treatment plant(ETP)?
� Whether the load (input to the ETP fromthe process) is being measured?
Appendix A contains a table you can use torecord your findings, and some hints on howto estimate missing data.
True cost of waste = Cost of wasted rawmaterials + lost time + cost of utilities used +waste treatment costs + disposal costs.
3.3 Collect dataData can be collected from many sources,including production records, bills and thefinance, quality control and wastemanagement departments.
By this stage you should have a good idea ofwhat is available. Choose a suitable baseperiod, usually a year. If data are available forpart of a year, annualise them based on asuitable ratio, as shown in Table 2.
1 IntroductionHome 2 What is wastereally costingyou?
3 Calculate thecost of waste 4 Benchmarking
and KPIs5 Make an
action plan6 Cost of waste
case study7 Further
informationAppendices
Table 1: Example waste-tracking sheet
Process description:
Resource/material/utility Quantity wasted Cost Notes
Wasted time
Transit packaging
Breakages
Heat
Spilt product
Out-of-date stock
Wasted water
Effluent or cleaning by-product
Total:
Next process:
Table 2: Using a base period to collect data
Basis Base period Full year Multiply data by
Number of working days 227 365 1.60
Production (tonnes) 1,208 2,054 1.70
Number of months 8 12 1.50

WRAP Self-assessment Review for Food and Drink Manufacturers 8
Remember: if you don’t measure it, you can’t manage it!
The information needed should be easy toobtain.
� Use existing accounts records for rawmaterial purchases.
� Use production records to find out howmuch raw material is actually used, ratherthan how much is ordered and delivered. Ifmore than one type of raw material isused, add more lines to the tracking sheet.
� For the main production process wastes,include trimmings, damaged finishedproduct, etc.
� Use waste transfer notes (a legalrequirement) to find out how much solidwaste has left the site and inspect invoicesfor waste disposal costs.
� For packaging, companies or supplierscovered by the packaging wasteregulations will already have data onpackaging use.
� Use utility bills to assess and recordenergy and water usage.
If you do not have all the data to complete thetracking sheet, approach the accountsdepartment: accounts should be able toprovide details of materials and servicesbought, product sold and waste disposalcosts. If in doubt, estimate the appropriatenumber; it is better to have an informedestimate than no data at all.
If your accounts department sits remotelyfrom the production site, ensure someone atthe actual production facility monitors theutility bills. Any anomalies will be picked upmore quickly on site than in a remoteaccounts department.
Create a final reportAfter the review has been completed and youhave identified areas for improvement, it is agood idea to create a report. This does notnecessarily have to be lengthy, but it shouldconvey a balanced summary of the status ofthe organisation reviewed.
Lack of information?
Are the data available for collection? Canyour suppliers help you to calculate yourwaste disposal costs? Companies covered bythe packaging waste regulations will havedata on the packaging sold to the company.
Waste transfer notes (a legal requirement)will contain data on how much solid wastehas left the site. Use existing accountsrecords for raw materials purchases, servicesbought and products sold, and waste disposalcosts. If in doubt, estimate the appropriatenumber.
3.4 Estimate missing dataWith a mass balance approach, missing inputor output data can be estimated fromknowledge of the other inputs and outputs.
� If you know Gross and Net production inkg, you can calculate the packaging yield(Yield = Gross – Net). If you know thepackaging usage in kg, then you cancalculate packaging loss (Loss = Usage –Yield). This will indicate if packaging loss isan issue, and will prompt you to take amore detailed look at packaging waste, todetermine the causes and potentialsavings.
� If you know the quantity of ingredientspurchased in kg (in a process whereingredient water is metered and theproduct is uncooked so there are nocooking/evaporative losses) and thenumber of each stock keeping units (SKUs)produced, then you can calculate netproduction based on the product weight.From this you will be able to calculateingredient loss (Loss = Purchases +Ingredient water – Net production (Numberof SKUs x Standard Product weight)).
1 IntroductionHome 2 What is wastereally costingyou?
3 Calculate thecost of waste 4 Benchmarking
and KPIs5 Make an
action plan6 Cost of waste
case study7 Further
informationAppendices

WRAP Self-assessment Review for Food and Drink Manufacturers 9
4 Benchmarking and Key PerformanceIndicators
Benchmarking and Key PerformanceIndicators (KPIs) are valuable components ofany waste management initiative.
4.1 BenchmarkingBenchmarking is an excellent way to assesswhere you stand, by comparing your utilityusage and waste generation levels with thoseof other businesses in your sector. When youhave compiled your list of wastes, you canuse the data to gauge your performancerelative to other businesses and set realistictargets for improvement.
4.2 Key Performance IndicatorsKPIs are a broadly accepted financial andnon-financial monitoring tool which reflects
manufacturing efficiency. They are a set ofmeasurements deemed essential tounderstanding an organisation’s operationalhealth, and can help you to measure progresstowards your organisational goals,particularly for difficult to quantify,knowledge-based processes.
Some commonly used KPIs in the food anddrink industry are listed in Table 3. The natureof the food and drink sector makes it difficultto provide a set of indicators that fits thewhole sector. The suggested KPIs will give youa useful starting point, from which you candevelop indicators suited to your organisation.
Benchmarking is anexcellent way toassess where youstand, by comparingyour utility usageand wastegeneration levelswith those of otherbusinesses in yoursector.
1 IntroductionHome 2 What is wastereally costingyou?
3 Calculate thecost of waste
4 Benchmarkingand KPIs 5 Make an
action plan6 Cost of waste
case study7 Further
informationAppendices
Table 3: Commonly used KPIs in the food and drink industry
KPI Units What is it? What does it What is a reflect? good result?
Water m3/tonne Total water use on site, Total volume of water Low levelsconsumption of product excluding cooling water consumed in any
extracted and returned given time period to source (week, month or year)
Process m3/tonne Water used in processing Volume of water used Dependent on water of product operations, including that in any given time period the particular
used as a raw material to produce a normalised product(ingredient) unit of production
Product % (by number Percentage of finished Level of rework – Low levels rework of items) goods (number of items) related to inefficiency
that have to be reprocessed or very high quality in some way (if applicable) standardsone or more times. % ‘first time best’ = 100 – product rework
Total product % (by weight) 100 x tonnage of saleable Overall effectiveness in High levelsyield goods divided by total tonnage making saleable product
of all goods produced
Process energy kWh/tonne Amount of energy used in Process energy use by Low levels(specific of product separate specific different activities (allow activities) manufacturing processes this to be tracked
(e.g. bottling lines, ovens, independently) requires mixing vessels) per unit of high levels of process production control and monitoring
equipment
Total raw Tonnes/tonne Relative quantity of raw Allows raw material Low levels are material use of product material consumed in a consumption to be generally good,
given time period (normally tracked over time, but varies a year), including all regardless of the level according to packaging but excluding of production output productfuel and water (unless water is also a main ingredient/raw material)
WRAP Self-assessment Review for Food and Drink Manufacturers 10
5 Make an action plan
To start seeing improvements in your wastemanagement practices, you need to take allthe information gathered so far and turn itinto an action plan. It is important that theaction plan is agreed, written and recorded,and that it is actually used to drive actionsand deliver cost savings and environmentalbenefits.
Your action plan can take the form of awritten document or a table; make sure it isclear what is to be done, who needs to do itand what you aim to achieve. There is anexample plan at the end of the case study inSection 6 which will give you ideas on what toinclude and a possible layout.
The following pointers may help you whendrafting your plan.
� Find out where and why waste is beingcreated.
� Prioritise your actions into those optionswhich will save you the most money. Startby identifying obvious areas for wastereduction, where you can achieveimmediate and substantial savings byimplementing no-cost and low-costmeasures.
� Calculate the true cost of all your wastestreams: you could represent the cost ofwaste as a percentage of turnover or peremployee (for an example, see the ‘keystatistics’ table in Section 6).
� Record the starting position and publiciseimprovements.
� Use the waste hierarchy, waste-trackingsheets and process flow diagrams to assistin identifying savings.
� Take into account KPIs and considerbenchmarking.
� Appoint a resource efficiency champion.� Ensure senior management is committed
to the whole process.� Carry out regular and focused staff
training.� Ensure your action plan covers all relevant
issues. For example, begin to monitorutility and packaging usage, if this has notbeen done before, and look at your use ofrefrigeration and at your productmovement and materials management.
Your action plan cantake the form of awritten document ora table; make sure itis clear what is to bedone, who needs todo it and what youaim to achieve.
1 IntroductionHome 2 What is wastereally costingyou?
3 Calculate thecost of waste
4 Benchmarkingand KPIs
5 Make anaction plan 6 Cost of waste
case study7 Further
informationAppendices
Start today!

WRAP Self-assessment Review for Food and Drink Manufacturers 11
6 Cost of waste case study
This example case study describes the reviewprocedure for a fictional frozen pie factory.The factory has a turnover of £2.5 million andemploys 18 people.
Each stage of the review is examined,including calculating the cost of waste for thefactory, deeper investigations to identifysavings and calculating potential savings forthe projects identified (see Figure 4).
The methods used are applicable to a widerange of food processes, although the issues,costs and opportunities will be different ineach case.
6.1 Calculating the total cost of waste The total cost of waste is built up from anumber of elements.
Data are entered into the coloured boxes inTable 4 and the remaining figures arecalculated from these. The ingredients dataare taken from production or purchasingrecords. The net production figure is alsotaken from the Management InformationSystem production records.
Ingredient water is added to the pie fillings;this is metered and the meter is read daily.The figure is taken from the meter readingsfor one year, and the cost per litre is foundfrom bills.
The methods usedare applicable to awide range of foodprocesses, althoughthe issues, costs andopportunities will bedifferent in eachcase.
■ Ingredient balance■ Packaging and waste costs■ Product write-offs
■ Waste disposal■ Water and effluent■ Other material waste
6.1 Calculate the total cost of waste
■ Review key statistics■ Ingredient yield loss■ Packaging yield loss
6.2 Go into more detail
■ Identify priority areas from the cost of waste and mass balance calculations■ Identify key projects
6.3 Identify potential savings
■ Detail projects■ Assign responsibilities■ Detail monitoring
■ Work with senior management to get buy-in
6.4 Develop an action plan
Figure 4: Steps involved in review procedure
1 IntroductionHome 2 What is wastereally costingyou?
3 Calculate thecost of waste
4 Benchmarkingand KPIs
5 Make anaction plan
6 Cost of wastecase study 7 Further
informationAppendices
WRAP Self-assessment Review for Food and Drink Manufacturers 12
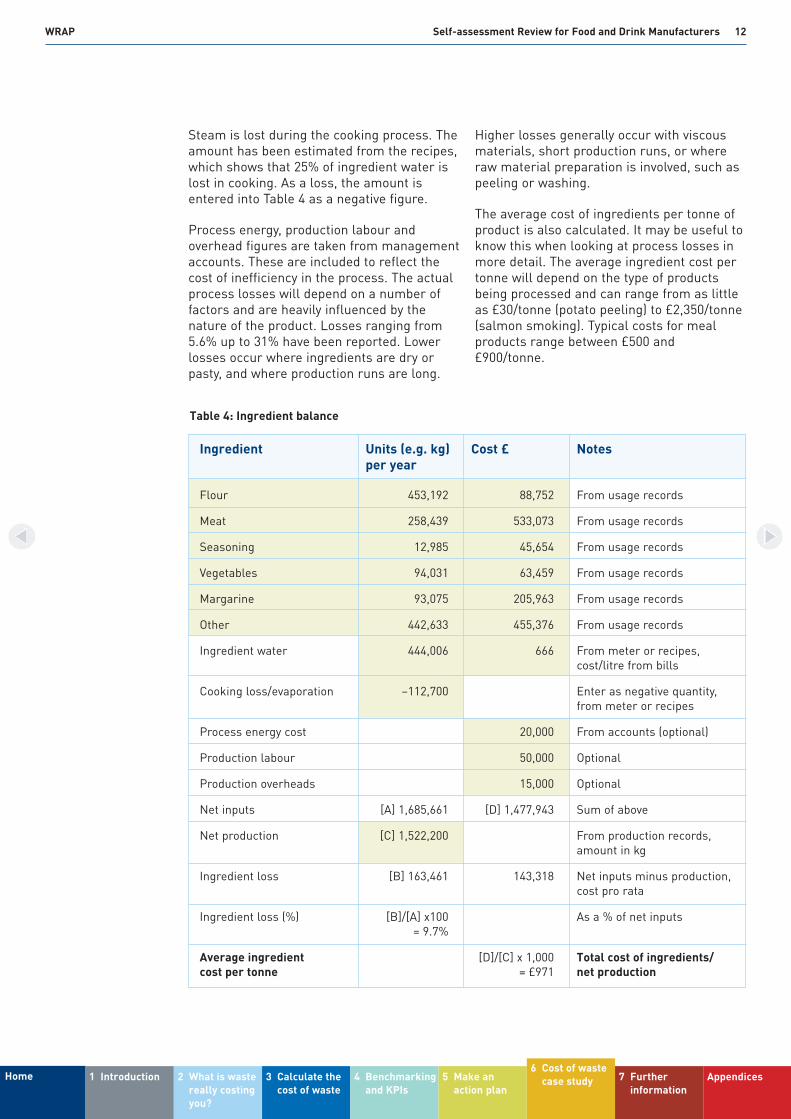
Steam is lost during the cooking process. Theamount has been estimated from the recipes,which shows that 25% of ingredient water islost in cooking. As a loss, the amount isentered into Table 4 as a negative figure.
Process energy, production labour andoverhead figures are taken from managementaccounts. These are included to reflect thecost of inefficiency in the process. The actualprocess losses will depend on a number offactors and are heavily influenced by thenature of the product. Losses ranging from5.6% up to 31% have been reported. Lowerlosses occur where ingredients are dry orpasty, and where production runs are long.
Higher losses generally occur with viscousmaterials, short production runs, or whereraw material preparation is involved, such aspeeling or washing.
The average cost of ingredients per tonne ofproduct is also calculated. It may be useful toknow this when looking at process losses inmore detail. The average ingredient cost pertonne will depend on the type of productsbeing processed and can range from as littleas £30/tonne (potato peeling) to £2,350/tonne(salmon smoking). Typical costs for mealproducts range between £500 and£900/tonne.
1 IntroductionHome 2 What is wastereally costingyou?
3 Calculate thecost of waste
4 Benchmarkingand KPIs
5 Make anaction plan
6 Cost of wastecase study 7 Further
informationAppendices
Table 4: Ingredient balance
Ingredient Units (e.g. kg) Cost £ Notesper year
Flour 453,192 88,752 From usage records
Meat 258,439 533,073 From usage records
Seasoning 12,985 45,654 From usage records
Vegetables 94,031 63,459 From usage records
Margarine 93,075 205,963 From usage records
Other 442,633 455,376 From usage records
Ingredient water 444,006 666 From meter or recipes, cost/litre from bills
Cooking loss/evaporation –112,700 Enter as negative quantity, from meter or recipes
Process energy cost 20,000 From accounts (optional)
Production labour 50,000 Optional
Production overheads 15,000 Optional
Net inputs [A] 1,685,661 [D] 1,477,943 Sum of above
Net production [C] 1,522,200 From production records, amount in kg
Ingredient loss [B] 163,461 143,318 Net inputs minus production, cost pro rata
Ingredient loss (%) [B]/[A] x100 As a % of net inputs= 9.7%
Average ingredient [D]/[C] x 1,000 Total cost of ingredients/cost per tonne = £971 net production
WRAP Self-assessment Review for Food and Drink Manufacturers 13
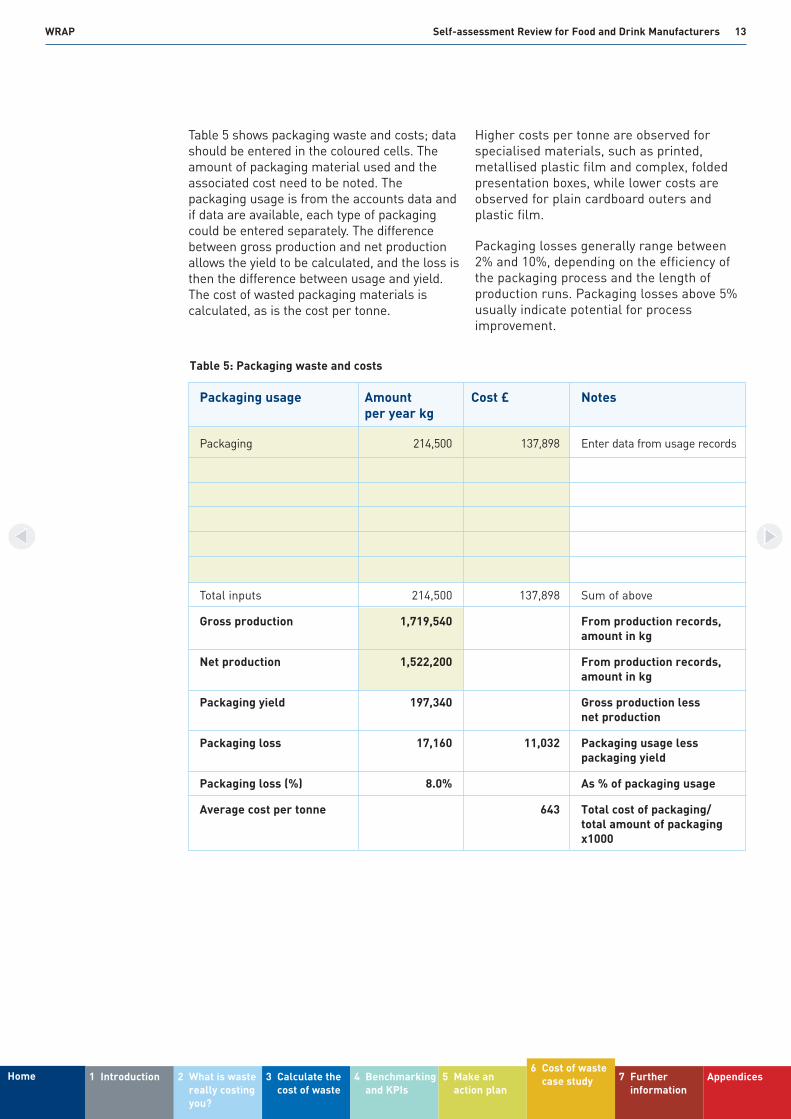
Table 5 shows packaging waste and costs; datashould be entered in the coloured cells. Theamount of packaging material used and theassociated cost need to be noted. Thepackaging usage is from the accounts data andif data are available, each type of packagingcould be entered separately. The differencebetween gross production and net productionallows the yield to be calculated, and the loss isthen the difference between usage and yield.The cost of wasted packaging materials iscalculated, as is the cost per tonne.
Higher costs per tonne are observed forspecialised materials, such as printed,metallised plastic film and complex, foldedpresentation boxes, while lower costs areobserved for plain cardboard outers andplastic film.
Packaging losses generally range between2% and 10%, depending on the efficiency ofthe packaging process and the length ofproduction runs. Packaging losses above 5%usually indicate potential for processimprovement.
1 IntroductionHome 2 What is wastereally costingyou?
3 Calculate thecost of waste
4 Benchmarkingand KPIs
5 Make anaction plan
6 Cost of wastecase study 7 Further
informationAppendices
Packaging usage Amount Cost £ Notesper year kg
Packaging 214,500 137,898 Enter data from usage records
Total inputs 214,500 137,898 Sum of above
Gross production 1,719,540 From production records, amount in kg
Net production 1,522,200 From production records, amount in kg
Packaging yield 197,340 Gross production less net production
Packaging loss 17,160 11,032 Packaging usage less packaging yield
Packaging loss (%) 8.0% As % of packaging usage
Average cost per tonne 643 Total cost of packaging/total amount of packagingx1000
Table 5: Packaging waste and costs

WRAP Self-assessment Review for Food and Drink Manufacturers 14
Product write-offs include items such as out-of-date stock, cancelled orders, rawmaterials which are scrapped owing to dateissues, or product returns. Table 6 shows thatin this case, data about the amount of out-of-date stock that was written off areavailable from accounts. This table must notinclude anything counted under ingredientusage, or it would be double-counted.
Table 7 includes all the waste streams fromthe site. The ‘product with packaging’ skipincludes pastry waste and finished productwaste, in its packaging, mixed together.Where wastes are mixed, it may be necessaryto look at them in more detail to see wheresavings can be made. In this case, cardboardis being recycled and the revenue from this(after compactor hire costs) is shown as anegative cost.
1 IntroductionHome 2 What is wastereally costingyou?
3 Calculate thecost of waste
4 Benchmarkingand KPIs
5 Make anaction plan
6 Cost of wastecase study 7 Further
informationAppendices
Write-offs Amount £ in the Noteslast year
Out-of-date stock 20,000 From accounts
Raw material write-offs
Total 20,000 Sum of above
Table 6: Product write-offs
Waste disposal costs Kilograms Disposal cost/ Notesor litres revenue £
Food waste disposal
General waste disposal 52,000 3,120 From accounts/bills
Product with packaging 102,700 7,514
Plastic for recycling
Cardboard for recycling 12,000 –480 Revenue
Wood/pallets
Empty raw material containers
ETP sludge
Metals
Used cooking oil 240 90
Disposal [D] 154,940 10,724 Disposal costs
Sales of waste [R] 12,000 480 Total revenue from sales of waste
Net disposal 142,940 10,244 [D-R] Net disposal costs(costs less revenue)
Table 7: Waste disposal

WRAP Self-assessment Review for Food and Drink Manufacturers 15
Water, sewerage and effluent costs in Table 8are entered from the bills. The effluenttreatment plant (ETP) chemical costs aretaken from the accounts. Other costs whichcould be included are the costs of watertreatment and heating, if these are relevant.
Other material waste (Table 9) includes anyother materials which are purchased andused in the process, but not included iningredients or packaging.
1 IntroductionHome 2 What is wastereally costingyou?
3 Calculate thecost of waste
4 Benchmarkingand KPIs
5 Make anaction plan
6 Cost of wastecase study 7 Further
informationAppendices
Water and effluent Amount Cost £ Notes
Water from mains m3 11,500 From bill
Water fixed cost 2,350 From bill
Water variable cost 10,225 From bill
Sewerage amount m3 2,350 From bill
Sewerage fixed cost 960 From bill
Sewerage variable cost 1,058 From bill
Trade effluent volume m3 9,150 From bill
Trade effluent fixed cost 2,504 From bill
Trade effluent charge 7,196 From bill
Cost of water treatment For example, reverse osmosis(RO) or softening
Cost of water heating Energy use for hot water
ETP costs 2,580 Chemicals/labour etc
Total cost 26,873 Total
Table 8: Water and effluent
Other resource waste Amount Cost £ Notes
Chemicals for cleaning station 150 200 As required, where not included in the above
Total cost 200 Total
Table 9: Other material waste
WRAP Self-assessment Review for Food and Drink Manufacturers 16
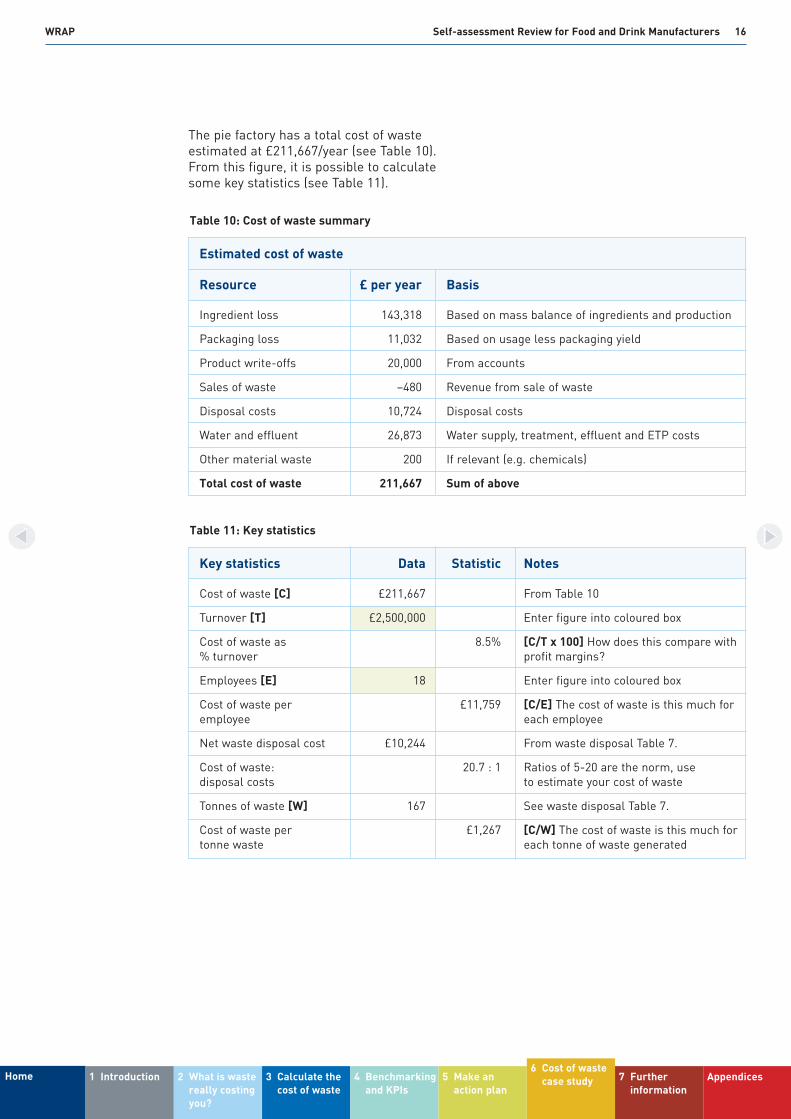
The pie factory has a total cost of wasteestimated at £211,667/year (see Table 10).From this figure, it is possible to calculatesome key statistics (see Table 11).
1 IntroductionHome 2 What is wastereally costingyou?
3 Calculate thecost of waste
4 Benchmarkingand KPIs
5 Make anaction plan
6 Cost of wastecase study 7 Further
informationAppendices
Estimated cost of waste
Resource £ per year Basis
Ingredient loss 143,318 Based on mass balance of ingredients and production
Packaging loss 11,032 Based on usage less packaging yield
Product write-offs 20,000 From accounts
Sales of waste –480 Revenue from sale of waste
Disposal costs 10,724 Disposal costs
Water and effluent 26,873 Water supply, treatment, effluent and ETP costs
Other material waste 200 If relevant (e.g. chemicals)
Total cost of waste 211,667 Sum of above
Table 10: Cost of waste summary
Key statistics Data Statistic Notes
Cost of waste [C] £211,667 From Table 10
Turnover [T] £2,500,000 Enter figure into coloured box
Cost of waste as 8.5% [C/T x 100] How does this compare with % turnover profit margins?
Employees [E] 18 Enter figure into coloured box
Cost of waste per £11,759 [C/E] The cost of waste is this much for employee each employee
Net waste disposal cost £10,244 From waste disposal Table 7.
Cost of waste: 20.7 : 1 Ratios of 5-20 are the norm, usedisposal costs to estimate your cost of waste
Tonnes of waste [W] 167 See waste disposal Table 7.
Cost of waste per £1,267 [C/W] The cost of waste is this much for tonne waste each tonne of waste generated
Table 11: Key statistics

WRAP Self-assessment Review for Food and Drink Manufacturers 17
The cost of waste (see Figure 5) amounts to8.5% of turnover. How does this compare withprofit margins? Waste disposal costs areshown to be a minor element of the total; theoverall cost of waste is almost 20 times thedisposal costs. The cost of waste forcompanies in the UK can be as high as 4% ofturnover. However, it is not uncommon forthis figure to be higher in food processing.
Another interesting statistic is the cost pertonne of waste identified in this case study.Each tonne of waste avoided has the potentialto save £1,267.
It is a good idea to start with the overallpicture and then zoom in to specific issuesfollowing a top-down approach. For this piefactory, the main waste costs arise throughingredient losses, with water and effluentcosts and product write-offs much lessimportant in cost terms.
6.2 Going into more detailOnce the overall costs have been estimated, itis time to go into more detail and look atwhich areas have the most potential forsavings.
Ingredient losses (Table 12) account for thelargest part of the waste costs and, in a walk-around, the four main sources ofingredient loss have been identified asingredient preparation, changeovers, cleaninglosses and checkweigher rejects.
6.2.1 Ingredient preparationBins of waste from the food preparation areaare placed in a separate skip from the mainproduction waste. Using data for this skip, itis possible to estimate the annual wastetonnage at 9,000kg, which is 2% of rawmaterials.
1 IntroductionHome 2 What is wastereally costingyou?
3 Calculate thecost of waste
4 Benchmarkingand KPIs
5 Make anaction plan
6 Cost of wastecase study 7 Further
informationAppendices
Ingredient loss
Packaging loss
Product write-offs
Sales of waste
Disposal costs
Water and effluent
Other material waste
-£20,000 £0 £20,000 £40,000 £60,000 £80,000 £100,000 £120,000 £140,000 £160,000
£143,318
£11,032
£20,000
-£480
£10,724
£26,873
£200
Figure 5: Cost of waste
Loss Estimated % Cost £ Notes
Drain loss (load on ETP) 4.0 59,118 Enter % loss, calculate cost pro rata
Ingredient waste 2.0 29,559 Enter % loss, calculate cost pro rata
Changeover waste 1.0 14,779 Enter % loss, calculate cost pro rata
Checkweigher rejects 2.0 29,559 Enter % loss, calculate cost pro rata
Metal detector rejects 0.5 7,390 Enter % loss, calculate cost pro rata
Unaccounted (calc) 0.2 2,913 Ingredient loss less sum of above
Total cost of waste 9.7 143,318 From ingredient balance (Table 4)
Table 12: Ingredient yield loss

WRAP Self-assessment Review for Food and Drink Manufacturers 18
6.2.2 ChangeoversWhen there is a changeover on the pie fillingline, the practice is to use up all the fillingand then scrap any pastry left in the line. Theamount of reject pastry is recorded for aweek and from that data, annual pastry wasteis estimated at 4,500kg or 1% of rawmaterials.
6.2.3 Cleaning lossesThe load on the ETP is sampled regularlyusing an automatic sampler. Based on theaverage suspended solids content and thetotal volume of effluent, the total suspendedsolids are estimated at 18,000kg or 4% of rawmaterials. The solids are reaching the ETPfrom the various equipment washing stations(mobile tanks, cookers and mixers).
6.2.4 Checkweigher rejectsRejected product levels are examined usingrecords from the Quality Control department.These show checkweigher rejects arerunning at 2% and metal detector rejects at0.5%.
These data can then be used to calculateingredient yield loss. Based on the dataavailable, there is an unaccounted loss of just0.2%, which is very acceptable. In general, agood mass balance will result in unaccountedlosses of less than 1%.
These new data in Table 12 and Figure 6reveal drain loss to be a priority, especiallywhen coupled with the cost of water andeffluent treatment.
1 IntroductionHome 2 What is wastereally costingyou?
3 Calculate thecost of waste
4 Benchmarkingand KPIs
5 Make anaction plan
6 Cost of wastecase study 7 Further
informationAppendices
Drain loss (load on ETP)
Ingredient waste
Changeover waste
Checkweigher rejects
Metal detector rejects
Unaccounted (calc)
£0 £10,000 £20,000 £30,000 £40,000 £50,000 £60,000 £70,000
£59,118
£29,559
£14,779
£29,559
£7,390
£2,913
Figure 6: Cost of ingredient yield losses
WRAP Self-assessment Review for Food and Drink Manufacturers 19
Another walk-around is carried out to look forsources of drain loss. This reveals that fillingis left in the mobile tanks used to transferfilling from the cookers to the pie filling lines,so some tanks are weighed before and afterwashing. Based on the amount of product leftin the tanks, it is possible to estimate theamount and cost of this loss.
If unaccounted losses were higher, overfillmight be the cause. Overweight product is an‘invisible’ loss of ingredients. Checkweigherdata will reveal the average product giveaway.
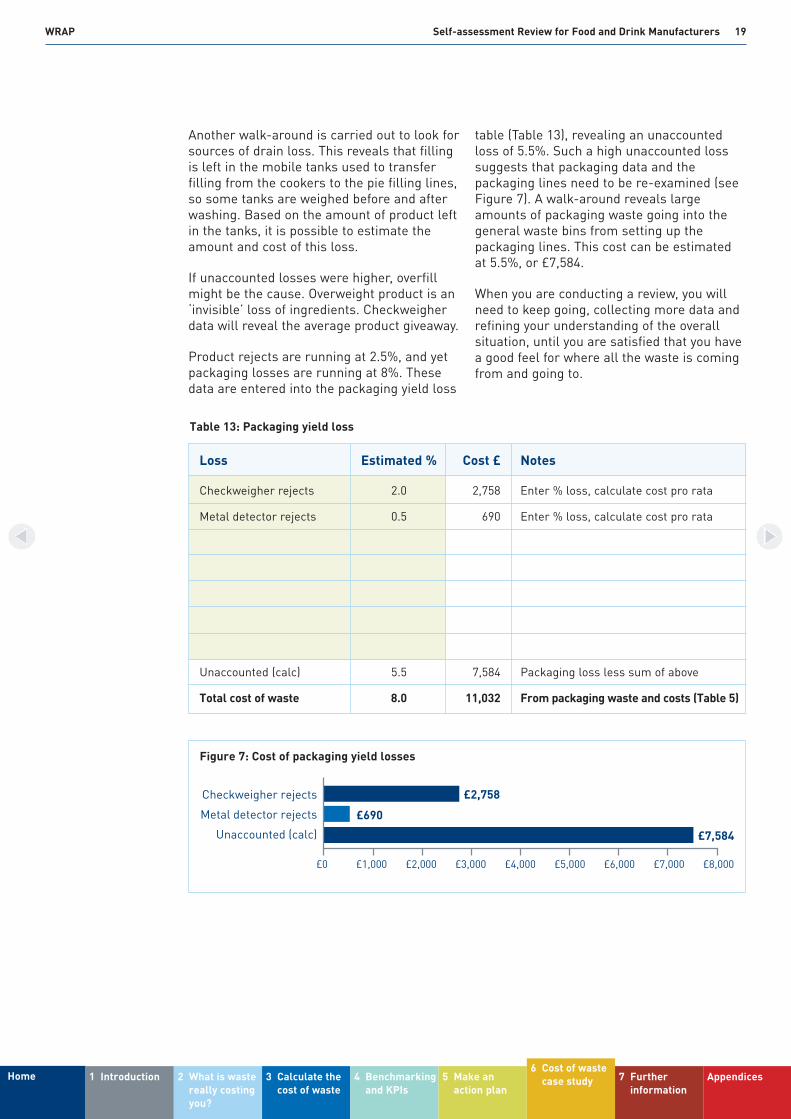
Product rejects are running at 2.5%, and yetpackaging losses are running at 8%. Thesedata are entered into the packaging yield loss
table (Table 13), revealing an unaccountedloss of 5.5%. Such a high unaccounted losssuggests that packaging data and thepackaging lines need to be re-examined (seeFigure 7). A walk-around reveals largeamounts of packaging waste going into thegeneral waste bins from setting up thepackaging lines. This cost can be estimatedat 5.5%, or £7,584.
When you are conducting a review, you willneed to keep going, collecting more data andrefining your understanding of the overallsituation, until you are satisfied that you havea good feel for where all the waste is comingfrom and going to.
1 IntroductionHome 2 What is wastereally costingyou?
3 Calculate thecost of waste
4 Benchmarkingand KPIs
5 Make anaction plan
6 Cost of wastecase study 7 Further
informationAppendices
Loss Estimated % Cost £ Notes
Checkweigher rejects 2.0 2,758 Enter % loss, calculate cost pro rata
Metal detector rejects 0.5 690 Enter % loss, calculate cost pro rata
Unaccounted (calc) 5.5 7,584 Packaging loss less sum of above
Total cost of waste 8.0 11,032 From packaging waste and costs (Table 5)
Table 13: Packaging yield loss
Checkweigher rejects
Metal detector rejects
Unaccounted (calc)
£0 £2,000£1,000 £3,000 £4,000 £5,000 £6,000 £7,000 £8,000
£2,758
£690
£7,584
Figure 7: Cost of packaging yield losses

WRAP Self-assessment Review for Food and Drink Manufacturers 20
6.3 Identifying potential savingsOnce the priority areas have been identifiedfrom the cost of waste and mass balancecalculations, it is time to identify someprojects.
6.3.1 Drain loss: 4.0% at a cost of£59,000/year
The remains left in mobile tanks amount toaround 2kg/tank per week. Around 400 tanksare used each week, resulting in 800kg ofwaste. Based on £877/tonne (averageingredient cost), this loss amounts to£700/week. After discussing the situationwith a team of operators and supervisors, it isdecided to install a mangle at the transferpoint and to use a plastic liner in the mobiletanks. The operator can use the mangle toempty the liner, and trials show a reduction inwaste of 1.5kg/tank. The tank cleaningoperation is speeded up and the load on theETP is reduced by 300kg/week. After allowingfor the additional cost of liners and wastedisposal, the potential saving is £480/week or£24,000/year. This new approach also has anadditional benefit, as the effluent from theETP had been exceeding discharge consentsand the upgrade that was being consideredmay no longer be needed.
The remaining area of drain loss is in thecookers and pipework used to transfer theproduct into the mobile tanks. A project teamis set up to look at this in more detail,including cooker operators, supervisors,quality control staff and laboratory technicians.The potential savings are unknown, so a targetcannot be set at this stage.
To track drain loss in the future and monitorimprovements, a KPI is established based onthe load on the ETP. A sample of the effluentbefore the ETP is taken daily and suspendedsolids are measured in the laboratory. Thedata are entered into a spreadsheet and theETP load (expressed in kg of suspendedsolids) is calculated, based on the monthlyeffluent volume. The KPI used is ETP load inkg/Net production in kg, expressed as apercentage.
6.3.2 Ingredient waste: 2.0% at a cost of£30,000/year
Observations of the bins revealed that abouthalf of the ingredient waste is vegetable peel,which is unavoidable. It may, however, beworth investigating whether there is a marketfor this peel.
1 IntroductionHome 2 What is wastereally costingyou?
3 Calculate thecost of waste
4 Benchmarkingand KPIs
5 Make anaction plan
6 Cost of wastecase study 7 Further
informationAppendices

WRAP Self-assessment Review for Food and Drink Manufacturers 21
In a walk-around, the way in which chickenpieces are delivered is examined and it isnoticed that some chicken pieces are left ineach bag. The bags are slit down one side,but the cut does not go all the way to thecorner and some pieces are trapped.
Twenty chicken bags are collected and 50g ofwaste is found in each 10kg bag, a loss of0.5%. Based on the amount of chickenbought, this loss costs £3,000/year. Bychanging the cutting method to remove theentire edge of the bag, no pieces are trapped.
A KPI for this area of ingredient waste is setup as kg waste/kg production.
6.3.3 Changeover waste: 1.0% at a cost of£15,000/year
Changeover waste occurs because the fillinghas run out and any surplus pastry is thenscrapped. During a walk-around, it is noticedthat a part-filled container is always used atthe end of each batch, making it hard topredict when the filling will run out.Sequencing is changed so that the part-filledcontainer is used earlier on, and each run isthen finished with a full container.
As it is known exactly how many pies can befilled from a full container, pastry mixing canbe adjusted such that there is a minimumsurplus for scrapping. This productionchange could save £10,000/year.
A KPI is set up as kg pastry waste/kg ofproduction.
6.3.4 Checkweigher rejects: 2.0% at a cost of£30,000/year
A technical team is set up to look at thecheckweigher rejects, working withsupervisors and operators in the packingroom. One of the checkweighers is found tohave the wrong settings and is falselyrejecting good product. This accounts foraround one-third of the rejects and can beeliminated by changing the settings, saving£10,000/year. Another third of the rejectsarise on one particular product, where filllevels are variable because the filling ishighly viscous. The team shifts focus to workon improving the capability of the volumetricdispenser.
A KPI is set up as checkweigher rejects as apercentage of production.
6.3.5 Metal detector rejects: 0.5% at a costof £7,500/year
The checkweigher team also looks at theseand identifies one product with high rejectionrates. The problem is found to result from thepackaging: this is proved by removing theproduct from the rejected packs and putting itthrough again. This problem is referred to thetechnical manager, who is targeted to comeup with a design that eliminates the problem.This redesign could save £5,000/year.
6.3.6 Packaging rejects: 5.5% at a cost of£7,500/year
Previous detailed investigations had revealedthat large amounts of packaging were beinglost in setting up the packing machines, andpart rolls were being dumped at the end of arun. A team is set up to investigate thereasons, involving packaging technicians,operators and a supervisor. They setthemselves a target of saving £5,000/year bystandardising machine settings, and usingpart-rolls for set-up. One operator takesresponsibility for setting up a part-roll re-use area.
6.3.7 Water and effluent: £27,000/yearA reduction in effluent charges should resultfrom the projects to reduce drain losses. Ateam is set up to look at where water is used,with a view to implementing efficiencymeasures and saving £10,000/year.
A KPI is set up as water use in m3/kg ofproduction.
6.3.8 Product write-offs: £20,000/year Investigations reveal that this was due to twobatches returned from a customer because ofpoor packaging seal integrity. This should beinvestigated further to identify whether this isan on-going issue that needs to be resolved.
1 IntroductionHome 2 What is wastereally costingyou?
3 Calculate thecost of waste
4 Benchmarkingand KPIs
5 Make anaction plan
6 Cost of wastecase study 7 Further
informationAppendices

WRAP Self-assessment Review for Food and Drink Manufacturers 22
6.3.9 Waste disposal costs: £11,000/year Product waste at £7,500/year is the largestelement of these costs and, by reducingcheckweigher rejects and avoiding productwrite-offs, savings of £3,000/year areanticipated here.
Looking at the cardboard collection operationreveals that cardboard is collected from theraw material preparation area, but not fromthe filling area where the packaging isunpacked. By setting up cardboard collectionfrom this area, and also from the canteen,general waste will be reduced by some 30%,saving £1,000/year.
About half of the general waste comprisesvarious forms of raw material packaging,plastic drums, plastic bottles and bags. It isdifficult to find recyclers that will take plasticthat has been in contact with food. Thepurchasing department is asked to review allraw material packaging to see if re-usable orreturnable alternatives are available and towork with suppliers to ensure that what is notreturnable or re-usable is recyclable.
Plastic drums are used to transfer part-processed material to another site.There is potential for these drums to bewashed and re-used with a liner, potentiallysaving up to £3,000/year on purchases of newdrums.
Implementing these projects has thepotential to save £74,000/year, around 35% ofthe total cost of waste. Experience shows thatwhen the cost of waste is analysed in thisway, potential savings of between 20% and40% are the norm, and can be higher.
6.4 Developing an action planThe identified projects and potential savingscan now be incorporated into an action plan.The plan needs to detail projects, assignresponsibilities and detail monitoring. At thisstage, it is important to work with seniormanagement, to get buy-in to the plans andensure accountability.
The action plan for the pie factory is shown inTable 14. It lists the resources required, thebenefits, both financial and non-financial, theactions and responsible persons. The plancan also be used to monitor completion andthe savings achieved.
Completing a review and drafting an actionplan are just the start of the process.
� Review your action plan regularly.� Continue to monitor progress.� Communicate results and celebrate
successes.� Keep looking for new opportunities to
make savings.� Calculate the true cost of waste on a
regular basis, and report your findings aspart of Board level reporting.
1 IntroductionHome 2 What is wastereally costingyou?
3 Calculate thecost of waste
4 Benchmarkingand KPIs
5 Make anaction plan
6 Cost of wastecase study 7 Further
informationAppendices
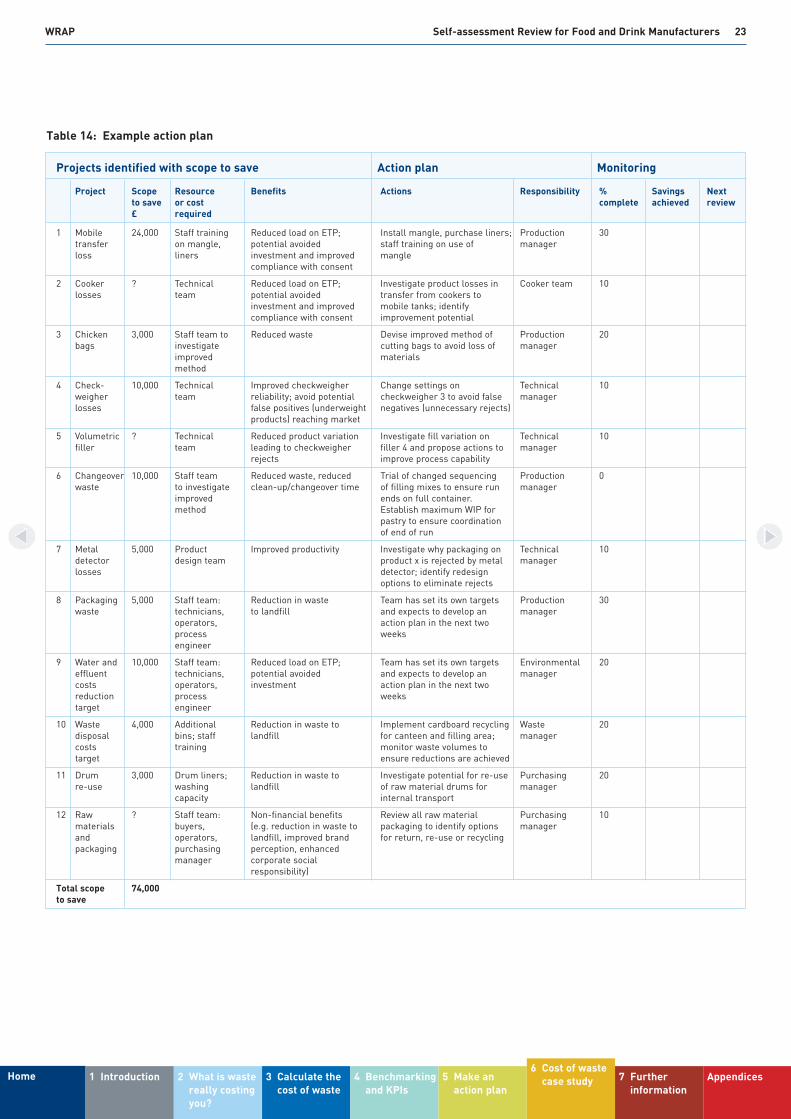
Projects identified with scope to save Action plan Monitoring
Project Scope Resource Benefits Actions Responsibility % Savings Next to save or cost complete achieved review£ required
1 Mobile 24,000 Staff training Reduced load on ETP; Install mangle, purchase liners; Production 30transfer on mangle, potential avoided staff training on use of managerloss liners investment and improved mangle
compliance with consent
2 Cooker ? Technical Reduced load on ETP; Investigate product losses in Cooker team 10losses team potential avoided transfer from cookers to
investment and improved mobile tanks; identify compliance with consent improvement potential
3 Chicken 3,000 Staff team to Reduced waste Devise improved method of Production 20bags investigate cutting bags to avoid loss of manager
improved materialsmethod
4 Check- 10,000 Technical Improved checkweigher Change settings on Technical 10weigher team reliability; avoid potential checkweigher 3 to avoid false managerlosses false positives (underweight negatives (unnecessary rejects)
products) reaching market
5 Volumetric ? Technical Reduced product variation Investigate fill variation on Technical 10filler team leading to checkweigher filler 4 and propose actions to manager
rejects improve process capability
6 Changeover 10,000 Staff team Reduced waste, reduced Trial of changed sequencing Production 0waste to investigate clean-up/changeover time of filling mixes to ensure run manager
improved ends on full container.method Establish maximum WIP for
pastry to ensure coordination of end of run
7 Metal 5,000 Product Improved productivity Investigate why packaging on Technical 10detector design team product x is rejected by metal managerlosses detector; identify redesign
options to eliminate rejects
8 Packaging 5,000 Staff team: Reduction in waste Team has set its own targets Production 30waste technicians, to landfill and expects to develop an manager
operators, action plan in the next two process weeksengineer
9 Water and 10,000 Staff team: Reduced load on ETP; Team has set its own targets Environmental 20effluent technicians, potential avoided and expects to develop an managercosts operators, investment action plan in the next two reduction process weekstarget engineer
10 Waste 4,000 Additional Reduction in waste to Implement cardboard recycling Waste 20disposal bins; staff landfill for canteen and filling area; managercosts training monitor waste volumes to target ensure reductions are achieved
11 Drum 3,000 Drum liners; Reduction in waste to Investigate potential for re-use Purchasing 20re-use washing landfill of raw material drums for manager
capacity internal transport
12 Raw ? Staff team: Non-financial benefits Review all raw material Purchasing 10materials buyers, (e.g. reduction in waste to packaging to identify options managerand operators, landfill, improved brand for return, re-use or recyclingpackaging purchasing perception, enhanced
manager corporate social responsibility)
Total scope 74,000to save
Table 14: Example action plan
WRAP Self-assessment Review for Food and Drink Manufacturers 23
1 IntroductionHome 2 What is wastereally costingyou?
3 Calculate thecost of waste
4 Benchmarkingand KPIs
5 Make anaction plan
6 Cost of wastecase study 7 Further
informationAppendices
WRAP Self-assessment Review for Food and Drink Manufacturers 24
1 IntroductionHome 2 What is wastereally costingyou?
3 Calculate thecost of waste
4 Benchmarkingand KPIs
5 Make anaction plan
6 Cost of wastecase study
7 Furtherinformation Appendices
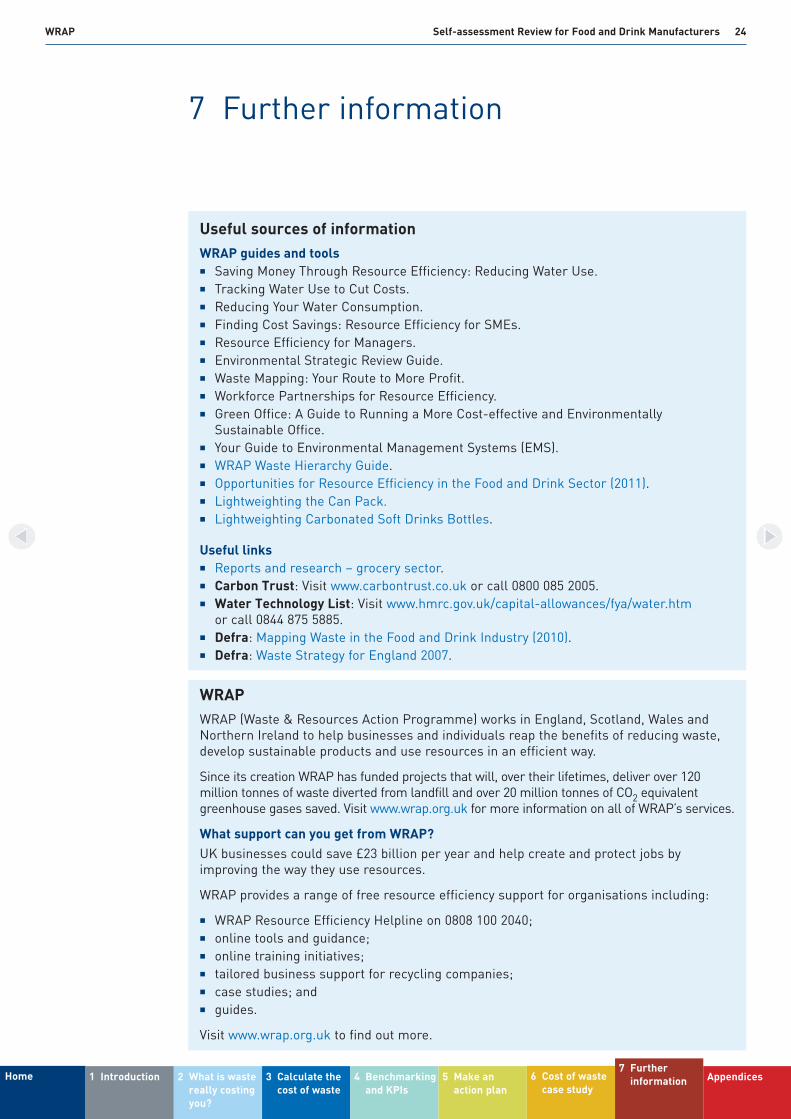
7 Further information
Useful sources of informationWRAP guides and tools� Saving Money Through Resource Efficiency: Reducing Water Use.� Tracking Water Use to Cut Costs.� Reducing Your Water Consumption.� Finding Cost Savings: Resource Efficiency for SMEs.� Resource Efficiency for Managers.� Environmental Strategic Review Guide.� Waste Mapping: Your Route to More Profit.� Workforce Partnerships for Resource Efficiency.� Green Office: A Guide to Running a More Cost-effective and Environmentally
Sustainable Office.� Your Guide to Environmental Management Systems (EMS).� WRAP Waste Hierarchy Guide.� Opportunities for Resource Efficiency in the Food and Drink Sector (2011).� Lightweighting the Can Pack.� Lightweighting Carbonated Soft Drinks Bottles.
Useful links� Reports and research – grocery sector.� Carbon Trust: Visit www.carbontrust.co.uk or call 0800 085 2005.� Water Technology List: Visit www.hmrc.gov.uk/capital-allowances/fya/water.htm
or call 0844 875 5885.� Defra: Mapping Waste in the Food and Drink Industry (2010).� Defra: Waste Strategy for England 2007.
WRAPWRAP (Waste & Resources Action Programme) works in England, Scotland, Wales andNorthern Ireland to help businesses and individuals reap the benefits of reducing waste,develop sustainable products and use resources in an efficient way.
Since its creation WRAP has funded projects that will, over their lifetimes, deliver over 120million tonnes of waste diverted from landfill and over 20 million tonnes of CO2 equivalentgreenhouse gases saved. Visit www.wrap.org.uk for more information on all of WRAP’s services.
What support can you get from WRAP?UK businesses could save £23 billion per year and help create and protect jobs byimproving the way they use resources.
WRAP provides a range of free resource efficiency support for organisations including:
� WRAP Resource Efficiency Helpline on 0808 100 2040;� online tools and guidance; � online training initiatives;� tailored business support for recycling companies;� case studies; and� guides.
Visit www.wrap.org.uk to find out more.

WRAP Self-assessment Review for Food and Drink Manufacturers 25
1 IntroductionHome 2 What is wastereally costingyou?
3 Calculate thecost of waste
4 Benchmarkingand KPIs
5 Make anaction plan
6 Cost of wastecase study
7 Furtherinformation
Appendices
Appendix A Data locator
Raw materials
Inputs Data available from Units of measure Notes
Gross weight of raw Purchasing Kilos, tonnes, Can be calculated if ingredientmaterials purchased drums, litres, sacks usage and raw material
packaging are known
Outputs Data available from Units of measure Notes
Packaging waste No data unless Drums, containers, Can be estimated fromsome types of IBCs, bags, pallets, gross/net weight of typicalpackaging waste kilos, litres ingredientsare segregated for recycling
Raw materials left No data Kilos, litres Can be estimated from in packaging sampling some ‘empty’
containers
Preparation
Inputs Data available from Units of measure Notes
Ingredient usage Material usage Kilos, drums, reports litres, sacks
Outputs Data available from Units of measure Notes
Raw material waste Solid waste data Kilos(peel, trimming, bones)
Processing
Inputs Data available from Units of measure Notes
Ingredient water Meter readings Litres Can also be estimated from recipes
Outputs Data available from Units of measure Notes
Gross production Management reports Kilos
Cooking loss No data Kilos Can be estimated from recipes
CIP wash to ETP CIP records See load on ETP
Failed batches Waste or quality data Kilos
Samples Waste or quality data Kilos
Product left in No data Kilos Can be estimated fromtransfer containers sample weighing and data on
number of containers washed
The following table suggests where you are likely to find the information needed to complete your review.

WRAP Self-assessment Review for Food and Drink Manufacturers 26
1 IntroductionHome 2 What is wastereally costingyou?
3 Calculate thecost of waste
4 Benchmarkingand KPIs
5 Make anaction plan
6 Cost of wastecase study
7 Furtherinformation
Appendices
Packaging
Inputs Data available from Units of measure Notes
Gross packaging Purchasing Kilos/units
Outputs Data available from Units of measure Notes
Saleable product Production data Kilos/units
Product rejects Quality data Kilos/units
Packaging rejects No data Kilos Use mass balance
Waste management
Inputs Data available from Units of measure Notes
Waste from each No data Kilos Can be sampled by process segregating wastes from
an individual process
Non-production waste No data Kilos
Outputs Data available from Units of measure Notes
Waste to landfill Waste invoices Kilos, tonnes or volume Convert volume to kilos based on bulk density
Waste to recovery Waste invoices Kilos, tonnes or volume
Waste to recycling Waste invoices Kilos, tonnes or volume
Liquid waste Waste invoices Litres May have high water content; adjust if using for mass balance
Food waste for Waste invoices Kilos, tonnesrendering
Effluent treatment
Inputs Data available from Units of measure Notes
Treatment chemicals Purchasing records Kilos
Load No data Kilos of solids Use mass balance
Outputs Data available from Units of measure Notes
Screening sludge Waste management Kilos
ETP sludge Waste management Kilos
Suspended solids (S/S) Effluent bills or Kilos Calculate total load as and chemical oxygen monitoring data average solids x effluent demand (COD) to volume in litres (m3 x 1,000)trade effluent
Storage/dispatch
Outputs Data available from Units of measure Notes
Product write-offs Accounts £
May have high watercontent; adjust if using formass balance
WRAP Self-assessment Review for Food and Drink Manufacturers 27
1 IntroductionHome 2 What is wastereally costingyou?
3 Calculate thecost of waste
4 Benchmarkingand KPIs
5 Make anaction plan
6 Cost of wastecase study
7 Furtherinformation
Appendices
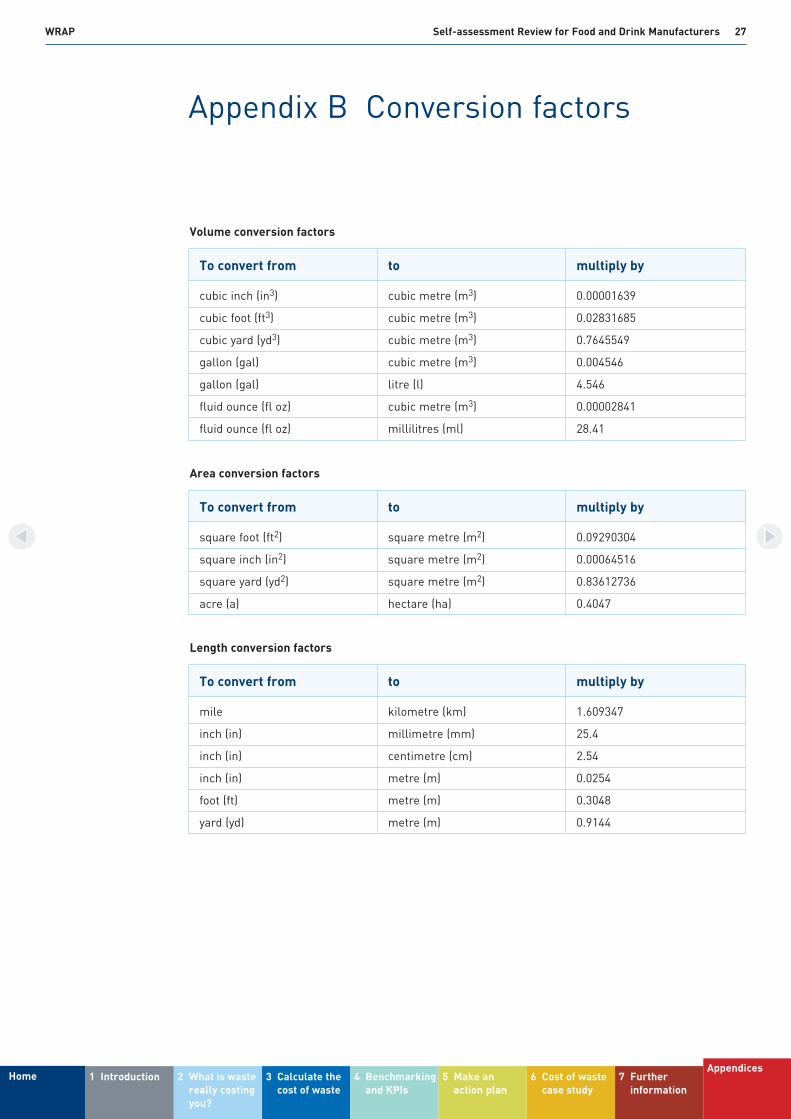
Appendix B Conversion factors
To convert from to multiply by
cubic inch (in3) cubic metre (m3) 0.00001639
cubic foot (ft3) cubic metre (m3) 0.02831685
cubic yard (yd3) cubic metre (m3) 0.7645549
gallon (gal) cubic metre (m3) 0.004546
gallon (gal) litre (l) 4.546
fluid ounce (fl oz) cubic metre (m3) 0.00002841
fluid ounce (fl oz) millilitres (ml) 28.41
Volume conversion factors
To convert from to multiply by
square foot (ft2) square metre (m2) 0.09290304
square inch (in2) square metre (m2) 0.00064516
square yard (yd2) square metre (m2) 0.83612736
acre (a) hectare (ha) 0.4047
Area conversion factors
To convert from to multiply by
mile kilometre (km) 1.609347
inch (in) millimetre (mm) 25.4
inch (in) centimetre (cm) 2.54
inch (in) metre (m) 0.0254
foot (ft) metre (m) 0.3048
yard (yd) metre (m) 0.9144
Length conversion factors

WRAP Self-assessment Review for Food and Drink Manufacturers 28
1 IntroductionHome 2 What is wastereally costingyou?
3 Calculate thecost of waste
4 Benchmarkingand KPIs
5 Make anaction plan
6 Cost of wastecase study
7 Furtherinformation
Appendices
To convert from to multiply by
kip per square inch (ksi) megapascal (MPa) 6.894757
pound per square foot (psf) kilogram per square metre (kg/m2) 4.8824
pound per square foot (psf) pascal (Pa) 47.88
pound per square inch (psi) pascal (Pa) 6,894.757
pound per square inch (psi) megapascal (MPa) 0.00689476
Pressure or stress conversion factors
To convert from to multiply by
pound (lb) kilogram (kg) 0.4535924
ton (2,000 lb) kilogram (kg) 907.1848
grain kilogram (kg) 0.0000648
Mass conversion factors
To convert from to use the equation
degree Fahrenheit (°F) degree Celsius (°C) tC = (tF – 32)/1.8
degree Fahrenheit (°F) kelvin (K) tK = (tF + 459.7)/1.8
kelvin (K) degree Celsius (°C) tC = tK – 273.15
Temperature conversion factors

WRAP Self-assessment Review for Food and Drink Manufacturers 29
1 IntroductionHome 2 What is wastereally costingyou?
3 Calculate thecost of waste
4 Benchmarkingand KPIs
5 Make anaction plan
6 Cost of wastecase study
7 Furtherinformation
Appendices
Appendix C Walk-around sheets
Issue ✓ X ? If you answered… Comments/Quantities/Costs
Are materials ✓ What happens to defective or inspected damaged materials? How are they on arrival? damaged? Could this be prevented?
Are raw materials ? Do they frequently get bruised/stored crushed/go out of date before they appropriately? have the opportunity to be used?
What happens to ? If residue or hard-to-get-atpart-containers of ingredients are left in a container, raw materials? what happens to them? Are they
disposed of or washed into the effluent stream, where a bit of extraeffort would save you ingredients and disposal costs?
Do raw materials ✓ How is this managed? Are there have a shelf-life? any records of the amounts which are
wasted owing to expired shelf-life?
Are samples taken ? What is the purpose? Quality or and, if so, how temperature control? Is too much much and for taken? How is it disposed of?what purpose?
Are good quality ✓ The demands of customers for a off cuts of raw food certain size of product can lead to materials re-used, otherwise good quality whole productwhere possible, in or off cuts being wasted – at aother products for substantial cost. Try discussing a retail outlets? change in specification with the
customer and/or find additional customers with less stringent specifications.
Raw materials
The following sheets offer guidance on the issues you need to check when conducting a walk-around to identify sources of waste and areas for improved waste management. Blanklines are left to enable you to tailor the sheets to your organisation.

WRAP Self-assessment Review for Food and Drink Manufacturers 30
1 IntroductionHome 2 What is wastereally costingyou?
3 Calculate thecost of waste
4 Benchmarkingand KPIs
5 Make anaction plan
6 Cost of wastecase study
7 Furtherinformation
Appendices
Issue ✓ X ? If you answered… Comments/Quantities/Costs
Are materials ✓ How? Is a record kept of theseweighed or figures?measured?
Does spillage occur ✓ Is this a regular spill or a one-off when materials occurrence? Can you measure how are transferred? much is being spilled and roughly
what this spill costs?
Are there wastes ✓ Can these be re-used in any way, from preparation such as animal feed, and if not are (peel, trimmings, they disposed off correctly in line bones, etc)? with the Animal By-Product
Regulations (ABPR)?
Can you avoid ✓ You may be able to fix this problem breakages and easily with low-cost measures. It is damage by improving best to calculate the cost of waste storage and handling caused by damages and weigh this techniques up against any new purchases.(especially after value has been added by processing)?
Are products ✓ Is it possible to provide protection frequently damaged to the products to minimise damage during the production in the production process?process?
Can you plan ? All losses cost you money in production to materials and waste disposal costs. minimise changeover If you can reduce wastes, do.losses?
Do you know what X Establish the total material losses causes the most for the process. Compare these product damage? losses with utilisation rates to find
the relative importance of process and materials handling losses.
Is there any ✓ Excellent; re-use is always betterreprocessing of than recycling.materials?
Is there any area ✓ Can you reduce this by loss (e.g. of sheet reprogramming machines to cut materials)? closer or changing product shape?
Are materials left ✓ If so, what happens to them? over at the end of Refer to the waste hierarchy for the a batch? best option.
Is there wastage If so, what happens? How could during the start-up this be avoided?of the process?
Materials management

WRAP Self-assessment Review for Food and Drink Manufacturers 31
1 IntroductionHome 2 What is wastereally costingyou?
3 Calculate thecost of waste
4 Benchmarkingand KPIs
5 Make anaction plan
6 Cost of wastecase study
7 Furtherinformation
Appendices
Issue ✓ X ? If you answered… Comments/Quantities/Costs
Do prepared ✓ How is this managed? materials have a Does wastage ever occur?shelf-life?
Are materials ✓ Could this be improved by a simple wasted or damaged action such as reducing the speed? in transfers within Fewer units produced per hour maythe process? be more acceptable at a higher
quality rate.
Are there any ✓ Could this be improved by a conveyor or transfer simple action such as reducing the losses? speed? Fewer units produced per
hour may be more acceptable at a higher quality rate.
Are materials wasted ✓ What happens to materials left in during cleaning of containers or pipework after transfer containers/ transfer? Could a method such as pipework? pigging reduce waste?
Materials management (continued)

WRAP Self-assessment Review for Food and Drink Manufacturers 32
1 IntroductionHome 2 What is wastereally costingyou?
3 Calculate thecost of waste
4 Benchmarkingand KPIs
5 Make anaction plan
6 Cost of wastecase study
7 Furtherinformation
Appendices
Issue ✓ X ? If you answered… Comments/Quantities/Costs
Are raw material ✓ Are they, in fact, returned?containers designed to be returned to the supplier?
Are there designated ✓ Could this packaging be reduced, disposal routes for re-used or recycled?transit packaging(e.g. pallets, slip-sheets, shrink-wrap)?
Are raw material X If not, could they be used in containers re-used this way?for transporting materials within the process?
Is raw material ✓ Is it, in fact, separated for packaging recyclable? recycling?
Do empty raw ✓ Could a change in practices material containers prevent this from occurring?have ingredient Would more staff training help? residues in them?
Can you find ways ✓ This will require a bit of thought of minimising and discussion. Could you all packaging with both benefit?suppliers and customers?
Could you re-use ? Re-use is always more any packaging for cost-effective and environmentally your products, friendly than recycling or disposal.where appropriate, or elsewhere in the workplace?
Is the packaging ✓ Making changes to the way that over-engineered for final products are packaged can your requirements? substantially reduce your costs.
Is packaging rejected ✓ Can anything be done to reduce during the start-up this? Watch the process.phase of the packaging process?
Don’t just think of ? Can it be re-used, returned to the product packaging. supplier, or recycled?Do you know what happens to the packaging of the product packaging?
Packaging
Packaging is paid for twice – once to buy it and again to dispose of it.
WRAP Self-assessment Review for Food and Drink Manufacturers 33
1 IntroductionHome 2 What is wastereally costingyou?
3 Calculate thecost of waste
4 Benchmarkingand KPIs
5 Make anaction plan
6 Cost of wastecase study
7 Furtherinformation
Appendices
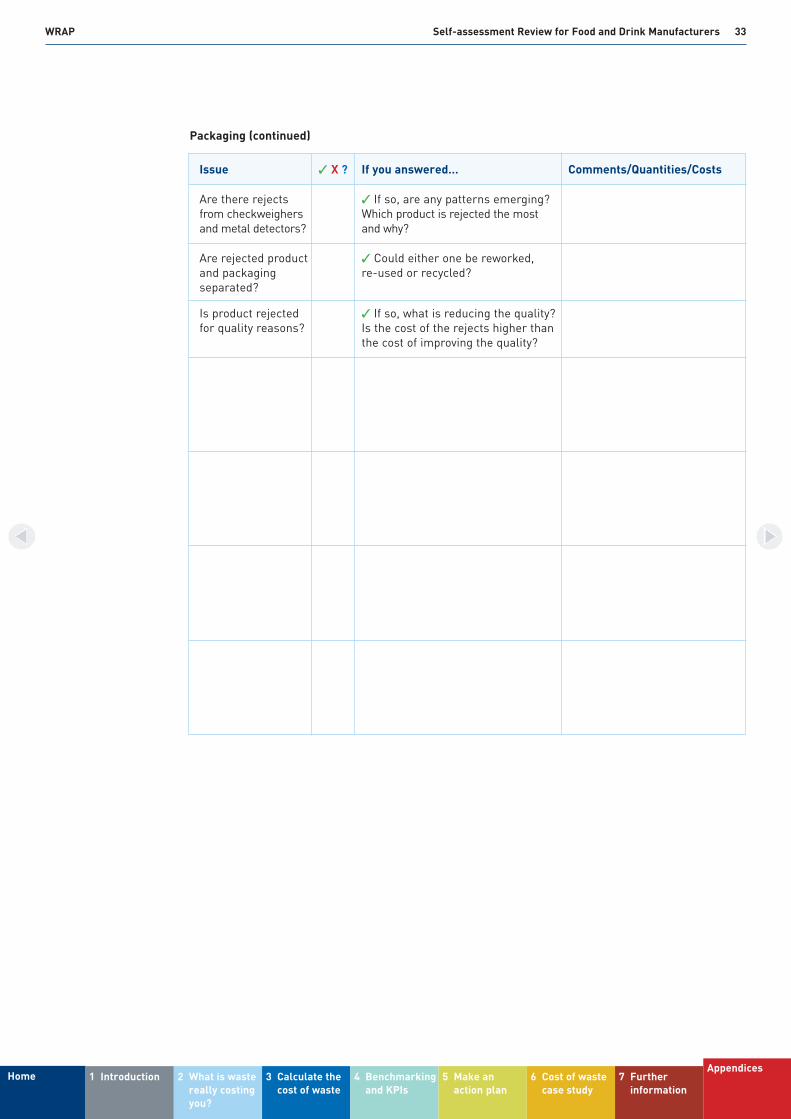
Issue ✓ X ? If you answered… Comments/Quantities/Costs
Are there rejects ✓ If so, are any patterns emerging? from checkweighers Which product is rejected the mostand metal detectors? and why?
Are rejected product ✓ Could either one be reworked, and packaging re-used or recycled?separated?
Is product rejected ✓ If so, what is reducing the quality? for quality reasons? Is the cost of the rejects higher than
the cost of improving the quality?
Packaging (continued)
WRAP Self-assessment Review for Food and Drink Manufacturers 34
1 IntroductionHome 2 What is wastereally costingyou?
3 Calculate thecost of waste
4 Benchmarkingand KPIs
5 Make anaction plan
6 Cost of wastecase study
7 Furtherinformation
Appendices
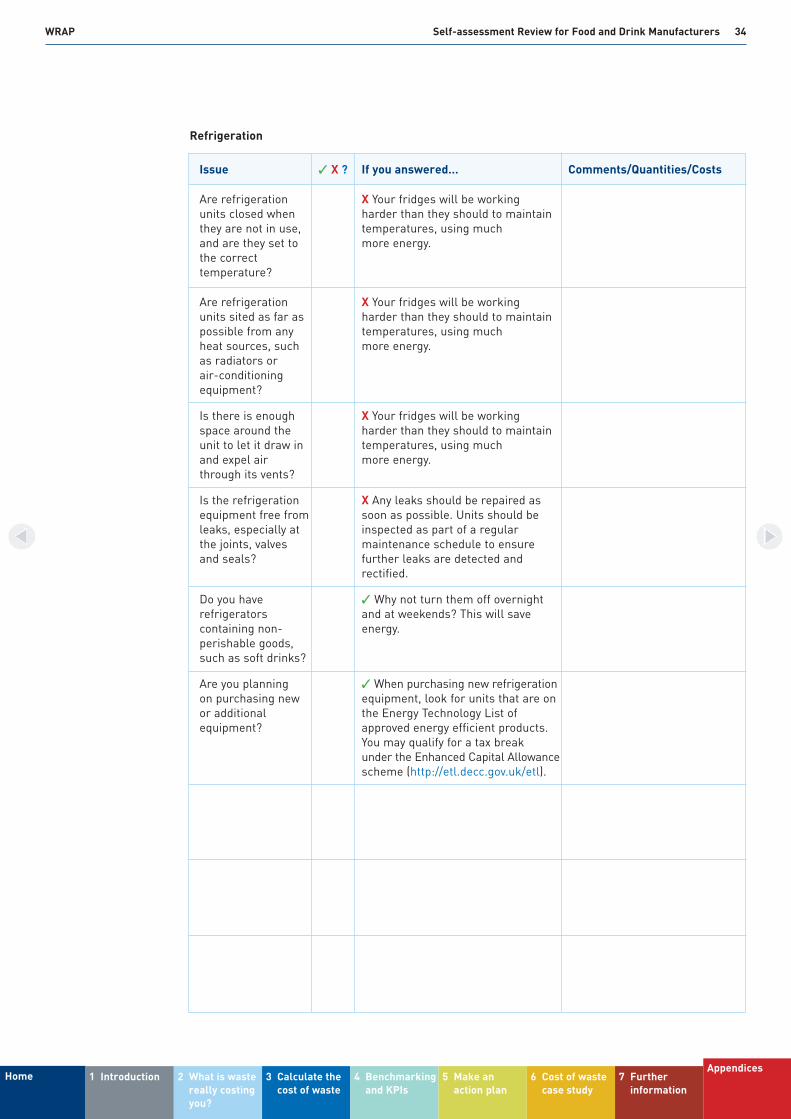
Issue ✓ X ? If you answered… Comments/Quantities/Costs
Are refrigeration X Your fridges will be working units closed when harder than they should to maintain they are not in use, temperatures, using much and are they set to more energy.the correct temperature?
Are refrigeration X Your fridges will be working units sited as far as harder than they should to maintainpossible from any temperatures, using much heat sources, such more energy.as radiators or air-conditioning equipment?
Is there is enough X Your fridges will be working space around the harder than they should to maintainunit to let it draw in temperatures, using much and expel air more energy.through its vents?
Is the refrigeration X Any leaks should be repaired asequipment free from soon as possible. Units should be leaks, especially at inspected as part of a regular the joints, valves maintenance schedule to ensure and seals? further leaks are detected and
rectified.
Do you have ✓ Why not turn them off overnight refrigerators and at weekends? This will save containing non- energy.perishable goods, such as soft drinks?
Are you planning ✓ When purchasing new refrigerationon purchasing new equipment, look for units that are on or additional the Energy Technology List of equipment? approved energy efficient products.
You may qualify for a tax break under the Enhanced Capital Allowance scheme (http://etl.decc.gov.uk/etl).
Refrigeration
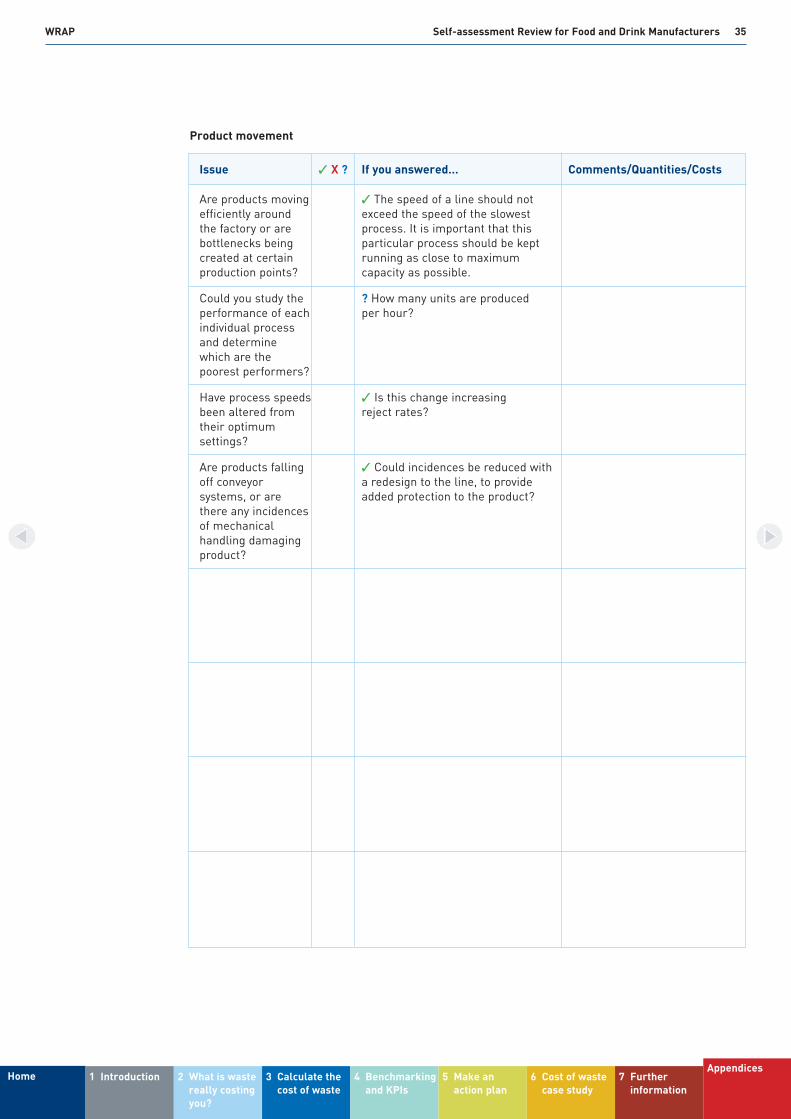
WRAP Self-assessment Review for Food and Drink Manufacturers 35
1 IntroductionHome 2 What is wastereally costingyou?
3 Calculate thecost of waste
4 Benchmarkingand KPIs
5 Make anaction plan
6 Cost of wastecase study
7 Furtherinformation
Appendices
Issue ✓ X ? If you answered… Comments/Quantities/Costs
Are products moving ✓ The speed of a line should notefficiently around exceed the speed of the slowestthe factory or are process. It is important that this bottlenecks being particular process should be kept created at certain running as close to maximum production points? capacity as possible.
Could you study the ? How many units are produced performance of each per hour?individual process and determine which are the poorest performers?
Have process speeds ✓ Is this change increasing been altered from reject rates?their optimum settings?
Are products falling ✓ Could incidences be reduced with off conveyor a redesign to the line, to provide systems, or are added protection to the product?there any incidences of mechanical handling damaging product?
Product movement

WRAP Self-assessment Review for Food and Drink Manufacturers 36
1 IntroductionHome 2 What is wastereally costingyou?
3 Calculate thecost of waste
4 Benchmarkingand KPIs
5 Make anaction plan
6 Cost of wastecase study
7 Furtherinformation
Appendices
Issue ✓ X ? If you answered… Comments/Quantities/Costs
Are employees X Conduct resource awareness trained to understand presentations to demonstrate to all the effects of their members of staff the true costs of actions? waste. If they make savings, you
could measure the amount and then split this between staff as a bonus, donate it to charity, or use it to improve staff facilities.
Do you run staff X Put up posters to remind staff of awareness what they can do to reduce resource campaigns? use (e.g. switching lights off).
Suitable posters are available free from the Carbon Trust (www.carbontrust.co.uk) and Recycle Now (www.recyclenow.com).
Do you have a team X Set up a resource efficiency team of people responsible with members from all levels and for environmental departments. Involve the relevant issues? people both inside and outside the
company (e.g. purchasing manager, waste manager and suppliers).
Other measures

WRAP Self-assessment Review for Food and Drink Manufacturers 37
1 IntroductionHome 2 What is wastereally costingyou?
3 Calculate thecost of waste
4 Benchmarkingand KPIs
5 Make anaction plan
6 Cost of wastecase study
7 Furtherinformation
Appendices
Issue ✓ X ? If you answered… Comments/Quantities/Costs
Is ingredient water ✓ Does cooking/evaporation change used and how is moisture content, and how can this this measured? be estimated?
Could you make ? Water companies will often assume everyone aware of that the amount of water entering water costs, the premises leaves as effluent. especially the Check the bills to make sure that difference between you are paying only for what you are purchase and disposing of; consider metering effluent disposal discharges if there are large costs? evaporative losses or water is being
incorporated into the product. Where a large quantity of water is consumed in the production process, consider installing sub-metering to identify individual area efficiency.
Is the water supply X If you’re not using them, why notturned off to turn it off and save water.processes that are not operating?
Have you checked ✓ Repair all leaks as soon as for leaks in the possible, even dripping taps, as this water system? will save you water and money
instantly. Check your water meter regularly to help identify whether you have any leaks. If the meter is running even when the plant is closed, you probably have a leak.
Could you set hot ✓ The water will retain its heat for water controls to that last hour and you’ll savestop heating one on energy.hour before the end of daily work?
Do you know the ? Discharging wastewater to effluent quality of wastewater streams can be wasteful; in some for processes? cases this water may be of
sufficiently high quality to be re-used.
Can you reduce the ? Could you treat effluent effectively strength and volume on site?of your effluent, thus reducing effluent treatment and disposal charges?
Have you fitted flush X Remember you may qualify for controls to urinal Enhanced Capital Allowance systems in all men’s assistance if the products and toilets? processes purchased appear on the
Water Technology List (www.hmrc.gov.uk/capital-allowances/fya/water.htm).
Water

WRAP Self-assessment Review for Food and Drink Manufacturers 38
1 IntroductionHome 2 What is wastereally costingyou?
3 Calculate thecost of waste
4 Benchmarkingand KPIs
5 Make anaction plan
6 Cost of wastecase study
7 Furtherinformation
Appendices
Issue ✓ X ? If you answered… Comments/Quantities/Costs
Have you installed X Remember you may qualifywater saving devices for Enhanced Capital Allowance into older toilet assistance if the products and cisterns where processes purchased appear on the possible (e.g. hippo Water Technology List bags saving 2 litres (www.hmrc.gov.uk/capital-per flush)? allowances/fya/water.htm).
Have you fitted X If hoses are just left running, you trigger controls to will be pouring water and money hosepipes used in down the drain.clean-down procedures?
Is the load on the ✓ If so, do you keep a record of effluent treatment monthly figures and are there any plant (ETP) abnormalities?measured?
Are there screening ? If so, what are they, and how are wastes or other they disposed of?liquid wastes from the ETP?
Are the effluent ? Do you do anything with this properties information?(suspended solids/ chemical oxygen demand) measured?
Water (continued)
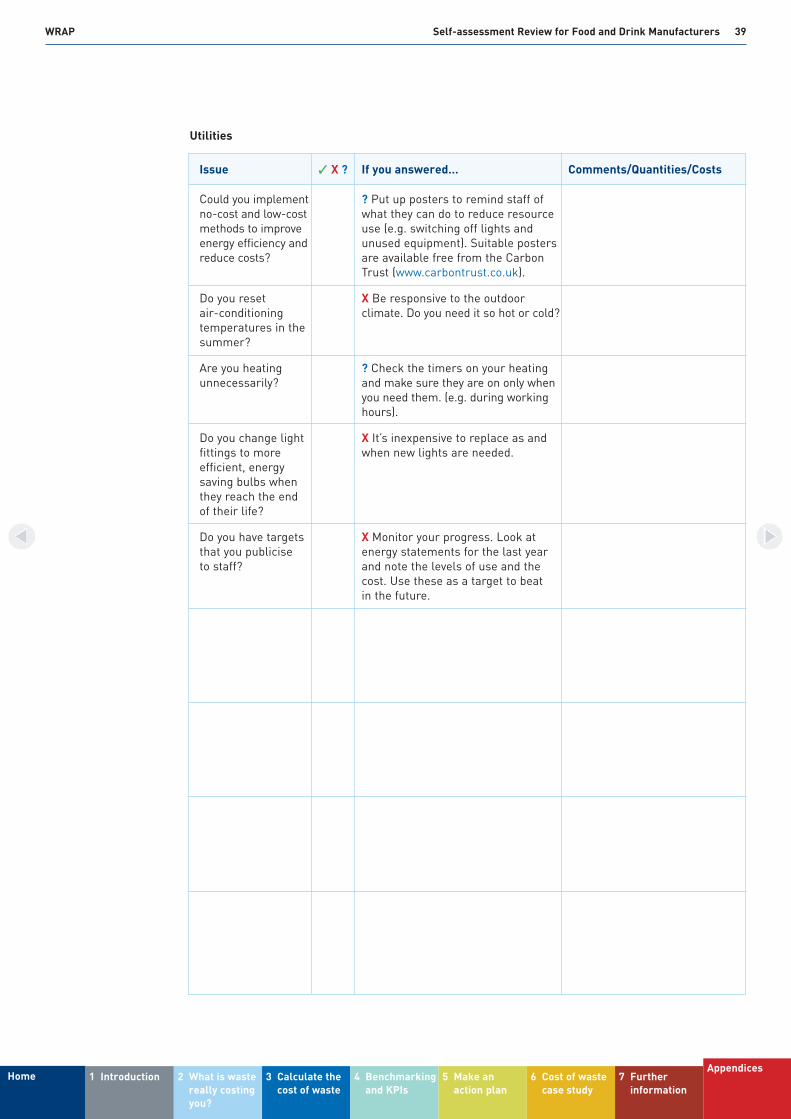
WRAP Self-assessment Review for Food and Drink Manufacturers 39
1 IntroductionHome 2 What is wastereally costingyou?
3 Calculate thecost of waste
4 Benchmarkingand KPIs
5 Make anaction plan
6 Cost of wastecase study
7 Furtherinformation
Appendices
Issue ✓ X ? If you answered… Comments/Quantities/Costs
Could you implement ? Put up posters to remind staff of no-cost and low-cost what they can do to reduce resource methods to improve use (e.g. switching off lights and energy efficiency and unused equipment). Suitable posters reduce costs? are available free from the Carbon
Trust (www.carbontrust.co.uk).
Do you reset X Be responsive to the outdoor air-conditioning climate. Do you need it so hot or cold?temperatures in the summer?
Are you heating ? Check the timers on your heating unnecessarily? and make sure they are on only when
you need them. (e.g. during working hours).
Do you change light X It’s inexpensive to replace as andfittings to more when new lights are needed.efficient, energy saving bulbs when they reach the end of their life?
Do you have targets X Monitor your progress. Look at that you publicise energy statements for the last year to staff? and note the levels of use and the
cost. Use these as a target to beat in the future.
Utilities

WRAP Self-assessment Review for Food and Drink Manufacturers 40
1 IntroductionHome 2 What is wastereally costingyou?
3 Calculate thecost of waste
4 Benchmarkingand KPIs
5 Make anaction plan
6 Cost of wastecase study
7 Furtherinformation
Appendices
Issue ✓ X ? If you answered… Comments/Quantities/Costs
Did you shop around X Is there a better deal out there for local waste your business? Look for other waste contractors and contractors on find the best option? http://recycleatwork.wrap.org.uk/
Is it possible to X If not, why not?rationalise the number of waste collections or waste bins that your business uses on aweekly or monthly basis?
Do you recycle? X Where possible, consider segregation for wastes that are recyclable and may offer lower collection and disposal costs.
Are bins clearly X When segregating wastes, ensure labelled? that the desired contents of each bin
are clear to staff through posters or colour-coding of bins.
Do you ensure that X You could be paying more than you any inactive waste need to. By contaminating all your streams are waste, you will have to pay the segregated to ensure hazardous waste price to dispose of that the correct every single tonne.landfill tax tariff is applied?
Are you careful to X By smart ordering, you can avoid order only the having to throw away unused products.ingredients needed for the production process?
Could you talk to ? The negotiating power of a collective your neighbours to of companies is greater than that of see what waste the individual.management practices they have implemented and which local waste contractor they are using?
Is finished product ✓ Can you reduce this by more tightly written off (e.g. controlled management?cancelled orders, out of shelf-life)?
Are materials ✓ Are they actually recycled?collected separately for recycling?
Are there other ✓ What happens to each sources of waste waste stream?(e.g. canteen, offices, staff facilities)?
Waste
We hope that you have found this guide helpful on your route to greater resource efficiency. Don’t forget that WRAPis here to help you to improve resource efficiency. Visit the website at www.wrap.org.uk or contact the WRAPResource Efficiency Helpline on 0808 100 2040.
While we have tried to make sure this guide is accurate, we cannot accept responsibility or be held legally responsible for any loss or damage arisingout of or in connection with this information being inaccurate, incomplete or misleading. This material is copyrighted. You can copy it free of charge as long as the material is accurate and not used in a misleading context. You must identify the source of the material and acknowledge our copyright.You must not use material to endorse or suggest we have endorsed a commercial product or service. For more details please see our terms andconditions on our website at www.wrap.org.uk
Waste & ResourcesAction Programme
www.wrap.org.uk/brehub
The Old Academy21 Horse FairBanbury, OxonOX16 0AH
March 2013
Tel: 01295 819 900Fax: 01295 819 911Email: [email protected]
Resource Efficiency Helpline:0808 100 2040
1 IntroductionHome 2 What is wastereally costingyou?
3 Calculate thecost of waste
4 Benchmarkingand KPIs
5 Make anaction plan
6 Cost of wastecase study
7 Furtherinformation
Appendices