business results for the fiscal year ended september 30, 2013 · business results for the fiscal...
TRANSCRIPT

Business Results for the Fiscal Year Ended September 30, 2013
November 22, 2013Hirofumi Imai,
President and Chief Executive Officer
Fuji Pharma Co., Ltd.(4554/TSE1)

Table of Contents
3-456
Summary of FY9/13 Financial Results ・・・・・・ ・・・・・・ ・・・・・・ ・・・・・・ ・・・・・・ ・・・ ・・・・・・ ・・ ・・Sales by Therapeutic CategorySales of Major Products 6
789
Sales of Major ProductsSales by Medical Field and Route of AdministrationAcute Medical Care: Sales TrendlineAcute Medical Care: Sales Trendline for DPC based Hospitals 9
101112
Acute Medical Care: Sales Trendline for DPC-based HospitalsMedical Care for Women: Sales TrendlineSummary of FY9/13 Balance SheetsSummary of FY9/13 Statements of Cash Flows 12
13-1415
Summary of FY9/13 Statements of Cash Flows
FY9/14 Forecast ・・・・・・・・・・・・・・・・・・・・・・・・・・・・・・・・・・・・・・・・・・・・・・・・・・・・・・・・・・・・・・・・・・Sales Forecast by Therapeutic Category and Medical Field 15
16
17-18
Sales Forecast by Therapeutic Category and Medical FieldSales Forecast for Major Products
FY9/14 Highlights of Medium-term Business Plan ・・・・・・・・・・・・・・・・・・・・・・・・・・・・・・・・・・・・・・ 17 1819
20
FY9/14 Highlights of Medium term Business Plan Acute Medical Care:
Release of Biosimilar Drugs and Transfer of Sales Rights of Contrast MediaMedical Care for Women: 20
21
Medical Care for Women: Start Selling New Drugs; Transfer of Marketing Approval and Sales Rights
Business Outline / Business Performance Trendlines
Copyright ©2012‐2013 Fuji Pharma Co.,Ltd. All rights reserved.
23Overview of OLIC (Thailand) Limited and Toyama Research and Development Center

Summary of FY9/13 Financial Results
Sales of diagnostic drugs increased by 8.8%, or ¥739 million YoYSales of hormone drugs increased by 13.1%, or ¥945 million YoYPerformance of OLIC (Thailand) Limited is reflected from January 2013
[Reference]FY9/13 vs FcstFY9/12 (Non-consolidated) FY9/13 (Consolidated)
1H 2H Full Year 1H 2H Full Year Fcst Change inAmount
9,779 11,741 21,520 11,996 13,178 25,174 25,975 -801
4,267 5,049 9,318 5,243 5,698 10,941 - -
G M i 43 6% 43 0% 43 3% 43 7% 43 2% 43 5%
( million)¥
Net Sales
Gross Profit
Gross Margin 43.6% 43.0% 43.3% 43.7% 43.2% 43.5% - -
3,293 3,278 6,571 3,634 4,045 7,679 - -
SG&A Margin 33.7% 27.9% 30.5% 30.3% 30.7% 30.5% - -
974 1,772 2,746 1,609 1,652 3,261 3,575 -314
SG&A Expenses
Operating Income
Operating Income Margin 10.0% 15.1% 12.8% 13.4% 12.5% 13.0% 13.8%
977 1,721 2,698 1,734 1,642 3,376 3,540 -164
Ordinary Income Margin 10.0% 14.7% 12.5% 14.5% 12.5% 13.4% 13.6%
313 1,057 1,370 1,088 980 2,068 2,190 -122
Ordinary Income
Net Income
Net Income Margin 3.2% 9.0% 6.4% 9.1% 7.4% 8.2% 8.4%
6.3% 8.6% 9.2%
97.09 146.48 155.10 -9
507 1,185 1,693 2,138 1,029 3,167Capital Expenditure
ROE
EPS (Yen)
507 1,185 1,693 2,138 1,029 3,167602 608 1,211 587 619 1,206173 256 430 211 189 400706 597 1,303 594 686 1,280
R&D Expenses Ratio 7 2% 5 1% 6 1% 5 0% 5 2% 5 1%
Capital Expenditure
Depreciation
Leased Equipment
R&D Expenses
Copyright ©2012‐2013 Fuji Pharma Co.,Ltd. All rights reserved.
3
R&D Expenses Ratio 7.2% 5.1% 6.1% 5.0% 5.2% 5.1%

Summary of FY9/13 Financial Results
YoY Changes in Non-consolidated Operating IncomeIncrease in gross profit due to higher net sales
Consolidated Operating Income FY9/13 Forecast vs. Actual
and other factors
Decrease in R&D expenses
Increase in personnel costs
Decrease in gross profit due to sales shortfalland other factors
Inability to effectively direct R&D expenses or termination of R&D etc
( million)¥
Increase in other SG&A expensestermination of R&D, etc.
Increase in other SG&A expenses
Profit shortfall at subsidiary( million)¥
3,417
+233,575 3,261-393
-363-216+167
+1,346
-338 -131+258
Decrease
expenses
Increasecosts
2,746
Increase
,
Increaseexpenses
Profit shortsubsidiary
Decrease i
Inability todirect R&
D
Terminatio
Increase inSG
&A expee in R&
D
s in personnel
in gross profit
in other SG&
As tfall at
in gross profit
o effectively D
expenses
on of R&D
, etc.
n other enses
FY9/12 FY9/13 FY9/13 FY9/13Actual Actual Forecast Actual
Copyright ©2012‐2013 Fuji Pharma Co.,Ltd. All rights reserved.
4

Sales by Therapeutic Category
1H 2H Full Year 1H 2H Full Year Amount Ratio
Diagnostic Drugs 6,983 8,494 8,978 3,803 4,616 8,419 4,622 4,535 9,158 739 8.8%
Hormone Drugs 4 815 5 403 6 704 3 188 4 001 7 189 3 728 4 406 8 134 945 13 1%
( million)¥YoY ChangeFY9/12 FY9/13
FY9/09 FY9/10 FY9/11
Hormone Drugs 4,815 5,403 6,704 3,188 4,001 7,189 3,728 4,406 8,134 945 13.1%
Circulatory Drugs 1,161 1,155 1,067 443 518 962 472 447 920 -42 -4.3%
in v itro Diagnostics 1,124 999 810 480 375 856 473 329 802 -54 -6.2%
Antibiotics & Chemotherapeutics 646 680 752 353 372 726 356 437 793 67 9.3%
Urogenital & Genital Organ Drugs 364 389 418 185 210 396 192 213 406 10 2.5%
Dermatological Preparations 288 297 314 132 153 285 135 154 289 4 1.4%
Others 1,814 2,277 2,577 1,190 1,493 2,684 1,579 1,862 3,441 757 28.2%
Total 17 198 19 698 21 623 9 779 11 740 21 520 11 560 12 387 23 948 2 428 11 3%Total 17,198 19,698 21,623 9,779 11,740 21,520 11,560 12,387 23,948 2,428 11.3%
CMO Business 436 790 1,226
Total 17,198 19,698 21,623 9,779 11,740 21,520 11,996 13,178 25,174 3,654 17.0%
Sales Breakdown by Therapeutic Category
Diagnostic Drugs
30,000(¥million) Sales Trendline by Therapeutic Category
CMO Business
Others
36.4%
3.2%1.6%
1.1%13.7%
4.9%Diagnostic Drugs
Hormone Drugs
Circulatory Drugs
in vitro Diagnostics
Antibiotics & ChemotherapeuticsFY9/13
Net Sales15 000
20,000
25,000Others
Dermatological Preparations
Urogenital & Genital Organ DrugsA tibi ti & Ch th ti
32.3%
3.7%3.2%
Antibiotics & Chemotherapeutics
Urogenital & Genital Organ Drugs
Dermatological Preparations
Others
CMO Business
Net Sales¥25,174 million
5,000
10,000
15,000 Antibiotics & Chemotherapeutics
in vitro Diagnostics
Circulatory Drugs
H D
Copyright ©2012‐2013 Fuji Pharma Co.,Ltd. All rights reserved.5
CMO Business
0FY9/09 FY9/10 FY9/11 FY9/12 FY9/13
Hormone Drugs
Diagnostic Drugs
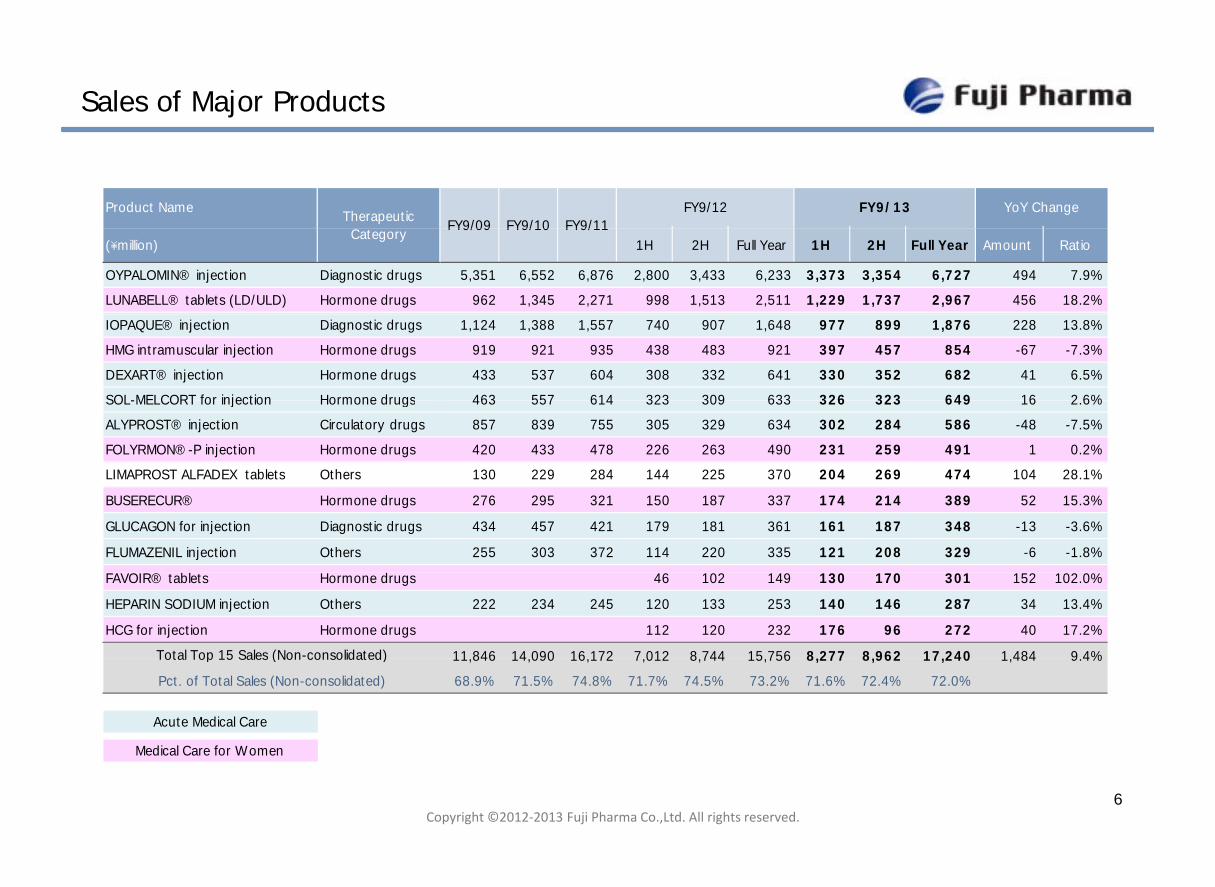
Sales of Major Products
Product Name YoY ChangeFY9/12 FY9/13FY9/09 FY9/10 FY9/11
TherapeuticC
( million)¥ 1H 2H Full Year 1H 2H Full Year Amount Ratio
OYPALOMIN® injection Diagnostic drugs 5,351 6,552 6,876 2,800 3,433 6,233 3,373 3,354 6,727 494 7.9%
LUNABELL® tablets (LD/ULD) Hormone drugs 962 1,345 2,271 998 1,513 2,511 1,229 1,737 2,967 456 18.2%
FY9/09 FY9/10 FY9/11Category
IOPAQUE® injection Diagnostic drugs 1,124 1,388 1,557 740 907 1,648 977 899 1,876 228 13.8%
HMG intramuscular injection Hormone drugs 919 921 935 438 483 921 397 457 854 -67 -7.3%
DEXART® injection Hormone drugs 433 537 604 308 332 641 330 352 682 41 6.5%
SOL-MELCORT for injection Hormone drugs 463 557 614 323 309 633 326 323 649 16 2 6%SOL-MELCORT for injection Hormone drugs 463 557 614 323 309 633 326 323 649 16 2.6%
ALYPROST® injection Circulatory drugs 857 839 755 305 329 634 302 284 586 -48 -7.5%
FOLYRMON®-P injection Hormone drugs 420 433 478 226 263 490 231 259 491 1 0.2%
LIMAPROST ALFADEX tablets Others 130 229 284 144 225 370 204 269 474 104 28.1%
BUSERECUR® Hormone drugs 276 295 321 150 187 337 174 214 389 52 15.3%
GLUCAGON for injection Diagnostic drugs 434 457 421 179 181 361 161 187 348 -13 -3.6%
FLUMAZENIL injection Others 255 303 372 114 220 335 121 208 329 -6 -1.8%
FAVOIR® tablets Hormone drugs 46 102 149 130 170 301 152 102.0%
HEPARIN SODIUM injection Others 222 234 245 120 133 253 140 146 287 34 13.4%
HCG for injection Hormone drugs 112 120 232 176 96 272 40 17.2%
11 846 14 090 16 172 7 012 8 744 15 756 8,277 8,962 17,240 1 484 9 4%Total Top 15 Sales (Non-consolidated) 11,846 14,090 16,172 7,012 8,744 15,756 8,277 8,962 17,240 1,484 9.4%
68.9% 71.5% 74.8% 71.7% 74.5% 73.2% 71.6% 72.4% 72.0%
Acute Medical Care
Total Top 15 Sales (Non consolidated)
Pct. of Total Sales (Non-consolidated)
Copyright ©2012‐2013 Fuji Pharma Co.,Ltd. All rights reserved.6
Medical Care for W omen

Sales by Medical Field and Route of Administration
Breakdown by Medical Field YoY ChangeFY9/09 FY9/10 FY9/11 FY9/12 FY9/13
Sales Breakdown by Medical Fieldy
( million)¥ Amount Ratio
Acute Medical Care 10,826 12,772 13,453 12,796 14,059 1,263 9.9%
Medical Care for W omen 4,733 5,240 6,480 6,776 7,969 1,193 17.6%
FY9/09 FY9/10 FY9/11 FY9/12 FY9/13
Others7.6%
CMO Business5.1%
FY9/13
Others 1,639 1,686 1,690 1,948 1,919 -29 -1.5%
Total (Non-consolidated) 17,198 19,698 21,623 21,520 23,948 2,428 11.3%
CMO Business (OLIC) 1,226
Acute Medical Care
55.8%
Medical Care for Women
31.7%
Net Sales¥25,174 million
Total (Consolidated) 17,198 19,698 21,623 21,623 25,174 3,551 16.4%
Sales Breakdown by Route of AdministrationBreakdown by Route ofAdministration
( million)¥ Amount Ratio
Parenteral Injections 12,481 14,329 15,090 14,442 15,463 1,021 7.1%
YoY ChangeFY9/09 FY9/10 FY9/11 FY9/12 FY9/13
External
in vitro Diagnostics,
Others3.3%
CMO Business
Sales Breakdown by Route of Administration
Oral Medications 2,520 3,219 4,547 5,053 6,416 1,363 27.0%
External Applications 1,038 1,150 1,139 1,123 1,243 120 10.7%
in v itro Diagnostics, Others 1,159 1,045 847 902 825 -77 -8.5%
T t l (N lid t d) 17 198 19 698 21 623 21 520 23 948 2 428 11 3%
Oral Medications
25 5%
e aApplications
4.9%
CMO Business5%
FY9/13Net Sales
¥25,174 millionTotal (Non-consolidated) 17,198 19,698 21,623 21,520 23,948 2,428 11.3%
CMO Business (OLIC) 1,226
Total (Consolidated) 17,198 19,698 21,623 21,520 25,174 3,654 17.0%
Parenteral Injections
61.4%
25.5% ¥25,174 million
Copyright ©2012‐2013 Fuji Pharma Co.,Ltd. All rights reserved.7

Acute Medical Care: Sales Trendline
Sales Breakdown by Acute Medical Care
14 000
16,000(¥million) Sales Trendline for Acute Medical Care
Others31.5%
FY9/13303 575242
4 150
4,4734,593
4,3884,431
10,000
12,000
14,000
その他Others
Contrast Media62 7%
Biosimilar1.7%
FY9/13Net Sales in
Acute Medical Care¥14,059 million
6 5498,036 8,556 8,058 8,810
127
262 303 348 5754,150
4,000
6,000
8,000 バイオ
抗がん剤Anti-cancer Agents
Biosimilar
62.7%Anti-cancer
Agents 4.1%
6,549
0
2,000 造影剤Contrast Media
FY9/09 FY9/10 FY9/11 FY9/12 FY9/13
Copyright ©2012‐2013 Fuji Pharma Co.,Ltd. All rights reserved.
8

Acute Medical Care: Sales Trendline for DPC-based Hospitals
15,000
(¥million) Acute Medical Care-related Shipments by Sales Channel
医薬品卸 販売委託1 910
8,000
Deliveries to DPC-based Hospitals out of Shipments via Our Own Channel
DPC その他
(¥million)
Consignment sale
Drug wholesaling
Others
5,144
6,053 6,285 5,487
6,280
9,000
12,000
2,254
2,089 1,895
1,619 1,910
6,000
5 6826,718 7,167 7,308 7,779
5,144
3,000
6,000
3,427 4,628
5,272 5,689 5,868
2,000
4,000
5,682
0
3,000
0 FY9/09 FY9/10 FY9/11 FY9/12 FY9/13FY9/09 FY9/10 FY9/11 FY9/12 FY9/13
85.8%87.8% 88.6%
89.5% 90.0%2,000
(Hospitals)DPC対象病院数 当社カバー率(納入ベース)
3,877 4,145 4,268 4,383
4,000
5,000 2,000
(¥thousand)(Hospitals) DPC採用軒数 1軒当たり平均納入額No. of HospitalsAdopting DPC System
Our Coverage Ratio on a Delivery Basis
No. of DPC Hospitals with Our Coverage
Average sales per Hospital
1 449 1 505 1 496
81.5%
80.0%
85.0%
1,000
1,500 3,280
2,000
3,000
4,000
1,000
1,500
1,282 1,391 1,449 1,505 1,496
70.0%
75.0%
0
500 1,045 1,194 1,272 1,333 1,339
0
1,000
,
0
500
Copyright ©2012‐2013 Fuji Pharma Co.,Ltd. All rights reserved.
9
FY9/09 FY9/10 FY9/11 FY9/12 FY9/13 FY9/09 FY9/10 FY9/11 FY9/12 FY9/13

Medical Care for Women: Sales Trendline
Sales Breakdown by Medical Care for Women8,000
(¥million) Sales Trendline for Medical Care for Women
Infertility Treatment
Drugs22.6%
Others23.4%
FY9/134961 020 1,456
2,421 2,640
3,1786,000
月経困難症治療剤
経口避妊剤
Dysmenorrhea Treatment Drugs
Oral Contraceptive
Endometriosis Treatment
Drugs7.9%
Oral Contraceptive
Drugs6.2%
FY9/13Net Sales in
Medical Care for Women
¥7,969 million495 530 588 571
628
1,675 1,695 1,789 1,8281,802
1814961,020 1,456
2,000
4,000経口避妊剤
不妊症治療剤
子宮内膜症治療剤
Oral Contraceptive Drugs
Infertility Treatment Drugs
Endometriosis 9%
Dysmenorrhea Treatment
Drugs39 9%
1,542 1,559 1,671 1,556 1,863
495 530 5
0
その他
FY9/09 FY9/10 FY9/11 FY9/12 FY9/13
Treatment Drugs
Others
39.9%
http://www.seiritsuu-navi.com
Copyright ©2012‐2013 Fuji Pharma Co.,Ltd. All rights reserved.
10

Summary of FY9/13 Balance Sheets
[Reference]
( million)¥FY9/12
(Non-consolidated)FY9/13
(Consolidated)
• Notes and accounts receivable-trade: ¥9,697 million
• Cash and deposits: ¥6,015 million
Term End Term End
22,828 23,772Current Assets
Assets
• Buildings and structures: ¥8,858 million• Machinery, equipment and vehicles:
¥9,949 million
8,642 15,366
Property , Plant and Equipment 7,242 10,506
Intangible Assets 718 4,105
Investments and Other Assets 682 753
Noncurrent Assets
• Notes and accounts payable-trade: ¥3,604 million
31,471 39,138
8,034 8,917
1 338 6 153
Liabilities
Total Assets
Current Liabilities
N t Li biliti 1,338 6,153
9,373 15,071
22,098 23,644
Net Assets
Noncurrent Liabilities
Total Liabilities
Shareholders’ Equity
-• Interest-bearing debt: ¥6,272 million
(Short-term loans payable: ¥933 million)(Long-term loans payable: ¥5,339 million)
Capital Stock 2,447 2,447
Capital Surplus 3,672 3,672
Retained Earnings 15,979 17,525
Treasury Stock 0 -0Treasury Stock -0 -0
-0 421
22,098 24,066
31,471 39,138
Accumulated Other Comprehensive Income
Total Net Assets
Total Liabilities and Net Assets
Copyright ©2012‐2013 Fuji Pharma Co.,Ltd. All rights reserved.11

Summary of FY9/13 Statements of Cash Flows
[Reference]
FY9/12(Non-consolidated)
FY9/13(Consolidated)
Full Year Full Year
( million)¥
Full Year Full Year1,171 3,630
2,325 3,3321,211 1,206Depreciation and Amortization
Net Cash Prov ided by (Used in) Operating Activ ities
(Major Breakdown)Income Before Income Taxes
207
-1,353 809
-1,355 546572 -1,320
p
Amortization of Goodwill
Decrease (Increase) in Notes and Accounts Receivable-Trade
Decrease (Increase) in InventoriesIncrease (Decrease) in Notes and Accounts Payable-Trade 572 1,320
-989 -1,36680 -6,601
-1,629 -2,779
Net Cash Prov ided by (Used in) Investing Activ ities(Major Breakdown)
Income Taxes Paid
Purchase of Property, Plant and Equipment
Increase (Decrease) in Notes and Accounts Payable Trade
• Phase II construction works on the No. 5 pharmaceutical plant
• R&D center1,725
-547
-3,386
835 3 743Net Cash Prov ided by (Used in) Financing Activ ities
Purchase of Intangible AssetsPurchase of Investments in Subsidiaries Resulting in Change in Scopeof Consolidation
Proceeds from Sales of Property, Plant and Equipment
• Purchase of subsidiary stock for acquisition of OLIC: ¥3,386 million
R&D center
-835 3,743
1,000 -1,0735,850
1 300 -510
Proceeds from Long-term Loans Payable
Repayment of Long term Loans Payable
Net Cash Prov ided by (Used in) Financing Activ ities
(Major Breakdown)Net Increase (Decrease) in Short-term Loans Payable
-1,300 -510-535 -522
5,260 5,676
5,676 6,521
Cash and Cash Equivalents at Beginning of Period
Cash and Cash Equivalents at End of Period
Repayment of Long-term Loans PayableCash Div idends Paid
Copyright ©2012‐2013 Fuji Pharma Co.,Ltd. All rights reserved.12
Free Cash Flows 1,251 -2,971

FY9/14 Forecast
Increase net sales in our core medical fields by ¥3.6 billion (Acute Medical Care: ¥2.2 billion, Medical Care for Women: ¥1.4 billion)
Establish the Diagnostic Imaging Drug Group and start selling “OPTIRAY® injection” in December 2013
St t lli f d i D b 2013 hi h ill b t f d th k ti l d lStart selling four drugs in December 2013, which will be transferred the marketing approval and sales rights from Shionogi & Co., Ltd.
Profits to be unchanged due to the impact of the April 2014 NHI drug price revisions, higher expenses of sales right transfer, and rising R&D expensesof sales right transfer, and rising R&D expenses
1H 2H Full Year 1H 2H Full Year Amount Ratio( million)¥
FY9/13 FY9/14 YoY Change
11,996 13,178 25,174 13,985 15,480 29,465 4,291 17.0%
1,609 1,652 3,261 1,410 2,040 3,450 189 5.8%
Operating Income Margin 13.4% 12.5% 13.0% 10.1% 13.2% 11.7% - -
Net Sales
Operating Income
1,734 1,642 3,376 1,370 2,015 3,385 9 0.3%
Ordinary Income Margin 14.5% 12.5% 13.4% 9.8% 13.0% 11.5% - -
1 088 980 2 068 825 1 245 2 070 2 0 1%
Ordinary Income
Net Income 1,088 980 2,068 825 1,245 2,070 2 0.1%
Net Income Margin 9.1% 7.4% 8.2% 5.9% 8.0% 7.0% - -
2,138 1,029 3,167 453 644 1,098 -2,069 -65.3%
Net Income
Capital Expenditure
587 619 1,206 656 782 1,439 233 19.3%
211 189 400 186 346 532 132 33.0%
594 686 1 280 997 837 1 835 555 43 4%
Lease Equipment
R&D Expenses
Depreciation
Copyright ©2012‐2013 Fuji Pharma Co.,Ltd. All rights reserved.13
594 686 1,280 997 837 1,835 555 43.4%
R&D Expenses Ratio 5.0% 5.2% 5.1% 7.1% 5.4% 6.2% - -
R&D Expenses

FY9/14 Forecast
YoY Changes in FY9/14 Consolidated Operating Income ForecastIncrease in gross profit due to higher net sales and other factors
Increase in R&D expenses
Increase in expenses of sales right transfer
Increase in other SG&A expenses
-555
Increase in subsidiary’s goodwill
3,450
-575+1,746
-355-73
Incre
Incresales
3,261,
Incr
Increexpe
Incregoodease in R
&D
e
ease in expens right transfe
ease in gross
ease in other Senses
ease in subsiddw
ill
FY9/13 FY9/14
xpenses
nses of erprofit
SG&
A
iary’s
Copyright ©2012‐2013 Fuji Pharma Co.,Ltd. All rights reserved.14
FY9/13Actual
FY9/14Forecast

Sales Forecast by Therapeutic Category and Medical Field
FY9/13 FY9/14
Forecast Amount Ratio( million)¥
YoY Change
Diagnostic Drugs 9,158 11,029 1,871 20.4%
Hormone Drugs 8,134 9,469 1,335 16.4%
Circulatory Drugs 920 1,037 117 12.7%
in vitro Diagnostics 802 786 -16 -2 0%in vitro Diagnostics 802 786 16 2.0%
Antibiotics & Chemotherapeutics 793 858 65 8.2%
Urogenital & Genital Organ Drugs 406 412 6 1.5%
Detmetological Preparations 289 257 -32 -11.1%
Others 3,441 3,773 332 9.6%
CMO Business (OLIC) 1,226 1,845 619 50.5%
Total 25,174 29,465 4,291 17.0%
FY9/13 FY9/14
Forecast Amount Ratio
Acute Medical Care 14,059 16,306 2,247 16.0%
( million)¥YoY Change
Acute Medical Care 14,059 16,306 2,247 16.0%
Medical Care for Women 7,969 9,358 1,389 17.4%
Others 1,919 1,959 40 2.1%
CMO Business (OLIC) 1,226 1,845 619 50.5%
Total 25,174 29,465 4,291 17.0%
Copyright ©2012‐2013 Fuji Pharma Co.,Ltd. All rights reserved.15

Sales Forecast for Major Products
Product Name FY9/13 FY9/14
( million)¥ Forecast Amount Ratio
YoY ChangeTherapeutic Category
OYPALOMIN® injection Diagnostic drugs 6,727 6,706 -21 -0.3%
LUNABELL® tablets (LD/ULD) Hormone drugs 2,967 3,640 673 22.7%
IOPAQUE® injection Diagnostic drugs 1,876 1,909 33 1.8%
HMG i t l i j ti H d 854 817 37 4 3%HMG intramuscular injection Hormone drugs 854 817 -37 -4.3%
DEXART® injection Hormone drugs 682 691 9 1.3%
SOL-MELCORT for injection Hormone drugs 649 664 15 2.3%
ALYPROST® injection Circulatory drugs 586 565 -21 -3.6%
FOLYRMON®-P injection Hormone drugs 491 514 23 4.7%
LIMAPROST ALFADEX tablets Others 474 506 32 6.8%
BUSERECUR® Hormone drugs 389 402 13 3.3%
GLUCAGON for injection Diagnostic drugs 348 315 -33 -9.5%j g g
FLUMAZENIL injection Others 329 343 14 4.3%
FAVOIR® tablets Hormone drugs 301 396 95 31.6%
HEPARIN SODIUM injection Others 287 291 4 1.4%
HCG for injection Hormone drugs 272 184 -88 -32 4%HCG for injection Hormone drugs 272 184 -88 -32.4%
17,240 17,954 714 4.1%
New Product 1,014 1,771 757 74.7%
Transferred Products 2,452 2,452
Total Top 15 Sales
Other Products 5,693 5,446 -247 -4.3%
CMO Business (OLIC) 1,226 1,845 619 50.5%
25,174 29,465 4,291 17.0%
M di l C f W
Total
Copyright ©2012‐2013 Fuji Pharma Co.,Ltd. All rights reserved.16
Acute Medical Care Medical Care for Women

FY9/14 Highlights of Medium-term Business Plan
● Central themeExpand existing core businesses and capitalize on new opportunities for creating new businesses for the future between now and our 50th anniversary in 2015businesses for the future between now and our 50th anniversary in 2015
(1) Focus resources on parenteral injections to upgrade operations in the Acute Medical Care sectorin the Acute Medical Care sector
❑Establish multi-parenteral injection production line, including production of new anticancer drugs and other multi-parenteral injections
❑Upgrade marketing capabilities for Filgrastim BS Syringe❑Transfer of license to sell in Japan OPTIRAY® injection, the non-ionic contrast media
(2) Become a leader in the field of Medical Care for Women❑Start clinical trials for new drugs for assisted reproductive technologies and biosimilar drugs
❑Start selling LUNABELL® tablets ULD for the treatment of dysmenorrhea
❑Transfer of marketing approval and sales rights for four brand drugs in the field of obstetrics and gynecology
(3) Become the largest contract pharmaceutical manufacturer i S th t A iin Southeast Asia
❑Build a new parenteral injection plant and a new warehouse at OLIC (Thailand) Limited
❑Prepare for the production and sale outside Japan of parenteral injections, including in the core contrast media category
Copyright ©2012‐2013 Fuji Pharma Co.,Ltd. All rights reserved.
17
contrast media category

FY9/14 Highlights of Medium-term Business Plan
35,000
(¥milion)「オプチレイR注」OPTIRAY® injection
1 88030,000
フィルグラスチムBS注
既存X線造影剤16,306 +16%
Filgrastim BS syringe
Existing X-ray contrast media
243
6701,880
25,000
急性期医療その他
「ルナベルR配合錠 」
14,059 Other items of acute medical care
LUNABELL® tablet
8,603
8,615
20,000「承継/移管ブランド薬」
経口避妊剤Acute Medical Care
Transferred brand drug
Oral contraceptive drug
5,213
5,14115,000 女性医療その他
その他
Acute Medical Care
Other items of medical care for women
Others
4 440496 706
5722,9673,640
10,000
そ 他
CMO事業(OLIC社)
Medical Care for Women
CMO business (OLIC)
1 8451,919 1,959
4,506 4,4405,000 7,969 9,358 +17%
CMO Business 50%
Copyright ©2012‐2013 Fuji Pharma Co.,Ltd. All rights reserved.
1,226 1,8450
18
CMO Business +50%
FY9/13 FY9/14

Acute Medical Care: Release of Biosimilar Drugs and Sales Right Transfer of Contrast Media
Released biosimilar drug Filgrastim BS Syringe 「F」
Transfer of sales rights of the non-ionic contrast media
OPTIRAY® injection fromin May 2013 OPTIRAY® injection from Mallinckrodt Japan Co. Ltd.
This product will be started selling in December 2013in December 2013
Copyright ©2012‐2013 Fuji Pharma Co.,Ltd. All rights reserved.
19

Medical Care for Women:Start Selling New Drugs; Transfer of Marketing Approval and Sales Rights
l d ® blReleased LUNABELL® Tablet ULD, ultra-low-dose estrogen progestin (LEP)
for treatment of dysmenorrhea in September 2013in September 2013
Transfer of marketing approval and sales rights for four drugs (for obstetrics and gynecology)from Shionogi & Co., Ltd. These drugs will be started selling in December 2013from Shionogi & Co., Ltd. These drugs will be started selling in December 2013
Transfer of marketing approval: LUTORAL® tablets 2mg, FLAGYL® vaginal tablets 250mgTransfer of sales rights: CLOMID® tablets 50mg, NORLUTEN® tablets 5mg
塩野義製薬より産科・婦人科4製剤の承継及び販売移管、12月販売開始
承継品目 「 ト Ⓡ錠2 「 ジ Ⓡ腟錠2 0承継品目:「ルトラールⓇ錠2mg」「フラジールⓇ腟錠250mg」
販売移管品目:「クロミッドⓇ錠50mg」「ノアルテンⓇ錠(5mg)」
Copyright ©2012‐2013 Fuji Pharma Co.,Ltd. All rights reserved.
20

Business Outline / Business Performance Trendlines
Management philosophies
“Contributing to healthy living by supplying outstanding pharmaceuticals” “The growth of the Company that is proportional to the development of its employees”
16.0%
18.0%
30,000
35,000
(¥million) 売上高 営業利益率 総資産経常利益率(ROA)Net Sales Operating Income Margin Return on Assets (ROA)
10.0%
12.0%
14.0%
20,000
25,000
,
4.0%
6.0%
8.0%
5 000
10,000
15,000
0.0%
2.0%
0
5,000
FY9/05 FY9/06 FY9/07 FY9/08 FY9/09 FY9/10 FY9/11 FY9/12 FY9/13(Consolidated)
FY9/14(Consolidated
f
Dec. 04 Jun 08Feb. 10Concluded contract to Jul 12
(Consolidated) forecast)
Feb. 09Jul. 11Listed on TSE 2nd Section / Apr. 06
Listed on JASDAQ Stock Exchange
Jun. 08Released new LUNABELL® tablets
Concluded contract to co-develop biosimilardrug with MOCHIDA PHARMACEUTICAL CO., LTD. May 13
Released biosimilar drug l 「
Jul. 12Listed on TSE 1st Section
Sep. 13Released LUNABELL®
tablets ULD
Oct. 12
Apr. 13Completed R&D center
Copyright ©2012‐2013 Fuji Pharma Co.,Ltd. All rights reserved.
Entered into capital alliance with TERUMO CORPORATION
/Completed new injection production plant (No. 5 Pharmaceutical Plant)
Completed new tablet production plant (current No. 4 Pharmaceutical Plant)
Filgrastim BS Syringe 「F」
21
Made OLIC (Thailand) Limited a subsidiary

Memo
Copyright ©2012‐2013 Fuji Pharma Co.,Ltd. All rights reserved.
22

Overview of OLIC (Thailand) Limited and Toyama Research and Development Center
OLIC (Thailand) LimitedLocation: Bangpa-In, Ayutthaya, Thailand
Toyama Research and Development CenterLocation: 447-1 Mizuhashi-nakamura, Toyama City, Toyamagp , y y ,
Current facility built in 1997Employees: 884 (as of March 31, 2013) Facility: Site area: 80,000 sq. meters
Completion: April 2013Scale: Three-story steel frame structure
Construction area: 1,001.96 sq. metersFloor area: 2 898 46 sq meters
Footprint: 40,000 sq. metersFloor area: 25,000 sq. meters
Product: Producing approximately 600 products for over 35 multinational
Floor area: 2,898.46 sq. metersFeatures: (1) Dealing with environmental pollution
We have installed equipment for separating out and disposing of waste water containing active substances with high pharmaceutical efficacies,products for over 35 multinational
clientssubstances with high pharmaceutical efficacies, and also installed exhaust gas scrubbing apparatus.(2) Preventing health hazardsWe have installed injection testing equipment to
Copyright ©2012‐2013 Fuji Pharma Co.,Ltd. All rights reserved.
23
j g q pensure that our workers are able to work in a safe and secure operating environment.

Contact Information
The financial forecasts and other projections provided in this presentation are based onThe financial forecasts and other projections provided in this presentation are based on information available at the time of its compilation and it therefore contains an element of uncertainty and potential risks. Actual results may differ significantly from these forecasts for a number of reasons. It should also be noted that the views and/or facts presented here may be altered or deleted without prior notification.
Fuji Pharma Co., Ltd.Corporate Planning Department
Phone: +81-3-3556-3344Fax: +81-3-3556-4455E-Mail: [email protected]: http://www fujipharma jp/URL: http://www.fujipharma.jp/
Copyright ©2012‐2013 Fuji Pharma Co.,Ltd. All rights reserved.