business service manager version 6.1 - ibm · aggregation and numerical formula rules overview 95...
TRANSCRIPT

Business Service ManagerVersion 6.1.1
Service Configuration Guide
SC23-6041-09
���

Business Service ManagerVersion 6.1.1
Service Configuration Guide
SC23-6041-09
���

NoteBefore using this information and the product it supports, read the information in “Notices” on page 369.
Edition notice
This edition applies to IBM Tivoli Business Service Manager Version 6 Release 1.1 and to all subsequent releasesand modifications until otherwise indicated in new editions.
© Copyright IBM Corporation 2008, 2013.US Government Users Restricted Rights – Use, duplication or disclosure restricted by GSA ADP Schedule Contractwith IBM Corp.
Contents
About this publication . . . . . . . . 1Audience . . . . . . . . . . . . . . . 1Publications . . . . . . . . . . . . . . 1
TBSM library . . . . . . . . . . . . . 1Prerequisite publications . . . . . . . . . 1Related publications . . . . . . . . . . . 2Accessing terminology online . . . . . . . . 2Accessing publications online . . . . . . . . 2Ordering publications . . . . . . . . . . 3
Accessibility . . . . . . . . . . . . . . 3Tivoli technical training. . . . . . . . . . . 3Support information . . . . . . . . . . . . 3Conventions used in this publication . . . . . . 4
Typeface conventions . . . . . . . . . . 4
Introduction to IBM Tivoli BusinessService Manager . . . . . . . . . . . 5What's new in TBSM Version 6.1.1 . . . . . . . 5
Technical overview of TBSM . . . . . . 7TBSM architecture . . . . . . . . . . . . 7TBSM components . . . . . . . . . . . . 8Integrated applications . . . . . . . . . . 11Operating system variables and paths . . . . . 14Java support . . . . . . . . . . . . . . 15
Accessing the TBSM console . . . . . 17Logging in. . . . . . . . . . . . . . . 17Logging out . . . . . . . . . . . . . . 18
TBSM console overview . . . . . . . 19
Service Navigation portlet . . . . . . 23Services . . . . . . . . . . . . . . . 23Templates . . . . . . . . . . . . . . . 24Service Component Repository . . . . . . . . 25Custom Canvases . . . . . . . . . . . . 25Data . . . . . . . . . . . . . . . . . 26Data Fetcher . . . . . . . . . . . . . . 27Charts . . . . . . . . . . . . . . . . 28
Service Editor. . . . . . . . . . . . 31View Service and Template tabs . . . . . . . 31Edit tabs . . . . . . . . . . . . . . . 32Edit tab editors . . . . . . . . . . . . . 32
Service Viewer . . . . . . . . . . . 35
Event Summary portlet. . . . . . . . 37
TBSM service model configurationoverview . . . . . . . . . . . . . . 391 Plan your service model . . . . . . . . . 40
2 Create service templates . . . . . . . . . 413 Create structural dependencies . . . . . . . 414 Identify data sources. . . . . . . . . . . 415 Create incoming status and numerical rules . . . 416 Create services. . . . . . . . . . . . . 427 Create custom service trees and views . . . . . 438 Create SLAs . . . . . . . . . . . . . 439 Set permissions . . . . . . . . . . . . 4310 Monitor services . . . . . . . . . . . . 43
Data sources . . . . . . . . . . . . 45About data sources . . . . . . . . . . . . 45Creating a data source . . . . . . . . . . . 46Editing a data source . . . . . . . . . . . 48Deleting a data source . . . . . . . . . . . 48
Data fetchers . . . . . . . . . . . . 51Data fetcher overview . . . . . . . . . . . 51Setting up a data fetcher . . . . . . . . . . 52Creating the data fetcher . . . . . . . . . . 52
Setting the polling criteria . . . . . . . . 53Setting up the query criteria . . . . . . . . 55
Using the data fetcher results . . . . . . . . 61
Service templates . . . . . . . . . . 63Service templates overview . . . . . . . . . 63
Service instances. . . . . . . . . . . . 63Service template model: Example 1 . . . . . 64Service model: example 2. . . . . . . . . 66
Service template configuration . . . . . . . . 68Opening the Edit Template tab . . . . . . . 68Basic service template properties . . . . . . 69
Rule configuration . . . . . . . . . . . . 70Tagging services . . . . . . . . . . . . . 72Output expressions . . . . . . . . . . . . 73
Example output expressions . . . . . . . . 74Creating and editing output expressions . . . . 75
SLA tab. . . . . . . . . . . . . . . . 77Additional tab . . . . . . . . . . . . . 77Adding security levels . . . . . . . . . . . 77Event enrichment solution . . . . . . . . . 78
Configuring Event Enrichment in TBSM . . . . 78
Incoming status rules . . . . . . . . 79Incoming status rules overview. . . . . . . . 79
Incoming status rules properties and conditions 80Customizing Data Feed fields . . . . . . . 82
Good, marginal, and bad incoming status rules . . 83Create and edit good, marginal, and badincoming status rules . . . . . . . . . . 84
Numerical incoming status rules . . . . . . . 86Create and edit numerical incoming status rules 87
Text-based incoming status rules . . . . . . . 90Create and edit text-based incoming status rules 91
Creating automatic roll-up rules . . . . . . . 93
© Copyright IBM Corp. 2008, 2013 iii

Aggregation and numerical formularules. . . . . . . . . . . . . . . . 95Aggregation and numerical formula rules overview 95Good, marginal, and bad aggregation rulesoverview . . . . . . . . . . . . . . . 95
Good, marginal, and bad aggregation ruleproperties . . . . . . . . . . . . . . 96Create and edit good, marginal, and badaggregation rules . . . . . . . . . . . 98
Numerical aggregation rules overview . . . . . 100Numerical aggregation rules properties. . . . 101Create and edit numerical aggregation rules . . 103
Numerical formula rules overview . . . . . . 104Numerical formula rule properties . . . . . 104Create and edit numerical formula rules . . . 106
Auto-population rules . . . . . . . . 109Automatic service creation overview . . . . . 109TBSM auto-population solutions overview. . . . 109Adding auto-population rules . . . . . . . . 110
Setting status auto-population rules . . . . . 110Example: adding settings for parent templates . . 113Deleting an auto-population rule set . . . . . . 115Working with additional service properties . . . 116Deleting an additional service property . . . . . 117Specifying key performance indicators for services 117Example KPI configuration . . . . . . . . . 117Service persistence settings . . . . . . . . . 118Custom auto-population options . . . . . . . 118
Settings for existing parent services . . . . . 118Settings for multiple service templates . . . . 119Assign a group name to services . . . . . . 119Create policy for additional service properties 119Create policy for service names . . . . . . 120
Query Builder . . . . . . . . . . . 123Query Builder overview . . . . . . . . . . 123Building the query . . . . . . . . . . . 123Filtering the query data . . . . . . . . . . 128Add metrics . . . . . . . . . . . . . . 128Adding Group Bys . . . . . . . . . . . 129Adding Order Bys. . . . . . . . . . . . 129
ITCAM for Internet Service Monitoringrules . . . . . . . . . . . . . . . 131ITCAM for Internet Service Monitoring ruleoverview . . . . . . . . . . . . . . . 131Configuring a service template with InternetService Monitoring rules . . . . . . . . . 131Adding an Internet Service Monitoring serverconnection . . . . . . . . . . . . . . 132Deleting an Internet Service Monitoring serverconnection . . . . . . . . . . . . . . 133Provisioning the monitor . . . . . . . . . 133Viewing the monitor . . . . . . . . . . . 133Setting up a HTTP monitor. . . . . . . . . 134Setting up an HTTPS monitor . . . . . . . . 135Setting up a DNS monitor . . . . . . . . . 137
IP address lookup . . . . . . . . . . . 137Host name lookup. . . . . . . . . . . 138
Setting up an LDAP monitor . . . . . . . . 138Setting up an ICMP monitor . . . . . . . . 140Creating an Internet Service Monitoring templaterule . . . . . . . . . . . . . . . . 141Editing template Internet Service Monitoring rules 142Deleting an Internet Service Monitoringconfiguration rule . . . . . . . . . . . . 143Tagging services with an Internet ServiceMonitoring template . . . . . . . . . . . 143Viewing an Internet Service Monitoring report fora service . . . . . . . . . . . . . . . 144
ESDA rules . . . . . . . . . . . . 145ESDAs overview . . . . . . . . . . . . 145
Accessing the ESDA sample data . . . . . . 145About TBSM auto-population solutions. . . . 146ESDA rules and service structure . . . . . . 146Child and parent rules . . . . . . . . . 147ESDA queries . . . . . . . . . . . . 148ESDA service expressions . . . . . . . . 148ESDA rule triggers . . . . . . . . . . 149Service persistence . . . . . . . . . . 149
Setting the service model structure . . . . . . 150Selecting child or parent rules . . . . . . . . 152ESDA query concepts. . . . . . . . . . . 155Entering an ESDA query . . . . . . . . . 157Working with ESDA service expressions . . . . 158Testing ESDA rules . . . . . . . . . . . 160Service persistence settings . . . . . . . . . 161
Configuring services . . . . . . . . 163Services overview . . . . . . . . . . . . 163Service configuration . . . . . . . . . . . 163
Creating a service . . . . . . . . . . . 164Editing an existing service . . . . . . . . 164
Basic service properties . . . . . . . . . . 166Setting basic service properties . . . . . . 167
Assigning templates to a service . . . . . . . 167Service Identification fields . . . . . . . . . 168Editing Identification fields . . . . . . . . . 169Service dependency configuration . . . . . . 170Additional service settings . . . . . . . . . 171
Setting the GIS position for a service . . . . 171Setting SLA penalty calculations . . . . . . 172Setting the sort order for a service . . . . . 173
Configuring and provisioning Internet ServicesMonitoring . . . . . . . . . . . . . . 173Adding user and group permissions. . . . . . 173
Service Details portlet . . . . . . . 175Cumulative SLAs tab . . . . . . . . . . . 175Events tab . . . . . . . . . . . . . . 176Rules tab . . . . . . . . . . . . . . . 176Displaying events . . . . . . . . . . . . 176
Displaying service-affecting events table . . . 177Displaying root cause events . . . . . . . 177Display active events list . . . . . . . . 177
Show rule status . . . . . . . . . . . . 178
iv IBM Tivoli Business Service Manager: Service Configuration Guide

Maintenance schedules . . . . . . . 179Maintenance schedules overview . . . . . . . 179Configuring maintenance schedules . . . . . . 179
Configuring recurring time windows . . . . 181Configuring absolute time windows . . . . . 182
Maintenance right-click tools overview . . . . . 182Adding maintenance schedules quickly. . . . . 183Removing maintenance schedules quickly . . . . 183
Granting user and group permissionsto templates and services . . . . . . 185Assigning privileges overview. . . . . . . . 185Assigning roles globally . . . . . . . . . . 185Assigning roles per service . . . . . . . . . 185Assigning roles to templates . . . . . . . . 186Accessing TBSM-specific roles . . . . . . . . 187
Editing policies . . . . . . . . . . 189About the Policy editor . . . . . . . . . . 189Pre-defined policies overview . . . . . . . . 189Opening the Policy editor . . . . . . . . . 189Policy editor toolbar controls . . . . . . . . 190
Using the Undo, Redo, Cut, Copy, and Pasteoptions . . . . . . . . . . . . . . 191Using the Find and Replace option . . . . . 192Using the Goto Line option. . . . . . . . 192Checking the policy syntax . . . . . . . . 193Optimize your policy. . . . . . . . . . 193Adding functions to policy . . . . . . . . 193List and overview of functions . . . . . . 194
Triggering the policy . . . . . . . . . . . 201Setting policy runtime parameters in the editor . . 201Displaying the graphical view . . . . . . . . 201Editing a policy . . . . . . . . . . . . 202Saving a policy . . . . . . . . . . . . . 202
Service level agreement configuration 203SLAs overview . . . . . . . . . . . . . 203SLA settings tab . . . . . . . . . . . . 203Editing SLA settings . . . . . . . . . . . 204
Multiple service level configuration . . . . . 204Duration-based violation calculations . . . . 205Violation incident-count calculations. . . . . 206Set incident-count violation calculations . . . 208Set cumulative violation calculations . . . . 209Setting SLA penalty calculations . . . . . . 210
SLA data in the dependency view . . . . . . 211Displaying the SLA tab . . . . . . . . . 212SLA chart . . . . . . . . . . . . . 213
Viewing service models . . . . . . . 215Service Administration Overview. . . . . . . 215Service Availability Overview . . . . . . . . 216Service Configuration Overview . . . . . . . 217Creating a freeform custom page . . . . . . . 218
Example 1: Adding a Service Tree portlet to afreeform page . . . . . . . . . . . . 220Example 2: Adding an Urgent Services portlet toa freeform page . . . . . . . . . . . 221
Services in the Service Navigation portlet . . . . 221
Services elements . . . . . . . . . . . . 222Services in the Service Tree . . . . . . . . . 225
Service Tree preferences . . . . . . . . . 225Customizing the Service Tree . . . . . . . 229
Service Viewer preferences . . . . . . . . . 230Service Viewer preferences Context tab . . . . 231Service Viewer preferences Viewer tab . . . . 231
View Service tab . . . . . . . . . . . . 233Status data in service instances . . . . . . 233
View Service toolbar and menus . . . . . . . 234View Service menus . . . . . . . . . . 237Quick Find . . . . . . . . . . . . . 240
View service layout options . . . . . . . . 241Basic Relationships view . . . . . . . . 241Business Impact view . . . . . . . . . 241Business Impact All view . . . . . . . . 242Concentric view . . . . . . . . . . . 242Grid view . . . . . . . . . . . . . 242GIS view . . . . . . . . . . . . . . 242Relationships view . . . . . . . . . . 242
Displaying service details . . . . . . . . . 243Editing service configuration data . . . . . . 243
Editing service instance data . . . . . . . 243Editing service template data . . . . . . . 243Removing child service dependencies . . . . 243
Sending test events . . . . . . . . . . . 244
Urgent Services portlet . . . . . . . 245Urgent Services preferences. . . . . . . . . 246
Urgent Services preferences Filtering tab . . . 246
Right-click menus . . . . . . . . . 249About the right-click menus . . . . . . . . 249Edit Service Instance action. . . . . . . . . 250Children actions . . . . . . . . . . . . 250Edit Member Templates action . . . . . . . 250Show actions . . . . . . . . . . . . . 251
Service affecting events (table) option . . . . 251Service Affecting Events (AEL) option . . . . 251Show Rule Status option . . . . . . . . 251Show Root Cause Events . . . . . . . . 251Show SLA chart for children . . . . . . . 251Show SLA chart for service . . . . . . . . 252Send test event . . . . . . . . . . . . 252Internet Service Monitoring Report viewer . . 252Show 30-day history . . . . . . . . . . 252Compare Service Metrics . . . . . . . . 252
Launch to other Tivoli consoles . . . . . . . 252Maintenance window tools . . . . . . . . . 253
TBSM reports . . . . . . . . . . . 255Run TBSM reports. . . . . . . . . . . . 255TBSM Average Outage Duration report . . . . . 256TBSM Average Daily Outage Count report . . . 256TBSM Service Outage Average Duration chart . . 257TBSM Service Outage Count Summary report . . 257TBSM Service Path Outage Summary report . . . 257TBSM Top Level Path Status Changes report . . . 258TBSM Service Outage Duration report . . . . . 258TBSM Service Affecting Events report . . . . . 259
Contents v
TBSM Service Outage Details report . . . . . . 259TBSM Top Service Outage Average Duration chart 260TBSM Top Service Outage Count Summary chart 260BIRT reports. . . . . . . . . . . . . . 261
Custom service trees . . . . . . . . 263About custom service trees . . . . . . . . . 263Getting started with the Tree Template editor. . . 264
Opening the Tree Template Editor . . . . . 265Working with tree templates . . . . . . . . 266
Selecting a tree template. . . . . . . . . 267Adding a tree template . . . . . . . . . 267Deleting Tree Template . . . . . . . . . 267Displaying the Tree Template . . . . . . . 267
About tree columns . . . . . . . . . . . 268Adding a tree column . . . . . . . . . 269Changing a tree column name and position . . 270Deleting columns . . . . . . . . . . . 270
Selecting service templates for a tree template . . 270Service templates and tree templates . . . . . 271Template rules and tree columns . . . . . . . 271
Adding a template rule to a column . . . . . 272Working with reserved column names . . . . . 272Viewing a custom tree . . . . . . . . . . 274
Viewing a tree for a user-defined tree template 274Examples for creating custom trees . . . . . . 275
Custom view definitions. . . . . . . 277About view definitions . . . . . . . . . . 277Creating and editing view definitions . . . . . 277Working with the General tab . . . . . . . . 279
Visibility options . . . . . . . . . . . 280Example general settings . . . . . . . . 280
View definition visuals . . . . . . . . . . 282Changing visuals for specific service templates 282Change the visuals for all service templates . . 284Visual types . . . . . . . . . . . . . 285Setting visual thresholds. . . . . . . . . 290
Working with view definition actions . . . . . 292Changing the actions for specific servicetemplates . . . . . . . . . . . . . . 293Changing the actions for all service templates 294Using service attributes in an action . . . . . 296View definition action examples . . . . . . 296
Deleting a view definition . . . . . . . . . 300
TBSM Charts . . . . . . . . . . . 301Charts overview . . . . . . . . . . . . 301Charts reference . . . . . . . . . . . . 302Chart data sources. . . . . . . . . . . . 303Creating a chart . . . . . . . . . . . . 305Adding a chart to a Tivoli Integrated Portal page 305Working with ITM charts . . . . . . . . . 307
Time Window Analyzer view . . . . . 311Time Window Analyzer overview . . . . . . 311Selecting services . . . . . . . . . . . . 313
Opening Time Window Analyzer for a service 314Adding services to compare in the graph . . . 314
Graphing a performance indicator for services . . 315
Showing historical comparison for a service . . . 316Adding a Time Window Analyzer Portlet to aTivoli Integrated Portal page . . . . . . . . 316Time Window Analyzer preferences . . . . . . 317
Window preferences . . . . . . . . . . 318Chart preference . . . . . . . . . . . 319Context preferences . . . . . . . . . . 319Portlet preferences. . . . . . . . . . . 320
Working with the configurationdocumenter . . . . . . . . . . . . 323Configuration documenter overview . . . . . 323Opening the configuration documenter . . . . . 323Viewing the cluster status . . . . . . . . . 324Viewing the server status . . . . . . . . . 324Viewing data sources . . . . . . . . . . . 324Viewing data types . . . . . . . . . . . 325Viewing policies . . . . . . . . . . . . 325Viewing services . . . . . . . . . . . . 325
Custom static canvases . . . . . . . 327About custom canvases . . . . . . . . . . 327Creating new custom canvases . . . . . . . 336
Changing the scope of custom canvases . . . 337Static custom visual elements . . . . . . . 339Working with custom static decorations . . . 340
Example 1: Configuring a speedometer gauge . . 341Example 2: Configuring a service instance indicator 343Example 3: Configuring a three-element prototype 346
Deleting visual elements. . . . . . . . . 348Example 4: Configuring multiple gauges perservice. . . . . . . . . . . . . . . . 348Working with the Inspector. . . . . . . . . 350
Editing properties . . . . . . . . . . . 350Inspector properties . . . . . . . . . . 351
Reference . . . . . . . . . . . . . 353TBSM-specific projects . . . . . . . . . . 353Event enrichment solution . . . . . . . . . 353Creating the event source . . . . . . . . . 353OMNIbus event reader service . . . . . . . 354
OMNIbus event reader configuration . . . . 355OMNIbus event reader service General Settingstab . . . . . . . . . . . . . . . . 355Database event reader configuration window -general settings. . . . . . . . . . . . 356
Event enrichment tutorial . . . . . . . . . 357Tutorial overview . . . . . . . . . . . 357Understanding the Netcool/Impact installation 358Understanding the business data . . . . . . 358Analyzing the workflow. . . . . . . . . 358Creating the project . . . . . . . . . . 359Setting up the data model . . . . . . . . 359Setting up services . . . . . . . . . . 363Writing the policy . . . . . . . . . . . 363Running the solution . . . . . . . . . . 367
Notices . . . . . . . . . . . . . . 369Trademarks . . . . . . . . . . . . . . 370
vi IBM Tivoli Business Service Manager: Service Configuration Guide

Index . . . . . . . . . . . . . . . 373
Contents vii

viii IBM Tivoli Business Service Manager: Service Configuration Guide

About this publication
This guide contains information how to operate, maintain, and configure theproduct.
AudienceThis publication is for administrators and system programmers who need to use,install, maintain, or configure TBSM.
PublicationsThis section lists publications in the TBSM library and related documents. Thesection also describes how to access Tivoli® publications online and how to orderTivoli publications.
TBSM libraryThe following documents are available in the TBSM library:v Installation Guide, GI11-8054-09
Provides information about installing the product.v Quick Start, GI11-8055-04
Provides overview information about TBSM.v Exploring IBM Tivoli Business Service Manager , GI11-8056-07
Provides an overview of the product features.v Administrator's Guide, SC23-6040-09
Provides information about managing and configuring TBSM.v Service Configuration Guide, SC23-6041-09
Provides information on how to use the features of the product console.v Customization Guide, SC23-6042-09
Provides information on how to customize select features of the product.v Troubleshooting Guide, GI11-8057-09
Provides information about resolving common problems with the product.v Release Notes,
Provides latest information about the product discovered late in the test cyclethat cannot be incorporated into the other publications.
Prerequisite publicationsTo use the information in this publication effectively, you must have someprerequisite knowledge, which you can obtain from the publications listed here.
These publications are included on the Tivoli Documentation Central pages at:
http://www.ibm.com/tivoli/documentationv IBM Tivoli Netcool/OMNIbus Version 7 Release 3.1 User Guide
Provides an overview of Netcool/OMNIbus components, as well as adescription of the operator tasks related to event management using the desktoptools. TBSM uses Netcool/OMNIbus as its event manager.
© Copyright IBM Corp. 2008, 2013 1

v IBM Tivoli Netcool/OMNIBUS Administration Guide
Provides information about how to perform administrative tasks using theNetcool/OMNIbus Administrator GUI, command line tools, and process control.It also contains descriptions and examples of ObjectServer SQL syntax andautomations.
v IBM Tivoli Netcool/OMNIBUS Probe and Gateway Guide
Provides information contains introductory and reference information aboutprobes and gateways, including probe rules file syntax and gateway commands.For more information about specific probes and gateways, refer to thedocumentation available for each probe and gateway.
v IBM Tivoli Netcool/OMNIBUS Probe for Tivoli EIF
Provides reference information about the optional Probe for Tivoli EIF that isincluded with TBSM.
Related publicationsThe following documents also provide useful information and are included in theTBSM Information Center.
These publications are included on the Tivoli Documentation Central pages at:
http://www.ibm.com/tivoli/documentationv IBM Tivoli Netcool/Impact Administration Guide
Provides information about installing, configuring and running Netcool/Impactand its related software components. TBSM uses Netcool/Impact policies toparse events and other data.
v IBM Tivoli Netcool/Impact User Interface Guide
Provides information about using the Netcool/Impact user interface.v IBM Tivoli Netcool/Impact Policy Reference Guide
Provides reference information about the Netcool/Impact Policy Language (IPL).It contains complete information about policy language syntax, data types,operators and functions.
v IBM Tivoli Netcool/Impact Solutions Guide
Provides information about implementing Netcool/Impact in your environment.v IBM Tivoli Netcool/Impact DSA Reference Guide
Provides reference information about Netcool/Impact data source adaptors(DSA).
Accessing terminology onlineThe IBM Terminology Web site consolidates the terminology from IBM productlibraries in one convenient location. You can access the Terminology Web site at thefollowing Web address:
http://www.ibm.com/software/globalization/terminology.
Accessing publications onlineThe format of the publications is PDF, HTML, or both.
IBM® posts publications for this and all other Tivoli products, as they becomeavailable and whenever they are updated, to the Tivoli Documentation CentralWeb site at http://www.ibm.com/tivoli/documentation
2 IBM Tivoli Business Service Manager: Service Configuration Guide
Note: If you print PDF documents on other than letter-sized paper, set the optionin the File → Print window that allows Adobe Reader to print letter-sized pages onyour local paper.
Ordering publicationsYou can order many Tivoli publications online at http://www.ibm.com/e-business/linkweb/publications/servlet/pbi.wss.
You can also order by telephone by calling one of these numbers:v In the United States: 800-879-2755v In Canada: 800-426-4968
In other countries, contact your software account representative to order Tivolipublications. To locate the telephone number of your local representative, performthe following steps:1. Go to http://www.elink.ibmlink.ibm.com/publications/servlet/pbi.wss.2. Select your country from the list and click Go.3. Click About this site in the main panel to see an information page that
includes the telephone number of your local representative.
AccessibilityThis guide contains information how to operate, maintain, and configure theproduct.
Accessibility features help users with a physical disability, such as restrictedmobility or limited vision, to use software products successfully. In this release, theTBSM console does not meet all accessibility requirements.
Tivoli technical trainingFor Tivoli technical training information, refer to the following IBM TivoliEducation Web site at http://www.ibm.com/software/tivoli/education.
Support informationIf you have a problem with your IBM software, you want to resolve it quickly. IBMprovides the following ways for you to obtain the support you need:
OnlineAccess the IBM Software Support site at http://www.ibm.com/software/support/probsub.html .
IBM Support AssistantThe IBM Support Assistant is a free local software serviceability workbenchthat helps you resolve questions and problems with IBM softwareproducts. The Support Assistant provides quick access to support-relatedinformation and serviceability tools for problem determination. To installthe Support Assistant software, go to http://www.ibm.com/software/support/isa.
Troubleshooting GuideFor more information about resolving problems, see the problemdetermination information for this product.
About this publication 3

Conventions used in this publicationThis publication uses several conventions for special terms and actions, operatingsystem-dependent commands and paths, and margin graphics.
Typeface conventionsThis publication uses the following typeface conventions:
Bold
v Lowercase commands and mixed case commands that are otherwisedifficult to distinguish from surrounding text
v Interface controls (check boxes, push buttons, radio buttons, spinbuttons, fields, folders, icons, list boxes, items inside list boxes,multicolumn lists, containers, menu choices, menu names, tabs, propertysheets), labels (such as Tip:, and Operating system considerations:)
v Keywords and parameters in text
Italic
v Citations (examples: titles of publications, diskettes, and CDsv Words defined in text (example: a nonswitched line is called a
point-to-point line)v Emphasis of words and letters (words as words example: "Use the word
that to introduce a restrictive clause."; letters as letters example: "TheLUN address must start with the letter L.")
v New terms in text (except in a definition list): a view is a frame in aworkspace that contains data.
v Variables and values you must provide: ... where myname represents....
Monospace
v Examples and code examplesv File names, programming keywords, and other elements that are difficult
to distinguish from surrounding textv Message text and prompts addressed to the userv Text that the user must typev Values for arguments or command options
4 IBM Tivoli Business Service Manager: Service Configuration Guide

Introduction to IBM Tivoli Business Service Manager
This information can help you understand IBM Tivoli Business Service Manager(TBSM), including its business value and key technologies.
TBSM delivers the real-time information that you need in order to respond toalerts effectively and in line with business requirements, and optionally to meetservice-level agreements (SLAs).
The TBSM tools enable you to build a service model that you integrate with IBMTivoli Netcool/OMNIbus alerts or optionally with data from an SQL data source.TBSM includes optional components that let you access data from other IBM Tivoliapplications such as IBM Tivoli Monitoring, and IBM Tivoli ApplicationDependency Discovery Manager. TBSM processes the external data based on theservice model data you created in the TBSM database and returns a new orupdated TBSM service event to Netcool/OMNIbus.
The TBSM console provides a graphical user interface (GUI) that allows you tologically link services and business requirements within the service model. Theservice model provides an operator with a view of how, second by second, anenterprise is performing at any given moment in time or how the enterprise hasperformed over a given time period.
What's new in TBSM Version 6.1.1TBSM Version 6.1.1 contains support for Jazz™ for Service Management andNetcool/Impact 6.1.1.
Jazz for Service Management
TBSM has been updated to integrate with Jazz for Service Management and theIBM Dashboard Application Services Hub. In order to use these new features, youalso need to have Jazz for Service Management and the IBM DashboardApplication Services Hub installed as part of your environment.
Jazz for Service Management employs a new deployment pattern and mechanismthat helps you integrate shared components such as your User Interface, LinkedData Registry, Reporting, Security, and Administrative Services. This newmechanism helps you speed up delivery cycles for clients and simplifydeployments.
For more information see Administration Guide > TBSM and IBM DashboardApplication Services Hub.
IBM Dashboard Application Services Hub
The IBM Dashboard Application Services Hub provides user interface anddashboard services in Jazz for Service management. This new self-servicedashboard capability enables you to combine a variety of visual widgets such asgauges, tables, charts, lists or topology views into custom dashboards using aguided work flow. These dashboards can also include management data fromsources such as:
© Copyright IBM Corp. 2008, 2013 5

v Service status and metrics from TBSMv Third-party data from Netcool/Impactv Performance metrics from IBM Tivoli Monitoring
Mobile Support: The self-service dashboard enable you to view businessdashboards on mobile devices including tablets and phones. This enables access toboth information technology and business data anytime / anywhere and gives youthe ability to support your customers more effectively.
Linked data integration
The Jazz for Service Management registry services follow the Open Services forLifecycle Collaboration (OSLC) standards; which enable you to reconcile dataacross multiple sources. This capability lets you link to source data, rather thanduplicating it locally. The data linking enables BSM users, including operators,subject matter experts, application owners, or line of business owners to viewinformation about their managed services, applications, or resources that helpsthem isolate, diagnose, and route problems. Contextual information about thesesupporting resources can include configuration or health and performance details.
TBSM uses the registry services to display Hover Preview help for services in theService Tree and Service Navigator.
For more information see Customization Guide > OSLC hover preview configuration.
What's new in Netcool/Impact
TBSM includes a full and integrated version of Netcool/Impact version 6 release1.1 as part of the TBSM Data Server. The new version includes theseenhancements:
New visualization: The new visualization include Operator View customizationenhancements and UI Services provided by Jazz for Service Management. Thesewill enable clients to link their own data accessed through Impact's proven dataaccess methods with visual widgets such as gauges, tables, or lists to createdashboards.
Linked data integration: Netcool/Impact can also use the Jazz for ServiceManagement registry services that follow the Open Services for LifecycleCollaboration (OSLC) standards.
Service Level Objective (SLO) Reporting: Enables you to establish and report onservice level objectives based on their own measures (for example, incidents,tickets, and availability).
Consumability: Continued improvements to enhance the user experience,including MWM cluster replication and e-mail reader enhancements.
Enhanced Web Services Integrations and Wizards: Enhances and simplifies accessto web services data sources.
6 IBM Tivoli Business Service Manager: Service Configuration Guide

Technical overview of TBSM
This section contains topics about the product architecture and the main softwarecomponents.
TBSM architectureThis section describes the basic architecture of the IBM Tivoli Business ServiceManager (TBSM).
Figure 1 on page 8 shows the basic architecture for TBSM. The TBSM Data serveranalyzes IBM Netcool/OMNIbus ObjectServer events or SQL data for matchesagainst the incoming-status rules you configured for your service models. If thematching data changes the service status, the status of the TBSM service modelchanges accordingly. When a services status changes, TBSM sends correspondingservice events back to the ObjectServer.
You can also use data from an external database or an ObjectServer to drivecustom views and charts. The Discovery Library Toolkit lets you create TBSMservice objects using data from Discovery Library Adaptor (DLA) books or fromthe IBM Tivoli Application Dependency Discovery Manager.
The TBSM users and group permissions are managed by the Tivoli IntegratedPortal, which can authenticate users internally, or use data from an external sourcesuch as an ObjectServer or LDAP server.
© Copyright IBM Corp. 2008, 2013 7

TBSM componentsThis topic describes the components included on the product DVD.
The following applications are included on the TBSM product DVD. Theseapplications must be installed on a host that is accessible by the TBSM server.
TBSM has the following major components:v Tivoli Integrated Portalv IBM Tivoli Netcool/OMNIbusv Netcool/OMNIbus Web GUIv TBSM Dashboard serverv TBSM Data serverv TBSM DB2® databasev IBM Tivoli EIF Probe (optional)v Discovery Library Toolkitv Business Service Management Agent (optional)v IBM Tivoli Netcool/Impact
Figure 1. Architecture
8 IBM Tivoli Business Service Manager: Service Configuration Guide

Tivoli Integrated Portal
Tivoli Integrated Portal enables the interaction and secure passing of data betweenTivoli products through a common portal. You can launch from one application toanother and within the same dashboard view to research different aspects of yourmanaged enterprise.
Tivoli Netcool/OMNIbus
TBSM monitors the Tivoli Netcool/OMNIbus ObjectServer for incoming events.The ObjectServer collects events from probes, monitors, and other applicationssuch as IBM Tivoli Monitoring. You use TBSM to create service models thatrespond to the data received in the incoming events.
For example, the incoming event data can change the status of a service or startthe tracking of a potential SLA violation. In short, if you can set up a probe orother application to forward data to the TBSM ObjectServer, you can use that datato build and monitor your service models. The TBSM installation package includesNetcool/OMNIbus. If you want to use the Discovery Library toolkit, or the IBMTivoli Event Integration Facility (EIF) probe you need version 7.1 or higher.
For more information see: IBM Tivoli Netcool/OMNIbus documentation
Netcool/OMNIBus Web GUI
The Web GUI is the browser console for Netcool/OMNIbus and TBSM uses WebGUI components to display events related to service models. The Active Event List(AEL) and Service Details portlet in TBSM are Web GUI components, and areinstalled as part of TBSM. The Tivoli Integrated Portal also includes Web GUIcomponents.
For more information see: IBM Tivoli Netcool/OMNIBus documentation
TBSM Dashboard server
The TBSM Dashboard server manages the TBSM console display. You can havemultiple dashboard servers for a single data server. The dashboard server enhancesthe scalability, performance, and availability of TBSM.
The TBSM Dashboard server communicates with the TBSM Data server to supportthe creation and visualization of service models through connected TBSM consoles.As console users view portions of the service model, the dashboard server willacquire and maintain status of services from the data server.
TBSM Data server
The TBSM Data server monitors the ObjectServer and external databases for datathat affect the status of the services you configured in the TBSM console or withthe RAD shell command line tool. The server calculates the status of these servicesby applying rules to the external data. Your service models and the rules are storedin the TBSM database.
TBSM DB2 database
The TBSM DB2 database stores all the information on the service models youcreated in the TBSM console. This data includes rules that determine how your
Technical overview of TBSM 9

service model changes in relation to data in external data sources. This databasealso includes tables for the metrics and markers used in the Time WindowAnalyzer and demo data. A Metric History database, which has a default name ofTBSMHIST, is also included to store the historical metric data,
TBSM DSAs
The optional data source adaptors (DSA) let you monitor external data sources forservice-affecting data. You can use a DSA within an Impact policy in TBSM. Theexternal data provided by the DSA allows you to build your service-modelstructure, and monitor the status of your service model. DSAs are shipped withIBM Tivoli Netcool/Impact. For more information, see Tivoli DocumentationCentral. Search under I.
Tivoli EIF probe
You can set up the optional IBM Tivoli Event Integration Facility (EIF) probe toaccess the event data from various Tivoli applications. The probe is a generic EIFevent listener that can receive events from any application that has the capabilityto create EIF events and forward those events to a event listener.
Discovery Library Toolkit
The Discovery Library Toolkit enables TBSM to discovery resources and toautomatically build service models from Discovery Library data sources. Thesesources include:IBM Tivoli Application Dependency Discovery Manager ,Discovery Library books conforming to the common data model, Discovery Librarybooks containing objects for an alternate namespace, the Discovery Library toolkitAPI, or auto-pop objects.
Data discovered through the toolkit can be enriched through notifications sent toImpact. This enriched data can then be used in the automatic building of theservice model.
Business Service Management Agent
The optional IBM Tivoli Business Service Management Agent provides you withthe capability to monitor Tivoli Business Service Manager, and to perform basicactions within the Tivoli Enterprise Portal.
The Business Service Management Agent provides the following functions:v TBSM service monitoring
Collects and displays information on the status of services monitored by TBSM,key performance indicators, and root cause events for the status change, and thestatus of the TBSM Data server.
v TBSM event broker log monitoring
Collects and displays information on the number of events read per second andthe amount of memory used by the TBSM event broker based on data from theTBSM_tbsmomnibuseventreader.log file.
v Availability monitoring
Collects and displays availability information separately for the monitored TBSMserver. The agent pings the application to determine whether the TBSM Dataserver is available.
10 IBM Tivoli Business Service Manager: Service Configuration Guide

For more information, see the "Installing and configuring the TBSM Agent" sectionin the IBM Tivoli Business Service Manager Installation Guide.
Netcool/Impact
Netcool/Impact is the automation, correlation, and integration engine for the IBMTivoli Netcool suite of software products. You can use Netcool/Impact to automateevent management tasks, to correlate event information with other information inyour environment, and to integrate Netcool products with a wide variety of thirdparty systems and applications.
TBSM now includes a full and integrated version of Netcool/Impact version 6release 1.1 as part of the TBSM Data Server. As a consequence of this integration,you can now take advantage of these Netcool/Impact capabilities:v You can use Netcool/Impact services and policies to acquire, enrich, and pass
data to TBSM to use for service status determination or visualization.v TBSM uses the same policy functions and policy language as Netcool/Impact.
Javascript is supported as a policy language in addition to IPL (Impact PolicyLanguage).
v Event enrichment is supported as an out-of-box function. Impact policies enrichevents before TBSM reads these same events for status determination andpropagation.
v The Dashboard server package includes the Impact User Interface which isdeployed into the Tivoli Integrated Portal. This provides a common userinterface for administration of both TBSM and Impact policies and services.
v The Data server package includes a name server that enables you to accessNetcool/Impact server clusters.
For more information about Netcool/Impact, see the Tivoli Netcool/Impactpublications at: Netcool/Impact Documentation.
Integrated applicationsThis section is an overview of the optional external applications you can integratewith TBSM.
The following applications either forward data to TBSM, or receive data fromTBSM:v Jazz for Service Management and the IBM Dashboard Application Services hub
can display TBSM service data in graphical widgets and share data with otherapplications.
v Using the IBM Tivoli EIF probe, you can forward data from IBM TivoliMonitoring version 6 release 1 and above, Tivoli Enterprise Console® version 3release 9 or later, IBM Tivoli Netview version 3 release 7 or later, and the IBMTivoli Event Pump for z/OS® version 4 release 2.
v Netcool/Impact version 6.1.1 is installed as part of the TBSM data server. TBSMcan receive data from other Netcool/Impact servers that share that same nameservice as the TBSM server.
v IBM Tivoli Application Dependency Discovery Manager version 7 release 1.2 orlater
v IBM Tivoli Enterprise Portal (Tivoli Monitoring charts)v IBM Tivoli Composite Application Manager for Internet Service Monitoring
(ITCAM for Internet Service Monitoring)
Technical overview of TBSM 11

v IBM Tivoli Change and Configuration Management Database (CCMDB) version7 releases 1 and 1.1
v Discovery Library Adapters including those from the following products:– IBM Tivoli Monitoring (6.2.3 or higher is recommended)– IBM Tivoli Business Service Manager for z/OS– IBM Tivoli Composite Application Manager for SOA– IBM Tivoli Composite Application Manager for WebSphere®
– IBM Tivoli Composite Application Manager for Transaction Tracking– IBM Tivoli Network Manager– IBM Tivoli NetView® for z/OS– IBM Tivoli Storage Productivity Center version 4, release 1.1
You can launch to or from the following applications from TBSM:v Tivoli Monitoring 6.2 with fix pack 1 or laterv Tivoli Application Dependency Discovery Manager 7.1 or laterv CCMDB version 7.1 or laterv Netcool/OMNIbus Web GUI component bundled with TBSM.v IBM Tivoli Network Manager IP Edition version 3 release 8v IBM Tivoli Composite Application Manager for Transactions version 7 release
1.0.2v IBM Tivoli TotalStorage Productivity Center (TPC)
Note: For launch support, the supported product versions may be more restrictivethan those specified for data exchange above.
Jazz for Service Management
TBSM has been updated to integrate with Jazz for Service Management and theIBM Dashboard Application Services Hub. In order to use these new features, youalso need to have Jazz for Service Management and the IBM DashboardApplication Services Hub installed as part of your environment.
Jazz for Service Management employs a new deployment pattern and mechanismthat helps you integrate shared components such as your User Interface, LinkedData Registry, Reporting, Security, and Administrative Services. This newmechanism helps you speed up delivery cycles for clients and simplifydeployments.
For more information see Administration Guide > TBSM and IBM DashboardApplication Services Hub.
IBM Dashboard Application Services Hub
The IBM Dashboard Application Services Hub provides user interface anddashboard services in Jazz for Service management. This new self-servicedashboard capability enables you to combine a variety of visual widgets such asgauges, tables, charts, lists or topology views into custom dashboards using aguided work flow. These dashboards can also include management data fromsources such as:v Service status and metrics from TBSMv Third-party data from Netcool/Impact
12 IBM Tivoli Business Service Manager: Service Configuration Guide
v Performance metrics from IBM Tivoli Monitoring
Mobile Support: The self-service dashboard enable you to view businessdashboards on mobile devices including tablets and phones. This enables access toboth information technology and business data anytime / anywhere and gives youthe ability to support your customers more effectively.
Tivoli Event Integration Facility (EIF) probe
You can set up the optional IBM Tivoli Event Integration Facility (EIF) probe toaccess the event data from applications such as IBM Tivoli Monitoring, TivoliEnterprise Console, and Tivoli Netview. The probe forwards the event data to theTBSM Netcool/OMNIbus ObjectServer. You can use TBSM to create service modelsbased on the event data from the Event Pump for z/OS, Tivoli Monitoring (andTivoli Monitoring agents), Tivoli Enterprise Console, and Tivoli NetView.
Tivoli Enterprise Portal
If you create service models with the TBSM Discovery Library integration, theseservices can represent resources monitored by Tivoli Monitoring and contain dataabout the Tivoli Enterprise Portal server used to monitor those resources. If aservice represents an Tivoli Monitoring resource and contains this data, then theTivoli Enterprise Portal can be launched from TBSM. Likewise, you can also launchTBSM from the Tivoli Enterprise Portal console.
IBM Tivoli Composite Application Manager for Internet ServiceMonitoring
From within TBSM you can automatically configure IBM Tivoli CompositeApplication Manager for Internet Service Monitoring (ITCAM for Internet ServiceMonitoring) monitors so that TBSM can receive ISM events from an ObjectServer.
IBM Tivoli Netcool/Impact
Netcool/Impact is the automation, correlation, and integration engine for the IBMTivoli Netcool® suite of software products. You can use Netcool/Impact toautomate event management tasks, to correlate event information with otherinformation in your environment, and to integrate Netcool products with a widevariety of third party systems and applications.
You can configure Netcool/Impact to forward events to the Netcool/OMNIbusObjectServer monitored by TBSM and use those events to update your servicemodel. Netcool/Impact is designed for Netcool administrators who want toenhance, customize, and extend the capabilities of the Netcool suite. For moreinformation, see the Netcool/Impact publications.
Change and Configuration Management Database
TBSM can launch into a Change and Configuration Management Database(CCMDB) associated with a Tivoli Application Dependency Discovery Manager. Ifyou create service models with the TBSM Discovery Library integration, theseservices can contain data about a Tivoli Application Dependency DiscoveryManager server. If a service contains data about a Tivoli Application DependencyDiscovery Manager server, you can launch the Tivoli Application DependencyDiscovery Manager and CCMDB consoles from the TBSM console. Likewise, you
Technical overview of TBSM 13
can also launch TBSM from the Tivoli Application Dependency Discovery Managerconsole.
Operating system variables and pathsOn both the Data server and the Dashboard server a script is provided that allowsyou to set environment variables for quick access to the TBSM directory structure.If you do not set the variables, you can substitute directories with full path nameswhen you run commands.
You must run the script that applies to the servers that you installed. If youinstalled both servers on the same system, you must run both scripts.
The locations of these setup scripts on UNIX systems are as follows:v installdirectory/tbsm/bin/setupTBSMData.sh for the Data serverv installdirectory/tbsm/bin/setupTBSMDash.sh for the Dashboard server
where installdirectory is the directory in which you installed the server. The defaultdirectory is /opt/IBM/tivoli.
The syntax used to run the UNIX scripts is:. installdirectory/tbsm/bin/setupTBSMData.sh
The locations of these setup scripts on Windows systems are as follows:v installdirectory\tbsm\bin\setupTBSMData.bat for the Data serverv installdirectory\tbsm\bin\setupTBSMDash.bat for the Dashboard server
where installdirectory is the directory in which you installed the server. The defaultdirectory is C:\Program Files\IBM\tivoli.
The following environment variables are used by TBSM as system environmentvariables:v TBSM_HOME
This variable is used on both the Data and Dashboard servers. By default, thepath set for this variable on Windows is C:\Program Files\IBM\tivoli\tbsm. Thedefault path on the UNIX operating system is /opt/IBM/tivoli/tbsm
v TBSM_DATA_SERVER_HOMEThis variable is used on the Data server. By default, the path for this variable onWindows is: C:\Program Files\IBM\tivoli\tipv2\profiles\TBSMProfile\installedApps\TBSMCell\TBSM.ear. The default path on the UNIX operatingsystem is /opt/IBM/tivoli/tipv2/profiles/TBSMProfile/installedApps/TBSMCell/TBSM.ear.
v TBSM_DASHBOARD_SERVER_HOMEThis variable is used on the Dashboard server. By default, the path set for thisvariable on Windows is C:\Program Files\IBM\tivoli\tipv2\profiles\TIPProfile\installedApps\TIPCell\isc.ear\sla.war. The default path on theUNIX operating system is /opt/IBM/tivoli/tipv2/profiles/TIPProfile/installedApps/TIPCell/isc.ear/sla.war
v TIP_HOMEThis variable is used on both the Data and Dashboard servers. By default, thepath set for this variable on Windows is C:\Program Files\IBM\tivoli\tipv2.The default path on the UNIX operating system is /opt/IBM/tivoli/tipv2.
14 IBM Tivoli Business Service Manager: Service Configuration Guide

Variables used in TBSM Publications
For many of the commands and paths specified in this publication, both the UNIXand Windows equivalents are provided. However, in instances where only theUNIX convention has been specified, follow these directions for Windows systems.
When using the Windows command line, replace $variable with % variable% forenvironment variables and replace each forward slash (/) with a backslash (\) indirectory paths. The names of environment variables are not always the same inthe Windows and UNIX environments. For example, %TEMP% in Windowsenvironments is equivalent to $TMPDIR in UNIX environments.
Note: If you are using the bash shell on a Windows system, you can use the UNIXconventions.
Java supportThis topic describes the Java™ runtime Environment (JRE) plug-in versions that arerequired for the IBM Tivoli Business Service Manager user interface in a webbrowser.
Supported Java runitme versions: The most up-to-date information aboutsupported hardware, software, browsers and operating systems is provided by theIBM Software Product Compatibility Reports at:
http://pic.dhe.ibm.com/infocenter/prodguid/v1r0/clarity/prereqsForProduct.html1. In the Full or partial product name: field, type Business Service and click the
search button.2. From the Search Results, select Tivoli Business Service Manager.
3. From the Version field, select 6.1.1.4. From Mandatory capabilities:, select Java.5. Click Submit.
For more information on the Software Product Compatibility Reports, see theOverview and Planning topic in the TBSM Wiki:
https://www.ibm.com/developerworks/mydeveloperworks/wikis/home?lang=en#/wiki/Tivoli%20Business%20Service%20Manager1/page/Overview%20and%20Planning
Note: The Java Runtime Environment that is being used should be updated to themost recent fix level.
Important: These web browser settings are required:v JavaScript is enabled in the browser.v Set your browser to allow pop-up windows. If you block pop-up windows, you
will disable features of TBSM that require pop-up windows.v Set your browser to accept third-party cookies.
Technical overview of TBSM 15

16 IBM Tivoli Business Service Manager: Service Configuration Guide

Accessing the TBSM console
This section describes how to access IBM Tivoli Business Service Manager (TBSM).The TBSM Console user interface is displayed by an IBM Tivoli Integrated Portalcomponent, which is installed with TBSM.
Logging inThis topic describes how to log in to TBSM.
About this task
Before you log in to TBSM, make sure the ObjectServer is running so that you cansend and receive events.
To log in to TBSM, you need to have the following information:v Your user namev Your passwordv The name or IP address of the TBSM Dashboard server hostv Port used for the TBSM Dashboard server
Two or more users cannot log on using the same web browser on the sameworkstation at the same time.
To log in, complete the following steps:
Procedure1. Open a supported web browser and enter the URL of the Login page. This
URL must be in the format:https://host:port
Where:v host is the host name or IP address of the TBSM Dashboard serverv port is the HTTPS port of the TBSM Dashboard server
The default URL is https://hostname:16311/ibm/console/logon.jsp
Note: If you get a login error, check that you have specified the URLcorrectly. If the URL is correct, the IBM Tivoli Integrated Portal server maynot be running. Contact your IBM Tivoli Integrated Portal administrator.
2. Enter your user name and password.
Note: User names and passwords are case sensitive. If you receive a loginerror message, and are sure that you have entered your user name andpassword correctly, then contact your Tivoli Integrated Portal administrator.
3. Click Log In.The default page for your user opens. This page is set by the IBM TivoliIntegrated Portal administrator.
Note: If you logged in as the IBM Tivoli Integrated Portal administrative user(by default, tipadmin), you can access Tivoli Integrated Portal administratorfunctionality. This functionality enables you to perform user and content
© Copyright IBM Corp. 2008, 2013 17

management for all IBM Tivoli Integrated Portal applications. All IBM TivoliIntegrated Portal administrator functionality is described in the IBM TivoliIntegrated Portal Administrator's Guide.The TBSM pages are listed in the left navigation pane under Administration,Availability, and Troubleshooting. Your user roles determine what pages yousee. TBSM administrators (tbsmadmin) can access the Administration > ServiceAdministration page and the Availability > Service Availability pages. Regularusers can only access the Service Availability pages. You can access the SystemStatus, Audit Log Records, Audit Log Configuration in Troubleshooting > TivoliBusiness Service Manager.You can also build custom Tivoli Integrated Portal views and pages and addthem to this list of tasks. For more information about creating custom views,see the IBM Tivoli Business Service Manager: Customization Guide.If you are having problems logging in, clicking the TBSM product name on theWelcome page displays the TBSM About page. Click the TBSM tab providesversion and support information. It also provides links to additional resources.Clicking the Support Information tab provides information that may bevaluable for problem determination situations.
4. To display a page in Tivoli Integrated Portal, click a page name in the leftnavigation pane. To view the default TBSM page, select Service Administrationfrom the pages list.The TBSM Service Administration page opens. If this is the first time you havelogged on, it shows the default view, with no configured services listed in theService Navigation portlet or in the Service Editor.After you have configured your services, the dependencies are displayed in theservice tree in the Service Navigation portlet on the left and graphically in theService Editor on the right.
Note: In Internet Explorer, TBSM automatically logs out when you press thebackspace key on the keyboard. You must log in again to resume your session.
Logging outThis topic describes how to log out of TBSM.
About this task
Click Logout at the top, right side of the page to log out of TBSM.
Note: Do not close the browser window or tab to exit the TBSM console. Alwaysclick Logout to exit. Otherwise, your user ID remains active until your sessiontimes out.
18 IBM Tivoli Business Service Manager: Service Configuration Guide
TBSM console overview
This topic describes the TBSM default pages and common portlet buttons.
In the left navigation pane, the default IBM Tivoli Business Service Manager(TBSM) console consists of default pages: Service Administration, ServiceConfiguration, Service Availability, and the Time Window Analyzer page. TheService Configuration and Service Administration pages are found under theAdministration node. The Service Availability and Time Window Analyzer pagesare located under the Availability node in the left navigation pane. Yourpermissions control which page you can view and use.
The default Service Administration page has four portlets:
Note: The Service Administration page will not be part of subsequent TBSMreleases. Use the Service Configuration page to configure your services models.v Service Navigation portlet on the upper left side shows summary information
about service templates, service instances, views, and data. The templates andservices are listed in trees.
v Service Editor on the upper right side shows a graphical service-dependencymodel and custom view definitions and lets you configure your servicetemplates and service instances.
v Event Summary portlet on the lower left side under the Service Navigationportlet shows a chart that summarizes the events that affect a given servicemodel. This feature will not be part of subsequent TBSM releases.
v Service Details portlet on the lower right side under the Service Editor showsdetailed information about the events that affect a service model, as well as dataon service level agreements and template rules. This feature will not be part ofsubsequent TBSM releases.
The default Service Availability page has four portlets:v Service Tree portlet on the upper left side shows summary information about the
service instances that are listed in trees.v Service Viewer on the upper right side shows a graphical service-dependency
model and custom view definitions. This feature will not be part of subsequentTBSM releases.
v Urgent Services portlet on the lower left side under the Service Tree portletshows a list of services that have a status defined as urgent.
v Service Details portlet on the lower right side under the Service Viewer showsdetailed information about the events that affect a service model as well as dataon service level agreements and template rules. This feature will not be part ofsubsequent TBSM releases.
The default Service Configuration page has two portlets:v Service Navigation portlet on the left side shows summary information about
service templates, service instances, views, and data. The templates and servicesare listed in trees.
v Service Editor on the right side shows a graphical service-dependency modeland custom view definitions. Use the Service Editor to configure your servicetemplates and service instances.
© Copyright IBM Corp. 2008, 2013 19

Note: If you are building services or configuring templates, this page is moreefficient because it loads faster than the Service Administration page.
The default Time Window Analyzer page can be used to show service trends overtime. It can compare trends between different services or compare trends for aservice against recent historical data for the same service. The Time WindowAnalyzer can also show service affecting events in relation to the service trends.When you configure the view you select the following options:v One or more services where you want to show key performance indicator (KPI)
values for a given time periodv A KPI value you want to plot over time. This value is a numeric rule that is part
of the service's template.v An Overlay that shows when the service status changed over the time period.v Other recent time periods showing the same data. The chart plots the data for
the recent time period on top of the chart for the most recent time period. TheTime Window Analyzer contains two elements:– The Compare frame lets you select the services you want to view in the chart,
and history for those services.– The Chart frame lets you select the KPI you want to plot and an Overlay you
want to display in the chart.
From the left navigation pane, expand Troubleshooting and Support > TivoliBusiness Service Manager, there are three default TBSM Troubleshooting pages:v System Statusv Audit Log Recordsv Audit Log Configuration
For more information, see the "Getting started with diagnosis" section in the IBMTivoli Troubleshooting Guide.
These portlets are explained in more detail in the sections that follow.
Common portlet buttons
This section describes the common refresh and navigation buttons for portlets inthe TBSM console.
Clicking the Expand button at the top right of the four portlets exposes the buttonsthat control how these portlets display.
Table 1 on page 21 describes the common refresh and navigation buttons.
Note: Not all buttons will be available on every portlet.
20 IBM Tivoli Business Service Manager: Service Configuration Guide
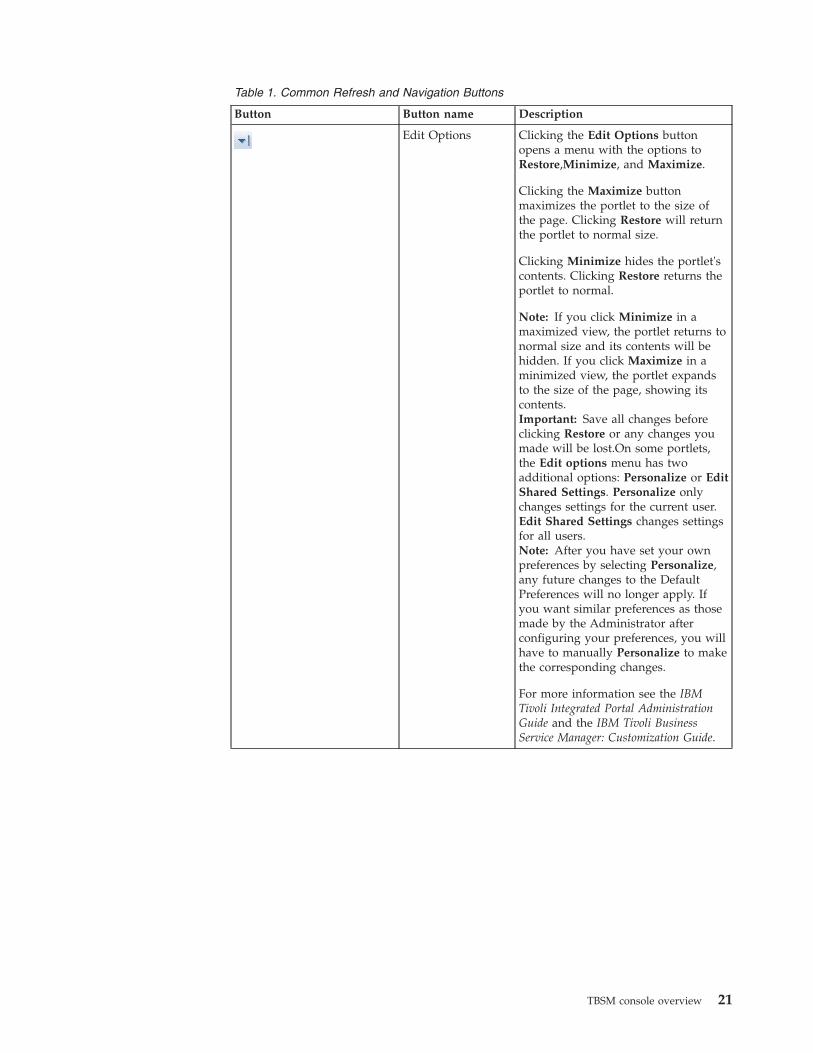
Table 1. Common Refresh and Navigation Buttons
Button Button name Description
Edit Options Clicking the Edit Options buttonopens a menu with the options toRestore,Minimize, and Maximize.
Clicking the Maximize buttonmaximizes the portlet to the size ofthe page. Clicking Restore will returnthe portlet to normal size.
Clicking Minimize hides the portlet'scontents. Clicking Restore returns theportlet to normal.
Note: If you click Minimize in amaximized view, the portlet returns tonormal size and its contents will behidden. If you click Maximize in aminimized view, the portlet expandsto the size of the page, showing itscontents.Important: Save all changes beforeclicking Restore or any changes youmade will be lost.On some portlets,the Edit options menu has twoadditional options: Personalize or EditShared Settings. Personalize onlychanges settings for the current user.Edit Shared Settings changes settingsfor all users.Note: After you have set your ownpreferences by selecting Personalize,any future changes to the DefaultPreferences will no longer apply. Ifyou want similar preferences as thosemade by the Administrator afterconfiguring your preferences, you willhave to manually Personalize to makethe corresponding changes.
For more information see the IBMTivoli Integrated Portal AdministrationGuide and the IBM Tivoli BusinessService Manager: Customization Guide.
TBSM console overview 21
Table 1. Common Refresh and Navigation Buttons (continued)
Button Button name Description
Refresh Clicking this button reloads thedisplay for a given portlet. Forexample, whenever you change yourservice instances or templates in theService Editor, click the Refreshbutton in the Service Navigationportlet to show the changes. Also,clicking this button returns the portletto the default view. For example, inthe Services tree, if you haveexpanded elements of the tree, clickingthis button closes them.
Note: If you click the Refresh buttonin the Service Editor, it refreshes to thedefault view. If you did not set astarting instance, it returns to thesplash screen.
Help Clicking this button allows you toaccess help for the portlet.
22 IBM Tivoli Business Service Manager: Service Configuration Guide

Service Navigation portlet
This topic describes the drop-down menu in the Service Navigation portlet.
The Service Navigation portlet, on the upper left of either the ServiceAdministration or the Service Configuration page contains a drop-down menuwith the objects:v Servicesv Templatesv Service Component Repositoryv Custom Canvasesv Datav Data Fetcherv Charts
Templates is open by default.
Right-click menus are accessible from the Service Navigation portlet. The menusgive you quick access to many of the editing functions in TBSM.
ServicesThis topic describes the elements in Services in the Service Navigation portlet.
Services in the Service Navigation portlet contains trees of service-dependencymodels that have been configured for TBSM. The service instances you see dependon your user and group permissions.
To see the full tree, click the plus symbols to the left of the services. To see a viewof a service or template in the Service Editor, click the name of the service ortemplate.
Table 2 describes the Services elements.
Table 2. Services elements
Services element Element type Description
Create NewService button
Click this button to create a service. Whenyou click this button, a blank Edit Servicetab opens in the Service Editor. Enter theparameters for the new service instance andclick the Save button.
Delete Servicesbutton
Click this button to select the services youwant to delete. When you click this button,the Delete Instances tab opens in the ServiceEditor.
In the Service Editor, select the services youwant to delete and click the Delete button.
© Copyright IBM Corp. 2008, 2013 23

Table 2. Services elements (continued)
Services element Element type Description
Search button Click this button to search for services. Whenyou click the Search button, a new windowopens. Enter a string in this field and clickthe Search button to search for services thatcontain the string you entered. The systemdisplays the search results alphabetically bydisplay name and service name.
For example, if you want to find all theservices with names like webserver1, enterwebs in the Search field.Important: Only services that are persistedwill return as search results. The searchfunction will not find services that are notpersisted.
Tree TemplateEditor button
Click this button to open an editor whereyou can create, design, and edit treetemplates.
Help button Click this button to access help.
Related tasks:“Assigning roles per service” on page 185This describes how to assign roles per service.“Service configuration” on page 163This topic describes how to create and edit services.“Opening the Tree Template Editor” on page 265This topic describes how to open the Tree Template Editor.
TemplatesThis topic describes the elements in Templates in the Service Navigation portlet.
Templates in the Service Navigation portlet contains a tree of service templatesthat have been configured for TBSM. The service templates you see and the actionsyou can perform depend on your user and group permissions.
To see the full tree, click the plus symbols to the left of the templates. A list oftemplates is displayed. To display a template in the Service Editor, click thetemplate name in the tree. These buttons are disabled if you do not havepermission to use them.
Table 3. Templates elements
Template element Element type Description
Create NewTemplate button
Click this button to create a service template.When you click this button, a blank EditTemplate tab opens in the Service Editor. Enterthe parameters for the new service templateand click the Save button.
24 IBM Tivoli Business Service Manager: Service Configuration Guide

Table 3. Templates elements (continued)
Template element Element type Description
Delete Templatesbutton
Click this button to select the templates youwant to delete. When you click this button, theDelete Templates tab opens in the ServiceEditor. In the Service Editor, select the templatesyou want to delete and click the Delete button.
Configure EventEnrichment button
Click this button to configure EventEnrichment. Event Enrichment allows you tomonitor an event source for new events. Impact"catches" new and updated alerts as they aresent to the ObjectServer, and then goes to oneor more external data sources to correlateinformation in the alerts with business data. Formore information, see the topic in the Tivoli®
Netcool/Impact Solutions Guide.
Help button Click this button to access help.
Service Component RepositoryThis topic describes the Service Component Repository in the Service Navigationportlet.
The services in the Service Component Repository (SCR) are required for theoptional Discovery Library Toolkit. When you import the SCR services andtemplates, TBSM creates a set of services and service templates. The default SCRservices and service templates enable TBSM to discover and create new servicesfrom Discovery Library data retrieved by the Toolkit. The discovered servicesdisplay in the Service Component Repository, accessed from the ServiceNavigation drop-down list. To monitor these services, you must create adependency between the SCR service and one of the services in the Services tree.
Note: The information that is displayed for the Service Component Registry in theServices tree reflects the last validation of top level resources such as AppServers,Oracle, and CICS. The Service Component Registry does not update the Servicestree in the same way as it updates the resources that are displayed the Services tab.CAUTION:Do not alter these services. Do not alter any of the service templates with aprefix of SCR or BSM. Altering these services and templates may cause theDiscovery Library Toolkit to malfunction. For more information about setting upthe Discovery Library Toolkit and working with SCR services, see the IBM TivoliBusiness Service Manager: Administrator's Guide and the IBM Tivoli Business ServiceManager: Customization Guide.
Custom CanvasesThis topic describes the elements in Custom Canvases in the Service Navigationportlet.
Custom Canvases in the Service Navigation portlet contains a list of the TBSMviews saved as custom canvases by users or the TBSM administrator. The canvasesyou see here depend on your user permissions.
Service Navigation portlet 25

Table 4 describes the Custom Canvases elements.
Table 4. Custom canvas elements (1 of 2)
Views element Element type Description
Create CustomCanvas button
Click this button to open an editor whereyou can create a custom canvas.
Refresh button Click this button to refresh the list of customcanvases. If you saved a custom canvas inthe Service Editor, click the Refresh buttonin the Custom Canvases to update thedisplay to show the new custom canvas.
Help button Click this button to access help.
Table 5 describes the right-click menu options for the Custom Canvases. Theseoptions are disabled if you do not have permission to use them.
Table 5. Right-click menu options for custom canvases
Right-click menu option Description
View Select this option to open the custom canvasin the Service Editor.
Delete Select this option to select the customcanvases you want to delete. If you selectDelete, a window opens. Click OK toconfirm that you want to delete this canvas.
Related tasks:“Assigning roles per service” on page 185This describes how to assign roles per service.“Creating new custom canvases” on page 336This topic describes how to create custom canvases.Related reference:“View Service toolbar and menus” on page 234This topic describes the elements of the View Service toolbar and menu.
DataThis topic describes the elements in Data in the Service Navigation portlet.
Data in the Service Navigation portlet shows a list of data sources that providedata for your service model. You can only configure data sources if you haveadministrator permissions for TBSM. When you edit or add a data source, the Edittab for data sources is displayed in the Service Editor. The tab for creating orediting data sources opens when you click the 'Create New Data Source' button inthe Service Navigation portlet or click on an existing data source.
Table 6 on page 27 describes the Data elements.
26 IBM Tivoli Business Service Manager: Service Configuration Guide
Table 6. Data elements
Data element Element type Description
Refresh button Click this button to refresh thelist of data sources. If youcreated a data source in theEdit tab for data sources, clickthe Refresh button in Data toupdate the display to showthe new data source.
Create New DataSource button
Click this button to create adata source. When you clickthis button, a blank New DataSource tab opens in theService Editor. Enter theparameters for the new datasource and click the Savebutton.
Help button Click this button to accesshelp.
Table 7 describes the Data right-click menus. These options are disabled if you donot have permission to use them.
Table 7. Right-click menu options for Data Sources
Right-click menu option Description
Edit This right-click option opens the Edit tab inthe Service Editor, where you can edit a datafetcher.
Delete This right-click menu option deletes the datasource.
Data FetcherThis topic describes the elements in Data Fetcher in the Service Navigation portlet.
The Data Fetcher in the Service Navigation portlet shows a list of data fetchersthat have been configured to deliver data periodically from databases. The DataFetcher allows you to query a database and use the data to affect the status of aservice model. The data can also be used to auto-populate the service model.
You can define a data fetcher for the following types of databases:v Oraclev Sybasev MS-SQLv MySQLv Informixv DB2
Table 8 on page 28 describes the Data Fetcher elements. These buttons are disabledif you do not have permission to use them.
Service Navigation portlet 27

Table 8. Data Fetcher Elements
Data Fetcher element Element type Description
Refresh button Click this button to refreshthe list of data fetchers. Ifyou create a data fetcherin the Data Browser, clickthe Refresh button in theData Fetcher to update thedisplay to show the newfetcher.
Create New DataFetcher button
Click this button to openthe New Data Fetcher tabin the Service Editor,where you can configure anew data fetcher.
Help button Click this button to accesshelp.
Table 9 describes the Data Fetcher right-click menus. These options are disabled ifyou do not have permission to use them.
Table 9. Right-click options for Data Fetchers
Right-click menuoption Description
Edit This right-click option opens the Edit tab in the Service Editor,where you can edit a data fetcher.
Fetch Now This right-click option runs the data fetcher and the resulting eventsare processed by the server.
Show log This right-click option opens a log for the data fetcher activity in theService Editor.
Enable/Disable This right-click option disables/enables the data fetcher.
Delete This right-click option deletes the data fetcher.
The Status column indicates the status of the data fetcher. For example, a greenstatus indicates a data fetcher is working correctly.Related tasks:“Setting the polling criteria” on page 53This task describes how to set the polling criteria, configure a daily fetch, and setthe fetching interval.
ChartsThis topic describes the elements in Charts in the Service Navigation portlet.
Note: While it is possible to use Business Intelligence and Reporting Tools (BIRT)to work with charts in TBSM, this feature is deprecated. The information providedin this section is provided for your convenience only.Charts in the Service Navigation portlet lets you create a BIRT Designer chart aspart of the TBSM. The charts you create can access any data sources you use foryour service models. To open the portlet, select Charts from the Service Navigationdrop-down list.
28 IBM Tivoli Business Service Manager: Service Configuration Guide

The table below describes the Charts elements. These options are disabled if youdo not have permission to use them.
Table 10. Charts Elements
Charts element Description
Refresh
Click this button to refresh the list of charts.If you create a chart, click the Refreshbutton in Charts to update the display toshow the new chart.
Create New Chart
Click Create New Chart to add a new chart.The New Chart tab opens in the ServiceEditor.
Help
Click this button to access help.
The table below describes the Charts right-click menu options.
Table 11. Right-click menu option for Charts
Right-click menu option Description
Edit This right-click option opens the Edit tab inthe Service Editor, where you can edit achart.
Delete This right-click option deletes the chart.
Related concepts:“TBSM Charts” on page 301This topic describes how to use the IBM Tivoli Business Service Manager (TBSM)Charts tool to create reports.
Service Navigation portlet 29

30 IBM Tivoli Business Service Manager: Service Configuration Guide

Service Editor
This topic describes the Service Editor portlet.
When you click a service, service template, custom canvas, data source, or datafetcher in the Service Navigation portlet, a detailed display opens in the ServiceEditor, either a graphical view or an editor depending on what you selected. Someof these options have no graphical view.
The toolbar for each view or editor contains tools appropriate for that tab.
Note: If you click the Refresh button in the Service Editor, it refreshes to thedefault view. If you did not set a starting instance, it displays the "No servicecurrently selected" message. Select an instance, and it will display in the ServiceEditor.
The Service Editor contains two tabs:v View Service contains either the default service-dependency view or a
customized service view. Customized views can be set to display for a usergroup or individual users.
v Edit Service contains an editor for service instances, service templates, or datasources, depending on what you selected from the Service Navigation portlet.
Right-click menus are accessible from the Service Editor. The menus give you quickaccess to many of the editing functions in TBSM.
Note: By default, the Service Editor portlet, which can both view and edit, isfeatured on the Service Configuration and Administration pages.Related tasks:“Assigning roles per service” on page 185This describes how to assign roles per service.“Creating and editing view definitions” on page 277This topic describes how to create and edit view definitions.“Static custom visual elements” on page 339This topic describes how to configure visual elements for a view.Related reference:“View Service toolbar and menus” on page 234This topic describes the elements of the View Service toolbar and menu.
View Service and Template tabsThis topic describes the View Service and Template tabs in the Service Editor.
The View Service tab shows a graphical dependency model of related services orservice templates and lets you change the view of the service model. It can alsodisplay a customized service view that contains charts and indicators.
This view requires a Java plug-in and allows you to customize your view morefully and save custom views. The client loads once from the TBSM server andrenders the display from your local machine.
© Copyright IBM Corp. 2008, 2013 31

When you mouse over a service in the View Service tab graphical display in thefull client view, information about the service name and the template it belongs todisplays.Related tasks:“Overview tool” on page 239This topic describes the overview tool.Related reference:“View Service toolbar and menus” on page 234This topic describes the elements of the View Service toolbar and menu.
Edit tabsThis topic describes the Edit tab in the Service Editor.
The Edit tab let you configure your service templates, service instances, servicecomponent repository, data sources, and data fetchers in TBSM.
Edit Service tab toolbar
Table 12 describes the Edit tabs' tools.
Table 12. Edit tab toolbar
Button Name Description
Save button Click this button to save the information that youentered in one of the tabs in an editor. You mustsave your entries in each tab before continuing tothe next one.
Help button Click this button to access help for the tab.
Refreshbutton
Click this button to reload the last saved values fora given tab. (Not applicable to every editor.)
Edit tab editorsThis topic describes the Edit tab editors in the Service Editor.
The Edit tab contains one of the editors, depending on what you selected from theService Navigation portlet. These tabs are described in the following sections.
Edit Service tab
When you click a service or view, or create a service or view, the Edit Service tabis displayed. You configure template assignments, dependent services, and otherattributes for the selected service in this tab.
Edit Template tab
Service templates define how services respond to external data and the status ofother services. You can assign (or tag) a service with a template or templates. Whenyou select a service template or create a template, the Edit Template tab isdisplayed. You configure rules, output expressions, and other attributes for theselected service template in this tab.
32 IBM Tivoli Business Service Manager: Service Configuration Guide

Edit Data Source tab
When you click a data source or create a data source, the tab for creating or editingdata sources is displayed in the Service Editor. You set up a data source to accessadditional data about your services. You can only configure data sources if youhave administrator permissions for TBSM. In the Edit Data Source tab, you enterthe information you need to access the data in a database such as an ObjectServeror an SQL database.
Edit tab for Data Fetcher
When you click a data fetcher or create a data fetcher, the Edit Data Fetcher tabopens in the Edit tab of the Service Editor. You set up data fetchers to queryexternal databases and use the returned data to affect the status of the servicemodel.
Delete tab
When you click a Delete button for services or templates, the appropriate Deletetab is displayed in the Service Editor. Select the item or items you want to deletefrom the Delete tab and click the red Delete button in the Delete tab toolbar.Related tasks:“Service configuration” on page 163This topic describes how to create and edit services.“Creating a data source” on page 46This task describes how to create your own data source.“Building the query” on page 123This topic describes how to build queries using Query Builder.
Service Editor 33

34 IBM Tivoli Business Service Manager: Service Configuration Guide

Service Viewer
This topic describes the Service Viewer portlet.
Note: This feature will not be part of subsequent TBSM releases.When you click a service in the Service Tree portlet, a detailed, graphical displayopens in the Service Viewer.
The Service Viewer contains either the default service-dependency view or acustomized service view. Customized views can be set to display for a user groupor individual users.
The Service Viewer shows a graphical dependency model of related services andlets you change the view of the service model. This view requires a Java plug-inand allows you to customize your view and save custom views. The client loadsonce from the TBSM server and renders the display from your local machine. Itcan also display a customized service view that contains charts and indicators.
When you mouse over a service in the Service Viewer graphical display in thisview, information about the service name and the template it belongs to displays.
Right-click menus are accessible from the Service Viewer.
Note: By default, the Service Viewer, which does not include the ability to edit, isfeatured on the Service Availability page.
© Copyright IBM Corp. 2008, 2013 35

36 IBM Tivoli Business Service Manager: Service Configuration Guide

Event Summary portlet
This topic describes the Event Summary portlet.
The Event Summary portlet under the Service Navigation portlet shows a chartthat displays information about events related to your service model. By default, itshows a summary for all the events in the ObjectServer. If you click a service inthe Services tree, the chart shows a summary of events for all child services of theselected item.
Note: This portlet is featured on the Service Administration page, not on theService Availability.
© Copyright IBM Corp. 2008, 2013 37

38 IBM Tivoli Business Service Manager: Service Configuration Guide
TBSM service model configuration overview
TBSM lets you create models of the services required to monitor your organization.In TBSM, these models are called service models. Figure 2 on page 40 describes ahigh-level overview of the process required to create a TBSM service model. Thesequence of the stages is a general guideline, since you can perform some of thesestages out of sequence. The sections that follow the figure are numbered accordingto the sequence in Figure 2 on page 40.
For more information about each stage see:v “1 Plan your service model” on page 40v “2 Create service templates” on page 41v “3 Create structural dependencies” on page 41v “4 Identify data sources” on page 41v “5 Create incoming status and numerical rules” on page 41v “6 Create services” on page 42v “7 Create custom service trees and views” on page 43v “8 Create SLAs” on page 43v “9 Set permissions” on page 43v “10 Monitor services” on page 43
© Copyright IBM Corp. 2008, 2013 39

1 Plan your service modelBefore you start to configure a service model in TBSM, it is important to develop aplan that includes information about the services and service dependencies youwant TBSM to monitor. Identify distinct service types that have commoncharacteristics.
To help you identify the common service types, create a draft model of this servicehierarchy in TBSM that includes the following information:v What do you monitor in your environment now with applications such as IBM
Tivoli Monitoring, ITCAM applications, Netcool/OMNIbus, and otherapplications? How would you visualize this incoming data for your clients?
v What business units or customers do you want to create dashboards for? Thedashboard for the IT department is different from a dashboard for an executive.What data sources do you need to access and filter for your dashboards?
v What are the key performance indicators and other data you want to highlighton your dashboards.
v What are the highest level services you want to monitor on your dashboard? Dothese services represent customers, business departments, or a business? You canmap out services to represent them and their dependencies.
Figure 2. Service model creation process
40 IBM Tivoli Business Service Manager: Service Configuration Guide

v What are the applications, devices–and so on–that support the high-levelservices? That is, what are the dependencies for the high-level services? You canmap out child services to represent these items.
v How do the child services affect the high-level or parent services at the top ofthe service hierarchy?
v What are the Netcool/OMNIbus events and other data that affect each servicetype?
2 Create service templatesWhen you have figured out the service hierarchy, create service templates forservices that share common behavior. For example, if you want to monitormultiple web servers, you create a web server template that defines the attributescommon to all the web servers. When you create services, you assign these serviceinstances to a given service template.
3 Create structural dependenciesIn service templates, you define the relationships between the various services toset the structure for a given service model. These rules aggregate the overallservice status based on the rule-output values for multiple child services and arecalled dependency-aggregation rules. These rules are based on status values suchas Bad or Marginal that are passed from child service templates.
4 Identify data sourcesIdentify the data sources that contain information about the services you want tocreate. You use this data to build your service model structure, and to monitor thestatus of the services in the model. TBSM uses the default ObjectServer that isinstalled with TBSM as a data source for your service models. You can alsoconfigure SQL databases as data sources and select data with SQL queries.
Also, you must configure Netcool/OMNIbus or database queries so that a singleevent or row shows the status of a given service.
5 Create incoming status and numerical rulesIn TBSM, three types of rules determine the status of a given service or calculate anumerical rule-output value based on external data:v Incoming status rulesv Numerical aggregation rulesv Numerical formula rules
Incoming status rules
TBSM service templates have the following types of incoming status rules:v Good, Marginal, and Bad rulesv Numerical rules
TBSM uses Good, Marginal, and Bad incoming status rules to obtain the generalstate of a service from an incoming ObjectServer event or other data. The generalservice state is determined by comparing threshold values set in the rule definition
TBSM service model configuration overview 41
to event field values or field values in other incoming data. When this type of ruleis processed, TBSM obtains a general service state of Good, Marginal, or Bad andassigns this value to the service instance.
TBSM uses numerical incoming status rules to obtain a numerical value from fieldsin ObjectServer events or other data and then to associate this value with a serviceinstance as a rule-output value. The resulting rule-output value is stored inmemory and identified by the rule name where referenced elsewhere in TBSM.
TBSM uses numerical and text incoming status rules to obtain a value from fieldsin ObjectServer events or other data and then to associate this value with a serviceinstance as a rule-output value. The resulting rule-output value is stored inmemory and identified by the rule name where referenced elsewhere in TBSM.
Numerical aggregation rules
TBSM uses numerical aggregation rules to combine rule-output values of the sametype across a set of child service instances. This type of rule is defined as part ofthe parent service template. The rule-output values combined by a numericalaggregation rule can be generated by incoming numerical-status rules or by otheraggregation and numerical formula rules.
Numerical formula rules
TBSM uses numerical formula rules to combine rule-output values of differenttypes within the same service instance. These output values can be generated byincoming numerical-status rules or by numerical aggregation rules. When anumerical formula rule is processed, the resulting combined output value isassigned to the same service instances where the original output values existed.
6 Create servicesWhen you have defined the rules for service templates in your model, then youcreate the service instances for your service model. A service instance, or service, isa unique instance of a given service template. For example, if you have an E-mailServer service template, you can assign services called e-mail1, e-mail2, ande-mail3 to the service template.
Optionally, you can automatically create the services by creating auto-populationrules, External Service Dependency Adaptor (ESDA) rules or with the DiscoveryLibrary Toolkit.
Service name restrictions
Important: TBSM checks the Service Name field for invalid characters. The Namefield for services must not contain these special characters:" < > \ * ? | ;
TBSM will not create a service when the Name field contains any of these invalidcharacters. If the object does not save, remove any special characters from thename field.
Service names longer than 127 characters can cause display and performanceissues.
42 IBM Tivoli Business Service Manager: Service Configuration Guide

Service names longer than 127 characters will be truncated in the Service Detailsportlet display. This does not affect the functioning of TBSM, but the truncatedservice name will appear in the Service Details portlet.
If you use the Node column in Netcool/OMNIBus to create or match yourservice name: The node column is limited to 64 characters. If the service name isgreater than 64 characters, it will be truncated and TBSM will not receive anyevents for the service.
You can either change the incoming status rule to use different service instancenaming fields, or you can change the identification fields for a service with a longname. The identification field or fields can be different than the service namingfield or fields. For example, if you have a service name that uses the Node columnfor its name, and the name is longer than 64 characters, the service will not receiveevents. To fix this, you can specify another field, such as a field that contains the IPaddress as the Identification field for the service.
7 Create custom service trees and viewsWhen you configure your numerical rules, you can display the rule-output valuesin the Services tree (Service Availability) or in the Service Editor (ServiceConfiguration or Service Administration) or Service Viewer (Service Availability).
8 Create SLAsOptionally, you can define service level agreement (SLA) settings for the servicetemplates in your model. You can measure the downtime and the number ofoutages over a given time period in relation to the SLAs for your organization. Formore information about SLA rules, see the TBSM Service Configuration Guide.
9 Set permissionsFor users and user groups, you can define the view and edit permissions for agiven service template or service instance. For example, if you have 10 servicemodels, you can set user group permissions to view and edit only two of themodels. You use the Tivoli Integrated Portal Users and Groups tasks to managepermissions for pages and portlets. To manage object level permissions, use theSecurity tab in the service and template editors.
10 Monitor servicesWhen you set up your TBSM service model, you can monitor it and change itsappearance in the Service Viewer. For more information, see the TBSM ServiceConfiguration Guide.
TBSM service model configuration overview 43

44 IBM Tivoli Business Service Manager: Service Configuration Guide

Data sources
This section describes the use of data sources in IBM Tivoli Business ServiceManager (TBSM) and explains how to configure them.Related concepts:“Chart data sources” on page 303The section describes the chart data sources.
About data sourcesThis topic describes data sources along with unique driver-specific requirements.
A TBSM data source provides connection information to an external source of data(for example, a relational database) that contains information that affects the statusof services in your service model.
To establish a database connection between TBSM and a data source such as anObjectServer or a database, you configure the connection information in the Edittab for data sources.
You must create a data source mapping for each data source that you want toaccess within TBSM. Data sources store database information such as the hostname, port, and user information you need to connect to the data source.
Only certain types of data sources are supported. These types are listed in SQLType drop-down list. The TBSM software supports the following externalapplications for data sources:v ObjectServer (see first note)v Informixv Sybasev Oraclev MySQLv MS-SQLv Postgresv DB2
Note: The default ObjectServer is optimized for TBSM. Do not use an ObjectServerdata source unless you want to use a table other than alert.status.
Note: If you want to use any non-SQL data sources, you need to useNetcool/Impact to extend TBSM for these environments. See the Netcool/Impactdocumentation for more information.
MySQL data source requirements
Before you add a MySQL data source to TBSM, you need to grant privileges toTBSM server's host machine on your MySQL server. Otherwise, you will not beable to establish a connection between your TBSM host and your MySQL datasource.
© Copyright IBM Corp. 2008, 2013 45
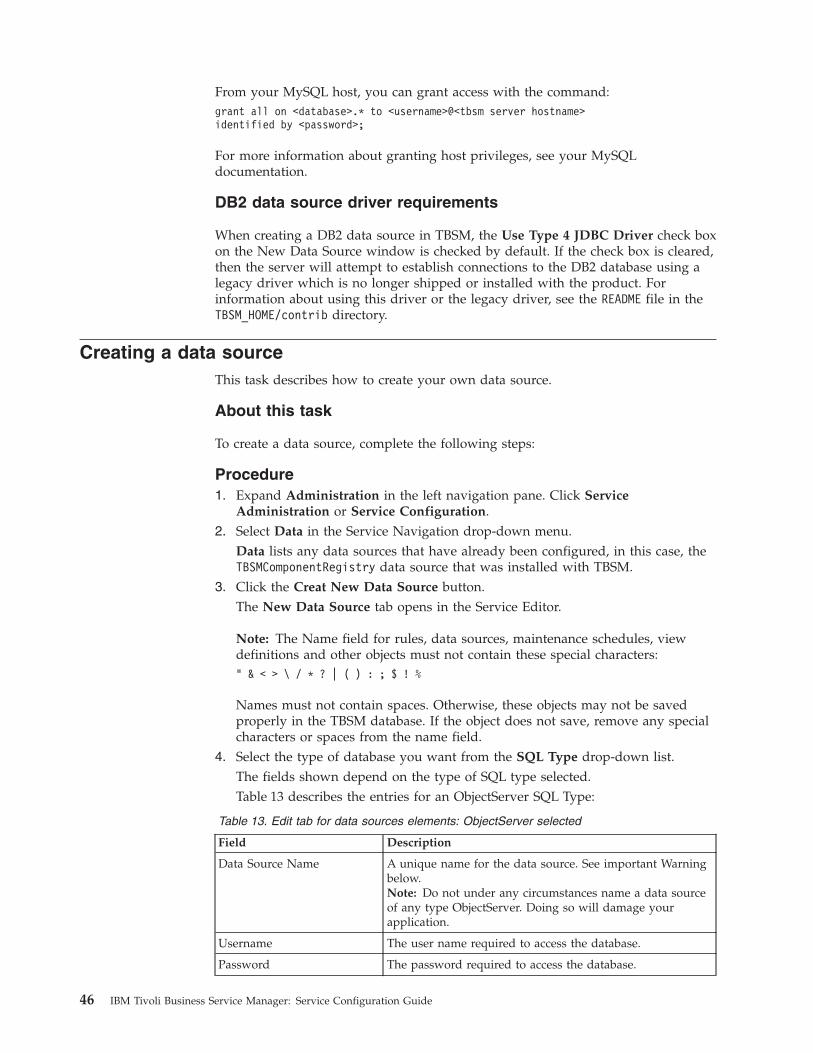
From your MySQL host, you can grant access with the command:grant all on <database>.* to <username>@<tbsm server hostname>identified by <password>;
For more information about granting host privileges, see your MySQLdocumentation.
DB2 data source driver requirements
When creating a DB2 data source in TBSM, the Use Type 4 JDBC Driver check boxon the New Data Source window is checked by default. If the check box is cleared,then the server will attempt to establish connections to the DB2 database using alegacy driver which is no longer shipped or installed with the product. Forinformation about using this driver or the legacy driver, see the README file in theTBSM_HOME/contrib directory.
Creating a data sourceThis task describes how to create your own data source.
About this task
To create a data source, complete the following steps:
Procedure1. Expand Administration in the left navigation pane. Click Service
Administration or Service Configuration.2. Select Data in the Service Navigation drop-down menu.
Data lists any data sources that have already been configured, in this case, theTBSMComponentRegistry data source that was installed with TBSM.
3. Click the Creat New Data Source button.The New Data Source tab opens in the Service Editor.
Note: The Name field for rules, data sources, maintenance schedules, viewdefinitions and other objects must not contain these special characters:" & < > \ / * ? | ( ) : ; $ ! %
Names must not contain spaces. Otherwise, these objects may not be savedproperly in the TBSM database. If the object does not save, remove any specialcharacters or spaces from the name field.
4. Select the type of database you want from the SQL Type drop-down list.The fields shown depend on the type of SQL type selected.Table 13 describes the entries for an ObjectServer SQL Type:
Table 13. Edit tab for data sources elements: ObjectServer selected
Field Description
Data Source Name A unique name for the data source. See important Warningbelow.Note: Do not under any circumstances name a data sourceof any type ObjectServer. Doing so will damage yourapplication.
Username The user name required to access the database.
Password The password required to access the database.
46 IBM Tivoli Business Service Manager: Service Configuration Guide
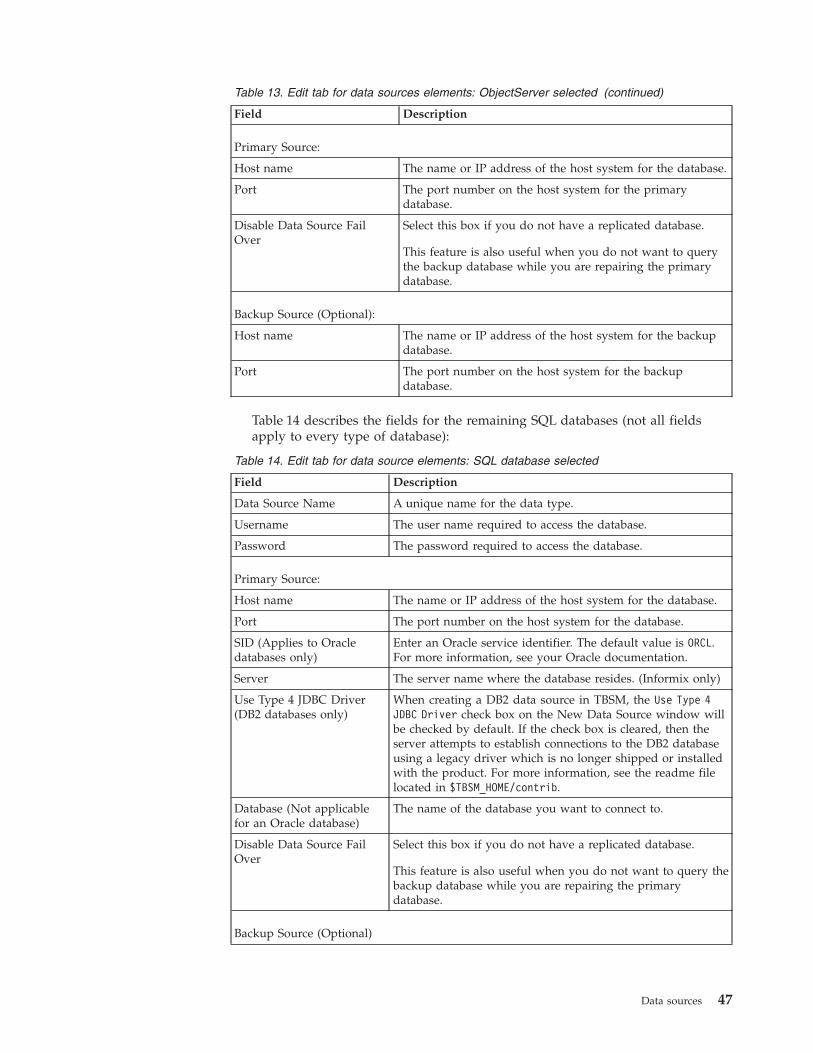
Table 13. Edit tab for data sources elements: ObjectServer selected (continued)
Field Description
Primary Source:
Host name The name or IP address of the host system for the database.
Port The port number on the host system for the primarydatabase.
Disable Data Source FailOver
Select this box if you do not have a replicated database.
This feature is also useful when you do not want to querythe backup database while you are repairing the primarydatabase.
Backup Source (Optional):
Host name The name or IP address of the host system for the backupdatabase.
Port The port number on the host system for the backupdatabase.
Table 14 describes the fields for the remaining SQL databases (not all fieldsapply to every type of database):
Table 14. Edit tab for data source elements: SQL database selected
Field Description
Data Source Name A unique name for the data type.
Username The user name required to access the database.
Password The password required to access the database.
Primary Source:
Host name The name or IP address of the host system for the database.
Port The port number on the host system for the database.
SID (Applies to Oracledatabases only)
Enter an Oracle service identifier. The default value is ORCL.For more information, see your Oracle documentation.
Server The server name where the database resides. (Informix only)
Use Type 4 JDBC Driver(DB2 databases only)
When creating a DB2 data source in TBSM, the Use Type 4JDBC Driver check box on the New Data Source window willbe checked by default. If the check box is cleared, then theserver attempts to establish connections to the DB2 databaseusing a legacy driver which is no longer shipped or installedwith the product. For more information, see the readme filelocated in $TBSM_HOME/contrib.
Database (Not applicablefor an Oracle database)
The name of the database you want to connect to.
Disable Data Source FailOver
Select this box if you do not have a replicated database.
This feature is also useful when you do not want to query thebackup database while you are repairing the primarydatabase.
Backup Source (Optional)
Data sources 47
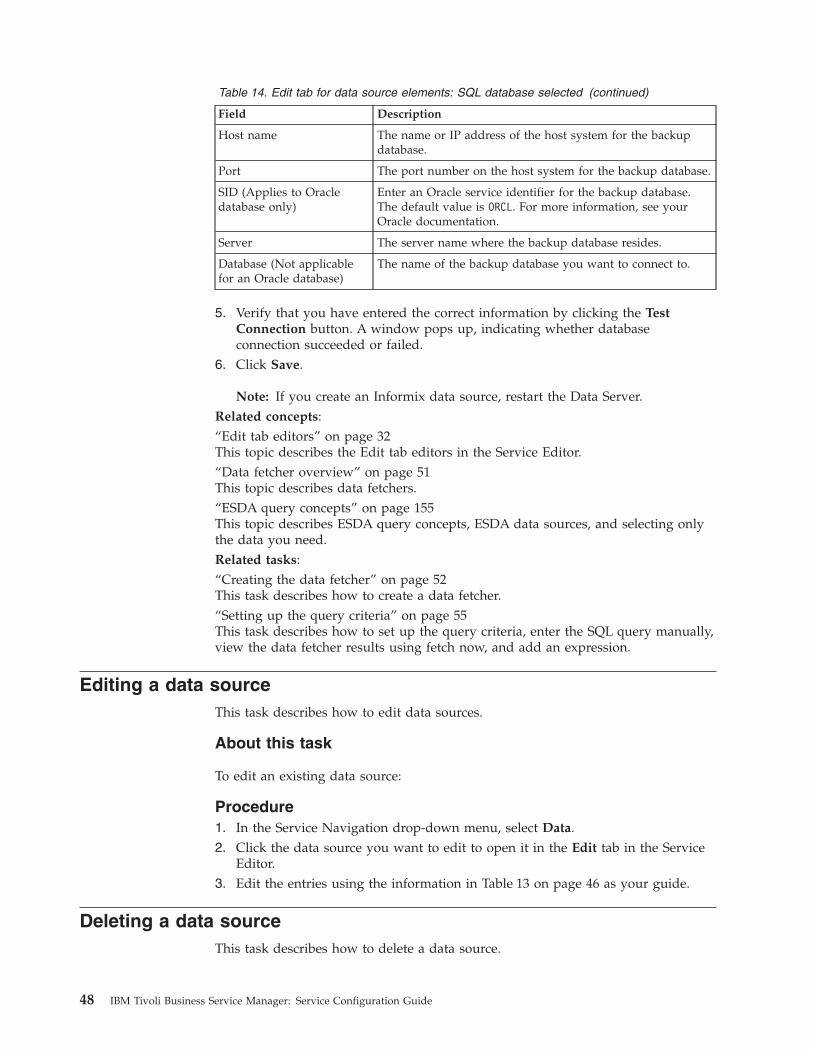
Table 14. Edit tab for data source elements: SQL database selected (continued)
Field Description
Host name The name or IP address of the host system for the backupdatabase.
Port The port number on the host system for the backup database.
SID (Applies to Oracledatabase only)
Enter an Oracle service identifier for the backup database.The default value is ORCL. For more information, see yourOracle documentation.
Server The server name where the backup database resides.
Database (Not applicablefor an Oracle database)
The name of the backup database you want to connect to.
5. Verify that you have entered the correct information by clicking the TestConnection button. A window pops up, indicating whether databaseconnection succeeded or failed.
6. Click Save.
Note: If you create an Informix data source, restart the Data Server.Related concepts:“Edit tab editors” on page 32This topic describes the Edit tab editors in the Service Editor.“Data fetcher overview” on page 51This topic describes data fetchers.“ESDA query concepts” on page 155This topic describes ESDA query concepts, ESDA data sources, and selecting onlythe data you need.Related tasks:“Creating the data fetcher” on page 52This task describes how to create a data fetcher.“Setting up the query criteria” on page 55This task describes how to set up the query criteria, enter the SQL query manually,view the data fetcher results using fetch now, and add an expression.
Editing a data sourceThis task describes how to edit data sources.
About this task
To edit an existing data source:
Procedure1. In the Service Navigation drop-down menu, select Data.2. Click the data source you want to edit to open it in the Edit tab in the Service
Editor.3. Edit the entries using the information in Table 13 on page 46 as your guide.
Deleting a data sourceThis task describes how to delete a data source.
48 IBM Tivoli Business Service Manager: Service Configuration Guide

About this task
To delete an existing data source:
Procedure1. In the Service Navigation portlet drop-down menu, select Data.2. Right-click the data source you want to delete, and select Delete.
A message window opens asking you to confirm the deletion.3. Click OK to delete the data source.
Data sources 49

50 IBM Tivoli Business Service Manager: Service Configuration Guide
Data fetchers
This section describes how to set up and use a data fetcher in IBM Tivoli BusinessService Manager (TBSM).Related concepts:“Chart data sources” on page 303The section describes the chart data sources.
Data fetcher overviewThis topic describes data fetchers.
Data fetchers query a data source at intervals and then provide the data returnedfrom the query to TBSM for use in determining the status of a service. When youconfigure a data fetcher, you specify the terms of the query and the query interval.
After you have created a connection to an external data source, you can configurea data fetcher to send queries to the database. The database returns the results ofthe query to TBSM. Data fetchers can be configured in SQL and IBM TivoliMonitoring Policy (backed by an ITM web service).
You can configure queries to any of the databases defined in TBSM.
Note: The default ObjectServer is optimized for TBSM. Do not use an ObjectServerdata fetcher unless you want to use a table other than alert.status.
After you have set up the criteria for the data fetcher, you can use the queried datato complete the following steps in TBSM:v Create incoming status rules to update the status of service instancesv Create auto-population rules that are based on the incoming status rules that are
based on the data fetcher data
You configure the Data Fetcher's polling period to run either periodically or at thesame time each day.
Note: The data fetcher results can be cached. There are benefits to configuring thedata fetcher to allow it to cache data. However, you should configure the datafetcher to cache the numbers of rows that is appropriate for your configuration andalso be aware of the limitations of caching. For more information about configuringdata fetcher caching, seeData fetcher tuning in the IBM Tivoli Business ServiceManager Administrator's Guide.
Data fetcher set up
Use the procedures in this section to set up a new data fetcher. Some of theexamples in this section use data from the TBSMDEMO.tickets table in the tbsmDBdatabase that is included with your installation of TBSM. Those examples arebased on the tutorials included in the TBSM Scenarios Guide.
© Copyright IBM Corp. 2008, 2013 51

Time interval hints
When you enter an invalid time, a hint is displayed next to the field showing theacceptable format for the time. The format expressed is like the Java classjava.text.SimpleDateFormat.
Table 15. Time hint notation
Notation Description
h 12 hour clock time.
H 24 hour clock time.
t The am or pm indicator for 12 hour clock time.
hh Hours with leading zero (01, 02, and so on).
mm Minutes with leading zero (01, 02, and so on).
h Hours without a leading zero (1, 2, and so on).
m Minutes without a leading zero (1, 2, and so on).
Related tasks:“Creating a data source” on page 46This task describes how to create your own data source.“Building the query” on page 123This topic describes how to build queries using Query Builder.“Create and edit good, marginal, and bad incoming status rules” on page 84This topic describes how to create and edit good, marginal, and bad incomingstatus rules. This topic also describes properties and conditions for incoming statusrules.“Adding auto-population rules” on page 110This topic describes auto-population rules. This topic also describes how to setstatus auto-population rules.
Setting up a data fetcherUse the procedures in this section to set up a new data fetcher. Some of theexamples in this section use data from the TBSMDEMO.tickets table in the tbsmDBdatabase that is included with your installation of TBSM. Those examples arebased on the tutorials included in the TBSM Scenarios Guide.
Creating the data fetcherThis task describes how to create a data fetcher.
About this task
To create a data fetcher called RegionalTickets, complete the following steps:
Procedure1. Click Data Fetcher in the Service Navigation drop-down menu.
The Data Fetcher opens.
Note: Before you can set up a data fetcher in TBSM, you must first configure adata source connection to the database.
52 IBM Tivoli Business Service Manager: Service Configuration Guide

2. Click Create New Data Fetcher in the Data Fetcher toolbar to set up a newdata fetcher.
The New Data Fetcher tab opens in the Service Editor.3. Enter a unique name for the data fetcher.
Note: Data Fetcher names are not case-sensitive. For example, TBSM seesDBFetch1 and dbfetch1 as the same data fetcher.
Important: The Name field for data fetchers must not contain these specialcharacters:$ ! % & " < > | : / * \ ?
Names must not contain spaces. Otherwise, these objects may not be savedproperly in the TBSM database. If the data fetcher does not save, remove anyspecial characters or spaces from the name field.
4. After you enter a valid name for the data fetcher you can do the following:v Set the polling criteriav Set the query for the data fetcherv If you want to set up a Tivoli Monitoring Policy data fetcher, see Data fetchers
for Tivoli Monitoring in the TBSM Customization Guide.
What to do next
Note: If you select to delete a Data Fetcher while the Data Fetcher is currentlybeing edited in the Editor, the Editor will not be automatically closed.Related concepts:“Query Builder overview” on page 123This topic describes Query Builder.Related tasks:“Creating a data source” on page 46This task describes how to create your own data source.Related reference:“Incoming status rules properties and conditions” on page 80This reference topic describes these incoming status rule properties and conditions:rule name, data feed name, event discriminators, name expression, filter, and ruleoutput expression.
Setting the polling criteriaThis task describes how to set the polling criteria, configure a daily fetch, and setthe fetching interval.
About this task
This section explains how to select the polling criteria. First you need to decidewhether you want the data returned at an interval that you specify or whether youwant the data returned at a specific time each day. The next section describes howto set a daily fetch.
Figure 3. Create New Data Fetcher button
Data fetchers 53
Note: When you configure a query in the data fetcher for the first time and test it,it is better to select the Daily Fetch at option. If you configure a query to use thefetching interval option, you could be running an incomplete data fetcher manytimes, which could produce strange results. Before testing your query each time,use the Fetch Now right-click menu in the Service Navigation portlet to reset thedata. You can find the Fetch Now if you right-click your test data fetcher in theData Fetcher in the Service Navigation portlet.
Note: The default query timeout is 2 minutes. You can change the timeout lengthin the RAD_server.props file. The property name is server.timeout and thetimeout is in milliseconds. The default timeout of server.timeout=120000 is 2minutes.Related concepts:“Data Fetcher” on page 27This topic describes the elements in Data Fetcher in the Service Navigation portlet.
“Using the data fetcher results” on page 61“ESDA queries” on page 148This topic describes ESDA queries.
Configuring a daily fetchAbout this task
To configure a data fetcher to poll data from a database once a day, select the FetchDaily at radio button and enter or select the time you want to retrieve the data.Since this example explains how to set up a test data fetcher, it uses the DailyFetch at option.
Note: When setting up a daily fetch, you do not have to enter any information inthe interval setting fields.
Procedure1. Select the Fetch Daily at radio button.2. Accept the default setting to run the query once a day at 12:00. For this
example, you use the Fetch Now right-click menu in the Service Navigationportlet's Data Fetcher to run this data fetcher.
3. To enter the polling criteria manually, see “Setting up the query criteria” onpage 55. To use the Query Builder, see “Query Builder” on page 123.
Setting the fetching intervalAbout this task
This section describes how to set the minimum and maximum intervals betweenfetches.
To set a fetching interval, you select the minimum and maximum intervalsbetween fetches. Since the length of time a fetch takes depends on the number ofrows returned, the length of time before the next fetch is determined bymultiplying the number you set in the Fetcher Interval Multiplier field by thetime it took to return and process the records from the last fetch. Use theinformation in Table 16 on page 55 to help you set the fetching interval.
54 IBM Tivoli Business Service Manager: Service Configuration Guide

Table 16. Setting the fetching interval
Editor element Description
Minimum Interval BetweenFetches spin field
Enter or select the minimum interval between fetches.
Maximum Interval BetweenFetches spin field
Enter or select the maximum interval between fetches.
Fetcher Interval Multiplier The system determines the fetching interval by multiplyingthe number (for example, 5) entered in this field by the timeit took to fetch and process the records from the previousfetch. The fetching interval will not exceed the number ofseconds set in the Maximum Interval Between Fetches field,for example, 300. It will also not fall below the number ofseconds set in the Minimum Interval Between Fetches field,for example, 30.
If the Data Fetcher takes 60 seconds to fetch and process therecords, the next fetch would begin in 300 seconds (60 x 5).
Setting up the query criteriaThis task describes how to set up the query criteria, enter the SQL query manually,view the data fetcher results using fetch now, and add an expression.
About this task
After you have set up the polling criteria, you are ready to select the data youwant from the database by building an SQL query.
Note: When you create your query, be sure to select only the fields that you needto identify unique service names and create incoming status rules for the servicesyou want to model. For a given service instance, your query must select only onerow that contains the values you want to retrieve with a given incoming statusrule.
You have two options for building the query:v Select a previously configured data source from the drop-down list and enter an
SQL statement manually in the space provided.v Click Query Builder to use the Query Builder wizard. Within the Query Builder
wizard, you can either select an existing data source or configure a new one andthen use the wizard to help you build the query. For information about how touse the Query Builder, see the TBSM Scenarios guide.
Note: If you use the Query Builder to build the query, you should only edit itusing the Query Builder. If you change the query manually in the text area,those changes will not be reflected in the Query Builder windows. You wouldhave to rebuild the query again in the Query Builder.
Related concepts:“Query Builder overview” on page 123This topic describes Query Builder.Related tasks:“Creating a data source” on page 46This task describes how to create your own data source.
Data fetchers 55

Entering the SQL query manuallyAbout this task
This section describes how to enter an SQL query manually.
Note: If you want to enter the query manually, you must create the data sourcefirst, if it has not already been created.
To enter an SQL query manually, complete the following steps:
Note: Unless you are familiar with the databases you will be working with, usingthe Query Builder is much easier than entering the statement manually. The QueryBuilder gives you access to the names of all the tables in the database and thefields in the tables that you select to include in the query.
Procedure1. Select a previously configured data source from the Data Source selection list.2. Enter a Select statement to select data from the table.
Setting case in queries: All Select statements should reflect the casesensitivity of the database being used. When you select a column in your query,by default, your results show the column name as defined in the database. Youcan use the AS clause to control case of meta data coming back from database.Enclose the metric column name in quotes to make sure the returned columnname matches the case you want. For example, to have a query return anduppercase result, enter:select columnname as "COLUMNNAME"
In this example, you are going to create a data fetcher called REGIONALTICKETSthat selects all open tickets with a severity of 4 or higher for a group of servicesin the TBSMDEMO.tickets table and displays them in descending order. The as"OPENTICKETS" clause creates a metric named OPENTICKETS. Enclose"OPENTICKETS" in quotes to make sure that the column name returned from thequery is in all UPPERCASE letters, that is, OPENTICKETS.select CUSTOMER,HIGHLEVELSERVICEID,LOWLEVELSERVICEID,REGION,SEVERITY,STATUS,COUNT(*)as "OPENTICKETS" from TBSMDEMO.TICKETS where SEVERITY>=4and STATUS=’Open’ group by CUSTOMER,HIGHLEVELSERVICEID,LOWLEVELSERVICEID,REGION,SEVERITY,STATUS order by OPENTICKETS desc
3. Select View to view the data from that database.The View Data window opens.
56 IBM Tivoli Business Service Manager: Service Configuration Guide

The first 20 rows are displayed by default. You can change the number of rowsdisplayed by entering or selecting a different number of rows in the First fieldand then clicking the Refresh button.
Note: If you enter the query by hand you may get exception errors when youexecute a complex query. For example, the TBSM database does not acceptqueries with column aliases in the where clause. You can get similar errors ifyou pasted your query in from another application. When you paste in a query,your query may contain invalid characters. If you get such errors, check yourquery or try entering it in the Query Builder.
4. Close the View Data window.
Viewing the data fetcher results using fetch nowAbout this task
When you have set up your SQL query, you can run the data fetcher to view theresults:
Procedure1. Select Data Fetcher in the drop-down menu for the Service Navigation portlet.2. Select Fetch Now from the right-click menu for the REGIONALTICKETS data
fetcher to execute the query.3. To see the results of the query, click the data fetcher to open it in the Service
Editor.4. Click View.
The View Data window opens.
Figure 4. View Data window
Data fetchers 57

The order-by clause and the group-by clause that are entered result in the rowwith the highest number of open tickets appearing at the top of the retrieveddata. Also, for each unique combination of fields, there are two rows of data:one for severity 4 tickets, and one row for severity 5 tickets. The first row in theOPENTICKETS field contains the count for the severity 4 tickets for the followingunique combination of field values:v CUSTOMER = ABCBank
v HIGHLEVELSERVICEID = ABCOnlineBanking
v LOWLEVELSERVICEID = DBFarm
v REGION = US
The OPENTICKETS field contains a count for the severity 5 tickets for the samecombination of fields. This combination of field values is used to uniquelyidentify a given instance of a service template. In this case, the serviceinstance is DBFarm in the US REGION for the ABCBank CUSTOMER.
Adding an expressionAbout this task
Use the query expression to limit the rows returned by the Data Fetcher, improvingthe efficiency of the fetcher processing. Use a query expression. If you add anexpression to the query, the last record from the previously fetched data will beused to build the expression. The expression is added to the fetcher query as anadditional filtering clause that limits the rows returned by the fetcher. Use thefollowing procedure to add an expression to the query.
Procedure1. Click the Use Expression? icon.
Figure 5. View Data window with the query results
58 IBM Tivoli Business Service Manager: Service Configuration Guide

This icon opens the expression builder section of the Data Fetcher editor.2. Enter an expression or click Expression Builder to open the Expression
Builder window.The Expression Builder window opens. You can use this window to help youbuild the expression.
An expression can be entered that tells the data fetcher to fetch records basedon a time that is greater than the last record received or when Process equalsTRUE.
3. Select the open parenthesis by clicking the down arrow on the left side of thewindow.
4. Select a field. For this example, select the SEVERITY field.5. Select an operator. For this example, select > (greater than).6. Select the _SEVERITY_ variable.
In the example below, the underscores on either side of the severity valueindicate a variable.This variable is replaced by the time value of the last row from the previousfetch.
Figure 6. Data Fetcher editor - expression builder section
Figure 7. Data Fetcher Expression Builder window
Data fetchers 59

7. Click Add Filter Row to add a second row to add a second condition.In the example in Figure 9, the process condition is added.
8. Select the OR condition.9. Select the STATUS field.
10. Select the = operator.11. Enter BAD in the next field.
12. Click OK to save the expression and close the window.The expression is added in the text field.
Figure 8. Expression Builder - time variable added
Figure 9. Expression Builder with second expression added
60 IBM Tivoli Business Service Manager: Service Configuration Guide

13. Click Save to save the data fetcher.
Using the data fetcher resultsWhen you have created the data fetchers you need, you can use the data to createincoming status rules and auto-population rules in your service templates.Related concepts:“Service instances” on page 63This topic describes services instances and service instance tagging.Related tasks:“Adding auto-population rules” on page 110This topic describes auto-population rules. This topic also describes how to setstatus auto-population rules.“Building the query” on page 123This topic describes how to build queries using Query Builder.“Setting the polling criteria” on page 53This task describes how to set the polling criteria, configure a daily fetch, and setthe fetching interval.
Figure 10. Data Fetcher editor - expression added
Data fetchers 61

62 IBM Tivoli Business Service Manager: Service Configuration Guide

Service templates
This section explains how to build and edit service templates in IBM TivoliBusiness Service Manager (TBSM).Related tasks:“Assigning templates to a service” on page 167This topic describes how to assign templates to a service.
Service templates overviewThis topic describes service templates.
To simplify the process for defining and configuring services, the TBSM consoleprovides tools to help you create service templates for services instances withcommon behavior. Rather than define each of your services and their dependenciesindividually, you can create one template for a type of service and then assignapplicable services to the template.
Note: If you change rule or template names, you can cause issues with otherfeatures of TBSM. TBSM uses these names to reference the rule values for otherrules, such as auto-population or ESDA rules and for custom displays such asservice trees and view definitions.
If you want to change a rule or template name, change the name before you usethe rule or template elsewhere in TBSM.
For example, when you create numeric and text-based rule, you need to create acustom service tree or view definition to display the output of the rule in theTBSM console. The trees and view definitions use the template and rule names tomap the rule values to a display object. As a result, if you change the name of arule or a template used in a custom display, the custom tree or view definition willno longer display the rule values properly.
Service instancesThis topic describes services instances and service instance tagging.
You can create a template for physical components such as servers, or abstractcomponents such as webservers. You can also configure templates to monitor theObjectServer for enriched events from other products such as Netcool/Impact.
Service instances represent actual services that are assigned a template. Thetemplate defines how a service responds to incoming data and the status of otherservices. You should assign services of the same type to a common template. Thisallows you to use the same template rules to evaluate the status of multipleservices.
Service instance tagging
When you assign a template to a service, you tag the service with the template.Templates eliminate the necessity of creating the same rules for a service type morethan once.
© Copyright IBM Corp. 2008, 2013 63

For example, webserver1 and webserver2 are services tagged with the WebServertemplate. The status of all services tagged with the WebServer template areevaluated using the rules defined in the WebServer template.Related concepts:“Using the data fetcher results” on page 61Related tasks:“Service configuration” on page 163This topic describes how to create and edit services.
Service template model: Example 1This topic describes an example template model, templates with incoming statusrules, and templates with aggregation rules.
You can create dependencies for each service type. Figure 11 shows a simpleservice template model example that explains how template dependencies work.This model contains a hierarchy of service templates where the highest levelservice template depends on the status of the subservices below it. In this case, thestatus of the services is based on ObjectServer events.
Table 17 on page 65 describes the dependencies for the example service model inFigure 11.
Figure 11. Simple service model example 1
64 IBM Tivoli Business Service Manager: Service Configuration Guide

Table 17. Service model dependencies (1 of 2)
TemplateServiceinstances Dependent rules Incoming status rules
WebApp customer1 Status of Webserver services. None.
WebServer webserver1webserver2webserver3
Status of Database services. Netcool/OMNIbus events asdefined in WebServertemplate.
Database database1database2
Status of DNSServer services.
Status of AuthServerservices.
Netcool/OMNIbus events asdefined in Databasetemplate.
DNSService dnsserver1 None. Netcool/OMNIbus events asdefined in DNSServicetemplate.
AuthServer authserver1 None. Netcool/OMNIbus events asdefined in the AuthServertemplate.
Templates with Incoming Status rules
The service templates in Figure 11 on page 64 within the dotted line rectangleinclude rules that evaluate events from Netcool/OMNIbus. The dependencies forthese templates are based on the incoming events. These dependencies are calledincoming status rules. For example, the templates for the DNS and theauthentication servers evaluate service-related events from Netcool/OMNIbus. Thestatus of these two servers affects the status of the two databases and the threeweb servers because they require these two servers to function properly.Accordingly, you could add both incoming and aggregation rules to the Databaseand WebServer templates.
Templates with Aggregation rules
The status of the database servers affects the status of the web servers. The statusof all these servers, in turn, affects the status of service instances tagged with theWebApp service template. The status of services tagged with the WebApp template arebased on the status of the services tagged with the other templates in the servicemodel, such as Database and AuthServer. WebApp does not depend on the incomingevents directly. These dependencies are defined with aggregation rules within thetemplate. These rules aggregate the status of multiple child services to determinethe status of the parent service.
You need to model these types of dependencies for your network in the TBSMconsole to monitor the service status in the Service Editor.Related tasks:“Create and edit good, marginal, and bad incoming status rules” on page 84This topic describes how to create and edit good, marginal, and bad incomingstatus rules. This topic also describes properties and conditions for incoming statusrules.“Create and edit good, marginal, and bad aggregation rules” on page 98This task describes how to create and edit good, marginal, and bad aggregationrules. This topic also describes the properties of good, marginal, and badaggregation rules.
Service templates 65

Service model: example 2This topic describes an example service hierarchy, the dependencies for theexample service hierarchy, and the service hierarchy displayed in the View Servicetab of the Service Editor/Viewer.
Figure 12 shows another way you could create a service hierarchy for a similarservice. In this example, the status of the services depends on both ObjectServerevents and data from a DNS SQL data source.
Table 18 describes the dependencies for the example service model in Figure 12.
Table 18. Service model dependencies
Template Service instances Aggregation rules Incoming status rules
WebApp customer8 Status of WebFarm, DBFarm, andNetGroup services
None
WebFarm webfarm1 Status of Webserver services None
WebServer webserver4
webserver5
webserver6
None Netcool/OMNIbus events forweb servers 4, 5, and 6
DBFarm dbfarm1 Status of Database services None.
Figure 12. Example service hierarchy
66 IBM Tivoli Business Service Manager: Service Configuration Guide

Table 18. Service model dependencies (continued)
Template Service instances Aggregation rules Incoming status rules
Database database3
database4
None Netcool/OMNIbus events fordatabases 3 and 4
NetGroup netgroup1 Status of DNSServer services
Status of AuthServer services
None.
DNSService dnserver2 None Data from a database thatcontains DNS availabilityinformation for dnsserver2
AuthServer authServer2 None Netcool/OMNIbus events forauthserver2
In Figure 12 on page 66, the provider has created service templates for:v WebApp (with a service called customerB) that depends on the status of services
tagged with the WebFarm, DBFarm and NetGroup templates as defined in theWebApp template's aggregation rules.
v WebFarm (with a service called webfarm1) that depends on the status of servicestagged with the WebServer service template as defined in the WebFarm template'saggregation rules.
v WebServer (with services webserver4, webserver5, and webserver6) that gets itsstatus from Netcool/OMNIbus events as defined in the template's incomingstatus rules.
v DBFarm (with a service called dbfarm1) that depends on the status of servicestagged with the Database service template as defined in the DBFarm template'saggregation rules.
v Database (with services database3 and database4) that gets its status fromNetcool/OMNIbus events as defined in the template's incoming status rules.
v NetGroup (with a service called netgroup1) that depends on the status of servicestagged with the Authserver and DNSserver service template as defined in theNetGroup template's aggregation rules.
v Authserver (with a service called authserver2) that gets its status fromNetcool/OMNIbus events as defined in the template's incoming status rules.
v DNSserver (with one instance called dnsserver2) that gets its status from an SQLquery into a database with information about DNS events.
Service hierarchy example 2 in Service View
Figure 13 on page 68 shows how the service would look in the TBSM ServiceEditor window.
Service templates 67

For more examples of service models that include external databases, see the TBSMScenarios guide.
Service template configurationWhen you know your service hierarchy, create a template for each service type inTBSM. This section describes how to create and modify service templates.
Opening the Edit Template tabThis topic describes the elements of the Edit Template tab in the Service Editor.
You create and edit service templates in the Edit Template tab of the ServiceEditor.
To create a new service template, click the Create New Template button from thetoolbar in Templates in the Service Navigation portlet.
To edit an existing service template, click a template name in Templates in theService Navigation portlet; then click the Edit Template tab for the template in theService Editor.
Table 19 describes the elements of the Edit Template tab.
Table 19. Edit Template tab elements
Element Description Reference
Toolbar The toolbar options let you save and refresh the servicetemplate settings. You can also display online help.
“Edit tabs” on page 32
Template Properties Template Properties fields let you set the basic servicetemplate information and choose an icon to represent thetemplate in the console.
“Basic service templateproperties” on page 69
Figure 13. Alternate service model in Service Editor: View Service
68 IBM Tivoli Business Service Manager: Service Configuration Guide

Table 19. Edit Template tab elements (continued)
Element Description Reference
Rules tab The settings in this tab let you configure the service incomingstatus and aggregation rules for a service template. You canalso configure auto-population, ISM, and ESDA rules for thetemplate.
“Incoming status rules” onpage 79
“Aggregation and numericalformula rules” on page 95
“Auto-population rules” onpage 109
“ITCAM for Internet ServiceMonitoring rules” on page 131
“ESDA rules” on page 145
Tagged Services tab The settings in this tab let you tag services with the settingsin the service template.
“Tagging services” on page 72
Output Expressionstab
The settings in this tab let you combine the status of multiplerules to get the status of a service.
“Output expressions” on page73
SLA tab Optional. The settings in this tab let you configure your SLAsettings.
“Service level agreementconfiguration” on page 203
Additional tab Optional. The settings in this tab let you set an hourly SLApenalty for templates with SLA settings and add customproperties to the service template. For example, you cancreate an additional attribute that gets its value from a fieldin a database row.
“Service level agreementconfiguration” on page 203
“Additional tab” on page 77
Security tab The settings in this tab let you assign user and grouppermissions for viewing and editing the service template. Youonly see this tab if you have the tbsmTemplateAdmin user rolefor the service template.
“Granting user and grouppermissions to templates andservices” on page 185
Related tasks:“Adding an Internet Service Monitoring server connection” on page 132This task describes how to add a server connection for Internet Service Monitoring.
Basic service template propertiesThis topic describes template properties, how to select a display icon, and how toset template properties.
The Template Properties section of the Edit Template tab lets you specify thefollowing information:v Unique service Template Name
Note: Service template names must not contain spaces. Otherwise, these objectsmay not be saved properly in the TBSM database.
v Text Description of the service templatev Display icon for service templatev Advanced options - Edit Properties
Note: Note: The Name field for templates, rules, data sources, maintenanceschedules, view definitions and other objects must not contain these specialcharacters:" & < > \ / * ? | : $ ! % , .
Service templates 69

Names must not contain spaces. Otherwise, these objects may not be savedproperly in the TBSM database. If the object does not save, remove any specialcharacters or spaces from the name field.
Selecting a display icon
To select a display icon for a service template, complete the following steps:1. Click Browse for the Display Icon: field.
The Browse Icons window opens.2. Click the icon you want to display for this service template and the services
tagged with the template.The Browse Icons window closes and the new icon displays in the DisplayIcon field.
3. Click the Save button in the toolbar.
Setting template properties
You can set standard properties for templates that have auto-population and ESDArules. You can make the data permanent and you can specify when permanentdata should be deleted if the system does not detect a change in the data within aspecified time period.
To set the standard properties for a template, complete the following steps:1. In the Edit template tab, click the Edit Properties link next to the Properties
field.The Standard Template Properties window opens.
2. For more information about standard properties, see “Service persistencesettings” on page 161.
Related tasks:“Service persistence settings” on page 161This topic describes how to set persistence settings for a service template.
Rule configurationThis topic describes the elements of the Rules tab in the Service Editor.
The settings in this tab let you configure the incoming status, aggregation,auto-population, ISM monitoring, and ESDA rules for a service template. To editrules:1. Click the Rules tab in the Service Editor.2. Table 20 describes the Edit Template Rules tab elements.
Table 20. Rules tab elements
Tab element Element name Description
Select All button Click Select All to select all the rules for deletion.
Deselect All button Click Deselect All to deselect all the rules selected for deletion.
Delete button Click Delete to delete the selected rules.
70 IBM Tivoli Business Service Manager: Service Configuration Guide

Table 20. Rules tab elements (continued)
Tab element Element name Description
Status rules buttonsSee “Incoming status rules” on page 79 for more information about these rules.
Create IncomingStatus Rule button
Click Create Incoming Status Rule to open the New Incoming StatusRule Type window. Enter the data that maps ObjectServer events orother data to services which are tagged with this template.
Children buttonsSee “Aggregation and numerical formula rules” on page 95 for more information about these rules.
Create Good,Marginal, BadAggregation Rulebutton
Click Create Good, Marginal, Bad Aggregation Rule to open the EditGood, Marginal, Bad Aggregation Rule window. Enter the data thatcreates a status aggregation on another service template. That is, thestatus of every service you tag with this template depends on thestatus of other services which are tagged with the template you selectin the Good, Marginal, Bad Aggregation Rule window.
Create NumericalAggregation Rulebutton
Click Create Numerical Aggregation Rule to open the Edit NumericalAggregation Rule window. Numerical aggregation rules are used byTBSM to aggregate rule output values of the same type across a set ofchild service instances.
Create NumericalFormula Rule button
Click Create Numerical Formula Rule to open the Edit NumericalFormula Rule window. Numerical formula rules are a type of ruleused by TBSM to combine rule output values of different types withinthe same service instance. These output values can be generated byincoming numerical status rules or by numerical aggregation rules.
Additional rule types
CreateAuto-populationRule button
Click Create Auto-population Rule to open the CreateAuto-population Rule window where you can configure servicesautomatically based on data from an incoming status rule. See“Auto-population rules” on page 109.
Create NewTemplate ISMConfiguration Rulebutton
Click Create New Template ISM Configuration Rule to open theCreate New Template ISM Configuration Rule window. From thiswindow, you can auto-configure ITCAM for Internet ServiceMonitoring monitors so that TBSM can receive ISM events from anObjectServer. See “ITCAM for Internet Service Monitoring rules” onpage 131.
Configure New ISMServer button
Click Configure New ISM Server to open the ISM ServerConfiguration window. Before you configure the ITCAM for InternetService Monitoring rule, you need an ITCAM for Internet ServiceMonitoring server to connect with so that you can receive events froman ObjectServer. See “ITCAM for Internet Service Monitoring rules”on page 131.
Create ESDA Rulebutton
Click Create ESDA Rule to open the ESDA Model Rule window.External Service Dependency Adapters (ESDAs) let TBSM dynamicallyimport service hierarchies from any data source you can configure forTBSM. See “ESDA rules” on page 145.
Rule Description Columns
Select Column Select column Select the check boxes in this column to mark rules for deletion.
Type column This column shows the type of rule listed in the Rule Name column.The multi-colored icon indicates an incoming status rule and thesingle-colored icon with three circles indicates an aggregation orformula rule.
Service templates 71

Table 20. Rules tab elements (continued)
Tab element Element name Description
Rule Name column This column lists all the rules configured for the service template. Ifyou want to edit the rule, click the rule name to display theappropriate rule editor window.
Rule Settings column This column shows a summary of the rule attributes for each rule.
Incoming status rules have summaries like:
Class: Default Class(0)Bad When: (AlertKey = ’Webserver’) AND (Severity >= 5)
Aggregation rules have summaries like:
Bad When: Any AuthServer child is in a Bad state or worse.
Note: The Name field for rules, data sources, maintenance schedules, viewdefinitions and other objects must not contain these special characters:" & < > \ / * ? | ( ) : ; $ ! %
Names must not contain spaces. Otherwise, these objects may not be savedproperly in the TBSM database. If the object does not save, remove any specialcharacters or spaces from the name field.
Note: If you change rule or template names, you can cause issues with otherfeatures of TBSM. TBSM uses these names to reference the rule values for otherrules, such as auto-population or ESDA rules and for custom displays such asservice trees and view definitions.
If you want to change a rule or template name, change the name before youuse the rule or template elsewhere in TBSM.
For example, when you create numerical and text-based rule, you need tocreate a custom service tree or view definition to display the output of the rulein the TBSM console. The trees and view definitions use the template and rulenames to map the rule values to a display object. As a result, if you change thename of a rule or a template used in a custom display, the custom tree or viewdefinition will no longer display the rule values properly.
Tagging servicesThis topic describes the elements of the Tagged Services tab and how to tagservices to a template.
After you create a service template, you can assign the template to a given servicein your model. When a service has a template assigned, the service is tagged withthe template. When a service is tagged with a service template, the templatedetermines how the service responds to incoming data and the status of otherservices. To tag services with a service template:1. From the Service Editor Edit tab, click the Tagged Services tab.2. Select the Services you want to tag using Table 21 on page 73 as your guide.
72 IBM Tivoli Business Service Manager: Service Configuration Guide

Table 21. Tagged Services tab elements
Element Description
Search the Available Servicesfield and Search button
Enter a string in the search field and click Search tosearch for services that contain the string you entered.The system displays the search results in AvailableServices list.
For example, if you want to find all the services withthe letters serv in their name, enter serv in the fieldand click Search.
Available Services list This list shows all the services you have permission toedit in your system. You can press Ctrl or Shift whileyou click to select multiple services in this list. Servicesfrom this list are added to Selected Services list.
Maximum results Maximum results specifies the maximum number ofservices listed in the Available Services list. Thedefault is 100.
>> Add button
<< Remove button
Highlight a service or services and click the >> buttonto move services from the Available Services list to theSelected Services list. Click the << button to removethe highlighted services back to the Available Serviceslist.
Selected Services list This list shows all the services that have been taggedwith the service template. You only see the services youhave permission to view in the system. You can usepress Ctrl or Shift while you click to select multipleservices in this list.
Output expressionsThis topic describes the Output Expressions tab in the Service Editor. This topicalso describes output expression parameters.
You can use the Output Expressions tab to create special rules to determine thestatus of a service. The settings in this tab let you combine the status of multiplerules to get a different output status of a service tagged with the template. You canalso specify an unknown status if a given service does not receive events for aspecified time period.
Output expressions parameters
When you create an output expression, you specify an expression as described inTable 22. The Output Expressions tab contains a drop-down list for each of theseparameters. For more information about using these fields, see “Creating andediting output expressions” on page 75.
Table 22. Output expression parameters
Parameter drop-down list Description
Rule The incoming status and or aggregation rules configured for the template.
Service templates 73

Table 22. Output expression parameters (continued)
Parameter drop-down list Description
Value and State Change You can select either value or LastStateChange for this parameter.
Value refers to the status of the rule: either Bad or Marginal.
LastStateChange refers to the time of the latest state change for the rule in UNIXtime. This parameter is useful if you want to determine which rule first changeda service's status to bad.
Comparison operators You can select the following comparison operators:
v =
v >=
v <=
v >
v <
Rule status You can select either Bad or Marginal rule status. You can specify good status byselecting < Marginal status.
Boolean operator You can select either AND or OR from this field.
If you never want a service status to change to Bad or Marginal, enter False in theBad or Marginal Output Expression field.
You can use TBSM functions to parse the values in the expression. For moreinformation about using TBSM functions, see the TBSM Customization Guide.Related tasks:“Creating and editing output expressions” on page 75This task describes how to create and edit output expressions.
Example output expressionsThis topic describes a value output expression example and a LastStateChangeoutput expression example.
This section contains example expressions using both the Value andLastStateChange parameters.
Value output expression example
In this example, the template DBFarm has two aggregation rules:v The NetGroupWorst rule changes the DBFarm status to Bad or Marginal if a
NetGroup service's status changes to bad or marginal.v The DBWorst rule changes the DBFarm status to bad if any database service's status
changes to bad or marginal.
To create a rule that sets the DBFarm status to change to bad when bothNetGroupWorst rule and DBWorst rule report a marginal status, enter the followingvalue in the Bad Output Expression field:(NetGroupWorst.Value = Marginal) AND (DBWorst.Value=Marginal)
LastStateChange output expression example
In this example the template WebFarm has two aggregation rules:
74 IBM Tivoli Business Service Manager: Service Configuration Guide

v The NetGroupWorst rule changes the WebFarm status to bad or marginal if aNetgroup service's status changes to bad or marginal. The Netgroup Servicesinclude DNS and Authentication servers, and in this case also part of anenterprise service-dependency model.
v The WebserverWorst rule changes the WebFarm status to bad if any web server'sstatus changes to bad or marginal.
The WebFarm template's main purpose is to monitor web servers, but you still havea NetGroup dependency to help identify a network problem. However, you do notwant a WebFarm service status to change to bad when there are network problems,since the web server's processes are still running when the network has troubles.
If you want to distinguish between outages caused by the network group andoutages caused by a web server, you create an expression using theLastStateChange parameter that determines which service failed first: a web server,or a network service.
In this example, the WebFarm status changes to bad when:v The WebserverWorst rule status is Bad AND the WebserverWorst status changed
before the NetGroupWorst status changed to bad
orv The WebserverWorst rule status is Bad AND the NetGroupWorst status is less than
bad
To create an expression for this example, enter the following value in the BadOutput Expression field:((WebserverWorst.Value = Bad) AND (WebserverWorst.LastStateChange <NetGroupWorst.LastStateChange)) OR ((WebserverWorst.Value = Bad) AND(NetGroupWorst.Value < Bad))
In the Marginal Output Expression field, enter:((WebserverWorst.Value = Marginal) AND (WebserverWorst.LastStateChange <NetGroupWorst.LastStateChange)) OR ((WebserverWorst.Value = Marginal) AND(NetGroupWorst.Value < Bad))
Creating and editing output expressionsThis task describes how to create and edit output expressions.
About this task
To create or edit output expressions, complete the following steps:
Procedure1. From the Edit Template tab of the Service Editor, click the Output Expressions
tab.The Output Expressions tab opens.
2. Enter the special rule data using Table 23 on page 76 as your guide.
Service templates 75

Table 23. Output Expressions tab elements
Element Description
Report Unknown Severity if noEvents after the followingnumber of seconds check box
When you select this check box, the service statuschanges to unknown (purple) if the service does notdetect events for a given time period. TBSM also sendsa severity 1 (indeterminate) event to the ObjectServer.
For example, if you set the seconds to 60 and noservice events are detected for more than 1 minute, theservice status changes to unknown and sends aseverity 1 event to the ObjectServer.
Expression builder drop-downlists and Insert buttons
These fields enable you to enter output expressionparameters in the open text field for both Bad-andMarginal Output Expressions. The first field lists allthe rules for the service template.
To use these fields, select the value you want from thedrop-down list and click Insert to the right of the field.For non-English browsers, translated values will bedisplayed in the drop down lists, followed by English,displayed in brackets. The Insert buttons will insert theEnglish only, as this is required for TBSM processing.
The selected value is displayed at the end of theexpression. You cannot insert values into the middle ofan expression with these fields.
Bad Output Expression text field Type your expression that results in a bad status for theservice in this field. That is, the service status is bad ifthe expression is true.
You can also use the expression builder fields to insertthe values you want as described in this table. Youmust enter values for both the Bad and MarginalOutput Expression fields. You can enter false in oneof the fields if you do not want a service to changestates.
You can cut and paste text in this field by right-clickingthe highlighted text and selecting Cut, Copy, or Pastefrom the menu. There are also Select All and Undooptions in this menu.
Marginal Output Expression textfield
Type your expression that results in a marginal statusfor the service in this field. See Bad Output Expressionfor more information about how to use this text field.You can enter false in one of the fields if you do notwant a service to change states.
3. When you have completed your expressions, click the Save button in thetoolbar.TBSM performs a syntax check on the expressions before saving and displaysan error message if syntax errors are found.
Related concepts:“Output expressions” on page 73This topic describes the Output Expressions tab in the Service Editor. This topicalso describes output expression parameters.“Status data in service instances” on page 233This topic describes status data in service instances.
76 IBM Tivoli Business Service Manager: Service Configuration Guide

SLA tabFor information about configuring SLA calculation parameters, see “Service levelagreement configuration” on page 203.
Additional tabThis topic describes the Additional tab. This topic also describes ReservedAdditional Properties.
The settings in the Additional tab are optional. With the default SLA Penaltyproperty, you can set an hourly SLA penalty for templates that have SLA settingsconfigured. The SLA penalty calculations let you set a cost estimate for each hourof downtime caused by an outage. For more information about adding hourly SLApenalties for templates, see “Setting SLA penalty calculations” on page 210.
In this tab, you can also add custom properties. For example, you can create anadditional attribute that obtains its value from a field in a database row.
Reserved additional properties
You can add Reserved Additional Properties to a template and set them as adefault. Every service assigned to the template will have the additional property.You can also manually set a specific value for the additional property for eachservice instance. To add additional properties to the template, follow these steps:1. Click the New Parameter button on the toolbar.2. Enter the parameter name and the default value.
Table 24 describes the reserved properties:
Table 24. Reserved additional properties
Reserved property name Sample value Property description
ViewDefName AppManagerView This view definition is used for anytemplate/instance where this value isdefined.
MapName maps/Europe.ivl This map is used for antemplate/instance where this value isdefined.
WebtopViewName NewView This Webtop view name is used in theService Details portlet and the AELwhen launching from an instance that isassigned to the template where thisvalue is defined.
Related tasks:“Setting SLA penalty calculations” on page 210This topic describes how to set SLA penalty calculations.
Adding security levelsFor information about adding security levels, see “Granting user and grouppermissions to templates and services” on page 185.
Service templates 77

Event enrichment solutionEvent enrichment is the process by which Netcool/Impact monitors an eventsource for new events, looks up information related to them in an external datasource and then adds the information to them.
An event enrichment solution consists of the following components:v A data model that represents the data you want to add to eventsv An OMNIbus event reader service that monitors the event sourcev One or more event enrichment policies that look up information related to the
events and add the information to them
For a sample event enrichment solution, see “Event enrichment tutorial” on page357.
Configuring Event Enrichment in TBSMThis topic describes how to enable Event Enrichment in TBSM.
Before you begin
Before you can use the Event Reader tool, the event reader and event sources mustbe created. See these topics for more information:v “Creating the event source” on page 360v “OMNIbus event reader service” on page 354
About this task
The configuration changes outlined in this topic ensure that TBSM does not readevents until Impact has enriched them. To avoid this issue, configuration changesare necessary to ensure that Impact updates a field in OMNIbus calledRAD_SeenByImpact after Impact is finished with the event. An additional TBSMrestriction added to the TBSMOMNIbusEventReader ensures that events are notread unless RAD_SeenByImpact = 1.
Important: If you configure Event Enrichment for a specified Event Reader, thatEvent Reader must be running for TBSM to read any events from the ObjectServer.If the Impact Event Reader is turned off, TBSM will not read any events from theObjectServer.
Procedure1. Click the Event Enrichment button on the Service Navigation portlet. The
Event Enrichment window opens.2. Check the OMNIbusEventReader box to enable Event Enrichment for the
Impact Service.
Remember: The Event Reader must be running for the Event Reader checkboxto be active.Event readers from a remote Impact server will be listed in this UI with theirclustername in parentheses.
3. Click OK.“Event enrichment tutorial” on page 357The goal of this tutorial is to develop an event enrichment solution to enhancethe value of an existing Netcool/Impact installation.
78 IBM Tivoli Business Service Manager: Service Configuration Guide

Incoming status rules
This section contains information about incoming status rules in IBM TivoliBusiness Service Manager (TBSM).
Incoming status rules overviewThis topic describes incoming status rules.
Incoming status rules are sets of conditions that allow TBSM to obtain general ordetailed status parameters from field values in incoming ObjectServer events orother data.
You use incoming status rules as part of a logical model that takes informationderived from ObjectServer events or other incoming data and uses it to determinedifferent aspects of the status of a service.
You define incoming status rules when you create or edit a service template. Eachtemplate can have any number of associated incoming status rules. You canconfigure TBSM to display the results of incoming status rules in the Services Treeor Service Editor features of the application console. This display allows users toview and respond to changes in the general or detailed state of the service in realtime.
TBSM has the following types of incoming status rules:v Good, Marginal, and Bad rulesv Numerical rulesv Text-based rules
Note: If you change rule or template names, you can cause issues with otherfeatures of TBSM. TBSM uses these names to reference the rule values for otherrules, such as auto-population or ESDA rules and for custom displays such asservice trees and view definitions.
If you want to change a rule or template name, change the name before you usethe rule or template elsewhere in TBSM.
For example, when you create numerical and text-based rule, you need to create acustom service tree or view definition to display the output of the rule in theTBSM console. The trees and view definitions use the template and rule names tomap the rule values to a display object. As a result, if you change the name of arule or a template used in a custom display, the custom tree or view definition willno longer display the rule values properly.
For more information about mapping rule output values to the Services Tree andService Editor, and examples, see the IBM Tivoli Business Services Manager: ScenariosGuide.Related tasks:“Opening the Tree Template Editor” on page 265This topic describes how to open the Tree Template Editor.
© Copyright IBM Corp. 2008, 2013 79

“Creating and editing view definitions” on page 277This topic describes how to create and edit view definitions.
Incoming status rules properties and conditionsThis reference topic describes these incoming status rule properties and conditions:rule name, data feed name, event discriminators, name expression, filter, and ruleoutput expression.
Incoming status rules have the following properties and conditions:v Rule namev Data feed namev Event discriminatorsv Name expressionv Filterv Rule output expression
Rule name
The rule name is a unique string that identifies the rule. This name is also used toidentify the rule output value when referenced elsewhere in TBSM.
Note: You cannot use these special characters in rule names:" & < > \ / * ? | ( ) : ;
Otherwise, the rule may not be saved properly in the TBSM database. If the ruledoes not save, remove any special characters from the rule name.
Description
Using a description will help you stay organized in your TBSM environment.When you mouse-over the rule or Display Name in the TWA, the Description willappear and help you determine if this is the rule or data you want to see.
Display Name
The Display Name will appear in the metric list in the Time Window Analyzer.The Display Name will also appear in the Rule Name column in the Rules tab inthe Service Editor. If no unique name is specified, the name of the rule will beused.
Data feed name
The data feed name specifies which data feed is associated with the rule. WhenTBSM retrieves events from an ObjectServer or data from another data source, itevaluates only those rules that are associated with that data feed. For SQL datasources, the data feed name is the name of a data fetcher.
Event discriminators
Event discriminators are ObjectServer classes that you can use to pre-filterincoming events to make sure that TBSM only processes incoming events that arerelevant to the defined rules. If you are using an ObjectServer as the data feed forthe rule, you should specify classes that identify the types of events that are relatedto the rule. Event discriminators are not supported for non-ObjectServer data feeds.
80 IBM Tivoli Business Service Manager: Service Configuration Guide

For example, you can choose Alcatel 5620 Corba(4950) to specify that this ruleapplies to events related to the Alcatel 5620 probe.
Name expression
The name expression is used by TBSM to determine which service instance isassociated with a particular incoming event or other data. The expression can bethe name of a field or a statement that uses the TBSM expression syntax to derivethe service instance name from one or more fields.
When a rule is processed by the TBSM software, the value of the name expressionis based on fields in the incoming event. This name expression is then compared tothe rule identification field for each service instance that is tagged with the rule'stemplate.
For example, to specify that the Node field in an incoming event contains the nameof the related service instance, you can use the following instance name expression:Node
When TBSM processes an event associated with this rule, it takes the value of theNode field and attempts to locate a service instance that is tagged with thistemplate and that has an equivalent name. For example, if the value of Node isdb_server_01, TBSM looks for the service instance with this name and attaches theoutput value that results from the rule.
Note: Ensure that you move at least 1 item from the Available Instance NameFields list to the Selected Instance Name Fields list. If this Selected InstanceName Fields list is empty, TBSM cannot match a Service Instance to an incomingevent or other data.
For more information about the expression syntax, see the IBM Tivoli BusinessService Manager: Customization Guide.
Filter
The filter for metric rules lets you specify additional matching conditions that anincoming event or other data must fulfill in order for the rule to be processed. Youmust also specify the field that contains the value that TBSM will use to derive theoutput value as part of the filter.
Rule output expression
The rule output expression is an expression used by TBSM to determine the valuethat results when the rule is processed. The expression can be either the name of afield or a statement in the TBSM expression syntax. When TBSM evaluates therule, it assigns either the value of the specified field or the result of the statementto the affected service instance.
Metric Collection
The Metric Collection options enable TBSM to collect and store the metric data forthe rule. You can activate the storing of status changes of the rule and display therecent history of the metric. The collected metric data can be displayed in the TimeWindow Analyzer, and stored in the TBSM database. You can also store statuschanges of rules to the Tivoli Data Warehouse (TDW) using the BSM Agent. TheTDW stores data for historical reporting.
Incoming status rules 81

Store data for this rule for TWAStore the output values for this rule in the TBSM database for the TimeWindow Analyzer.
Store data for this rule for TDWStore the output values for this rule in the TDW as a key performanceindicator for the BSM Agent Service Indicators attribute group.
Note: If you want to store status changes to the warehouse, you need to installand configure the BSM agent and TDW.Related concepts:“Service Identification fields” on page 168This topic describes service identification fields.“Query Builder overview” on page 123This topic describes Query Builder.“Text-based incoming status rules” on page 90This topic describes text-based incoming status rules.Related tasks:“Editing Identification fields” on page 169This task describes how to edit identification fields.“Creating the data fetcher” on page 52This task describes how to create a data fetcher.“Building the query” on page 123This topic describes how to build queries using Query Builder.“Create and edit text-based incoming status rules” on page 91This topic describes to create and edit text-based incoming status rules. This topicalso describes the properties and conditions of text-based incoming status rules.
Customizing Data Feed fieldsCustomizing Fields will enable you to use Impact Services as a Data feed.
When you select an Impact Service as a Data Feed for a rule, the Customize Fieldbutton appears. Clicking this button enables you to configure the Data Feed fieldsto match the Impact policy fields. The field names and types are default for ImpactServices. You can add fields in the policy, and add the same field names in therule. The names and types must match and are case sensitive. If they do notmatch, the rule will not work properly.
Note: You must configure the Impact policy and service before you customizefields in TBSM.
The table below describes the Customized Fields elements:
Table 25.
Element Description
Select All button Click Select All to select all the fields.
Deselect All button Click Deselect All to deselect all the fields.
82 IBM Tivoli Business Service Manager: Service Configuration Guide

Table 25. (continued)
Element Description
Delete button Click Delete to delete the selected fields.
New button Click this button to create a new field.service instance. When you click this button,a blank field appears at the top of the list.Enter the name for the new field.
The table below describes the default field settings:
Table 26.
Field Name Field Type
EventClass String
EventType String
ResourceName String
SecondaryResourceName String
Summary String
Value1 Float
Value2 Float
Value3 Float
For more information about configuring Impact policies and Impact Services, seethe IBM Tivoli Netcool/Impact Solutions Guide.Related tasks:“Create and edit good, marginal, and bad incoming status rules” on page 84This topic describes how to create and edit good, marginal, and bad incomingstatus rules. This topic also describes properties and conditions for incoming statusrules.
Good, marginal, and bad incoming status rulesThis topic describes good, marginal, and bad incoming status rules.
TBSM uses Good, Marginal, and Bad incoming status rules to obtain the generalstate of a service from an incoming ObjectServer event or other data. The generalservice state is determined by comparing threshold values set in the rule definitionto event field values or field values in other incoming data. When this type of ruleis processed, TBSM obtains a general service state of Good, Marginal, or Bad andassigns this value to the service instance. If multiple rules of this type are definedin a single service template, the worst current output of all rules is reflected as thegeneral service state.
Good, Marginal, and Bad incoming status rules consist of a set of properties andfilters that specify which events or other data contain relevant information andhow TBSM can derive the general state from this information. In addition, thistype of rule contains a name expression that TBSM uses to determine the affectedservice instance.
Incoming status rules 83

TBSM processes Good, Marginal, and Bad incoming status rules during runtimeafter it retrieves events from the ObjectServer or data from another data source.For each incoming event or other data set, TBSM checks the currently defined rulesand processes the ones that are associated with the event or data type. TBSM thenassigns the general state to the service.
By default, the general service state is shown in the Services Tree or Service Editorof the application console as a green, yellow, or red light, where green correspondsto Good, yellow corresponds to Marginal, and red corresponds to Bad.
Note: The general service states of Good, Marginal, and Bad correspond to numericrule output values of 0, 3, and 5 respectively. TBSM uses this numeric value whenthe resulting service state is combined with other rule-output values using anumerical aggregation rule or numerical formula rule.
For examples of these rules and how to map them to trees and views, see theTBSM Scenarios Guide.Related tasks:“Opening the Tree Template Editor” on page 265This topic describes how to open the Tree Template Editor.“Creating and editing view definitions” on page 277This topic describes how to create and edit view definitions.
Create and edit good, marginal, and bad incoming status rulesThis topic describes how to create and edit good, marginal, and bad incomingstatus rules. This topic also describes properties and conditions for incoming statusrules.
About this task
Use the following procedure to create or edit a good, marginal, and bad incomingstatus rule:
Procedure1. Click Incoming Status Rule on the Edit Template tab in the Service Editor.
The Select Incoming Status Rule Type window opens.Or, to edit an existing rule, click the name of the good, marginal, and bad ruleyou want to edit.
2. Select Based on a Good, Marginal, and Bad Threshold in the Select IncomingStatus Rule Type window and click OK.
3. The Edit Incoming Status Rule window opens.4. Enter the rule properties and conditions using Table 27 as your guide.
Table 27. Edit Incoming Status Rule window: good, marginal, bad rule properties andconditions
Window element Description
Rule Name field The name of the good, marginal, and bad rule.
Description Using a description will help you stay organized in yourTBSM environment.
84 IBM Tivoli Business Service Manager: Service Configuration Guide

Table 27. Edit Incoming Status Rule window: good, marginal, bad rule properties andconditions (continued)
Window element Description
Display Name The Display Name will appear in the metric list in the TimeWindow Analyzer. The Display Name will also appear in theRule Name column in the Rules tab in the Service Editor. Ifno Display Name is specified, the name of the rule will beused.
Data Feed list The data feed is the ObjectServer or data fetcher name thatcontains incoming events or other data used by TBSM whenprocessing the rule. You can customize data fields to useImpact services. For more information, see the "CustomizingData Feed fields" topic.
Preview Data button You can display events or other data that match theconditions specified in this window by clicking the PreviewData button. When you click this button, an event table isdisplayed in a new browser window. This table has the sameformat as the event table shown in the Service Details portlet.You must specify any event discriminators and filters beforeyou will see matching data.
For SQL data sources, you can view the selected data in theData Fetcher View Data window by clicking the View Databutton. Filter criteria, if specified, will affect the datadisplayed in the window. If you open the Data Fetcherwindow, the previewed data would be unfiltered.
Event Discriminators list If you are using an ObjectServer data feed, you can select oneor more ObjectServer classes from this list. You use eventdiscriminators to specify which event types are relevant tothe rule.
Instance name list You can select one or more event fields from this list. TBSMuses the value of this field to determine the affected serviceinstance when processing this rule. Alternatively, you can usethe Advanced button as described below to specify aninstance expression.
Advanced button As an alternative to specifying an instance name field asdescribed above, you can click this button to specify aninstance expression. The instance expression allows you tospecify multiple field names, to manipulate values, or both inthe field using statements and functions in the TBSMexpression syntax.
Store data for this rule forTWA checkbox
If you select this option, TBSM will collect and store statuschanges for the rule. This data is stored in the TBSMdatabase. The collected metric data can be displayed in theTime Window Analyzer.
Store data for this rule forTDW checkbox
If you select this option, TBSM will collect and store thestatus changes of the rule to the warehouse (TDW) using theBSM Agent. The TDW stores data for historical reporting.Note: You need to install and configure the BSM agent andthe TDW to use this option.
Automatic Roll-up button If you use the Auto-Rule roll-up feature, you canautomatically create rules in other service templates thatcontain the values from the incoming status rule. That is, youpass the rule output values from the incoming status rule to arule in another service template.
Incoming status rules 85

5. Choose from available filter fields and specify threshold values andcorresponding general service states.The Available Filter Fields list in this section of the window contains the fieldsin the incoming events (or other data provided by the data feed). You canchoose any number of fields from this list. The Threshold Filters table allowsyou to set one or more threshold values for each of the selected fields and acorresponding service state of Good, Marginal, or Bad for each threshold.When TBSM evaluates the rule, it compares the value of each selected fieldwith the threshold value that you specified. The worst resulting service state ofall comparisons then becomes the general state of Good, Marginal, or Bad for theservice instance.
6. Click OK.Related concepts:“Data fetcher overview” on page 51This topic describes data fetchers.“Service template model: Example 1” on page 64This topic describes an example template model, templates with incoming statusrules, and templates with aggregation rules.“ESDA rule triggers” on page 149This topic describes ESDA rule triggers, On-Demand triggers, and automaticupdates.“Service Identification fields” on page 168This topic describes service identification fields.“Customizing Data Feed fields” on page 82Customizing Fields will enable you to use Impact Services as a Data feed.
Numerical incoming status rulesThis topic describes numerical incoming status rules.
Numerical incoming status rules are a type of rule used by TBSM to obtain anumeric value from fields in ObjectServer events or other data and then toassociate this value with a service instance as a rule output value. The resultingrule output value is stored in memory and identified by the rule name wherereferenced elsewhere in TBSM.
Numerical incoming status rules consist of a set of properties and filters thatspecify which events or other data contain relevant information and how TBSMcan derive the rule output value from this information. In addition, this type ofrule contains a name expression that TBSM uses to determine the affected serviceinstance. Optionally, numerical incoming status rules can also set the general stateof the service to Good, Marginal, or Bad, depending on thresholds specified for therule output value.
TBSM processes numerical incoming rules during runtime after it retrieves eventsfrom the ObjectServer or data from another data source through a data feed. Foreach incoming event or other data set, the application checks the currently definednumerical rules and processes the numerical rules that are associated with theevent or data type. This check includes deriving the rule output value from fieldvalues and evaluating the instance name expression to determine the affectedservice instance. After the rule is processed, TBSM assigns the output value to theaffected service.
86 IBM Tivoli Business Service Manager: Service Configuration Guide

You can configure TBSM to display the output values associated with a serviceinstance as part of the Service Editor. You can also aggregate or combine theoutput values within a single service or across services using numericalaggregation and formula rules. In other words, these incoming status rulesproduce numerical values that you can use in your numerical aggregation rulecalculations.
When you create the rule, you can enable TBSM to collect and store metric datausing the Metric Collection options. You can activate the storing of status changesof the rule and display the recent history of the metric. The collected metric datacan be displayed in the Time Window Analyzer, and stored in the TBSM database.You can also store status changes of rules to the warehouse (TDW) using the BSMAgent. The TDW stores data for historical reporting and must be installed andconfigured before you want to use this option.
You can define the aggregation rules automatically directly from the incomingstatus rule. Internally, the same aggregation rules is created. Externally, theaggregation rules can be directly edited on service templates after they are createdautomatically. TBSM automatically names aggregation status rules based on thename of the incoming status rule and template that the aggregation belongs to.However, you will not be allowed to add a template to the list if the name of theautomatically generated aggregation rule would be too long.
The rules can also be managed directly by editing each service template. If youchange an automatically generated aggregation rule yourself, the "automaticroll-up" function may no longer display the service templates. If the names of theincoming status rules or service templates change, the automatically createdaggregation rules will still work but are not displayed if you press the AutomaticRoll-up button for this incoming status rule.
To have more control over rolling up numerical status rules, you might need tocreate your own aggregation rules.Related tasks:“Create and edit good, marginal, and bad aggregation rules” on page 98This task describes how to create and edit good, marginal, and bad aggregationrules. This topic also describes the properties of good, marginal, and badaggregation rules.“Creating automatic roll-up rules” on page 93This topic describes how to create automatic roll-up rules.
Create and edit numerical incoming status rulesThis topic describes how to create and edit numerical incoming status rules. Thistopic also describes the properties and conditions of numerical incoming statusrules.
About this task
To create or edit a numerical incoming status rule, complete the following steps:
Procedure1. From the Edit Template tab in the Service Editor, click the Incoming Status
Rule button.The Select Incoming Status Rule Type window opens.
Incoming status rules 87
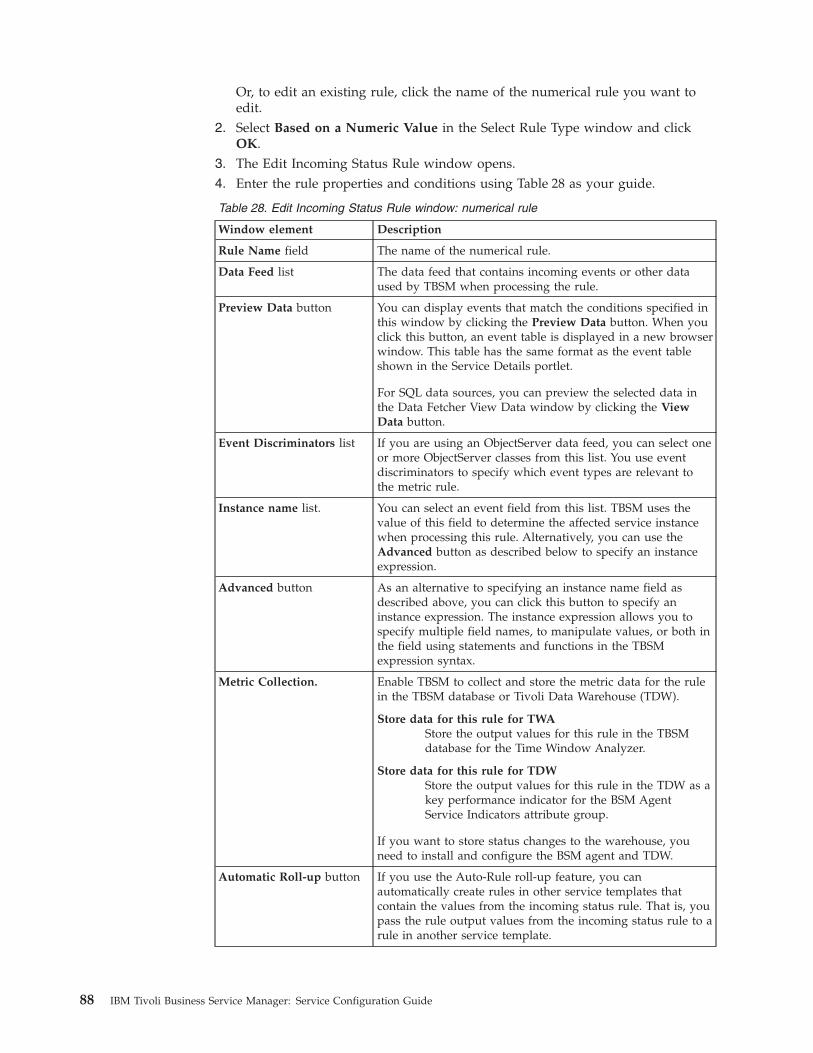
Or, to edit an existing rule, click the name of the numerical rule you want toedit.
2. Select Based on a Numeric Value in the Select Rule Type window and clickOK.
3. The Edit Incoming Status Rule window opens.4. Enter the rule properties and conditions using Table 28 as your guide.
Table 28. Edit Incoming Status Rule window: numerical rule
Window element Description
Rule Name field The name of the numerical rule.
Data Feed list The data feed that contains incoming events or other dataused by TBSM when processing the rule.
Preview Data button You can display events that match the conditions specified inthis window by clicking the Preview Data button. When youclick this button, an event table is displayed in a new browserwindow. This table has the same format as the event tableshown in the Service Details portlet.
For SQL data sources, you can preview the selected data inthe Data Fetcher View Data window by clicking the ViewData button.
Event Discriminators list If you are using an ObjectServer data feed, you can select oneor more ObjectServer classes from this list. You use eventdiscriminators to specify which event types are relevant tothe metric rule.
Instance name list. You can select an event field from this list. TBSM uses thevalue of this field to determine the affected service instancewhen processing this rule. Alternatively, you can use theAdvanced button as described below to specify an instanceexpression.
Advanced button As an alternative to specifying an instance name field asdescribed above, you can click this button to specify aninstance expression. The instance expression allows you tospecify multiple field names, to manipulate values, or both inthe field using statements and functions in the TBSMexpression syntax.
Metric Collection. Enable TBSM to collect and store the metric data for the rulein the TBSM database or Tivoli Data Warehouse (TDW).
Store data for this rule for TWAStore the output values for this rule in the TBSMdatabase for the Time Window Analyzer.
Store data for this rule for TDWStore the output values for this rule in the TDW as akey performance indicator for the BSM AgentService Indicators attribute group.
If you want to store status changes to the warehouse, youneed to install and configure the BSM agent and TDW.
Automatic Roll-up button If you use the Auto-Rule roll-up feature, you canautomatically create rules in other service templates thatcontain the values from the incoming status rule. That is, youpass the rule output values from the incoming status rule to arule in another service template.
88 IBM Tivoli Business Service Manager: Service Configuration Guide

5. Choose from available filter fields and specify the matching conditions.
The Available Filter Fields list in this section of the window contains the fieldsin the incoming events (or other data provided by the data feed).In Figure 14, TBSM processes the rule for a service where the value of thelowlevelserviceid field equals WebFarm and the value of the severity fieldequals 5. When these filter conditions are met, the output value for the ruleequals the value of the opentickets field.You can choose any number of fields from this list. The lists and text fieldsbelow allow you to specify the condition that each field must match in orderfor TBSM to process this event using the rule.
6. Enter the rule output expression in the text field below. The expression can beeither the name of a field or a statement in the TBSM expression syntax. Youcan use the field list to select fields defined in the data feed.
7. (Optional) If you want the numerical rule to also set the general state of theaffected service instance, select Status, and enter threshold values for the twoservice states in the Marginal and Bad fields. If the Marginal threshold islower than the Bad threshold, the values you set are treated as the maximumallowed values. Therefore, when the value returned by the rule exceeds thevalues you have set, the status changes. However, if the Marginal threshold isset to a value higher than the Bad threshold, the values you set are treated asthe minimum allowed values. In this instance, when the value returned by the
Figure 14. Edit Incoming Status Rule window: numerical rule
Incoming status rules 89

rule drops below these settings, the status is changed. For example, if theMarginal threshold was set to 70 and the Bad threshold was set to 90, thestatus returned worsens as the value returned increases, that is to say below 70would provide a status of Good, between 70 and 90 would result in a status ofMarginal and above 90 would result in a status of Bad. Alternatively, if theMarginal threshold was set to 90 and the Bad threshold was set to 70, thestatus returned worsens as the value returned decreases, that is to say above 90would provide a status of Good, between 70 and 90 would result in a status ofMarginal and below 70 would result in a status of Bad.
8. Click OK.Related concepts:“ESDA rule triggers” on page 149This topic describes ESDA rule triggers, On-Demand triggers, and automaticupdates.“Service dependency configuration” on page 170This topic describes how to configure service dependencies.
Text-based incoming status rulesThis topic describes text-based incoming status rules.
Text-based incoming status rules are a type of rule used by TBSM to obtain a textvalue from fields in ObjectServer events or other data and then to associate thisvalue with a service instance as a rule output value. Incoming status rules basedon text values let you extract text strings from events or SQL data sources. Theexpression is evaluated as a string value and assigned to the rule. The resultingrule output value is stored in memory and identified by the rule name wherereferenced elsewhere in TBSM.
Text-based incoming status rules consist of a set of properties and filters thatspecify which events or other data contain relevant information and how TBSMcan derive the rule output value from this information. In addition, this type ofrule contains a name expression that TBSM uses to determine the affected serviceinstance. Optionally, text-based incoming status rules can also set the general stateof the service to Good, Marginal, or Bad, depending on thresholds specified for therule output value. For example, if the value of the expression contains the stringconfigured in the Bad status box then the service will be Bad. If the value of theexpression contains the string configured in the Marginal status box then theservice will be Marginal.
TBSM processes text-based incoming rules during runtime after it retrieves eventsfrom the ObjectServer or data from another data source through a data feed. Likethe other incoming status rules, the text-based rules use a naming expression tomap events or other data to a specific service instance. For each incoming event orother data set, the application checks the currently defined text-based rules andprocesses the text-based rules that are associated with the event or data type. Thischeck includes deriving the rule output value from field values and evaluating theinstance name expression to determine the affected service instance. After the ruleis processed, TBSM assigns the output value to the affected service.
You can configure TBSM to display the output values associated with a serviceinstance as part of the Service Editor. You can also aggregate or combine theoutput values within a single service or across services using text-based policyrules. In other words, these incoming status rules produce text values that you canuse in your text aggregation rule calculations.
90 IBM Tivoli Business Service Manager: Service Configuration Guide

For more information about the configuration and policy dependency forpropagation of text-based rules, see the IBM Tivoli Business Service Manager:Customization Guide.Related tasks:“Create and edit text-based incoming status rules”This topic describes to create and edit text-based incoming status rules. This topicalso describes the properties and conditions of text-based incoming status rules.Related reference:“Incoming status rules properties and conditions” on page 80This reference topic describes these incoming status rule properties and conditions:rule name, data feed name, event discriminators, name expression, filter, and ruleoutput expression.
Create and edit text-based incoming status rulesThis topic describes to create and edit text-based incoming status rules. This topicalso describes the properties and conditions of text-based incoming status rules.
About this task
To create or edit a text-based incoming status rule, complete the following steps:
Procedure1. From the Edit Template tab in the Service Editor, click the Incoming Status
Rule button.The Select Incoming Status Rule Type window opens.Or, to edit an existing rule, click the name of the rule you want to edit.
2. Select Based on Text Value in the Select Rule Type window and click OK.3. The Edit Incoming Status Rule window opens.4. Enter the rule properties and conditions using Table 29 as your guide.
Table 29. Edit Incoming Status Rule window: text-based rule
Window element Description
Rule Name field The name of the rule.
Data Feed list The data feed that contains incoming events or other dataused by TBSM when processing the rule.
Preview Data button You can display events that match the conditions specified inthis window by clicking the Preview Data button. When youclick this button, an event table is displayed in a new browserwindow. This table has the same format as the event tableshown in the Service Details portlet.
For SQL data sources, you can preview the selected data inthe Data Fetcher View Data window by clicking the ViewData button.
Event Discriminators list If you are using an ObjectServer data feed, you can select oneor more ObjectServer classes from this list. You use eventdiscriminators to specify which event types are relevant tothe metric rule.
Incoming status rules 91

Table 29. Edit Incoming Status Rule window: text-based rule (continued)
Window element Description
Instance name list. You can select an event field from this list. TBSM uses thevalue of this field to determine the affected service instancewhen processing this rule. Alternatively, you can use theAdvanced button as described below to specify an instanceexpression.
Advanced button As an alternative to specifying an instance name field asdescribed above, you can click this button to specify aninstance expression. The instance expression allows you tospecify multiple field names, to manipulate values, or both inthe field using statements and functions in the TBSMexpression syntax.
5. Choose from available filter fields and specify the matching conditions.
The Available Filter Fields list in this section of the window contains the fieldsin the incoming events (or other data provided by the data feed).In the figure above, TBSM processes the rule for a service where the value ofthe lowlevelserviceid field equals WebFarm and the value of the severity fieldequals 5. When these filter conditions are met, the output value for the ruleequals the value of the opentickets field.You can choose any number of fields from this list. The lists and text fieldsbelow allow you to specify the condition that each field must match in orderfor TBSM to process this event using the rule.
6. Enter the rule output expression in the text field below. The expression can beeither the name of a field or a statement in the TBSM expression syntax. Youcan use the field list to select fields defined in the data feed. The expressionwill be evaluated as a string value to assign to the rule a text output.
Figure 15. Edit Incoming Status Rule window: numerical rule
92 IBM Tivoli Business Service Manager: Service Configuration Guide
7. (Optional) If you want the text-based rule to also set the general state of theaffected service instance, select Status and enter threshold values for the twoservice states in the Marginal and Bad fields. If the value of the expressioncontains the text string configured in the Bad status box then the service will beBad. If the value of the expression contains the text string configured in theMarginal status box then the service will be Marginal.
8. Click OK.Related concepts:“Text-based incoming status rules” on page 90This topic describes text-based incoming status rules.Related reference:“Incoming status rules properties and conditions” on page 80This reference topic describes these incoming status rule properties and conditions:rule name, data feed name, event discriminators, name expression, filter, and ruleoutput expression.
Creating automatic roll-up rulesThis topic describes how to create automatic roll-up rules.
Before you begin
You can automatically roll up rule output values to a service template. Instead ofediting each level of the service model and creating an aggregation rule by hand,you can automatically roll-up the rule to a service model. Only roll up the ruleautomatically to a single parent template. The roll-up feature works best whenthere is only one parent template at each level of the service model. If the originaltemplate has multiple parent templates, you need to create a separate rule for eachparent template. You then roll up each rule separately. Do not roll up a single tomultiple service templates.
Note: The automatic rollup option is only available for numerical incoming statusrules and numerical formula rules.
About this task
To automatically roll-up rule output values to service templates, complete thefollowing steps:
Procedure1. From the Edit Template tab in the Service Editor, click the Rules tab. If you are
creating a rule for the roll-up, click Save on the Edit Template tab to save therule. Otherwise, it will not be possible to configure the rule.
2. To edit an existing rule, click the name of the rule you want to configure forautomatic roll-up from the list. The Edit Incoming Status Rule window opens.
3. Click Automatic Roll-up. The Automatically Roll-up Numerical Rule windowopens.
4. For each template to which you want to roll-up:a. Select the template from the list of available templates. Initially, all
templates except the one for which the incoming status rule is defined arein alphabetic order in the "available templates" list and no templates are inthe "roll up to templates" list. The order of the templates is important. You
Incoming status rules 93

should have the most immediate, or lowest level, at the bottom. The leastimmediate, or highest level, should be at the top.
b. Click Add selected template to top of Roll up to templates.5. To delete an aggregation rule:
a. Select the template from the "Roll-up to templates" list.b. Click Remove selected template from Roll up to templates.
6. Choose one or more aggregation functions.7. Any changes you make will not be carried out until you click OK.8. You must save your rules in the Edit Template tab before they become active.9. To verify, check the service template you selected for the rule roll-up for the
new rule.
Note: The names of the aggregation rules are automatically generated based onthe name of the original rule, the names of the parent and child template ateach level of the service model, and the name of the aggregation function. Donot change rule or template names. TBSM uses these names to reference therule values. When you create numerical and text-based rule, you need to createa custom service tree or view definition to display the output of the rule in theTBSM console. The trees and view definitions use the template and rule namesto map the rule values to a display object. As a result, if you change the nameof a rule or a template used in a custom display, the custom tree or viewdefinition will no longer display the rule values properly. If you want tochange a rule name, change the name before you use the rule elsewhere inTBSM.
Related concepts:“Numerical formula rule properties” on page 104This topic describes these numerical formula properties: rule name, combinationexpression, and status.“Numerical incoming status rules” on page 86This topic describes numerical incoming status rules.
94 IBM Tivoli Business Service Manager: Service Configuration Guide

Aggregation and numerical formula rules
This section explains how to work with aggregation and numerical formula rulesin IBM Tivoli Business Service Manager (TBSM).
Aggregation and numerical formula rules overviewThis topic describes aggregation and numerical formula rules.
Aggregation and numerical formula rules are sets of properties and conditionsused by TBSM to aggregate and otherwise combine parameters related to the stateof a service. These parameters consist of general, detailed, or both stateinformation generated by incoming status rules or other aggregation and numericalformula rules.
You use aggregation and numerical formula rules as part of a logical model thattakes information derived from ObjectServer events and other incoming data anduses it to determine different aspects of the status of a service. The rule definitionsdepend on how you want to aggregate or otherwise combine this information.
You define aggregation and numerical formula rules when you create or edit aservice template. Each template can have any number of associated aggregationand numerical formula rules. You can configure TBSM to display the results ofthese rules in the Service Tree or Service Viewer. This display allows users to viewand respond to changes in the general or detailed state of the service in real time.
Note: If you change rule or template names, you can cause issues with otherfeatures of TBSM. TBSM uses these names to reference the rule values for otherrules, such as auto-population or ESDA rules and for custom displays such asservice trees and view definitions.
If you want to change a rule or template name, change the name before you usethe rule or template elsewhere in TBSM.
For example, when you create numerical and text-based rule, you need to create acustom service tree or view definition to display the output of the rule in theTBSM console. The trees and view definitions use the template and rule names tomap the rule values to a display object. As a result, if you change the name of arule or a template used in a custom display, the custom tree or view definition willno longer display the rule values properly.
Good, marginal, and bad aggregation rules overviewThis topic describes good, marginal, and bad aggregation rules.
TBSM uses good, marginal, and bad aggregation rules to aggregate service statesacross a set of child service instances. This type of rule is defined as part of theparent service template. The general services states aggregated by rules of this typeare generated by incoming status rules or other aggregation rules.
When good, marginal, and bad aggregation rules are processed, the resulting stateis assigned to the parent service instance. This service state information is stored inmemory and is identified by the rule name when referenced elsewhere in TBSM.
© Copyright IBM Corp. 2008, 2013 95

Good, marginal, and bad aggregation rules consist of a set of properties thatspecify the relevant child service instances and the calculations that must beperformed to aggregate their service states. The rules aggregate these states byperforming simple math calculations or by executing more complicated policyfunctions.
TBSM processes good, marginal, and bad aggregation rules during runtime when aservice state associated with child service changes. When the service state changes,the application checks the parent instances of the associated service to see if relatedaggregation rules exist. TBSM then processes any related rules and assigns theresulting applicable service state to the parent instances.
Note: The general service states of Good, Marginal, and Bad correspond to numericrule output values of 0, 3, and 5 respectively. This numerical value is used byTBSM when the resulting service state is combined with other rule output valuesusing a numerical aggregation rule or numerical formula rule.
You can configure TBSM to display the results of a good, marginal, and badaggregation rule as part of the Service Tree or Service Viewer features of theapplication GUI. You can also use the result as a factor of other aggregation rules.
For examples of these rules and how to map them to trees and views, see theTBSM Scenarios Guide.Related tasks:“Opening the Tree Template Editor” on page 265This topic describes how to open the Tree Template Editor.“Creating and editing view definitions” on page 277This topic describes how to create and edit view definitions.
Good, marginal, and bad aggregation rule propertiesThis topic describes good, marginal, and bad aggregation rules and properties. Thistopic also describes the aggregation rule properties: rule name, child template,condition type, and additional properties based on condition type.
Good, marginal, and bad aggregation rules have the following properties:v Rule namev Child templatev Conditions
Rule name
The rule name is a unique string that identifies the rule. This name is also used toidentify the output value that results from processing the rule when usedelsewhere in TBSM.
Note: The Name field for templates, data fetchers, rules, data sources, maintenanceschedules, and other objects must not contain these special characters:" & < > \ / * ? | ( ) : ;
Names must not contain spaces. Otherwise, these objects might not be savedproperly in the TBSM database. If the object does not save, remove any specialcharacters or spaces from the name field.
96 IBM Tivoli Business Service Manager: Service Configuration Guide

Child template
The child template is the service template of child service instances whose stateyou want to combine using the good, marginal, and bad aggregation rule. Select atemplate from the Child Rule/Mapping drop-down list.
Note: Child services not tagged with this template are not included in theaggregation calculation.
Description
Using a description will help you stay organized in your TBSM environment.
Display Name
The Display Name will appear in the metric list in the Time Window Analyzer. Ifno display name is specified, the name of the rule will be used.
Conditions
Propagation typeTBSM has two propagation types, which determine the type of child statusused in the aggregation rule. A Child instance can be tagged with multipletemplates. Each of these templates might have rules that affect the childstatus. When an event matches the template rule criteria, the child templatestatus changes. When the Child template status changes, the overall statusof the child service refreshes. The net overall status is the worse case of allthe child templates. The propagation type identifies whether the childtemplate status or the overall status of the child service instance ispropagated. The Child template propagation type is the default algorithm.
Condition type
TBSM supports two condition types for good, marginal, and badaggregation rules.
The first type of condition, percentage type calculation (% of children),calculates the state of the parent service using the percentage of children ina particular state. For percentage type calculation (% of children) youspecify the Child status (Marginal, Bad, or All) to monitor. The thresholdsare based on the percentages of child services that match the specifiedstate.
The second type of condition, Any child, calculates the general state of theparent service using the worst state of any child service. To use thiscondition, you specify a state for the parent service when the worst state ofa child service instance is Marginal or Bad.
Under all circumstances, the state of the parent service is Good by defaultand only changes when the specified percentage or worst state condition istrue.
Additional Properties for Condition type
These additional properties are dependent on the Condition type youselected. For Any Child, the additional property is Output Severity. For %of Children, the additional properties are Weight Property, Weight Default,Child Status, and Output Severity Threshold.
Any Child additional properties
Aggregation and numerical formula rules 97

Output SeverityYou specify the child state (Marginal or Bad) at which theparent service is considered to be Marginal or Bad.
% of children additional properties
Weight PropertyIf a property name is specified, the child service instancevalue for that property is used to calculate a weightedpercentage.
Weight DefaultThe default Weight Default value is 50. This default valueis assigned if no Weight Property value or child serviceinstance property value are specified.
Note:If the child service instance property value is not numeric,the default Weight Default value of 50 is assigned.
Child StatusSelect the child status (Marginal, Bad, or All) you want tomonitor. The All state option specifies that all childservices with Marginal and Bad states are considered.However, children with a Marginal status only affect 50%of the calculation, and children with a Bad have 100% effecton the calculation.
Output Severity ThresholdSpecify the percentage threshold to change the parentservice state. When the specified percentage of childservices has been met, then parent state changes to Bad orMarginal.
Metric Collection
The Metric Collection options enable TBSM to collect and store the metric data forthe rule. You can activate the storing of status changes of the rule and display therecent history of the metric. The collected metric data can be displayed in the TimeWindow Analyzer, and stored in the TBSM database. You can also store statuschanges of rules to the warehouse (TDW) using the BSM Agent. The TDW storesdata for historical reporting.
Note: If you want to store status changes to the warehouse, you need to installand configure the BSM agent and TDW.
Store data for this rule for TWAStore the output values for this rule in the TBSM database for the TimeWindow Analyzer.
Store data for this rule for TDWStore the output values for this rule in the TDW as a key performanceindicator for the BSM Agent Service Indicators attribute group.
Create and edit good, marginal, and bad aggregation rulesThis task describes how to create and edit good, marginal, and bad aggregationrules. This topic also describes the properties of good, marginal, and badaggregation rules.
98 IBM Tivoli Business Service Manager: Service Configuration Guide

About this task
To create or edit good, marginal, and bad aggregation rules:
Procedure1. From the Rules tab of the Edit Template tab in the Service Editor, click the
Create Good, Marginal, and Bad Aggregation Rules button. Or, to modify anexisting rule, click the name of the rule that you want to edit.The Good, Marginal, and Bad Aggregation Rule window opens.
2. Enter the rule properties using Table 30 as your guide.
Table 30. Good, marginal, and bad Aggregation rule: properties
Window element Description
Rule Name field The name of the good, marginal, and bad aggregation rule.
Note: The Name field for templates, data fetchers, rules, datasources, maintenance schedules, and other objects must notcontain these special characters:
" & < > \ / * ? | ( ) : ;
Names must not contain spaces. Otherwise, these objectsmight not be saved properly in the TBSM database. If theobject does not save, remove any special characters or spacesfrom the name field.
Description Using a description will help you stay organized in yourTBSM environment.
Display Name The Display Name will appear in the metric list in the TimeWindow Analyzer. If no Display Name is specified, the nameof the rule will be used.
Child Rule / Mapping list The service template of child service instances whose generalstate you want to aggregate using the rule.
Propagation Type selection The type of child status you want to propagate. Options areChild instance or Child template.
Condition Type selection The condition type associated with the rule. Options arePercentage of Children and Any Child.
Weight Property The child service instance property whose value is used tocalculate a weighted percentage. This is optional forPercentage of Children condition type only.
Weight Default This is the default weighted value. This is optional forPercentage of Children condition type only.
Child Status list The child status (Bad, Marginal, or All) to monitor which willbe aggregated to determine the parent servicestatus.Percentage of Children condition type only.
Output Severity Thresholdselections
Thresholds for percentages of children with the specifiedChild Status. When the calculated percentages exceed thespecified thresholds, TBSM sets the state of the parent serviceto Bad or Marginal. For Percentage of Children conditiontype only.
Output Severity lists Matching conditions that specify the state of the parentservice when the worst state of a child is Marginal or Bad. ForAny Child condition type only.
Aggregation and numerical formula rules 99

Table 30. Good, marginal, and bad Aggregation rule: properties (continued)
Window element Description
Store data for this rule forTWA checkbox
If you select this option, TBSM will collect and store statuschanges for the rule. This data is stored in the TBSMdatabase. Th collected metric data will be displayed in theTime Window Analyzer.
Store data for this rule forTDW checkbox
If you select this option, TBSM will collect and store thestatus changes of the rule to the warehouse (TDW) using theBSM Agent. The TDW stores data for historical reporting.Note: You need to install and configure the BSM agent andthe TDW to use this option.
3. Click OK.Related concepts:“Service template model: Example 1” on page 64This topic describes an example template model, templates with incoming statusrules, and templates with aggregation rules.“Numerical incoming status rules” on page 86This topic describes numerical incoming status rules.“Setting the service model structure” on page 150This topic describes how to set the service model structure using an example.
Numerical aggregation rules overviewThis topic describes numerical aggregation rules.
TBSM uses numerical aggregation rules to combine rule output values of the sametype across a set of child service instances. This type of rule is defined as part ofthe parent service template. The rule output values combined by a numericalaggregation rule can be generated by incoming numerical status rules or by otheraggregation and numerical formula rules.
When a numerical aggregation rule is processed, the resulting aggregated ruleoutput value is assigned to the parent service instance. This rule output value isstored in memory and is identified by the rule name when referenced elsewhere inTBSM.
Numerical aggregation rules consist of a set of properties that specify the relevantchild service instances and the calculations that must be performed to combine therule output values. The rules combine the values by performing simple mathcalculations or by executing more complicated custom policy functions. Likeincoming numerical status rules, numerical aggregation rules can also contain asimple status condition that sets the state of the affected service to Good, Marginal,or Bad.
TBSM processes numerical aggregation rules during runtime when a rule outputvalue associated with child service instance changes. When a rule output valuechanges, the application checks the parent instances of the associated services tosee if related numerical aggregation rules exist. TBSM then processes the relatedrules and assigns the resulting rule output value to the parent instances.
You can configure TBSM to display the result of a numerical aggregation rule aspart of the Services Tree or Service Editor features of the application GUI. You canalso use the result as a factor of other aggregation and numerical formula rules.
100 IBM Tivoli Business Service Manager: Service Configuration Guide

Numerical aggregation rules propertiesThis topic describes the numerical aggregation rule properties: rule name, childtemplate, child metric rule, aggregation function, and status.
Numerical aggregation rules have the following properties:v Rule namev Child templatev Child metric rulev Aggregation functionv Status
Rule name
The rule name is a unique string that identifies the rule. This string is also used toidentify the output value that results from processing the rule.
Note: The Name field for templates, data fetchers, rules, data sources, maintenanceschedules, and other objects must not contain these special characters:" & < > \ / * ? | ( ) : ;
Names must not contain spaces. Otherwise, these objects may not be savedproperly in the TBSM database. If the object does not save, remove any specialcharacters or spaces from the name field.
Child template
The child template is the service template of the child service that contains theoutput value that you want to combine using the numerical aggregation rule.
Child metric rule
The child metric rule is the name of a rule in the child template whose outputvalue you want to aggregate using this numerical aggregation rule. If the output ofthe child template rule is a value of Good, Bad, or Marginal, TBSM maps thesestates to numerical values of 5, 3 and 0 respectively during aggregation.
Description
Using a description will help you stay organized in your TBSM environment.
Display Name
The Display Name will appear in the metric list in the Time Window Analyzer. Ifno Display Name is specified, the name of the rule will be used.
Aggregation function
The aggregation function is the mathematical calculation used by TBSM toaggregate the rule output values from across the child service instances.
Table 31 on page 102 shows the aggregation functions for numerical aggregationrules.
Aggregation and numerical formula rules 101

Table 31. Numerical aggregation rules: aggregation functions
Function Description
Average Adds all the rule output values and then divides the result by the totalnumber of child service instances. The multiplier expression allows you tospecify the name of a custom field in the template that is used to weightvalues per service instance. For example, you can create a custom field inthe template named Weight and then manually assign a value in eachservice instance between 1 and 5. Then, you can specify Weight as themultiplier expression in the rule definition. When TBSM evaluates theAverage function, it then multiplies the value of each child output rule bythe corresponding value of Weight to give weighted outputs for eachservice.
Maximum Determines the greatest value among rule output values set in the childservice instances.
Minimum Determines the least value among rule output values set in the child serviceinstances.
Percentile Returns the rule output value associated with the child service closest to thespecified percentile. For example, if there are 60 child services and the ruleoutput values range from 1 to 60 among them, a percentile value of 75would return the rule output value associated with the child service ranked15 (or 25 percent) from the highest value among the children.Recommended for scenarios with a large number of child service instances.
Sum Adds all the rule output values set in the child service instances.
Policy You can also create custom policy functions that perform more complicatedtypes of aggregations.
TBSM provides a pre-defined function that determines the standarddeviation among output values. The standard deviation represents thedegree to which rule output values differ among themselves.
The other functions determine the number of child service instances whoseservice state is currently set to Bad and the status of child services.
For more information about writing custom functions in the expressionlanguage, see the IBM Tivoli Business Service Manager: Customization Guide.
Note: The percentile calculation for aggregation rules simply picks the value ofthe child that falls closest to the percentile specified in the rule. It does not performany averaging or smoothing calculations.
Status
You can optionally specify a status to be used by the rule to set the state of theaffected service instance to Marginal or Bad when the value of the resultingaggregated output value exceeds the thresholds you specify.
Metric Collection
The Metric Collection options enable TBSM to collect and store the metric data forthe rule. You can activate the storing of status changes of the rule and display therecent history of the metric. The collected metric data will be displayed in the TimeWindow Analyzer, and stored in the TBSM database. You can also store statuschanges of rules to the warehouse (TDW) using the BSM Agent. The TDW storesdata for historical reporting.
102 IBM Tivoli Business Service Manager: Service Configuration Guide

Store data for this rule for TWAStore the output values for this rule in the TBSM database for the TimeWindow Analyzer.
Store data for this rule for TDWStore the output values for this rule in the TDW as a key performanceindicator for the BSM Agent Service Indicators attribute group.
Note: If you want to store status changes to the warehouse, you need to installand configure the BSM agent and TDW.
Create and edit numerical aggregation rulesThis topic describes how to create and edit numerical aggregation rules. This topicalso describes numerical aggregation rule properties.
About this task
To create and edit numerical aggregation rules:
Procedure1. From the Edit Template tab in the Service Editor, click the Create Numerical
Aggregation Rule button. Or, to modify an existing rule, click the name of therule that you want to edit.The Edit Numerical Aggregation Rule window opens.
2. Enter the rule properties using Table 32 as your guide.
Table 32. Numerical aggregation rule: properties
Window element Description
Rule Name field The name of the numerical aggregation rule.
Child Template list The service template of child instances that contain the rule outputvalue you want to aggregate.
Child Metric Rule The name of a numerical rule in the child template. This rulegenerates the output value that you want to aggregate.
Description Using a description will help you stay organized in your TBSMenvironment.
Display Name The Display Name will appear in the metric list in the TimeWindow Analyzer. If no Display Name is specified, the name ofthe rule will be used.
Aggregation Function The mathematical calculation used by TBSM to aggregate theoutput values across child service instances. You can chooseAverage, Maximum, Minimum, Percentile, Sum, and Policy. If youchoose Policy, you must specify a custom policy that performs theaggregation.
Edit Policy button Opens the TBSM policy editor. You can use the policy editor tomodify one of the predefined functions or to create your ownfunctions using the TBSM expression language. For moreinformation about creating and modifying these functions, see theIBM Tivoli Business Service Manager: Customization Guide.
Status (Optional) If you want this rule to set the general state of the affected serviceinstance, select Status and enter threshold values for the twoservice states in the Marginal and Bad fields.
Aggregation and numerical formula rules 103

Table 32. Numerical aggregation rule: properties (continued)
Window element Description
Store data for thisrule for TWAcheckbox
If you select this option, TBSM will collect and store status changesfor the rule. This data is stored in the TBSM database. Thecollected metric data can be displayed in the Time WindowAnalyzer.
Store data for thisrule for TDWcheckbox
If you select this option, TBSM will collect and store the statuschanges of the rule to the warehouse (TDW) using the BSM Agent.The TDW stores data for historical reporting.Note: You need to install and configure the BSM agent and theTDW to use this option.
3. Click OK.Related concepts:“Service dependency configuration” on page 170This topic describes how to configure service dependencies.“Setting the service model structure” on page 150This topic describes how to set the service model structure using an example.
Numerical formula rules overviewThis topic describes numerical formula rules.
TBSM uses numerical formula rules to combine rule output values of differenttypes within the same service instance. These output values can be generated byincoming numerical status rules or by numerical aggregation rules. When anumerical formula rule is processed, the resulting combined output value isassigned to the same service instances where the original output values existed.This output value is stored in memory and is identified by the rule name whenreferenced elsewhere in TBSM.
Numerical formula rules consist of a set of properties that specify which outputvalues are to be combined and the calculations that must be performed to combinethem. These calculations can be simple math operations or more complicatedpolicy functions. Like incoming numerical status rules and numerical aggregationrules, numerical formula rules can also contain a simple status condition that setsthe state of the affected service to Good, Marginal, or Bad.
As with numerical aggregation rules, TBSM processes numerical formula rulesduring runtime when a rule output value associated with service instance changes.When the output value changes, the application checks the associated serviceinstance to see if related numerical formula rule exists. TBSM then processes therelated rules and assigns the resulting rule output value to the service instance.
Numerical formula rule propertiesThis topic describes these numerical formula properties: rule name, combinationexpression, and status.
This section contains information about creating and editing numerical formularules.
Numerical formula rules have the following properties:v Rule name
104 IBM Tivoli Business Service Manager: Service Configuration Guide

v Combination expressionv Status
Rule name
The rule name is a unique string that identifies the rule. This name is also used toidentify the output value that results from processing the rule.
Note: The Name field for templates, data fetchers, rules, data sources, maintenanceschedules, and other objects must not contain these special characters:" & < > \ / * ? | ( ) : ;
Names must not contain spaces. Otherwise, these objects may not be savedproperly in the TBSM database. If the object does not save, remove any specialcharacters or spaces from the name field.
Description
Using a description will help you stay organized in your TBSM environment.
Display Name
The Display Name will appear in the metric list in the Time Window Analyzer. Ifno Display Name is specified, the name of the rule will be used.
Expression
The expression (e.g. Attribute1.Value + Attribute2.Value) specifies how TBSMcombines the rule output values in the service instance. When you write theexpression, you use the notation rule_name.Value to represent the output valuesthat you want to combine, where rule_name is the name of the rule that generatedthe output value.
As an alternative to using a combination expression, you can create a custompolicy function that TBSM will use to combine the wanted rule output values.Using a custom policy function allows you to take advantage of conditionalstatements like If and When that are not otherwise available in combinationexpressions.
If the output of a rule in the service is a value of Good, Marginal, or Bad, TBSMmaps these states to numerical values of 0, 3 and 5respectively duringcombination.
For more information about the expression language, see the IBM Tivoli BusinessService Manager: Customization Guide.
Status
Optionally, you can specify a status to be used by the rule to set the state of theaffected service instance to Marginal or Bad when the resulting output valueexceeds thresholds that you specify.
Metric Collection
The Metric Collection options enable TBSM to collect and store the metric data forthe rule. You can activate the storing of status changes of the rule and display the
Aggregation and numerical formula rules 105
recent history of the metric. The collected metric data will be displayed in the TimeWindow Analyzer, and stored in the TBSM database. You can also store statuschanges of rules to the warehouse (TDW) using the BSM Agent. The TDW storesdata for historical reporting.
Store data for this rule for TWAStore the output values for this rule in the TBSM database for the TimeWindow Analyzer.
Store data for this rule for TDWStore the output values for this rule in the TDW as a key performanceindicator for the BSM Agent Service Indicators attribute group.
Note: If you want to store status changes to the warehouse, you need to installand configure the BSM agent and TDW.
Automatic roll-up of incoming status rules
In TBSM, you can define the aggregation rules automatically directly from theincoming status rule. Internally, the same aggregation rules will be created.Externally, the aggregation rules can even be directly edited on service templatesafter they are created automatically. TBSM automatically names aggregation statusrules based on the name of the incoming status rule and template that theaggregation belongs to. However, you will not be allowed to add a template to thelist if the name of the automatically generated aggregation rule would be too long.
The rules can also be managed directly by editing each service template to whichthey are being rolled up. If you change an automatically generated aggregationrule yourself, the "automatic roll-up" function may no longer display the servicetemplates. If the names of the incoming status rules or service templates change,the automatically created aggregation rules will still work but are not displayed ifyou press the Automatic Roll-up button for this incoming status rule.
To have more control over rolling up numerical status rules, you might need tocreate the aggregation rules yourself.Related tasks:“Creating automatic roll-up rules” on page 93This topic describes how to create automatic roll-up rules.
Create and edit numerical formula rulesThis topic describes how to create and edit numerical formula rules.
About this task
To create a numerical formula rule:
Procedure1. From the Edit Template tab in the Service Editor, click the Create Numerical
Formula Rule button.The Edit Numerical Formula Rule window opens.To edit an existing rule, click the name of the numerical formula rule you wantto edit.
2. Enter the rule properties using Table 33 on page 107 as your guide.
106 IBM Tivoli Business Service Manager: Service Configuration Guide

Table 33. Numerical formula rule properties
Window element Description
Rule Name field The name of the numerical formula rule. The Name field must notcontain these special characters:
" & < > \ / * ? | ( ) : ;
Description Using a description will help you stay organized in your TBSMenvironment.
Display Name The Display Name will appear in the metric list in the TimeWindow Analyzer. If no Display Name is specified, the name ofthe rule will be used.
Expression list You can use the expression list to view and add the names ofrule-output values to the combination expression.
Expression field You can use this field to enter the expression to be used by TBSMto combine the values of output values associated with the serviceinstance, for example, NumericInternalRule1.value +NumericInternalRule2.value.
Edit Policy button Opens the TBSM policy editor. You can use the policy editor tomodify one of the predefined functions or to create your ownfunctions using the TBSM expression language. For moreinformation creating and modifying these functions, see the IBMTivoli Business Service Manager: Customization Guide.
Use Policy If you created a policy for this rule, select this check box to enablethe policy. To disable the policy, unselect this check box.
Text Rule If you select the Text Rule check box, the output value of the rulewill be text.
Status (Optional) If you want this rule to set the general state of the affected serviceinstance, select Status and enter threshold values for the twoservice states in the Marginal and Bad fields. For example, you canspecify that if the result of the rule is 100 or higher, the service'sstatus changes to Bad.
Store data for thisrule for TWAcheckbox
If you select this option, TBSM will collect and store status changesfor the rule. This data is stored in the TBSM database. Thecollected metric data will be displayed in the Time WindowAnalyzer.
Store data for thisrule for TDWcheckbox
If you select this option, TBSM will collect and store the statuschanges of the rule to the warehouse (TDW) using the BSM Agent.The TDW stores data for historical reporting.Note: You need to install and configure the BSM agent and theTDW to use this option.
Automatic Roll-upbutton
If you use the Auto-Rule roll-up feature, you can automaticallycreate rules in other service templates that contain the values fromthe incoming status rule. That is, you pass the rule output valuesfrom the incoming status rule to a rule in another service template.
3. Click OK.
Aggregation and numerical formula rules 107

108 IBM Tivoli Business Service Manager: Service Configuration Guide

Auto-population rules
This section describes how you can set up IBM Tivoli Business Service Manager(TBSM) to automatically create services with the Auto-Population Rule feature.
Automatic service creation overviewThis topic describes what to do before you create services automatically.
You can configure TBSM to automatically create services based on event data fromthe Netcool/OMNIbus ObjectServer or an SQL data source.
Before you set up auto-population rules, you must define your service templatehierarchy in TBSM. See TBSM Scenarios guide for more information. You must alsodetermine the information that follows:1. The template and status rules for the services you want to create automatically.2. The parent template and service that you want the created service to support. If
a parent service name is identified in the data source or ObjectServer event,you can also assign or create parent services based on the data. You can createor assign the parent services for each level in the template dependency model.
3. For each higher level in the service hierarchy, you need to determine the parentservice (if any) for this level.Figure 16 shows a template structure that will be used in this chapter to createservices automatically. See the Service Template Structure in the IBM TivoliBusiness Service Manager: Scenarios Guide for more information about configuringthis template structure.
TBSM auto-population solutions overviewThis topic describes auto-population solutions available in TBSM.
TBSM provides two solutions for automatically configuring services based ontemplate rules:v Using an incoming status rule in combination with auto-population rules.
Auto-population rules are appropriate for simple models that do not constantlyupdate. They work best when you can obtain all the data (ObjectServer or SQLdata source) for the model from a single row in one table.
v ESDA auto-population works better for more complex models that update datain real time, when the model structure changes quickly whenever underlyingdata changes.
Figure 16. Auto-Population sample template service hierarchy
© Copyright IBM Corp. 2008, 2013 109

This section describes the first solution, using an incoming status rule incombination with auto-population rules.
Adding auto-population rulesThis topic describes auto-population rules. This topic also describes how to setstatus auto-population rules.
About this task
This section describes how to set the status auto-population settings for a servicetemplate. The status auto-population rules control how services are generated fortemplates with status rules at the bottom tier of your service hierarchy.
For the template example in Figure 16 on page 109, services tagged with theOSDBFarm, OSNetwork, OSWebfarm templates at the bottom tier of the servicehierarchy respond to events according to the incoming status rules in the template.
Note: The information provided in this section is based on examples in the IBMTivoli Business Service Manager: Scenarios Guide. Refer to that document forclarification of specific steps described here.Related concepts:“Data fetcher overview” on page 51This topic describes data fetchers.“Using the data fetcher results” on page 61
Setting status auto-population rulesAbout this task
In the following examples, rules are created that automatically populate all serviceinstances in the sample service model.
To set up auto-population rules for templates with status rules, complete thefollowing steps:
Procedure1. Select Templates from the drop-down list in the Service Navigation portlet.
Select the template that you want to create services for using theAuto-Population feature.Using the example in the example hierarchy in Figure 16 on page 109, select theOS_Network template.When the Template editor opens in the Service Editor, the Rules tab is open bydefault.The examples that follow create auto-population rules for the OSNetworktemplate: one for the HighNetworkTickets incoming status rule and one for theCriticalNetworkTickets incoming status rule. You can find more informationabout the incoming status rules shown here in the IBM Tivoli Business ServiceManager: Scenarios Guide.
2. Click Create AutoPopulation Rule to create a rule or click the name of anexisting auto-population rule to edit it.The system displays the New Auto-Population Rule window. For the examplesin this section, the latter was done.
110 IBM Tivoli Business Service Manager: Service Configuration Guide

This window shows the service templates related to the selected template in thecolumn on the left side of the window.Some auto-population rules have been created with the service hierarchydescribed in Figure 16 on page 109.The OSNetwork template is at the bottom tier of the service hierarchy. SinceOSNetwork is the template selected, OSNetwork is the current template. Theselected button is colored gray.The other template buttons in the hierarchy are colored dark blue. When youcreate a rule, the dark blue color does not show until you have createdexpressions which affect the template on that tab. For example, when youcreate a rule, when the window first opens, none of the tabs on the left have adark blue background and you can only select the lowest level tab. When youenter rule expressions for the lowest level template, the background of the nexthigher one turns dark blue and you can select it. In turn, when you enter ruleexpressions for this template, the background of the next higher one turns darkblue and you can select it and enter rule expressions on that tab.Click the Online Services template, the highest level service template in thehierarchy.The Online Services template is now colored gray and shows theauto-population rule that was created for it. The other two service templatenames in the hierarchy are colored blue.When you are creating an auto-population rule, the system forces you to startfrom the lowest level template in the hierarchy. You cannot start with theparent template or skip a level in the hierarchy.
Note: It is not necessary to configure the parent level auto-population rule. Itturns blue so that you can configure it, but it is not necessary.
3. Click the lowest level template in the hierarchy on the left side of the window(OSNetwork, for example.)
4. Table 34 explains the field entries for this example.
Table 34. New Auto-Population Rule window
Field name Description
Rule Name Enter a name for the rule or accept the default. For this example, enter NetAutopopHigh.Note: The Name field for rules, data sources, maintenance schedules, view definitions andother objects must not contain these special characters:
" & < > \ / * ? | ( ) : ; $ ! %
Names must not contain spaces. Otherwise, these objects may not be saved properly in theTBSM database. If the object does not save, remove any special characters or spaces from thename field.
Incoming Status Rule Since this template is the lowest in the hierarchy, you need to select the incoming status rulethat triggers the auto-population rule. Select a rule to auto-create service instances from anevent in the ObjectServer or a database. In this example, HighNetworkTickets is from a datafetcher called REGIONALTICKETS.
If an event matches the above status rule, but no service instance exists, create a instance using the followinginformation:Note: When entering name expressions, select the field values from the drop-down menu whenever possible toavoid incorrectly typing the field names for the name expressions. Selecting the values eliminates spelling and caseerrors that will cause your rule to malfunction.
Auto-population rules 111

Table 34. New Auto-Population Rule window (continued)
Field name Description
Instance NameExpression*
Enter an expression that will be used to construct the instance name of the new service thatwill be created. This expression should be written in the Netcool/Impact policy languageusing fields in the event. You can use the dropdown list on the right to help you constructthe expression. It provides a selectable list of event fields that you can move into theexpression box.
An example expression is:
LOWLEVELSERVICEID+CUSTOMER+REGION
Important: The result of the naming expression field for automatically created services mustnot contain these special characters:
" < > \ * ? | ;
The result of the naming expression must not be longer than 127 characters. Names longerthan 127 characters can cause display and performance issues.
For more information about expressions, see the IBM Tivoli Business Service Manager:Customization Guide.
Display NameExpression
If you want a different display name other than the default name defined in the InstanceName Expression field, enter an expression in this optional field. This expression must be inthe TBSM expression language. If no display name is configured, the display name will bethe same as the instance name (which is configured in the Instance Name Expression fieldabove.
An example expression is:
LOWLEVELSERVICEID+’_for_’+(RExtract(CUSTOMER,’(...).*’))+REGION
which would build the display name value from the LOWLEVELSERVICEID plus the string’_for_’ plus the first three characters of the CUSTOMER field value, and the REGION.
An example resulting name is: Network_for_ABCAsia.
See the IBM Tivoli Business Service Manager: Scenarios Guide for more examples andinformation.
Service LevelAgreement
If the service template has multiple SLAs, select the SLA you want from this drop-down list.
In the example, the default SLA level Standard is selected.
Restriction Filter Enter an expression in this optional field if you want to apply additional conditions when aservice instance is auto-created.
For example, if you only want a service created when the ALERTKEY field has a value, typeALERTKEY<> ’’ (ALERTKEY field value not equal to empty string) in this field.
Otherwise, you can use the default value of true.
A value of true means always create the instance without any additional conditions.
CustomConfiguration
See “Custom auto-population options” on page 118.
Enabled Select this check box to activate the rule.
5. Click OK.6. Click the Save button in the Edit Template toolbar.
The system saves the auto-population settings.
112 IBM Tivoli Business Service Manager: Service Configuration Guide

7. Enter the parent service auto-population settings as described in “Example:adding settings for parent templates” if there is a parent service for thistemplate. Otherwise, close the Auto-Population Rules window.
Example: adding settings for parent templatesThis task is an example which describes adding setting for parent templates.
About this task
In this example, you set rules for the OSRegion template, the next template in thehierarchy. Since the data for the parent OSRegion template is in the row retrievedby the HighDBTickets incoming status rule, you can automatically create the servicenames for the OSRegion services.
Procedure1. Enter the values for the OSRegion service template using Table 35 as your
guide.
Table 35. Auto-Population settings for a parent template
Window element Value
Rule Name Enter a name for the rule or accept the default. For thisexample, enter DBAutpopHigh.
Template Name Select the parent template, in this case OSRegion.
Instance Name Expression Enter the fields that uniquely identify the service for a givenrule. TBSM evaluates this expression against the incomingevent to obtain the instance name.
For this example, enter:
CUSTOMER+REGION
Display Name Expression Leave blank. Leaving this field blank generates the servicenames using the value in the Instance Name Expressionfield.
Service Level Agreement If the service template has multiple SLAs, select the SLA youwant from this drop-down list.
In the example, the default SLA level Standard is selected.
Restriction Filter Enter an expression in this optional field if you want to applyadditional conditions when a service instance is auto-created.
For example, if you only want a service created when theALERTKEY field has a value, type ALERTKEY<> ’’ (ALERTKEYfield value not equal to empty string) in this field.
For this example, accept the default value of true.
A value of true means always create the instance without anyadditional conditions.
2. Now enter the rules for the highest template in the hierarchy, OnlineServices. Since the data for the parent Online Services template is in the rowretrieved by the HighNetworkTickets rule, you can automatically create theservice names for the services assigned to the Online Services template.
3. Select the Online Services template.
Auto-population rules 113
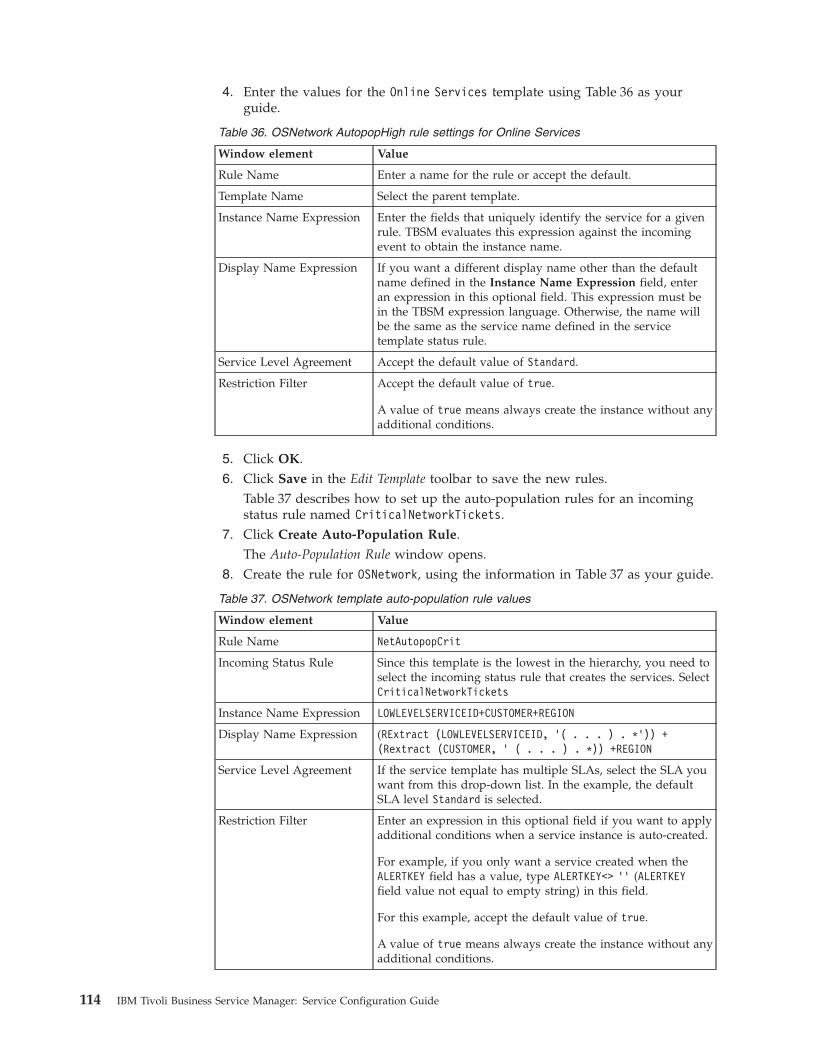
4. Enter the values for the Online Services template using Table 36 as yourguide.
Table 36. OSNetwork AutopopHigh rule settings for Online Services
Window element Value
Rule Name Enter a name for the rule or accept the default.
Template Name Select the parent template.
Instance Name Expression Enter the fields that uniquely identify the service for a givenrule. TBSM evaluates this expression against the incomingevent to obtain the instance name.
Display Name Expression If you want a different display name other than the defaultname defined in the Instance Name Expression field, enteran expression in this optional field. This expression must bein the TBSM expression language. Otherwise, the name willbe the same as the service name defined in the servicetemplate status rule.
Service Level Agreement Accept the default value of Standard.
Restriction Filter Accept the default value of true.
A value of true means always create the instance without anyadditional conditions.
5. Click OK.6. Click Save in the Edit Template toolbar to save the new rules.
Table 37 describes how to set up the auto-population rules for an incomingstatus rule named CriticalNetworkTickets.
7. Click Create Auto-Population Rule.The Auto-Population Rule window opens.
8. Create the rule for OSNetwork, using the information in Table 37 as your guide.
Table 37. OSNetwork template auto-population rule values
Window element Value
Rule Name NetAutopopCrit
Incoming Status Rule Since this template is the lowest in the hierarchy, you need toselect the incoming status rule that creates the services. SelectCriticalNetworkTickets
Instance Name Expression LOWLEVELSERVICEID+CUSTOMER+REGION
Display Name Expression (RExtract (LOWLEVELSERVICEID, ’( . . . ) . *’)) +(Rextract (CUSTOMER, ’ ( . . . ) . *)) +REGION
Service Level Agreement If the service template has multiple SLAs, select the SLA youwant from this drop-down list. In the example, the defaultSLA level Standard is selected.
Restriction Filter Enter an expression in this optional field if you want to applyadditional conditions when a service instance is auto-created.
For example, if you only want a service created when theALERTKEY field has a value, type ALERTKEY<> ’’ (ALERTKEYfield value not equal to empty string) in this field.
For this example, accept the default value of true.
A value of true means always create the instance without anyadditional conditions.
114 IBM Tivoli Business Service Manager: Service Configuration Guide

9. Click the OSRegion tab and enter the values shown in Table 38.
Table 38. OSNetwork NetAutopopCrit rule settings for OSRegion
Window element Value
Rule Name NetAutopopCrit
Incoming Status Rule Select OSRegion
Instance Name Expression CUSTOMER+REGION
Display Name Expression Leave this field blank to generate the service names using the entry in theInstance Name Expression field.
Service Level Agreement Standard
Restriction Filter true
A value of true means always create the instance without any additionalconditions.
10. Click the Online Services tab and enter the values shown in Table 39.
Table 39. OSNetworkNetAutopopCrit rule settings for OSRegion
Window element Value
Rule Name NetAutopopCrit
Template Name Select Online Services
Instance Name Expression CUSTOMER+HIGHLEVELSERVICEID
Display Name Expression CUSTOMER+(Rextract (HIGHLEVELSERVICEID, ’ . . . . . . . . (.*) ) )
This expression extracts all the characters after the eighth character in the fieldvalue.
Service Level Agreement Standard
Restriction Filter true
A value of true means always create the instance without any additionalconditions.
11. Click OK.12. Click the Save button in the Edit Template toolbar.
Deleting an auto-population rule setThis task describes how to delete an auto-population rule set.
About this task
To delete an auto-population rule, complete the following steps:
Procedure1. In the Service Viewer Edit Template tab, select the Rules tab.2. Select the check box(es) to the left of the auto-population rules that you want to
delete.3. Click the Delete Selected button.4. Click Save in the toolbar.
Auto-population rules 115

Working with additional service propertiesAbout this task
When services are created with auto-population rules, the services inherit thestandard rules and attributes from their assigned service template. You can alsoadd additional service properties to the auto-populated service by enteringproperty-name and expression-value pairs in the Custom Auto-Population RuleConfiguration window. After the new services are created with the auto-populationrule, you can see the additional properties in the Additional tab of the ServiceEditor: Edit Service tab.
To add an additional service property:
Procedure1. In the Add property name/expression pairs to set properties on the instances
table, click the New button. A new row for the table opens.2. Enter the Property Name and Expression for the additional service property.
Table 40. Additional service property fields
Field Description
Property Name The descriptive name of the additional attribute you wantto add to the service.
Expression The expression used to obtain the value for the property.This expression can be the name of a field or a statementthat uses the TBSM expression syntax to derive the propertyvalue from one or more fields from the data source.
In Figure 17, the Property Name is Regional Group, and the Expressionspecifies the value as the value of the REGION field from the source data feed.
Results
For more information about expressions, see the IBM Tivoli Business ServiceManager: Customization Guide.Related concepts:“Create policy for additional service properties” on page 119This topic describes how to start creating policies.
Figure 17. Custom auto-population configuration: Add additional properties
116 IBM Tivoli Business Service Manager: Service Configuration Guide

Deleting an additional service propertyAbout this task
To delete an additional service property, complete the following steps:
Procedure1. Click the Select check box for the properties you want to delete.2. Click Delete to delete the selected property or properties.
Specifying key performance indicators for servicesThis section describes how you can specify key performance indicators for theTBSM Service Indicators attribute group in the IBM Tivoli Business ServiceManagement Agent.
The TBSM Service Indicators attribute group is designed to record the values ofone or more key process indicators in the Tivoli Data Warehouse. The rules orattributes that are considered key process indicators vary between installations andeven between service templates or instances. Therefore, it is necessary to specifywhether a given TBSM rule or attribute values should be treated as a serviceindicator and recorded in the TBSM Service Indicators group.
In order for the system to treat a rule value or attribute as a key process indicator,you must define an additional attribute for the rules you want to use as keyprocess indicators in TBSM. This attribute name must match the rule name andhave a suffix of _KPI. This _KPI attribute must have the value set to true for thesystem to send the rule value to the service indicators attribute group.
For example, if you have a rule called Mystatus in a service template and youwant to use the output value of that rule as a performance indicator, you mustcreate an additional attribute called Mystatus_KPI for the service template.Related concepts:“Additional service settings” on page 171This topic describes additional service settings.
Example KPI configurationThis section describes a simple configuration for a KPI.
Before you begin
You must install the Common Agent for TBSM on your IBM Tivoli Monitoring hostbefore you set up performance indicators in TBSM.
About this task
In this example, we use one of the service templates and a formula rule from theservice configuration in the TBSM Scenarios Guide.
Procedure1. Open the Edit Template tab for the service template called OS_Region.2. Double-click the rule name RegSumCritical.
Auto-population rules 117

This rule calculates the total number of critical trouble tickets for a givenregion. The output value of this rule will be the key performance indicator inthis example. This rule sums the trouble tickets for all the service types thataffect a given region using the expression:NetSumCrit.Value + WebSumCrit.Value + DBSumCrit.Val
3. To create an additional attribute to store this rule value as a key performanceindicator, click the Additional tab.
4. Add a new attribute called RegSumCritical_KPI and set the default value totrue.Now, whenever the RegSumCritical rule is evaluated for a service assigned tothe OS_Region template, its value is stored in the Tivoli Data Warehouse in theservice indicator attribute group.This example shows how to control storage of service indicator values on atemplate basis. You can also control it on a service instance basis by adjustingthe RegSumCritical_KPI property value in the Additional tab for a givenservice instance.For more information about setting additional attributes, see the IBM TivoliBusiness Service Manager: Service Configuration and Customization guides.
Service persistence settingsThis topic describes service persistence settings.
For each service template, you can specify whether services discovered usingauto-population remain in the TBSM database based on the data retrieved in theSQL query. For example, you can specify that a service will be deleted if TBSMdoes not detect any activity for the service within a given time period.
Important: The search function in the Service Navigation portlet and Service Treewill only find services that are persisted. Services that are not persisted will notreturn as search results.Related tasks:“Service persistence settings” on page 161This topic describes how to set persistence settings for a service template.
Custom auto-population optionsThis topic describes the custom auto-population options.
In addition to the regular settings on the Auto-Population Rule window, you canconfigure custom options by opening the Custom Auto-Population Configurationwindow.
To open the Custom Auto-Population Configuration window, click the CustomConfiguration link on the Auto-Population Rule window.
Settings for existing parent servicesThis topic describes the settings for existing parent services.
When your auto-population rule discovers a new parent service for a child servicewith an existing parent, you can specify whether you want to add the new parent.
118 IBM Tivoli Business Service Manager: Service Configuration Guide
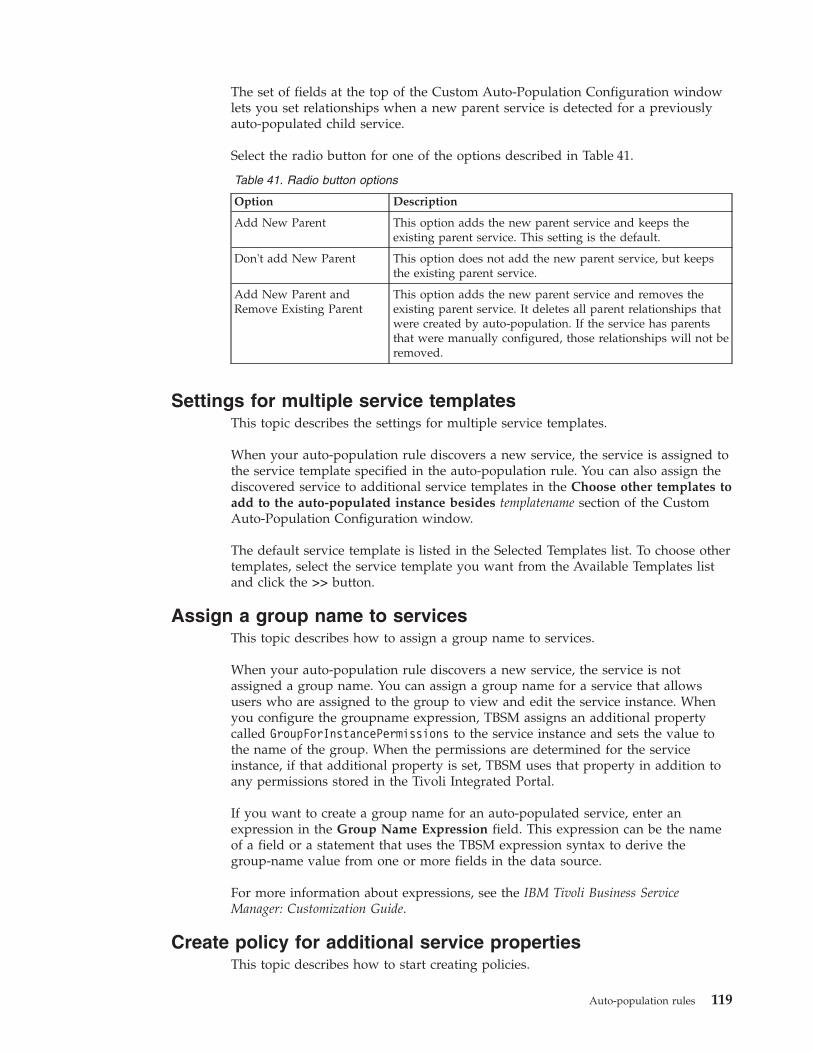
The set of fields at the top of the Custom Auto-Population Configuration windowlets you set relationships when a new parent service is detected for a previouslyauto-populated child service.
Select the radio button for one of the options described in Table 41.
Table 41. Radio button options
Option Description
Add New Parent This option adds the new parent service and keeps theexisting parent service. This setting is the default.
Don't add New Parent This option does not add the new parent service, but keepsthe existing parent service.
Add New Parent andRemove Existing Parent
This option adds the new parent service and removes theexisting parent service. It deletes all parent relationships thatwere created by auto-population. If the service has parentsthat were manually configured, those relationships will not beremoved.
Settings for multiple service templatesThis topic describes the settings for multiple service templates.
When your auto-population rule discovers a new service, the service is assigned tothe service template specified in the auto-population rule. You can also assign thediscovered service to additional service templates in the Choose other templates toadd to the auto-populated instance besides templatename section of the CustomAuto-Population Configuration window.
The default service template is listed in the Selected Templates list. To choose othertemplates, select the service template you want from the Available Templates listand click the >> button.
Assign a group name to servicesThis topic describes how to assign a group name to services.
When your auto-population rule discovers a new service, the service is notassigned a group name. You can assign a group name for a service that allowsusers who are assigned to the group to view and edit the service instance. Whenyou configure the groupname expression, TBSM assigns an additional propertycalled GroupForInstancePermissions to the service instance and sets the value tothe name of the group. When the permissions are determined for the serviceinstance, if that additional property is set, TBSM uses that property in addition toany permissions stored in the Tivoli Integrated Portal.
If you want to create a group name for an auto-populated service, enter anexpression in the Group Name Expression field. This expression can be the nameof a field or a statement that uses the TBSM expression syntax to derive thegroup-name value from one or more fields in the data source.
For more information about expressions, see the IBM Tivoli Business ServiceManager: Customization Guide.
Create policy for additional service propertiesThis topic describes how to start creating policies.
Auto-population rules 119
You can also use a custom policy to create additional properties for a given service.This feature is intended for experienced Netcool/Impact users. You should notattempt to edit this policy if you are unfamiliar with Netcool/Impact policies.
To use a custom policy to create custom service properties for the auto-populatedservices, select the Use Policy For Service Properties check box. Click the EditPolicy button to open the policy editor for this policy. Follow the instructionsinside the policy editor.
For more information about editing this policy, see the IBM Tivoli Business ServiceManager: Customization Guide.Related tasks:“Working with additional service properties” on page 116
Create policy for service namesThis task explains how to use the generic policy and create a custom policy.
About this task
You can also create a custom policy to create the names for the auto-populatedservices. This feature is intended for experienced Netcool/Impact users. Youshould not attempt to use these policies if you are unfamiliar with Netcool/Impactpolicies.
You can use the generic policy that takes an SQL query as input or create a totallynew policy to obtain the service names you want to create.
Using the generic policyAbout this task
For the generic policy, you select a data source and create an SQL query thatselects one row for each service you want to create. The Instance NameExpression in the Auto-Population Rule window is applied to each row selected bythe query you enter here. To use the generic policy to obtain the service instancenames, complete the following steps:
Procedure1. Under the Use a policy to obtain instance names, select the Use Policy check
box.2. Select the Use Generic Policy radio button.
The Data source and Query fields open.3. Select the Data source you want to use for the generic policy query.4. Enter an SQL query that returns exactly one row for each service instance you
want to discover.
Creating a custom policyAbout this task
This feature is intended for experienced Netcool/Impact users. You should notattempt to use these policies if you are unfamiliar with Netcool/Impact policies. Tocreate a custom policy to obtain service instance names, complete the followingsteps:
120 IBM Tivoli Business Service Manager: Service Configuration Guide

Procedure1. Under the Use a policy to obtain the instance names, select the Use Policy
check box.2. Select the Use Custom Policy radio button.3. To open the policy editor, click on the Edit Policy button.4. Follow the instructions inside the policy editor.
For more information about editing this policy, see the IBM Tivoli BusinessService Manager: Customization Guide.
Auto-population rules 121

122 IBM Tivoli Business Service Manager: Service Configuration Guide

Query Builder
This section covers how to use Query Builder in IBM Tivoli Business ServiceManager (TBSM).Related concepts:“Chart data sources” on page 303The section describes the chart data sources.
Query Builder overviewThis topic describes Query Builder.
The Query Builder helps you build SQL queries that retrieve data from databasessupported by TBSM. The Query Builder can help you create queries whenconfiguring a data fetcher and during template creation when you are addingESDA rules.
From the Data Fetcher, the ESDA rule, and the Charts in Service Navigationcreation windows, you have two options: you can enter queries manually, or usethe Query Builder windows. However, unless you are familiar with the databasesyou will be working with, using the Query Builder is much easier than enteringthe statement manually. The Query Builder gives you access to the names of all thetables in the database and the fields in those tables that you can select to includein the query. It also helps you do an SQL JOIN between tables.Related tasks:“Service persistence settings” on page 161This topic describes how to set persistence settings for a service template.“Creating the data fetcher” on page 52This task describes how to create a data fetcher.“Building the query”This topic describes how to build queries using Query Builder.“Setting up the query criteria” on page 55This task describes how to set up the query criteria, enter the SQL query manually,view the data fetcher results using fetch now, and add an expression.Related reference:“Incoming status rules properties and conditions” on page 80This reference topic describes these incoming status rule properties and conditions:rule name, data feed name, event discriminators, name expression, filter, and ruleoutput expression.
Building the queryThis topic describes how to build queries using Query Builder.
About this task
You use the Query Builder to select a data source and then to help you build thequery. You can access the Query Builder from either the Data Fetcher editor (see“Data fetchers” on page 51), the Templates editor, Create New ESDA Rule window(see “ESDA rules” on page 145), or from Charts in the Service Navigation
© Copyright IBM Corp. 2008, 2013 123
drop-down list. The procedures in this chapter explain how the feature works.
Procedure1. Click Query Builder.
The first pane of the Query Builder wizard, Choose Data Source and Tables,opens.
2. Select the data source you want from list of existing data sources in theChoose an existing Data Source drop-down menu. You must create the datasource before using Query Builder. For instructions on creating a data source,see “Data sources” on page 45. When the data source has been created, reopenQuery Builder and select the data source you created.
3. Select the data source and the Available Tables list will then automaticallyupdate with a list of the tables from the chosen data source.The Available Tables pane contains a list of all the tables in the data source.
Note: The list of tables includes all user defined tables and all views for thedatabase specified by the datasource. For some database types, this can meannumerous system views are included in the list. This happens because thesystem views are not distinguished from user defined views by the JDBCdrivers or database management systems that provide the information.
4. Select one or more tables from the data source, depending on what data youneed for your service model or template and click the Add > button.The tables move to the Selected Tables pane.You can select more than one table at a time by holding down the Shift or Ctrlkey and highlighting the table names.To deselect a table, highlight it and click the < Remove button to move it backto the Available Tables pane.In this example, two tables are selected, ESDA_APPLICATION andESDA_BUSINESSUNITS.
Note: For an ObjectServer data source, you can only select one table becausethe ObjectServer does not support the Join operation.
124 IBM Tivoli Business Service Manager: Service Configuration Guide

5. Click Next to open the next pane in the wizard, Choose Fields from theSelected Tables.
The Choose Fields from the Selected Tables window contains two panes foreach table that was selected in the Select Tables from Data Source window. Ineach pane on the left is a list of the fields that are available in those tables.The fields you select to use in the query move to the pane on the right.
Figure 18. Query Builder - Select Tables from the Data Source window
Figure 19. Choose Fields from the Selected Tables window showing two tables
Query Builder 125
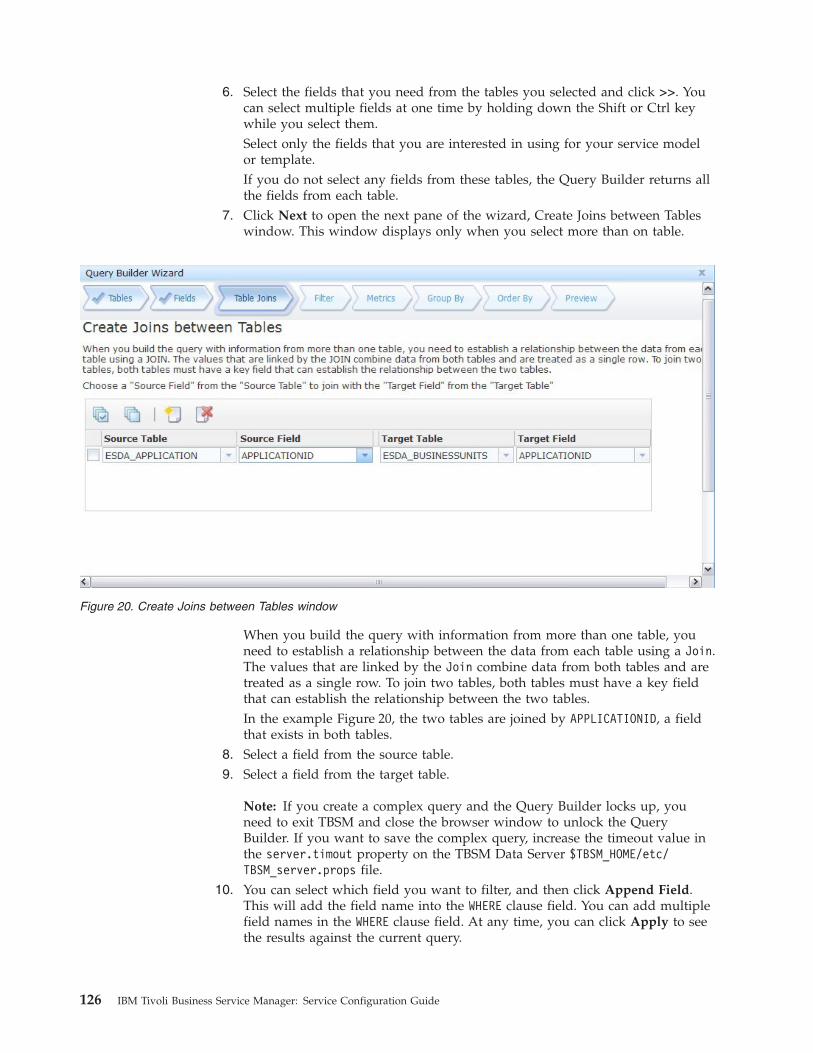
6. Select the fields that you need from the tables you selected and click >>. Youcan select multiple fields at one time by holding down the Shift or Ctrl keywhile you select them.Select only the fields that you are interested in using for your service modelor template.If you do not select any fields from these tables, the Query Builder returns allthe fields from each table.
7. Click Next to open the next pane of the wizard, Create Joins between Tableswindow. This window displays only when you select more than on table.
When you build the query with information from more than one table, youneed to establish a relationship between the data from each table using a Join.The values that are linked by the Join combine data from both tables and aretreated as a single row. To join two tables, both tables must have a key fieldthat can establish the relationship between the two tables.In the example Figure 20, the two tables are joined by APPLICATIONID, a fieldthat exists in both tables.
8. Select a field from the source table.9. Select a field from the target table.
Note: If you create a complex query and the Query Builder locks up, youneed to exit TBSM and close the browser window to unlock the QueryBuilder. If you want to save the complex query, increase the timeout value inthe server.timout property on the TBSM Data Server $TBSM_HOME/etc/TBSM_server.props file.
10. You can select which field you want to filter, and then click Append Field.This will add the field name into the WHERE clause field. You can add multiplefield names in the WHERE clause field. At any time, you can click Apply to seethe results against the current query.
Figure 20. Create Joins between Tables window
126 IBM Tivoli Business Service Manager: Service Configuration Guide

For example, select the TBSMDEMO.ESDA_BUSINESSUNITS table and the LOCATIONfield. Click Append Field to add LOCATION to the WHERE clause. EnterLOCATION='New York' to and click apply to see all the rows for New York.
11. Click Next. The next pane of the wizard displays. The pane shows the resultsof your query.
If the data displayed in the Add Filter pane is not what you want, you canclick the Tables, Fields, or Table Joins buttons at the top of the wizard to goback and correct your entries.
Results
If the query returns no data or is invalid, the query results would be: No Data ToDisplay Bad Query or no data.Related concepts:“Edit tab editors” on page 32This topic describes the Edit tab editors in the Service Editor.“Data fetcher overview” on page 51This topic describes data fetchers.“ESDA query concepts” on page 155This topic describes ESDA query concepts, ESDA data sources, and selecting onlythe data you need.“ESDA queries” on page 148This topic describes ESDA queries.“Working with ESDA service expressions” on page 158This topic describes how to configure ESDA service expressions.“Using the data fetcher results” on page 61“Query Builder overview” on page 123This topic describes Query Builder.Related reference:
Figure 21. Query Builder filter results
Query Builder 127

“Incoming status rules properties and conditions” on page 80This reference topic describes these incoming status rule properties and conditions:rule name, data feed name, event discriminators, name expression, filter, and ruleoutput expression.
Filtering the query dataThis task describes how to filter the query data.
About this task
When the correct data is displayed in the Add Filter pane, you can further refinethe results by adding a filter in the SQL WHERE Clause section of the window.
For example, if you wanted to filter the data so that you see only the servers thathave more than 20 seconds of downtime, you would complete the following steps:
Procedure1. Select fetcherappstatus in the Choose Data Source and Tables drop-down list.2. Select fetcherappstatus.downtime in the Choose Fields from the Selected
Tables drop-down list.3. Click Append Field. This will add the field name into the WHERE clause field.4. Type >20 as the operator. Valid operator characters: <>, =, !=, >, <.5. Click Apply to see the results against the current query.
You now see only the servers that have more than 20 seconds of downtime.
Note: You can add multiple field names in the WHERE clause field.6. To display the original data, delete the contents of the WHERE text field and click
Apply.7. Click Next to open the Metrics pane.
Add metricsThis task describes how to add query metrics in Query Builder.
About this task
If you are defining a data fetcher query in the Query Builder, you have the optionof adding metrics.
In this example, metrics are created that show the average downtime for servers.
Clicking Next from the Add Filter pane takes you to the Add Metrics pane wherethe two fields that were selected from the tables display as the column names.
To add the average downtime for these servers, complete the following steps:
Procedure1. To add a function, select one from the list. For example, AVG.2. Select a field name. For example, select a field that shows downtime, such as
FETCHERAPPSTATUS.DOWNTIME.3. In the As field, replace expr1 with a column name that describes the metric you
are adding. For example, add AVERAGEDOWNTIME.
128 IBM Tivoli Business Service Manager: Service Configuration Guide

4. Click Apply to see the results.When you create a metric, you need to use the fields you selected when youbuilt your query.
Adding Group BysIf you are defining a data fetcher query in the Query Builder, you have the optionof adding grouping.
About this task
You can optionally group your query results.
Clicking Next from the Add Metrics pane takes you to the Add Group Bys pane.
To add grouping, complete the following steps:
Procedure1. In the Select Fields to Groupby list, if you specified a metric and have not
explicitly set any "Group By" fields - then the group by fields will automaticallybe added to the query by TBSM.For example, if you added SERVERNAME was added, the servers are nowgrouped, and the metric is shown for each server name.
Note: If you select no fields on the Choose Fields from the Selected Tablewindow, the query builder selects all fields for the table. In other words, youselect * from the table. When you select all the fields from the table in this wayand you want to use the Group by clause, the fields will not be automaticallyadded to the Group by clause. In this case, you need to add the fields to theGroup by clause by hand.
2. You can add more groups to the GroupBy by selecting another field andclicking the Add All button.The figure below shows the results after adding applicationname to theGroupBy.You can delete any field names that you add by clicking the Remove Allbutton in the GroupBy toolbar, but you cannot delete the fields that wereautomatically added.
Adding Order BysIf you are defining a data fetcher query in the Query Builder, you have the optionof adding ordering.
About this task
You can order your results by a metric or numerical field.
Clicking Next from the Add Group Bys pane takes you to the Add Order Byswindow where the two fields that were selected from the tables display as thecolumn names.
To add ordering to the query results, complete the following steps:
Query Builder 129

Procedure1. Change the order by selecting asc or desc in the Direction drop-down list.2. Now scroll down to the Available Fields table.3. Select the field you want to order by.4. Click the Add button.5. Click Apply to see updated query results.6. When you have the query the way you want it, click Next to preview the
query, or click the Back button to return to previous windows to modify thequery.When you click Finish on the Preview Query pane, the Query Builder closesand you return to the original editor (Data Fetcher or ESDA rule). You can seethe query you created in the SQL Query text box.
130 IBM Tivoli Business Service Manager: Service Configuration Guide

ITCAM for Internet Service Monitoring rules
This topic describes how to set up IBM Tivoli Business Service Manager (TBSM) toautomatically configure rules for Internet Service Monitoring.
Note: This feature will not be part of subsequent TBSM releases.The Internet Service Monitoring component for IBM Tivoli Composite ApplicationManager (ITCAM) for Transactions application collects data about web pages. Usethese rules to monitor web services in the Internet Service Monitoring for theITCAM for Transactions application.
ITCAM for Internet Service Monitoring rule overviewThis topic describes how to set up an Internet Service Monitoring service template.This topic also describes Internet Service Monitoring rules.
From the TBSM console you can configure the Internet Service Monitoringcomponent of ITCAM for Transactions to automatically forward events to TBSM.
You can monitor the availability of Internet services, such as HTTP, HTTPS, andthe underlying services, such as DNS, LDAP, and ICMP.
To set up Internet Service Monitoring rules in a service template, you do thefollowing:1. Set default parameters to configure a monitor automatically every time you
create a service instance assigned to that template.2. Create an incoming status rule that will map events from the monitor to the
appropriate TBSM service instance.
The integration between these applications saves administration time, because youdo not have to manually configure the Web servers you want to monitor inInternet Service Monitoring. In the template, you can configure:v Internet Service Monitoring connectionv Rules that contain polling criteria, such as how often to poll the servicesv auto-population rules that create the services you want to monitor
Configuring a service template with Internet Service Monitoring rulesYou can configure template rules for each type of Internet Service Monitoringservice that you want to monitor. This setup contains the following tasks:v Selecting or setting up a serverv Creating profiles on the server for use with TBSMv Adding a server connectionv Configuring rules for a Web server templatev Adding a Web service instance and provisioning the rule
The last three steps are described in the following sections. For information aboutinstalling the Internet Services Monitoring server and creating profiles, see theITCAM for Internet Service Monitoring User's Guide.
© Copyright IBM Corp. 2008, 2013 131

Adding an Internet Service Monitoring server connectionThis task describes how to add a server connection for Internet Service Monitoring.
About this task
After you install the Internet Service Monitoring server and create the TBSMprofiles, you create Internet Service Monitoring rules for the service template.
Procedure1. From the Service Navigation portlet, select Templates, and select the template
that you want to add Internet Services Monitoring rules to. If you have notcreated the template yet, click the Create New Template button.The Service Editor opens with the Edit Template tab displayed. The Rules tabis open by default.The first step is to set up an Internet Service Monitoring server connection sothat the server can be accessed for Internet Service Monitoring profileinformation and to allow the provisioning of monitors.
2. Select the ISM Server Configuration button.The ISM Server Configuration window opens.
3. Select the Add New ISM Server button.The Add New ISM Server window opens.
4. Use the information in Table 42 to help you add the Internet Service Monitoringserver connection.
Table 42. Add New Server window
Fields Description
Server Enter the server IP address.
Server Port Enter the server port number.
Server User Name Enter the user name for the server.
Server Password Enter the server password.
5. Click OK to save the server connection information and close the window.6. Close the ISM Server Configuration window when you are finished adding
servers.The ISM Server Configuration window displays again showing the InternetService Monitoring server connection in a new row.
Results
Now that you have added the server connection, you are ready to configure theInternet Services Monitoring rules in your service template.Related concepts:“Opening the Edit Template tab” on page 68This topic describes the elements of the Edit Template tab in the Service Editor.Related tasks:“Creating an Internet Service Monitoring template rule” on page 141This task describes how to create a template rule for Internet Service Monitoring.
132 IBM Tivoli Business Service Manager: Service Configuration Guide
Deleting an Internet Service Monitoring server connectionThis task describes how to delete a server connection for Internet ServiceMonitoring.
About this task
To delete an Internet Service Monitoring server connection:
Procedure1. From the ISM Server Connection window, select the check box to the left of the
server that you want to delete.2. Click the red Delete button in the toolbar.
The server is deleted from the list.
Provisioning the monitorThis task describes how to provision the monitor for Internet Service Monitoring.
About this task
This section describes how to provision the monitor.
Procedure1. If you are not already in the ISM Configuration tab for the service, select the
service in the Service Navigation portlet.2. Select the ISM Configuration tab.3. Click the ISM Rule Name to open the Modify ISM Configuration Rule window.
The entries in this window were inherited from the template Internet ServiceMonitoring rule for this service.
4. Change any information that is specific to this service.5. Select the Provision Monitor when instance is next saved check box.6. Click Apply.
The monitor is now listed as configured, but not provisioned.7. Click Save to save the configuration and provision the monitor.
The monitor is listed as configured and provisioned.
Note: When you configure and provision Internet Service Monitoring rules ona service instance, any changes that are made to the underlying TemplateInternet Service Monitoring Rule are NOT propagated to the existing serviceinstance rules that were configured and provisioned. If you want the changesto apply, unassign the service template from the service, and reconfigure therule for the service.
Viewing the monitorThis task describes how to view the monitor in Internet Service Monitoring.
About this task
You can now log on to Internet Service Monitoring to see the configured monitor.
ITCAM for Internet Service Monitoring rules 133

Procedure1. Select the applicable profile.2. Select the monitor type, for example, HTTPS elements.3. Select the monitor name to view the profile elements.
Results
The monitor is listed showing the status.
Setting up a HTTP monitorThis topic describes how to set up a HTTP monitor. This topic also describescommands used with this monitor.
About this task
The HTTP monitor checks the availability and response time of web servers. TheHTTP monitor emulates a Web browser that supports the HTTP/1.0 protocol. Totest the Web server, the monitor sends a request for the Web page using one of thecommands below:v GET
This command attempts to access the Web page and return the whole page,including the HTTP header.
v POST
This command attempts to access a Web page that contains an HTTP form andcomplete the fields in that form.
v HEAD
This command attempts to access the Web page and return the header. Thiscommand is a fast way to check availability.
v GETALL
This command attempts to access the Web page and return the whole page,including the following:– HTTP header– Background– Images– Applets– Frames– Cascading style sheet– Scripts
Because the command returns the whole page, it may give a more realisticindication of the time taken to access the page. The monitor also usesmultiple threads to more accurately match the behavior of Web browsers.
Use the following procedure to set up an HTTP monitor:
Procedure1. Select a monitor type of HTTP when creating an Internet Service Monitoring
rule, or click the name of an existing rule for the HTTP monitor type.The default values for the HTTP monitor type are shown in the bottom portionof the ISM Configuration Rule window.
134 IBM Tivoli Business Service Manager: Service Configuration Guide

2. Use the information in Table 43 to help you configure the monitor:
Table 43. HTTP monitor rule configuration
Field Description
HTTP server The host name of the server to be monitored. The defaultentry is a variable you can use to have the service instancename displayed automatically in the Server field when theinstance is created.
Page The page to be monitored. You can accept the default entryof the forward slash (/), or you can specify a particularpage.
HTTP Server Port The port on the HTTP server to use. The default is 80.
Poll Interval The time, in seconds, between each test.
Number of Retests on Failure The number of times to retest before indicating a failure.
Retest Poll Interval The time, in seconds, to wait between each failure retest.
Action The HTTP request type:
v GET
v POST
v HEAD
v GETALL
Description An optional text field for entering descriptive informationabout the monitor.
3. Click OK or Apply to save the configuration.You can now see two rules configured in the Rules list, an Internet ServiceMonitoring rule and, if you checked the Create new Incoming Status Rulecheck box, an automatically configured Incoming Status rule. You now need totag the Web services that you want to monitor with this template.
Related tasks:“Creating an Internet Service Monitoring template rule” on page 141This task describes how to create a template rule for Internet Service Monitoring.“Tagging services with an Internet Service Monitoring template” on page 143This task describes how to tag services in Internet Service Monitoring templates.
Setting up an HTTPS monitorThis topic describes how to set up a HTTPS monitor. This topic also describescommands used with this monitor.
About this task
The HTTPS monitor checks the availability and response time of Web servers. Itcan monitor individual Web pages, including Web pages that use HTML forms,which normally require the user to enter data into fields.
Note: This monitor works the same way as the HTTP monitor, but itcommunicates with the HTTP server using version 2 or version 3 of the SecureSocket Layer (SSL) protocol, which encrypts all communication between the serverand the monitor.
To test the Web server, the monitor sends it a request for a Web page using one ofthe following request types:
ITCAM for Internet Service Monitoring rules 135

v GET
This command attempts to access the Web page and return the whole page,including the HTTP header.
v POST
This command attempts to access a Web page that contains an HTTP form andcomplete the fields in that form.
v HEAD
This command attempts to access the Web page and return the header. This is afast way to check availability.
v GETALL
This command attempts to access the Web page and return the whole page,including the following:– HTTP header– Background– Images– Applets– Frames– Cascading style sheet– Scripts
Because the command returns the whole page, it may give a more realisticindication of the time it took to access the page. The monitor also usesmultiple threads to more accurately match the behavior of Web browsers.
Use the following procedure to configure an HTTPS monitor:
Procedure1. Select a monitor type of HTTPS when creating an Internet Services Monitoring
rule, or click the name of an existing Internet Services Monitoring rule for theHTTPS monitor type.The HTTPS fields containing default values are shown in the bottom portion ofthe ISM Configuration Rule window.
2. Use the field descriptions in Table 44 to help you set up the monitor:
Table 44. HTTPS monitor rule configuration
Field Description
HTTPS server The host name of the server to be monitored. The defaultentry is a variable you can use to have the service instancename shown autopmatically in the Server field when theinstance is created.
Page The page to be monitored. You can accept the default entryof the forward slash (/), or you can specify a particularpage.
HTTPS server port The default port number for the HTTPS server is 443.
Poll Interval The time, in seconds, between each test.
Number of Retests on Failure The number of times to retest before indicating a failure.
Retest Poll Interval The time, in seconds, to wait between each failure retest.
136 IBM Tivoli Business Service Manager: Service Configuration Guide

Table 44. HTTPS monitor rule configuration (continued)
Field Description
Action The HTTPS request type:
v GET
v POST
v HEAD
v GETALL
Description An optional text field for entering descriptive informationabout the monitor.
3. Click OK or Apply to save the configuration.You can now see two rules configured in the Rules list, an Internet ServiceMonitoring rule and, if you checked the Create New Incoming Status Rulecheck box, an automatically configured Incoming Status rule. You now need totag the Web services that you want to monitor with this template.
Related tasks:“Creating an Internet Service Monitoring template rule” on page 141This task describes how to create a template rule for Internet Service Monitoring.“Tagging services with an Internet Service Monitoring template” on page 143This task describes how to tag services in Internet Service Monitoring templates.
Setting up a DNS monitorThis topic describes how to set up a DNS monitor, perform IP address lookup, andperform host name lookup.
About this task
The DNS monitor uses the Domain Name System (DNS) service to findinformation about one or more hosts. You can configure the DNS monitor to lookup the address or host name of the target host. How the monitor communicateswith the target depends on the type of lookup. The monitor measures theperformance of the service by recording the result of the search and the responsetimes.Related tasks:“Creating an Internet Service Monitoring template rule” on page 141This task describes how to create a template rule for Internet Service Monitoring.“Tagging services with an Internet Service Monitoring template” on page 143This task describes how to tag services in Internet Service Monitoring templates.
IP address lookupAbout this task
When performing an IP address lookup, the monitor queries the DNS service byusing the fully qualified host name to request the IP address. If it finds theaddress, it returns it to the monitor. If it cannot locate the IP address of the host, itreturns a message that contains the details of the failed search to the monitor.
If the request times out, the monitor will try again (if you configure retries). Ifthere are no retries left, the monitor creates a failed event. For more informationabout how the IP address lookup works, see the ITCAM for Internet ServiceMonitoring Reference Guide.
ITCAM for Internet Service Monitoring rules 137

Use the following procedure to set up a DNS monitor:
Procedure1. Select a monitor type of DNS when creating an Internet Service Monitoring
rule, or click the name of an existing rule for the DNS monitor type.The DNS fields, some of them containing default values, are shown in thebottom portion of the ISM Configuration Rule window:
2. Use the field descriptions in Table 45 to help you set up the monitor:
Table 45. DNS monitor rule configuration
Field Description
DNS server IP The IP address of the primary DNS server. The defaultentry is a variable you can use to have the service instancename shown automatically in the Server field when theinstance is created.
DNS Server Port The port on the DNS server to which the monitor listens.
Host to Resolve The host name of the target host to be resolved. This field isused for IP address lookups but not for host name lookups.
Monitor IP Address The IP address of the target host to be resolved. This field isused for host name lookups but not for IP address lookups.
Timeout The time, in seconds, to wait for the server to respond.
Retries on Timeout The number of times the monitor should try to contact theDNS server again before quitting.
Poll Interval The time, in seconds, between each poll of the server usingthe current profile element.
Number of Retests on Failure The number of times to retest before indicating a failure.
Description An optional text field for entering descriptive informationabout the monitor.
3. Click OK or Apply to save the configuration.You can now see two rules configured in the Rules list, an Internet ServicesMonitoring rule and, if you checked the Create New Incoming Status Rulecheck box, an automatically configured Incoming Status rule. You now need totag the Web services that you want to monitor with this template.
Host name lookupAbout this task
The setup for host name lookup is basically the same as for an IP address lookup,except that you provide an IP address in the Monitor IP Address field to beresolved into a host name instead of providing a host name to be resolved into anIP address.
Setting up an LDAP monitorThis topic describes how to set up a LDAP monitor.
About this task
The LDAP monitor connects to an LDAP server (using Version 2 or 3 of the LDAPprotocol) and tries to locate a specific entry. If the server succeeds in locating the
138 IBM Tivoli Business Service Manager: Service Configuration Guide

entry, it returns the contents of the entry to the monitor. The LDAP monitor canuse the Secure Socket Layer (SSL) to authenticate and connect to the LDAP server.
Use the following procedure to set up an LDAP monitor:
Procedure1. Select a monitor type of LDAP when creating an Internet Service Monitoring
rule, or click the name of an existing LDAP monitor type.The LDAP fields, some of them with default entries, are shown in the bottomportion of the ISM Configuration Rule window:
2. Use the information in Table 46 to help you set up the monitor:
Table 46. LDAP monitor rule configuration
Field Description
LDAP server The name or the IP address of the LDAP server to bemonitored. The default entry is a variable you can use tohave the service instance name shown automatically in theServer field when the instance is created.
LDAP Server Port The port on the LDAP server to connect to. You mustspecify the SSL port if you are using SSL authentication.
Username The user name used to log in to the directory service. Theformat of the user name depends on the setting of theAuthentication type. See Authentication Type descriptionbelow.
You can specify a Windows domain, that isDOMAIN\username.
Password The password used to log in to the directory service, ifnecessary. See Note in the Authentication Type Descriptioncolumn.
Searchbase The distinguished name of the location from which to startthe search.
Search filter An attribute of the target entity to search for.
Timeout The time, in seconds, to wait for the server to respond.
Poll Interval The time, in seconds, between each test.
Number of Retests on Failure The number of times to retest before indicating a failure.
Retest Poll Interval The time, in seconds, to wait between each failure retest.
Authentication Type The LDAP authentication method to use:
v SIMPLE
v SSL-SIMPLE
v SASL-DIGEST-MDS
Note: SASL-DIGEST-MDS authentication is not available onLinux platforms.
Sasl Realm The authentication realm for the LDAP server; typically, thefully qualified domain name of the server. If you want toshare passwords between multiple machines, you might usea domain name.
Description An optional text field for entering descriptive informationabout the monitor.
3. Click OK or Apply to save the configuration.
ITCAM for Internet Service Monitoring rules 139

You can now see two rules configured in the Rules list, an Internet ServiceMonitoring rule and, if you checked the Create New Incoming Status Rulecheck box, an automatically configured Incoming Status rule. You now need totag the Web services that you want to monitor with this template.
Related tasks:“Creating an Internet Service Monitoring template rule” on page 141This task describes how to create a template rule for Internet Service Monitoring.“Tagging services with an Internet Service Monitoring template” on page 143This task describes how to tag services in Internet Service Monitoring templates.
Setting up an ICMP monitorThis topic describes how to set up a ICMP monitor.
About this task
The ICMP monitor tests the performance of the Internet Control Message Protocolrunning on a network. To test the performance, the monitor uses the ICMP echocommand (commonly called ping) to target hosts and wait for a response.
If the monitor receives a reply from the target host, it records the time taken toproduce the response. If the monitor does not receive a reply within the specifiedtime period, the request is recorded as failed and an event is sent to theObjectServer, which passes it to TBSM.
Use the following procedure to set up an ICMP monitor:
Procedure1. Select a monitor type of ICMP to create an Internet Service Monitoring rule or
click an existing rule for the ICMP monitor type.The ICMP fields with default values appear in the bottom portion of the ISMConfiguration Rule window.
2. Use the information in Table 47 to help you set up the monitor:
Table 47. ICMP monitor rule configuration
Field Description
Host to Test The host name or IP address of the host to ping. Thedefault entry is a variable you can use to get the serviceinstance name to automatically appear in the Server fieldwhen the instance is created.
Timeout The time, in seconds, to wait for the server to respond tothe ping request.
Number of Packets to Send The number of echo request packets to send.
Packet Interval The time, in seconds, to wait between sending packets.
Packet Size The size (in bytes) of each packet to send.
Retries on Timeout The number of times the monitor should try the pingrequest again before quitting.
Poll Interval The time, in seconds, between each test.
Number of Retests on Failure The number of times to retest before reporting a failure.
Retest Poll Interval The time, in seconds, to wait between each failure retest.
Description A text field for providing descriptive text about the monitor.
140 IBM Tivoli Business Service Manager: Service Configuration Guide

3. Click OK or Apply to save the configuration.You can now see two rules configured in the Rules list, an Internet ServiceMonitoring rule and, if you checked the Create New Incoming Status Rulecheck box, an automatically configured Incoming Status rule. You now need totag the Web services that you want to monitor with this template.
Related tasks:“Creating an Internet Service Monitoring template rule”This task describes how to create a template rule for Internet Service Monitoring.“Tagging services with an Internet Service Monitoring template” on page 143This task describes how to tag services in Internet Service Monitoring templates.
Creating an Internet Service Monitoring template ruleThis task describes how to create a template rule for Internet Service Monitoring.
About this task
To add a new Internet Service Monitoring configuration rule for a template,complete the following steps:
Procedure1. Select the template in the Service Navigation portlet.2. In the Service Editor Rules tab of the Edit Template tab, select the Create New
ISM Auto Conf Rule button.TBSM uses the information you enter in this window when the serviceinstances for this template are created.Enter the Internet Service Monitoring rule information using the information inTable 48 as your guide.
Table 48. Create New Template Rule
Window element Description
Rule Name Enter a unique name for the rule.
Server Enter the IP address for the server. If you have not added aserver connection, there will be no servers listed here.
Profile Select a profile from the list. The profiles must already havebeen created in the Internet Services Monitoring componentfor ITCAM for Transactions.
Monitor Select the type of service you want to monitor:
v HTTP
v HTTPS
v DNS
v LDAP
v ICMP
Note: The type of service you select affects the fields whichare shown in the bottom half of the window.
ITCAM for Internet Service Monitoring rules 141

Table 48. Create New Template Rule (continued)
Window element Description
Create New IncomingStatus Rule
Select this option to map the events coming from the serverto your service instance in TBSM. The Event Mapping (orIncoming Status) rule is automatically configured anddisplays with the ISM rule in separate rows in the Rules tab.
This rule maps the events coming from the server to yourservices in TBSM, so that on poll failure the status will bereported.
3. Click OK and move to the fields beneath the list of monitor types.
Results
In the lower portion of the window, you can see the template-level default valuesfor the services that you can tag with this template. What you see in this portion ofthe window depends on what type of service you entered in the Monitor field,which is described in Table 48 on page 141. The values you need to provide foreach type of service are described in the following sections.
You can find more information about these monitors in the ITCAM for InternetService Monitoring Reference Guide.
Note: When you configure and provision rules on a service instance, any changesthat are made to the underlying Template Rule are NOT propagated to the existingservice instance rules that were configured and provisioned. If you want thechanges to apply, unassign the service template from the service, and reconfigurethe rule for the service.Related tasks:“Setting up a HTTP monitor” on page 134This topic describes how to set up a HTTP monitor. This topic also describescommands used with this monitor.“Setting up an HTTPS monitor” on page 135This topic describes how to set up a HTTPS monitor. This topic also describescommands used with this monitor.“Setting up a DNS monitor” on page 137This topic describes how to set up a DNS monitor, perform IP address lookup, andperform host name lookup.“Setting up an LDAP monitor” on page 138This topic describes how to set up a LDAP monitor.“Setting up an ICMP monitor” on page 140This topic describes how to set up a ICMP monitor.“Adding an Internet Service Monitoring server connection” on page 132This task describes how to add a server connection for Internet Service Monitoring.
Editing template Internet Service Monitoring rulesThis task describes how to edit template rules for Internet Service Monitoring.
142 IBM Tivoli Business Service Manager: Service Configuration Guide

About this task
To edit an existing Internet Service Monitoring rule, click the rule in the EditTemplate tab list.
Procedure1. Click the rule you want to modify.
The Modify ISM Configuration Rule window opens.2. Edit the fields as necessary and click Apply. The "grayed-out" entries are not
editable.3. Click Save in the Edit Template toolbar.
Deleting an Internet Service Monitoring configuration ruleThis task describes how to delete configuration rules for Internet ServiceMonitoring.
About this task
To delete an Internet Services Monitoring configuration rule:
Procedure1. In the Rules tab of the Edit Template tab, select the check box or boxes in the
Select column next to the rule, or rules, that you want to delete.2. Click the Delete Selected button in the Rules tab toolbar.3. Click Save in the Edit Template toolbar.
The rule or rules is removed from the list.
Tagging services with an Internet Service Monitoring templateThis task describes how to tag services in Internet Service Monitoring templates.
About this task
Now that you have a service template with Internet Service Monitoring rulesconfigured, you can tag services that you want to monitor with the template. Thefollowing example explains how to tag a service called google.com with theWebServer template.
Procedure1. Select Services in the Service Navigation drop-down menu.2. Create the google.com service.
Note: When you are provisioning a DNS monitor, use the IP address for theservice instance name expression rather than an alphabetic name. For any othertype of monitor, you should use an alphabetic name; for example, google.com.
3. The Service Editor opens with the Edit Service tab displayed.4. From the Available Templates column, select the template where you
configured Internet Services Monitoring rules.5. Click >> to move it to the Selected Templates column.6. Click Save.
ITCAM for Internet Service Monitoring rules 143

When you select the template and save the service, the rule is added to theservice in the ISM Configuration tab.
7. Select the ISM Configuration tab.The rule is listed in the ISM Rule Name column. As you can see, by the Novalues in the Configured and Provisioned columns, it has not yet beenconfigured, or provisioned.
Related concepts:“Configuring and provisioning Internet Services Monitoring” on page 173This topic describes Internet Service Monitoring configuration and provisioning.Related tasks:“Setting up an LDAP monitor” on page 138This topic describes how to set up a LDAP monitor.“Setting up an ICMP monitor” on page 140This topic describes how to set up a ICMP monitor.“Service configuration” on page 163This topic describes how to create and edit services.“Setting up a DNS monitor” on page 137This topic describes how to set up a DNS monitor, perform IP address lookup, andperform host name lookup.“Setting up a HTTP monitor” on page 134This topic describes how to set up a HTTP monitor. This topic also describescommands used with this monitor.“Setting up an HTTPS monitor” on page 135This topic describes how to set up a HTTPS monitor. This topic also describescommands used with this monitor.
Viewing an Internet Service Monitoring report for a serviceThis task describes how to view an Internet Service Monitoring report for a service.
About this task
If you have provisioned a monitor for a service, you can view an Internet ServiceMonitoring report for that service.
To view a report:
Procedure1. From the service tree or the Service Editor, right-click on a service for which
you have a monitor provisioned.A pop-up menu opens.
2. From the pop-up menu, select Show > ISM Service Report Viewer.The Report Viewer opens in Internet Service Monitoring.
3. Select the report options you want.4. Click View Report.
144 IBM Tivoli Business Service Manager: Service Configuration Guide

ESDA rules
This section describes how to work with External Service Dependency Adapters(ESDAs).
ESDAs overviewThis topic describes ESDAs.
ESDAs let IBM Tivoli Business Service Manager (TBSM) dynamically importservice hierarchies from any data source you can configure for TBSM. You shouldonly attempt to use ESDAs if you understand SQL queries, regular expressions,and the underlying data for your service model.
Accessing the ESDA sample dataThis topic describes how to access ESDA sample data.
The sample data for this section is part of the TBSMDEMO schema included theTBSM database. To access this data create a data source for the TBSM DB2database.
The tables used for ESDA examples are:
ESDA_APPLICATIONApplication table for the examples
ESDA_BUSINESSUNITSBusiness unit table for the examples
ESDA_HOSTSHosts table for the examples.
Creating the data source
To create a datasource for the TBSMDEMO data:1. Select Administration > Service Configuration from the task view.2. Select Data from the Service Navigation drop-down list.3. Click the New button.4. Enter these values for the data source:
Data source nametbsm_demo
User nameDB2 user name.
PasswordDB2 password
Host NameDB2 host name.
Port DB2 port. Default is 50000.
DatabaseTBSM
© Copyright IBM Corp. 2008, 2013 145

Disable database failoverSelected.
5. Click Test Connection
A message window displays:CTGBA0025I The test connection is open and functioning.
If an error message displays, check your settings and test the connection again.
About TBSM auto-population solutionsThis topic describes two TBSM auto-population solutions.
TBSM provides two solutions for automatically configuring services based ontemplate rules:v Using a data fetcher in combination with auto-population rules.
Auto-population rules are appropriate for simple models that do not constantlyupdate. They work best when you can obtain all the data (ObjectServer or SQLdata source) for the model from a single row in one table
v ESDA auto-population rules work better for more complex models that updatedata in real time, when the model structure changes quickly wheneverunderlying data changes.
ESDA rules and service structureThis topic describes ESDA rules and service structure. This topic also describesseed services.
You configure ESDA rules for the service templates in your service model. TheESDA rules consist of queries and naming expressions that discover and configurethe child and parent services defined by the aggregation rules in the seed servicetemplate. For each of these service templates, the ESDA rule creates multipleservices that share the common rules defined in the service templates. You canconfigure ESDA rules that discover services for each of the service templates in thisservice model. The seed template can be at any level, depending on yourconfiguration.
Using the template structure shown in Figure 22 on page 147, you configure theESDA rules in the seed service template: BUSINESSUNIT. Figure 22 on page 147shows the service template structure where the BUSINESSUNIT is the seed servicetemplate, CUSTOMER is the parent service template, and APPLICATION is the childservice template. Figure 22 on page 147 is an example of a possible configuration.
146 IBM Tivoli Business Service Manager: Service Configuration Guide

Before you configure your ESDA rules, you should analyze your source data andcreate a service structure by defining the relationships between TBSM servicetemplates. You should sketch these relationships on paper before you start yourESDA rule configuration.
Creating a seed service
After you create the service template structure, you need to create a seed service asa starting point for your ESDA rules. The rule cannot discover any new servicesuntil you create a seed service and assign it to template with an ESDA rule.
When a service has ESDA rules configured in its assigned service template, TBSMautomatically executes the necessary query and logic to discover any new servicesrelated to the seed service. TBSM then combines the dynamically discoveredservices with any existing child or parent services of the seed service. As the datachanges in the external data source, TBSM adjusts the service model to reflect thechanges by adding and removing services and relationships in the service model.Related tasks:“Selecting child or parent rules” on page 152This topic describes how to select child or parent rules.
Child and parent rulesThis topic describes child and parent rules.
With an ESDA rule, you can create a query and naming expressions for both childand parent services of the seed service. Child rules discover child services for theseed service. Parent rules discover parent services for the seed service. The ESDAModel Rule window lets you select the seed service template and whether the rulediscovers child or parent services.
Figure 22. Example service template structure
ESDA rules 147

Note: When you configure your ESDA rules, you should configure your childrules first, confirm that they work, and then configure your parent rules.Related tasks:“Selecting child or parent rules” on page 152This topic describes how to select child or parent rules.
ESDA queriesThis topic describes ESDA queries.
For each level on the service model, you create a query in the ESDA rule. TheESDA queries select data from an external data source and this data is used tobuild service instances. You can type in the query by hand, or select the QueryBuilder button to browse the data source and build your query from the QueryBuilder window. You use the data from the query to select the data needed todiscover the services for your service model.
Note: All Select statements should reflect the case sensitivity of the databasebeing used.
Whenever a service is created with an ESDA rule, the field and value pairsretrieved from the data source are added as additional properties of the ESDAservices that are created. You can use these additional parameters in custompolicies for ESDA and other rules. The names of the additional properties will beexactly the name of the fields returned by the query. For more information aboutpolicies, see the IBM Tivoli Business Service Manager: Customization Guide.Related tasks:“Entering an ESDA query” on page 157This topic describes how to enter an ESDA query.“Building the query” on page 123This topic describes how to build queries using Query Builder.“Setting the polling criteria” on page 53This task describes how to set the polling criteria, configure a daily fetch, and setthe fetching interval.
ESDA service expressionsThis topic describes ESDA service expressions.
For each level of your service model, you can configure ESDA rules that define thebasic service attributes for each discovered service. You configure expressions thatcreate a unique service name, a description, and a display name for a givenservice. These expressions use the values from the SQL query you created for yourrule. You can use expressions to combine these values with data from multiplefields or with data from the seed service. You can also parse the data usingNetcool/Impact functions and expressions. For more information about usingexpressions in TBSM, see the IBM Tivoli Business Service Manager: CustomizationGuide.Related tasks:“Service persistence settings” on page 161This topic describes how to set persistence settings for a service template.
148 IBM Tivoli Business Service Manager: Service Configuration Guide

ESDA rule triggersThis topic describes ESDA rule triggers, On-Demand triggers, and automaticupdates.
TBSM triggers ESDA rules on demand, or when new service data is discovered inthe service template data source. The data source can be an ObjectServer or an SQLdatabase. You can update the service model interactively, or you can set up theservice model to update automatically based on new data.
On-Demand triggers
When you click a service with ESDA rules in the Service Navigation portlet, TBSMexecutes the ESDA rules, updates the service model, and renders the service modelin the Service Editor.
When you click the + sign for a service with ESDA rules in the Service Navigationportlet, TBSM executes the ESDA rules, updates the service model, and renders theupdated service model in the Service Navigation portlet.
Automatic updates
The ESDA rule can also be triggered when a new or updated event or databaserow is detected by TBSM. To enable automatic ESDA updates, you must configurean incoming-status rule for the service template at the bottom level in your servicemodel. If the new data matches an incoming-status rule in the service template, ittriggers the creation of a new service based on the new data. TBSM calculates thestatus propagation of all affected services and discovers the parents of the servicerecursively.
You configure rules for importing child and parent services in service templatesassigned to the seed service. To discover the children or parents of a service, TBSMgoes through all the templates that the service is assigned to and applies all theESDA rules in the service templates.Related concepts:“Testing ESDA rules” on page 160This topic describes how to test ESDA rules, check an ESDA rule in the servicestree, check an ESDA rule in the Service Editor, and check automatic updates.Related tasks:“Create and edit good, marginal, and bad incoming status rules” on page 84This topic describes how to create and edit good, marginal, and bad incomingstatus rules. This topic also describes properties and conditions for incoming statusrules.“Create and edit numerical incoming status rules” on page 87This topic describes how to create and edit numerical incoming status rules. Thistopic also describes the properties and conditions of numerical incoming statusrules.
Service persistenceThis topic describes service persistence.
For each service template, you can specify whether services discovered with ESDArules remain in the TBSM database based on the data retrieved in the SQL query.Related tasks:
ESDA rules 149
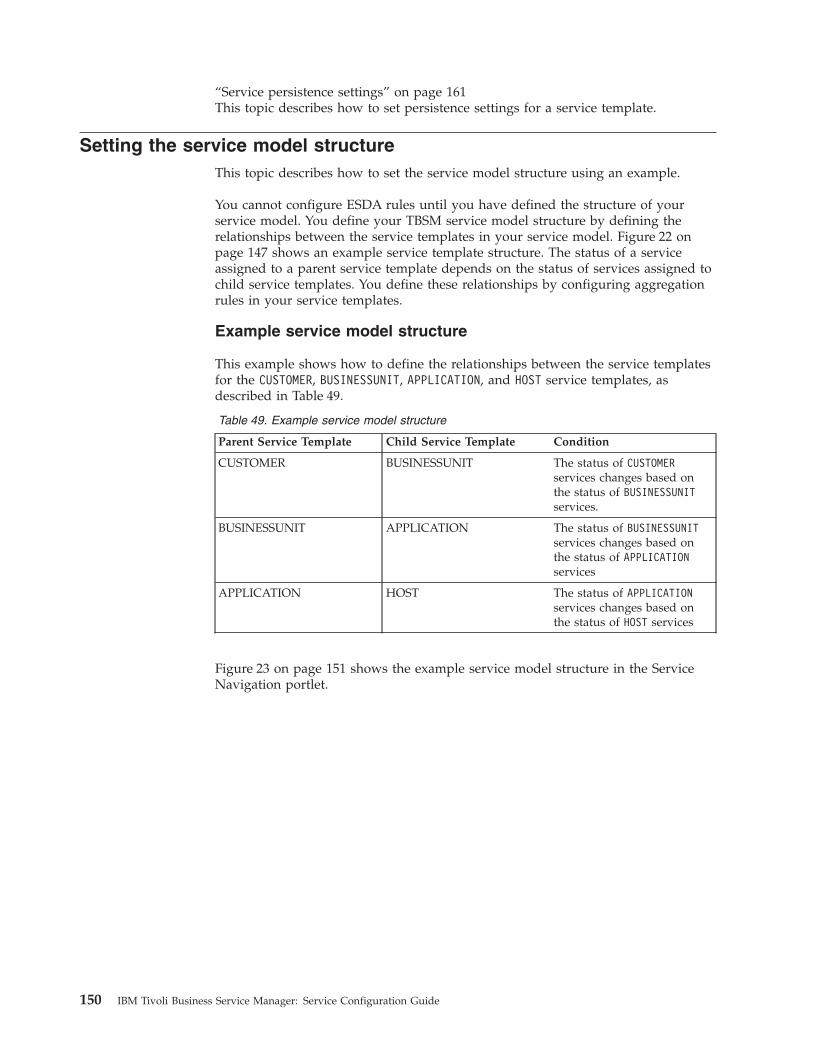
“Service persistence settings” on page 161This topic describes how to set persistence settings for a service template.
Setting the service model structureThis topic describes how to set the service model structure using an example.
You cannot configure ESDA rules until you have defined the structure of yourservice model. You define your TBSM service model structure by defining therelationships between the service templates in your service model. Figure 22 onpage 147 shows an example service template structure. The status of a serviceassigned to a parent service template depends on the status of services assigned tochild service templates. You define these relationships by configuring aggregationrules in your service templates.
Example service model structure
This example shows how to define the relationships between the service templatesfor the CUSTOMER, BUSINESSUNIT, APPLICATION, and HOST service templates, asdescribed in Table 49.
Table 49. Example service model structure
Parent Service Template Child Service Template Condition
CUSTOMER BUSINESSUNIT The status of CUSTOMERservices changes based onthe status of BUSINESSUNITservices.
BUSINESSUNIT APPLICATION The status of BUSINESSUNITservices changes based onthe status of APPLICATIONservices
APPLICATION HOST The status of APPLICATIONservices changes based onthe status of HOST services
Figure 23 on page 151 shows the example service model structure in the ServiceNavigation portlet.
150 IBM Tivoli Business Service Manager: Service Configuration Guide
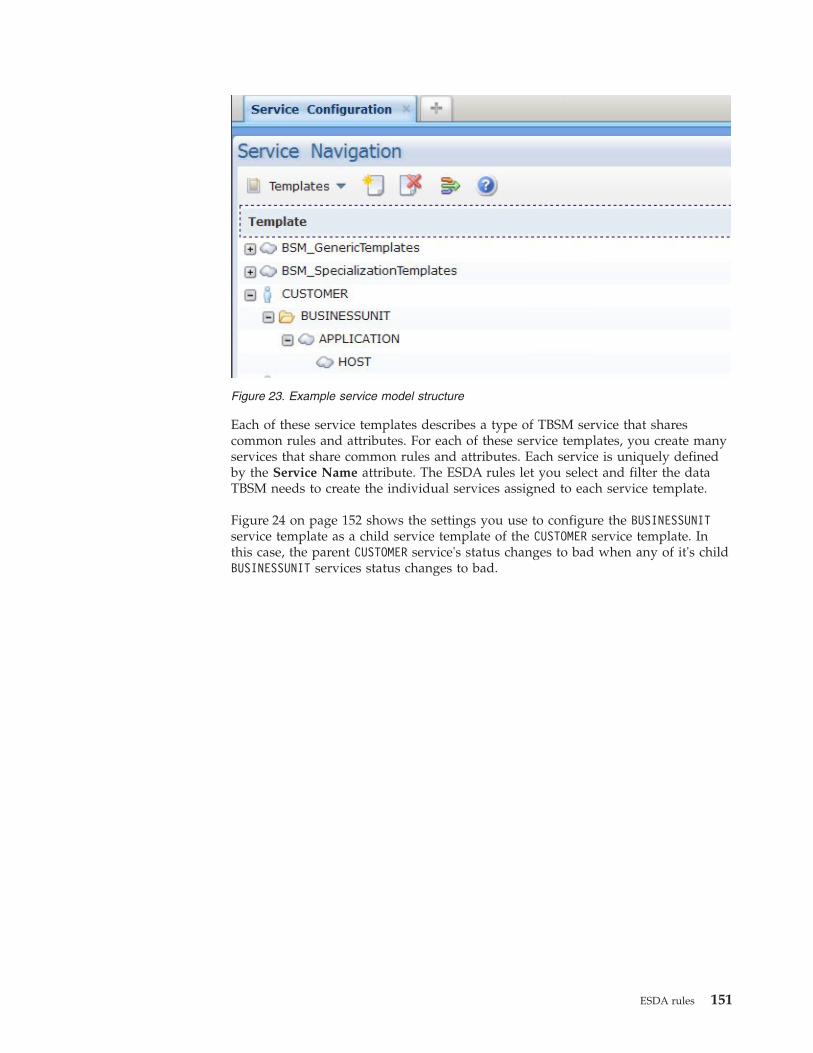
Each of these service templates describes a type of TBSM service that sharescommon rules and attributes. For each of these service templates, you create manyservices that share common rules and attributes. Each service is uniquely definedby the Service Name attribute. The ESDA rules let you select and filter the dataTBSM needs to create the individual services assigned to each service template.
Figure 24 on page 152 shows the settings you use to configure the BUSINESSUNITservice template as a child service template of the CUSTOMER service template. Inthis case, the parent CUSTOMER service's status changes to bad when any of it's childBUSINESSUNIT services status changes to bad.
Figure 23. Example service model structure
ESDA rules 151

Related tasks:“Create and edit good, marginal, and bad aggregation rules” on page 98This task describes how to create and edit good, marginal, and bad aggregationrules. This topic also describes the properties of good, marginal, and badaggregation rules.“Create and edit numerical aggregation rules” on page 103This topic describes how to create and edit numerical aggregation rules. This topicalso describes numerical aggregation rule properties.“Selecting child or parent rules”This topic describes how to select child or parent rules.
Selecting child or parent rulesThis topic describes how to select child or parent rules.
About this task
When you configure an ESDA rule for a service template, you need to specifywhether a given ESDA query is used to discover child or parent services. Youshould configure and test your child rules before you configure your parent rules.Before you start configuring your ESDA rules, you must create a seed serviceinstance by hand. The seed service is a starting point where you can add theparent and child services with the ESDA rule. Typically, you assign your seedservice for your top-level service template. For example, assign your seed serviceto the CUSTOMER service template.
To select the service type:
Figure 24. Good, marginal, bad aggregation rule settings
152 IBM Tivoli Business Service Manager: Service Configuration Guide

Procedure1. From the Service Navigation drop-down menu, select Templates.2. From Templates, click the service template you want for the new ESDA rule.
For example, in Figure 25 you could select the CUSTOMER template.
3. If the Edit Template 'Template Name' tab is not open, click the tab to open it.4. Click the Create ESDA Rule button.
The ESDA Model Rule window opens. The ESDA Model Rule window showsthe service templates related to the selected template in the two columns: oneon each side of the window. The values in these Child Rules and Parent Rulescolumns are determined by the structure of your service model.
5. Enter a rule name or accept the default. The rule name you select here will beadded to each template where you configure a child or parent rule.
6. To configure a rule that discovers child services for a template, click the servicetemplate name in the Child Rules column on the left side of the window.The ESDA Model Rule window refreshes to show the settings you need toconfigure for this part of the ESDA rule. The settings let TBSM discover childservices for the selected seed service template.In Figure 26 on page 154, the BUSINESSUNIT service template is selected in theChild Rules column. The query and expressions entered in this window areused to discover child services for the BUSINESSUNIT service template. In thiscase, the child services are assigned to the APPLICATION service template. Thatis, the seed service template is BUSINESSUNIT, and the child service template isAPPLICATION.
7. To configure a rule that discovers parent services for a service template, clickthe service template name in the Parent Rules column on the right side of thewindow. You should configure all your Child Rules before you configure yourParent Rules.The ESDA Model Rule window rule refreshes to show the settings you need toconfigure for this part of the ESDA rule. The settings let TBSM discover parentservices for the selected service template.
Figure 25. Example service template structure
ESDA rules 153

For example, Figure 26 shows similar settings for this section of configuration.
In Figure 26, the APPLICATION service template is selected in the Parent Rulescolumn. The query and expressions entered in this window are used todiscover parent services of the APPLICATION service template. In this case, theseed service template is APPLICATION and the parent services are assigned to theBUSINESSUNIT service template.
8. When you have selected the service template for either parent or child rules,you will see the template in the Child/Parents rules column.If you have multiple templates for a given level, you will only see one templatein the Child/Parents rules column.
9. To delete a rule, click the red X in the box for the rule you want to delete.Related concepts:“Setting the service model structure” on page 150This topic describes how to set the service model structure using an example.“ESDA query concepts” on page 155This topic describes ESDA query concepts, ESDA data sources, and selecting onlythe data you need.“Working with ESDA service expressions” on page 158This topic describes how to configure ESDA service expressions.“ESDA rules and service structure” on page 146This topic describes ESDA rules and service structure. This topic also describesseed services.
Figure 26. ESDA Model Rule window: parent rules
154 IBM Tivoli Business Service Manager: Service Configuration Guide

“Child and parent rules” on page 147This topic describes child and parent rules.
ESDA query conceptsThis topic describes ESDA query concepts, ESDA data sources, and selecting onlythe data you need.
After you have selected the seed service template for either child or parent rules,you create an SQL query to select the service data from an external data source.The SQL query selects a set of data you use to obtain the service names for thechild and parent services of a given seed service.
ESDA data sources
Before you create an ESDA query, you must configure the data source you want touse for TBSM. You can configure the data source for TBSM from the Edit DataSource tab.
Note: If you use the Query Builder to create your query, the fields you select withyour query are added to the drop-down lists in the Results section of the windowfor the Instance Name, Display Name, and Description expression fields.
Important: select only the data you need
Whenever you create a query for an ESDA rule, it is important that you only selectthe tables and fields you need to identify unique service names for the servicesyou want to discover. The Select * clause should only be used in cases where youneed data from all the columns in a table. Otherwise, your queries will take moretime and system resources to execute.
Figure 27 on page 156 shows the Query Builder window with the necessary fieldsselected from the TBSM.DEMO.ESDA_APPLICATION table. In this case, you do not needthe BUSINESSID and hostname fields to define the services assigned to a servicetemplate for applications.
ESDA rules 155

In the following example, the query only selects the fields you need to identify theservices from the TBSMDEMO.ESDA_APPLICATION table.select APPLICATIONID,APPLICATIONNAME,APPLICATIONTYPE from TBSMDEMO.ESDA_APPLICATIONwhere BUSINESSID = __BUSINESSID__
This query also uses the __fieldname__ notation. This notation lets you specify avariable field value. In this example, both the TBSM.DEMO.ESDA_APPLICATION table,and the TBSM.DEMO.ESDA_BUSINESSUNIT table contain a key field named BUSINESSID.The query only selects rows where the value of the BUSINESSID field (inTBSM.DEMO.ESDA_APPLICATION table) matches the field value (in businessunits table)for the seed service. This notation refers to the value for the seed service instance.
For the business services in the service model, this example query dynamicallyimports the data about the child services of a given business unit service. Eachbusiness unit service has a field called BUSINESSID which was set by the ESDAquery that created the business unit services from data in theTBSM.DEMO.ESDA_BUSINESSUNIT table.
The data about the child service is in a table called TBSM.DEMO.ESDA_APPLICATION,which also has a BUSINESSID field that maps each application to a given businessunit. The ESDA rule uses the data from the TBSM.DEMO.ESDA_APPLICATION table toimport the corresponding applications as child services of the matching businessunit service. That is, when the BUSINESSID value matches in both tables, the ESDArule creates a child application service for the matching business unit service.Related tasks:“Creating a data source” on page 46This task describes how to create your own data source.“Building the query” on page 123This topic describes how to build queries using Query Builder.“Entering an ESDA query” on page 157This topic describes how to enter an ESDA query.
Figure 27. Selected Fields from TBSM.DEMO.ESDA_APPLICATION table.
156 IBM Tivoli Business Service Manager: Service Configuration Guide

“Selecting child or parent rules” on page 152This topic describes how to select child or parent rules.
Entering an ESDA queryThis topic describes how to enter an ESDA query.
About this task
You can manually enter an SQL query in the SQL Query text field if you havealready configured the data source you want to use for TBSM or you can use theQuery Builder. To create a query in your ESDA rule:
Note: If you are not familiar with the tables and all the fields in the database youwant to query, it will be much easier to use the Query Builder. The Query Builderlists all the tables and their fields and allows you to select them from the lists. Ifyou use the Query Builder, you will avoid spelling and case sensitivity problems.
Procedure1. Select a data source from the Data Source drop-down list.2. Enter your query in the SQL Query text field.
Figure 28 shows an SQL query that selects the rows where the value of theBUSINESSID field matches the BUSINESSID field value (__BUSINESSID__) for theseed service. In this case, the ESDA is selecting a child service assigned to theAPPLICATION service template for the seed services assigned to the BUSINESSUNITservice template.
3. Enter the Instance Name, Description, and Display Name expressions for theservices.
Related concepts:“ESDA queries” on page 148This topic describes ESDA queries.“ESDA query concepts” on page 155This topic describes ESDA query concepts, ESDA data sources, and selecting onlythe data you need.“Working with ESDA service expressions” on page 158This topic describes how to configure ESDA service expressions.
Figure 28. Example ESDA database query
ESDA rules 157

Working with ESDA service expressionsThis topic describes how to configure ESDA service expressions.
After you create an SQL query to select the service data you want from a datasource, you need to configure expressions that create unique attributes for eachdiscovered service. You configure expressions that create a unique name,description, and display name for a given service in the Results section of theESDA Model Rule window.
Note: You must make sure that each Instance Name Expression creates a uniqueservice name for each service you want to discover. If the expression results are thesame for multiple rows, the ESDA rule will only create a service for the last rowthat matches the Instance Name Expression.
These expressions use the values from the SQL query you created for your rule.You can use expressions to combine these values with data from multiple fields orwith data from the seed service. You can also parse the data using Netcool/Impactfunctions and expressions. For more information about using expressions in TBSM,see the IBM Tivoli Business Service Manager: Customization Guide.
To configure service expressions:1. Select the seed service template and rule type you want.2. Configure the SQL query to select the data you want to use for your ESDA
rule. You enter expressions in these fields to obtain the service attributes fromthe data selected by your SQL query.
3. Enter the information in the service expression fields using the information inTable 50 on page 159.
Note: When entering name expressions, select the field values from thedrop-down menu whenever possible to avoid incorrectly typing the field namesfor the name expressions. Selecting the values eliminates spelling and caseerrors that cause your rule to malfunction. Some data sources, such as MS-SQL,have case-sensitive field names. If you use the Query Builder to build thequery, all the fields for query will be in drop-down lists for the namingexpressions In this way you can avoid spelling and case errors in the fieldnames.
158 IBM Tivoli Business Service Manager: Service Configuration Guide

Table 50. ESDA rule configuration window
Field name Description
Instance NameExpression
Enter an expression for the service name. For example, enter:"Application" +__serviceinstancename__ + applicationid)
to create the name from the word Application, + the name of theseed service, + the value of the applicationid field. The resultingname would be like: ApplicationMIS24.
For more information about expressions, see the IBM Tivoli BusinessService Manager: Customization Guide.Important: The result of the naming expression field forautomatically created services must not contain these specialcharacters:
" < > \ * ? | ;
The result of the naming expression must not be longer than 127characters. Names longer than 127 characters can cause displayand performance issues.
Display NameExpression
Optional. If you want a different display name other than thedefault name defined in the Instance Name Expression field, enteran expression in this field. This expression must be in the TBSMexpression language. Otherwise, the name will be the same as theservice name defined in the service template status rule.
For example enter:
applicationtype + applicationid
to create the display name from the values of the applicationtypeand applicationid fields.
This name is displayed as the service name in the ServiceNavigation portlet tree.
DescriptionExpression
Optional. If you want to include a description of the discoveredservice, enter an expression in this field.
Available/SelectedTemplates
Select the service template or templates you want assigned to thediscovered services. Use the >> and << buttons to move the servicetemplates between the Available Templates and Selected Templateslists.
Primary Template If you have selected multiple templates for the discovered services,select the primary template you want assigned to the service fromthe Primary Template drop-down list field.
Enabled Select the Enabled check box to activate the ESDA rule.
Restriction Filter(Optional)
Enter an SQL WHERE clause in this optional field if you want toapply additional conditions when the ESDA rule is run. Thiscondition is evaluated against the fields of the seed service.
For example, if you only want a service created if theapplicationid field of the seed service has a value, typeapplicationid <> ’’ (applicationid field value not equal toempty string) in this field.
4. When you have finished configuring you service expressions, select theEnabled check box to enable the rule. The ESDA rule will not function untilyou select the Enabled option.
5. Click OK to save your settings and close the window.
ESDA rules 159

Note: When you save an ESDA rule definition, a message warns you that theincomplete rule definitions will not be saved. The system displays this message ifyou opened a child or parent rule page, but did not specify all the required fields.When you click the OK button, the system reports these incomplete definitions forany ESDA child or parent rules. This includes the rule page that displays whenyou first open the ESDA Model Rule window. If you do not need the incompleterules for your ESDA specification, then click OK for the message and only thecompleted rules will be saved. Otherwise, open the appropriate rule page andspecify all the required fields.Related tasks:“Entering an ESDA query” on page 157This topic describes how to enter an ESDA query.“Building the query” on page 123This topic describes how to build queries using Query Builder.“Selecting child or parent rules” on page 152This topic describes how to select child or parent rules.
Testing ESDA rulesThis topic describes how to test ESDA rules, check an ESDA rule in the servicestree, check an ESDA rule in the Service Editor, and check automatic updates.
By default, TBSM automatically checks for new services when you click a servicethat is assigned to a service template with ESDA rules.
Checking an ESDA rule in the services tree
To check that the ESDA rule is working, click the + for the seed service name inServices in the Service Navigation portlet. TBSM executes the ESDA rules for theservice and displays the updated service model in the Services Tree.
Before you test the ESDA rule, you need to create the seed service and assign it toa service template.
Table 51. Example discovered services and their related templates
Service Service Template
Micromuse CUSTOMER
Development BUSINESSUNIT
Impact APPLICATION
shark HOST
Checking an ESDA rule in the Service Editor
To check that the ESDA rule is working, click the seed service name in Services inthe Service Navigation portlet. TBSM executes the ESDA rules for the service anddisplays the updated service model in the Service Editor.
Checking automatic updates
If a service template with an ESDA parent rule also has an incoming-status rule,TBSM automatically updates the service model whenever a new or updated eventfor the service is detected. To check that the ESDA rule is working for automaticupdates, send a test event or add a database row for the seed service. TBSM
160 IBM Tivoli Business Service Manager: Service Configuration Guide
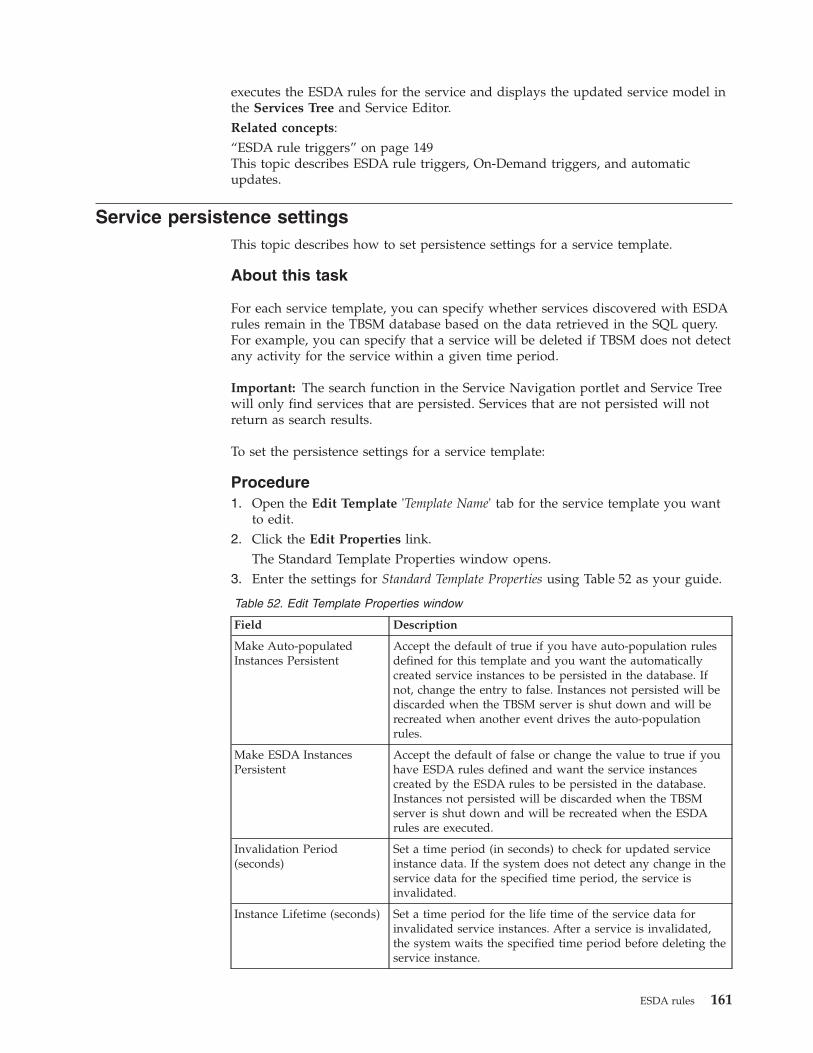
executes the ESDA rules for the service and displays the updated service model inthe Services Tree and Service Editor.Related concepts:“ESDA rule triggers” on page 149This topic describes ESDA rule triggers, On-Demand triggers, and automaticupdates.
Service persistence settingsThis topic describes how to set persistence settings for a service template.
About this task
For each service template, you can specify whether services discovered with ESDArules remain in the TBSM database based on the data retrieved in the SQL query.For example, you can specify that a service will be deleted if TBSM does not detectany activity for the service within a given time period.
Important: The search function in the Service Navigation portlet and Service Treewill only find services that are persisted. Services that are not persisted will notreturn as search results.
To set the persistence settings for a service template:
Procedure1. Open the Edit Template 'Template Name' tab for the service template you want
to edit.2. Click the Edit Properties link.
The Standard Template Properties window opens.3. Enter the settings for Standard Template Properties using Table 52 as your guide.
Table 52. Edit Template Properties window
Field Description
Make Auto-populatedInstances Persistent
Accept the default of true if you have auto-population rulesdefined for this template and you want the automaticallycreated service instances to be persisted in the database. Ifnot, change the entry to false. Instances not persisted will bediscarded when the TBSM server is shut down and will berecreated when another event drives the auto-populationrules.
Make ESDA InstancesPersistent
Accept the default of false or change the value to true if youhave ESDA rules defined and want the service instancescreated by the ESDA rules to be persisted in the database.Instances not persisted will be discarded when the TBSMserver is shut down and will be recreated when the ESDArules are executed.
Invalidation Period(seconds)
Set a time period (in seconds) to check for updated serviceinstance data. If the system does not detect any change in theservice data for the specified time period, the service isinvalidated.
Instance Lifetime (seconds) Set a time period for the life time of the service data forinvalidated service instances. After a service is invalidated,the system waits the specified time period before deleting theservice instance.
ESDA rules 161

4. Click OK to save the settings and close the window.Related concepts:“Query Builder overview” on page 123This topic describes Query Builder.“ESDA service expressions” on page 148This topic describes ESDA service expressions.“Service persistence” on page 149This topic describes service persistence.“Service persistence settings” on page 118This topic describes service persistence settings.“Basic service template properties” on page 69This topic describes template properties, how to select a display icon, and how toset template properties.
162 IBM Tivoli Business Service Manager: Service Configuration Guide

Configuring services
This section describes how to configure IBM Tivoli Business Service Manager(TBSM) services.
Services overviewThis topic describes services. This topic also describes the relationship betweenservices and templates.
TBSM services represent services in your enterprise that are configured for TBSM.When you configure a service in TBSM, you create a representation of hardware orsoftware in your company or organization. The service can also represent acustomer or a collection of related services. For example, you can create a servicethat groups a collection of services that support your operations in a givengeographical region.
Services and templates
When you create a service, you can assign it to one or more templates. The servicetemplate defines how the service responds to events, external data, and the statusof other services. In other words, the services tagged with the rules from atemplate are the same type of service and therefore can use the same rules toevaluate service status.
Note: If you change rule or template names, you can cause issues with otherfeatures of TBSM. TBSM uses these names to reference the rule values for otherrules, such as auto-population or ESDA rules and for custom displays such asservice trees and view definitions.
If you want to change a rule or template name, change the name before you usethe rule or template elsewhere in TBSM.
For example, when you create numerical and text-based rule, you need to create acustom service tree or view definition to display the output of the rule in theTBSM console. The trees and view definitions use the template and rule names tomap the rule values to a display object. As a result, if you change the name of arule or a template used in a custom display, the custom tree or view definition willno longer display the rule values properly.Related tasks:“Assigning templates to a service” on page 167This topic describes how to assign templates to a service.
Service configurationThis topic describes how to create and edit services.
About this task
When you have configured your service templates, you can add services and tagthem with the rules for a given service template or templates.Related concepts:
© Copyright IBM Corp. 2008, 2013 163

“Services” on page 23This topic describes the elements in Services in the Service Navigation portlet.“Edit tab editors” on page 32This topic describes the Edit tab editors in the Service Editor.“Service instances” on page 63This topic describes services instances and service instance tagging.Related tasks:“Tagging services with an Internet Service Monitoring template” on page 143This task describes how to tag services in Internet Service Monitoring templates.
Creating a serviceYou create services in the Edit Service tab of the Service Editor.
About this task
To create a service, click the New button in Services in the Service Navigationportlet.
The Edit Service tab is displayed in the Service Editor.
Service name restrictions
Important: TBSM checks the Service Name field for invalid characters. The Namefield for services must not contain these special characters:" < > \ * ? | ;
TBSM will not create a service when the Name field contains any of these invalidcharacters. If the object does not save, remove any special characters from thename field.
Service names longer than 127 characters can cause display and performanceissues.
Service names longer than 127 characters will be truncated in the Service Detailsportlet display. This does not affect the functioning of TBSM, but the truncatedservice name will appear in the Service Details portlet.
If you use the Node column in Netcool/OMNIBus to create or match yourservice name: The node column is limited to 64 characters. If the service name isgreater than 64 characters, it will be truncated and TBSM will not receive anyevents for the service.
You can either change the incoming status rule to use different service instancenaming fields, or you can change the identification fields for a service with a longname. The identification field or fields can be different than the service namingfield or fields. For example, if you have a service name that uses the Node columnfor its name, and the name is longer than 64 characters, the service will not receiveevents. To fix this, you can specify another field, such as a field that contains the IPaddress as the Identification field for the service.
Editing an existing serviceYou edit services in the Edit Service tab of the Service Editor.
164 IBM Tivoli Business Service Manager: Service Configuration Guide

About this task
To edit an existing service:
Procedure
Click the service name you want to edit in Services in the Service Navigationportlet.The Service Editor is populated with the selected service.
Results
Table 53 describes the elements of the Edit Service tab.
Table 53. Edit Service tab elements
Element Description References
Toolbar The toolbar options let you save and refreshthe service settings. You can also displayonline help.
“Edit tabs” on page32
Service Properties The Service Properties fields let you set thebasic service information and select an SLAservice level.
You can also create and edit maintenanceschedules for the service.
“Basic serviceproperties” on page166
“Maintenanceschedules overview”on page 179
“Service levelagreementconfiguration” onpage 203
Templates tab The Templates tab allows you to tag theservice with a template or templates. Youonly see the templates you have permissionto view.
“Assigning templatesto a service” on page167
Identification Fieldstab
If the service has incoming status rulesconfigured, the settings in this tab let youview and change the identification fieldvalues for the service. For each service,TBSM searches incoming events for theservice name values specified in theidentification fields.
If the service has no associated incomingstatus rules, this tab is blank.
“Service Identificationfields” on page 168
Dependents tab The settings in this tab let you select childservices for the service you are editing. Thelist of available dependent services can befiltered by template and service name.
“Service dependencyconfiguration” onpage 170
Additional tab This tab allows you to set the sort order ofthe service in the Service Navigationportlet, set GIS properties for map basedviews, and set values for any additionalproperties that have been configured forthis service. If the service has SLA settings,you can also set the penalty amount indollars for each hour of downtime.
“Additional servicesettings” on page 171
Configuring services 165

Table 53. Edit Service tab elements (continued)
Element Description References
Security tab The settings in this tab let you assign userand group permissions for viewing andediting the service. You only see this tab ifyou have the tbsmServiceAdmin user rolefor the service.
“Granting user andgroup permissions totemplates andservices” on page 185
ISM Configurationtab
The settings in this tab are generated by thetemplate's ISM rules that are assigned tothis service. You configure, and provisionthe ISM monitor in this tab.
“ITCAM for InternetService Monitoringrules” on page 131
Basic service propertiesThis topic describes basic service properties, and how to set them.
About this task
The Service Properties section of the Edit Service tab lets you specify the followinginformation for a service:v Service name, description, and display name
Note: The Name field for services must not contain these special characters:" & < > \ / * ? | ( ) : ;
Otherwise, these objects may not be saved properly in the TBSM database. If theobject does not save, remove any special characters from the name field.
Note: Service names and events: If your service name is longer than 64characters, the name will be truncated in Netcool/OMNIBus ObjectServer eventsdue to field length limits in the alerts.status Node field. As a result, the servicename in the status and TBSM-generated events will not match the service namein the TBSM database. These events cannot be correlated with the service theyaffect.
v SLA level for services with SLA settingsv Maintenance schedules for the service
Note: The Name field for rules, data sources, maintenance schedules, viewdefinitions and other objects must not contain these special characters:" & < > \ / * ? | ( ) : ; $ ! %
Names must not contain spaces. Otherwise, these objects may not be savedproperly in the TBSM database. If the object does not save, remove any specialcharacters or spaces from the name field.Related concepts:“Maintenance schedules overview” on page 179This topic describes maintenance schedules.“Service Identification fields” on page 168This topic describes service identification fields.“Service level agreement configuration” on page 203
166 IBM Tivoli Business Service Manager: Service Configuration Guide

Setting basic service propertiesAbout this task
After you have created a service and saved it, refresh the Service Navigationportlet to see it displayed in the service list. The service has an icon displayed nextto it, which appears with the service throughout the system to more easily identifyit.
The display icon selected depends on the template it is attached to. If the service isattached to more than one template, the primary template determines the serviceicon. If you do not attach the service to a template, the service icon from thedefault template is assigned to the service.
To select basic service properties:
Procedure1. Type a unique service name in the required Service Name field. If a service has
incoming status rules, the service name you enter here is used as the defaultvalue for the identification fields. If you have more than one identification field,you may need to change the default.
Important: TBSM checks the Service Name field for invalid characters. TheName field for services must not contain these special characters:" < > \ * ? | ;
TBSM will not create a service when the Name field contains any of theseinvalid characters. If the object does not save, remove any special charactersfrom the name field.
Service names longer than 127 characters can cause display and performanceissues.
Service names longer than 127 characters will be truncated in the ServiceDetails portlet display. This does not affect the functioning of TBSM, but thetruncated service name will appear in the Service Details portlet.
2. If the service has SLA rules defined, select an SLA service level in thisdrop-down list.
3. If you want the service display name to be different from the service name,enter the name in the Display Name field. If you leave this field blank, theservice display name will match the value of the Service Name field.
4. If the service has scheduled maintenance times, select or set the times with thedrop-down list or buttons for the Maintenance Schedule field.
5. Click Save in the toolbar.6. In the Service Navigation portlet, the new service with a default icon should
appear in the list automatically. If it does not, select the Refresh button on theportlet title bar.
Assigning templates to a serviceThis topic describes how to assign templates to a service.
Configuring services 167

About this task
When you assign a template to a service, you tag the service with the template.Using templates eliminates the necessity of creating the same rules for a servicetype more than once. If you do not tag a service with a template, TBSM assigns thedefault template.
To tag a service with service templates:
Procedure1. From the Edit Service tab, click the Templates tab.
The Templates tab opens. The Templates tab shows all the templates you havepermission to assign in the Available Templates list. The Selected Templateslist shows all the templates assigned to the service.
2. To assign a template to a service, highlight the template or templates you wantto add from the Available Templates list.Press Ctrl or Shift while clicking to select multiple templates from the list.
3. Click the >> button.The highlighted templates move to the Selected Templates list.
4. To remove templates from the Selected Templates list, highlight the templateor templates you want to remove from the Selected Templates list.
5. Click the <<Remove button.The highlighted templates move to the Available Templates list.
6. If the service has multiple templates assigned, select a main template from thePrimary Template drop-down list. This setting sets the display icon for theServices tree and service-dependency view in the Service Editor.If the assigned service templates have SLA settings configured, the PrimaryTemplate tells the system which SLA settings apply to the service.
7. When you have finished assigning templates, click Save in the toolbar.Related concepts:“Services overview” on page 163This topic describes services. This topic also describes the relationship betweenservices and templates.“Service templates” on page 63
Service Identification fieldsThis topic describes service identification fields.
If the service has incoming status rules, the settings in this tab let you view andchange the identification field values for the service. For example, you may wantto have TBSM check events for a different value than the Service Name field orcheck for multiple Identification Field values for a single incoming status rule.
When TBSM receives new data from an event or other data source, it checks forincoming status rules which match the event or data. For each incoming status rulein a template, TBSM checks the rule instance name field values for a match againstthe Identification fields of all the services assigned to the template. If you do notconfigure the Identification fields, the rule instance name value will be matchedagainst the service instance name.Related tasks:
168 IBM Tivoli Business Service Manager: Service Configuration Guide

“Create and edit good, marginal, and bad incoming status rules” on page 84This topic describes how to create and edit good, marginal, and bad incomingstatus rules. This topic also describes properties and conditions for incoming statusrules.“Editing Identification fields”This task describes how to edit identification fields.“Basic service properties” on page 166This topic describes basic service properties, and how to set them.Related reference:“Incoming status rules properties and conditions” on page 80This reference topic describes these incoming status rule properties and conditions:rule name, data feed name, event discriminators, name expression, filter, and ruleoutput expression.
Editing Identification fieldsThis task describes how to edit identification fields.
About this task
To edit the identification fields for a service:
Procedure1. From the Edit Service tab click the Identification Fields tab.
By default, this tab shows the value entered in the Service Name field. If theservice template has multiple incoming status rules configured, this tab willshow the identification field values for each rule.
2. Configure the identification fields using Table 54 as your guide.
Table 54. Identification Fields tab elements
Tab Element Description
Select All button Click Select All to select all the identification fields fordeletion.
Deselect All button Click Deselect All to deselect all the identificationfields selected for deletion.
Delete button Click Delete to delete the selected identification fields.
Rule Name column and Addbutton
This column lists all the incoming status rulesconfigured for the service's template. If you want toadd another field value for the rule, click Add for therule and a new row appears for the rule.
Select column Select the check boxes in this column to markidentification fields for deletion.
Field Values column This column shows the field name and value for eachincoming status rule. By default, this tab shows thevalue entered in the Service Name field for the service.
Configuring services 169

3. When you have finished configuring the identification fields, click Save in thetoolbar.
Related concepts:“Service Identification fields” on page 168This topic describes service identification fields.Related reference:“Incoming status rules properties and conditions” on page 80This reference topic describes these incoming status rule properties and conditions:rule name, data feed name, event discriminators, name expression, filter, and ruleoutput expression.
Service dependency configurationThis topic describes how to configure service dependencies.
The settings in the Dependents tab let you select child services for the service youare editing. The status of the service you are editing depends on the status of thedependent services you select here. The list of available dependent services can befiltered by template and service name.
Configuring service dependencies
To configure service dependencies:1. From the Edit Service tab, click the Dependents tab.
The Dependents tab opens.2. Select the service dependencies using Table 55 as your guide.
Table 55. Dependents tab elements
Tab element Description
Show services for templates This list shows all the templates you have permission to view.If you want to only display the services for a single template,click the template name you want from this list.
Search the AvailableServices
Enter a string in the search field to search for services thatcontain the string you entered. The system displays thesearch results in Available Services list.
Select the service you want from the list and click the >>button.
Available Services list This list shows all the services you have permission to viewin your system. You can press Ctrl or Shift while clicking toselect multiple services in this list. The services you selectfrom this list are added to Selected Services list when youclick the >> button.
Search Click this button to search the Available Services field.
Maximum results This field limits the amount of data displayed in the AvailableServices List. If there are more services to be displayed thanthe maximum limit, then the data is sorted and the limit isapplied. You can use the filter to narrow your search forservices. The default setting is 100.
>> Add button
<< Remove button
Highlight a service or services and click the >> button tomove services from the Available Services list to the SelectedServices list. Click the << button to remove the highlightedservices back to the Available Services list.
170 IBM Tivoli Business Service Manager: Service Configuration Guide
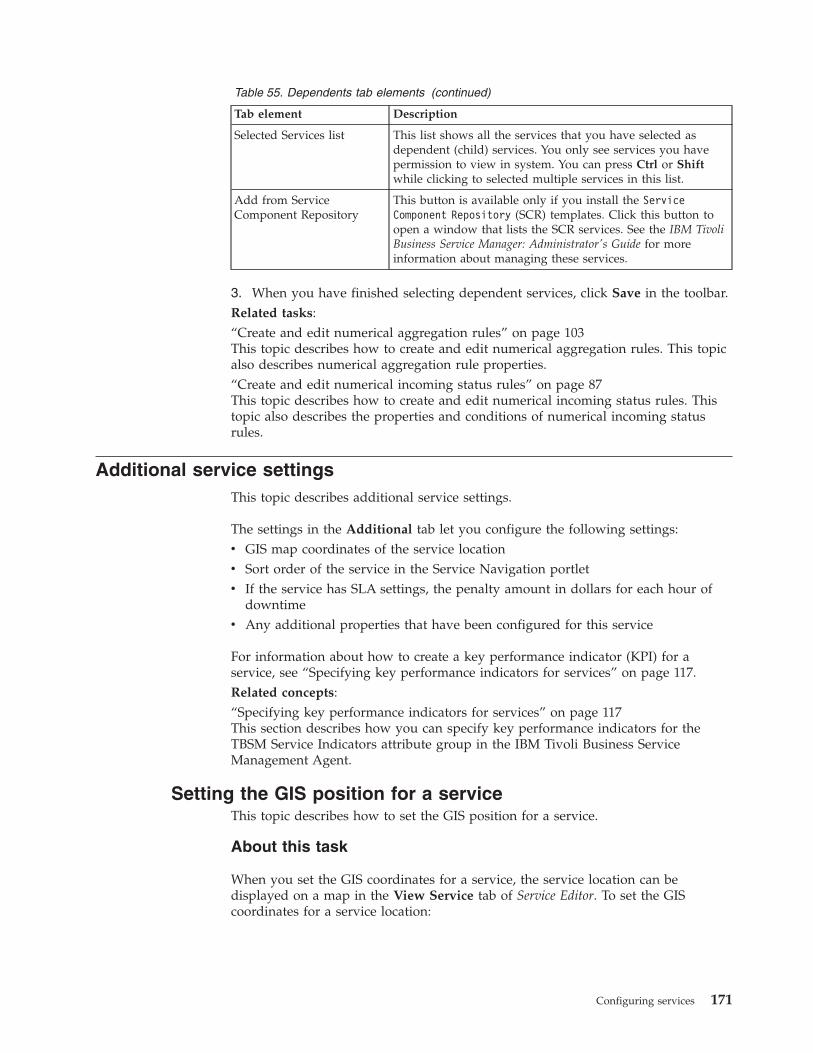
Table 55. Dependents tab elements (continued)
Tab element Description
Selected Services list This list shows all the services that you have selected asdependent (child) services. You only see services you havepermission to view in system. You can press Ctrl or Shiftwhile clicking to selected multiple services in this list.
Add from ServiceComponent Repository
This button is available only if you install the ServiceComponent Repository (SCR) templates. Click this button toopen a window that lists the SCR services. See the IBM TivoliBusiness Service Manager: Administrator's Guide for moreinformation about managing these services.
3. When you have finished selecting dependent services, click Save in the toolbar.Related tasks:“Create and edit numerical aggregation rules” on page 103This topic describes how to create and edit numerical aggregation rules. This topicalso describes numerical aggregation rule properties.“Create and edit numerical incoming status rules” on page 87This topic describes how to create and edit numerical incoming status rules. Thistopic also describes the properties and conditions of numerical incoming statusrules.
Additional service settingsThis topic describes additional service settings.
The settings in the Additional tab let you configure the following settings:v GIS map coordinates of the service locationv Sort order of the service in the Service Navigation portletv If the service has SLA settings, the penalty amount in dollars for each hour of
downtimev Any additional properties that have been configured for this service
For information about how to create a key performance indicator (KPI) for aservice, see “Specifying key performance indicators for services” on page 117.Related concepts:“Specifying key performance indicators for services” on page 117This section describes how you can specify key performance indicators for theTBSM Service Indicators attribute group in the IBM Tivoli Business ServiceManagement Agent.
Setting the GIS position for a serviceThis topic describes how to set the GIS position for a service.
About this task
When you set the GIS coordinates for a service, the service location can bedisplayed on a map in the View Service tab of Service Editor. To set the GIScoordinates for a service location:
Configuring services 171

Procedure1. From the Edit Service tab, click the Additional tab.
The Additional tab opens.2. Enter the GIS coordinates using Table 56 as your guide.
Table 56. Additional tab elements: GIS positioning
Tab element Description
Use GIS Positioning checkbox
Select this check box to enable the GIS positioning option.
City Locations drop-downlists and Set button
These drop-down lists contain the country and city locationspreinstalled into TBSM. Select the country and city of yourservice and click the Set button.
The GIS coordinates for the city you selected display in theLongitude and Latitude fields. You can also type thecoordinates by hand.
Longitude field The longitude coordinate for your service location. If yourservice location is not in the City Locations drop-down lists,you can enter this coordinate by hand.
Latitude field The latitude coordinate for your service location. If yourservice location is not in the City Locations drop-down lists,you can enter this coordinate by hand.
3. When you have finished selecting your service coordinates, click Save in thetoolbar.
What to do next
For more information about using a custom GIS map, see the IBM Tivoli BusinessService Manager: Customization Guide.Related tasks:“Setting SLA penalty calculations”This topic describes how to set the SLA penalty calculations for a service.
Setting SLA penalty calculationsThis topic describes how to set the SLA penalty calculations for a service.
About this task
If a service's template has cumulative time-based SLA settings, you can set a costestimate for each hour of downtime caused by an outage. If there is an hourlypenalty set for the service's template, this template value is the default for theHourlySLAPenalty field.
To set the SLA hourly penalty calculations for a service:
Procedure1. From the Edit Service tab, click the Additional tab.2. Enter the dollar amount for the hourly penalty in the HourlySLAPenalty field.3. Click Save in the toolbar.Related tasks:“Setting the GIS position for a service” on page 171This topic describes how to set the GIS position for a service.
172 IBM Tivoli Business Service Manager: Service Configuration Guide
Setting the sort order for a serviceThis topic describes how to set the sort order for a service.
About this task
You can change the sort order of the services in Services in the Service Navigationportlet by setting the service sort order in the Additional tab. If you do not enter avalue in the Order field, the services are listed in alphabetic order in the Servicestree. To set the sort order of a service:
Procedure1. From the Edit Service tab, click the Additional tab.2. In the Additional Parameters section, enter a number or a letter-number
combination in the Order field. The lowest number is displayed at the top ofthe service tree.For example, a service with a 3 in the Order field displays closer to the top ofthe tree than a service with a 4. You can also enter a combination of letters andnumbers. For example, 3a displays closer to the top of the tree than 3b.If two services have the same number in the Order field, they display inrelative alphabetic order. That is, a service starting with A is closer to the top ofthe tree than a service starting with B.
3. When you have finished setting the sort order for a service, click Save in thetoolbar.
4. To see how the sort order affects the services tree, click Refresh in ServiceNavigation portlet.
Note: You can also set the sort order for services in the Service Editor.However, you can only use numeric ordering. Alphabetic ordering is notsupported for the Service Editor.
Note: The resources displayed in the Service Viewer and Service Editor are notsorted. They are positioned, so as to optimize the layout of the view in thespace provided.
Configuring and provisioning Internet Services MonitoringThis topic describes Internet Service Monitoring configuration and provisioning.
You can set up TBSM to work with the Internet Service Monitoring component ofIBM Tivoli Composite Application Manager (ITCAM) for Transactions. From theTBSM console, you can auto-configure Internet Service Monitoring to forwardevents to TBSM. After you have configured a service template to read events forInternet Service Monitoring, you can assign a service to that service template.Related tasks:“Tagging services with an Internet Service Monitoring template” on page 143This task describes how to tag services in Internet Service Monitoring templates.
Adding user and group permissionsOn the Security tab, you can assign access privileges to a given service in TBSM.To control access for a service, you assign roles to users and groups.Related tasks:
Configuring services 173

“Assigning roles per service” on page 185This describes how to assign roles per service.
174 IBM Tivoli Business Service Manager: Service Configuration Guide

Service Details portlet
This topic describes the Service Details portlet and the portlet toolbar buttons.
Note: This feature will not be part of subsequent TBSM releases.
The Service Details portlet shows information about events, rules, and SLAs thataffect a given service-dependency model. The Service Details portlet is displayedbelow the Service Editor by default. It has the following tabs:v Cumulative SLAs
v Events
v Rules
Note: Clicking a Service Details tab does not update the data displayed in thetab. Click the service or chart as described in the following sections for each tab.
Table 57 describes the Service Details portlet toolbar buttons for the SLA, Events,and Rules tabs.
Table 57. Service Details portlet toolbar buttons
Button Click this button to...
Refresh the data in this tab.
Freeze/update this portlet.
Select/deselect all rows.
Access help for the tab.
Cumulative SLAs tabThis topic describes the Cumulative SLAs tab in the Service Details portlet.
The Cumulative SLAs tab shows the SLA status for services that have SLAcumulative-time settings defined. When a service is marginal or critical, you canview the details of the time and duration calculations of the outage.
To display the data in the Cumulative SLAs tab, click a service with SLA settingsin the Service Tree or the Service Navigation portlet. The data will displayed in theService Viewer and Editor.
Note: Only SLA cumulative, time-based violations are shown on the CumulativeSLAs tab.Related concepts:“SLA settings tab” on page 203This topic describes the SLA settings tab in the Service Editor.Related tasks:
© Copyright IBM Corp. 2008, 2013 175

“Editing SLA settings” on page 204This topic describes how to configure SLA setting in the Service Editor.
Events tabThis topic describes the Events tab in the Service Details portlet.
The Events tab shows ObjectServer events that affect the selected service in tableformat. There are three ways to display events in the Events tab.v Right-click a service in the Service Viewer or Service Editor View tab and select
Show > Service Affecting Events (Table) or select Show > Root Cause Events.v Double-click the service image.v Click a service in the Service Tree or Service Navigation portlet. The service
details updates.
If you double-click the event in the Service Details portlet, the Alert Status windowopens. It shows all the field values for the event.Related tasks:“Displaying events”This topic describes how to display service-affecting events, display root causeevents, and display active events list.
Rules tabThis topic describes the Rules tab in the Service Details portlet.
The Rules tab shows the status of the event or dependency rules that caused aservice instance's status to change to marginal or critical.
To display the rule status for a service, right-click a service in the Service Tree,Service Navigation portlet, Service Viewer, or Service Editor and select Show >Show Rule Status from the menu that is displayed.Related tasks:“Displaying events”This topic describes how to display service-affecting events, display root causeevents, and display active events list.
Displaying eventsThis topic describes how to display service-affecting events, display root causeevents, and display active events list.
About this task
You can display information about the events that affect a given service in a tableor in an Active Event List (AEL).Related concepts:“Events tab”This topic describes the Events tab in the Service Details portlet.“Rules tab”This topic describes the Rules tab in the Service Details portlet.
176 IBM Tivoli Business Service Manager: Service Configuration Guide
Displaying service-affecting events tableAbout this task
You can display data on ObjectServer events that affect a given service in theEvents tab of the Service Details portlet in the following ways:
Procedure1. From the Service Tree, the Service Navigation portlet, Service Viewer, or the
Service Editor View Service tab, right-click the service where you want to seeevents.
2. Select Show > Service Affecting Events (Table) from the menu that appears.The Events tab in the Service Details portlet shows a table of events that affectthe service. Only the events related to the service are displayed. The columns inthis table are Netcool/OMNIbus event list fields.
Displaying root cause eventsAbout this task
If a service has an outage, you can display only the root-cause events for theoutage in the Service Details window as follows:
Procedure1. Right-click the service instance in the Service Tree, the Service Navigation
portlet, Service Viewer, or the Service Editor to display the options menu.2. Select Show > Show Root Cause Events from the menu that appears.
An event table is displayed in the Service Details window. However, this tablewill only display the data for the events that caused the outage.
Display active events listAbout this task
You can also display service-affecting events in an Active Event List (AEL). Youmust have the Java plug-in installed on your client machine to display an AEL. Toopen an AEL for a service:
Procedure1. Right-click the service instance in the From the Service Tree, the Service
Navigation portlet, Service Viewer, or the Service Editor to display the optionsmenu.
2. Select Show > Show Service Affecting Events (AEL) from the menu thatappears.A portlet page is opened containing an AEL portlet shown in context of theservice. If an AEL page is already opened, it will be reused.Only the events related to the service are displayed. The AEL contains many ofthe same features as the Netcool/OMNIbus event list.
Note: If you want users to be able to modify ObjectServer events, those usersmust exist in the ObjectServer user store and the appropriate roles must beassigned.
Note: By default, the AEL tools in the Tools menu do not function in TBSM.You need to edit the appropriate tool configuration file to point to the PERL
Service Details portlet 177
home directory on the TBSM host. The default location of PERL may not becorrect for your system. For more information about enabling AEL tools, see theIBM Tivoli Business Service Manager: Administrator's Guide.
Show rule statusThis topic describes how to show rule status in Service Details.
About this task
You can display a summary of the TBSM rule status for a service in the ServiceDetails window. To show the rule status for a service, complete the following steps:
Procedure1. Right-click the service in the Service Tree, the Service Navigation portlet,
Service Viewer, or the Service Editor to display the options menu.2. Select Show > Show Rules Status from the menu that appears.
A list of service-affecting rules is displayed in the Rules tab of the ServiceDetails window. The rule information displayed here is the same as the servicestatus events that TBSM sends to the ObjectServer when the service's statuschanges.You can show the details of each event by double-clicking on an event in thelist.
178 IBM Tivoli Business Service Manager: Service Configuration Guide

Maintenance schedules
This section describes how to create, edit, and remove maintenance schedules.
Maintenance schedules overviewThis topic describes maintenance schedules.
TBSM includes a maintenance feature that allows you to schedule maintenanceperiods for your services.
During maintenance, TBSM displays the following maintenance information:v The service status in the Services tree is in maintenance (blue).v The service instance in the View Service tab turns blue and has a
construction-cone icon to indicate the service is undergoing maintenance.
If an event comes in that clears the service, the service instance and status in theServices tree turns green.
To schedule a maintenance period for a service, you associate a maintenanceschedule with the service. You can assign one or more time windows to a singlemaintenance schedule. There are two types of time windows: a recurring scheduleand an absolute, one-time only time period. A combination of each type can beassigned to a single maintenance schedule.
You can enter maintenance schedules in two ways:v From the Edit Service tab, you can configure maintenance schedules for a
service. You can configure both recurring schedules and one-time only(Absolute) time windows and assign them to a maintenance schedule.
v From both the View Service tab in the Service Editor and the Services tree inthe Service Navigation portlet, you can use the right-click menu options toquickly add or remove maintenance schedules. Using the quick option, you canschedule maintenance times in the following ways:– For the selected service only– For the selected service and all its descendents– For all the children but not for the selected service
Note: There is no way to delete a maintenance schedule from the scheduleselection list in the TBSM console. If you need to delete a maintenance schedule,see the TBSM Administrator's Guide.Related tasks:“Basic service properties” on page 166This topic describes basic service properties, and how to set them.
Configuring maintenance schedulesThis task describes how to configure maintenance schedules in the Edit Servicetab.
© Copyright IBM Corp. 2008, 2013 179

About this task
Maintenance schedules contain one or more maintenance time windows. The timewindows are the periods when the service is in maintenance mode. There are twotypes of time windows:v Recurring time windows are maintenance periods that occur on a weekly basis.
For example, you can schedule a maintenance period for every Monday between1 am and 3 am.
v Absolute time windows are maintenance periods with a set date and time. Theydo not repeat on a regular basis. For example, you can schedule a maintenanceperiod for March 30, 2007 between 2 am and 5 am.
Note: If a schedule has multiple time windows, these time windows cannotoverlap.
Use the options on the Edit Service tab to add and edit maintenance schedules fora given service.
Note: When you create a service instance, you must save it before you add amaintenance schedule for it. If you do not save the service instance first, all othersettings you have made for the instance will disappear.
Table 58 describes the Edit Service tab maintenance elements.
Table 58. Edit Service tab: maintenance elements
Window element Description
Maintenance Schedule list If there are maintenance schedules configured on yoursystem, select the schedule you want from this list andclick the Save button in the toolbar.
Edit button If you want to change the settings for a schedule, selecta schedule from the Maintenance Schedule list andclick the Edit button.
The Maintenance window opens in a new browserwindow.
New button If you want to create a maintenance schedule, click theNew button.
The Maintenance window opens in a new browserwindow.
To edit or create a maintenance schedule for a service, complete the followingsteps:
Procedure1. In the Service Navigation portlet drop-down menu, select Services. Click the
service you want.2. To edit an existing maintenance schedule, select a schedule from the
Maintenance Schedule drop-down list and click the Edit button.To create a schedule, click the New button.The Maintenance window opens in a new browser window.
3. Enter the maintenance schedule data using Table 59 on page 181 as your guide.
180 IBM Tivoli Business Service Manager: Service Configuration Guide
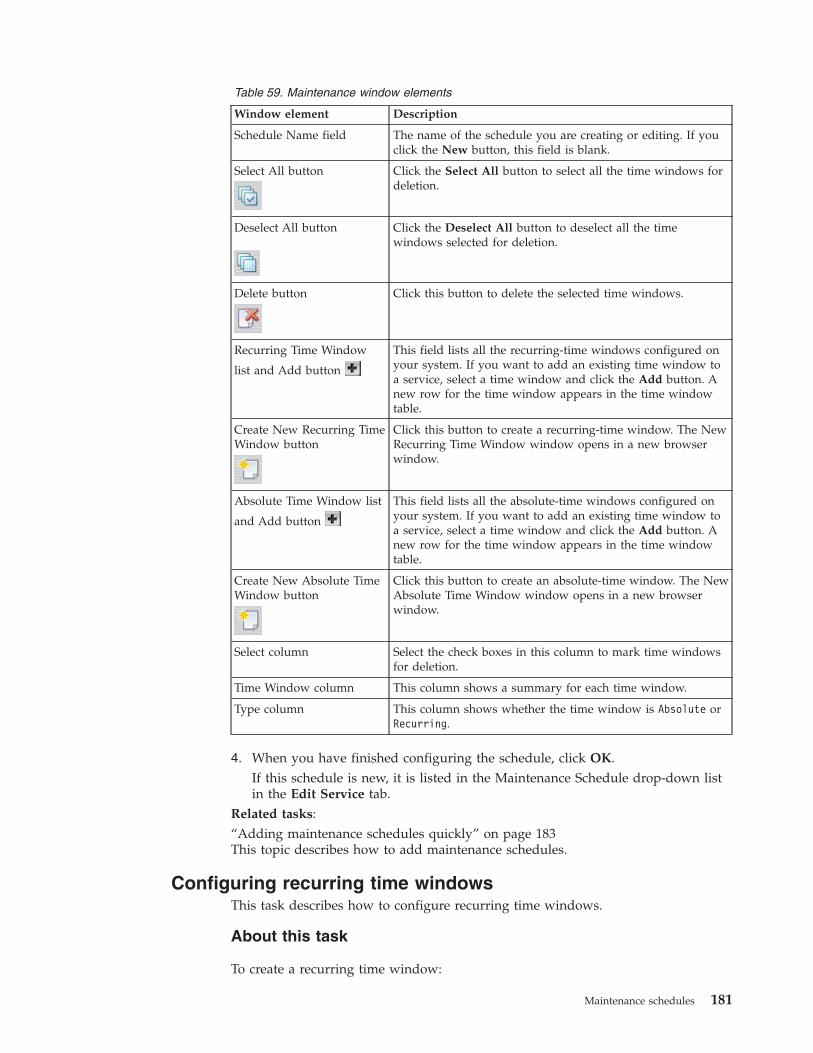
Table 59. Maintenance window elements
Window element Description
Schedule Name field The name of the schedule you are creating or editing. If youclick the New button, this field is blank.
Select All button Click the Select All button to select all the time windows fordeletion.
Deselect All button Click the Deselect All button to deselect all the timewindows selected for deletion.
Delete button Click this button to delete the selected time windows.
Recurring Time Window
list and Add button
This field lists all the recurring-time windows configured onyour system. If you want to add an existing time window toa service, select a time window and click the Add button. Anew row for the time window appears in the time windowtable.
Create New Recurring TimeWindow button
Click this button to create a recurring-time window. The NewRecurring Time Window window opens in a new browserwindow.
Absolute Time Window list
and Add button
This field lists all the absolute-time windows configured onyour system. If you want to add an existing time window toa service, select a time window and click the Add button. Anew row for the time window appears in the time windowtable.
Create New Absolute TimeWindow button
Click this button to create an absolute-time window. The NewAbsolute Time Window window opens in a new browserwindow.
Select column Select the check boxes in this column to mark time windowsfor deletion.
Time Window column This column shows a summary for each time window.
Type column This column shows whether the time window is Absolute orRecurring.
4. When you have finished configuring the schedule, click OK.If this schedule is new, it is listed in the Maintenance Schedule drop-down listin the Edit Service tab.
Related tasks:“Adding maintenance schedules quickly” on page 183This topic describes how to add maintenance schedules.
Configuring recurring time windowsThis task describes how to configure recurring time windows.
About this task
To create a recurring time window:
Maintenance schedules 181

Procedure1. Click the New button for recurring-time windows.
The New Recurring Time Window window opens in a new browser window.2. Select the day of the week for the time window from the Start Day and End
Day drop-down lists. The maintenance period will begin and end on these daysevery week.
3. Select the time of day for the time window from the Start Time and End Timefields. The maintenance period will occur between these times on the scheduledday(s) of the week.
4. Click OK.A new row for the time window appears in the time window table.
Configuring absolute time windowsThis task describes how to configure absolute time windows.
About this task
To create an absolute time window:
Procedure1. Click the New button for absolute-time windows.
The New Absolute Time Window window opens in a new browser window.2. Click the Start Date button to open a calendar. Click the start date.
The date is displayed in the Start Date field.3. Select the time of day for the time window from the Start Time field. The
maintenance period will occur between this time and the end time on thescheduled day.
4. Click the End Date button to open a calendar. Click the end date.The date is displayed in the End Date field.
5. Select the time of day for the time window from the End Time field. Themaintenance period will occur between this time and the start time on thescheduled day.
6. Click OK.A new row for the time window displays in the time window table.Time and date hints
When you enter an invalid time or date, this hint appears: The value enteredis not valid.The time and date fields will be formatted based on the format defined for thelocale chosen for the browser. A new time or date can be selected from themenu shown when the entry field is clicked. If a custom time or date isrequired, select a value from the window close to the wanted value, and editthe entry field manually using the completed format as a guide.
Maintenance right-click tools overviewThis topic describes right-click tools for maintenance.
You can quickly add and remove maintenance schedules for services using theright-click menus. You access these menus from either the Service Navigationportlet or the Service Editor by right-clicking the service that you want for
182 IBM Tivoli Business Service Manager: Service Configuration Guide
maintenance schedules updates. When you add or remove maintenance schedulewith the right-click tool, you can choose the scope of the schedule as:v the selected service onlyv for this service and all dependent servicesv for only the dependant services, but not the selected service
Adding maintenance schedules quicklyThis topic describes how to add maintenance schedules.
About this task
To add or edit a maintenance schedule with a right-click menu option, completethe following steps:
Procedure1. Open the Service Administration page.2. Navigate to the service you want, either in Services in the Service Navigation
portlet drop-menu, or the View Service tab in the Service Viewer.3. Right-click the service you want and select Maintenance window tools from
the list.4. Select Schedule Maintenance to open the Schedule Maintenance window.5. In the window that opens, click OK to accept the defaults, or complete the
following steps:6. Select the scope:
v Select to add the schedule for this service only (the default)v Select to add the schedule to this service and all its childrenv Select to add the schedule to all the children but not to the service
7. Enter the duration.v You can accept the default of Now radio button, for one hour (the default),
or change the duration.v You can select the Schedule radio button. After selecting this option, you can
select an existing schedule, select an existing schedule and edit it, or add anew schedule. Selecting any of these options opens the ScheduleMaintenance windows that are accessible from the Edit Service tab in theService Viewer.
8. Click OK to save the schedule and close the window.Related tasks:“Configuring maintenance schedules” on page 179This task describes how to configure maintenance schedules in the Edit Servicetab.
Removing maintenance schedules quicklyThis topic describes how to remove maintenance schedules.
Before you begin
To remove a maintenance schedule from a service using the right-click option,complete the following steps:
Maintenance schedules 183

Procedure1. Open the Service Administration page.2. Navigate to the service you want, either in Services in the Service Navigation
portlet drop-menu, or the View Service tab in the Service Editor or ServiceViewer.
3. Right-click the service.4. Select Maintenance window tools from the list.5. Select Remove from Maintenance from the list.6. Select the scope:
v Remove the schedule for the selected service only (the default)v Remove the schedule for the selected service and all its dependentsv Remove the schedule for the service's dependents but not for the selected
service7. Click OK to remove the schedule.
184 IBM Tivoli Business Service Manager: Service Configuration Guide
Granting user and group permissions to templates andservices
This section describes how to add user privileges at the service and servicetemplate levels.
Assigning privileges overviewYou assign access privileges by assigning roles to users and groups. You can grantaccess privileges in the following ways:v Globallyv Per servicev Per template
For examples on how to assign user and groups roles in IBM Tivoli BusinessService Manager (TBSM), see the TBSM Administrator's Guide.
Assigning roles globallyThis describes global user roles.
When you assign a role globally to a user or group, that role is effective for all theassociated TBSM objects. For example, if you assign the tbsmEditService role to auser, that user can edit any service instance objects currently defined in TBSM.Similarly, if you assign the tbsmEditTemplate role to a user, that user can edit anytemplate object. You assign a role globally to users and groups using the TivoliIntegrated Portal console, as described in the TBSM Administrator's Guide.
To manage user roles, from the left navigation pane, click Users and Groups →User Roles. For more information, see the console help.
Assigning roles per serviceThis describes how to assign roles per service.
About this task
When you assign a role per service, that role is effective only for the service forwhich it is assigned. For example, if you assign the tbsmEditService role to a userin association with a particular service, that user is only given permission to editthat service. You assign roles per service when you edit services using the TBSMconsole.
To assign roles per service:
Procedure1. In the left navigation pane, expand Administration, and click Service
Administration or Service Configuration. The Service Administration orService Configuration page opens on the right.
2. In the Service Navigation portlet, select Services from the drop-down menu,click the service that you want to assign roles to.
© Copyright IBM Corp. 2008, 2013 185

3. Open the Edit Service tab if it is not already open.4. Click the Security tab. The Security tab opens.5. Select an item from the Users/Groups list and then use the Privileges lists to
add or remove roles from the specified user or group.Table 60 describes the privilege levels:
Table 60. Available user privileges
Privilege Description
tbsmServiceAdmin Users can add and delete services as well as view and editthem.
tbsmEditService Users can edit existing services as well as view them.
tbsmViewService Users can view service only.
Related concepts:“Services” on page 23This topic describes the elements in Services in the Service Navigation portlet.“Service Editor” on page 31This topic describes the Service Editor portlet.“Custom Canvases” on page 25This topic describes the elements in Custom Canvases in the Service Navigationportlet.“Services in the Service Tree” on page 225This topic describes Services in the Service Tree. This topic also describes how todisplay the dependency view.“Adding user and group permissions” on page 173
Assigning roles to templatesThis describes how to assign roles to templates.
About this task
When you assign a role per template, that role is effective only for the template forwhich it is assigned. For example, if you assign the tbsmEditTemplate role to a userin association with a particular template, that user is only given permission to editthat template. You assign roles per template when you edit templates using theTBSM console.
To assign roles per template:
Procedure1. In the left navigation pane, expand Administration, and click Service
Administration or Service Configuration. The Service Administration orService Configuration page opens on the right.
2. Select Templates from the drop-down list in the Service Navigation portlet, andclick the template that you want to add roles to.
3. From the Service Editor, Edit Templates tab, click the Security tab. TheSecurity tab opens.
4. Select an item from the Users/Groups list and then use the Privileges lists toadd or remove roles from the specified user or group.
186 IBM Tivoli Business Service Manager: Service Configuration Guide

Results
Table 61 describes the privilege levels.
Table 61. Available user privileges
Privilege Description
tbsmTemplateAdmin Users can add, edit, delete, and view the template.
tbsmServiceAdmin Users can add, edit, delete, and view specific services thatare tagged with the template.
tbsmEditTemplate Users can edit the template as well as view it.
tbsmViewTemplate Users can view the template only.
tbsmEditService Users can edit specific services that are tagged with thetemplate.
tbsmViewService Users can view the service only.
Accessing TBSM-specific rolesThis topic describes how to access TBSM-specific roles.
About this task
The Tivoli Integrated Portal Security page provides a list of TBSM-specific roles.
Use the following procedure to access the Security page:
Procedure1. From the left navigation pane, expand Settings.2. Select Users and Groups > Roles from the list.
The TBSM-specific roles are prefixed with tbsm. Check all three pages to seethem all.Table 62 describes the TBSM-specific roles:
Table 62. TBSM user roles
Role Description
tbsmAdminUser A user assigned to this role can access and modify all the TBSMfeatures except AEL event modification. See the IBM Tivoli BusinessService Manager: Administration Guide for more information.
tbsmSLAChartViewVisible This role is assigned automatically by TBSM to the necessary users andgroups. This role does not display in the list roles for users andgroups. Do not assign this role manually.
tbsmViewRawEvents View ObjectServer event lists.
tbsmAVSaveCanvasLayoutForGroup Create, edit, and delete custom canvases for a group.
tbsmAVSaveCanvasLayoutForUser Create, edit, and delete custom canvases for a user.
tbsmTemplateAdmin Add or edit any template
tbsmServiceAdmin Add or edit service instances
tbsmCreateTemplate Add service templates
tbsmEditTemplate Edit service templates
tbsmViewTemplate View service instances
tbsmCreateService Create service instances
Granting user and group permissions to templates and services 187

Table 62. TBSM user roles (continued)
Role Description
tbsmEditService Edit service instances
tbsmViewService View service instances
tbsmDataSourceAdmin Add, edit, or delete data source configurations.
tbsmCreateDataSource Add data source configurations.
tbsmEditDataSource Edit data source configurations.
tbsmViewDataSource View data source configurations.
tbsmDataFetcherAdmin Add edit, or delete data fetcher configurations.
tbsmCreateDataFetcher Add data fetcher configurations.
tbsmEditDataFetcher Edit data fetcher configurations.
tbsmViewDataFetcher View data fetcher configurations.
tbsmChartAdmin Create, edit, view, and delete TBSM charts.
tbsmCreateChart Create, view, and edit TBSM charts.
tbsmEditChart Create view, and edit TBSM charts.
tbsmViewChart View TBSM charts.
tbsmLaunchISMServiceReportViewer Launch ITCAM for Internet Service Monitoring reports.
tbsmReadOnlyUser This role is required to make readonly users operational on TBSM andmust be assigned to all readonly users. This role is assigned by defaultto the tbsmReadOnly group; users assigned to that groupautomatically have this role.
tbsmViewDefinitionAdmin Create, edit, view, and delete TBSM view definitions.
188 IBM Tivoli Business Service Manager: Service Configuration Guide

Editing policies
This section explains how to work with the IBM Tivoli Business Service Manager(TBSM) Policy editor.
About the Policy editorThis topic describes the Policy editor.
Policies consist of a series of function calls that manipulate events and data fromyour supported data sources. A policy is a script that contains a set of instructionsto automate alert management tasks, for example, defining the conditions forsending an e-mail to an administrator, or sending instructions to the ObjectServerto clear an event. For example, TBSM policies define conditions that determinewhether the status of a service is good, marginal, or bad.
Pre-defined policies overviewThis topic describes pre-defined policies.
TBSM lets you customize the functions for the policies used for numericaggregation rules and rules used to create services automatically. You can modifythese policies to better meet the needs of your service environment. You should befamiliar with Netcool/Impact policies before you attempt to customize thesepolicies. For more information about Netcool/Impact policies, see theNetcool/Impact User, Policy Reference, and Solutions guides.
You can edit the following policies from within the TBSM console:v Numeric-Aggregation Policyv Numerical Formula Rule Policyv Auto-Population Rule Policiesv ESDA Model Rule Policy
For more information about these policies, see the IBM Tivoli Business ServiceManager: Customization Guide.
Opening the Policy editorThis topic describes how to open the policy editor.
You can access the Policy editor by clicking the Edit Policy button in the followingwindows:v Numerical Aggregation Rule
v Numerical Formula Rule
v ESDA Model Rule
v Custom Auto-population Rule Configuration
– Click Custom Configuration in the New Auto-population Rule window.– Click one of the Use Policy check boxes in the Custom Auto-population Rule
Configuration window to make the Edit Policy button available.
© Copyright IBM Corp. 2008, 2013 189

For more information about accessing and customizing the Policy editor, see theIBM Tivoli Business Service Manager: Customization Guide.
Policy editor toolbar controlsAn overview of the policy editor toolbar controls.
Table 63. Policy Editor toolbar options
Icon Description
The Save icon saves the current policy.
Use the Save with comments option to save your policy withcomments. To save a policy with a different file name click Saveas....Remember: If you use UTF-8 characters in the policy name,check that the locale on the Impact Server where the policy issaved is set to the UTF-8 character encoding.
Restore your work to its state before your last action, forexample, add text, move or, delete. Undo works for one-levelonly.
Restore your work to its state before you selected the Undoaction. Redo works for one-level only.
Cut highlighted text. In some instances, due to browserlimitations, the Cut icon cannot be activated. Use the keyboardshort cut Ctrl + x instead.
Copy highlighted text. In some instances due to browserlimitations, the Copy icon cannot be activated. Use the keyboardshort cut Ctrl + c instead.
Use this icon to paste cut, or copied text to a new location. Insome instances due to browser limitations, the Paste icon cannotbe activated. Use the keyboard short cut Ctrl + v instead.
To copy and paste rich text formatted content, for example froma web page or document file:
1. Paste the content into a plain text editor first to remove therich text formatting.
2. Copy the content from the plain text editor into the policyeditor.
Use this icon to find and replace text in a policy. Search for atext string. Type the text that you want to find, choose if youwant to run a case-sensitive search, and choose the direction ofthe search.
Search for text and replace it with a text you specify. Type thetext that you want to search for. Type the replacement text.Choose if you want to run a case-sensitive search, and choosethe direction of the search.
Click the Go To icon to show a Go To Line field in the policyeditor. Type the number of the line you want the cursor to go to.Click Go.
Insert a selected function, an action function, or a parserfunction, in your policy. Add additional parameters for thefunction if required.
The toolbar selection lists provide you with a set of functions touse in your policy.
190 IBM Tivoli Business Service Manager: Service Configuration Guide

Table 63. Policy Editor toolbar options (continued)
Icon Description
Access a list of data types. The Data Type Browser iconsimplifies policy development by showing available data typesand details including field name and type information. You donot have to open the data type viewer to get the data typeinformation.
The Check Syntax icon checks the policy for syntax errors. Ifthere are errors, the error message locates the error by the linenumber. If there are no errors, a message to that effect is shown.
Optimize the policy. .
Click the Run Policy icon to start the policy. After removing allsyntax errors, you can run the policy to ensure that it producesthe result you wanted. To run your policy with additionalparameters, use the Run with Parameters option. You can usethis option after you configure user parameters for your policy.
Use this icon to set the user parameters for the policy.
Click the View Version History icon to view the history ofchanges made to policies, and compare different versions ofpolicies.Important:
The View Version History icon is disabled for new and draftedpolicies and it becomes active after the policy is committed toserver.
This option is supported only with the embedded SVN versioncontrol system.
Click this icon to view the policy logs in the log viewer.
The Graphic View is not available for JavaScript policies.
Click this icon to manually enable or disable the syntaxhighlighter.
Using the Undo, Redo, Cut, Copy, and Paste optionsThis topic describes the Undo, Redo, Cut, Copy, and Paste options.
About this task
This section explains how to use the Undo, Redo, Cut, Copy, and Paste options.
Undo
To restore your work to the state it was in before your last action, for example,adding text, deleting text, replacing text, and so on, click the Undo button.
This function is a one-level Undo only.
Editing policies 191

Redo
To restore your work to the state it was in before an Undo, for example, addingtext, deleting text, replacing text, and so on, click the Redo button.
This function is a one-level Redo only.
Cut
To cut text that you want to either delete or move to a new location, highlight thetext and click the Cut button.
Copy
To copy text so that you can place it in an additional location without retyping it,highlight the text and click the Copy button.
Paste
To paste cut or copied text to a new location, place your cursor where you want itto start and click the Paste button.
Using the Find and Replace optionThis topic describes how to use the Find and Replace option.
About this task
Select the Find and Replace button to open the Find and Replace window.
Table 64 explains the window elements.
Table 64. Policy Script Editor Find and Replace window
WindowElement Element Type Description
Find What Required textfield
Enter the text that you want to find or replace.
Replace With Required textfield
Enter the new text.
Match case Check box Select to consider case.
Direction:Backwards
Check box By default, the direction of the search is forward -beginning to end. You can check Backwards to change thedirection of the search - end to beginning.
Replace Button Click to replace the text at the first occurrence.
Replace All Button Click to replace all occurrences of the text string.
Find Button Click to highlight the requested text.
Close Button Click to close the window.
Using the Goto Line optionThis topic describes how to use the Goto Line option.
192 IBM Tivoli Business Service Manager: Service Configuration Guide

About this task
This option moves your cursor immediately to a specified line in a policy.
Procedure1. Select the Goto Line button to access the Goto Line window:2. Click the Line Number Spin arrows to find the appropriate line number, or
type in the number that you want.3. Click Go.
To close the window without searching for a line number, click the Closebutton.
Checking the policy syntaxThis topic describes how to check the policy syntax.
About this task
While you are creating your policy, you can check to ensure that the syntax iscorrect.
When you select the Check Syntax button, the system displays a list of errors atthe bottom of the Policy editor. If there are no errors in the policy, the followingmessage is displayed:Syntax check successful. No error found.
If the checker finds errors, you will see a table at the bottom of the editor thatshows the error type, the line where it occurred, and a message.
The Type column contains an error indicator, either Warning or Error.
The Line column contains the line number where the error occurred. To find theerror, click the line number. The editor scrolls to that line in the script.
Optimize your policyThis section describes how to optimize a policy.
About this task
After you have written, named, and saved your policy, you can check to seewhether there is a way to improve it by selecting the Optimize It button
To optimize your policy, click the Optimize It button.
Results
A message box opens either with suggestions or a message that no improvementsare necessary.
Adding functions to policyUse this procedure to add a function to a policy.
Editing policies 193

Procedure1. Click the Insert function icon and select one of the functions.2. Enter the required parameters in the new function configuration window.
Note: When entering a string, check that all string literals are enclosed inquotation marks ("string "), to distinguish them from variable names, which donot take quotation marks.
List and overview of functionsA list of all functions with a short overview.
Table 65. List of functions
Name Type Description
Activate Policy The Activate function runs anotherpolicy.
ActivateHibernation Policy The ActivateHibernation functioncontinues running a policy that waspreviously put to sleep using theHibernate function. You must also runthe RemoveHibernation function toremove the policy from the hibernationqueue and to free up memory resources.
AddDataItem Database,Internal
The AddDataItem function adds a dataitem to a data type.
BatchDelete Database The BatchDelete function deletes a set ofdata items from a data type.
BatchUpdate Database The BatchUpdate function updates fieldvalues in a set of data items in a datatype.
BeginTransaction Database The BeginTransaction is a localtransactions function that is used in SQLoperations.
CallDBFunction Database CallDBFunction calls an SQL databasefunction.
CallStoredProcedure Database The CallStoredProcedure function calls adatabase stored procedure.
ClassOf Context The ClassOf function returns the datatype of a variable.
CommandResponse Systems Use the CommandResponse function to runinteractive and non-interactive programson both local and remote systems.
CommitChanges Database Used only in connection withGetByFilter, and GetByKey functions toforce updates in a database.
CommitTransaction Database The CommitTransaction function is alocal transactions function that is used inSQL operations.
CurrentContext Context The CurrentContext function returns thecurrent policy context.
Decrypt String The Decrypt function decrypts a stringthat has been previously encrypted usingEncrypt or the nci_crypt tool.
194 IBM Tivoli Business Service Manager: Service Configuration Guide

Table 65. List of functions (continued)
Name Type Description
DeleteDataItem Database,Internal
The DeleteDataItem function deletes asingle data item from a data type.
Deploy Miscellaneous The Deploy function copies data sources,data types, policies, and services betweenserver clusters.
DirectSQL Database The DirectSQL function runs an SQLoperation against the specified databaseand returns any resulting rows to thepolicy as data items.
DataItems Keys Provided for backward-compatibilityonly.
Distinct Array The Distinct function returns an array ofdistinct elements from another array.
Encrypt String The Encrypt function encrypts a string.
Escape String This function escapes special charactersin an input string in a policy.
Eval Context The Eval function evaluates anexpression using the given context.
EvalArray Array, Context The EvalArray function evaluates anexpression using the given array.
Exit Policy You use the Exit function to stop afunction anywhere in a policy or to exit apolicy.
Extract String The Extract function extracts a wordfrom a string.
FindFilters Database Provided for backward-compatibilityonly.
Float Numeric The Float function converts an integer,string, or Boolean expression to a floatingpoint number.
FormatDuration Time The FormatDuration function converts aduration in seconds into a formatteddate/time string.
GetByFilter Database,Internal,ITNM, LDAP,XML
The GetByFilter function retrieves dataitems from a data type using a filter asthe query condition.
GetByKey Database,Internal,LDAP
The GetByKey function retrieves dataitems from a data type using a keyexpression as the query condition.
GetByLinks Database,Internal, XML
The GetByLinks function retrieves dataitems in target data types that are linkedto one or more source data items.
GetByXPath XML The GetByXPath function provides a wayto parse an XML string or get an XMLstring through a URL specified asparameter.
Editing policies 195

Table 65. List of functions (continued)
Name Type Description
GetClusterName Variables You use the GetClusterName functioninside a policy to identify which clusteris running the policy.
GetDate Time The GetDate function returns thedate/time as the number of secondsexpired since the start of the UNIXepoch.
GetFieldValue Java Use this function to get the value ofstatic, or non-static fields. For non-staticfields, use the variable FieldName for aJava class or TargetObject for a Javaobject. For a static Java class field, usethe variable ClassName.
GetGlobalVar Variables This function retrieves the global valuesaved by previous SetGlobalVar calls.
GetHTTP REST You can use the GetHTTP function toretrieve any HTTP URL or to postcontent to a web page.
GetHibernatingPolicies Policy The GetHibernatingPolicies functionretrieves data items from the Hibernationdata type by performing a search ofaction key values.
GetScheduleMember Time The GetScheduleMember functionretrieves schedule members associatedwith a particular time range group andtime.
GetServerName Variables You use the GetServerName functioninside a policy to identify which server isrunning the policy.
GetServerVar Variables You use this function to retrieve theglobal value saved by previousSetServerVar.
Hibernate Policy The Hibernate function causes a policy tohibernate.
Illegal String If the input in the policy has maliciouscontent, the Illegal function throws anexception in a policy.
Int Numeric The Int function converts a float, string,or Boolean expression to an integer.
JRExecAction Systems The JRExecAction function executes anexternal command using the JRExecserver.
JavaCall Java You use this function to call the methodMethodName in the Java objectTargetObject with parameters, or, to callthe static method MethodName in the Javaclass ClassName with parameters.
Keys Context The Keys function returns an array ofstrings that contain the field names of thegiven data item.
196 IBM Tivoli Business Service Manager: Service Configuration Guide

Table 65. List of functions (continued)
Name Type Description
Length Array, String The Length function returns the numberof elements or fields in an array or thenumber of characters in a string
Load JavaScript You use this function to load a JavaScriptlibrary into your JavaScript policy.
LocalTime Time The LocalTime function returns thenumber of seconds since the beginning ofthe UNIX epoch as a formatteddate/time string.
Log Policy The Log function prints a message to thepolicy log.
Merge Context The Merge function merges two contextsor event containers by adding themember variables of the source contextor event container to the those of thetarget.
NewEvent Context,Database
The NewEvent function creates a newevent container.
NewJavaObject Java The NewJavaObject function is used tocall the constructor for a Java class.
NewObject Context The NewObject function creates a newcontext.
ParseDate Time The ParseDate function converts aformatted date/time string to the time inseconds since the beginning of the UNIXepoch. 1st January 1970 00:00:00 (UTC).
PassToTBSM TBSM Use the PasstoTBSM function to sendevent information from Netcool/Impactto TBSM.
Random Numeric The Random function returns a randominteger between zero and the givenupper bound.
RDFModel String You can use the RDFModel function tocreate an RDF model without anyruntime parameters.
RDFModelToString String You can use the RDFModelToStringfunction to export an RDF model to astring in a particular language.
RDFModelUpdateNS String You can use the RDFModelUpdateNSfunction to insert, update, or remove anamespace from an RDF model.
RDFNodeIsResource RDFNode You can use the RDFNodeIsResourcefunction to help other functions read andparse objects that are also an RDFresource.
RDFNodeIsAnon RDFNode You can use the RDFNodeIsAnonfunction to assist in reading and parsingan RDF.
Editing policies 197

Table 65. List of functions (continued)
Name Type Description
RDParse String You can use the RDFParse function tohelp other functions read and parse anRDF object
RDFRegister String You can use the RDFRegister function tohelp you to register service providers orOSLC resources with the registry server.
RDFUnRegisgter String To remove the registration record of aservice provider or resource from theregistry server, use the RDFUnRegisterfunction to supply the location of theregistration record, the Registry Servicesserver username and password, and theregistration record that you want toremove.
RDFSelect String You can use the RDFSelect function toassist in reading and parsing an RDF. Toretrieve statements based on an RDFmodel, you call the RDFSelect functionand pass the RDF model that is createdby the RDFParse function. You can filterbased on subject, predicate, and object.
RDFStatement String,Boolean
You can use the RDFStatement functionto create and add statements to an RDFmodel.
RemoteTBSMShell TBSM A stand-alone implementation ofNetcool/Impact can run RADShellcommands from a policy in TivoliBusiness Service Manager.
RExtract String The RExtract function uses regularexpressions to extract a substring from astring.
RExtractAll String The RExtractAll function uses regularexpression matching to extract multiplesubstrings from a string.
ReceiveJMSMessage JMS The ReceiveJMSMessage functionretrieves a message from the specifiedJava Message Service (JMS) destination.
RemoveHibernation Policy The RemoveHibernation function deletes adata item from the Hibernation data typeand removes it from the hibernationqueue.
Replace String The Replace function uses regularexpressions to replace a substring of agiven string.
ReturnEvent Policy The ReturnEvent function inserts,updates, or deletes an event from anevent source.
RollbackTransaction Database The RollbackTransaction function rollsback any changes done by an SQLoperation.
SendEmail Notifications The SendEmail function sends an emailthat uses the email sender service.
198 IBM Tivoli Business Service Manager: Service Configuration Guide

Table 65. List of functions (continued)
Name Type Description
SendInstantMessage Notifications The SendInstantMessage function sendsan instant message using the Jabberservice.
SendJMSMessage JMS The SendJMSMessage function sends amessage to the specified destination byusing the Java Message Service (JMS)DSA.
SetFieldValue Java Use the SetFieldValue function to set thefield variable in the Java class to somevalue.
SetGlobalVar Variables The SetGlobalVar function creates in apolicy a global variable which can beaccessed from any local functions, libraryfunctions, and exception handlers in apolicy.
SetServerVar Variables The SetServerVar function creates aserver-wide global variable in a policy.
SnmpGetNextAction SNMP, Sytems The SnmpGetNextAction function retrievesthe next SNMP variables in the variabletree from the specified agent.
SnmpGetAction SNMP,Systems
The SnmpGetAction function retrieves aset of SNMP variables from the specifiedagent
SnmpSetAction SNMP The SnmpSetAction function sets variablevalues on the specified SNMP agent.
SnmpTrapAction SNMP The SnmpTrapAction function sends atrap (for SNMP v1) or a notification (forSNMP v2) to an SNMP manager.
Split String The Split function returns an array ofsubstrings from a string using the givendelimiters.
String String The String function converts an integer,float, or boolean expression to a string.
Strip String The Strip function strips all instances ofthe given substring from a string.
Substring String The Substring function returns asubstring from a given string using indexpositions.
Synchronised Policy Use the Synchronized function to writethread-safe policies for use with amulti-threaded event processor using IPLor JavaScript.
ToLower String The ToLower function converts a stringto lower case characters.
TBSMShell TBSM This topic describes the TBSMShell actionfunction which lets you put RADshellcommands in a policy. With theTBSMShell function, you can change theTBSM configuration in a policy.
Editing policies 199

Table 65. List of functions (continued)
Name Type Description
ToUpper String The ToUpper function converts a stringto upper case characters.
Trim String The Trim function trims leading andtrailing white space from a string.
URLDecode String, REST The URLDecode function returns a URLencoded string to its originalrepresentation.
URLEncode String, REST The URLEncode function converts astring to a URL encoded format.
UpdateEventQueue Database The UpdateEventQueue function updatesor deletes events in the event readerevent queue.
WSDMGetResourceProperty[Important: This feature isdeprecated.]
Web Services The WSDMGetResourceProperty functionretrieves the value of a managementproperty that is associated with a WebServices Distributed Management(WSDM) managed resource.
WSDMInvoke [Important: Thisfeature is deprecated.]
Web Services The WSDMInvoke function sends a webservices message to a Web ServicesDistributed Management (WSDM)managed resource.
WSDMUpdateResourceProperty[Important: This feature isdeprecated.]
Web Services The WSDMUpdatetResourcePropertyfunction updates the value or values of amanagement property that is associatedwith a Web Services DistributedManagement (WSDM) managed resource.
WSInvoke Web Services Provided for backward-compatibilityonly.
WSInvokeDL Web Services The WSInvokeDL function makes webservices calls when a Web ServicesDescription Language (WSDL) file iscompiled with nci_compilewsdl, or whena web services DSA policy wizard isconfigured.
WSNewArray Web Services The WSNewArray function creates anarray of complex data type objects orprimitive values, as defined in the WSDLfile for the web service.
WSNewEnum Web Services The WSNewEnum function returns anenumeration value to a target webservice.
WSNewObject Web Services The WSNewObject function creates anobject of a complex data type as definedin the WSDL file for the web service.
WSNewSubObject Web Services The WSNewSubObject function creates achild object that is part of its parentobject and has a field or attribute nameof ChildName.
WSSetDefaultPKGName Web Services The WSSetDefaultPKGName functionsets the default package that is used byWSNewObject and WSNewArray.
200 IBM Tivoli Business Service Manager: Service Configuration Guide

For more details about each of these functions, see the Policy Reference Guide.
Triggering the policyThis describes how to trigger a policy.
About this task
To trigger a policy, complete the following steps:
Procedure1. Click the Policy Trigger button to the open the Policy Trigger window. The
fields you see in the window depend on whether you have specified anyruntime parameters for the policy and what the runtime parameters were setto.
2. If you do not want to use the default values, then enter appropriate parametervalues for the fields that are displayed.
3. Click Execute to trigger the policy.
Setting policy runtime parameters in the editorUse this procedure to set the runtime parameters for your policy in the policyeditor.
Procedure1. In the policy editor toolbar, click the Configure Runtime Parameters icon to
open the policy runtime parameter editor.2. Click New Runtime Parameter to open the Create a New Policy Runtime
Parameter window.Enter the information in the new runtime parameter configuration window.Required fields are marked with an asterisk (*).
3. To edit an existing runtime parameter, select the check box next to theparameter and select edit in in the corresponding cell of the Edit column.
4. Click OK to save the changes to the parameters and close the window.
Displaying the graphical viewThis topic describes how to display the graphical view of the policy.
About this task
Click the Graphical View button to open a graphical view of the policy in awindow.
Procedure1. Remove the check mark in the Show: Assignments check box to remove
assignments from the view.2. Enter a check mark in the Logging check box to show logging details.
Note: If you use JavaScript to write a policy, the graphical view option is notavailable.
Editing policies 201

Editing a policyThis topic describes how to edit a policy.
About this task
Use the following procedure to edit a policy:
Procedure1. To open a policy for editing, click the Edit Policy button, which is accessible
from any of the following TBSM windows:v Numerical Aggregation Rule
v Numerical Formula Rule
v ESDA Model Rule
v Custom Auto-population Rule Configuration
– Click Custom Configuration in the New Auto-population Rule windowand then
– Click one of the Use Policy check boxes in the Custom Auto-populationRule Configuration window to make the Edit Policy button available.
You can edit the policy as required in the same way you created it: enteringnew text, new action and parser functions, checking the syntax and optimizingthe policy.
Note: In general, do not use special characters in policy names.2. When you are finished, click Save.
Saving a policyYou can save a policy that is open in the Policy editor by clicking the Save buttonin the Policy editor toolbar. You can also add comments when you save a policy byselecting the Save with comments option.
202 IBM Tivoli Business Service Manager: Service Configuration Guide

Service level agreement configuration
This section explains how to configure and view the SLA data with the optionalSLA features of IBM Tivoli Business Service Manager (TBSM).Related tasks:“Basic service properties” on page 166This topic describes basic service properties, and how to set them.Related reference:“TBSM prototype” on page 285This topic describes the default visual type TBSM prototype.
SLAs overviewThis topic describes service level agreements (SLA).
When you have created your service template hierarchy and added services, thebasic service configuration is complete. Optionally, you can add service levelagreement rules to your templates. This section describes how to apply servicelevel agreement (SLA) rules to service templates with TBSM and how to displaySLA data. SLA rules define when a given service violates the parameters of anSLA. Each template has its own set of service level agreements. For example, youcan configure a rule that triggers an SLA violation whenever a service's up time isless than 99% of the time in a given week.
You can set up TBSM to forward SLA events to Tivoli Service Level Advisor foranalysis and long-term storage of the TBSM SLA data. To use this integration, youmust have Tivoli Service Level Advisor version 2.1.1 or later. For more information,see the IBM Tivoli Business Service Manager: Administrator's Guide.
SLA settings tabThis topic describes the SLA settings tab in the Service Editor.
The SLA tab in the Service Editor: Edit Template tab lets you set the SLA rules foreach service template. For each service template, you have three options:v You can accept the default values for the standard SLA settings that have
already been set for you.v You can modify the settings for the standard level of service, including:
– Cumulative, time-based violations and warnings (for the month, day, hour,and minute)
– Duration-based violations and warnings– The number of violation incidents in a given time period
v You can also create multiple levels of service to replicate the various servicelevel agreements you have with your customers. For example, you could creategold, silver, and bronze service levels.
Note: Only the SLA cumulative, time-based violations are shown on the ServiceDetails: SLA tab.Related concepts:
© Copyright IBM Corp. 2008, 2013 203

“Cumulative SLAs tab” on page 175This topic describes the Cumulative SLAs tab in the Service Details portlet.
Editing SLA settingsThis topic describes how to configure SLA setting in the Service Editor.
About this task
To configure the SLA settings, complete the following steps:
Procedure1. From the Service Navigation portlet's drop-down menu, select Templates.2. To create a service template, click the New button. If you are editing an
existing service template, skip to step 3.The Service Editor is displayed with the Edit Template tab in the foreground.Skip to step 4.
3. To edit an existing service template from the Service Navigation portlet:v Click the name of the service template that you want to edit in the
Templates.The Service Editor opens with the View Template tab in the foreground.
v Click the Edit Template tab.4. Click the SLA tab to configure the SLA settings.
The system displays the SLA tab.5. From the SLA tab, you can configure the service level and the SLA rules.Related concepts:“Cumulative SLAs tab” on page 175This topic describes the Cumulative SLAs tab in the Service Details portlet.“Service Administration Overview” on page 215This topic describes how to use the Service Administration page to view services.“SLA data in the dependency view” on page 211This topic describes SLA data in the dependency view and in service instances.Related tasks:“Setting SLA penalty calculations” on page 210This topic describes how to set SLA penalty calculations.
Multiple service level configurationThis topic describes multiple service level configuration. This topic also describeshow to create multiple service levels.
About this task
TBSM allows you to create multiple service level agreements for a single servicetemplate. By default, TBSM supplies a Standard service level. If you only have asingle service level for a service template, use the Standard service level. If youneed to create multiple service levels such as gold and silver service levels, followthe procedures in this section.
To create multiple service levels:
204 IBM Tivoli Business Service Manager: Service Configuration Guide

Procedure1. Click the New Service Level button.
A new row is displayed in the Service Level Name column and in the SLAconfiguration settings.
2. Enter the new service level name in the Service Level Name column.3. Click Save in the toolbar.
The new service level is added to the SLA tab.4. Create the service levels using the table below as your guide.
The table below describes the top section of the SLA tab where you configurethe service levels.
Table 66. SLA tab: service level elements
Tab element Description
Select All button Click Select All to select all the service levels fordeletion.
Deselect All button Click Deselect All to deselect all the service levelsselected for deletion.
Delete button Click Delete to delete the selected service levels.
New Service Level button Click this button to create a entry in the Service LevelName column and in the SLA configuration settings.
Select column Selecting the check boxes in this column marks theselected service level for deletion.
Service Level Name column This column list all the service levels you can configurefor the service template.
Order column When you click an arrow button in this column, itchanges the order of the listed service levelsaccordingly. The order changes in both the ServiceLevel Name column and in the SLA configurationsettings.
Duration-based violation calculationsThis topic describes duration-based violation calculations. This topic also describeshow to set duration-based calculations.
About this task
The Calculate duration-based SLA violations section of the SLA tab lets you setthe amount of time a service can be unavailable before TBSM sends a violation orwarning event. A warning event is an SLA event that is yellow, that is it has aMarginal status. A violation event is an SLA event that is red, that is it has aviolation status. A warning or violation event is generated when the threshold foreither of those event types in the SLA rule is exceeded.Related concepts:
Service level agreement configuration 205

“SLA data in the dependency view” on page 211This topic describes SLA data in the dependency view and in service instances.
Example duration-based calculationAbout this task
If your service violates the SLA when a single outage is greater than 5 minutes,you can set the duration-based calculations as follows:v Report a warning condition after 2 minutes of downtime (marginal status)v Report a violation after 5 minutes of downtime (critical status)
Set duration-based violation calculationsAbout this task
This section is for setting duration based SLA violations. If a service instancetagged with this template were to change to a Bad status for a duration longerthan the time you configure below, an SLA violation will occur. Use the ViolationDuration spin fields to enter the time for hours:minutes:seconds.
To configure duration-based violation calculations:
Procedure1. Select the Calculate duration based SLA violations check box.2. Enter the time values for each service level that will trigger TBSM SLA
Violation Duration and Warning Duration events for the service template (useTable 67 as your guide).
3. Click the Save button in the toolbar.
Table 67. Service Level Agreement Settings window - duration-based calculations
Window element Description
Calculate duration based SLA violationscheck box
Select this check box to enable the durationvalue fields.
Service Level column This column lists all the service levels you canconfigure for the service template.
Violation duration (h:m:s) column andfields
Select or enter the times you want for your SLAviolation settings in these spin fields.
If you have defined multiple service levels, thesystem displays separate hours, minutes, andseconds fields for the SLA violation andwarning times for each service level.
Warning duration (h:m:s) column andfields
Select or enter the times you want for your SLAviolation-warning settings in these spin fields.
Violation incident-count calculationsThis topic describes violation incident-count calculations. This topic also describeshow to set incident-count calculations based on an example.
The Calculate number of duration violations in given time period section letsyou set how many violations can occur in a given time period before TBSM sendsa violation or warning event. This setting helps you to evaluate whether a service
206 IBM Tivoli Business Service Manager: Service Configuration Guide
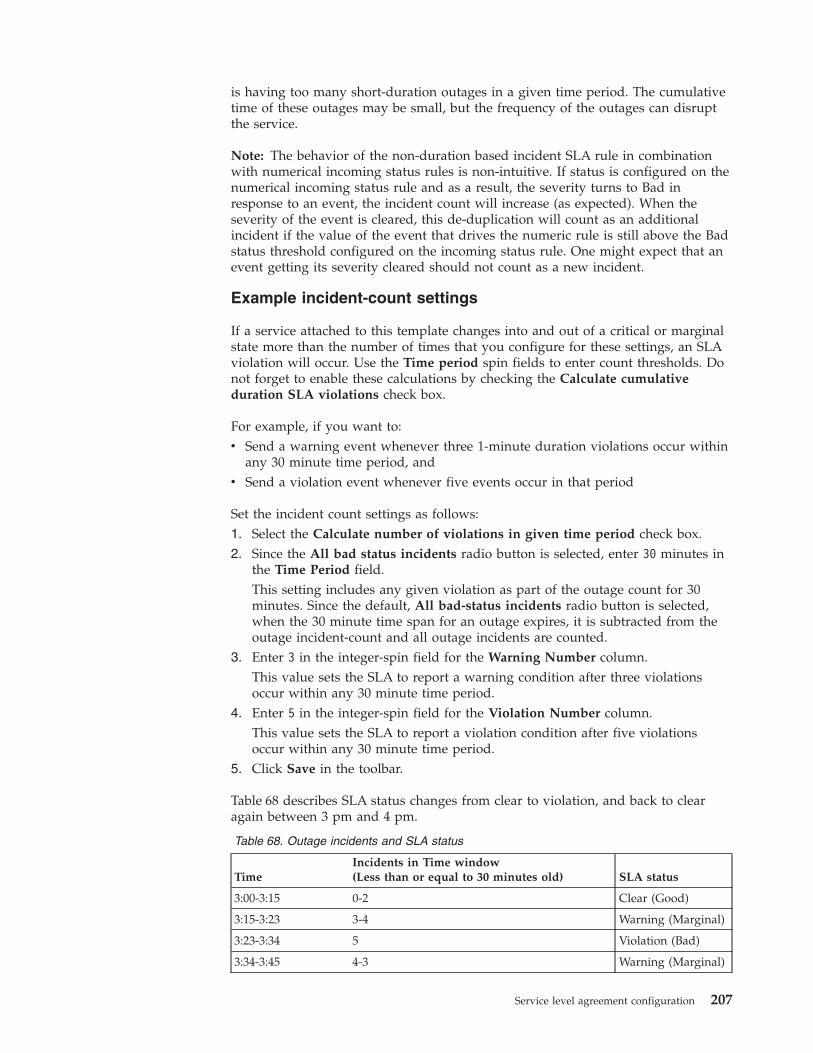
is having too many short-duration outages in a given time period. The cumulativetime of these outages may be small, but the frequency of the outages can disruptthe service.
Note: The behavior of the non-duration based incident SLA rule in combinationwith numerical incoming status rules is non-intuitive. If status is configured on thenumerical incoming status rule and as a result, the severity turns to Bad inresponse to an event, the incident count will increase (as expected). When theseverity of the event is cleared, this de-duplication will count as an additionalincident if the value of the event that drives the numeric rule is still above the Badstatus threshold configured on the incoming status rule. One might expect that anevent getting its severity cleared should not count as a new incident.
Example incident-count settings
If a service attached to this template changes into and out of a critical or marginalstate more than the number of times that you configure for these settings, an SLAviolation will occur. Use the Time period spin fields to enter count thresholds. Donot forget to enable these calculations by checking the Calculate cumulativeduration SLA violations check box.
For example, if you want to:v Send a warning event whenever three 1-minute duration violations occur within
any 30 minute time period, andv Send a violation event whenever five events occur in that period
Set the incident count settings as follows:1. Select the Calculate number of violations in given time period check box.2. Since the All bad status incidents radio button is selected, enter 30 minutes in
the Time Period field.This setting includes any given violation as part of the outage count for 30minutes. Since the default, All bad-status incidents radio button is selected,when the 30 minute time span for an outage expires, it is subtracted from theoutage incident-count and all outage incidents are counted.
3. Enter 3 in the integer-spin field for the Warning Number column.This value sets the SLA to report a warning condition after three violationsoccur within any 30 minute time period.
4. Enter 5 in the integer-spin field for the Violation Number column.This value sets the SLA to report a violation condition after five violationsoccur within any 30 minute time period.
5. Click Save in the toolbar.
Table 68 describes SLA status changes from clear to violation, and back to clearagain between 3 pm and 4 pm.
Table 68. Outage incidents and SLA status
TimeIncidents in Time window(Less than or equal to 30 minutes old) SLA status
3:00-3:15 0-2 Clear (Good)
3:15-3:23 3-4 Warning (Marginal)
3:23-3:34 5 Violation (Bad)
3:34-3:45 4-3 Warning (Marginal)
Service level agreement configuration 207

Table 68. Outage incidents and SLA status (continued)
TimeIncidents in Time window(Less than or equal to 30 minutes old) SLA status
3:45-4:00 2-0 Clear (Good)
Related concepts:“SLA data in the dependency view” on page 211This topic describes SLA data in the dependency view and in service instances.
Set incident-count violation calculationsThis topic describes how to set incident-count violation calculations.
About this task
To set incident-count violation calculations. complete the following steps.
Note: The behavior of the non-duration based incident SLA rule in combinationwith numeric attributes is somewhat non-intuitive. If status is configured on thenumerical incoming status rule and as a result the severity turns to Bad inresponse to an event, the incident count will increase (as expected). When theseverity of the event is cleared, this deduplication will count as an additionalincident if the value of the event that drives the numeric rule is still above the Badstatus threshold configured on the incoming status rule. One might expect that theevent getting its severity cleared should not count as a new incident.
Procedure1. Select the Calculate number of violations in given time period check box.2. Select the radio button for either Duration violations only or All bad-status
incidents.3. Enter the rolling Time Period and incident-count settings you want TBSM to
track, using Table 69 as your guide.4. Click Save in the toolbar.
Table 69 describes the Calculate time-based Service Level Agreement (SLA)violations: section of the Service Level Agreement Settings window.
Table 69. Service Level Agreement Settings window - incident-count calculations
Window element Description
Calculate number of violations ingiven time period
Select this check box field to activate the incidentvalue fields.
Duration violations only radio button Select this radio button if you want to count onlyoutage-duration violations in your incident-count.These violations are only counted when the servicestatus changes to bad. That is, if a service is alreadyin a bad status, subsequent bad status events are notcounted until the status changes back to good ormarginal.
All bad-status incidents radio button Select this radio button if you want to count allincidents (events) that cause the service instance'sstatus to change to bad.
Time Period Enter the time period for the violation-incident-count calculation in the h: (hour), m: (minutes), ands: (seconds) spin fields. The default time period is30 minutes.
208 IBM Tivoli Business Service Manager: Service Configuration Guide

Table 69. Service Level Agreement Settings window - incident-countcalculations (continued)
Window element Description
Service Level column This column lists all the service levels you canconfigure for the service template.
Violation Number column For each service level, set the number of outagesthat trigger an incident-count violation in the spinfield for the SLA Violation Number columns. Thedefault is 3 outages for a violation.
Warning Number column For each service level, set the number of outagesthat trigger an incident-count violation warning inthe spin field for the SLA Warning Numbercolumns. The default value is 2 outages for aviolation warning.
Set cumulative violation calculationsThis task describes cumulative violation calculations. This topic also describes howto set cumulative violation calculations.
About this task
The cumulative-time violations section of the SLA tab lets you set the amount oftime a service can be unavailable within a given time period before TBSM sends aviolation or warning event to TBSM ObjectServer. The default settings in theStandard SLA report a warning after 15 minutes of downtime and a violation after45 minutes of downtime within the selected time period (month, day, hour, orminute). You can track SLA violations over all four time periods simultaneously.
To set cumulative-time SLA calculations:
Procedure1. Select the Calculate cumulative duration SLA violations check box.2. Enter the SLA settings using the table below as your guide.
Table 70. Service Level Agreement Settings window - time-based calculations
Window element Description
Calculate cumulative duration SLAviolations check box
Select this check box to activate thecumulative-time violation settings.
Track Service Status Each fields Select the time periods you want for your SLAcalculations. If you select the month timeperiod, you can change the start day for themonthly calculation. The default start day is thefirst day of the month. You can track the outagetime over a month, day, hour, or minute.
Percentage of Month If you want the downtime per month to bemeasured in percentages rather than hours,select this check box. The Month check box hasto be selected for this function to work.
Time Period column The SLA-monitoring time period. For each timeperiod, this column displays rows of servicelevels, and time fields that let you enter thetime values for a given service level and timeperiod.
Service level agreement configuration 209

Table 70. Service Level Agreement Settings window - time-based calculations (continued)
Window element Description
Service Level column This column lists all the service levels you canconfigure for the service template.
Violation Time h: m: s: column Select the times you want for your SLAviolation settings in these spin fields. If youhave defined multiple service levels, the systemdisplays separate hours, minutes, and secondsfields for the SLA violation and warning timesfor each service level.
Warning Time h: m: s: column Select the times you want for your SLAviolation-warning settings in these spin fields.
3. Click Save in the toolbar.Related concepts:“SLA data in the dependency view” on page 211This topic describes SLA data in the dependency view and in service instances.Related tasks:“Displaying the SLA tab” on page 212This topic describes the Cumulative SLAs tab in the Service Details portlet. Thistopic also describes how to display the SLA tab.
Setting SLA penalty calculationsThis topic describes how to set SLA penalty calculations.
About this task
By using the SLA penalty calculations, you can set a cost estimate for each hour ofdowntime caused by an outage.
You must first save your SLA settings on the SLA tab before you can set the SLApenalty calculations.
To set the SLA hourly penalty calculations, complete the following steps:
Procedure1. From the Service Editor: Edit Templates tab, click the Additional tab.
The Additional tab opens.2. Enter the dollar amount for the hourly penalty in the Default Value column of
the HourlySLAPenalty parameter.3. Click Save in the toolbar.
Results
The only parameter that is available is HourlySLAPenalty. You can change thedefault value for this parameter. The parameter and default value only displaywhen SLA parameters have been set for the service template.Related concepts:“Additional tab” on page 77This topic describes the Additional tab. This topic also describes ReservedAdditional Properties.Related tasks:
210 IBM Tivoli Business Service Manager: Service Configuration Guide
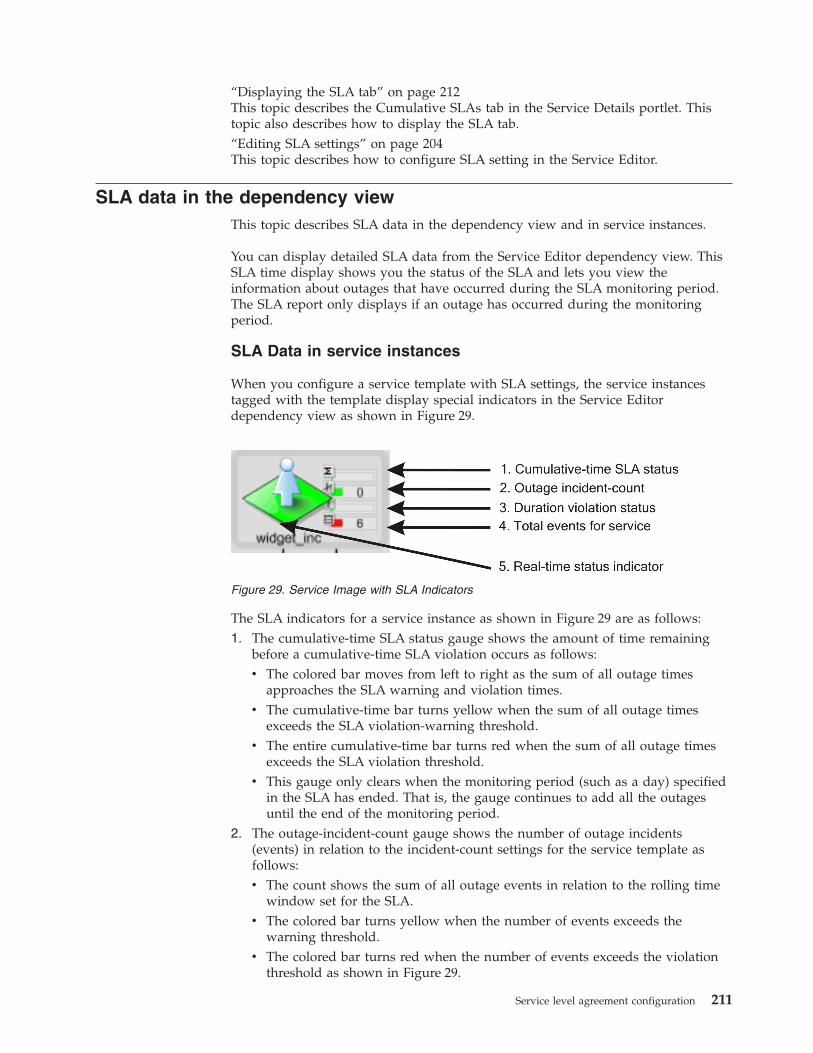
“Displaying the SLA tab” on page 212This topic describes the Cumulative SLAs tab in the Service Details portlet. Thistopic also describes how to display the SLA tab.“Editing SLA settings” on page 204This topic describes how to configure SLA setting in the Service Editor.
SLA data in the dependency viewThis topic describes SLA data in the dependency view and in service instances.
You can display detailed SLA data from the Service Editor dependency view. ThisSLA time display shows you the status of the SLA and lets you view theinformation about outages that have occurred during the SLA monitoring period.The SLA report only displays if an outage has occurred during the monitoringperiod.
SLA Data in service instances
When you configure a service template with SLA settings, the service instancestagged with the template display special indicators in the Service Editordependency view as shown in Figure 29.
The SLA indicators for a service instance as shown in Figure 29 are as follows:1. The cumulative-time SLA status gauge shows the amount of time remaining
before a cumulative-time SLA violation occurs as follows:v The colored bar moves from left to right as the sum of all outage times
approaches the SLA warning and violation times.v The cumulative-time bar turns yellow when the sum of all outage times
exceeds the SLA violation-warning threshold.v The entire cumulative-time bar turns red when the sum of all outage times
exceeds the SLA violation threshold.v This gauge only clears when the monitoring period (such as a day) specified
in the SLA has ended. That is, the gauge continues to add all the outagesuntil the end of the monitoring period.
2. The outage-incident-count gauge shows the number of outage incidents(events) in relation to the incident-count settings for the service template asfollows:v The count shows the sum of all outage events in relation to the rolling time
window set for the SLA.v The colored bar turns yellow when the number of events exceeds the
warning threshold.v The colored bar turns red when the number of events exceeds the violation
threshold as shown in Figure 29.
Figure 29. Service Image with SLA Indicators
Service level agreement configuration 211

v The outage incident-count clears if the time window expires before any moreoutages occur.
3. The duration-violation status gauge shows the amount of time remainingbefore an outage-duration SLA violation as follows:v The colored bar moves from left to right as an active outage's downtime
approaches the warning and violation times set for your SLA as shown inFigure 29 on page 211.
v The outage-duration bar turns yellow when the outage duration exceeds theSLA violation-warning threshold.
v The outage-duration bar turns red when the outage duration exceeds theSLA violation threshold.
v This gauge clears when the outage ends.4. The total service-affecting events gauge shows the number of events that affect
a service and the status color of the event with the worst status. This gauge isthe same for services with no SLA settings.
5. The real-time status indicator shows the status of the service.v The real-time status indicator turns from green to yellow when the service
status is marginal.v The real-time status indicator turns red when the service status is bad.
This indicator is the same for services with no SLA settings.Related concepts:“Violation incident-count calculations” on page 206This topic describes violation incident-count calculations. This topic also describeshow to set incident-count calculations based on an example.Related tasks:“Duration-based violation calculations” on page 205This topic describes duration-based violation calculations. This topic also describeshow to set duration-based calculations.“Set cumulative violation calculations” on page 209This task describes cumulative violation calculations. This topic also describes howto set cumulative violation calculations.“Editing SLA settings” on page 204This topic describes how to configure SLA setting in the Service Editor.
Displaying the SLA tabThis topic describes the Cumulative SLAs tab in the Service Details portlet. Thistopic also describes how to display the SLA tab.
About this task
Note: This feature will not be part of subsequent TBSM releases.
The Cumulative SLAs tab in the Service Details portlet shows the SLA status forservices that have SLA settings defined. When the service status is bad, you canview the details of the cumulative-duration calculations for the outage in theService Details portlet.
To display the Cumulative SLAs tab in the Service Details portlet:
212 IBM Tivoli Business Service Manager: Service Configuration Guide

Procedure1. From the Services in the Service Navigation portlet or the Service Tree, click
the service you want to view.The dependency view for the service is displayed in the Service Editor.
2. Click a service with SLA settings.3. Click the Cumulative SLAs tab in the Service Details portlet.4. When the status refreshes, click the service again to see updated data in the
Cumulative SLAs tab.
Results
The updated data is organized in the list on the tab. The table below describeseach column of data.
Table 71. Time computations display
Column name Description
Service Name The name of the affected service.
Best Case % Best case projections for the selected time period for theservice.
Downtime Calculation for how long the service has been down.
Time Left Calculation for how much time is left before the SLA is inviolation.
TWin (Time Window) The time range selected for tracking the outage.
Penalty The estimated cost of the outages in dollars.
Related concepts:“Status data in service instances” on page 233This topic describes status data in service instances.Related tasks:“Setting SLA penalty calculations” on page 210This topic describes how to set SLA penalty calculations.“Set cumulative violation calculations” on page 209This task describes cumulative violation calculations. This topic also describes howto set cumulative violation calculations.
SLA chartThis topic describes SLA charts. This topic also describes how to display a SLAchart.
About this task
Note: This feature will not be part of subsequent TBSM releases.
You can display a chart and outage list for more data on a service's SLA status.
Displaying the SLA chartAbout this task
To display the SLA chart:
Service level agreement configuration 213

Procedure1. From the Service Navigation portlet, select Services from the drop-down list.
Click the service you want to view.The dependency view for the service is displayed in the Service Editor.
2. Right-click a service with SLA settings.3. Select Show from the menu that appears.4. Select Show SLA Chart for Service or Show SLA Chart for Children from the
menu that appears. The Show SLA Chart for Children option is disabledunless the service has child instances that have SLA settings. The charts forboth options work the same way.The selected SLA chart is displayed in a new browser window.
5. Click the Refresh button to update the display and show the Outages Listportlet.
6. You can change the display using Table 72 as your guide.
Table 72. SLA chart elements
Chart element Descriptions
Start and End fields These fields let you set the start and end dates for a daily orhourly chart.
Type/Time Perioddrop-down list
Select the type of chart you want for this field. The validselections are Hourly, Daily, and Monthly.Remember: Monthly is only available for the Show SLAChart for Children option.
Refresh button Refreshes the chart display after you change one of thedisplay settings. Click this refresh button to display theoutage list at the bottom of the window.
3D check box Select this option if you want to display your chart in threedimensions.
Time Period Table The time period table below the bar chart shows a summaryof the SLA status for each data point in the chart. Forexample, if you selected a daily chart, the table shows theSLA summary for the covered period in the bar chart.
7. View the data displayed in the Outages List portlet using Table 73 as yourguide. If there is no data in the Outages List portlet, or you want to update thedata, click the refresh button in the chart or one of the bars in the chart.
Table 73. Outages List portlet
Column name Description
Sub-Service Down The name of the subservice that is causing the outage
Outage Start The time the outage started
Sub-Service Up The time the subservice came back up
Outage End The time the service outage ended
Duration The amount of time the outage lasted
8. To delete an outage, select it in the Select (all) column and click the Deletebutton.
9. Click the link in the column that has the service name. It opens an outage eventlist.
214 IBM Tivoli Business Service Manager: Service Configuration Guide

Viewing service models
You view and monitor your service-dependency model in the IBM Tivoli BusinessService Manager (TBSM) Service Editor View Service tab. This section explainshow to work with the Service Editor.
Service Administration OverviewThis topic describes how to use the Service Administration page to view services.
Services in the Service Navigation portlet and the View Service tab of the ServiceEditor let you view your service-dependency models and monitor howObjectServer events or other data affect your services.
Note: The Service Administration page will not be part of subsequent TBSMreleases. Use the Service Configuration page to configure your services models.
To access the Service Administration page:1. In the left navigation pane, click the + to expand Administration.2. Click Service Administration. The page loads on the right.
From these service views you can do the following:v View your services, subservices, and service health based on simple color-coded
indicators (red, yellow, green, and so on)v View a graphical presentation of your service dependencies and change the
appearance of the views (Relationships, Grouping, Custom, and so on)v Display related events in an Event List in the Service Details portlet or in an
Active Event List (AEL)v Display the status of the rules you configured in a services templatev Display a computation of optional SLA settings (see “Service level agreement
configuration” on page 203)v Display an event summary chart of any service.
The Service Navigation portlet's Services and the Service Editor's View Service tabare shown in Figure 30 on page 216.
© Copyright IBM Corp. 2008, 2013 215

The left portlet contains a navigation tree of your services and subservices.Related tasks:“Opening the Tree Template Editor” on page 265This topic describes how to open the Tree Template Editor.“Editing SLA settings” on page 204This topic describes how to configure SLA setting in the Service Editor.
Service Availability OverviewThis topic describes how to use the Service Availability page to view services.
The Service Availability page lets you view your service models and related data.The Service Tree portlet and the Service Viewer let you view yourservice-dependency models and monitor how ObjectServer events or other dataaffect your services.
The Service Tree, Service Viewer, and Urgent Services portlets can be customized.Portlet preferences can be accessed by clicking the Edit Options button on theportlet.
To access the Service Availability page:1. In the left navigation pane, click the + to expand Availability.2. Click Service Availability. The page loads on the right.
From these service views you can do the following:v View your services, subservices, and service health based on simple color-coded
indicators (red, yellow, green, and so on)
Figure 30. Service Navigation portlet and the dependency view in the View Service tab
216 IBM Tivoli Business Service Manager: Service Configuration Guide

v View a graphical presentation of your service dependencies and change theappearance of the views (Relationships, Grouping, Custom, and so on)
v Display related events in an Event List in the Service Details portlet or in anActive Event List (AEL)
v Display the status of the rules you configured in a services templatev Display a computation of optional SLA settings (see “Service level agreement
configuration” on page 203)v Display of all the services in the urgent (red) state in a table form.
Note: There are no buttons on the Availability page, because no configuration isdone on this page. Your permissions control which page you are able to view anduse.
The Service tree portlet and the Service Viewer are shown in the figure below.
Service Configuration OverviewThis topic describes how to use the Service Configuration page to view services.
Services in the Service Navigation portlet and the View Service tab of the ServiceEditor let you view your service-dependency models and monitor howObjectServer events or other data affect your services.
To access the Service Configuration page:1. In the left navigation pane, click the + to expand Administration.2. Click Service Configuration. The page loads on the right.3. Templates is open by default in the Service Navigation portlet. Select Services
in the drop down list to view your services.
The left portlet contains a navigation tree of your services and subservices.
Viewing service models 217
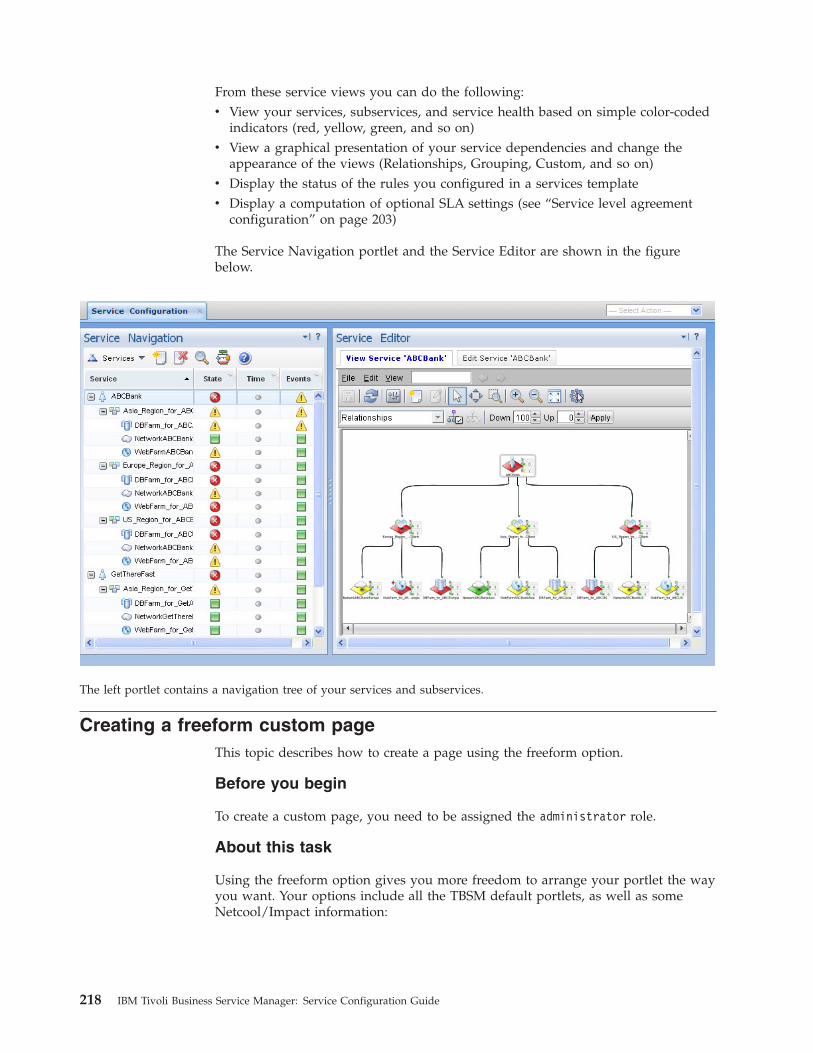
From these service views you can do the following:v View your services, subservices, and service health based on simple color-coded
indicators (red, yellow, green, and so on)v View a graphical presentation of your service dependencies and change the
appearance of the views (Relationships, Grouping, Custom, and so on)v Display the status of the rules you configured in a services templatev Display a computation of optional SLA settings (see “Service level agreement
configuration” on page 203)
The Service Navigation portlet and the Service Editor are shown in the figurebelow.
Creating a freeform custom pageThis topic describes how to create a page using the freeform option.
Before you begin
To create a custom page, you need to be assigned the administrator role.
About this task
Using the freeform option gives you more freedom to arrange your portlet the wayyou want. Your options include all the TBSM default portlets, as well as someNetcool/Impact information:
The left portlet contains a navigation tree of your services and subservices.
218 IBM Tivoli Business Service Manager: Service Configuration Guide

Table 74. Lists some of the common portlets of TBSM information you can choose todisplay on a custom page.
TBSM
Service Tree
Service Navigation
Service Viewer
Service Editor
Service Details
Urgent Services
Charting
Widgets
Time Window Analyzer
You can also add pre-configured, customized portlets to a custom page. If youwant a custom portlet on your new page, you must do any customizing before youstart creating a new page or the custom portlet will not be accessible in the catalog.
Procedure1. To get started, access the Create New Work Page page with one of the options
below:v In the taskbar, click the Create new work page tab.v In the left navigation pane, click Settings > Pages, and click New Page.
A Page Settings page is displayed.2. Click New Page. A new page is launched with the title Page Settings. You can
also click the New Page tab3. Enter the name you want in the Page name field.4. In the Page location field, click Location to browse for the location you want
your page. An example is console/Availability/. This path specifies that thepage will be listed under Availability in the console task list.
5. Select Freeform option under Page Layout.6. Expand Optional setting. Click Add to view a list of roles that can access this
page.7. After you select the roles you want, click Add.8. Click OK. The Portlet palette displays, which is used to select portlet content.
The portlets are grouped into catalogs.9. Select the All folder, which contains all of the portlet options available to you.
10. Use the navigation arrows at the bottom of the portlet palette to find andselect the portlet you want, or you can use the search filter to find the portletyou want.
11. Drag the portlet into the empty space below the portlet palette. You can dragthe portlet to wherever you want on the page. You can also resize the portletby pulling the lower-right corner.
12. Click Edit Options if you want to customize your portlet. These edit optionsinclude:v The common portlet Edit Options: Personalize and Edit Shared Settings.
Personalize changes settings for the current user. Edit Shared Settingschanges settings for all users.
Viewing service models 219

v Skin, which controls how the border looks: Default,Default with notitle,Transparent, and Transparent no title. You can easily change yoursettings back to the default by clicking the Show Menu button at the topright of the portlet.
Note: After you save your page, you wil not be able to edit Skin changeswithout returning to the Edit page.
v Fill Work Page will resize a portlet to fill the entire page without borders.v Layering options which include: Bring to Front, Send to Back, Bring
Forward, and Send Backward.v You can select Events to view event settings for the portlet.v You can delete the portlet from the page by clicking Delete space.
13. When you are done adding portlets, customizing, and arranging, click Done.
What to do next
For additional information see:v The TBSM Scenarios Guide contains example step-by-step procedures detailing
portlet customization and creating freeform pages.v The Tivoli Integrated Portal User Assistance topics will give you general
information about creating pages, roles, and customizing portlets.
Example 1: Adding a Service Tree portlet to a freeform pageThis topic describes how to add a Service Tree portlet to a page using the freeformoption.
Before you begin
To create a custom page, you need to be assigned the administrator role.
Procedure1. Click Settings –> Pages in the navigation pane. A list of all navigation nodes
in the console are displayed, grouped the same way as they are in the consolenavigation.
2. Click New Page. A new page is launched with the title Page Settings.3. Type Services in the Page name field.4. In the Page location field, click Location to browse for where the new page
will be listed in the console task list. Select Availability. The Location field isupdates with console/Availability/. Keep the defaults for the other fields.
5. Select Freeform option under Page Layout.6. Expand Optional setting. Click Add to view a list of roles that can access this
page.7. Select tbsmreadonly and click Add.8. Click OK. The Portlet palette displays, which is used to select portlet content.
The portlets are grouped into catalogs.9. Select the All folder, which contains all of the portlet option available to you.
10. Use the navigation arrows at the bottom of the Portlet palette to find andselect Service Tree.
11. Drag the Service Tree portlet into the empty space below the Portlet palette.You can drag the portlet to wherever you want on the page. You can alsoresize the portlet by pulling the lower-right corner.
220 IBM Tivoli Business Service Manager: Service Configuration Guide

12. Click Edit Options to customize your portlet. Set as follows:v In the Skin menu: select Transparent no title.v Select Fill Work Page, and the portlet will expand to fill the entire page.
13. When you are done adding portlets, customizing, and arranging, click Done.The new All Services List page will open.
Example 2: Adding an Urgent Services portlet to a freeformpage
This topic describes how to add an Urgent Services portlet to a page using thefreeform option.
Before you begin
To create a custom page, you need to be assigned the administrator role.
Procedure1. In the taskbar, click the Create new work page tab. A new page is launched
with the title Page Settings.2. Type Urgent Only in the Page name field.3. In the Page location field, click Location to browse for where the new page
will be listed in the console task list. Select Availability. The Location field isupdates with console/Availability/. Keep the defaults for the other fields.
4. Select Freeform option under Page Layout.5. Expand Optional setting. Click Add to view a list of roles that can access this
page.6. Find tbsmuser in the list and click Add.7. Click OK. The Portlet Palette displays, which is used to select portlet content.
The portlets are grouped into catalogs.8. Select the All folder, which contains all of the portlet option available to you.9. Use the search filter to find and select Urgent Services.
10. Drag the Urgent Services portlet into the empty space below the Portletpalette. You can drag the portlet to wherever you want on the page.
11. Click Edit Options to customize your portlet. Set as follows:v In the Skin menu: select Transparent.v Select Fill Work Page, and the portlet will expand to fill the whole page.
12. Click Done. The new Urgent only page will open.
Services in the Service Navigation portletThis topic describes Services in the Service Navigation portlet. This topic alsodescribes how to display the dependency view.
The Services tree in the Service Navigation portlet contains trees ofservice-dependency models that have been configured for TBSM. The serviceinstances you see depend on your user and group permissions.
To see the full tree, click the plus symbols to the left of the services. A list ofservices instances is displayed.
Viewing service models 221

Displaying the dependency view
Clicking a service in the Services navigation tree loads a dependency view of theservice and its subservices in the View Service tab of the Service Editor.
Figure 30 on page 216 shows the dependency view for ABCBankeBanking and itssubservices.
Note: If you change rule or template names, you can cause issues with otherfeatures of TBSM. TBSM uses these names to reference the rule values for otherrules, such as auto-population or ESDA rules and for custom displays such asservice trees and view definitions.
If you want to change a rule or template name, change the name before you usethe rule or template elsewhere in TBSM.
For example, when you create numerical and text-based rule, you need to create acustom service tree or view definition to display the output of the rule in theTBSM console. The trees and view definitions use the template and rule names tomap the rule values to a display object. As a result, if you change the name of arule or a template used in a custom display, the custom tree or view definition willno longer display the rule values properly.
Services elementsThis topic describes the elements in Services in the Service Navigation portlet.
The color coded indicators to the right of each service name and subservice namechange color as the status of the service changes. The status is automaticallyrefreshed every 60 seconds. If the services have been added or removed from theservice model, the service model is automatically updated with the changes.
Table 75 describes the Services elements.
Table 75. Services elements
Services elementElementtype Description Page
New button Click this button to create a serviceinstance. When you click thisbutton, a blank Edit Service tabopens in the Service Editor. Enterthe parameters for the new serviceinstance and click Save.
v ServiceAdministration
v ServiceConfiguration
DeleteServicesbutton
Click this button to select theservices you want to delete. Whenyou click this button, the DeleteInstances tab opens in the ServiceEditor. Select the services you wantto delete and click the Deletebutton in the Delete Instances tab.
v ServiceAdministration
v ServiceConfiguration
222 IBM Tivoli Business Service Manager: Service Configuration Guide

Table 75. Services elements (continued)
Services elementElementtype Description Page
FindInstancebutton
On the Service Administration andService Configuration pages,clicking the Search button opens anew window that allows you tosearch for service instances. Enter asearch string in the Search forfield, and click Search. Thematching results are shown in thetable below.
For example, if you want to findall the service instances withnames like webserver1, click thesearch icon. In the new window,enter webserver1 in the Search Forfield and click the Search button.The table will be populated withmatching service instance. If youdouble-click the instance in the list,the service editor will be populatedwith that service.
On the Service Availability page,when you click one of theinstances in the list, it will bedisplayed and selected in theService Tree.
v ServiceAdministration
v ServiceConfiguration
v ServiceAvailability
TreeTemplateEditorbutton
Click this button to open an editorwhere you can create, design, andedit tree templates.
v ServiceAdministration
v ServiceConfiguration
Help button Click this button to access help forthe tab.
v ServiceAdministration
v ServiceConfiguration
Service Column This column lists the names ofservices instances configured forTBSM. This column is sortedalphabetically by default, but youcannot selectively sort it.Note: If your service name is toolong, the Service Tree on theService Availability pageautomatically wraps the text to thenext line.
v ServiceAdministration
v ServiceConfiguration
v ServiceAvailability
Viewing service models 223

Table 75. Services elements (continued)
Services elementElementtype Description Page
State IndicatorColumn
The State indicator shows thestatus with up-to-the-minuteinformation about the service as awhole, depending on the status ofthe subservices. The colorindicators are:
v Green = Good
v Yellow = Marginal
v Purple = unknown (for eventsonly)
v Blue = Maintenance
v Red = Bad
You can sort the services accordingto the status by clicking thiscolumn heading.
v ServiceAdministration
v ServiceConfiguration
v ServiceAvailability
Time IndicatorColumn
If a service has cumulative-timeSLA settings, the Time indicatorcolumn shows the status of theSLA. If the service does not havecumulative-time SLA settings thisindicator is gray. The colorindicators are:
v Green = Good
v Yellow = Marginal
v Red = Bad
You can sort the services accordingto the status by clicking thiscolumn heading.
v ServiceAdministration
v ServiceConfiguration
v ServiceAvailability
Events IndicatorColumn
The Event indicator shows thehighest severity level of relatedevents for the service. Theindicator colors match theseverity-level colors forObjectServer events. For example,if the highest severity level iswarning, this indicator is blue.
You can sort the services accordingto the event status by clicking thiscolumn heading.
v ServiceAdministration
v ServiceConfiguration
v ServiceAvailability
Clearsettingsbutton
Use the Clear settings button torestore the default column-basedsettings in the Service Tree. TheClear settings button will notrestore all default portlet settings.
ServiceAvailability
Note: You can customize the Indicator columns to meet your needs.
224 IBM Tivoli Business Service Manager: Service Configuration Guide

Services in the Service TreeThis topic describes Services in the Service Tree. This topic also describes how todisplay the dependency view.
The Service Tree contains trees of service-dependency models that have beenconfigured for TBSM. The service instances you see depend on your user andgroup permissions.
To see the full tree, click the plus symbols to the left of the services. A list ofservices instances is displayed.
Displaying the dependency view
Clicking a service in the Service Tree loads a dependency view of the service andits subservices in the Service Viewer.
“Service Availability Overview” on page 216 shows the dependency view forABCBankeBanking and its subservices.
Note: If you change rule or template names, you can cause issues with otherfeatures of TBSM. TBSM uses these names to reference the rule values for otherrules, such as auto-population or ESDA rules and for custom displays such asservice trees and view definitions.
If you want to change a rule or template name, change the name before you usethe rule or template elsewhere in TBSM.
For example, when you create numerical and text-based rule, you need to create acustom service tree or view definition to display the output of the rule in theTBSM console. The trees and view definitions use the template and rule names tomap the rule values to a display object. As a result, if you change the name of arule or a template used in a custom display, the custom tree or view definition willno longer display the rule values properly.Related tasks:“Assigning roles per service” on page 185This describes how to assign roles per service.
Service Tree preferencesThis topic describes Service Tree preferences.
The Service Tree preference window allows you to control the default presentationof a tree and set a default service instance.
Note: Any changes that you make in the Service Tree preferences window are notsaved when you close your login session.
To access Service Tree preferences:1. Click Edit Options in the Service Tree portlet.2. Select Personalize.
The service tree preferences window opens. The General tab shows by default.3. Set your preferences using Table 76 on page 226 as a guide.
Viewing service models 225

Table 76. Service Tree preferences guidelines
Tab Description
General This tab lets you specify the portlet title andthe refresh interval of the tree (30 secondsby default).
Context This tab lets you set:
v The default starting service instance
v Whether the tree accepts context fromanother page or from other portlets on thesame page.
See “Set service context” for moreinformation.
View This tab lets you select which Tree Templateyou want to view in the Service Tree portlet.
Select the Use Depth Shading option tocolor each level expanded in the tree todistinguish it from its parent and children.
Select the Enable Hover Preview option toactivate hover preview for servicesconfigured for this feature. If you do notconfigure TBSM for OSLC, this option isdisabled.
This tab also allows you to set the visibilityof services in the Service Tree portlet. Formore information, see “Service Treepreferences View tab” on page 227 for moreinformation.
4. To save your new preferences, click Save.
Note: The Restore defaults button lets you restore the preferences to the systemdefaults.
Set service contextThis topic describes the elements on the Service Tree preferences Context tab. Thistopic also describes how to set the options on this tab.
About this task
The Context tab options let you specify the default top-level service for your tree,or whether the tree changes in response to context passed from other portlets orpages.
The Set Starting Instance option lets you select a default service from a tree ofyour service models. This service displays as the default in the Service Tree portlet.You can set the starting service instance for your user ID only or for one of thegroups you belong to.
The Change starting instance when Node clicked on or launch page events arereceived option lets you specify if the tree accepts context from another page orfrom other portlets on the same page.
To set the context for a Service Tree portlet, complete the following steps:
226 IBM Tivoli Business Service Manager: Service Configuration Guide

Procedure1. From the Context tab in the Service Tree preferences, choose from these
options:
Change starting instance when Node clicked on or launch page events arereceived.
When you select this option, the tree accepts context from another pageor from other portlets on the same page. When the service tree receivescontext, it shows either the service passed as context or its childservices as the default view. For example, if you select a service inanother tree on the same page, the context of this Service Tree changesto show the selected service.
By default, it is not selected. If it is not selected, the tree does notreceive context from other portlets or pages.
Show starting node in treeTo use this option, select the service you want to display by defaultfrom the Service Tree. Then select this option to show the service as theonly root node in the Service Tree.
By default, it is not selected. If it is not selected, the immediate childrenof the starting instance become the root nodes of the tree.
Broadcast service instance to page after tree loadedWhen you configure this option, after the tree is loaded, it broadcastsservice context data to the other portlets on the page. This enables theinitial content for the page. To enter the broadcast service instance,select one of the following values:v - 1: Indicates that there is no automatic selection of the initial row.v 0: Indicates that the first row is automatically selected.v 1: Indicates that the second row is automatically selected.v 99: Indicates that the 100th row is automatically selected.
2. Click OK to save your preferences.
Service Tree preferences View tabThis topic describes the options in the Service Tree preferences View tab. You canalso set the visibility for services from this tab.
Display options
You can set these display options in the Service Tree preferences View tab:v Use the Tree Template drop-down list to select the tree template where you
want to change the hover preview and depth shading options.v Enable Hover Preview enables hover preview for services that are configured
for this feature. When this option is enabled and configured, the hover previewdisplays when a user moves the mouse over specific rows in the Service Tree. IfTBSM is not configured for OSLC, the checkbox is disabled. Before you can usethe option, TBSM and the Jazz for Service Management Registry must beconfigured for hover preview as described in the TBSM Customization Guide >OSLC hover preview and TBSM.
v Use Depth Shading option colors each level expanded in the tree to distinguishit from its parent and child services.
Viewing service models 227

Service Visibility options
Access the Service Visibility option in the Service Tree preferences View tab to dothe following tasks:v Selectively show services in the Service Tree portletv Remove services from display in the Service Treev Show selected services always
For any services you want to control, you must specify a numeric rule. Eachservice in the model is then checked for the existence of this rule. If the rule existsand the output is zero, the service is considered invisible and is not displayed inthe Service Tree. If the rule does not have an output of zero, the service isdisplayed in the Service Tree. When a rule does not exist for a service or is notspecified, the tree shows the default that you select on the View Tab. All serviceswithout a rule are invisible or visible depending on your selection.
Note: Numeric formula rules with a hardcoded numerical value cannot be usedto make services always visible because the rule doesl not recalculate its valuewhen the data server is restarted. Use a rule that is driven by an event or datafetcher. Service visibility can be made static by using a numeric incoming statusrule that uses a data fetcher to obtain data from a static database table.
If you do not have any numeric rules, you must create a new numeric rule tocontrol visibility for each template in the Service Editor. Otherwise you cannot usethis preference option. To create a numeric rule in the Service Editor, see the topic:“Create and edit numerical incoming status rules” on page 87.
To set the Service Visibility option on the Service Tree preferences, follow thesesteps:1. Type the rule name you created in the Visibility Rule Name field. The name is
case-sensitive. This rule name controls what your Service Tree looks like.
Important: Rules are case-sensitive, and you must type the rule name exactly.If the name does not exactly match the rule you created in the Service Editor,the name does not exist to the TBSM program.
2. Select either Invisible or Visible to specify the default visibility state when therule does not exist for a particular service.
Note: If your rule is not found, and you selected Invisible, all your serviceswill become invisible.
Note: If the rule is present on more than one template a service is tagged with,the Service Tree does not work correctly. Create a rule only for the primarytemplate.
3. Click OK to save your preferences.
Note: To change your current settings, return to the Service Tree preferencesand edit the settings.
Restriction: The Service Tree will not dynamically update when templatechanges are made. For example, tagging or un-tagging a service with atemplate containing a visibility rule would require the Service Tree to bereloaded by reopening the page.
228 IBM Tivoli Business Service Manager: Service Configuration Guide

Customizing the Service TreeThis topic describes how to customize the Service Tree by customizing columns,using sort options, and the Find tool.
TBSM allows you to customize columns in the Service Tree directly.
Note: Any column customizations you make will be saved until you click ClearSettings on the toolbar.
Customizing Service Tree columns
Resizing columns
You can resize columns by clicking column header borders, then draggingto the size you want.
Reordering columnsYou can reorder columns by clicking the column headers and draggingthem to the wanted place.
Column visibilityYou can control what columns are visible in the Service Tree.
To hide any columns from view:1. Right-click on any column.2. Select Column Visibility.3. Clear the column you want to hide. The Service Tree automatically
refreshes to reflect the change.
Note: Repeat steps 1 and 2 for any additional columns you want tohide.
To make hidden columns visible, following these steps:1. Right-click on any column.2. Select Column Visibility.3. Check that the column you want to see. The Service Tree automatically
refreshes to reflect the change.
Locking ColumnsThis function allows you to lock certain columns and keep them in viewhorizontally while the remaining columns scroll (left and right). To lock acolumn:1. Right-click on the column you want to lock.2. Select Lock Column.
To unlock a column:1. Right-click on the column you want to lock.2. Select Unlock Column.
Service tree sort options
You can click the column headers in the Service Tree to change the order of thedisplayed information. When you click the column header, it toggles the sort modebetween ascending and descending.
Viewing service models 229

For example, on the initial column click, the Service Tree sorts the services inascending order. On the second click, the services sort in descending order, and onthe third click, the service tree reverts to the original sort order.
Note: By default, the Service name column is automatically sorted in ascendingorder. The State, Time, and Events columns are sorted in descending order bydefault.
Service tree Find
When you click the Find button on the toolbar, the Find Service window opens. Tofind a service or display name:1. Enter the service or display name you want to find.
Wildcard Character Use
* This wildcard is used to match zero or morecharacters.
? This wildcard is used to match any singlecharacter.
Note: There is an implied * wildcard at the beginning and end of the filter bydefault.
2. Click Find. A list of instances pops up.3. Find the service you want on the list and click it. The Find Service window
closes, and your service is highlighted in the Service Tree.Related tasks:“Opening the Tree Template Editor” on page 265This topic describes how to open the Tree Template Editor.Related reference:“About tree columns” on page 268This topic describes tree columns. This topic also describes the ColumnConfiguration toolbar.
Service Viewer preferencesThis topic describes how to use the Service Viewer preferences.
Note: This feature will not be part of subsequent TBSM releases.
The Service Viewer preference window allows you to control the defaultpresentation of the Service Viewer and set a default service instance.
To access Service Viewer preferences:1. To access the service viewer preferences, open the Service Availability page.2. Select Edit Shared Settings from the Edit drop-down menu.
The service viewer preferences window opens. The General tab shows bydefault.
3. Set your preferences using Table 77 on page 231 as a guide.
230 IBM Tivoli Business Service Manager: Service Configuration Guide
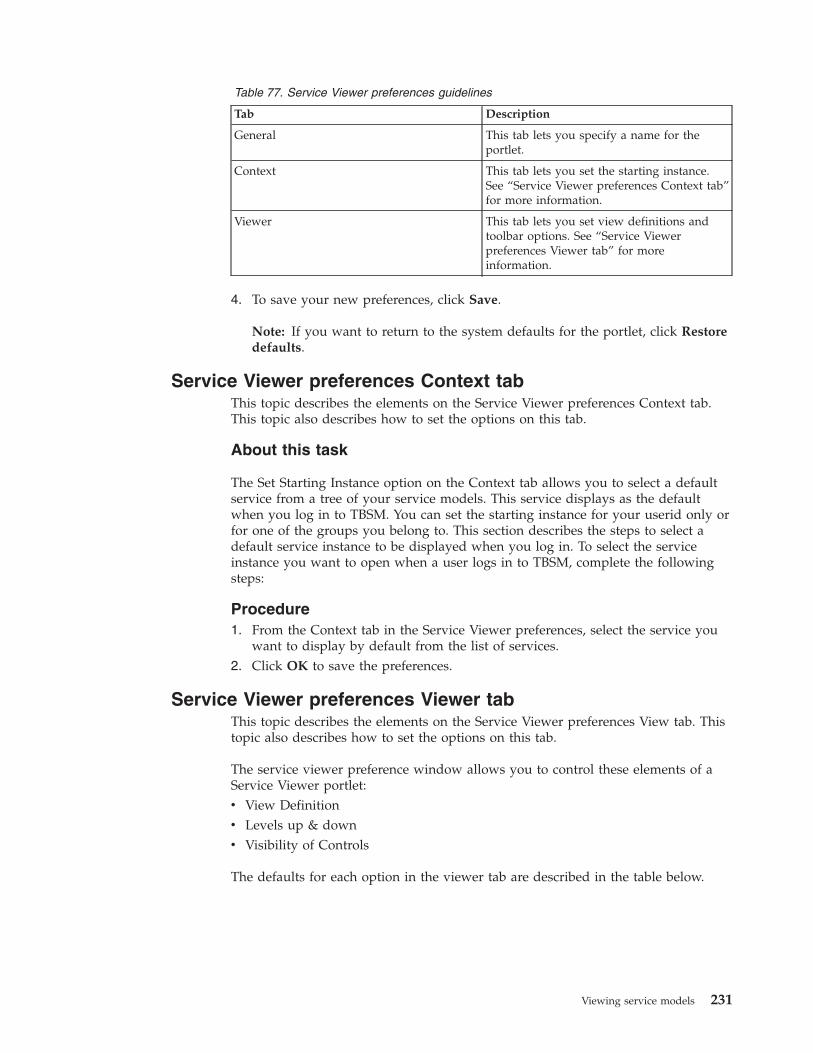
Table 77. Service Viewer preferences guidelines
Tab Description
General This tab lets you specify a name for theportlet.
Context This tab lets you set the starting instance.See “Service Viewer preferences Context tab”for more information.
Viewer This tab lets you set view definitions andtoolbar options. See “Service Viewerpreferences Viewer tab” for moreinformation.
4. To save your new preferences, click Save.
Note: If you want to return to the system defaults for the portlet, click Restoredefaults.
Service Viewer preferences Context tabThis topic describes the elements on the Service Viewer preferences Context tab.This topic also describes how to set the options on this tab.
About this task
The Set Starting Instance option on the Context tab allows you to select a defaultservice from a tree of your service models. This service displays as the defaultwhen you log in to TBSM. You can set the starting instance for your userid only orfor one of the groups you belong to. This section describes the steps to select adefault service instance to be displayed when you log in. To select the serviceinstance you want to open when a user logs in to TBSM, complete the followingsteps:
Procedure1. From the Context tab in the Service Viewer preferences, select the service you
want to display by default from the list of services.2. Click OK to save the preferences.
Service Viewer preferences Viewer tabThis topic describes the elements on the Service Viewer preferences View tab. Thistopic also describes how to set the options on this tab.
The service viewer preference window allows you to control these elements of aService Viewer portlet:v View Definitionv Levels up & downv Visibility of Controls
The defaults for each option in the viewer tab are described in the table below.
Viewing service models 231

Table 78.
Option Description Default Setting
View Definition This option controls whichview definition you see bydefault.
The view definition is set toRelationships.
Levels up & down This option controls howmany levels appear in yourservice model hierarchy.
Levels up: 1. Levels down: 3.
Visibility of Controls You can choose whatcontrols are visible. You canchoose to display the ViewDefinition toolbar, theStandard toolbar, or themenu bar. You can select allthe options or anycombination of these optionsyou want.
Menu bar, Standard toolbar,and View Definition toolbarare all selected.
To change these options, follow these steps:1. Select the view definition you want to display from the list of available view
definitions.2. To change the levels, select the check box Override levels up and down with:
3. Use the Up and Down fields to specify the number of services levels you wantto see above and below your selected service.
Note: To show no ancestors, specify 0 in the Up field. To show no descendents,specify 0 in the Down field.
4. Select menu bar, Standard toolbar, View Definition toolbar, or all to get thetoolbar settings you want. Table 79 describes these options.
Table 79. Service Viewer toolbar options
Toolbar option you want to view Settings
Menu bar Make sure only the menu bar is selected.
Standard Make sure that only the Standard check boxis selected.
View Definition Make sure that only the View Definitioncheckbox is selected.
All selected This setting is the default. Make sure themenu bar, the Standard toolbar, and theView Definition toolbar check boxes are allselected.
Note: This feature can also be found in the Service Editor View tab menu andin the Service Viewer menu. Select View � Toolbars. Select or deselect Standardand View Definition to get the settings you want.
5. To save your new preferences, click OK.
Note: If you want to return to the system defaults for the portlet, click Restoredefaults.
232 IBM Tivoli Business Service Manager: Service Configuration Guide

View Service tabThis topic describes the View Service tab. This topic also describes how to displaythe View Service tab.
The default Service Editor and Viewer show a dependency model. You can changethe view and edit the service model. It can also display a customized service viewthat contains custom indicators. The actions you can take depend on yourpermissions.
The service viewer view requires a Java plug-in and allows you to customize yourview.
Displaying the View Service tab
Clicking a service in the Services tree in the Service Navigation portlet loads adependency view of the service with its subservices in the View Service tab of theService Editor. The View Service tab by default displays the Relationships layout.By default, the dependency view displays up the hierarchy one level and threelevels down from the selected service.Related concepts:“Displaying service details” on page 243“View service layout options” on page 241This topic lists the view service options. This topic also describes how to center aview for a service.Related reference:“View Service toolbar and menus” on page 234This topic describes the elements of the View Service toolbar and menu.
Status data in service instancesThis topic describes status data in service instances.
When you configure services for TBSM, the service instances are displayed in theView Service tab of the Service Editor dependency view, as shown in Figure 31.
The indicators for a service image as shown in Figure 31 are as follows:1. The service icon in each instance represents the service type throughout TBSM.2. The following real-time status indicator colors show the current service status:
v The real-time status indicator turns yellow when the service status ismarginal.
v The real-time status indicator turns red when the service status is bad.
Figure 31. Service image with indicators
Viewing service models 233

v If the service's template has unknown status set, the indicator turns purple ifno events are detected for the specified time period.
3. The total service-affecting events gauge shows the number of events that affecta service and the status color of the event with the worst status.
The service instance has special indicators if a service's template has optional SLAsettings configured.Related tasks:“Creating and editing output expressions” on page 75This task describes how to create and edit output expressions.“Displaying the SLA tab” on page 212This topic describes the Cumulative SLAs tab in the Service Details portlet. Thistopic also describes how to display the SLA tab.
View Service toolbar and menusThis topic describes the elements of the View Service toolbar and menu.
The options on the View Service toolbar and menus let you customize and save theviews in the View Service tab.
The figure shows the toolbar.
Save
Clicking the Save button allows you to save a custom canvas.
Viewer Preferences tool
The Viewer Preferences tool allows you to set your display preferences for theView Service tab.
Click the Viewer Preferences button in the toolbar to open the Viewer Preferenceswindow.
You can change the following settings in the Viewer Preferences window:v If you have Save Canvas Layout for Group permissions, whether the views you
save and delete affect your entire user group.
Figure 32. View Service toolbar
Figure 33. Save button
Figure 34. Viewer Preferences tool
234 IBM Tivoli Business Service Manager: Service Configuration Guide

v The default visual elements for service instance images.
If you have the Save Canvas Layout for Group role, the Save tab appears in theViewer Preferences window. The Save Custom Views option lets you set whetherthe views you save affect your entire user group.
To set your view saving preference, complete the following steps:1. From the Save Custom Views option in the Viewer Preferences window, select
the radio button for the option you want. If you select For Group, any viewsyou save and delete will be saved for the selected group.
2. Click OK.
Create Custom Canvas tool
Clicking the Create Custom Canvas button allows you to create a custom canvas.
Palette tool
Clicking the Palette button displays the custom indicator and decoration palette.For more information about creating custom views, see the IBM Tivoli BusinessService Manager: Administrator's Guide
Refresh tool
The Refresh tool allows you to refresh the status of the services displayed in thedependency view.
Use the Refresh tool to get an updated view, including changes in status andservice dependencies. Changes in status are indicated by changes in the color ofthe service's visual elements.
Select tool
The Select tool allows you to select an individual service or visual element incustom views. You must be in a custom view to move or delete a visual element.
Figure 35. Create Custom Canvas button
Figure 36. Save button
Figure 37. Request Status/Instances Refresh button
Viewing service models 235

Pan tool
The Pan tool allows you to grab all the items in the dependency view and movethem around the window.
To use this tool, complete the following steps:1. Click the Pan button. The cursor turns into a figure of a hand.2. Click any service in the dependency view.3. Move the displayed services to a new point in the pane.4. Click the Pan icon again to turn off the tool.
Zoom Box tool
The Zoom box tool allows you to select a service, several services, or part of aservice rectangle in the dependency view to zoom in on the area.
To use this tool, complete the following steps:1. Click the Zoom box tool.2. Draw a rectangle around the service, services, or a portion of the service, that
you want to zoom in on.3. To make the view smaller, click the Zoom out button until the view is restored
to the size that you want.You can return the view to its original position in the pane by using the Fit toView tool.
Zoom In tool
The Zoom in tool allows you to enlarge the whole view.
To use this tool, complete the following steps:1. Click the Zoom in button.
The entire view becomes larger.
Figure 38. Select tool button
Figure 39. Pan tool button
Figure 40. Zoom Box tool
Figure 41. Zoom In tool
236 IBM Tivoli Business Service Manager: Service Configuration Guide

2. To restore the view to its original size, use the Zoom out or Fit to Viewbuttons.
Zoom Out tool
The Zoom out tool allows you to reduce the whole view.
To use this tool, complete the following steps:1. Click the Zoom out button.
The entire view becomes smaller.2. To restore the view to its original size, use the Zoom in or Fit to View buttons.
Fit Contents in View tool
The Fit Contents in View tool allows you to make the view fit to the size of thepane. By default, service models are set to display the entire model in the view.
Click the Fit Contents in View button. This view enlarges or reduces to fit thepane.Related concepts:“Custom Canvases” on page 25This topic describes the elements in Custom Canvases in the Service Navigationportlet.“View Service and Template tabs” on page 31This topic describes the View Service and Template tabs in the Service Editor.“View Service tab” on page 233This topic describes the View Service tab. This topic also describes how to displaythe View Service tab.“Service Editor” on page 31This topic describes the Service Editor portlet.Related tasks:“Creating new custom canvases” on page 336This topic describes how to create custom canvases.“Overview tool” on page 239This topic describes the overview tool.
View Service menusThis topic describes the View Service menus.
The menus give you additional options that are not on the toolbar.
Figure 42. Zoom Out tool
Figure 43. Fit Contents in View tool
Viewing service models 237

File menu
The File menu are described in the table below.
Table 80.
Toolbar button Description
Reload Style sheets Selecting this option will allow you to reloadthe style sheets.
Clear Instances Cache Selecting this option will allow you to clearthe instances cache.
Edit menu
The Edit menu contains the options as described in Table 81.
Table 81. Edit menu Options
Toolbar button Description
Cut Selecting Cut lets you cut the selectedservice indicator.
To use this tool:
1. Select an indicator with the Arrow tool.
2. Select Cut from the Edit menu to removethe selected indicator.
You can paste the item using the Pasteoption in the Edit menu.
Paste Selecting Paste lets you paste a cut serviceindicator.
To use this tool:
1. Cut an indicator.
2. Change views to another custom view.
3. Select the Paste option from the Editmenu.
Delete Selecting this option lets you delete theservice indicator you select. To use this tool:
1. Select an indicator with the Select tool.
2. Select Delete from the Edit menu toremove the selected indicator.
Bring to Front When you are creating a custom canvas, ifyou have overlapping service indicators ordecorations, selecting the Bring VisualElement to Front option sends the item tothe front.
Send to Back When you are creating a custom canvas, ifyou have overlapping service indicators ordecorations, selecting the Send VisualElement to Back option sends the item tothe back.
238 IBM Tivoli Business Service Manager: Service Configuration Guide
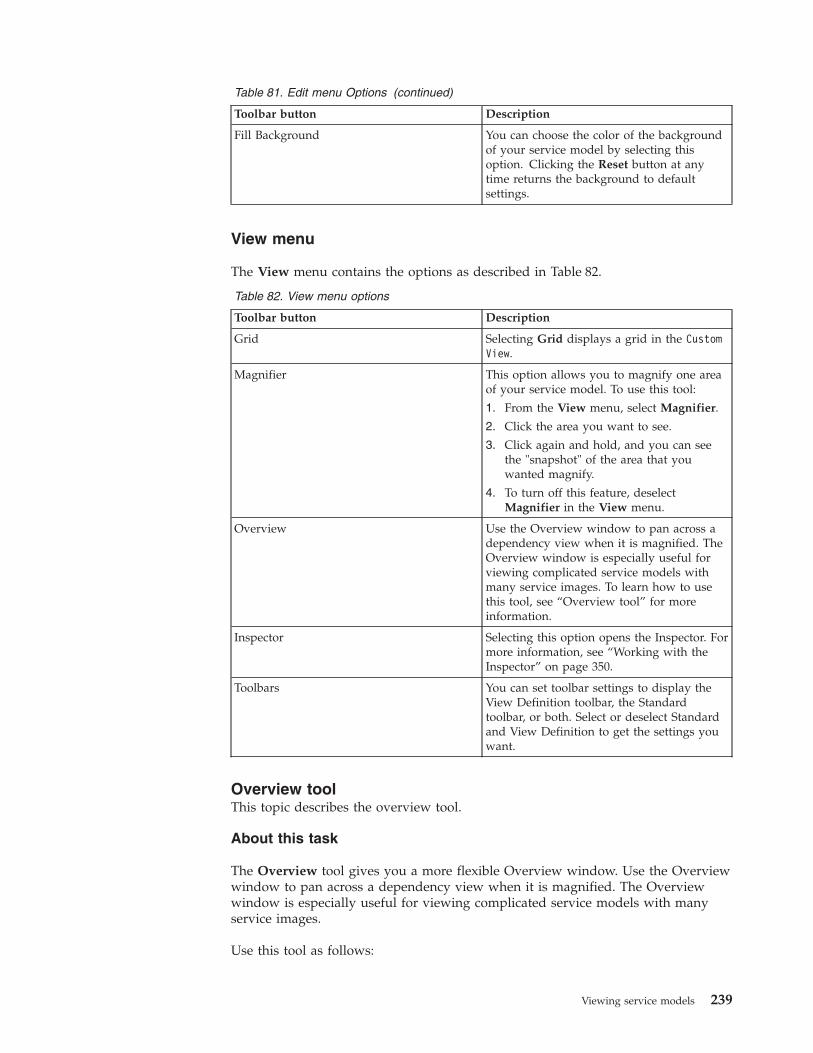
Table 81. Edit menu Options (continued)
Toolbar button Description
Fill Background You can choose the color of the backgroundof your service model by selecting thisoption. Clicking the Reset button at anytime returns the background to defaultsettings.
View menu
The View menu contains the options as described in Table 82.
Table 82. View menu options
Toolbar button Description
Grid Selecting Grid displays a grid in the CustomView.
Magnifier This option allows you to magnify one areaof your service model. To use this tool:
1. From the View menu, select Magnifier.
2. Click the area you want to see.
3. Click again and hold, and you can seethe "snapshot" of the area that youwanted magnify.
4. To turn off this feature, deselectMagnifier in the View menu.
Overview Use the Overview window to pan across adependency view when it is magnified. TheOverview window is especially useful forviewing complicated service models withmany service images. To learn how to usethis tool, see “Overview tool” for moreinformation.
Inspector Selecting this option opens the Inspector. Formore information, see “Working with theInspector” on page 350.
Toolbars You can set toolbar settings to display theView Definition toolbar, the Standardtoolbar, or both. Select or deselect Standardand View Definition to get the settings youwant.
Overview toolThis topic describes the overview tool.
About this task
The Overview tool gives you a more flexible Overview window. Use the Overviewwindow to pan across a dependency view when it is magnified. The Overviewwindow is especially useful for viewing complicated service models with manyservice images.
Use this tool as follows:
Viewing service models 239

Procedure1. Select the Overview tool from the View menu.
The Overview window is displayed in a new browser window.The red box within the Overview window is the overview area for the servicemodel. This overview area matches the viewable area of the service model inthe View Service tab. That is, the portion of the service model highlighted inthe overview area is displayed in the View Service tab.For example, if you click the Zoom-in button in toolbar, the overview areashrinks in proportion to the zoom level. You can also change the overview areasize from within the Overview window.
2. Use the Zoom-in, Zoom-out, or Zoom box buttons in the toolbar to change thesize of the overview area.
3. To change the size of the overview area from the Overview window, click anddrag one of the corner-selection blocks.
4. To change the position (focus) of the overview area, click and drag the red boxto the part of the service model you want to view.
Related concepts:“View Service and Template tabs” on page 31This topic describes the View Service and Template tabs in the Service Editor.Related reference:“View Service toolbar and menus” on page 234This topic describes the elements of the View Service toolbar and menu.
Quick FindThis topic describes the Quick Find function of the Service Editor/Viewer.
About this task
Quick Find allows you to search for services by name in the Service Viewer/Editorportlet. You can navigate between individual matches using the Previous and Nextbuttons.
To use the Quick Find:
Procedure1. Enter the name you want to find in the Quick Find field. See the table below
for valid wildcard characters.
Option Description
* This wildcard is used to match zero or morecharacters.
? This wildcard is used to match any singlecharacter.
2. Press Enter. The view automatically zooms to show all matches. You maychange the scope of the view by adjusting the zoom using buttons on thetoolbar.
3. Click Previous or Next to find what you want.
Note: If no service names match, the Quick Find field will turn red.
240 IBM Tivoli Business Service Manager: Service Configuration Guide

View service layout optionsThis topic lists the view service options. This topic also describes how to center aview for a service.
This section describes the layout options for the View Service tab. These optionslet you set the view type and dependency levels for a service-dependency view. Toset a layout, select one from Layout drop-down list. This section containsdescriptions of these layout options:v Basic Relationships viewv Business Impact viewv Business Impact All viewv Concentric viewv Grid viewv GIS viewv Relationships view
Centering a view for a service
To focus a view on a specific service, use the Re-Center View option. To center aview on a service:1. Right-click the service you want at the center of the view.2. Select Re-Center View from the menu that appears.
The display changes so that the selected service is at the center of the view.Related concepts:“View Service tab” on page 233This topic describes the View Service tab. This topic also describes how to displaythe View Service tab.
Basic Relationships viewThis topic describes the Basic Relationships view.
The Basic Relationships view shows the individual relationships between theservices and the subservices in a hierarchy. The Basic Relationships view onlyshows the top two levels of the model and does not include all the data theRelationships view displays (such as the event count and severity). As a result, thisview loads faster and consumes fewer resources than the Relationships view.
To set this layout, select it from Layout drop-down list.
Business Impact viewThis topic describes the Business Impact view.
The Business Impact view shows single branch of service relationships in a servicemodel. In this view, only critical or marginal services will be shown. Services witha good status will be invisible. When you select the Business Impact view for aservice at any level in the service model, a single branch of the model is displayedin the Service Viewer from bottom to top. The service you selected is at the bottomlevel when you use the Business Impact view. This view does not show siblingservices at any level in the model. You only see the direct child-parentrelationships, starting with the selected service at the bottom. Like the BasicRelationships view, the Business Impact view does not include all the data the
Viewing service models 241

Relationships view displays (such as the event count and severity). As a result, thisview loads faster and consumes fewer resources than the Relationships view.
To set this layout, select it from Layout drop-down list.
Business Impact All viewThis topic describes the Business Impact All view.
The Business Impact All view shows single branch of service relationships in aservice model. When you select the Business Impact All view for a service at anylevel in the service model, a single branch of the model is displayed in the ServiceViewer from bottom to top. The service you selected is at the bottom level whenyou use the Business Impact All view. This view does not show sibling services atany level in the model. You only see the direct child-parent relationships, startingwith the selected service at the bottom. Like the Basic Relationships view, theBusiness Impact view does not include all the data the Relationships view displays(such as the event count and severity). As a result, this view loads faster andconsumes fewer resources than the Relationships view.
To set this layout, select it from Layout drop-down list.
Concentric viewThis topic describes the Concentric view.
The Concentric view shows the relationship between the top-level service and eachindividual service in a concentric format. The service you selected from the ServiceNavigation portlet is at the center of the Concentric view. This view works wellwith complex service models.
To set this layout, select it from Layout drop-down list.
Grid viewThis topic describes the Grid view.
The grid view shows the service model without interconnecting lines. By default,the grid view only shows a single level of the service model.
To set this layout, select it from Layout drop-down list.
GIS viewThis topic describes the GIS view.
If you set the GIS coordinates for service, the GIS view shows the geographicalposition of the service with the service names on a map. The color of the iconindicates the service status.
To set this layout, select it from Layout drop-down list.
Relationships viewThis topic describes the Relationships view.
The Relationships view is the default view and shows the individual relationshipsbetween the services and the subservices in a hierarchy.
242 IBM Tivoli Business Service Manager: Service Configuration Guide

Displaying service detailsYou can display the following details about a given service from the View Servicetab or the Services tree in the Service Navigation portlet:v Events affecting the servicev The state of TBSM rules that affect the services statusv If a service has cumulative-time SLA settings, information about the SLA statusv Show ISM ReportRelated concepts:“View Service tab” on page 233This topic describes the View Service tab. This topic also describes how to displaythe View Service tab.
Editing service configuration dataThis topic describes how to edit service configuration data.
If you have permission to edit a service, you can display and edit the followingconfiguration information for a service from the Services tree or View Service tab.
Note: These options are only available on the Service Administration and ServiceConfiguration pages.
Editing service instance dataThis topic describes how to edit service instance data.
About this task
If you have permission to change the configuration of a service, you can open theEdit Service tab as follows:
Procedure1. Right-click the service in the services tree or the Service Editor.2. Select Edit Service Instance from the menu that appears. You can also display
this tab by clicking the Edit Service tab in the Service Editor.
Editing service template dataThis topic describes how to edit service template data.
About this task
If you have permission to change the configuration of a service's template, you canopen the Edit Template tab as follows:
Procedure1. Right-click the service from the services tree or the Service Editor.2. Select Edit Member Templates > Template Name from the menu that appears,
where Template Name is the name of the service template you want to edit.The Edit Template tab is displayed in the Service Editor.
Removing child service dependenciesThis topic describes how to remove child services from dependency models.
Viewing service models 243

About this task
You can remove child-service dependencies from the services tree or the ServiceEditor using the right-click menu options.
This procedure removes the service from the dependency model, but does notdelete the service from the TBSM database. To remove a child service from aservice-dependency model, complete the following steps:
Procedure1. Right-click the service instance you want to remove.2. Select Children > Remove as Child from the menu that appears.3. Select the template you want to remove.
The selected service is removed from the service-dependency model.
Sending test eventsThis topic describes how to send test events.
About this task
If a service has incoming status rules configured, you can send test ObjectServerevents from the View Service tab or the services tree. These test events let you seehow the dependency model responds to a given event or events. To send testevents, complete the following steps:
Procedure1. Right-click the service.2. Select Show > Send Test Event from the menu that appears.
Note: If you have more than one incoming status rule, Send Test Event willsend events that match the filters in the first rule only. If you have multiplerules, use the rad_sendevent script, as described in the TBSM Administrator'sGuide.The Event Fields window is displayed in a dialog that pops up. The fields inthis window match the identification and output threshold fields defined in theservices template.
3. Enter the field values you want for your test event.4. Click OK.
The test event is sent to the ObjectServer.5. Confirm that the event has been sent by clicking the service in the View
Service tab.The test event appears in the table in the Events tab of the Service Detailswindow.
244 IBM Tivoli Business Service Manager: Service Configuration Guide

Urgent Services portlet
The Urgent Services portlet displays a list of all services that have a status ofcritical.
Urgent status threshold
By default, the Urgent Services portlet displays services with a status of bad (5).You can set your preferences to filter Urgent Services by severity or taggedtemplate. For information about changing the urgent status threshold, see theTBSM Administrator's Guide.
Urgent Services update frequency
By default, the Urgent Services portlet updates every 30 seconds. You can set yourpreferences to use a different update frequency. For information about changingthe urgent services update frequency, see the TBSM Administrator's Guide.
Adding the Urgent Services portlet
By default the Urgent Services portlet only displays on the Service Availabilitypage; it does not display in the Service Administration page on the TBSM console.To add this portlet to a page, an administrator needs to add the Urgent Servicesportlet to a page, such as the Service Administration page. For information aboutadding the Urgent Services portlet, see the TBSM Administrator's Guide.
Showing an urgent service in other portlets
You can display one of the listed services in context in the other portlets byclicking anywhere on the row of the service name.
Urgent Services portlet elements
The Urgent Services portlet lists the services with an urgent status and the lasttime the service status changed.
Table 83. Urgent Services portlet elements
Element name Description
Service column The service names display in this column. You can sortthe service names alphabetically when you click Servicein the title row for this column. You can switch betweenascending and descending sort order when you click theup/down arrow. To display a service in the ServiceViewer or update other portlets with data from a service,click the service name in this column.
State column The status of the services displays in this column. You cansort the service names by status when you click State inthe title row for this column. You can switch betweenascending and descending sort order when you click theup/down arrow.
© Copyright IBM Corp. 2008, 2013 245

Table 83. Urgent Services portlet elements (continued)
Element name Description
Last Changed column This column shows the last time the status of the servicechanged. You can sort the service names by time whenyou click Last Changed in the title row for this column.You can switch between ascending and descending sortorder when you click the column name again.
Selectable Rows To show a service in the service viewer, click the servicename.
Urgent Services preferencesThis topic describes how to use the Urgent Services preferences.
The Urgent Services preference window allows you to filter the services in theUrgent Services portlet. You can set your preferences to filter services by severityor template.
To access Urgent Services preferences:1. Open a page containing an Urgent Services portlet.
Note: The Service Availability page contains the urgent services portlet bydefault.
2. Click Edit Options in the title bar.3. Select Personalize.
The Urgent Services preferences window opens. The General tab shows bydefault.
4. Set your preferences using the table below as a guide.
Table 84. Urgent Services preferences guidelines
Tab Description
General This tab lets you specify a name for theportlet. This tab also allows you to set therefresh interval (in seconds) for the portlet.
Filtering This tab lets you filter by severity andtemplate. See “Urgent Services preferencesFiltering tab” for more information.
5. To save your new preferences, click Save.
Note: If you want to return to the system defaults for the portlet, click Restoredefaults.
Urgent Services preferences Filtering tabThis topic describes the elements on the Urgent Services preferences Filtering tab.
The Urgent Services preference window allows you to filter services by:v Severityv Template
The defaults for each option in the Filtering tab are described in the table below.
246 IBM Tivoli Business Service Manager: Service Configuration Guide

Table 85.
Option Description Default Setting
Filter by Severity This option will filter theportlet results with servicesthat are only Bad, onlyMarginal, or both.
Bad is selected.
Filter by Template This option will filter theportlet results to only showservices tagged with thetemplates you select.
No templates are selected.
To change these options, follow these steps:1. Select the severity filter in the urgent services portlet, select Bad, Marginal, or
both to get the setting you want. The table below describes these options:
Table 86. Severity options
Service state you want to view Settings
Bad This setting is the default. Select the Badcheck box only.
Marginal Select the Marginal check box only.
Bad and Marginal Select both Bad and Marginal check boxes.
2. To filter by template, select a template from the list of templates. The tablebelow describes template options:
Table 87. Template options
Services you want to view Description Settings
Services tagged by template The services shown must betagged with at least one ofthe templates chosen on thispanel (and match theseverity as well). Forexample, selecting TemplateA and Bad – the only servicesshown in urgent services willbe services with a state ofBad that have been taggedwith Template A.
Select the templates youwant the portlet to be filteredwith. You can choose morethan one template to match.
Primary template only The template selected fromthe list must be the primarytemplate for the services youwant to see.
Select the Primary templateonly check box.
3. To save your new preferences, click Save.
Note: If you want to return to the system defaults for the portlet, click Restoredefaults.
Urgent Services portlet 247

248 IBM Tivoli Business Service Manager: Service Configuration Guide

Right-click menus
Right-click menus give you quick access to many of the editing functions in IBMTivoli Business Service Manager (TBSM). The menus are accessible from theService Navigation portlet and the Service Editor.Related concepts:“View definition action examples” on page 296This topic describes how to create and edit actions.
About the right-click menusThis topic describes right-click menus.
Many of the TBSM functions that are available in many parts of the system arealso available by right-clicking a service either in the Service Navigation portlet,Service Tree, the Service Editor, or the Service Viewer. Not all right-click menuoptions are available on every portlet.
Note: The set of menu options are reduced if a Service Editor portlet is not on thepage. Certain actions that require the Service Editor portlet will not be available.
TBSM has the following default right-click menu options:v Edit Service Instancev Children
The Children option has a submenu containing the Remove as Child option.v Edit Member Templates
The Edit Member Templates option has a submenu containing the templatesthat can be edited.
v ShowThe Show option has the following submenu selections:– Service Affecting Events (Table)– Service Affecting Events (AEL)– Show Rule Status– Show Root Cause Events– Show SLA Chart for Children– Show SLA Chart for Service– Send Test Event– ISM Service Report Viewer– Show 30-Day History– Compare Service Metrics
v Launch toThe Launch to option has a submenu containing launch options to otherexternal applications. This list is dynamic, and what is shown varies fromresource to resource. The Launch to option may have the following submenuselections:– Show Managed Systems (Tivoli Enterprise Portal)– Show Application Server (ITCAM for SOA)
© Copyright IBM Corp. 2008, 2013 249
– Show HOP View (ITNM)– Show Physical Topology (Tivoli Application Dependency Discovery Manager)– Show Change History (Tivoli Application Dependency Discovery Manager)– View Incidents (SRM)– Open Process Request (CCMDB)– View Changes (CCMDB)– Show Storage Topology (Tivoli Storage Productivity Center)
v Maintenance window toolsThe Maintenance option has the following submenu selections:– Schedule Maintenance– Remove from Maintenance
You can add to and edit these options, called "Right-Click Actions," for customviews of your service configuration. The actions you add or modify will only bevisible from the defined custom view. They will not be available from the defaultview or when right-clicking the services in the Service Navigation portlet.
Edit Service Instance actionThis topic describes Edit Service Instance action.
The Edit Service Instance action opens the Service Editor for the selected service.
Children actionsThis topic describes Children actions.
From the Children menu option, you can select the Remove as Child option.
Remove as Child action
This menu option allows you to remove the selected instance as a child of aservice. To remove a child service, follow these steps:1. Select this menu option. A submenu with a list of parent services for the
selected service opens.2. Choose the parent service you want the selected child service removed as a
dependent. The child service is removed from the parent-specific servicedependency model.
Edit Member Templates actionThis topic describes Edit Member Templates action.
Selecting the Edit Member Templates menu option allows you to edit anytemplates that this service has been tagged with.
When you select a template, the Edit Template window opens in the Service Editor.
250 IBM Tivoli Business Service Manager: Service Configuration Guide

Show actionsThis topic lists the actions available from the Show right-click menu.
From the Show menu options, you can select the following actions:v Service Affecting Events (Table)v Service Affecting Events (AEL)v Show Rule Statusv Show Root Cause Eventsv Show SLA Chart for Childrenv Show SLA Chart for Servicev Send Test Eventv ITCAM for Internet Service Monitoring Report Viewerv Show 30-Day History
Service affecting events (table) optionThis topic describes Service affecting events (table) option.
When you select the Service Affecting Events (Table) option from the Show menu(when you have event-based incoming status rules set up for the selected service),the events display in table format in the Events tab of the Service Details portlet.This selection does not work for incoming status rules based on an SQL datafetcher.
Service Affecting Events (AEL) optionThis topic describes Service affecting events (AEL) option.
When you select the Service Affecting Events (AEL) option from the Show menu(when you have event-based incoming status rules set up for the selected service),the events display in an Active Events List. This option does not work forincoming status rules based on an SQL data fetcher.
Show Rule Status optionThis topic describes Show Rule Status option.
When you select the Rule Status option from the Show menu, the rules display intable format in the Rules tab of the Service Details portlet. The TBSM events aregenerated any time the status of a service changes. It changes the status based onformula and aggregation rules as well as incoming status rules.
Show Root Cause EventsThis topic describes Show Root Cause Events option.
When you select the Root Cause Events option from the Show menu (when youhave event-based incoming status rules set up for the selected service), the rootcause events display in table format in the Events tab of the Service Details portlet.The root cause events are the events that cause the service's status to change.
Show SLA chart for childrenThis topic describes Show SLA chart for children option.
Right-click menus 251
When you select the SLA Chart for Children option from The Show menu, thechart displays in a new browser window. This option is grayed-out when you donot have SLA settings set for the service.
Show SLA chart for serviceThis topic describes Show SLA chart for service option.
When you select the SLA Chart for Service option from The Show menu, the chartdisplays in a new browser window. This option is grayed-out when you do nothave SLA settings set for the service.
Send test eventThis topic describes Send test event option.
You can send a test event when you want to test your service configuration andtheir related incoming status rules. Do not use this option if you have more thanone event-based incoming status rule set for the services tagged with a template.Instead, use the rad_sendevent script. For more information about this script, seethe IBM Tivoli Business Service Manager: Administrator's Guide.
Internet Service Monitoring Report viewerThis topic describes ISM Service Report Viewer option.
If you have provisioned a monitor for a service, you can view an Internet ServiceMonitoring report for that service. To see ITCAM for Internet Service Monitoringreports:1. Right-click on a service in the service tree or Service Editor for which you have
a monitor provisioned.2. Select Show.3. Select ISM Service Report Viewer from the Show menu.
Show 30-day historyThis section describes the option that lets you launch the Service Outage Detailreport.
This option launches the Service Outage Detail report for the selected service in anew browser window.
Compare Service MetricsThis topic describes Compare Service Metrics option.
This option launches the Time Window Analyzer Compare frame. The service youselected is automatically selected in the Compare frame to view in the chart, andhistory for that service.
Launch to other Tivoli consolesThis topic describes the Launch to option.
The Launch to menu has launch options to other external applications such asTivoli Enterprise Portal and Tivoli Application Dependency Discovery Managerconsoles. This list of options is dynamic, and what is shown varies from resourceto resource. This menu option is only applicable to services that have been
252 IBM Tivoli Business Service Manager: Service Configuration Guide

imported with the Service Component Repository. All other services will not havethis option enabled in the Service Navigation portlet.
If a service contains data about a Tivoli Enterprise Portal and Tivoli ApplicationDependency Discovery Manager server, these options will be enabled in theLaunch to menu. The CCMDB options (Show CI details and Open Service Request)will not initially appear on the submenu. You need to set the CCMDB host data inthe RAD_sla.props file and recycle the dashboard server for those options toappear. They will only be enabled for those services that have been discoveredwith the Discovery Library Toolkit from the Tivoli Application DependencyDiscovery Manager. When you select one of these options, the Tivoli ApplicationDependency Discovery Manager and Tivoli Enterprise Portal console open in anew browser window.
For more information about these launch options, see the topic "Launching to andfrom Applications" in the IBM Tivoli Business Service Manager: Customization Guide.
Maintenance window toolsThis section describes the options that let you change the maintenance status for aservice.
The maintenance window tools let you perform the following actions:v Quickly change the maintenance period for a service. You can also set the scope
of the schedule by choosing to set the schedule for all its related services as well,or for the related services only.
v Quickly remove the maintenance status from the service. You can set the scopeof the removal for this option as well.
Right-click menus 253

254 IBM Tivoli Business Service Manager: Service Configuration Guide

TBSM reports
The Tivoli Common Reporting (TCR) home page provides links that open variousreport packages.
You can load the TBSM reports using the install scripts described in the Installingthe Historical Reports section of the TBSM Installation Guide. Tivoli CommonReporting provides options to view and save the report output in a range offormats, for example HTML and PDF. For more information about configuringreports, and for information about the full range of tasks that you can perform, seethe Tivoli Common Reporting Information Center or the Custom Reports section ofthe IBM Tivoli Business Service Manager: Customization Guide. Cognos reports can becustomized with the Report Studio. See the Tivoli Common Reporting User's Guidefor more information about report customization.
Run TBSM reportsThis section describes how to open the TBSM report package and how to runreports.
Before you begin
The TBSM reports include reports developed with Cognos technology in TivoliCommon Reporting. Tivoli Common Reporting provides additional functions thatenable you to customize the Cognos reports. To access the TBSM reports, thereporting package must be installed on the Tivoli Common Reporting server asdescribed in the TBSM Installation Guide.
About this task
Log in to the dashboard where the Tivoli Common Reporting report engine exists.
Procedure1. In the navigation pane on the left side of the window, click the + beside
Reporting to expand the tree.2. Click Common Reporting. The Tivoli Common Reporting report navigation
pane opens.3. To view the IBM Tivoli Business Service Manager History Agent report
package, containing the TBSM Cognos reports, expand the navigation tree andclick IBM Tivoli Business Service Manager History Agent.
Note: To view the deprecated BIRT reports, click the Tivoli Products � TivoliBusiness Service Manager v6.1.
4. Under Tivoli Business Service Manager, there are three report sets: DetailHistory Reports, Summary History Reports, Top Level History Reports. Clickthe report set that you require. In the Reports table, a list of reports ispopulated.
5. To display the report in HTML format, click the report name and provide therequested parameters. To display a menu of other output formats, click Runwith options button to the right of the report name. You can select a report
© Copyright IBM Corp. 2008, 2013 255

option to schedule the report. For more information about report options, seethe IBM Tivoli Common Reporting User's Guide.
6. To specify a specific date range for the Cognos reports, select the Date Rangeoption from the list and then specify the start and end date in the date widgets.
Note: To specify a specific date in the deprecated BIRT reports, select thecheckbox next to Start Time and End Time widgets.
7. If you want to select a date option other than a specific date, select an option inthe Date Range pull-down.
8. Click Finish. The report is formatted and displayed.
What to do next
For information about how you can customize the reports shipped with TBSM orcreate your own custom reports and use them alongside the TBSM reports, see theTBSM Customization Guide.
TBSM Average Outage Duration reportThis report shows the average duration of outages for each top-level service.
Description
This report shows the average duration of outages for each top level service, aservice with no parent. The average is shown for the period including the 7 days,30 days, and 90 days prior to the end date of the report.
Parameter
When you run this report, you can specify this parameter:
Report End DataUse this parameter to select the end date for the report.
TBSM Average Daily Outage Count reportThis report shows the average number of outages per day for each top-levelservice.
Description
This report displays the number of outages per day for each top-level service thatexperienced an outage. Top-level services are services that do not have a parent.The value displayed is the number of service outages divided by the number ofdays in the time period. The value displayed is rounded to 1 decimal place. Forexample, if a service had 3 outages in the previous 7 days, the value displayedwould be 3/7 = 0.4.
Parameter
When you run this report, you can specify this parameter:
Report End DateUse this parameter to select the end date for the report.
256 IBM Tivoli Business Service Manager: Service Configuration Guide
TBSM Service Outage Average Duration chartThis report shows the average duration of outages recorded by TBSM during thereport period.
Description
The chart shows a bar representing the average duration for the total number ofoutages next to the name of the affected service. The table displayed for this reportlists the affected services and durations grouped by the status level.
Parameter
When you run this report, you can specify this parameter:
Date RangeUse this parameter to select the time interval for the report. Select a timeinterval from the list provided. If you choose Date Range (below), you mustspecify values in the Start Date and End Date fields.
TBSM Service Outage Count Summary reportThis report shows the number of outages recorded by TBSM during the reportperiod.
Description
The report displays a count of outages for each service that has a status of bad. Achart displays the count for each service. Click on any service listed in the chart toreview the Service Outage Details report for that service. The date range shown inthe Service Outage Details report reflects the range chosen for the TBSM ServiceOutage Count Summary report.
Parameter
When you run this report, you can specify this parameter:
Date RangeUse this parameter to select the time interval for the report. Select a timeinterval from the list provided. If you choose Date Range (below), you mustspecify values in the Start Date and End Date fields.
TBSM Service Path Outage Summary reportThis report shows the number of outages recorded by TBSM during the reportperiod for each service.
Description
This report shows the number of outages for each service in your model based onthe parameters you specify.
Parameters
When you run this report, you can specify these parameters:
TBSM reports 257

Date RangeUse this parameter to select the time interval for the report. Select a timeinterval from the list provided. If you choose Date Range (below), you mustspecify values in the Start Date and End Date fields.
Top Level PathYou can limit the report to the subset of services under a portion of the servicehierarchy tree by specifying the path, starting from the top of the tree, to theportion that you want to include in the report. The default value of All showsoutages for all the paths. A list of the service hierarchy paths is provided.
SeverityYou can limit the status events displayed based on the severity. Choosing 0displays all status changes. A Marginal status severity is determined by a valueof 3 and critical status severity is determined by a value of 5.
Note: To display a report for a specific service, use the TBSM Service OutageDetail report. To see the TBSM Service Outage Detail Report for a given service,click the status time within the list for the service.
TBSM Top Level Path Status Changes reportThis report displays a list of service status changes, recorded by TBSM for thespecified Top Level Path, ordered by date.
Description
Each row in the table shows the service affected, the time of the status change, thenew status, the previous status, and a path from the root of the service tree to theaffected service. The duration of the outage is show if the outage has ended, that itto say, if the current status is good.
Parameters
When you run this report, you can specify these parameters:
Date RangeUse this parameter to select the time interval for the report. Select a timeinterval from the list provided. If you choose Date Range (below), you mustspecify values in the Start Date and End Date fields.
Top Level PathThe Top Level Path parameter specifies the service hierarchy path for thedisplayed services. Select a specific path or select All to view all paths.
TBSM Service Outage Duration reportThis report displays a list of service outages that have ended for the specified TopLevel Path. The service outages are ordered by duration.
Description
Each row in the table shows the service affected, the time of the status change, thenew status, the previous status, the duration of the outage, and a path from theroot of the service tree to the affected service.
258 IBM Tivoli Business Service Manager: Service Configuration Guide

Parameters
When you run this report, you can specify these parameters:
Date RangeUse this parameter to select the time interval for the report. Select a timeinterval from the list provided. If you choose Date Range (below), you mustspecify values in the Start Date and End Date fields.
Top Level PathThe Top Level Path parameter specifies the service hierarchy path for theservice affected by an outage. Select a specific path or select All to view allpaths.
TBSM Service Affecting Events reportThis report in Tivoli Common Reporting shows the events that might havetriggered service outages reported in TBSM for the specified service.
Description
The table lists the time of the event, the time its state changed, the event identifierand the event summary message.
Parameters
When you run this report, you can specify these parameters:
Date RangeUse this parameter to select the time interval for the report. Select a timeinterval from the list provided. If you choose Date Range (below), you mustspecify values in the Start Date and End Date fields.
Service NameSpecify the service name. Select the service name you want from the listprovided.
Top Level PathThe Top Level Path parameter specifies the service hierarchy path for theselected service. Select a specific path or select All to view all paths.
TBSM Service Outage Details reportThis report shows the outages recorded by TBSM for a single service.
Description
The table shows the details of the status changes, including the time at which thestatus change occurred in TBSM, the new status, the previous status and theduration of the outage if this row represents a change from bad status. You canclick the status time value in a row to display a report showing the events thatmight have triggered the status change for this service. When you display theService Affecting Events report this way, it only includes events that occurred atabout the same time as the outage time.
Parameters
When you run this report, you can specify these parameters:
TBSM reports 259
Date RangeUse this parameter to select the time interval for the report. Select a timeinterval from the list provided. If you choose Date Range (below), you mustspecify values in the Start Date and End Date fields.
Service NameSpecify the service name. Select the service name you want from the listprovided.
Top Level PathSelect the service hierarchy path for the service name.
TBSM Top Service Outage Average Duration chartThis report shows the services with the highest average outage duration recordedby TBSM.
Description
The chart shows a bar representing the total outage duration next to the name ofthe affected service. The tabular part of the report lists affected services and outageduration totals grouped by status level. You can click on the service in the tabulardata to view the Service Outage Detail for the service.
Parameters
When you run this report, you can specify these parameters:
Date RangeUse this parameter to select the time interval for the report. Select a timeinterval from the list provided. If you choose Date Range (below), you mustspecify values in the Start Date and End Date fields.
Row LimitSelect the number of services shown in the report. The number of servicesshown is determined by the Row Limit. However, any services that have thesame average outage duration as the last item defined by the Row Limit arealso displayed.
TBSM Top Service Outage Count Summary chartThis report shows the services with the highest number of outages recorded byTBSM.
Description
The chart shows a bar representing the count next to the name of the affectedservice. The tabular part of the report lists affected services and counts grouped bystatus level.
Parameters
When you run this report, you can specify these parameters:
Date RangeUse this parameter to select the time interval for the report. Select a timeinterval from the list provided. If you choose Date Range (below), you mustspecify values in the Start Date and End Date fields.
260 IBM Tivoli Business Service Manager: Service Configuration Guide
Row LimitSelect the number of services shown in the report. The number of servicesshown is determined by the Row Limit. However, any services that have thesame outage count as the last item defined by the Row Limit are alsodisplayed.
BIRT reportsSupport for Business Intelligence and Reporting Tools (BIRT) reports has beendeprecated in TBSM 6.1.1. However, the BIRT reports provided previously withTBSM are available for use. An equivalent Cognos report is available for each ofthe BIRT reports. This TBSM BIRT reports are:
Average Outage Duration reportThis report shows the average duration of outages for each top-levelservice.
Average Daily Outage Count reportThis report shows the average number of outages per day for eachtop-level service.
Top Service Outage Average Duration chart reportThis report shows the services with the highest average outage durationrecorded by TBSM.
Service Outage Average Duration Chart reportThis report shows the average duration of outages recorded by TBSMduring the report period.
Top Service Outage Count Summary chart reportThis report shows the services with the highest number of outagesrecorded by TBSM.
Service Outage Count Summary Chart reportThis report shows the number of outages recorded by TBSM during thereport period.
Service Outage Summary Table reportThis report shows the number of outages recorded by TBSM during thereport period for each service.
Service Status Changes reportThis report shows a list of service status changes recorded by TBSM,ordered by date.
Service Outage Duration reportThis report shows a list of service outages that have ended, ordered byduration.
Service Affecting Events reportThis report shows the events that triggered service outages reported inTBSM, grouped by service names.
Service Outage Detail reportThis report shows the outages recorded by TBSM for a single service.
TBSM reports 261

262 IBM Tivoli Business Service Manager: Service Configuration Guide

Custom service trees
This section describes how to create custom Service trees in the Service Navigationportlet.
About custom service treesThis topic describes custom service trees in the Service Navigation portlet.
IBM Tivoli Business Service Manager (TBSM) lets you modify the columns incustom trees in both Service Navigation and Service Tree portlets.
Note: This topic only describes the Service Navigation portlet custom trees. See“Customizing the Service Tree” on page 229 for information about customizing theService Tree.
The default Service Navigation portlet Services tree has three columns: State, Time,and Events. You can modify, delete, and add tree columns with the Tree TemplateEditor. The Tree Template Editor is available from the Services toolbar in the ServiceNavigation portlet. For each custom column, you use the Tree Template Editor tospecify the rule data you want to display in the column.
You cannot change what Tree Template is assigned to the service tree in the ServiceNavigation portlet. You can assign a different tree template to trees in the ServiceTree portlet by editing the portlet preferences. This allows you to create pages withmultiple service tree portlet instances, each with its own custom tree template.
Figure 44 shows a Services tree customized to display a fourth column calledTickets. This column displays the number of trouble tickets for a service, based onthe output of numerical rules in the template assigned to the service.
Figure 44. Example custom tree
© Copyright IBM Corp. 2008, 2013 263

Before you edit tree templates
Before you edit the tree templates for TBSM, you must configure the data sources,data fetchers, and service templates with numeric aggregation rules to collect thedata you want to display in your custom service-tree columns.
When you set up your data source, your data fetcher to select the data you want,and configure your service templates and rules, you can configure a custom servicetree to display the rule data.
Note: If you change rule or template names, you can cause issues with otherfeatures of TBSM. TBSM uses these names to reference the rule values for otherrules, such as auto-population or ESDA rules and for custom displays such asservice trees and view definitions.
If you want to change a rule or template name, change the name before you usethe rule or template elsewhere in TBSM.
For example, when you create numerical and text-based rule, you need to create acustom service tree or view definition to display the output of the rule in theTBSM console. The trees and view definitions use the template and rule names tomap the rule values to a display object. As a result, if you change the name of arule or a template used in a custom display, the custom tree or view definition willno longer display the rule values properly.
Getting started with the Tree Template editorThis topic describes the Tree Template editor configuration settings. This topic alsodescribes the features of the Tree Template editor: column configuration, servicetemplate selection, service template rule mapping, and how to view custom trees.
The Tree Template Editor allows you to modify the appearance of the columns fortrees in TBSM that have been assigned the tree template being edited in the ServiceNavigation portlet. This section describes how to open the Tree Template Editor andmodify the settings within the editor.
Tree template configuration settings
The Tree Template Name drop-down list in the Tree Template Editor lets you specifythe tree template you want to edit. By default, TBSM includes three tree templates:v The ServiceInstance tree template defines layout of the Services in the Service
Navigation portlet. This tree template defines the State, Time, and Eventscolumns.
Note: If you modify this tree template, you will be modifying the view of allTBSM trees (unless they have been assigned a different template).
v The ServiceTemplate tree template defines layout of the Templates in theService Navigation portlet. This tree template contains no column definitions.
v The ServiceComponentRepository tree template defines the layout for the ServiceComponent Repository tree in the Service Navigation Portlet. This tree templatecontains no column definitions and should not be edited.
264 IBM Tivoli Business Service Manager: Service Configuration Guide

Column configuration
The TBSM Tree Template Editor lets you add, change, and delete the columns in agiven tree template.
Service template selection
The TBSM Tree Template Editor lets you specify the service templates that you wantto use for your service tree-column data. The Default Tag template contains therules for the default Services tree.
Service template rule mapping
When you add a rule to a column, you select the service template, the rule, andthe service-tree column that displays the rule data.
Viewing custom trees
After modifying a tree template for a given tree, you need to refresh the portletthat contains the tree.
Opening the Tree Template EditorThis topic describes how to open the Tree Template Editor.
About this task
To open the Tree Template Editor:
Procedure1. From the Service Navigation portlet, select Services from the drop-down menu.2. Click the Tree Template Editor button.
The Tree Template Editor opens as shown in Figure 45 on page 266.
Custom service trees 265

Related concepts:“Services” on page 23This topic describes the elements in Services in the Service Navigation portlet.“Incoming status rules overview” on page 79This topic describes incoming status rules.“Good, marginal, and bad incoming status rules” on page 83This topic describes good, marginal, and bad incoming status rules.“Good, marginal, and bad aggregation rules overview” on page 95This topic describes good, marginal, and bad aggregation rules.“Service Administration Overview” on page 215This topic describes how to use the Service Administration page to view services.“Customizing the Service Tree” on page 229This topic describes how to customize the Service Tree by customizing columns,using sort options, and the Find tool.Related reference:“About tree columns” on page 268This topic describes tree columns. This topic also describes the ColumnConfiguration toolbar.
Working with tree templatesThis topic describes how to select, add, delete, and display a tree template.
About this task
The Tree Template Name list in the Tree Template Editor lets you specify the treetemplate you want to edit. You can select, add, and delete tree templates.
Figure 45. Tree Template Editor
266 IBM Tivoli Business Service Manager: Service Configuration Guide

Related tasks:“Adding a tree column” on page 269This topic describes how to add a tree column.“Deleting columns” on page 270This task describes how to delete tree template columns in TBSM.Related reference:“About tree columns” on page 268This topic describes tree columns. This topic also describes the ColumnConfiguration toolbar.
Selecting a tree templateAbout this task
To select a tree template, choose the tree template you want to modify from theTree Template Name drop-down list.
Adding a tree templateAbout this task
To add a new tree template:
Procedure1. Click the Add New Tree Template button.
The Create New Tree Template window opens.2. Type the name you want for the new tree template.3. Click Apply.
The Create New Tree Template window closes and the new tree templateappears in the Tree Template Name drop-down list.
Deleting Tree TemplateAbout this task
To delete a tree template:
Procedure1. Select the tree template you want to delete from the Tree Template Name
drop-down list.2. Click the Delete Tree Template button.
Displaying the Tree TemplateAbout this task
To display a custom tree, you need to add a service tree portlet to a page, andselect the custom tree template.
Procedure1. Create or edit a page using the Page Management feature. For more
information about creating a custom page using the Page Management feature,see the IBM Tivoli Business Service Manager: Scenarios Guide.
2. Add a Service Tree portlet to the page:
Custom service trees 267

a. Click a custom page in the left navigation pane. The page displays on theright.
b. From the Select Action drop-down list, click Edit Page.c. From the icons on the Service Tree title bar, click the Vertical Split button.
The Portlet list displays.d. Select Service Tree as the Portlet Entity Title and click OK.e. Click Save. The Page Management page displays.f. Click Save. The updated custom page displays.
3. Click Edit Options in the title bar and select Edit Shared Settings from themenu that displays.
4. Select a tree template from the Tree Template drop-down list on the View tab.5. Optional, select a default Starting Instance for the portlet.
What to do next
For more information about how to display a user-defined tree in TBSM, see theIBM Tivoli Business Service Manager: Scenarios Guide.
About tree columnsThis topic describes tree columns. This topic also describes the ColumnConfiguration toolbar.
Working with tree columns
The TBSM Tree Template Editor lets you add, change, and delete the columns in agiven tree template. Before you can proceed with this step, you need to select thetree template you want to modify. To see the changes made to the columns, youmust save the tree template and refresh the Service Navigation portlet after youhave saved the changes.
Column Configuration toolbar
Table 88 describes the buttons in the Column Configuration toolbar.
Table 88. Column Configuration toolbar buttons
Button Button name Description
Add New TreeColumn
Adds a new tree column.
Select All Selects all columns for deletion.
Deselect All Clears the selection check boxfor all columns.
Delete Selected Deletes all the selected columns.
268 IBM Tivoli Business Service Manager: Service Configuration Guide

Table 88. Column Configuration toolbar buttons (continued)
Button Button name Description
Enable Static Sizingfor Tree Template
By selecting the Enable StaticSizing for Tree Templatecheckbox, you can specify thesize of each individual column.
By default, the checkbox is notselected. Columns are sizedinitially to fit within the ServiceTree boundary. As you resize thecolumns, those values areapplied to the columns anytimeyou access the instance of theService Tree portlet.
After you select the EnableStatic Sizing for Tree Templatecheckbox, click the LaunchColumn Sizing Tool button.From the Column Width Sizingtool dialog, you can configurethe static size configuration ofthe columns in either pixels orpercentages.Note: If the pixel widthspecified is greater than thewidth of the portlet, it will notbe possible to view or scrollthrough the rows in the ServiceTree properly.
Related concepts:“Customizing the Service Tree” on page 229This topic describes how to customize the Service Tree by customizing columns,using sort options, and the Find tool.Related tasks:“Working with tree templates” on page 266This topic describes how to select, add, delete, and display a tree template.“Opening the Tree Template Editor” on page 265This topic describes how to open the Tree Template Editor.
Adding a tree columnThis topic describes how to add a tree column.
About this task
To add a tree column, complete the following steps:
Procedure1. From the Column Configuration section, click the Add New Tree Column
button.A blank column is added to the Column Configuration table.
2. Type the name you want to use in the blank field for the new column.3. Click OK to save the new column.
Custom service trees 269

The new column is saved and the Tree Template Editor closes. When you openthe Tree Template Editor, it shows the new column.
Related tasks:“Working with tree templates” on page 266This topic describes how to select, add, delete, and display a tree template.
Changing a tree column name and positionThis topic describes how to change a tree column name and position.
About this task
You can change the name and the position of a given tree column.
To change the column position, use the arrows next to the column name text fieldto move the columns left and right.
Changing the column nameAbout this task1. To change the name of a column, click the text field for the column name and
edit the text.2. When you are finished editing the text, click OK to save your changes.
Deleting columnsThis task describes how to delete tree template columns in TBSM.
About this task
You can delete tree template columns by selecting the columns you want to deleteand clicking the Delete Selected button.
To select and delete columns, complete the following steps:
Procedure1. To select a single column, click in the check box next to the column name. To
select all the columns for deletion, click the Select All button.2. To clear the selection check box for a column, click check box for the selected
column. To clear the selection check box for all columns, click the Deselect Allbutton.
3. To delete the selected column or columns, click the Delete Selected button.4. Click OK to save your changes.Related tasks:“Working with tree templates” on page 266This topic describes how to select, add, delete, and display a tree template.
Selecting service templates for a tree templateThis task describes how to select service templates for a tree template in TBSM.
About this task
The TBSM Tree Template Editor lets you specify the service templates you want touse for your service-tree column data. The Default Tag template contains the rules
270 IBM Tivoli Business Service Manager: Service Configuration Guide

for the default Services tree. After you select a service template, you map templaterule output values to display in a service tree column.
Before you select the service templates you want to use for the custom-service tree,you need to select the tree template you want to modify.
Service templates and tree templatesThis topic describes the relationship between service templates and tree templates.This topic also describes template selection elements.
The TBSM Tree Template Editor lets you specify the service templates you want touse for your service-tree column data. The Default Tag template contains the rulesfor the default Services tree. After you select a service template, you map templaterule output values to display in a service tree column.
Before you select the service templates you want to use for the custom-service tree,you need to select the tree template you want to modify.
Template selection elements
Table 89 describes the elements of the Template Selection part of the Tree TemplateEditor.
Table 89. Service Template selection elements
Element Description
Available Templates list List of service templates configured on your system.
Select Template button >> Click this button to move service templates to theSelected Templates list.
Deselect Template button << Click this button to remove service templates from theSelected Templates list.
Selected Templates list List of service templates you have selected for the servicetree column display.
Template rules and tree columnsThis topic describes the relationship between template rules and tree columns.
The TBSM Tree Template Editor lets you specify the rules you want to use to displaydata in a given service-tree column. First you select the service template and thenyou select the rules you want to use to display data in a given service-tree column.You can assign multiple rules to a column and select which one to display. Thecolumn displays data from the rule for any service instance that is assigned to theselected service template.
You can display the output for both incoming status and aggregation rules in yourcustom-service-tree column. However, it is typically best to display the output of anumeric-status rule or a numerical formula rule in your column. When you usethese rule types, your column displays a number value that measures the status ofthe service.
For each level of your service model, you can assign a different rule to yourcustom-service-tree column. For example, if you want to display a count of trouble
Custom service trees 271

tickets by geographical region and by service name, you configure the column todisplay the output of rules that count the trouble tickets for each service andregion.
Adding a template rule to a columnThis topic describes how to add a template rule to a column.
About this task
The Active Template list contains the service templates you selected for yourcustom service tree. To add a rule to a service-tree column:
Procedure1. In the Active Template list, click the service template you want to use for the
service-tree column.2. For each rule you want to use, select the service-tree column for the rule using
Table 90 as your guide.
Table 90. Available Rules table rows
Column Description
Display check box Select this check box to display a column in yourcustom-service tree. You can assign multiple rules to acolumn and select which one to display.
Attribute Name The name of the service-template rule that provides thedata for a given column. The output from the selected ruledisplays in the tree column you select for the rule.
Type The type of rule. The incoming status and aggregation rulesfor a template can be used for a service-tree column.
Column Display Namedrop-down list
The name of the column that displays the rule output. Tohave custom column added to this drop-down list, youmust add the column. Select the column that will be usedto display the data for the rule.
3. Click Ok to save the updated tree template configuration.TBSM saves the tree-template configuration and the Tree Template Editor closes.To view the updated Services tree, refresh the Service Navigation portlet.
4. To change the tree-template configuration, click the Tree Template Editorbutton.
Working with reserved column namesThis topic describes the default reserved column names, names and color valuethresholds for tickets columns, revenue column format, percentage column format,customer column format, baseline column format, and state column format. Thistopic also has information about changing the default reserved column names.
TBSM includes a set of default reserved column names that either color code orconvert the numerical values in the columns. You can find the reserved columnname mappings in the policy named RAD_GetTreeColumnValue.ipl in the$TBSM_DASHBOARD_SERVER_HOME/policy directory.
The behavior of these default reserved column name types is described in Table 91on page 273.
272 IBM Tivoli Business Service Manager: Service Configuration Guide

Table 91. Default reserved column name behavior
Default reserved column nametypes Description
Color coding for Ticketscolumns
For Tickets columns, the color of the values displayed inthe column changes is based on the numbers in thecolumn. For example, if you have a column named TotalTickets, the numerical values shown in the column aregreen, orange, or red, depending on the value.
Dollar sign added($) A dollar sign is added to values representing dollaramounts (Revenue).
Percentage sign added (%) A percentage sign is added to the value when thecolumn name includes a percentage sign.
Strings converted to integers When values represent totals, strings are converted tointegers.
Decimals places restricted When the value represents certain totals, the decimalpoint places are restricted.
Each default reserved column name type is described in the sections that follow.
Default names and color value thresholds for tickets columns
The reserved column names in the following list display color-coded values:v Open ticketsv Closed ticketsv Total tickets - The values are also converted to integers.v Waiting tickets
The default colors for numerical values in these columns are:v Green when the value is less than or equal to 10v Orange when the value is greater than 10 and less than 20v Red when the value is greater than 20
In a column named Total Tickets, for example, by default the numbers in thecolumn would be green when the value is less than 10, orange if the value isgreater than 10, and red when the value is greater than 20.
Default revenue column format
The default revenue column names are:v New Customer Revenue
v Existing Customer Revenue
v Total Customer Revenue
A dollar sign ($) is added to the values that display in these columns and they areconverted to integers. The integer is limited to two decimal places. For example, ifthe rule-output value is 46.424321, the value displays as $46.42.
Default percentage column format
If the column name has a percentage sign (%) in it, then only whole number valuesdisplay in the column and a percentage sign is appended to the value. For
Custom service trees 273

example, if the value is 46.345678 and the column name is Customer %, the columndisplays the value 46%.
Default customer column format
The Customer reserved column names can be like any of the following:v New Customerv Tickets per Customerv Total Tickets
The values in these columns are converted to integers with no decimals.
Default baseline column format
If the column name has the string Baseline in it, the color automatically changesbased on the value. The value is bolded and the default color is green. Forexample, if the value is:v Less than 90, the color is greenv Less than 80, the color is redv More than or equal to 120, the color is red italic
Default state column format
If the column name has the string State in it, the status icons for the Good,Marginal, and Bad status display in the column. If the value is:v Less than 3, the icon is green (clear)v Less than 5, the icon is yellow (marginal)v Greater than or equal to 5, the value is red (bad)
Changing the default reserved column names
For information about how to change these defaults, see the TBSM CustomizationGuide.
Viewing a custom treeThis topic describes how to view a custom tree. This topic also describes how toview a tree for a user-defined tree template.
About this task
To view a custom tree, reopen the page that contains the custom Service Treeportlet. You can also view a custom tree by selecting the Refresh button on theportlet toolbar.
Viewing a tree for a user-defined tree templateAbout this task
To view a user-defined template, you need to create a custom page for TBSM. Forinformation about creating custom pages, see the TBSM Scenarios Guide.
274 IBM Tivoli Business Service Manager: Service Configuration Guide

Examples for creating custom treesFor examples of how to create custom trees, see the TBSM Scenarios Guide.
Custom service trees 275

276 IBM Tivoli Business Service Manager: Service Configuration Guide

Custom view definitions
This section explains how you can customize the views that appear in the ServiceEditor/Viewer.
About view definitionsThis topic describes view definitions. This topic also describes what you need todo before you create a view definition.
The View Definitions feature of IBM Tivoli Business Service Manager (TBSM) letsyou change the visual content that is displayed in your Service Editor/Viewerportlet and change the values that appear in the visual elements. Examples of howyou can change the display are:v Using different visualsv Setting visuals to display values from rules and attributesv Limiting the content that is displayedv Mapping the actions you want to perform
View definitions create a set of visual rules that are applied to the data in yourservice models. The rules help to customize the graphical display in the ServiceEditor/Viewer portlet.
Before you create view definitions
Before you create a view definition, you need to create templates and services.
Within the templates for the services for which you want to create custom views,you need to create a set of numerical aggregation rules. You will display theoutput values of these rules inside the view definition. For an example of how thisworks, see the IBM Tivoli Business Service Manager: Scenarios Guide.
Note: If you change rule or template names, you can cause issues with otherfeatures of TBSM. TBSM uses these names to reference the rule values for otherrules, such as auto-population or ESDA rules and for custom displays such asservice trees and view definitions.
If you want to change a rule or template name, change the name before you usethe rule or template elsewhere in TBSM.
For example, when you create numerical and text-based rule, you need to create acustom service tree or view definition to display the output of the rule in theTBSM console. The trees and view definitions use the template and rule names tomap the rule values to a display object. As a result, if you change the name of arule or a template used in a custom display, the custom tree or view definition willno longer display the rule values properly.
Creating and editing view definitionsThis topic describes how to create and edit view definitions.
© Copyright IBM Corp. 2008, 2013 277

Before you begin
Ensure that you have the tbsmViewDefinitionAdmin role before you begin thisprocedure. This role is required to allow you to save a new view definition asdescribed in this procedure.
About this task
To create a view definition, you must open a service model in the Service Editor orService Viewer and select the view definition you want to edit.
Procedure1. Select Services from the Service Navigation list.2. Click a service in the Service Navigation portlet.
The default view definition for the service model opens in the View Servicetab in the Service Editor or Service Viewer. For example, the Relationshipsview definition is one of the default view definitions included with TBSM. Asa result, you cannot edit this view definition and must create one. You do soby selecting an existing view definition and saving a copy.
3. Select the view definition you want to work with from the View Definitionlist.
4. Click Edit View Definition.The Edit View Definition page is displayed. The Edit View Definition pageshows the settings for the standard view definition.
5. To create a view definition, click Save as New.The Save As page opens.
6. Type the name of your view definition in the Save as New field and click OK.
Note: It is important that you limit view definition names to 25 characters.
Note: The Name field for rules, data sources, maintenance schedules, viewdefinitions and other objects must not contain these special characters:" & < > \ / * ? | ( ) : ; $ ! %
Names must not contain spaces. Otherwise, these objects may not be savedproperly in the TBSM database. If the object does not save, remove any specialcharacters or spaces from the name field.The View Definition list now shows the new view definition name. Select itand click Edit View Definition to reopen the Edit View Definition page, withall the fields for the view definition parameters enabled.
7. Click the General tab and edit these settings for your view definition.8. Click the Visuals tab and edit these settings for your view definition.9. Click the Actions tab and edit these settings.
10. When you are finished editing the settings, click OK to save the viewdefinition.
Related concepts:“Service Editor” on page 31This topic describes the Service Editor portlet.“Incoming status rules overview” on page 79This topic describes incoming status rules.
278 IBM Tivoli Business Service Manager: Service Configuration Guide

“Good, marginal, and bad incoming status rules” on page 83This topic describes good, marginal, and bad incoming status rules.“Good, marginal, and bad aggregation rules overview” on page 95This topic describes good, marginal, and bad aggregation rules.
Working with the General tabThis topic describes the General tab.
In the General tab, you set the overall layout for the view definition and theservice templates that use the definition, including the background color for theview. You can also set the number of levels that display, up or down, from thestarting instance.
You can choose to show links and seeds in the service view. In addition, if you areusing a Relationships-based view, you can include the swimlane feature in yourview. Swimlanes are colored lanes in grid layout that allow you to more easilyscan the services.
Table 92 describes the elements in the General tab.
Table 92. View Definitions: General Settings tab
Window element Element type Description
View DefinitionName
Dialog box The name of the view definition. If you need tochange this name, click Save As New.
Background Color Text field The background color for the view. The value canbe a color name such as black, or the hexadecimalRGB values for the color such as #000000 for black.These codes are the same hex codes that are usedfor HTML code.
An icon to the right of the Background Color textfield also allows you to select a background color.
Number of Levels Up Spin field Select the number of parent-service levels youwant to display by default.
Number of LevelsDown
Spin field Select the number of child-service levels you wantto display by default.
Flow Direction Drop-downlist
The direction of the service flow. The root servicefor the model can be positioned at the top, bottom,left, or right of the model.
Visibility Check boxes Select the elements you want to show for yourview definition. The selections vary with the ViewDefinition you select. For more information see“Visibility options” on page 280 in the next section.
Population Filter:AvailableTemplates/ExcludedTemplates
Selectionpanes
You can exclude or include layers in the visualmodel based on the templates you include in theview. If you exclude a template, the services thatare instances of the template are not included inthe view, along with the links that connect theservice's parents with its children. This connectionis helpful in limiting the view when there aremany levels, some of which may not be necessary.
View definitions only affect what is displayed inthe view, not the underlying behavior of model.
Custom view definitions 279

Visibility optionsThis topic describes the visibility options.
Visual elements are the shapes, colors, and text values that make up the serviceview. You can change the view to show only the information that you areinterested in.
The visibility options let you specify the service instances and links you want toinclude in your view definition. In addition, if you are using a hierarchical view,you can also include the Swim Lane feature in your view.
Table 93. View Definitions: Visibility Options
Visibilityoption Description
Show Links This option shows the lines that connect the services in the model.
Show Seeds This option shows the seed service instance for the service model; that is,the service you clicked to display the model.
Show SwimLanes
This option creates colored lanes for the services in a Relationships layout.These lanes make it easier to scan the services. The swim lane option isavailable for Relationship-based view definitions only.
Example general settingsThis topic describes how to create a view definition with swim lanes usingexample general settings.
This example describes how to use the General Settings tab to change thebackground color and layout for your view definition.
To create a view definition with swim lanes:1. From the Service Navigation portlet, select Services from the drop-down
menu.2. Click the service model where you want to create a view definition.3. Select the view definition you want to start with (in this example, select the
Relationships view) from the View Definitions drop-down list.4. Click the Edit View Definition button.
The Edit View Definition window opens.
Figure 46. Edit View Definition button
280 IBM Tivoli Business Service Manager: Service Configuration Guide

5. Click Save as New.6. Enter RelationshipsSwimLanes in the Save as New field and click OK.7. Select the view definition from the View Definition dropdown list and then
click the Edit View Definition button to reopen the Edit View Definitionwindow.The Edit View Definition window now shows the view definition nameRelationshipsSwimLanes and enables all the fields for the view definitionparameters.Figure 48 on page 282 shows the Edit View Definition window with theparameters set for this example.
Figure 47. Edit View Definition window
Custom view definitions 281

8. Type white in the Background Color field.9. Change the Number of Levels Down to 2.
10. Select the Show Swim Lanes and Show Seeds from the Visibility options.11. Click OK.
The Service Editor refreshes and opens the updated view definition in theView Service tab.
Note: Swim lanes are only valid for hierarchical-type views.
View definition visualsThis topic describes the Visuals tab.
The Visuals tab lets you select which visual representation to use for your serviceinstances, as well as the values associated with the visual representation. Bydefault, you set the visuals and values for specific service templates in yourconfiguration.
You can also select to change the default visual values for all templates byselecting the DefaultTag.
This section contains the following topics:
Changing visuals for specific service templatesThis topic describes how to change visuals for specific service templates.
Figure 48. Edit View Definition window defining swim lanes
282 IBM Tivoli Business Service Manager: Service Configuration Guide

About this task
You can map a specific service visual element type and the values displayed in thevisual to a given service template in your TBSM configuration. This feature letsyou create a view definition where the information displayed in the service imagechanges according to the service template assigned to the displayed service. Forexample, you can display the values from numeric aggregation rules in a parentservice and display the default TBSM prototype for its child services. To changethe visuals for a specific service template, complete the following steps:
Procedure1. Click the Visuals tab in the Edit View Definitions window.
The Visuals tab opens.2. Select the template you want to customize from the Service Template
drop-down list.
Note: If you want to clear the values you have previously set for a template,click Clear next to the Service Template selection list.Select DefaultTag from the list to configure the default visuals used for alltemplates that have not been configured. The templates that already havevisuals set have an asterisk next to the template name.
3. Select the visual type you want to use for your service template from the Typedrop-down list.The Edit View Definitions window refreshes and shows the selected visualimage and value parameters available for that image type.
4. Click the Configure Attributes button to configure the parameters for the typeyou selected. To use one of the standard rules or attributes, select the rule orattribute from the drop-down list for a given parameter.If you want to enter hard-coded text or an expression for a given parameter,type the text or expression you want to use in the field entry part of thedrop-down list.
5. Optionally, you can configure the rule thresholds that are specific to your viewdefinition in the Visual Thresholding table. You can use the visual thresholdsto determine when to hide the services or make them flash in your viewdefinition. If you do not configure any thresholds, the default thresholds foreach template are used in your view definition.
6. Optionally, you can collapse or expand instances tagged with the selectedtemplate as sub-graphs. Select Use show/hide for dependents under VisualBehavior.
7. Click Apply to show the updated view definition in the Service Editor orService Viewer.
8. Click OK to save the view definition and close the Edit View Definitionwindow.
Related concepts:“Visual types” on page 285Related tasks:“Setting visual thresholds” on page 290This topic describes how to set visual thresholds.Related reference:“TBSM prototype” on page 285This topic describes the default visual type TBSM prototype.
Custom view definitions 283

“One-to-six element prototypes” on page 286This topic describes one-to-six element prototypes.“Gauge” on page 287This topic describes gauges in TBSM.“Shape” on page 289This topic describes shapes in TBSM.
Change the visuals for all service templatesThis topic describes how to change visuals for all service templates.
About this task
When you change the visual elements for all service templates, you can only selectthe attribute or rule values that are common to all templates. These commonvalues include SLA rules and overall status for a given service. To create customvisual elements that display for all the service templates in your configuration,complete the following steps.
Note: If you have previously set visual values for a specific template or templateswhen you were in Override Defaults mode, those values take precedence over thevalues set for all templates.
Procedure1. Click the Visuals tab in the Edit View Definitions window.
The Visuals tab opens.2. Select DefaultTag(*) from the Service Template drop-down list.3. Select the visual type you want to use for your view definition from the Type
drop-down list.The Edit View Definitions window refreshes and shows the selected visualimage and value parameters available for that image type.
4. Click the Configure Attributes button to configure the parameters for the typeyou selected. To use one of the standard rules or attributes, select the rule orattribute from the drop-down list for a given parameter.If you want to enter hard-coded text or an expression for a given parameter,type the text or expression you want to use in the field entry part of thedrop-down list.
5. Optionally, you can configure the rule thresholds that are specific to your viewdefinition in the Visual Thresholding table. You can use the visual thresholdsto determine when to hide the services or make them flash in your viewdefinition. If you do not configure any thresholds, the default thresholds foreach template are used in your view definition.
6. Optionally, you can collapse or expand instances tagged with the selectedtemplate as sub-graphs. Select Use show/hide for dependents under VisualBehavior.
7. Click Apply to show the updated view definition in the Service Editor orService Viewer.
8. Click OK to save the view definition and close the Edit View Definitionwindow.
Related concepts:“Visual types” on page 285Related tasks:
284 IBM Tivoli Business Service Manager: Service Configuration Guide

“Setting visual thresholds” on page 290This topic describes how to set visual thresholds.Related reference:“TBSM prototype”This topic describes the default visual type TBSM prototype.“One-to-six element prototypes” on page 286This topic describes one-to-six element prototypes.“Gauge” on page 287This topic describes gauges in TBSM.“Shape” on page 289This topic describes shapes in TBSM.
Visual typesIn the Visuals tab you select from four basic visual types for your service. For eachtype of visual, you can configure a specific set of labels and corresponding values.Related tasks:“Setting visual thresholds” on page 290This topic describes how to set visual thresholds.“Changing visuals for specific service templates” on page 282This topic describes how to change visuals for specific service templates.“Change the visuals for all service templates” on page 284This topic describes how to change visuals for all service templates.Related reference:“TBSM prototype”This topic describes the default visual type TBSM prototype.“One-to-six element prototypes” on page 286This topic describes one-to-six element prototypes.“Gauge” on page 287This topic describes gauges in TBSM.“Shape” on page 289This topic describes shapes in TBSM.
TBSM prototypeThis topic describes the default visual type TBSM prototype.
The TBSMPrototype is the default visual type for TBSM services. You can changethe values displayed in the Visuals tab. Figure 49 shows the visual with thecorresponding parameter names in the Visuals tab.
Figure 49. Service image with SLA indicators
Custom view definitions 285

When the TBSMPrototype is selected in the Type field, the values in Table 94display. The numbers next to the parameters in Figure 49 on page 285 correspondto the numbers in the Parameter name column in Table 94:
Table 94. Visuals tab values for the TBSM prototype
Parameter name Description Default
Icon State Color The icon-state color shows the currentservice status.
The #realTimeServiceStateColor attribute for theservice instance. The color changes based on theoverall status of the service.
Gauge Max 1 A floating point value that represents themaximum value for the gauge.
The ?cumulSLAStatusMax attribute sets the maximumvalue for the cumulative-time SLA rule.
Color 1 Displays a color value. The #cumulSLAStatusColor attribute sets the colorsused for cumulative-time SLA rule.
Integer 2 Displays an integer value. The #numIncidentsInt rule shows the number ofoutage incidents in relation to the incident-countsettings for the SLA incident-count rule.
Color 2 Displays a color value. The #numIncidentSLAStatusColor shows the statuscolor mapped to the number of outage incidents.
Gauge Value 3 Displays a floating point value in thegauge.
The #durationSLAStatusElapsedSeconds rule showsthe amount of time remaining before anoutage-duration SLA violation occurs.
Gauge Max 3 A floating point value that represents themaximum value for the gauge.
The ?durationSLAStatusMax displays the maximumvalue of the gauge.
Color 3 Displays a color value. The #durationSLAStatusColor attribute sets thecolors used for duration SLA rule.
Gauge Value 4 Displays a floating point value in thegauge.
The #cumulSLAStatusElapsedSeconds rule shows theamount of time remaining before a cumulative-timeSLA violation occurs.
Integer 4 Displays an integer value. The #numRawEventsInt shows the number of eventsthat affect a service and the status color of the eventwith the worst status.
Color 4 Displays a color value. The #maxSeverityRawEventsColor shows the severityof the event with the highest severity value.
Related concepts:“Visual types” on page 285“Service level agreement configuration” on page 203Related tasks:“Setting visual thresholds” on page 290This topic describes how to set visual thresholds.“Changing visuals for specific service templates” on page 282This topic describes how to change visuals for specific service templates.“Change the visuals for all service templates” on page 284This topic describes how to change visuals for all service templates.
One-to-six element prototypesThis topic describes one-to-six element prototypes.
The element prototypes are visual representations that let you configure customlabels and values. For each element in the prototype, you need to specify the labeland the value displayed for the label.
286 IBM Tivoli Business Service Manager: Service Configuration Guide

When one of the prototypes is selected in the Type field, values like thoseprototypes in Table 95 display:
Table 95. Visual tab values for three-element prototype
Parameter name Description Default
Background Color The background color youwant to display on theprototype
TherealTimeServiceStateColorattribute for the serviceinstance. The color changesbased on the overall status ofthe service.
Labels Labels 1-6 display,depending on whichprototype you selected fromOneElementPrototype toSixElementPrototype. Youcan enter any text to displayon the element.
Values Values 1-6 display,depending on whichprototype you selected fromOneElementPrototype toSixElementPrototype.
If you are creating this viewfor a specific template, selectfrom a list of rules createdfor the template.
If you are creating this viewfor all templates, select froma list of rules from alltemplates in your instance.
Related concepts:“Visual types” on page 285Related tasks:“Setting visual thresholds” on page 290This topic describes how to set visual thresholds.“Changing visuals for specific service templates” on page 282This topic describes how to change visuals for specific service templates.“Change the visuals for all service templates” on page 284This topic describes how to change visuals for all service templates.
GaugeThis topic describes gauges in TBSM.
You can select a gauge to represent a service:
Custom view definitions 287

Table 96. Sample gauges
Gauge Description
Example speedometer gauge
You can configure this gauge to show totals.
For example, the number of critical and high ticketsfor a service.
In this example, the needle points to the total number ofopen tickets for a service instance calledAsia_Region_for_GetThereFast.
Gradient gauge
You can also configure the gradient gauge to show adisplay name and totals. For example, this gauge wasconfiguredto show total open tickets forABCBank.
Example tachometer Gauge
You can figure this gauge to use two different rules tocontrol needle and the odometer values, in addition todisplay name.
The Gauge Value parameter can be used to display anumerical value. The Gauge Odometer can configure thegauge needle to point to a green, yellow, or redbackground,
In this example, the needle reflects the overall servicestatus. The value is the total number of open tickets forthe service:Asia_Region_for_ABCBank.
When the speedometer gauge is selected, the values for the Type field are:
Table 97. Visual tab values for gauge
Parameter Name Description Default
Gauge Minimum The minimum value touse for the gauge valuecalculation.
0. You can change this value by typing thenew integer into the text field.
Gauge Maximum The maximum value touse for the gauge valuecalculation
durationSLAStatusMax. You can changethis value to an integer by typing the newinteger into the text field.
Gauge Value The rule output valueyou want to display inthe gauge.
durationSLAStatusElapsedSeconds. Youcan change this value to any of the rulesset for this template.
When you select the gradient gauge, the values are similar, except you can alsochoose the font color for the display name and the time stamp.Related concepts:“Visual types” on page 285
288 IBM Tivoli Business Service Manager: Service Configuration Guide

Related tasks:“Setting visual thresholds” on page 290This topic describes how to set visual thresholds.“Changing visuals for specific service templates” on page 282This topic describes how to change visuals for specific service templates.“Change the visuals for all service templates” on page 284This topic describes how to change visuals for all service templates.
ShapeThis topic describes shapes in TBSM.
When you select the Shape prototype, you can choose from a list of shapes torepresent the instances in your service model.
You can select one of the following shapes from the Type list.
Table 98. Edit View Definition window - Visuals tab available shapes
Shape Description
Rounded Rectangle
Rectangle
Ellipse
Diamond
Triangle Up
Triangle Down
Triangle Left
Triangle Right
You can select the dimensions for the shape and the color, as well as the positionfor the display name. Figure 50 on page 290 shows an example of the rectangleshape for a template named OS_NETWORK showing the #realTimeServiceStateColorcolors (Marginal and Bad). The values displayed are the number of open trouble
Custom view definitions 289

tickets for the service.
When the speedometer gauge is selected, the default values for the Type fields are:Related concepts:“Visual types” on page 285Related tasks:“Setting visual thresholds”This topic describes how to set visual thresholds.“Changing visuals for specific service templates” on page 282This topic describes how to change visuals for specific service templates.“Change the visuals for all service templates” on page 284This topic describes how to change visuals for all service templates.
Setting visual thresholdsThis topic describes how to set visual thresholds.
About this task
Visual thresholds let you define some visual behaviors for your services. You canset services to flash, when they are in the Bad state, for example, or make servicesinvisible to reduce the number of elements in the view. For example, you couldmake services invisible when they are in a Good (green) state.
The following procedure shows you how to:v Show children services only when the status changes to Bad or Marginal
v Set the children service icons to flash when their status is Bad
v Add the option to show or hide the children services
Note: In cases where a service hierarchy is not a strict parent/child hierarchy,Show/Hide may not always produce clear results. Show/Hide is meant toShow/Hide child services for a given parent. If you assign it to child services atthe bottom level, the results will not always be clear.
Procedure1. Select or create a view definition.2. Click the Edit View Definition button to open the Edit View Definition
window.3. Select the Visuals tab.4. Select a template to assign visual thresholds to.5. Click the New button in the Visual thresholding section of the window to
add a row to the threshold filter.6. In the first Threshold Filter field, select realTimeServiceStateColor.7. In the second Threshold Filter field, select =.8. In the third Threshold Filter field, type red.
Figure 50. Example shapes - rounded rectangle
290 IBM Tivoli Business Service Manager: Service Configuration Guide

9. In the Visual Effect section of the window, select blink to make the icons forthe red (Bad status) services flash.
10. Click the New button in the Visual Thresholding section of the windowagain to add a second row.
11. In the first Threshold Filter field, select realTimeServiceStateColor.12. In the second Threshold Filter field, select =.13. In the third Threshold Filter field, type green.14. In the Visual Effect section of the window, select Invisible to make the
green (Good status) services invisible.Click OK to return to the Service Editor.The green services should be invisible and the red services should flash.
15. Click OK to return to the Service Editor.Now add the Show/Hide setting for service instance children.
16. Open the view definition again.17. Select the Visuals tab.18. In the Visual Thresholding section of the window, select the Show/Hide for
Dependents check box.19. Click OK to save the view definition and return to the Service Editor.
A Show/Hide toggle button has been added to the service instance.
20. Click the Show/Hide button.You can now see the child service instance.
Figure 51. Service instance with Show/Hide button - Hide selected
Custom view definitions 291

Related concepts:“Visual types” on page 285Related tasks:“Changing visuals for specific service templates” on page 282This topic describes how to change visuals for specific service templates.“Change the visuals for all service templates” on page 284This topic describes how to change visuals for all service templates.Related reference:“TBSM prototype” on page 285This topic describes the default visual type TBSM prototype.“One-to-six element prototypes” on page 286This topic describes one-to-six element prototypes.“Gauge” on page 287This topic describes gauges in TBSM.“Shape” on page 289This topic describes shapes in TBSM.
Working with view definition actionsThis topic describes view definition actions.
Actions are the options available to you as the result of clicking, double clicking, orright-clicking a service in the Service Editor. Many actions are defined as part ofthe TBSM installation. In the Actions tab of the Edit View Definition window, youcan edit action properties, view the contents of actions and add new actions.
Figure 52. Service instance with Show/Hide button - Show selected
292 IBM Tivoli Business Service Manager: Service Configuration Guide

Note: Any custom actions are not accessible from the Service Navigation portletright-click menus. They only show up in the custom views for which they werecreated.
Single-click actions
In TBSM, when you single-click on a service displayed in the Service Editor, youdisplay the events related to that service in the Events tab of the Service Detailsportlet. You can replace this action with a new action in the Actions tab of the EditView Definitions window.
Double-click actions
When you double-click a service displayed in the Service Editor, you display theevents related to that service in the Events tab of the Service Details portlet. Youcan replace this action with a new action in the Actions tab of the Edit ViewDefinitions window.
Right-click actions
When you right-click on a service displayed in the Service Editor, a list of menuoptions displays, some of which have submenus. In the Actions tab, you can editthese actions and add new ones.
Changing the actions for specific service templatesThis topic describes how to change the actions for specific service templates.
About this task
You can map specific actions to a given service template in your TBSMconfiguration. This feature lets you create a view definition where the actions youcan access when clicking, double-clicking, and right-clicking on service instancescan differ depending on the service template assigned to the displayed service. Forexample, you can access the TBSM default actions in a parent service and accessdifferent actions for its child service. To change the actions for specific servicetemplates:
Procedure1. Click the Actions tab in the Edit View Definition window.
The Actions tab opens.Figure 53 on page 294 is an example.
Custom view definitions 293

The default values appear automatically.2. To edit an existing action, select it from the Action drop-down list. Click the
Edit button.3. To add a new action, click the New button next to the Action selection list.
The Edit Action window opens.4. Select the template that you want to set actions for from the Service Template
drop-down list.5. To select a different single-click action, select it from the Single Click
drop-down list.6. To select a different double-click action, select it from the Double Click
drop-down list.7. To select right-click actions for a view definition, select the option you want
from the Right click menu options list.8. To add a predefined right-click action, click the New button to add a new row
to the Right Click Menu Options action list.A blank row is added to the Actions list.
9. Select an action from the drop-down list.10. Click Apply to save the action.11. Click OK to close the Edit View Definition window.Related concepts:“View definition action examples” on page 296This topic describes how to create and edit actions.
Changing the actions for all service templatesThis topic describes how to change the actions for all service templates.
Figure 53. Edit View Definition window Actions tab: Override Defaults
294 IBM Tivoli Business Service Manager: Service Configuration Guide

About this task
To add or edit an action for all the service templates in your configuration:
Note: If you have previously defined actions for a specific template or templates,these defined actions override the defaults.
Procedure1. Click the Actions tab in the Edit View Definition window.
The Actions tab opens.Figure 54 is an example.
2. To edit an existing action, select it from the Action drop-down list. Click theEdit button.
3. To add a new action, click the New button next to the Action selection list.The Edit Action window opens.
4. By default, DefaultTag(*) should be selected from the Service Templatedrop-down list. DefaultTag(*) must be selected to configure the defaultactions used for all templates that have not been configured.
5. To select a different single-click action, select it from the Single Clickdrop-down list.
6. To select a different double-click action, select it from the Double Clickdrop-down list.
7. To select right-click actions for a view definition, select the options you wantfrom the Right click menu options list.
8. To add a predefined right-click action, click the New button to add a new rowto the Right Click Menu Options action list.A blank row is added to the Actions list.
9. Select an action from the drop-down list.
Figure 54. Edit View Definition window Actions tab: Defaults
Custom view definitions 295

10. Click the Apply button to save the action.11. Click the OK button to close the Edit View Definition window.Related concepts:“View definition action examples”This topic describes how to create and edit actions.
Using service attributes in an actionThis section describes how you can use service attributes in an action.
When you define an action, you can include information about the selected serviceas part of your Action URL. If you want to specify a service attribute as a variablein a click or right-click action, you can use the notation:__attributename__
Where attributename is the name of a service attribute such as the service name.This table describes common attributes you can use in an action.
Table 99. Service attributes
Attribute Description
ServiceInstanceID The unique ID for the selected service.
ServiceInstanceName The unique name for the selected service.
PrimaryTagName The primary template for the selected service.
For more examples of how you can use an attribute variable in an action, open oneof the default actions defined in the Actions tab.
You can also use an additional attribute value in the action. These attributes can becreated manually or by the Discovery Library Toolkit, an ESDA, or anauto-population rule. For information about how to set up additional attributes foractions, see the TBSM Customization Guide.
Examples
These examples show how you can define a URL in the Action URL field.
In this example, the standard attribute ServiceInstanceName is a parameter calledservice that is passed to the WebApp running on port 9999. The web server hostname is set to my.webserver.abc.com.http://my.webserver.abc.com:9999/WebApp?service=__ServiceInstanceName__
You can also define the web server name as a variable contained in an additionalattribute for the service. In this example, YourWebServer is an additional attributeas specified in the Additional tab for the service instance. The standard attributeServiceInstanceName is a parameter called service that is passed to the WebApprunning on port 9999.http://__YourWebServer__:9999/WebApp?service=__ServiceInstanceName__
View definition action examplesThis topic describes how to create and edit actions.
296 IBM Tivoli Business Service Manager: Service Configuration Guide

The examples in this section show how to add, edit, and delete actions. Theseexamples are based on the tutorials in the TBSM Scenarios guide and use the TBSMdatabase.
Adding a new action
This example shows you how to add an action URL that takes you to ibm.com.1. Open the service you want in the Service Editor.2. Select the view definition you want.3. Click the Edit View Definition button in the Service View toolbar.4. Select the Actions tab.5. To add a new action, click the New button next to the Action drop-down list.
The Edit Action window opens.6. Enter the information in the window using Table 100 as your guide.
Table 100. Edit Canvas Action window
Window element Description
Name Enter a meaningful name for the action, in this case ibm.
Display Name Enter the name that you want to display in the action list, inthis case, ibm.
Description You can enter text in this field to describe the action, forexample, url for ibm.com.
URL Enter the URL, in this case www.ibm.com.
Frame Accept the default (leave blank).
7. Click OK.8. Select the template where you want to configure the new action from the
Service Template field.9. Click OK
Adding a right-click action
This example adds the action to the right-click menu for a service template.1. Click the New button in the Right-Click Menu Options section of the window.
A blank row appears at the bottom of the list.2. Select ibm from the drop-down list.3. Click Apply.4. Click OK to save the changes to the view and close the window.5. Right-click on a network service instance in the view.
If you are unable to open ibm.com, you may need to edit the view.
Editing an action
This example shows you how to edit the ibm url so that you can open the window.1. Click the Edit View Definition button in the View Service toolbar.2. Select the Actions tab.3. Select ibm from the Action drop-down list.
Custom view definitions 297

4. Click the Edit button next to the Action drop-down list to open Edit Actionwindow.
5. Try changing the URL to http://www.ibm.com.6. Select a template from the Service Template dropdown list.7. Click OK to save your changes and close the window.8. Right-click on a network service instance and select ibm.
ibm.com should now open in a new browser window.
Changing the single-click action
The default single-click action displays the events related to the selected service inthe Events tab of the Service Details portlet. You can replace it with a new actionin the Actions tab of the Edit View Definitions window.
This example shows you how to replace the default action with Re-Center UsingGrid View Definition.
1. Click the Edit View Definition button in the View Service toolbar.2. Select the Actions tab.3. Select a template from the Service Template dropdown list.4. Select Re-Center Using Grid View Definition from the Single Click
drop-down list.5. Click Apply to apply the changes.6. Click OK to save your changes and close the window.7. Single-click on a region.
A new view should open in the Service Editor, like the one in Figure 55 onpage 299.
298 IBM Tivoli Business Service Manager: Service Configuration Guide

Changing the double-click action
When you double-click on a service displayed in the Service Editor, you displaythe status-affecting rules, that is, the rules that caused the service status to change.Only the status affected rules are displayed. For example, if the service is green,you will see no data in the rules tab.
You can replace this with a new action in the Actions tab of the Edit ViewDefinitions window.
This example shows you how to change the double-click action to Send Test Event.1. Open the service that you want to edit the view definition for.2. Select the View Definition that you want to edit.3. Click the Edit View Definition button in the View Service toolbar.4. Select the Actions tab.5. Select the applicable template.6. Select Send Test Event from the Double- Click drop-down list.7. Click Apply to apply the changes.8. Click OK to save your changes and close the window.9. Double-click on a network service.
Figure 55. Recenter using grid view definition example
Custom view definitions 299

A test event should be sent from the ObjectServer that changes the status of theservice.
Related concepts:“Right-click menus” on page 249Related tasks:“Changing the actions for specific service templates” on page 293This topic describes how to change the actions for specific service templates.“Changing the actions for all service templates” on page 294This topic describes how to change the actions for all service templates.
Deleting a view definitionThis topic describes how to delete a view definitions.
About this task
To delete a view definition:
Procedure1. From the View Definition list, select the custom view that you want to delete.2. Click the Delete View Definition button.3. Click Yes in the Warning window.
The view definition is deleted from the list.
300 IBM Tivoli Business Service Manager: Service Configuration Guide

TBSM Charts
This topic describes how to use the IBM Tivoli Business Service Manager (TBSM)Charts tool to create reports.
Note: This feature will not be part of subsequent TBSM releases.
Note: While it is possible to use Business Intelligence and Reporting Tools (BIRT)to work with charts in TBSM, this feature is deprecated. The information providedin this section is provided for your convenience only.Related concepts:“Charts” on page 28This topic describes the elements in Charts in the Service Navigation portlet.
Charts overviewThis topic describes the parts of the chart tool.
The Charts tool lets you create a Business Intelligence and Reporting Tools (BIRT)Designer chart as part of the TBSM. The charts you create can access any datasources you use for your service models.
Data for charts
You can create charts from any data source you can access from TBSM, includingany data sources you configure and the TBSM service model data.
Chart types: pie, line, bar
You can create pie charts, line charts, and bar charts with the charting. Select thetype of chart you want and the options change accordingly. If you want to createdifferent chart types, you can save the chart as a rptdesign file to disk on yourlocal machine and edit the file in the BIRT designer.
Chart portlets and Tivoli Integrated Portal pages
When you create a custom chart, TBSM saves the chart as a BIRT chart. You canthen add the chart to the Tivoli Integrated Portal Charting portlet on a custompage.
To manage user roles, from the left navigation pane, click Users and Groups →Roles. For more information, see the console help.
To manage pages, from the left navigation pane, click Settings → Pages. For moreinformation, see the console help.
To manage portlets, from the left navigation pane, click Settings → Portlets. Formore information, see the console help.
For more information about charts, see the Tivoli Integrated Portal charts topics.
© Copyright IBM Corp. 2008, 2013 301

Charts referenceThis topic describes the properties you need to configure for the TBSM charts.
Purpose
For charts you need to define data, the chart type, and how you want to displaythe data in the chart. You can set these properties in a chart.
Properties
Data source:This specifies the source of the data you use for the chart. You can use one ofthese data sources for a single chart:v Regular TBSM data sourcesv TBSM model data that uses the output of rules as datav Policy allows you to write a policy to return the data
X-axis ExpressionThis is a BIRT expression for the x-axis elements. For bar and line charts the xaxis is the horizontal axis of the chart. Each row returned by the querycorresponds to one x-axis value. The expression uses regular expression syntaxto reference fields returned by the query. You use the notationrow["fieldname"].
Time AxisIf the field for the X axis is a time stamp, then you check this axis to ensurethat BIRT plots the axis in chronological order. If the field is an integer (epochtime), you can configure the X axis expression to be new Date(row[""]).
Y Series ListEach Y series corresponds to a numeric field returned by the query that youwant to plot against the X axis expression value. In bar and line charts, this isthe vertical axis for the chart.
LabelThe text to assign to the legend for the series in question. The label is a stringliteral and it cannot depend on the data.
TooltipAn expression that shows up when you mouse over the bar or pie piececorresponding to the series in question. For example, you could configure as:"Num Tickets for Customer " + row["highlevelserviceid"] + " is "+ row["numentries"]
In the previous example, the tool tip is the literal text plus the values of tworows:
Num Tickets for Customer highlevelserviceid value is numentries value.
In the example tooltip, the highlevelserviceid is Online Banking and thenumentries value is 387.Num Tickets for Customer Online Banking is 387
Y axis ScaleLinear or Logarithmic (use logarithmic if you have different y values that areorders of magnitude apart from each other).
Y Axis TitleText to appear next to the Y axis (cannot depend on the data).
302 IBM Tivoli Business Service Manager: Service Configuration Guide

X Axis TitleText to appear next to the X axis (cannot depend on the data).
Grouping ExpressionThis term is useful for line graphs, but can be applicable for bar and pie chartsas well. It provides a way to group the data in the chart and is typically set toa text field.
ParametersThis term allows you to set parameters for the chart for each service instanceclicked in the tree. You can parameterize the query using '__param__' for eachsubstitution you want to make. The service property name can be the name ofthe additional property on the selected service that has the data to substitute inthe query. You can also use the parameters:v serviceinstancename
v displayname
v serviceinstanceid
The default value allows you to set the default for the parameter (for examplewhen the chart is opened, before you click a service instance). The paramtypeindicates whether you want the parameter to have single quotes around it (youdo not add the single quotes in the query for string fields).
View ButtonShows the data results from the expression that you entered.
Use Stacked BarsShows side by side stacked bars on the graph if you display more than oneseries of data.
Query BuilderOpens the Query Builder wizard to help you build an SQL query.
SQL Query fieldText field where you type the query you want to use to populate the chart.
Chart data sourcesThe section describes the chart data sources.
The TBSM charting tool supports the data sources:v Databasev TBSM model datav Use policy for data
Database
You can select any database configured as a data source in TBSM for your chartquery. You configure these data sources from Data in the Service Navigationportlet.
When you use the database data source, you enter a query in the query field oruse the Query Builder to create a query interactively. You can also directly enterthe query in the SQL Query field. Click View button to see a preview of dataselected by your query.
TBSM Charts 303

TBSM Model Data
When you use the TBSM Model Data, you set the services you want to show andthe key performance indicators (KPIs) you want to display in the chart. A KPI canbe the output of any rule you configure in a service template.
This table describes how you can select the service instances for a chart.
Table 101. Selecting service instances for chart
Option Description
Show KPIs for specified (comma separated)list of instances
Select specific service instances to display inthe chart. You can enter the list by hand, oruse the Instance Chooser to select from thelist of your services.
Show KPIs for instance clicked. Enter defaultinstance name (optional)
Set the chart to show data on the serviceinstance you select. When you click a servicein the Services portlet, the display in thechart changes accordingly. Optionally, youcan enter the default service instance for thechart.
Show KPIs for children of instance clicked.Enter filter to match (optional)
Set the chart to show data on the childservices for the service instance you select.When you click a service in the Servicesportlet, the display in the chart changesaccordingly. Optionally, you can enter a filterto further specify the child services youwant to display.
Use Display Name Select this option to show the service displayname in the chart. By default, the chartdisplays the service name, which can bedifferent from the display name.
This table describes how you select the KPIs (rule outputs) you want to display inthe chart.
Table 102. KPI (rule data) options for charts
Option Description
Show All KPIs Select this option to show data from all therules as KPIs in your chart. When you selectthis option, the chart displays data for allrules associated with the selected serviceinstance.
Show Selected KPIs Select this option to show data from specificrules as KPIs in your chart. When you selectthis option, the chart displays data from therules you select.
The Available KPIs list contains all the rulesconfigured in your service templates. Selectthe rules you want, and click >> to movethe rules to the Selected KPIs list.
304 IBM Tivoli Business Service Manager: Service Configuration Guide

Table 102. KPI (rule data) options for charts (continued)
Option Description
Rule Name Mapping Select this option to specify display namesfor the rules (KPIs).
When you click Rule Name Mapping, theRule name mapping window opens. Selectthe Rule (KPI) name and enter the DisplayName you want for your chart.
Use Policy for Data
If the data to chart is not available from an SQL command or in the TBSM model,there is the option to write a policy to obtain the data. The policy has access to anydata sources configured in TBSM and can transform and operate on the data inusing the standard policy functions. You need to be familiar with Netcool/Impactpolicies before you use this option.
In the data source radio button, you select the Use Policy for Data option. See thecomments in the policy (click the policy button) for the data format. If you click aninstance in the tree, the ServiceInstance object passed to the policy corresponds tothe selected service instance. When a user clicks a service, all the service propertiesare passed to the policy. Each "row" returned by the policy is treated like a rowreturned by a database query and the rest of the configuration is essentially thesame as for the database query configuration. That is, you specify the rows fromthe policy as KPI values in the Y Series list.Related concepts:“Data fetchers” on page 51“Data sources” on page 45“Query Builder” on page 123
Creating a chartThis topic describes how to create a chart.
To create a chart:1. Select Charts from the Service Navigation drop-down list.2. Click the Create New Chart button in the Service Navigation portlet.3. The New Chart portlet opens in the Service Editor4. Enter the name of the new chart.5. Select the radio button for the chart type you want.6. Select your data source and select the data you want for your chart.7. Set the X and Y axis properties for your chart.8. Optionally add a grouping expression and service property parameters.9. Click Save.
Adding a chart to a Tivoli Integrated Portal pageThis topic describes how to add a TBSM chart to a page.
TBSM Charts 305

Create new page with a chart
To add a chart to a page, you need to load it in Charting portlet. You can create apage and add a Charting Portlet.
To manage user roles, from the left navigation pane, click Users and Groups → UserRoles. For more information, see the console help.
To manage pages, from the left navigation pane, click Settings → Pages. For moreinformation, see the console help.
To manage portlets, from the left navigation pane, click Settings → Portlets. Formore information, see the console help.
For more information about Tivoli Integrated Portal charts, see the TivoliIntegrated Portal charts topics.
To display a TBSM chart on a new page:1. Open Settings -> Pages in the left navigation frame. Page Settings opens.2. Click New Page.3. Enter the name you want in the Page name field.4. In the Page location field, click Location to browse for the location you want
your page. An example is console/Availability/. This path specifies that thepage will be listed under Availability in the console task list.
5. Select Freeform option under Page Layout.6. Expand Optional setting. Click Add to view a list of roles that can access this
page. For example, add all the roles starting with tbsm.7. After you select the roles you want, click Add.8. Click OK. The Portlet palette displays, which is used to select portlet content.9. Find the Charting portlet from the Portlet palette page.
10. Drag the Charting portlet into the blank area below the Portlet palette.11. In the Charting portlet, click the Custom Charts charting source.12. Select the chart you created from the list of charts.13. Click Finish and your chart displays in the portlet.14. To save the page, click Save.15. Enter the page name, location, and select Client Side from Page persistence
drop-down list field.16. Click Role with Access to this Page and add the roles you want.17. Click Save.
Add your chart to the Charting portlet
To add your chart to an existing Charting portlet:1. In the top of the portlet, click the down arrow to open the portlet menu.2. Click the Return to chart selector button (arrow).3. In the Charting portlet, click the Custom Charts charting source.4. Select the chart you created from the list of charts.5. Click Finish and your chart displays in the portlet.
306 IBM Tivoli Business Service Manager: Service Configuration Guide

Note: To enable other users to see the chart portlet you need to share preferences.From the chart tools, click the Publish button and select Share Preferences fromthe menu that opens, or right-click on the chart and select Share Preferences.
To Share Preferences, you must have the chartAdministrator or chartCreatorroles. Users can only view the chart if they have one of the following roles:v chartAdministrator
v chartCreator
v chartViewer
Customizing charts in BIRT
To customize your chart in the Business Intelligence and Reporting Tools Designer(BIRT), you need to save your chart to your local system, customize it, and uploadit to TBSM:1. In the top of the Charting portlet, click the down arrow to open the portlet
menu.2. Click the Return to chart selector button (arrow).3. In the Charting portlet, click the Custom Charts charting source.4. Select the chart you created from the list of charts.5. Click the Save to File button and specify the file name and path from the
window that opens.6. Open the file in the BIRT Designer and customize it.
When you have finished editing the report in BIRT, you upload it back toCharting portlet.
7. In the top of the Charting portlet, click the down arrow to open the portletmenu.
8. Click the Return to chart selector button (arrow).9. In the Charting portlet, click the Custom Charts charting source.
10. Click the Upload button.11. From the Upload Chart window, browse your local file system by clicking
Browse to select a report design file containing a single chart. Then clickUpload to complete.
12. Select the uploaded chart.13. Click Finish and your chart displays in the portlet.
Working with ITM chartsThis task describes how to create an ITM chart within TBSM.
Before you begin
Note: You must have permissions to create a chart and page.
Make sure ITM is installed and configured correctly, see the IBM Tivoli MonitoringInstallation Guide for more information.
Before you can add ITM chart, you need to complete the installation andconfiguration of ITM Web Services.
TBSM Charts 307

The charting Web Service was made available as of Tivoli Monitoring 6.2.2 FP2. InTBSM 4.2.1, the charting web service was part of the TBSM installation, in TBSM6.1, you install and configure the web service on your Tivoli Monitoring TivoliEnterprise Portal Server (TEPS).
For information on how to install and configure the web service on your TEPSserver, see the section titles Enabling TIP Web Service for Tivoli Integrated Portalcharts in the ITM 6.2.2 FP2 Administration Guide at: http://www.ibm.com/developerworks/wikis/display/tivolidoccentral/Tivoli+Monitoring
About this task
After you have completed the ITM configuration, follow these steps:
Procedure1. Open Settings -> Pages in the left navigation frame.2. Click New Page... The Create New Page opens in a new tab.3. Click Location to select the location of the page. For example, select
Availability.4. Click Add to add the roles you want. For example, add all the roles starting
with tbsm.5. Click OK.6. Find the Charting portlet from the portlet palette by using the Search filter or
scrolling through the portlet catalog.7. Drag the Charting portlet into the blank area below the portlet palette.8. On the Charting portlet, select IBM charts from the Chart Sources.9. Select New to create the new chart source and specify these parameters:
Name The name assigned to the Charting Web Service when it was installedand configured. Typically the value is TIPWebServiceHttpRouter.
ProtocolThe communication protocol used to communicate with the ChartingWeb Service. If you need an HTTPS connection, then you need toupdate the trust stores on both the TBSM Data server and TBSMDashboard server. Otherwise, select HTTP.
HostnameThe host name of the server where the Charting Service is running.Typically, this is the Tivoli Monitoring Enterprise Portal server (TEPS).
Note: Do not use the value localhost as it can create an unreliableconnection.
Port The port number that the Charting Web Service is listening on.Typically this is 15200 for HTTP and 15201 for HTTPS.
UsernameThe user ID to used to connect to the IBM Tivoli Monitoring ChartingWeb Service. Typically this is sysadmin.
PasswordThe password for the user ID.
Select Chart to Import is displayed.10. Click Next.
308 IBM Tivoli Business Service Manager: Service Configuration Guide

11. In the Groups drop-down list, select ITM Shipped Charts or ITM customcharts.
12. Select the chart you want.13. Click Finish.
Note: Register the Dashboard Server to Tivoli Monitoring as follows:a. Change to the TIPProfile directory:
$TIP_HOME/profiles/TIPProfile/bin
For example on Windows:C:\IBM\tivoli\tipv2\profiles\TIPProfile\bin
On Unix:/opt/IBM/tivoli/tipv2/profiles/TIPProfile/bin
b. Run the command:
On Windows:tipcli.bat ITMLogin --hostname TEPS Server --port TEPS Port--username username --password password --ITMUsernameitmusername --ITMPassword itmpassword --servicename servicename
On Unix and Linux systems:./tipcli.sh ITMLogin --hostname TEPS Server --port TEPS Port--username username --password password --ITMUsernameitmusername --ITMPassword itmpassword --servicename servicename
For example:./tipcli.sh ITMLogin --hostname myhost.mycity.ibm.com --port 1920
Writing file:/opt/IBM/tivoli/tipv2Components/BIRTExtension/integration/properties/itm.properties CTGWA4017I The command completedsuccessfully.
:14. To save the page, click Save.15. Click Save.
TBSM Charts 309

310 IBM Tivoli Business Service Manager: Service Configuration Guide

Time Window Analyzer view
These topics describe how you can use the Time Window Analyzer view to displayservice key performance indicators (KPIs) in a time series line graph.
Time Window Analyzer overviewThese topics describes the main features of the Time Window Analyzer view.
You can use the Time Window Analyzer view to show service trends over timeand in relation to other services, service effecting events and compare it tohistorical data. When you configure the view you select the following options:v one or more services where you want to show KPI values for a given time
periodv a key performance indicator (KPI) value you want to plot over time. This is a
numerical rule that is part of the service's template.v an Overlay that shows, when the service status changed over the time period.v other recent time periods showing the same data. The chart plots the data for
the recent time period on top of the chart for the most recent time period.
The Time Window Analyzer contains two elements:v The Compare frame lets you select the services you want to view in the chart,
and history for those services.v The chart frame lets you select the KPI you want to plot and an overlay you
want to display in the chart.
Compare Services
The Compare Services frame lets you specify the services you want to show inyour chart. This tab displays by default. You can hide this tab by clicking the HideLegend(�) button between the chart frame and the Compare Services frame. Torestore the Compare Services frame, click the Show Legend(�) button. You canalso adjust the Compare Services frame by dragging the divider to any size youwant.
You can select a service three ways:1. You can specify services from the Services tab using Add Service .2. You can open the Time Window Analyzer in context from the Service Tree,
Urgent Service, or Service Viewer portlets using the Show -> Compare ServiceMetrics option from the right-click menu.
3. You add the services you want to plot as part of your user preferences or aspart of the default view for the Time Window analyzer:
You can remove a service from the Compare Services frame two ways:1. To remove a service from the graph, deselect the service you want to remove in
the list.2. To remove a service from the list, close and reopen the Time Window Analyzer
page. Add back any services you want.
© Copyright IBM Corp. 2008, 2013 311

Compare History
The Compare History tab lets you show historical data for past time periods for agiven service and KPI (rule metric). When you show historical data, the datarefresh is does not automatically refresh.
Chart frame
The chart frame lets you select the KPI you want to plot and an overlay you wantto display in the chart. The chart plots the KPI and overlay values for the servicesyou select.
Default view
By default the chart shows a static view of the data. If you select a non-static chartin your portlet preferences, the data is refreshed periodically according to yourportlet preferences. The time to each refresh is shown in the lower-right, below thechart.
Time window period
The time window set in the portlet preferences displays above the chart. Forexample: 8/10/09 5:28 AM to 1:28 PM
Zooming
To zoom-in to a time period within the time window, click and drag over the timeinterval you want to magnify. The chart shows only the time period you select,and Overview window opens to show the entire time window, with the magnifiedarea highlighted. To cancel the magnification, close the Overview window.
When you zoom in, the data refresh is suspended.
Key performance indicator (KPI)
You can plot KPI values for each service in the Compare Services frame. Select theKPI you want from the drop-down list on the left side of the chart frame. The KPIcan be any service template rule that outputs a numerical value. You can customizeTBSM to show any numerical rule as a KPI. For more information, see the TBSMcustomization guide.
By default, you can only view status change values for a given service. The statuschange values show the event severity value from the Netcool/OMNIbusalerts.status table. The values are:
Table 103. Event severity values
Severity value Description
0 Clear (green)
1 Indeterminate (purple)
2 Warning (blue)
3 Minor (yellow)
4 Major (orange)
5 Critical (red)
312 IBM Tivoli Business Service Manager: Service Configuration Guide

Overlay
The Overlay option lets you display a bar over the graph that containsstatus-change indicators for a given service. Select the Overlay check box todisplay the overlay data for a given service. To see an overlay for another service,click on the service you want in the Services tab. The service you select ishighlighted with a bar similar to the overlay bar. You can only show an overlay forone service at a time.Related tasks:“Selecting services”This task describes how you select services for the Time Window Analyzer.“Showing historical comparison for a service” on page 316This task shows how you can compare performance indicators from past timeperiods to the current time period.“Graphing a performance indicator for services” on page 315This task describes how to plot a key performance indicator (KPI rule) value overtime for a service.“Adding a Time Window Analyzer Portlet to a Tivoli Integrated Portal page” onpage 316This topic describes how to add a Time Window Analyzer to a page.
Selecting servicesThis task describes how you select services for the Time Window Analyzer.
Before you begin
You need to do be logged in as a user with authority to view and modify the TimeWindow Analyzer page.
About this task
You can select services to compare in the Time Window Analyzer graph threeways:
Procedure1. To select a service from the Time Window Analyzer, select Time Window
Analyzer from the Availability tasks in the left navigation frame and addservices to compare by hand.
2. Open the Time Window Analyzer in context of a service from the Service Tree,Urgent Service, or Service Viewer portlets.
Note: If you select a service with no available data, the system displays themessage :CTGBH0100W
No historical metric data is available.
This may simply mean that no data has ever been collected for DisplayName[ServiceName].
More time may be needed to collect the data, or you may need to configure theTime Window Analyzer to collect data for the service as described in the TBSMAdministrator's Guide.
Time Window Analyzer view 313

The Time Window Analyzer window opens and shows the service youspecified in the Services tab.
3. You can specify the default services you want to compare in Time WindowAnalyzer. You can set the service-context preference as a global default, or apreference for a user. When you create a custom page that includes a TimeWindow Analyzer portlet, you may want to set the default services for theportlet.
Related concepts:“Time Window Analyzer preferences” on page 317These topics describe the user and default preferences you can set for TimeWindow Analyzer.“Time Window Analyzer overview” on page 311These topics describes the main features of the Time Window Analyzer view.
Opening Time Window Analyzer for a serviceThis task describes how you open the Time Window Analyzer from a given TBSMservice.
Before you begin
You need to do be logged in as a user with authority to view and modify the TimeWindow Analyzer page.
About this task
To open the Time Window Analyzer from a service from the Service Tree, UrgentServices, or Service Viewer portlets:
Procedure1. Right-click on the service you want to plot in the chart.2. Select Show ->Compare Service Metrics from the menu that appears.
The Time Window Analyzer window opens and shows the service youspecified in the Services tab.
3. To add more services to the graph, click the Add Service button.
Adding services to compare in the graphThis task describes how you add services to compare in the Time WindowAnalyzer.
Before you begin
You need to do be logged in as a user with authority to view and modify the TimeWindow Analyzer page.
About this task
To add a service to compare in a graph:
Procedure1. From the Tivoli Integrated Portal navigation frame, select: Availability -> Time
Window Analyzer.2. Click on the Add Service button.
314 IBM Tivoli Business Service Manager: Service Configuration Guide

3. From the Search for Service window that opens, type all are part of the servicename you want to view and click Search to display a list of matching servicenames.
Note: This value is not the service display name, but the actual service name inthe TBSM database.The service displays on the Compare Services list.
Results
The results are displayed in a list (up to 10). Scroll to the item you want, and thenclick it. You might need to use the More button to see additional services.
What to do next
You can remove a service from the Compare Services list two ways:1. To remove a service from the graph, deselect the service you want to remove in
the list.2. To remove a service from the list, close and reopen the Time Window Analyzer
page. Add back any services you want.
Graphing a performance indicator for servicesThis task describes how to plot a key performance indicator (KPI rule) value overtime for a service.
Before you begin
You need to do be logged in as a user with authority to view and modify the TimeWindow Analyzer page.
About this task
In this task, you select the service, rule, and overlay values you want to plot inyour graph.
Procedure1. Add the services you want to analyze to the Time Window Analyzer Services
tab.2. Select a KPI rule from the left drop-down list. This KPI rule can be any
numeric rule from the service template assigned to the services you selected.3. Click the check box for the service or services you where you want to plot data.
The data values for the selected service are plotted on the graph.4. To hide the data for a service, click the check box for the service or services
where you plotted the data previously.5. To display an overlay value on the graph, select the Overlay check box. By
default, you can display the Status Changes overlay for the service you select.For each status change, an icon displays in the overlay bar.
Related concepts:“Time Window Analyzer preferences” on page 317These topics describe the user and default preferences you can set for TimeWindow Analyzer.
Time Window Analyzer view 315

“Time Window Analyzer overview” on page 311These topics describes the main features of the Time Window Analyzer view.
Showing historical comparison for a serviceThis task shows how you can compare performance indicators from past timeperiods to the current time period.
Before you begin
You need to do be logged in as a user with authority to view and modify the TimeWindow Analyzer page.
About this task
In this task, you select the service, rule, overlay time period values you want toplot in your graph.
Procedure1. Add the services you want to analyze to the Time Window Analyzer Services
tab.2. Click the check box for the service or services you where you want to plot data.3. Select a KPI rule from the left drop-down list. This KPI rule can be any
numeric rule from the service template assigned to the services you selected.4. To display an overlay value on the graph select the Overlay check box. You can
plot the overlay values: Change Events (Occurrences). Value2, Value3.For each change event, you can show the event or events associated with thestatus change. If there are multiple events, the event indicator is circled.
5. Click the History tab.6. Select the single service you want to compare from the services list.7. Select check box for the time periods you want to compare to the current time
period. The data points for each time period are plotted on the chart.Related concepts:“Time Window Analyzer preferences” on page 317These topics describe the user and default preferences you can set for TimeWindow Analyzer.“Time Window Analyzer overview” on page 311These topics describes the main features of the Time Window Analyzer view.
Adding a Time Window Analyzer Portlet to a Tivoli Integrated Portalpage
This topic describes how to add a Time Window Analyzer to a page.
Before you begin
You need to have the administrator user roles the let you create pages in TivoliIntegrated Portal. For example, the administrator user has the roles you need tocreate pages.
For more information on pages and portlets, see the help for these pages:
316 IBM Tivoli Business Service Manager: Service Configuration Guide

To manage user roles, from the left navigation pane, click Users and Groups →Roles. For more information, see the console help.
To manage pages, from the left navigation pane, click Settings → Pages. For moreinformation, see the console help.
To manage portlets, from the left navigation pane, click Settings → Portlets. Formore information, see the console help.
About this task
To add a Time Window Analyzer portlet to a page, you need to create a new pageand add a Time Window Analyzer portlet. You may need to add a new page toshow the Time Window Analyzer with other portlets on the same page. After youcreate the page, you can set the preferences for the Time Window Analyzer such asthe portlet title, the services you want to compare, the type of chart you want, andthe refresh rate.
Procedure1. Open Settings -> Pages in the left navigation frame. You can also click the +
(Create New Work Page) in the page tabs to open Page Settings.2. Click New Page.3. Select the Time Window Analyzer portlet from the Choose a Portlet page and
click OK.4. To save the page, click Save.5. Click Role with Access to this Page and add the roles you want. For example,
add all the roles starting with tbsm.6. Click Save.7. To set your the preferences, click on Edit options in the title bar and select
either Personalize or Edit Shared Settings from the menu that appears.Personalize controls the settings for the current user. Edit Shared Settingscontrols the settings for all users. Otherwise, the options are the same.For example: You can use the Portlet Preference tab options to change thedisplay mode size or set how the chart responds to new service context datausing the New Context Handling settings.
8. When you have finished setting your preferences, click Save.Related concepts:“Time Window Analyzer preferences”These topics describe the user and default preferences you can set for TimeWindow Analyzer.“Time Window Analyzer overview” on page 311These topics describes the main features of the Time Window Analyzer view.
Time Window Analyzer preferencesThese topics describe the user and default preferences you can set for TimeWindow Analyzer.
To set your the preferences, click on Edit options in the title bar and select eitherPersonalize or Edit Shared Settings from the menu that appears. Personalizecontrols the settings for the current user. Edit Shared Settings controls the settingsfor all users. Otherwise, the options are the same.
Time Window Analyzer view 317

Press Save to save your changes and return to the analyzer. Press Cancel todiscard any changes and return to the analyzer. You can edit these types ofpreferences:v Window: This tab allows you to customize aspects of the analysis time windowv Chart: This tab allows you to define various visual aspects of the time window
chart.v Context: This tab allows you to define the analysis context to use each time this
view instance opens.v Portlet: This tab allows you to define items for this particular portlet instance.Related tasks:“Selecting services” on page 313This task describes how you select services for the Time Window Analyzer.“Showing historical comparison for a service” on page 316This task shows how you can compare performance indicators from past timeperiods to the current time period.“Graphing a performance indicator for services” on page 315This task describes how to plot a key performance indicator (KPI rule) value overtime for a service.“Adding a Time Window Analyzer Portlet to a Tivoli Integrated Portal page” onpage 316This topic describes how to add a Time Window Analyzer to a page.
Window preferencesWindow preference for the Time Window Analyzer.
Purpose
These preferences let you to customize aspects of the analysis time window.
Preferences
Set preferences for the window. In any drop-down lists, the default setting is boldand the current setting is underlined.
Time Window SizeSpecifies the time interval shown in the chart. You specify hours or days.
Maximum ServicesSpecifies the maximum number of services shown in the Services tab.
Maximum Historical Time SlotsSpecifies the maximum number of time slots shown in the History tab.
Data Display ModeSelect one of these options from the drop-down list:v One-time Snapshot shows a static picture of the data for the service you
select.v Running History (past to now) shows data from the time window until
the current time. The data is updated according to the time window youspecified in the Check For New Data setting.
v Running Accumulation (now forward) shows data from the time youselect the service and onward. The data is updated according the timeyou specify in the Check For New Data setting.
318 IBM Tivoli Business Service Manager: Service Configuration Guide

Check for New DataSpecifies how often the chart checks for the availability of new data.
Chart preferenceChart preferences for the Time Window Analyzer.
Purpose
These preferences set the line width and line type in the chart.
Preferences
Set these parameters for the lines on your chart. In any drop-down lists, thedefault setting is bold and the current setting is underlined.
Line WidthUse the slider bar to change the width of the line in the chart. Lowernumbers equal thinner lines.
Default: 2
Line TypeYou display a line with data point markers or simple line with no datapoint markers.
When you select Visible data point markers and tooltips, a point displaysfor each instance of data plotted in the chart. In addition, tooltips showinformation about how the data point relates to the other data points in thechart. When you point to a data point, you see this information:The title of the tooltip is the service name.
Table 104. Tooltips for data points
Tooltip name Value
Before. The value and time stamp for the preceding data point.
This The value and time stamp for the data point.
After The value and time stamp for the subsequent data point.
Point The numerical position of the data point in relation to all the data points inthe chart. From example: 15 of 21.
Default: No data point markers.
Context preferencesContext preferences for the Time Window Analyzer.
Purpose
If you open a page that includes the Time Window Analyzer Portlet from the tasknavigator, the chart shows data for the services specified in the Contextpreferences. Specify the services and rules you want to use for your servicemetrics.
Preferences
Setting service context
Use the Browse button to search for services. Repeat this step for eachservice you want to add.
Time Window Analyzer view 319
The next time you open the Time Window Analyzer from the tasknavigator, the Services tab displays the service or services you specified.
To remove a service, click the Clear button.
Metric Initially Displayed
By default, the chart shows the OverallAttribute status metric for theservice.
To initially display a different metric. enter the template and rule name inthe Metric Initially Displayed field in the format:template.rulename
For example, for the WAS Method Invocation Rate rule in theBSMAccelerator_WASMetrics service template, enter:BSMAccelerator_WASMetrics.WAS Method Invocation Rate
To revert to the default, delete the metric.
Portlet preferencesPortlet preference for the Time Window Analyzer.
Purpose
These preferences specify a unique title, display mode, and context for your TimeWindow Analyzer portlet.
Preferences
Set these preferences for the portlet. In any drop-down lists, the default setting isbold and the current setting is underlined.
Title Specifies the title for the portlet.
User Interface Display ModeSelect the display type you want from these drop-down list options:
Standard sizeThe full-size portlet. Default.
Reduced sizeReduces heading font size and width of the Compare area
New Context Handling
Controls how the chart responds to new service context data when thepage is launched from another page (launchPage), or when a service isclicked in a Service Tree or other portlet on the same page(NodeClickedOn). By default, the chart replaces the service data when itreceives new service context data (New context replaces current setting).
When you first open a page that includes a Time Window Analyzer portlet,the chart shows data for a service or the services as follows:v When you right-click on a service and select the Compare Service
Metrics option, the chart shows data for the service you clicked. Thecontext of the chart is for a single service, which is the default setting:New context replaces current.
320 IBM Tivoli Business Service Manager: Service Configuration Guide

v If you open a page that includes the Time Window Analyzer Portletfrom the task navigator, the chart shows data for the services specifiedin the Context Preferences.
Once the portlet is open, these options specify how the chart respondswhen the new context data is sent to the portlet. Select one of theseoptions from the drop-down list:
Ignore new contextThe chart does not respond to any new context data from otherportlets on the same page. However, if you launch from anotherpage, the context data changes.
New context replaces current.Replace the current data with data from the new service context.Default setting.
New context added to currentAdd the new service context data to the current service data in thechart. Services accumulate until the Maximum Services limit isreached. The Maximum Services setting is on the Window tab.
Time Window Analyzer view 321

322 IBM Tivoli Business Service Manager: Service Configuration Guide

Working with the configuration documenter
The Configuration Documenter is used to view the configuration of aNetcool/Impact installation.
Configuration documenter overviewThe Configuration Documenter is an integral part of any Netcool/Impactinstallation.
With the Configuration Documenter, you can view the detailed information aboutthe system components:v Cluster status: the name and the host where primary and secondary servers are
running. Also, which server is currently the primary.v Server status: information about the memory status for all servers in the cluster.v Event status: information about the event-related services that are running. For
example, reader, listener, and event processor in the cluster and the number ofevents in the queue for each.
v Data sources: each defined data source.v All data types, including predefined data types such as Doc, Schedule, and
LinkType; user-defined internal and external data types; and report data types.v Policiesv Services
Opening the configuration documenterUse this procedure to open the Configuration Documenter for a selected cluster.
Figure 56. An example of the configuration documenter screen
© Copyright IBM Corp. 2008, 2013 323

Procedure1. Log on to Tivoli Integrated Portal.2. Select any component of Netcool/Impact to open it in a tab, in the workspace
on the right.For example, select System configuration > Event Automation > Services.
3. In the cluster selection menu, select a cluster for which you want to open theConfiguration Documenter.
4. Click the Configuration Documenter icon, , next to the Cluster menu, toopen the configuration documenter for the selected cluster.The configuration documenter opens in a new browser window. Use the tableof contents to view your cluster status, server status, event status, data sources,data types, policies, and services.
Viewing the cluster statusUse this procedure to view the information about the current cluster status in theconfiguration documenter.
Procedure1. Open the configuration documenter.2. Select Status in the table of contents at the top of the page.
The Cluster Status section contains the following information:v Which server is the primary serverv The name and host where the primary server is running.v The name and host of each secondary server.
Viewing the server statusUse this procedure to view the information about the current server status in theconfiguration documenter.
Procedure1. Open the configuration documenter.2. Select Status in the table of contents at the top of the page.
The Server Status section contains the following information:
Memory statusShows both the current heap memory usage and the maximum heapsize that the Java virtual machine where Netcool/Impact is running,can use. In a clustered setup, this information is shown for all serversin the cluster.
Viewing data sourcesUse this procedure to view the data source details in the configuration documenter.
Procedure1. Open the configuration documenter.2. Choose Data Sources in the table of contents at the top of the page.
A list of defined data sources displays showing the data source names and datasource types.
324 IBM Tivoli Business Service Manager: Service Configuration Guide

3. Choose the data source that you want to view.The data source details list displays showing host, port, and databaseinformation.
Viewing data typesUse this procedure to view data type details in the configuration documenter.
Procedure1. Open the configuration documenter.2. Choose Data Types in the table of contents at the top of the page.3. Choose a data type from the data type list.
You can view the following details about a data type:v Field Namev Display Namev Data source name (for external data types). By clicking the data source name,
you can display the connection information.v Configuration information for each of the fields in the data type, including
the Field Name, Display Name, Key field, Alias, Default Expression, andChoices.
v Dynamic links that are associated with the data type4. To see the connection information for an external data type, click the data
source name.
Viewing policiesYou can use the configuration documenter to view the policy details.
Procedure1. Open the configuration documenter.2. Choose Policies in the table of contents at the top of the page.3. Choose a policy from the Policy list.
Viewing servicesUse this procedure to view service details in the configuration documenter.
Procedure1. Open the configuration documenter.2. Choose Services in the table of contents at the top of the page.3. Choose the service that you want to view from the Services list.
You can use the configuration documenter to view the following informationabout a service:v Namev Class Namev Run status (running or not running)v Auto start configurationv Logging configurationv Configuration properties
Working with the configuration documenter 325

4. Select the associated policy link to see it displayed in the documenter.
326 IBM Tivoli Business Service Manager: Service Configuration Guide

Custom static canvases
This section contains information about how to create, edit, and delete customstatic canvases.
About custom canvasesThis topic describes custom canvases.
This chapter explains how to create custom canvases.
A view definition is a set of visual rules that you apply to a dynamically createdand updated portion of your service model. A custom canvas, however, contains afixed set of visual elements that do not change in content; however both typesprovide status information. View definitions are defined at the template level andcustom canvases are defined at the service template and service instance level.
Custom static canvases are made up of various visual elements. For example, theView Service tab in the IBM Tivoli Business Service Manager (TBSM) ServiceEditor is a canvas that contains the default service dependency view. You cancustomize this view to display different indicators, gauges, widgets, anddecoration. You can customize the data that displays in a visual element. Thefollowing sections show some examples of the visual elements that you can choose.
Gauges
You can choose from a number of types of gauges located on the Gauges tab in theService Editor when you create or edit a custom canvas. The table below is asample of those from which you can choose and provides an indication of theinformation that can be displayed using the full range of gauges available.
Table 105. Sample gauges
Gauge Description
Speedometer Gauge
You can configure this gauge to show a displayname and totals, for example, the number ofcritical and high tickets for a service. In thisexample, the needle points to the total number ofopen tickets for a service instance calledGetThereFastAsia.
© Copyright IBM Corp. 2008, 2013 327

Table 105. Sample gauges (continued)
Gauge Description
Gradient Gauge
You can also configure the gradient gauge toshow a display name and totals. For example,this gauge was configured to show total opentickets for the ABCBankeBanking Service.
Tachometer Gauge
You can configure these gauge needles to pointto a green, yellow, or red background, inaddition to display name and totals.
Vertical Gauge
This gauge consists of 10 horizontal barsreflecting the current value and threshold state.The filled horizontal bars reflect the thresholdstate using one of two colors. You can configurethe following parameters for this gauge:
v Minimum value
v Current value
v Threshold value
v Maximum value
v The color when the value is less than or equalto the threshold value.
v The color when the value is greater than thethreshold value.
Circular Gauge
This is a two color circular gauge. The rim colorreflects the threshold state. The marker triangleshows the defined threshold point. You canconfigure the following parameters for thisgauge:
v Minimum value
v Current value
v Threshold value
v Maximum value
v The color when the value is less than or equalto the threshold value.
v The color when the value is greater than thethreshold value.
328 IBM Tivoli Business Service Manager: Service Configuration Guide

Table 105. Sample gauges (continued)
Gauge Description
Half-circle Gauge
This is a two color circular gauge. Thebackground color reflects the threshold state. Youcan configure the following parameters for thisgauge:
v Minimum value
v Current value
v Threshold value
v Maximum value
v The color when the value is less than or equalto the threshold value.
v The color when the value is greater than thethreshold value.
Two-threshold circular gauge
The two-threshold circular gauge shows low andhigh thresholds. The rim color reflects the state ofthe two thresholds. Two marker triangles showthe defined threshold points. You can configurethe following parameters for this gauge:
v Minimum value
v Low Threshold value
v Current value
v High threshold value
v Maximum value
v The color when the value is less than the lowthreshold value.
v The color when the value is within low andhigh thresholds
v The color when the value is greater than thehigh threshold value.
Widgets
You can also choose from a number of widget types on the Widget tab in theService Editor when you create or edit a custom canvas. The table below shows asample of the widgets from which you can choose and provides an indication ofthe information that can be displayed using the full range of widgets.
Table 106. Sample widgets
Widget Description
Threshold widget
This widget is a two color widget thatallows you to display and configure thefollowing attributes:
v Minimum value
v Current value
v Threshold value
v Maximum value
v The color when the value is less than orequal to the threshold value.
v The color when the value is greater thanthe threshold value.
Custom static canvases 329

Table 106. Sample widgets (continued)
Widget Description
Trend widget
This widget allows you to view the currentvalue and a trend line representing threestates. You can also set values for thewidget:
v Minimum value
v Current value
v Threshold value
v Maximum value
v Value trend. The values are -1, 0, 1representing a decreasing, steady, orincreasing trend.
v The color when the value is less than orequal to the threshold value.
v The color when the value is greater thanthe threshold value.
Frame widget
The background color for this widget can bemapped to reflect the current state. You canconfigure the following attributes for thiswidget:
v Display value
v Numbering format
v Color of the displayed label and value
v Background color
v Display label
Widget
The background color for this widgetcan bemapped to reflect the current state. You canconfigure the following attributes for thiswidget:
v Display value
v Numbering format
v Background color
Bar widget
This widget consists of 5 fixed vertical bars.The number of visible bars displayed reflectsthe current state within the minimum andmaximum range that you have defined. Youcan configure the following attributes forthis widget:
v Minimum value
v Current value
v Maximum value
Figure 57. Chevron
Chevron
This symbol allows you to display two textlabels each showing any service data type.The optional rectangle that can beconfigured to change color depending on thestate of the service or it can be set to a colorindependent of the service state. Thebackground color can be configured tochange depending on the state of the serviceor it can be set to a color independent of theservice state.
330 IBM Tivoli Business Service Manager: Service Configuration Guide

Indicators
You can choose indicators that have from one to six customizable elements.Figure 58 and Figure 59 show some examples.
Two-Element Prototype
Figure 58 shows a two-element visual before it has been configured.
Six-Element Prototype
Figure 59 shows a six-element visual before it has been configured.
Decorations
Decorations are simple visual elements that you can add to your custom canvas.These decorations display no data. You can drag any of the graphics from theDecorations tab of the visual element palette to the canvas and then resize it usingyour mouse or open the Inspector to resize.
The figure below shows some of the images available on the Decorations tab:
Figure 58. Sample Two-Element Prototype before it is configured
Figure 59. Sample Six-Element Prototype before it is configured
Custom static canvases 331

Frame
You can set the value for the Title field to display a string for any service datatype. Using the Inspector, you can enable an image that is displayed in front of thetitle. You can also set the title color, the height and width of the symbol byadjusting the properties.
Text symbol
The Text symbol can be used to display text from any data service type. You canconfigure the following parameters for this symbol:v display stringv the numbering formatv color of the displayed textv whether a border is displayedv whether or not a background color is displayed
Figure 60. Default decorations
Figure 61. Frame
332 IBM Tivoli Business Service Manager: Service Configuration Guide

v background color
The "IBM" is an image. The rest of the defaults are visual elements and you canadjust their properties.
There are also several additional shapes that you can use to replace the TBSMdefault service instance visual element.
Note: On the Decoration tab, the rounded rectangle represents all of these choices.You must choose the shape you want in the drop-down list when you configureyour shape.
Table 107. Service indicators samples
Visual element Description
Rectangle
Rounded Rectangle
Ellipse
Diamond
Triangle Up
Figure 62. Text symbol
Custom static canvases 333

Table 107. Service indicators samples (continued)
Visual element Description
Triangle Down
Triangle Left
Triangle Right
Note: To resize an indicator, you must change the properties that define the scaleof the indicator. This is done in the Inspector. For more information aboutconfiguring indicators, see “Static custom visual elements” on page 339.
To manage user roles, from the left navigation pane, click Users and Groups →Roles. For more information, see the console help.
To manage pages, from the left navigation pane, click Settings → Pages. For moreinformation, see the console help.
To manage portlets, from the left navigation pane, click Settings → Portlets. Formore information, see the console help.
For examples of how to use custom canvases, see the information center for thisversion of TBSM at: http://www.ibm.com/developerworks/wikis/display/tivolidoccentral/Tivoli+Business+Service+Manager.
Click: Business Service Manager > Scenarios Guide > Creating a custom canvasfor a user
SVG image
Located on the Decoration tab, the Scalable Vector Graphics (SVG) image allowsyou to insert any SVG image in your Custom Canvas. Any SVG-based image canbe used.
334 IBM Tivoli Business Service Manager: Service Configuration Guide

It can also be used as a background image using the inspector:1. Change the labelShow property to false to prevent the label from being
displayed.2. Change the symbolWidth and symbolHeight properties so that the image fills the
canvas appropriately. If you do not alter these values the aspect ratio of theoriginal image is maintained and the image might not fill the canvas area.
If you want to use an SVG image that is not installed by TBSM, you must copy itto Dashboard server before using it in a Custom Canvas. When selecting an SVGfile, you type a path in the SVG file (relative to css) field. The path you type mustbe relative to the av/css directory on the Dashboard server. This is also thedirectory from which the base TBSM CSS files are loaded. For example, thestandard TBSM SVG images that are installed with TBSM are located in the../../icons/svg directory (relative to the av/css directory).
In addition to choosing the SVG image that you want to insert, you can alsochoose values to be inserted for the Label and Label Color fields.
Setting the value of the Render As field allows you to define how the ScalableVector Graphics (SVG) image is displayed. If you set the value of this field toimage, the image defined in the SVG file (relative to CSS) field is displayed. Ifyou type state into the Render As field, a different image is displayed dependingon the value of _overallServiceStatus.
Figure 64 on page 336 shows an example of a number of SVG images displayingthe status value appropriate to their state.
Figure 63. SVG image
Custom static canvases 335

Creating new custom canvasesThis topic describes how to create custom canvases.
About this task
This section describes how to create custom canvases, edit them, and delete them.
To create a custom canvas, complete the following steps:
Procedure1. In the Service Navigation portlet, select Custom Canvases from the drop-down
menu.2. Click the Create Custom Canvas button.
A blank service view opens in the Service Viewer with the Indicators, Gauges,Widgets, and Decorations tabs showing on the left of the viewer. TheIndicators tab is open by default.You may need to drag the tabs to the right to see all the indicators.
Note: By default, permissions needed to save and delete Custom Views(canvases) are set for the user who creates the custom canvas. If you want togive these permissions to a user group, you must select the group on thePreferences window before you start editing the custom canvas. Make sureyour settings are correct for user or group before creating the custom canvas.To set the preference, click the Edit Preference button in the Service Editortoolbar.
Note: Before adding any visual elements to the new custom canvas, name thenew canvas and save it.
Figure 64. Sample of SVG image with Render As field set to state
336 IBM Tivoli Business Service Manager: Service Configuration Guide

Note: The Name field for rules, data sources, maintenance schedules, viewdefinitions and other objects must not contain these special characters:" & < > \ / * ? | ( ) : ; $ ! %
Names must not contain spaces. Otherwise, these objects may not be savedproperly in the TBSM database. If the object does not save, remove any specialcharacters or spaces from the name field.
Related concepts:“Custom Canvases” on page 25This topic describes the elements in Custom Canvases in the Service Navigationportlet.Related reference:“View Service toolbar and menus” on page 234This topic describes the elements of the View Service toolbar and menu.
Changing the scope of custom canvasesThis topic describes how to change the scope of custom canvases.
By default, a custom canvas is saved on a "per user" basis for the user who createdit. This can be changed in the Viewer Preferences window of the ServiceEditor/Viewer where you can choose to work with canvases for any group towhich your user ID is assigned. This decision must be made before the customcanvas is created. Since the time at which the files for a custom canvas are createddepends on the way you create the custom canvas, you should understand thedifferences:v If you create the custom canvas by pressing the Create Custom Canvas button
in the Service Viewer or View tab in the Service Editor, the files for the customcanvas are immediately created.
v If you create the custom canvas from the Custom Canvases in the ServiceNavigation portlet, the files for the custom canvas are not created until you firstsave the canvas and you are prompted for the name for the custom canvas.
Note: This option is not available on the Service Availability page.
After a custom canvas is created, you must reconfigure the files associated with itto change the scope. This should be done by your TBSM administrator when theTBSM services are shut down. Here are some facts you need to know:v Files for custom canvases are stored in the TBSM database. Canvases with a user
scope of User1 are configured with a file category of customcanvas and asubcategory of user_user1. Canvases with a group scope of group2 are storedwith a file category of customcanvas and a subcategory of group_group2.
v There are three files that make up a custom canvas, each with its own uniquefile type: *.layoutxml, *.datamappings, and *.props.
v Custom canvases created under the Custom canvases section of the ServiceNavigation portlet have the name of the custom canvas in the names of theirfiles. Custom canvases created in the Service Viewer have the service instance IDof the selected service in the names of their files.
To see a listing of custom canvas files, at a command prompt type:
%TBSM_TOOLKIT_BASE%\bin\listArtifact.bat -category customcanvas
Custom static canvases 337

$TBSM_TOOLKIT_BASE/bin/listArtifact.sh -category customcanvas
If User1 creates a custom canvas for ServiceA (which has Service Instance ID 1)which is visible by only User1, the files for the custom canvas will be listed in thedatabase with the following configuration attributes:
Table 108. Configuration attributes
Artifact Name Category Subcategory
CanvasTemplate=CustomView,ServiceInstanceID=1,ServiceTypeID=1,.datamappings
customcanvas user_user1
CanvasTemplate=CustomView,ServiceInstanceID=1,ServiceTypeID=1,.layoutxml
customcanvas user_user1
CanvasTemplate=CustomView,ServiceInstanceID=1,ServiceTypeID=1,.props
customcanvas user_user1
If User2 creates a custom canvas from the Custom canvases section called CanvasA,which is visible by anyone in group tbsmAdmins, the files for the custom canvaswill be listed in the database with the following configuration attributes:
Table 109. Configuration attributes
Artifact Name Category Subcategory
CanvasTemplate=CustomView,ServiceInstanceID=0,ServiceTypeID=CanvasA,.datamappings
customcanvas group_tbsmAdmins
CanvasTemplate=CustomView,ServiceInstanceID=0,ServiceTypeID=CanvasA,.layoutxml
customcanvas group_tbsmAdmins
CanvasTemplate=CustomView,ServiceInstanceID=0,ServiceTypeID=CanvasA,.props
customcanvas group_tbsmAdmins
If a custom canvas is created as in the first example, and you wanted to make itavailable to anyone in group tbsmAdmins, these steps should be performed for allthree of the custom canvas files for ServiceInstanceID=1:1. Copy the custom canvas file named
’CanvasTemplate=CustomView,ServiceInstanceID=1,ServiceTypeID=1,.extension
from the TBSM database to your temporary file directory. At a commandprompt type:
%TBSM_HOME%\XMLtoolkit\bin\getArtifact.bat -nameCanvasTemplate=CustomView,ServiceInstanceID=1,ServiceTypeID=1,.extension -categorycustomcanvas -subcategory user_user1-directory temp
$TBSM_HOME/XMLtoolkit/bin/getArtifact.sh -nameCanvasTemplate=CustomView,ServiceInstanceID=1,ServiceTypeID=1,.extension -categorycustomcanvas -subcategory user_user1-directory temp
338 IBM Tivoli Business Service Manager: Service Configuration Guide

Where extension is datamappings, layoutxml, and props, and temp is the locationon your system that you use as a temporary file system directory.
2. Copy the custom canvas file named:’CanvasTemplate=CustomView,ServiceInstanceID=1,ServiceTypeID=1,.extension
into the TBSM database with an updated subcategory indicating the updatedtbsmAdmins group information. At a command prompt type:
%TBSM_HOME%\XMLtoolkit\bin\putArtifact.bat-name temp/CanvasTemplate=CustomView,ServiceInstanceID=1,ServiceTypeID=1,extension-category customcanvas -subcategory group_tbsmAdmins
$TBSM_HOME/XMLtoolkit/bin/putArtifact.sh-name temp/CanvasTemplate=CustomView,ServiceInstanceID=1,ServiceTypeID=1,.extension -categorycustomcanvas -subcategory group_tbsmAdmins
Where extension is datamappings, layoutxml, and props, and temp is the locationon your system that you use as a temporary file system directory.
Note: It may be necessary to know the instance ID of a service, which is anarbitrary integer assigned at the time the service is created in TBSM. For example,when connected to TBSM's DB2 database, use the following SQL on to determinethe instance ID of a service called "My service" :select serviceinstanceid from TBSMBASE.serviceinstance whereserviceinstancename = 'My service';
Static custom visual elementsThis topic describes how to configure visual elements for a view.
About this task
It is possible to resize a number, but not all, of the custom canvas visual elements.If the properties outlined in this procedure are not available, the visual elementscannot be resized. To configure visual elements for a view, complete the followingsteps:
Procedure1. Make sure the Select tool is activated in the toolbar.
The Select tool allows you to select and move a visual element.2. Click the tab with the type of visual element you want in the visual elements
palette.3. Drag the visual element you want into the CustomView.
A copy of the selected image appears in the CustomView and the ConfigureNew Instance - Select service instance window opens in a new browserwindow.
4. Select the service instance that you want to display as the selected visualelements.
5. Click Next to define the visual representation settings.
Custom static canvases 339

6. What you see in the window depends on the indicator you selected.Configure the properties of the visual elements as required and click Finish.
7. If you want to resize a visual element, you must update the appropriateproperties in the Inspector. The properties that are displayed differ dependingon the type of inspector you have selected. To open the Inspector click View-> Inspector.
8. To resize the visual element, update one of the following sets of parameters:v baseDim
v symbolWidth and symbolHeight
v shapeWidth and shapeHeight
9. Close the Inspector.10. Click Save on the custom canvas toolbar.Related concepts:“Service Editor” on page 31This topic describes the Service Editor portlet.“Example 1: Configuring a speedometer gauge” on page 341This topic is an example, using the TBSM database, of how to configure aspeedometer gauge.“Example 2: Configuring a service instance indicator” on page 343This topic is an example, using the TBSM database, of how to configure a serviceinstance indicator.Related tasks:“Example 3: Configuring a three-element prototype” on page 346This topic is an example, using the TBSM database, of how to configure athree-element prototype.
Working with custom static decorationsThis topic describes custom static decorations. This topic also describes how tocreate, edit, and delete custom static decorations.
About this task
Decorations are simple visual elements you can add to your custom canvas. Thesedecorations are simply images that display no data. You can drag any of thegraphics from the Decorations tab of the visual element palette to the canvas. TheDecorations tab lets you create a static (GIF, JGP, PNG) or scalable (SVG) image.
Custom images can be accessed by the image-based widgets. To access your ownimages, copy the browser-compatible image files to the$TBSM_DASHBOARD_SERVER_HOME/images directory. When an image is in the$TBSM_DASHBOARD_SERVER_HOME/images directory, you can reference the image fromthe Inspector window.
Some decorations require configuration. After you select a decoration, theConfigure New Instance window might be displayed.
Creating custom static decorationsAbout this task
To configure decorations from a view, complete the following steps:
340 IBM Tivoli Business Service Manager: Service Configuration Guide

Procedure1. Make sure the Select tool is activated in the toolbar.
The Select tool allows you to select and move a visual element.
2. Click the Decorations tab in the visual elements palette.3. Drag the image you want into the CustomView.
A copy of the selected image appears in the CustomView.4. You can drag the image to any location you want inside the CustomView.5. To change the properties for the decoration, select View > Inspector to display
the Inspector window.You use the Inspector window to modify an image or set values for a URL ormouse-over text for the decoration.
6. Click Save on the toolbar.
Editing custom canvas decorationsAbout this task
To edit a decoration:
Procedure1. Make sure the Select tool is activated in the toolbar.2. Select the decoration that you want to edit.3. Select View > Inspector to open the Inspector window. You use the Inspector
window to modify the image, set values for a URL, or mouse-over text for theelement.
Deleting custom static decorationsAbout this task
To delete a decoration:
Procedure1. Make sure the Select tool is activated in the toolbar.
The Select tool allows you to select and move a visual element.2. Select the visual element you want to delete.3. Click the Delete button.
The decoration disappears from the Service Editor.
Note: You can also delete a decoration by selecting it and selecting Edit >Delete from the Service Editor toolbar.
Example 1: Configuring a speedometer gaugeThis topic is an example, using the TBSM database, of how to configure aspeedometer gauge.
Figure 65. Select Tool Button
Custom static canvases 341

The data in this example was created for the tutorials found in the TBSM Scenariosguide. It is based on the data in the TBSM database.
This example shows you how to add a gauge that represents the number of opentickets for the US region of the GetThereFastTravelBooking service. The gauges forthe Asian and European regions have already been added, as shown in Figure 66.If you want to see the services shown in this example, you need to create them asdescribed in the TBSM Scenarios guide.
To add the US region gauge, complete the following steps:1. Select a speedometer gauge, in this example Gauge 8, and click in the Service
Editor.A copy of the gauge appears in the CustomView and the Configure NewInstance Gauge - Select service instance window opens in a new browserwindow.
Figure 66. GetThereFastBooking service gauges
Figure 67. Configure New Instance: Gauge: Select service instance
342 IBM Tivoli Business Service Manager: Service Configuration Guide

2. Select US_Region_for_GetThereFast and click Next.The Configure Visual representation settings opens.
3. Accept the Gauge Minimum field default of 0.4. Enter an appropriate number, 175 for example.5. Select RegionTicketsSum from the Gauge Value list.
In this example, RegionTicketsSum is an Internal Formula rule that counts thenumber of tickets for a given region. The output value for the rule will bedisplayed in the gauge. You can display the output values from any numericrule in a gauge.
6. Click Finish.Before the view is saved, the new gauge will display as follows:
7. Click Save in the Service Editor toolbar.The US region ticket total gauge displays.
8. To change the properties for the indicator, click the image and select View >Inspector to display the Inspector window.You use the Inspector window to modify the image, set values for a URL, ormouse-over text for the element.
9. To ensure that the totals for the new gauge are correct, check the gaugereadings against the Ticket column in the Service Navigation portlet Servicestree for the GetThereFastBooking service.
Related tasks:“Static custom visual elements” on page 339This topic describes how to configure visual elements for a view.
Example 2: Configuring a service instance indicatorThis topic is an example, using the TBSM database, of how to configure a serviceinstance indicator.
The data in this example was created for the tutorials found in the TBSM Scenariosguide. It is based on the data in the TBSM database.
Figure 68. Unsaved gauge indicator
Figure 69. Completed view
Custom static canvases 343

This example shows you how to create a rounded rectangle for theAsia_Region_for_ABCBank service instance for a static custom view:1. Select the Shape without image in the Decorations tab. Click in the visual
representations settings window in the Service Editor.A copy of the square appears in the CustomView and the Configure NewInstance: Shape - Select service instance window opens in a new browserwindow.
2. Select Asia_Region_for_ABCBank and click Next.The Configure New Instance - Visual representation settings window opens.
Figure 70. Configure New Instance: Shape - Select service instance
344 IBM Tivoli Business Service Manager: Service Configuration Guide

3. Accept the default value realTimeServiceState color in the Background Colorfield. The new shape changes from green to yellow to blue as the servicestatus changes.
4. Select Round Rectangle as the Shape Type.5. Click the Edit check box next to the Shape Width field and change the width
to 80.6. Click the Edit check box next to the Shape Width field and change the width
to 100.7. Click Finish.
The unsaved shape should resemble the one in Figure 72.
8. Keep the defaults for Display Name Color and Display Name Position: Blackand Center.
Figure 71. Configure New Instance: Shape - Visual representation settings window forrounded rectangle
Figure 72. Unsaved rounded rectangle shape
Custom static canvases 345

9. Click Save in the Service Editor toolbar.The new shape should look like the one in Figure 73.
Since custom canvases are created at the service instance level, you need toadd every instance separately to include it in the view.
10. To change the properties for the shape, click the image and select View >Inspector to display the Inspector window.You use the Inspector window to modify the image, set values for a URL, ormouse-over text for the element.
Related tasks:“Static custom visual elements” on page 339This topic describes how to configure visual elements for a view.
Example 3: Configuring a three-element prototypeThis topic is an example, using the TBSM database, of how to configure athree-element prototype.
About this task
The data in this example was created for the tutorials found in the TBSM Scenariosguide. It is based on the data in the TBSM database.
This example shows you how to add a three-element prototype to a customcanvas. This prototype changes color as the status of the service changes andshows the number of critical, the number of high tickets, and the ticket total.
Procedure1. Select the Three-element Prototype indicator and drag it to the Service Editor.
A copy of the prototype appears in the CustomView and the Configure NewInstance: Three Element Prototype window opens in a new browser window.
2. Select the GetThereFast service instance.3. Click Next to open the Visual representation settings window.
In these steps, you create labels and select the numeric-rule output values youwant to display for each label.
4. In the Visual representation settings window, accept the default valuerealTimeServiceState color in the Background Color field so that theconfigured prototype changes from green to yellow to blue as the servicestatus changes.
5. Type Critical in the Label 1 field to change the selection list to a text field.
Figure 73. Saved rounded rectangle shape
346 IBM Tivoli Business Service Manager: Service Configuration Guide

The Critical value for the Critical element will be the output value from theRegSumCritical_Sum_OSRegion_to_Online_Services rule.
6. Select RegSumCritical_Sum_OSRegion_to_Online_Services in the Value 1 field.The Critical value for the Critical element will be the output value from theRegSumCritical_Sum_OSRegion_to_Online_Services rule.
7. Type High in the Label 2 field to change the selection list to a text field.8. Select RegSumHigh_Sum_OSRegion_to_Online_Services in the Value 2 field.9. Type Tickets in the Label 3 field to change the selection list to a text field.
10. Select RegionTicketsSum_Sum_OSRegion_to_Online Services in the Value 3field.
11. Click Finish.The unsaved prototype should resemble the one in Figure 74.
12. Click Save in the Service Editor toolbar.The new prototype should look like the one in Figure 75.
The number of critical and high tickets display with the correct total ticketsnumber.
13. To change the properties for the indicator, click the image and select View >Inspector to display the Inspector window.You use the Inspector window to modify the image, set values for a URL, ormouse-over text for the element.
Related tasks:“Static custom visual elements” on page 339This topic describes how to configure visual elements for a view.
Figure 74. Three-element prototype indicator - before saving
Figure 75. Three-element prototype - saved
Custom static canvases 347
Deleting visual elementsAbout this task
To delete a visual element:
Procedure1. Make sure the Select tool is activated in the toolbar.
The Select tool allows you to select and move a visual element.2. Select the visual element you want to delete.3. Click the Delete.
The indicator disappears from the Service Editor.
Note: You can also delete a visual element by selecting it and selecting Edit >Delete.
Example 4: Configuring multiple gauges per serviceThis topic describes how to configure multiple gauges for a service.
Before you begin
TBSM allows you to configure multiple gauges per service. In this example, youcreate a custom canvas and configure two different gauges for the serviceGetThereFastTravelBooking. This service represents the number of open tickets forthe US region.
The data in this example was created for the tutorials found in the TBSM Scenariosguide. It is based on the data in the TBSM database.
Note: If you want to see the services shown in this example, you need to createthem as described in the TBSM Scenarios guide.
To add two new US region gauges, complete the following steps:
Procedure1. From the Service Administration page, select Custom Canvases in the Service
Navigation portlet.2. Select the custom canvas you want to add gauges to.3. In the Service Editor, make sure that the View Service tab is showing. Click the
Gauges tab to see widgets for gauges.4. Click one of the tachometer gauges. Your cursor changes into a crosshair
pointer.5. Click the custom canvas to add the gauge. The Configure New Instance
window appears.6. To configure a speedometer gauge, follow these steps:
a. Expand the list of services and select GetThereFastTravelBooking.b. Click Next.c. Specify the parameters according to Table 110 on page 349.
348 IBM Tivoli Business Service Manager: Service Configuration Guide
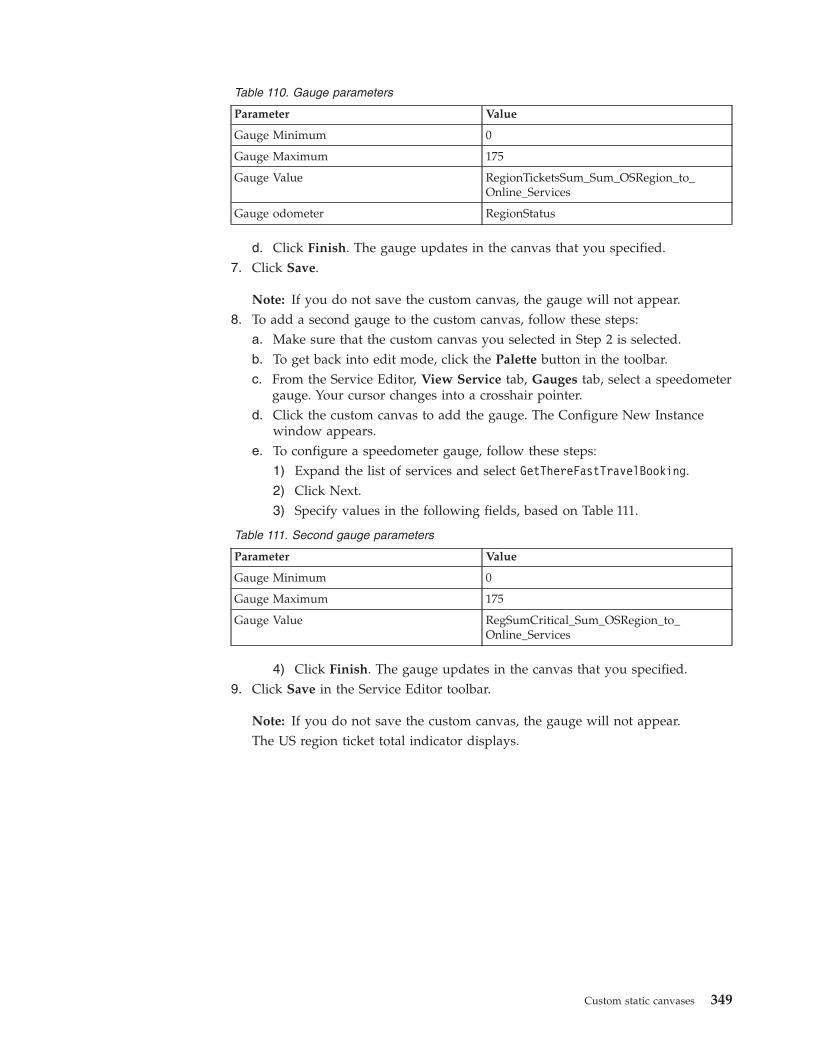
Table 110. Gauge parameters
Parameter Value
Gauge Minimum 0
Gauge Maximum 175
Gauge Value RegionTicketsSum_Sum_OSRegion_to_Online_Services
Gauge odometer RegionStatus
d. Click Finish. The gauge updates in the canvas that you specified.7. Click Save.
Note: If you do not save the custom canvas, the gauge will not appear.8. To add a second gauge to the custom canvas, follow these steps:
a. Make sure that the custom canvas you selected in Step 2 is selected.b. To get back into edit mode, click the Palette button in the toolbar.c. From the Service Editor, View Service tab, Gauges tab, select a speedometer
gauge. Your cursor changes into a crosshair pointer.d. Click the custom canvas to add the gauge. The Configure New Instance
window appears.e. To configure a speedometer gauge, follow these steps:
1) Expand the list of services and select GetThereFastTravelBooking.2) Click Next.3) Specify values in the following fields, based on Table 111.
Table 111. Second gauge parameters
Parameter Value
Gauge Minimum 0
Gauge Maximum 175
Gauge Value RegSumCritical_Sum_OSRegion_to_Online_Services
4) Click Finish. The gauge updates in the canvas that you specified.9. Click Save in the Service Editor toolbar.
Note: If you do not save the custom canvas, the gauge will not appear.The US region ticket total indicator displays.
Custom static canvases 349

Results
What to do next
To change the properties for the gauges, click the image and select View >Inspector to display the Inspector window. You use the Inspector window tomodify the image, set values for a URL, or mouse-over text for the element.
To ensure that the totals for the new gauge are correct, check the gauge readingsagainst the Ticket column in the Service Navigation portlet Services tree for theGetThereFastBooking service. The GetThereFastUS readings should be 27 tickets.
Working with the InspectorThis topic describes how to open the Inspector, view inspector properties for anelement, and edit a property value.
About this task
The Inspector window lets you view the data and visual appearance of a givenvisual element (typically representing a service). In certain cases, properties areeditable. To open the Inspector window:
Procedure1. Open the View menu and select Inspector. The Inspector window opens.2. Make sure the Select tool is activated in the toolbar.3. To view the properties for an element, click the element. The properties are
displayed in the Inspector window.
Editing propertiesAbout this task
To modify a property value:
Procedure1. Double-click in the Value column for the property you want to modify.2. Type the value you want for the property and press the Enter key. For
information about the Inspector window properties, see Table 112 on page 351.3. In the View Service tab, click Save in the toolbar.
350 IBM Tivoli Business Service Manager: Service Configuration Guide

Inspector propertiesThis topic describes Inspector properties.
Table 112 describes the properties you can edit for visual elements. You must notedit any of the properties that are not listed in Table 112.
Table 112. Inspector visual properties for indicators and decorations
Property Description
displayName Display name for the visual element.
entityName Name of the label, for example ABC.
fillAngle For shape decorations such as rectangles. The angle of thegradient for the fillStyle RADIAL_GRADIENT.
fillColor1 For shape decorations such as rectangles. Color 1 of thegradient for the fillStyles: RADIAL_GRADIENT andLINEAR_GRADIENT. The value can be a color name such as black,or the hexadecimal RGB value code for the color such as#000000 for black. These codes are the same hex codes that areused for HTML code.
fillColor2 For shape decorations such as rectangles. Color 2 of thegradient for the fillStyles: RADIAL_GRADIENT andLINEAR_GRADIENT. The value can be a color name such as black,or the hex code for the color such as #000000 for black. Thesecodes are the same hex codes that are used for HTML code.
fillEnd For shape decorations such as rectangles. The end value of thegradient for the fillStyles: RADIAL_GRADIENT andLINEAR_GRADIENT.
fillStart For shape decorations such as rectangles. The start value of thegradient for the fillStyles: RADIAL_GRADIENT andLINEAR_GRADIENT.
fillstyle For shape decorations such as rectangles. Fill style number ofthe label. The valid values are:
v NO_FILL
v SOLID_COLOR
v RADIAL_GRADIENT
v LINEAR_GRADIENT
iconLocation Directory path to the location of the icon for a decoration. Theicons are located in the $TBSM_DASHBOARD_SERVER_HOME/imagesdirectory. When you reference an image file, use the path../../images/filename.
indicatorColor The color number for the indicator.
labelColor The color for the label. The value can be a color name such asblack, or the hex code for the color such as #000000 for black.These codes are the same hex codes that are used for HTMLcode.
labelPosition The position of the label relative to the visual element. Thevalid values are:
v Center
v Top
v Bottom
v Left
v Right
Custom static canvases 351

Table 112. Inspector visual properties for indicators and decorations (continued)
Property Description
shapeHeight Integer that sets the height of the shape in pixels.
shapeType The type of shape. The valid values are:
v Rectangle
v RoundRectangle
v Ellipse
v TriangleUp
v TriangleDown
v TriangleLeft
v TriangleRight
v Diamond
shapeWidth Integer that sets the width of the shape in pixels.
StrokeColor For shape decorations such as rectangles. The color for thestroke. The value can be a color name such as black, or the hexcode for the color such as #000000 for black. These codes arethe same hex codes that are used for HTML code.
StrokeWidth For shape decorations such as rectangles. The width of thestroke.
textLabelColor The color for the text label. The value can be a color name suchas black, or the hex code for the color such as #000000 forblack. These codes are the same hex codes that are used forHTML code.
timeLabelColor The color for the value label text in a sliding gauge. The valuecan be a color name such as black, or the hex code for the colorsuch as #000000 for black. These codes are the same hex codesthat are used for HTML code.
tooltip Text to display when the cursor hovers over an object. This textcan be plain text or HTML.
UserDefinedURL The URL to launch when a user double clicks a visual element.
352 IBM Tivoli Business Service Manager: Service Configuration Guide

Reference
Reference information is organized to help you locate particular facts quickly.
TBSM-specific projectsThe Tivoli Business Service Manager version of Netcool/Impact has additionalTivoli Business Service Manager specific projects.v TBSM_BASE project contains all the predefined Netcool/Impact data sources,
data types, services, and policies, that are specific to Tivoli Business ServiceManager. Modifications to any of the items in this project must be done withcaution.
v TBSM project contains all Netcool/Impact data sources, data types, services, andpolicies that are created using the Tivoli Business Service Manager configurationinterface.
v TBSM_SAMPLES project contains sample policies used to interact with theServices Component Registry.
v ForImpactMigration project contains the data sources and data types necessaryfor a remote Impact Server to send events using the PassToTBSM function toTivoli Business Service Manager. To send events to Tivoli Business ServiceManager from a remote Impact Server, you must export the ForImpactMigrationproject from the Tivoli Business Service Manager server and import it into theImpact Server. For more information about PassToTBSM, see the Netcool/ImpactSolutions Guide.
Event enrichment solutionEvent enrichment is the process by which Netcool/Impact monitors an eventsource for new events, looks up information related to them in an external datasource and then adds the information to them.
An event enrichment solution consists of the following components:v A data model that represents the data you want to add to eventsv An OMNIbus event reader service that monitors the event sourcev One or more event enrichment policies that look up information related to the
events and add the information to them
For a sample event enrichment solution, see “Event enrichment tutorial” on page357.
Creating the event sourceWhen you have the connection information for the ObjectServer, you can create theevent source using the Tivoli Integrated Portal GUI. You create the event source inthe same way that you create any other data source.
Table 113 on page 354 shows the configuration properties for an event source.
© Copyright IBM Corp. 2008, 2013 353
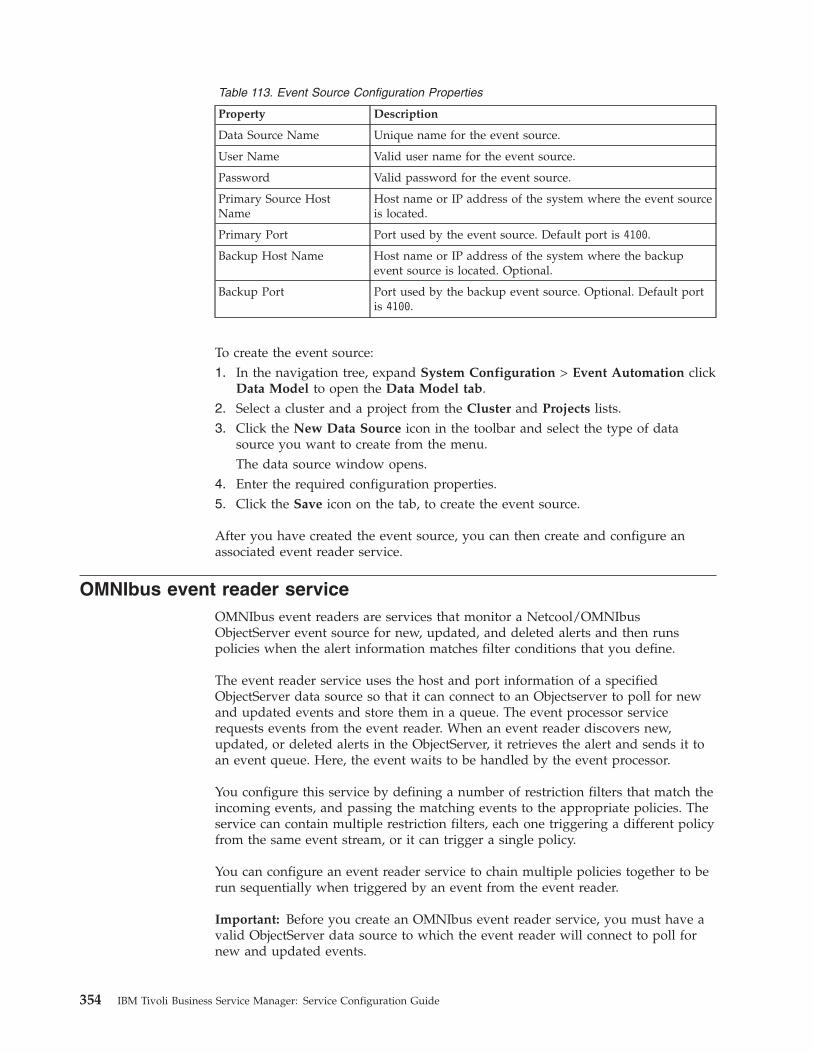
Table 113. Event Source Configuration Properties
Property Description
Data Source Name Unique name for the event source.
User Name Valid user name for the event source.
Password Valid password for the event source.
Primary Source HostName
Host name or IP address of the system where the event sourceis located.
Primary Port Port used by the event source. Default port is 4100.
Backup Host Name Host name or IP address of the system where the backupevent source is located. Optional.
Backup Port Port used by the backup event source. Optional. Default portis 4100.
To create the event source:1. In the navigation tree, expand System Configuration > Event Automation click
Data Model to open the Data Model tab.2. Select a cluster and a project from the Cluster and Projects lists.3. Click the New Data Source icon in the toolbar and select the type of data
source you want to create from the menu.The data source window opens.
4. Enter the required configuration properties.5. Click the Save icon on the tab, to create the event source.
After you have created the event source, you can then create and configure anassociated event reader service.
OMNIbus event reader serviceOMNIbus event readers are services that monitor a Netcool/OMNIbusObjectServer event source for new, updated, and deleted alerts and then runspolicies when the alert information matches filter conditions that you define.
The event reader service uses the host and port information of a specifiedObjectServer data source so that it can connect to an Objectserver to poll for newand updated events and store them in a queue. The event processor servicerequests events from the event reader. When an event reader discovers new,updated, or deleted alerts in the ObjectServer, it retrieves the alert and sends it toan event queue. Here, the event waits to be handled by the event processor.
You configure this service by defining a number of restriction filters that match theincoming events, and passing the matching events to the appropriate policies. Theservice can contain multiple restriction filters, each one triggering a different policyfrom the same event stream, or it can trigger a single policy.
You can configure an event reader service to chain multiple policies together to berun sequentially when triggered by an event from the event reader.
Important: Before you create an OMNIbus event reader service, you must have avalid ObjectServer data source to which the event reader will connect to poll fornew and updated events.
354 IBM Tivoli Business Service Manager: Service Configuration Guide

OMNIbus event reader configurationYou can configure the following properties of an OMNIbus event reader.v Event reader namev ObjectServer event source you want the event reader to monitorv Interval at which you want the event reader to poll the ObjectServerv Event fields you want to retrieve from the ObjectServerv Event mappingv Event lockingv Order in which the event reader retrieves events from the ObjectServerv Start up, service log, and reporting options
OMNIbus event reader service General Settings tabUse this information to configure the general settings of the OMNIbus event readerservice.
Table 114. EventReader service - general settings tab
Table Element Description
Service name Enter a unique name to identify the service.
Data Source Select an OMNIbusObjectServer data source. The ObjectServerdata source represents the instance of the Netcool/OMNIbusObjectServer that you want to monitor using this service. Youcan use the default ObjectServer data source that is createdduring the installation, defaultobjectserver.
Polling Interval The polling interval is the interval in milliseconds at which theevent reader polls the ObjectServer for new or updated events.
Select or type how often you want the service to poll the eventsin the event source. If you leave this field empty, the eventreader polls the ObjectServer every 3 seconds (3000milliseconds).
Restrict Fields: Fields You can complete this step when you have saved theOMNIbusEventReader service. You can specify which eventfields you want to retrieve from the ObjectServer. By default, allfields are retrieved in the alerts. To improve OMNIbus eventreader performance and reduce the performance impact on theObjectServer, configure the event reader to retrieve only thosefields that are used in the corresponding policies.
Click the Fields button to access a list of all the fields availablefrom the selected ObjectServer data source.
You can reduce the size of the query by selecting only the fieldsthat you need to access in your policy. Click the Optimize Listbutton to implement the changes. The Optimize List buttonbecomes enabled only when the OMNIbusEventReader servicehas been saved.
Startup: Automaticallywhen server starts
Select to automatically start the service when the server starts.You can also start and stop the service from the GUI.
Service log: Write to file Select to write log information to a file.
Collect Reports: Enable Select to enable data collection for the Policy Reports.
Reference 355

Table 114. EventReader service - general settings tab (continued)
Table Element Description
Clear State: Clear When you click the Clear State button, the Serial andStateChange information stored for the event reader is reset to 0.The event reader retrieves all events in the ObjectServer atstartup and places them in the event queue for processing. If theevent reader is configured to get updated events, it queries theObjectServer for all events where StateChange >= 0. Otherwise,it queries the ObjectServer for events where Serial > 0.
You can use the Clear State button only to clear the event readerstate when the service is stopped. Clicking the button while theservice is running does not change the state of the event reader.
Clear Queue: Clear Click to clear unprocessed events.
Database event reader configuration window - generalsettings
Use this information to configure the general settings of the database event reader.
Table 115. Database event reader configuration window - General Settings tab
Window element Description
Service name Enter a unique name to identify the service.
Data Source Select an external data source from the list.
The data source must have a field that is guaranteed to beincremented every time a new record is added to avoidrereading the entire table every time the data source isaccessed. If you want to use the GetUpdates function in a policyfor this data source, the table also must have a time stamp fieldthat is automatically populated when an insert or updateoccurs.
Data Type After you select a data source, the system populates the datatype field with a list of data types created in Netcool/Impactcorresponding to that particular data source. Select a data typefrom the list.
Polling Interval Select or enter a polling time interval to establish how oftenyou want the service to poll the events in the event source. Thepolling time selections are in milliseconds and the default valueis 3000 milliseconds
Restrict fields Click Fields to access a selection list with all the fields that areavailable from the selected data source.
You can reduce the size of the query by selecting only the fieldsthat you need to access in your policy.
Startup: Automaticallywhen server starts
Select to automatically start the service when the server starts.You can also start and stop the service from the GUI.
Service log: Write to file Select to write log information to a file.
356 IBM Tivoli Business Service Manager: Service Configuration Guide

Table 115. Database event reader configuration window - General Settings tab (continued)
Window element Description
Clear State When you click Clear, the internally stored value for the Keyfield and Timestamp field are reset to 0. This causes the eventreader to retrieve all events in the data source at startup andplace them in the event queue for processing.
If the event reader is configured to get updated events, itrequires the Timestamp field along with the Key field. TheTimestamp field must point to a column in the table which isautomatically populated with a timestamp when an insert orupdate occurs. The Key field must point to a column whichuniquely identifies a row (it does not have to be anautomatically incremented field).
However, when the Actions Get updated events check box inthe Event Mapping tab is not selected, you do not have toconfigure the Timestamp field. The Key field MUST in this casebe an automatically incremented numeric field.
You can only use Clear State to clear the event reader statewhen the service is stopped. Clicking Clear while the service isrunning does not change the state of the event reader.
Clear Queue Click Clear to enable the database event reader to deleteunprocessed events that it has fetched from an SQL data source.
Event enrichment tutorialThe goal of this tutorial is to develop an event enrichment solution to enhance thevalue of an existing Netcool/Impact installation.
This solution automates common tasks performed manually by the networkoperators and helps to integrate related business data with alerts in theObjectServer.
Tutorial overviewThis tutorial uses a sample environment that provides the background forunderstanding various event enrichment concepts and tasks.
The environment is a network operations center for a large enterprise where thecompany has installed and configured Netcool/OMNIbus and is currently using itto manage devices on its network. The sample environment is a scaled downrepresentation of what you might actually find in a real world operations center. Itcontains only the network elements and business data needed for this tutorial.
This tutorial leads you through the following steps:v Understanding the Netcool/Impact installationv Understanding the business datav Analyzing the workflow in the environmentv Creating a projectv Setting up a data modelv Setting up servicesv Writing an event enrichment policyv Configuring the OMNIbus event reader to run the policy
Reference 357

v Running the complete solution
Understanding the Netcool/Impact installationThe first step in this tutorial is to understand the current Netcool installation.
Generally, before you start developing any Netcool solution, you must find outwhich products in the Netcool suite you installed and which devices, systems, orapplications are being monitored in the environment.
The Netcool installation in the sample environment consists of Netcool/OMNIbusand a collection of probes that monitor devices on the network. This installationuses two instances of an ObjectServer database named NCOMS that is set up in abackup/failover configuration. These ObjectServers are located on host systemsnamed NCO_HOST_01 and NCO_HOST_02, and run on the default port of 4100.
The probes in this installation monitor various network devices. The details of thedevices are not important in this tutorial, but each probe sends the basic set ofalert fields to the ObjectServer database, including the Node, Summary, Severity,AlertKey, and Identifier fields.
Understanding the business dataThe next step in this tutorial is to understand the location and structure of thebusiness data in your environment.
In the sample environment, the company uses instances of the Oracle database tostore network inventory information, customer service information, and generalorganizational information about the business.
The information that you want to use is stored in two databases named ORA_01 andORA_02. ORA_01 is a network inventory database that stores information about thedevices in the network, including their technical specification, facility locations,and rack numbers. ORA_01 is located on a system named ORA_HOST_01. ORA_02 is adatabase that contains information about the various departments in the business.ORA_02 is located on a system named ORA_HOST_02. They both run on port 1521
Analyzing the workflowAfter you find the location and structure of the business data, the next step is toanalyze the current event management workflow in your environment.
The tutorial work environment is a network operations center. In this center, anumber of operators are on duty at all times. They sit in an open work area andeach one has access to a console that displays a Netcool/OMNIbus event list. Onlarge projector screens on one wall of the operation center are large mapvisualizations that provide geographical views into the current network status.
As alerts flow to the ObjectServer from the various Netcool probes and monitorsthat are installed in the environment, they are displayed in the event lists availableto the operators. Depending on the severity of the alerts, the operators manuallyperform a set of tasks using the event list tools, third-party applications, andtypical office tools like cell phones and email.
For the sake of this tutorial, we assume that, among other tasks, the operatorsperform the following actions for each high severity alert. The operators:v Manually acknowledge the alert using the event list.
358 IBM Tivoli Business Service Manager: Service Configuration Guide

v Use an in-house database tool to find information about the device causing thealert. This tool runs a query against the network inventory database and returnstechnical specifications, the location, and other information.
v Use another in-house tool to look up the business department being served bythe device that caused the alert.
v If the business department is part of a mission critical business function, theyincrease the severity of the alert and update it in the ObjectServer database.
The operators might perform other actions, like looking up the administrators oncall at the facility where the device is located and contacting them by phone orpager. After the problem that caused the alert is addressed, the operators mightalso record the resolution in a problem log and delete the alert from theObjectServer. For this tutorial, however, only use the workflow tasks listed.
Creating the projectAfter you finish analyzing the workflow, the next step is to create a project in theTivoli Integrated Portal GUI.
About this task
You can use this project to store the data model, services, and policies that are usedin this solution. The name of this project is NCI_TUT_01.
Procedure1. Open the Tivoli Integrated Portal in a web browser and log in.2. In the navigation tree, expand System Configuration > Event Automation click
one of the links, for example Data Model, to view the project and clusterselection lists on the Data Model tab.
3. Select a cluster from the Cluster list. From the Project list, select Global.4. Click the New Project icon on the toolbar to open the New Project window.5. Use the New Project window to configure your new project.6. In the Project Name field, type NCI_TUT_01.7. Click OK then click Close.
Setting up the data modelAfter you create a project for this tutorial, the next step is to set up aNetcool/Impact data model.
This data model consists of the event sources, data sources, and data types that arerequired by the event enrichment solution. It also consists of a dynamic link that isused to define the relationship between the data types.
You use the Tivoli Integrated Portal GUI to perform all the tasks in this step.
To set up the data model, you perform the following tasks:v Create the event sourcev Create the data sourcesv Create the data typesv Create the dynamic link
Reference 359

Creating the event sourceThe first task in setting up the data model is to create the event source. As youlearned when you investigated the details of the Netcool installation, the exampleenvironment has one event source, an ObjectServer named NCOMS.
About this task
Because you want to tap into the alerts that are stored in this ObjectServer, youmust create an event source that represents it in Netcool/Impact.
An event source is a special type of data source that Netcool/Impact can use torepresent a physical source of event data in the environment. Since your source ofevent data is an ObjectServer database, you must create an ObjectServer datasource and configure it with the connection information you discovered when youinvestigated the details of the Netcool installation.
To create the event source:
Procedure1. In the navigation tree, expand System Configuration > Event Automation
click Data Model to open the Data Model tab.2. Select a cluster from the Cluster list. From the Project list, select
NCI_TUT_01.3. Click the New Data Source icon and select ObjectServer from the list. The
New Data Source opens.4. Type NCOMS in the Data Source Name field.5. Type the name and password of an ObjectServer user in the Username and
Password fields.6. Type NCO_HOST_01 in the Primary Host Name field.7. Type 4100 in the Primary Port field.8. Click Test Connection to test the ObjectServer connection.9. Type NCO_HOST_02 in the Backup Host Name field.
10. Type 4100 in the Backup Port field.11. Click Test Connection to test the ObjectServer connection.12. Click OK.
Creating the data sourcesThe next task in setting up the data model is to create the data sources.
About this task
As you learned when you discovered the location and structure of the businessdata in your environment, the data you want to use in this solution is in twoOracle databases named ORA_01 and ORA_02. Since you want to access thesedatabases, you must create a data source that corresponds to each one.
To create the data sources:
Procedure1. In the navigation tree, expand System Configuration > Event Automation,
click Data Model to open the Data Model tab.
360 IBM Tivoli Business Service Manager: Service Configuration Guide

2. Click the New Data Source icon and select Oracle from the list. The New DataSource window opens.
3. Type ORACLE_01 in the Data Source Name field.4. Type an Oracle user name and password in the Username and Password fields.5. Type ORA_HOST_01 in the Primary Host Name field.6. Type 1521 in the Primary Port field.7. Type ORA_01 in the SID field.8. Click Test Connection to test the ObjectServer connection.9. Click OK.
Results
Repeat these steps to create another data source that corresponds to the ORA_02database. Name this data source ORACLE_02.
Creating the data typesThe next task in setting up the data model is to create the data types.
About this task
As you learned when you discovered the location and structure of the businessdata in your environment, the data that you want to use is contained in two tables.
The first table is called Device and is in the ORA_01 database. This table containsinformation about each device on the network. Columns in this table includeHostname, DeviceID, HardwareID, Facility, and RackNumber.
The second table is called Department and is in the ORA_02 database. This tablecontains information about each functional department in the business. Columns inthis table include DeptName, DeptID, and Location.
Since you want to access the data in both of these tables, you must create a datatype for each. Name these data types Device and Department.
To create the data types:
Procedure1. In the navigation tree, expand System Configuration > Event Automation
click Data Model to open the Data Model tab.2. Select ORACLE_01 from the data sources list.3. Click the New Data Type icon.
A new Data Type Editor tab opens.4. Type Device in the Data Type Name field.5. Select ORACLE_01 from the Data Source Name drop down menu.6. Ensure that the Enabled check box is selected. It is selected by default.7. Scroll down the Data Type Editor tab so that the Table Description area is
visible.8. Select Device from the Base Table list.9. Click Refresh.
Netcool/Impact queries the Oracle database and populates the TableDescription browser with the names of each column in the Device table.
Reference 361

10. Specify that the DeviceID field is the key field for the data type by selectingthe Key option in the DeviceID row.
11. Select Hostname from the Display Name Field list.12. Click Save in the Data Type Editor tab.13. Click Close in the Data Type Editor tab.
Results
Repeat these steps to create another data type that corresponds to the Departmenttable in the ORA_02 database. Name this data type Department.
Creating a dynamic linkThe next step is to create a dynamic link between the Device and Department datatypes.
About this task
One property of the business data that you are using in this solution is that there isa relationship between devices in the environment and departments in thebusiness. All the devices that are located in a certain facility serve the businessdepartments in the same location. You can make this relationship part of the datamodel by creating a dynamic link between the Device and Department data types.After you create the dynamic link, you can use the the GetByLinks function totraverse it within a policy.
In this relationship, Device is the source data type and Department is the targetdata type. When you create the link between the two data types, you can define itusing the following syntax:Location = ’%Facility%’
This filter tells Netcool/Impact that Device data items are linked to Departmentdata items if the value of the Location field in the Department is equal to the valueof the Facility field in the Device.
To create the dynamic link:
Procedure1. In the navigation tree, expand System Configuration > Event Automation,
click Data Model to open the Data Model tab.2. Click the name of the Device data type.
A new Data Type Editor tab opens in the Main Work panel of the GUI. Thiseditor displays configuration information for the Device data type.
3. Select the Dynamic Links tab in the editor.The Links From This Data Type area opens in the editor.
4. Click the New Link By Filter button to open the Link By Filter window.5. Select Department from the Target Data Type list.6. In the Filter ... Field, type the filter string that defines the relationship between
the Device and Department list. As noted in the description of this task above,the filter string is Location = ’%Facility%’. This means that you want Devicedata items to be linked to Department data items if the Location field in theDepartment is the same as the Facility field in the Device.
7. Click OK.8. Click the Save button in the Data Type Editor tab.
362 IBM Tivoli Business Service Manager: Service Configuration Guide

9. Click the Close button in the Data Type Editor tab.
Reviewing the data modelAfter you create the dynamic links, you can review the data model using the TivoliIntegrated Portal GUI to verify that you have performed all the tasks correctly.
About this task
You can review the data model by opening the Data Source and Data Type taskpanes in the Navigation panel, and by making sure that the event source, datasources, and data types that you created are visible.
Setting up servicesThe next step in this tutorial is to set up the OMNIbus event reader required bythe solution.
Creating the event readerThe OMNIbus event reader for this solution must check the NCOMS ObjectServerevery 3 seconds and retrieve any new events.
Procedure1. In the navigation tree, expand System Configuration > Event Automation,
click Services to open the Services tab.2. Click the Create New Service icon and select OMNIbusEvent Reader from the
list.3. Type TUT_READER_01 in the Service Name field.4. Select NCOMS from the Data Sourcelist.5. Type 3000 in the Polling Interval field.6. Select the Startup option. This option specifies whether the service starts
automatically when you run Netcool/Impact.7. Click OK.
Reviewing the servicesAfter you create the event reader, you can use the Tivoli Integrated Portal GUI toverify that you completed all the tasks correctly.
About this task
To review the service that you created, click the Services task pane in theNavigation panel, and make sure that the TUT_READER_01 OMNIbus event reader isvisible. You can also check to make sure that the event reader displays in theService Status panel.
Writing the policyAfter you set up the OMNIbus event reader service, the next step is to write thepolicy for the solution.
This policy is named EnrichEvent and it automatically performs the tasks that youdiscovered when you analyzed the workflow in the environment.
You can use the EnrichEvent policy to complete the following tasks:v Look up information about the device that is causing the alert.v Look up the business departments that are served by the device.
Reference 363
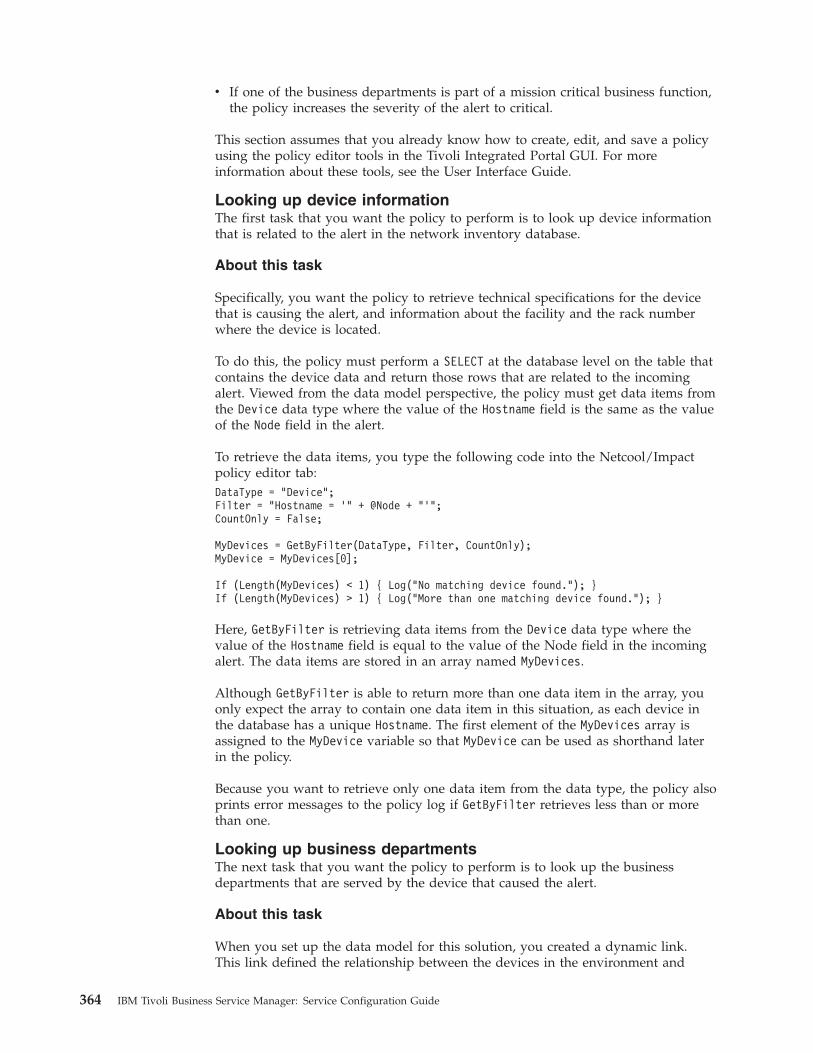
v If one of the business departments is part of a mission critical business function,the policy increases the severity of the alert to critical.
This section assumes that you already know how to create, edit, and save a policyusing the policy editor tools in the Tivoli Integrated Portal GUI. For moreinformation about these tools, see the User Interface Guide.
Looking up device informationThe first task that you want the policy to perform is to look up device informationthat is related to the alert in the network inventory database.
About this task
Specifically, you want the policy to retrieve technical specifications for the devicethat is causing the alert, and information about the facility and the rack numberwhere the device is located.
To do this, the policy must perform a SELECT at the database level on the table thatcontains the device data and return those rows that are related to the incomingalert. Viewed from the data model perspective, the policy must get data items fromthe Device data type where the value of the Hostname field is the same as the valueof the Node field in the alert.
To retrieve the data items, you type the following code into the Netcool/Impactpolicy editor tab:DataType = "Device";Filter = "Hostname = ’" + @Node + "’";CountOnly = False;
MyDevices = GetByFilter(DataType, Filter, CountOnly);MyDevice = MyDevices[0];
If (Length(MyDevices) < 1) { Log("No matching device found."); }If (Length(MyDevices) > 1) { Log("More than one matching device found."); }
Here, GetByFilter is retrieving data items from the Device data type where thevalue of the Hostname field is equal to the value of the Node field in the incomingalert. The data items are stored in an array named MyDevices.
Although GetByFilter is able to return more than one data item in the array, youonly expect the array to contain one data item in this situation, as each device inthe database has a unique Hostname. The first element of the MyDevices array isassigned to the MyDevice variable so that MyDevice can be used as shorthand laterin the policy.
Because you want to retrieve only one data item from the data type, the policy alsoprints error messages to the policy log if GetByFilter retrieves less than or morethan one.
Looking up business departmentsThe next task that you want the policy to perform is to look up the businessdepartments that are served by the device that caused the alert.
About this task
When you set up the data model for this solution, you created a dynamic link.This link defined the relationship between the devices in the environment and
364 IBM Tivoli Business Service Manager: Service Configuration Guide

departments in the business. To look up the business departments that are servedby the device, the policy must take the data item that it previous retrieved fromthe Device data type and traverse the links between it and the Department datatype.
To retrieve the Department data items that are linked to the Device, type thefollowing text into the policy editor below the code you entered previously:DataTypes = {"Department"};Filter = NULL;MaxNum = 10000;
MyDepts = GetByLinks(DataTypes, Filter, MaxNum, MyDevices);
If (Length(MyDepts) < 1) { Log("No linked departments found."); }
Here, GetByLinks retrieves up to 10,000 Department data items that are linked todata items in the MyDevices array. Since you are certain that the business has lessthan 10,000 departments, you can use a large value such as this one to make surethat all Department data items are returned.
The returned data items are stored in the MyDepts array. Because you want at leastone data item from the data type, the policy also prints an error message to thepolicy log if GetByLinks does not return any.
Increasing the alert severityThe final task that you want the policy to perform is to increase the severity of thealert.
About this task
For example, if the department that it affects has a mission critical function in thebusiness. For the purposes of this tutorial, the departments in the business whosefunction is mission critical are the data center and transaction processing units.
To perform this task, the policy must iterate through each of the Department dataitems that are retrieved in the previous step. For each Department, it must test thevalue of the Name field against the names of the two departments in the businessthat have mission critical functions. If the Department name is that of one of thetwo departments, the policy must increase the severity of the alert to Critical.Count = Length(MyDepts);
While (Count > 0) {
Index = Count - 1;MyDept = MyDepts[Index];
If (MyDept.Name == "Data Center" || MyDept.Name == "Transaction Processing") {@Severity = 5;
}
Count = Count - 1;
}
Here, you use a While loop to iterate through the elements in the MyDepts array.MyDepts is the array of Department data items that were returned previously in thepolicy by a call the GetByLinks.
Reference 365

Before the While loop begins, you set the value of the Count variable to the numberof elements in the MyDepts array. Each time the loop runs, it tests the value ofCount. If Count is greater than zero, the statements inside the loop are executed. IfCount is less than or equal to zero, the statements are not executed. Because Countis decremented by one each time the loop is performed, the While loop runs oncefor each data item in MyDepts.
A variable named Index is used to refer the current element in the array. The valueof Index is the value of Count minus one, as Netcool/Impact arrays are zero-basedstructures whose first element is counted as zero instead of one.
Inside the loop, the policy uses an If statement to test the name of the currentDepartment in the array against the name of the two mission-critical businessdepartments. If the name of the current Department matches the mission-criticaldepartments, the policy sets the value of the Severity field in the alert to 5, whichsignifies a critical severity.
Reviewing the policyAfter you finish writing the policy, you can review it for accuracy andcompleteness.
About this task
The following example shows the entire text of this policy.// Look up device information
DataType = "Device";Filter = "Hostname = ’" + @Node + "’";CountOnly = False;
MyDevices = GetByFilter(DataType, Filter, CountOnly);MyDevice = MyDevices[0];
If (Length(MyDevices) < 1) { Log("No matching device found."); }
// Look up business departments
DataTypes = {"Department"};Filter = NULL;MaxNum = 10000;
MyDepts = GetByLinks(DataTypes, Filter, MaxNum, MyDevices);
If (Length(MyDepts) < 1) { Log("No linked departments found."); }
// If department is mission-critical, update severity of alert
Count = Length(MyDepts);
While (Count > 0) {
Index = Count - 1;MyDept = MyDepts[Index];
If (MyDept.Name == "Data Center" || MyDept.Name == "Transaction Processing") {@Severity = 5;
}
Count = Count - 1;
}
366 IBM Tivoli Business Service Manager: Service Configuration Guide

Running the solutionThe final step in this tutorial is to run the event enrichment solution.
Before you begin
Before you run the solution, you must configure the TUT_READER_01 OMNIbusevent reader service so that it triggers the EnrichEvent policy. To configureTUT_READER_01:1. Open Netcool/Impact and select System Configuration > Event Automation >
Services
2. Select the the TUT_READER_01 service and click Edit.3. Click the Event Mapping tab.4. To create a mapping, click the New Mapping button.5. If you want to trigger the EnrichEvent policy for all events, leave the Filter
Expression field empty. If you want to trigger the EnrichEvent policy forspecific events, enter the values for these events.
6. Select EnrichEvent in the Policy to Run field.7. Click the Active check box.8. To save the configuration, click Ok.9. To save the changes to the TUT_READER_01 service, click the save icon.
Procedure
To start the solution, you simply start the OMNIbus event reader service.The event reader then begins to monitor the ObjectServer and retrieves any newevents that appear. When a new event appears, the event reader brings it back intoNetcool/Impact, where it is processed by running the EnrichEvent policy.
Reference 367

368 IBM Tivoli Business Service Manager: Service Configuration Guide

Notices
This information was developed for products and services offered in the U.S.A.IBM may not offer the products, services, or features discussed in this document inother countries. Consult your local IBM representative for information on theproducts and services currently available in your area. Any reference to an IBMproduct, program, or service is not intended to state or imply that only that IBMproduct, program, or service may be used. Any functionally equivalent product,program, or service that does not infringe any IBM intellectual property right maybe used instead. However, it is the user's responsibility to evaluate and verify theoperation of any non-IBM product, program, or service.
IBM may have patents or pending patent applications covering subject matterdescribed in this document. The furnishing of this document does not give youany license to these patents. You can send license inquiries, in writing, to:
IBM Director of LicensingIBM CorporationNorth Castle DriveArmonk, NY 10504-1785 U.S.A.
For license inquiries regarding double-byte (DBCS) information, contact the IBMIntellectual Property Department in your country or send inquiries, in writing, to:
Intellectual Property LicensingLegal and Intellectual Property LawIBM Japan, Ltd.1623-14, Shimotsuruma, Yamato-shiKanagawa 242-8502 Japan
The following paragraph does not apply to the United Kingdom or any othercountry where such provisions are inconsistent with local law:
INTERNATIONAL BUSINESS MACHINES CORPORATION PROVIDES THISPUBLICATION "AS IS" WITHOUT WARRANTY OF ANY KIND, EITHEREXPRESS OR IMPLIED, INCLUDING, BUT NOT LIMITED TO, THE IMPLIEDWARRANTIES OF NON-INFRINGEMENT, MERCHANTABILITY OR FITNESSFOR A PARTICULAR PURPOSE.
Some states do not allow disclaimer of express or implied warranties in certaintransactions, therefore, this statement might not apply to you.
This information could include technical inaccuracies or typographical errors.Changes are periodically made to the information herein; these changes will beincorporated in new editions of the publication. IBM may make improvementsand/or changes in the product(s) and/or the program(s) described in thispublication at any time without notice.
Any references in this information to non-IBM Web sites are provided forconvenience only and do not in any manner serve as an endorsement of those Websites. The materials at those Web sites are not part of the materials for this IBMproduct and use of those Web sites is at your own risk.
© Copyright IBM Corp. 2008, 2013 369

IBM may use or distribute any of the information you supply in any way itbelieves appropriate without incurring any obligation to you.
Licensees of this program who wish to have information about it for the purposeof enabling: (i) the exchange of information between independently createdprograms and other programs (including this one) and (ii) the mutual use of theinformation which has been exchanged, should contact:
IBM Corporation2Z4A/10111400 Burnet RoadAustin, TX 78758 U.S.A.
Such information may be available, subject to appropriate terms and conditions,including in some cases payment of a fee.
The licensed program described in this document and all licensed materialavailable for it are provided by IBM under terms of the IBM Customer Agreement,IBM International Program License Agreement or any equivalent agreementbetween us.
Any performance data contained herein was determined in a controlledenvironment. Therefore, the results obtained in other operating environments mayvary significantly. Some measurements may have been made on development-levelsystems and there is no guarantee that these measurements will be the same ongenerally available systems. Furthermore, some measurement may have beenestimated through extrapolation. Actual results may vary. Users of this documentshould verify the applicable data for their specific environment.
Information concerning non-IBM products was obtained from the suppliers ofthose products, their published announcements or other publicly available sources.IBM has not tested those products and cannot confirm the accuracy ofperformance, compatibility or any other claims related to non-IBM products.Questions on the capabilities of non-IBM products should be addressed to thesuppliers of those products.
All statements regarding IBM's future direction or intent are subject to change orwithdrawal without notice, and represent goals and objectives only.
This information contains examples of data and reports used in daily businessoperations. To illustrate them as completely as possible, the examples include thenames of individuals, companies, brands, and products. All of these names arefictitious and any similarity to the names and addresses used by an actual businessenterprise is entirely coincidental.
If you are viewing this information in softcopy form, the photographs and colorillustrations might not be displayed.
TrademarksIBM, the IBM logo, and ibm.com are trademarks or registered trademarks ofInternational Business Machines Corp., registered in many jurisdictions worldwide.Other product and service names might be trademarks of IBM or other companies.A current list of IBM trademarks is available on the Web at “Copyright andtrademark information” at www.ibm.com/legal/copytrade.shtml.
370 IBM Tivoli Business Service Manager: Service Configuration Guide

Adobe, Acrobat, PostScript and all Adobe-based trademarks are either registeredtrademarks or trademarks of Adobe Systems Incorporated in the United States,other countries, or both.
Java and all Java-based trademarks and logos are trademarks or registeredtrademarks of Oracle and/or its affiliates.
Linux is a trademark of Linus Torvalds in the United States, other countries, orboth.
Microsoft, Windows, Windows NT, and the Windows logo are trademarks ofMicrosoft Corporation in the United States, other countries, or both.
UNIX is a registered trademark of The Open Group in the United States and othercountries.
Other product and service names might be trademarks of IBM or other companies.
Notices 371

372 IBM Tivoli Business Service Manager: Service Configuration Guide

Index
Aabsolute time windows
configuring 182access privileges
assigning 185overview 185
action functions 194actions
service attributes 296View Definitions 292
active events listdisplaying 177
adding security levels 77aggregation and numerical formula rules
overview 95aggregation rules
Good, Marginal, and Bad 95creating 99editing 99
numerical 100architecture 7auto-populated services
assigning group names to 119deleting additional service
templates 117auto-population rules
adding additional serviceproperties 116
configuring custom options 118deleting a rule set 115event-based 110multiple service templates 119service persistence settings 118settings for parent services 118
auto-population solutions 109automatic roll-up
creating 93automatic service creation
overview 109
Bbaseline column format 272Basic Relationships view 241basic service properties 166
setting 167basic service template properties 69books
See publications
CCharting
Event Summary portlet 37charts
adding to a page 306charts tool 301creating 305data sources 303displaying 306
charts (continued)key performance indicators
(KPIs) 303overview 301properties 302reference 302
child service dependenciesadding 244removing 244
columnsadding a template rule 272default reserved column names 272
common portlet buttons 20Concentric view 242configuration documenter 323
cluster status 324opening 324overview 323server status 324
contextservice tree 226
conventionstypeface 4
core library 1Creation Planning
Service 40Cumulative SLAs tab
displaying 212cumulative violation calculations,
settings 209custom canvases 327
changing scope 337creating 331, 336decorations 331, 340elements 25overview 327visual elements 331working with the Inspector 350
custom decorationscreating 340deleting 340editing 340
custom service trees 263, 275examples 274getting started with the tree template
editor 264overview 263viewing 271, 274
customer column format 272
Ddaily fetch
configuring 54data 26data fetcher 51
adding an expression 58creating 52Delete tab 33elements 27entering the SQL query manually 56
data fetcher (continued)fetching interval 54on demand fetch 57overview 51polling criteria 53query criteria 55right-click menus 27setting up 51, 52viewing 57viewing results 61
data sourcecreating 46
data sources 45adding 45deleting 49editing 48elements 26identifying 41overview 45right-click menus 26
DB2driver requirements 46
decorations 327dependencies
configuring 170dependency view
displaying 222, 225SLA data in 211
display iconselecting for a service template 70
DNS monitorInternet Service Monitoring rules
for 137duration-based violation
calculations 205example 206
Eedit a policy 202Edit Data source tab 33Edit Service tab 32Edit tab 32
editors 32toolbar 32
Edit Template tab 32opening 68
educationSee Tivoli technical training
environment variables, notation 14ESDA rules 145
auto-population solutions 146building queries 148child rules 147configuring service expressions 158entering a query 157importing sample data 145overview 145parent rules 147queries 155seed service 147
© Copyright IBM Corp. 2008, 2013 373

ESDA rules (continued)selecting child or parent rules 152service expressions 148service persistence 149service persistence settings 161service structure 146testing 160triggers 149using the Query Builder 155
event enrichment 78, 353event readers
configuration 355event rules
editing 70Event Summary portlet 37events
displaying active event list 177displaying root cause 177
Events tab 176example
configuring a Key PerformanceIndicator (KPI) 117
configuring a prototype 346general settings 280multiple gauges per service 348service instance indicator 343service model 150speedometer 342
Ffeatures
new for 6.1.1 5fetch now 57Fit to View 237functions
action 194
Ggauge 287
configuring 342gauges
gradient 327speedometer 327tachometer 327
General Settingsexample 280View Definitions 279
generic policyusing 120
GIS position for a servicesetting 171
GIS viewlayout option 242
globalassigning roles 185
Good, Marginal, and Bad aggregationrules
configuring 96Good, Marginal, and Bad incoming status
rulescreating 84
Graphical User Interface 19group permissions
adding 173
groupingview options 241
Hhost name
lookup 137hover preview
Service Tree preference 227HTTP monitor
Internet Service Monitoring rulesfor 134
HTTPS monitorInternet Service Monitoring rules
for 135
IICMP monitor
Internet Service Monitoring rulesfor 140
identification fieldsediting 169in services 168
incident-count settingsexample 207
incident-count violation calculationssetting 208
incoming status rules 79automatic roll-up 93creating Good, Marginal, and Bad
rules 84filter, matching conditions 81Good, Marginal, and Bad 83numerical 86, 87properties and conditions 80text-based 90
Incoming Status Rulescreating 41
indicatorsconfiguring 343
inspectorproperties 351
instancesset starting service 226, 231
Internet Service Monitoringconfiguring 173provisioning 173rules 131
Internet Service Monitoring reportviewing 144
Internet Service Monitoring rulesabout 131adding a server connection 131, 132configuring 131, 141deleting 143deleting a connection 133editing 143for DNS monitor 137for HTTP monitors 134for HTTPS monitor 135for ICMP monitor 140for LDAP monitor 138provisioning services for 143tagging services 143
Internet Service Monitoring ServiceReport Viewer 252
IP addresslookup 137
IPL functions 194ISM rules
provisioning a monitor 133
KKey Performance Indicator (KPI) 311
configuring 117display in Time Window
Analyzer 315options for charts 303specifying for services 117
KPI 117
Llaststatechange output expression
example 74layout options
selecting 241LDAP monitor
Internet Service Monitoring rulesfor 138
logging into TBSM 17logging out of TBSM 18
Mmaintenance schedules 179
configuration 179creating 180editing 180overview 179remove 183right-click tools 182
manualsSee publications
multiple gauges per serviceconfiguring 348
multiple service level configuration 204MySQL
data source requirements 45
Nnames and color value thresholds for
tickets columns 272notation
environment variables 14path names 14typeface 14
numerical aggregation rulescreating 103edit 103overview 100properties
aggregation function 101child metric rule 101child template 101rule name 101status 101
374 IBM Tivoli Business Service Manager: Service Configuration Guide

Numerical Aggregation Rulescreating 41
numerical formula rulescreating 106overview 104
Numerical Formula Rulescreating 41
numerical incoming status rulescreating 87editing 87
Oone-element prototype 286online publications
accessing 2optimizing a policy 193ordering publications 3outages
average daily count report 256average duration report 256
output expressionscreating 75editing 75example 74laststatechange example 74parameters 73value output expression example 74
Overview tool 239
Ppages
and charts 306and Time Window Analyzer 316charting portlet 306
Pan tool 236parent auto-population rules 118parent templates
adding settings 113penalty calculations
about SLA 210setting SLA 172
percentage column format 272permissions
group 185setting for user and groups 43user 185
policiesabout 189creating custom policies 120customizing 189editing 189, 202graphical view of 201optimizing 193pre-defined 189saving 202triggering 201
policycreate additional service
properties 120Policy editor
about 189Copy option 191Cut option 191display the graphical view 201
Policy editor (continued)Find and Replace option 192GoTo Line option 193opening 189optimizing 193Paste option 191Redo option 191syntax checking 193trigger a policy 201Undo option 191
Policy Editorsetting runtime parameters 201toolbar controls 190
portletscharting 306Time Window Analyzer 316
pre-defined policiesoverview 189
preferences 317defaults 317user 317
product library 1prototype 285, 286publications 1
accessing online 2ordering 3
Qquery
adding metrics, ordering, andgrouping 128
building 123filtering data results 128
Query Builder 123adding metrics, ordering, and
grouping 128building a query 123overview 123using with the data fetcher 55
query criteriasetting up 55
Quick Find 240
Rrecurring time windows
configuring 181Refresh tool 235relationships view
layout option 242remove as child action 250reports
average daily outage count 256average outage duration 256main page 255running 255selecting 255Service Outage Average
Duration 257Service Outage Count Summary 257Service Outage Detail 252Service Outage Duration 258Service Path Outage Summary 257Service Status Changes 258viewing 255
reserved additional properties 77reserved column names
changing 272revenue column format 272right-click actions 249
children 250children actions 250compare service metrics 252edit member templates 250edit service instance 250integrations 252maintenance window tools 253service affecting events (table) 251Show 250, 251, 252
right-click menusoverview 249
rolesassigning 185, 186tbsm-specific 187
roles per serviceassigning 185
roles per templateassigning 186
root cause eventsdisplaying 177
rulesaggregation formula rules 95auto-population 109configuring 70deleting auto-population set 115ESDA 145incoming status 79Internet Service Monitoring 131numerical formula rules 95showing status 178
runtime parameters 201
Ssave a policy 202Save Preferences tool 234security levels
adding 77Select tool 235Send Test Event 252service
database event reader 356OMNIbus event reader 354, 355
Service Administrationselecting 18
service affecting eventsshowing 176
Service Affecting Events (AEL) 251Service Affecting Events Table 250Service Component Repository 25service instance data
editing 243service instances
status data in 233service level agreement
See SLA 203Service Level Agreement (SLA)
creating 43service level agreements 203service model
configuration overview 39setting up 150
Index 375

service model (continued)structure and templates 41
service modelsviewing 215
Service Navigation portlet 23service persistence settings
auto-population rules 118for ESDA rules 161
service templatescreating 41
service treeset context 226
Service Treecustomizing 229Find option 229hover preview 227setting your preferences 225sort 229
Service Tree preferencesView tab 227
service treescreating custom service trees 43creating custom service views 43
service viewoverview 215, 216, 217
Service Viewersetting your preferences 230, 231
Service Viewer preferences 230Service Viewer preferences View tab 231service-affecting events
showing 176service-affecting events table
displaying 177services
about templates 63additional settings 171assigning templates to 168attributes in actions 296basic properties 166configuring 163creating 42creating and editing 164creating automatically 109dependency configuration 170Details portlet 175displaying details 243editing configuration data 243elements 23finding names 168hierarchy example in service view 67identification fields 168instance tagging 63list of urgent services 245maintenance window tools 253monitoring 43multiple service level
configuration 204names: invalid characters 42, 164,
167overview 163planning 40Service Editor 31, 35Service Tree 225Services elements 222set default 226, 231set starting service 226, 231setting the GIS position for 171
services (continued)SLA data in 211sort order 173tagging 72template configuration 68template hierarchy example 64, 66template instances 63template model example 64, 66tree in the Service Navigation
portlet 221urgent 245Urgent Services portlet 245view layout options 241View Service tab 35viewing overview 215, 216, 217
services and templatesrelationship 163
setting runtime parametersSee Policy Editor
shape 289Show Root Cause Events 251Show Rule Status 251Show SLA Chart for Children 252Show SLA Chart for Service 252six-element prototype 286SLA 43
chart 213Cumulative SLAs tab 212cumulative violation calculations 209data in service instances 211data in the dependency view 211duration-based violation
calculations 205editing settings 204multiple service level
configuration 204overview 203penalty calculations 210violation incident-count
calculations 206SLA chart
displaying 213SLA Settings tab 203SLA tab 175sort order for a service
setting 173state column format 272status
for urgent services 245urgent services 245
status auto-population rulescreating 110
status datain service instances 233
Ttagging
service instances 63TBSM
core library 1logging in 17logging out 18overview of the graphical user
interface 19TBSM console
accessing 17
TBSM specific projects 353tbsm-specific roles
accessing 187templates
Additional tab 77aggregation and numerical formula
rules 95aggregation and numerical rules 107assigning to a service 168auto-population rules 109basic properties 69configuring 68editing data 243ESDA rules 145hierarchy example 64, 66incoming status rules 79instances 63Internet Service Monitoring rules 131model example 64, 66Output Expressions tab 73overview 63Rules tab 70SLA tab 77tagging services 72with dependent attributes 65with event rules 65with event-based attributes 65
Templates 163Templates tab 24terminology 2test events
sending 244text-based incoming status rules
creating 91the rules tab 176three-element prototype
configuring 346time
hints for notation 52, 182Time Window Analyzer 311, 317
adding to a page 316graphing KPI rule 315
Tivoliintegrated applications 11
Tivoli Application Dependency DiscoveryManager
launching console 252Tivoli Documentation Central 2Tivoli Enterprise Portal
launching console 252Tivoli technical training 3training, Tivoli technical 3tree columns
changing name 270changing position 270
tree template editoropening 265
tree templatesadding 267adding a tree column 269changing a tree column 270deleting 267deleting a tree column 265deleting columns 270displaying 268mapping template rules to
columns 270, 271
376 IBM Tivoli Business Service Manager: Service Configuration Guide

tree templates (continued)prerequisites for editing 264selecting service templates for 270,
271tree columns 268working with 266, 268
Tutorial DataImporting 145
typeface conventions 4
UUrgent Services portlet 245user permissions
adding 173user privileges
See roles per template
Vvariables, notation for 14view definitions
GIS 242View Definitions
actions 292actions examples 297Basic Relationships view 241business impact 241business impact all 242change actions for all service
templates 295change actions for specific service
templates 293change visuals for all service
templates 284change visuals for specific service
templates 282, 283Concentric view 242creating 277, 278deleting 300editing 278example General Settings 280General tab 279Grid 242overview 277Relationships view 242right-click action 297visibility options 280visual types 285visuals 282
view save optionssetting 235
View Servicemenus 234, 237toolbar 234
view service layout options 241View Service tab 31
about 233displaying 233
View Template tab 31Viewer Preferences tool 234viewing
data sources 324data types 325policies 325services 325
viewscentering 241dependency 222, 225
Views tab 25violations
cumulative calculations 209duration-based calculations 205incident-count calculations 206
visibility optionsswim lanes 282View Definitions 280
visual elementssix-element prototype 327two-element prototype 327
visual thresholdsView Definitions 290
VisualsView Definitions 282
ZZoom Box tool 236Zoom In tool 236Zoom Out tool 237
Index 377

378 IBM Tivoli Business Service Manager: Service Configuration Guide


����
Product Number:
Printed in USA
SC23-6041-09