business statistics lec 1
TRANSCRIPT

8/8/2019 Business Statistics Lec 1
http://slidepdf.com/reader/full/business-statistics-lec-1 1/19

8/8/2019 Business Statistics Lec 1
http://slidepdf.com/reader/full/business-statistics-lec-1 2/19
INTRODUCTION TO
STATISTICS
C
hapt
er
1
8/8/2019 Business Statistics Lec 1
http://slidepdf.com/reader/full/business-statistics-lec-1 3/19
What is statistics?
Statistics is a mathematical science that isconcerned with the techniques by whichinformation (data) is collected, organized,presented, analyzed and interpreted.

8/8/2019 Business Statistics Lec 1
http://slidepdf.com/reader/full/business-statistics-lec-1 4/19
application
Accounting
Finance
MarketingProduction
Economics

8/8/2019 Business Statistics Lec 1
http://slidepdf.com/reader/full/business-statistics-lec-1 5/19
Business StatisticsBusiness Statistics is a science assisting you to
make good business decisions underuncertainties based on some numerical andmeasurable scales.

8/8/2019 Business Statistics Lec 1
http://slidepdf.com/reader/full/business-statistics-lec-1 6/19
Data, Information & Knowledge

8/8/2019 Business Statistics Lec 1
http://slidepdf.com/reader/full/business-statistics-lec-1 7/19
ELEMENTS, VARIABLES & OBSERVATIONS
Elements: Entities on which data is collected
Variable: A characteristic of interest for the elements.
Observation: The set of measurements obtained for aparticular element.

8/8/2019 Business Statistics Lec 1
http://slidepdf.com/reader/full/business-statistics-lec-1 8/19
Population & Sample
Population: A population is the setrepresenting all observations of interest tothe sample collector.
Sample: A subset of measurements selectedfrom the population of interest.

8/8/2019 Business Statistics Lec 1
http://slidepdf.com/reader/full/business-statistics-lec-1 9/19
Descriptive & Inferential StatisticsDescriptive Statistics consists of procedures
used to summarize the information in a setof measurements and to describe thecharacteristics of the set.
Inferential Statistics consists of theprocedures used to make inferences aboutpopulation characteristics from informationcontained in a sample.

8/8/2019 Business Statistics Lec 1
http://slidepdf.com/reader/full/business-statistics-lec-1 10/19
Methods of Sampling
Convenience Samples – The most easily accessible
observations/measurements.
Judgment Samples –Individual selecting thesample items uses experience.
Random Samples – Every element of thepopulation has a known, and usually equal
chance of being chosen for inclusion in thesample.

8/8/2019 Business Statistics Lec 1
http://slidepdf.com/reader/full/business-statistics-lec-1 11/19
Types of Random samples
Simple random sample - Each item is selectedentirely on the basis of chance.
Systematic sample - We select the sampleelements at a uniform interval of a listed orderor at uniform points in time or distance.
Stratified sampling can be used whenever thepopulation can be partitioned into smaller sub-populations, groups, or strata, each of which ishomogeneous according to the particularcharacteristic of interest.

8/8/2019 Business Statistics Lec 1
http://slidepdf.com/reader/full/business-statistics-lec-1 12/19
Types of Random samples (cont..)Cluster Sample
Elements in the target population are selected ingroups rather than individually at the initial stepin sampling.
The groups to be included in the sample areselected by simple random sampling. Thus eachgroup in the target population is assigned aserial no.
Often used when the elements in the populationare not easily identified individually but aregrouped together (clustered) and more easilyidentified as members of the clusters.

8/8/2019 Business Statistics Lec 1
http://slidepdf.com/reader/full/business-statistics-lec-1 13/19
DATA
REPRESENTATION

8/8/2019 Business Statistics Lec 1
http://slidepdf.com/reader/full/business-statistics-lec-1 14/19
Types of Data
Internal & External Data
Primary and Secondary Data
Qualitative & Quantitative dataDiscrete & Continuous data

8/8/2019 Business Statistics Lec 1
http://slidepdf.com/reader/full/business-statistics-lec-1 15/19
Frequency distribution
Relative Frequency distribution
Percentage frequencydistribution
BarGraph
PieChart
Frequency distributionRelative Frequency distributionPercentage frequency
distributionCFDCRFDCPFD
Histogram
Ogive
ScatterDiagram
8/8/2019 Business Statistics Lec 1
http://slidepdf.com/reader/full/business-statistics-lec-1 16/19
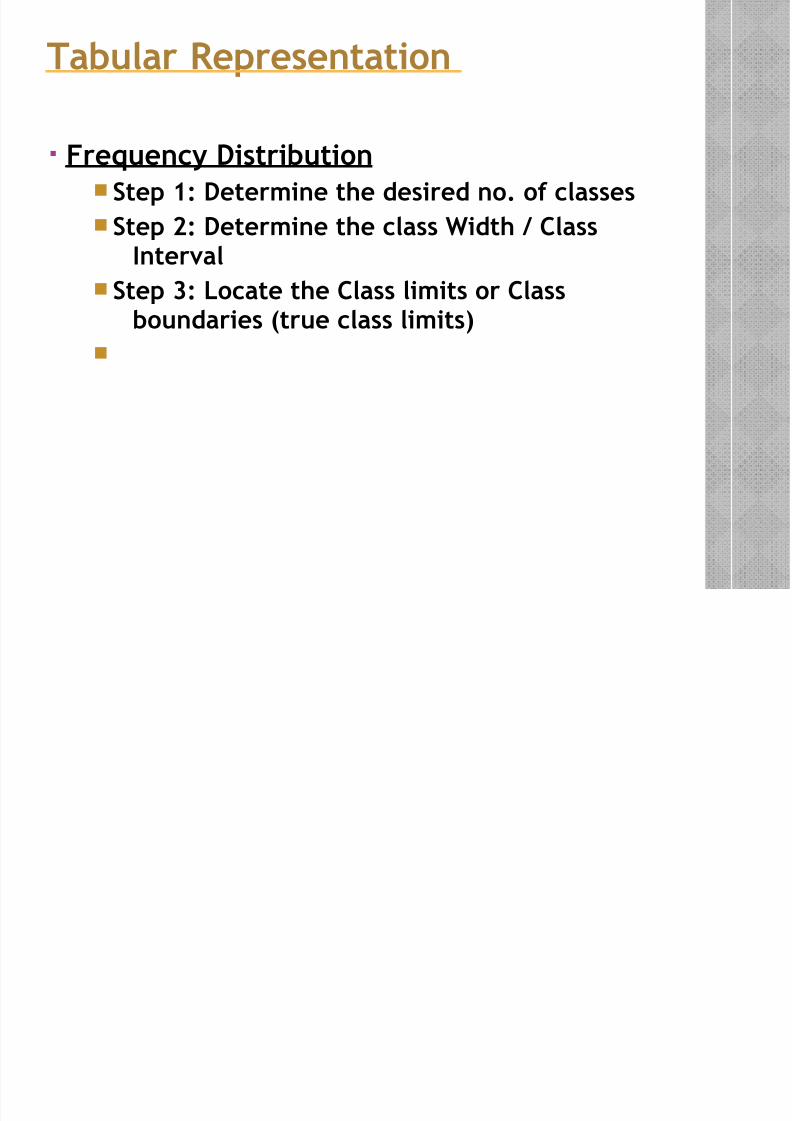
Tabular Representation
Frequency DistributionStep 1: Determine the desired no. of classes
Step 2: Determine the class Width / ClassInterval
Step 3: Locate the Class limits or Classboundaries (true class limits)

8/8/2019 Business Statistics Lec 1
http://slidepdf.com/reader/full/business-statistics-lec-1 17/19
Relative frequency distributionThe proportion of observations belonging to one
class.
Percentage frequency distributionThe percentage of observations belonging to one
class
Cumulative frequency distribution

8/8/2019 Business Statistics Lec 1
http://slidepdf.com/reader/full/business-statistics-lec-1 18/19
Graphical Representation
Histogram
Frequency Polygon
Frequency Curve
OgivePie Diagram
Scatter Diagram

8/8/2019 Business Statistics Lec 1
http://slidepdf.com/reader/full/business-statistics-lec-1 19/19
THANK YOU