business strategy - daniel serranodaniel-serrano.com/documents/serrano_daniel_zipcar_m2.pdf ·...
TRANSCRIPT
Business Strategy
Team 2Monica De LezaetaDaniel SerranoHugh BowenDaniel ShovlinAdam Chapman
Wheels when you want them
1Tuesday, May 4, 2010
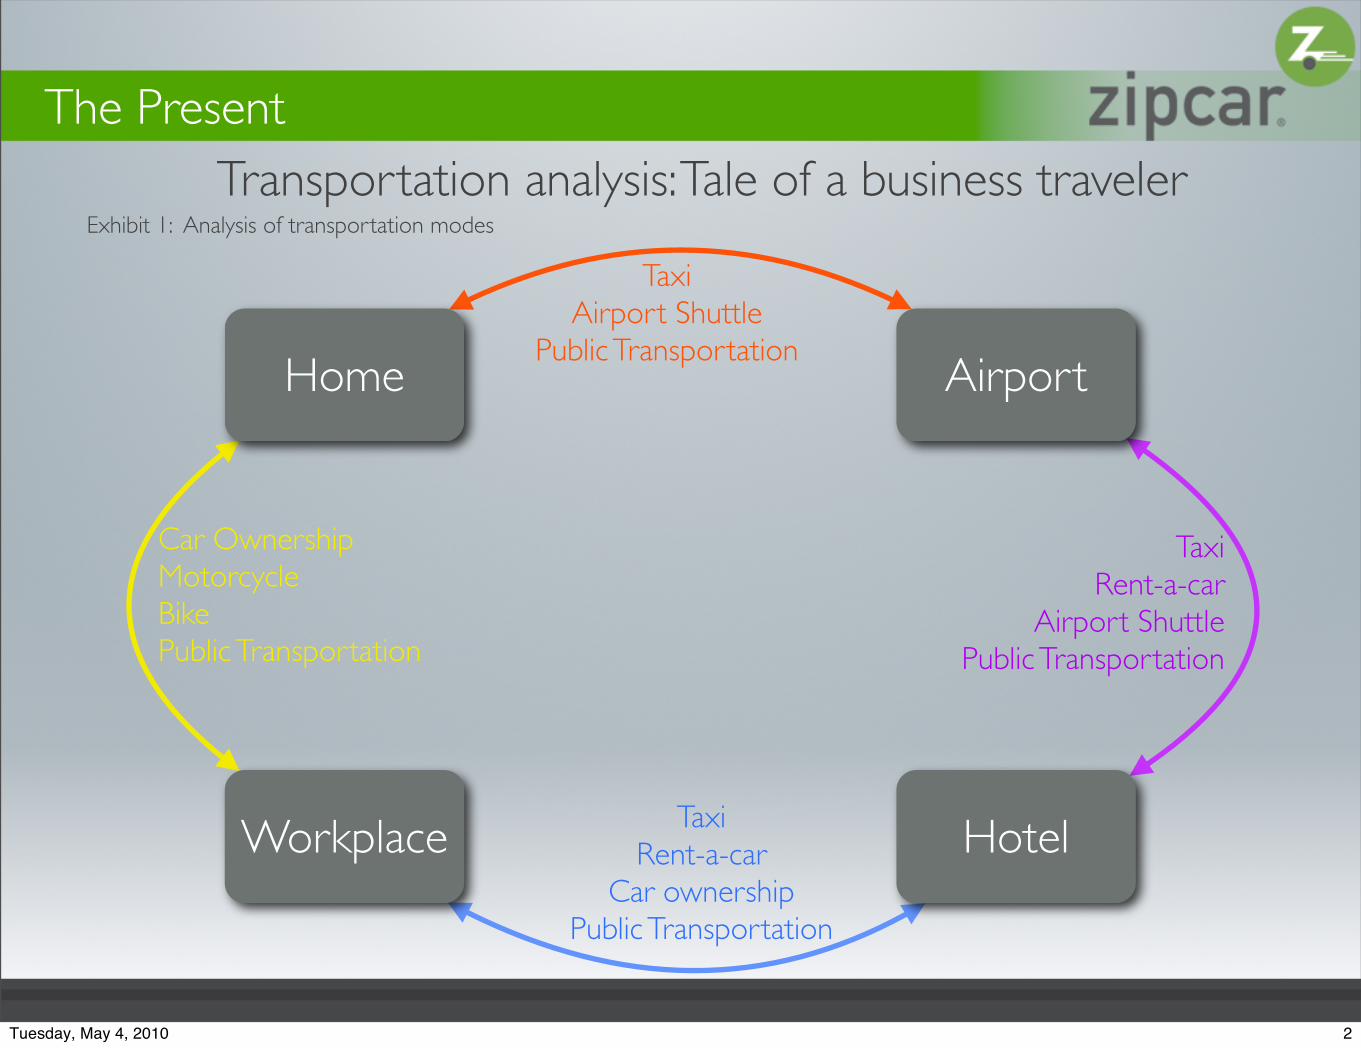
Home
HotelWorkplace
Airport
Car OwnershipMotorcycleBikePublic Transportation
TaxiRent-a-car
Airport ShuttlePublic Transportation
TaxiAirport Shuttle
Public Transportation
TaxiRent-a-car
Car ownershipPublic Transportation
The Present Transportation analysis: Tale of a business traveler
Exhibit 1: Analysis of transportation modes
2Tuesday, May 4, 2010
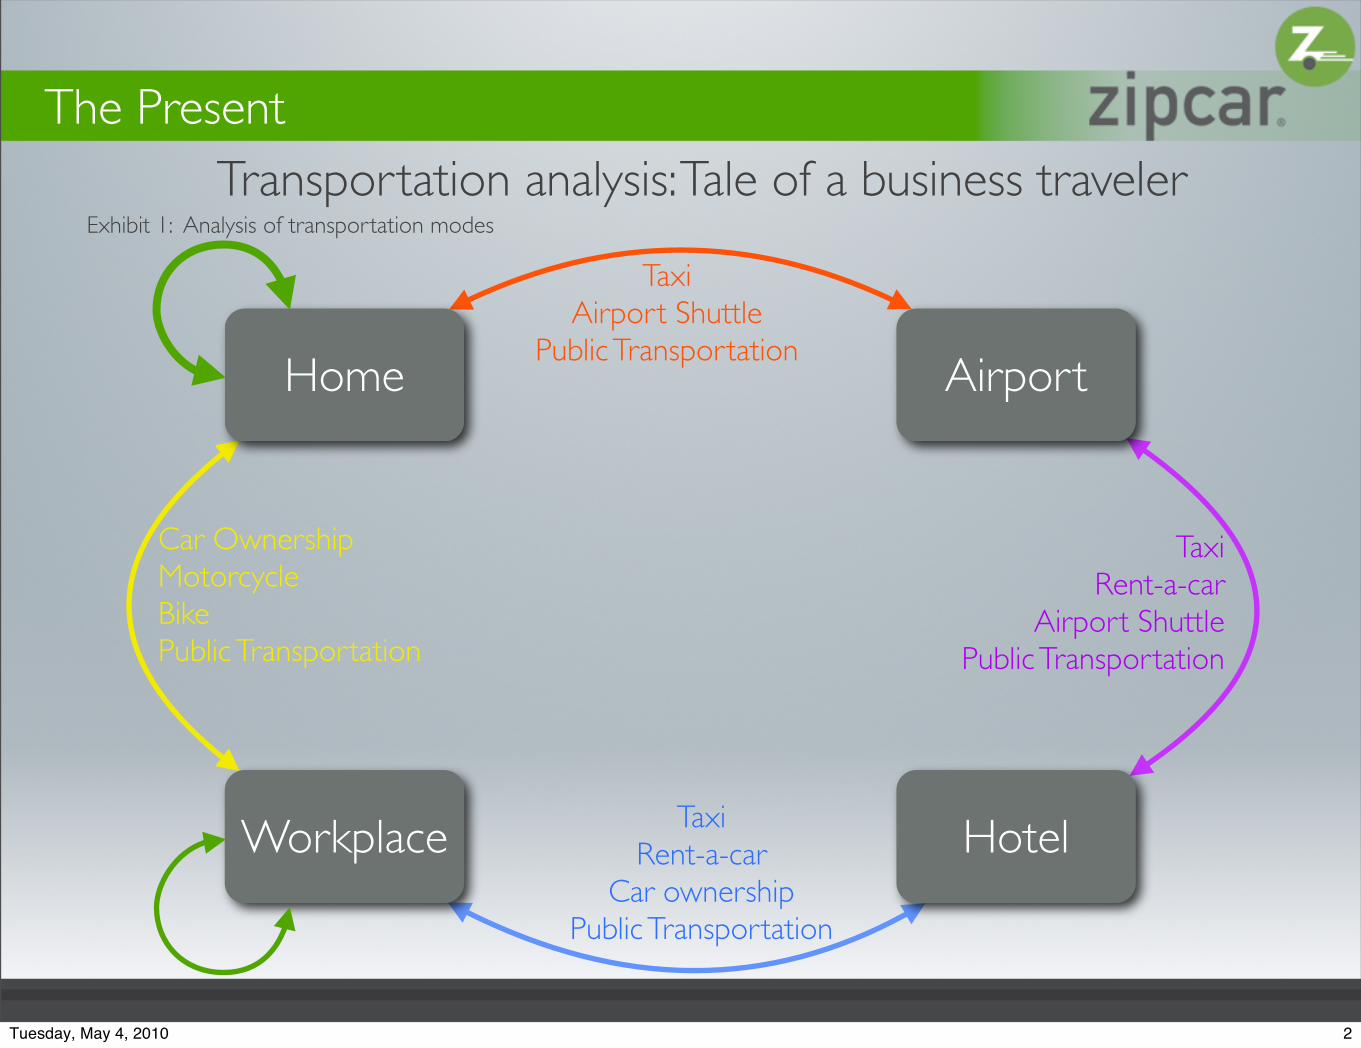
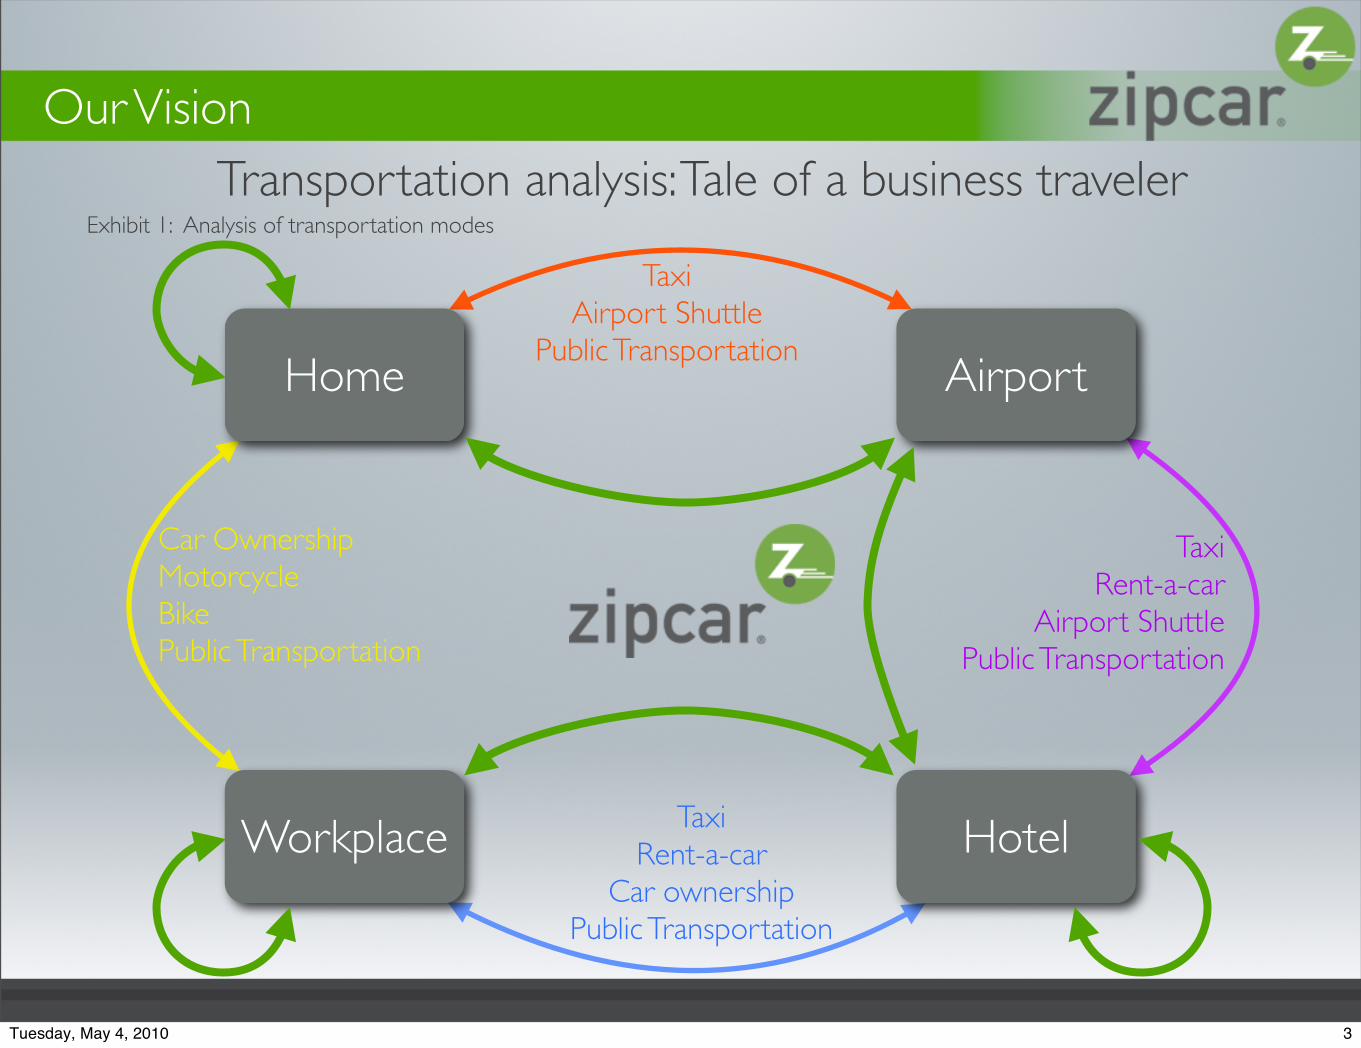
Transportation analysis: Tale of a business traveler
Home
HotelWorkplace
Airport
Car OwnershipMotorcycleBikePublic Transportation
TaxiRent-a-car
Airport ShuttlePublic Transportation
TaxiAirport Shuttle
Public Transportation
TaxiRent-a-car
Car ownershipPublic Transportation
Our Vision
Exhibit 1: Analysis of transportation modes
3Tuesday, May 4, 2010
Vision & Mission Statement
Vision“Be the Premier Global Car-Sharing Service provider offering and integrated transportation system solution.”
Mission“Strengthen the Zipcar brand in the United States and expand the Zipcar presence into Europe and Asia by leveraging core competencies, providing excellent customer service, capitalizing on proprietary technology and aggressively pursuing strategic partnerships.”
4Tuesday, May 4, 2010
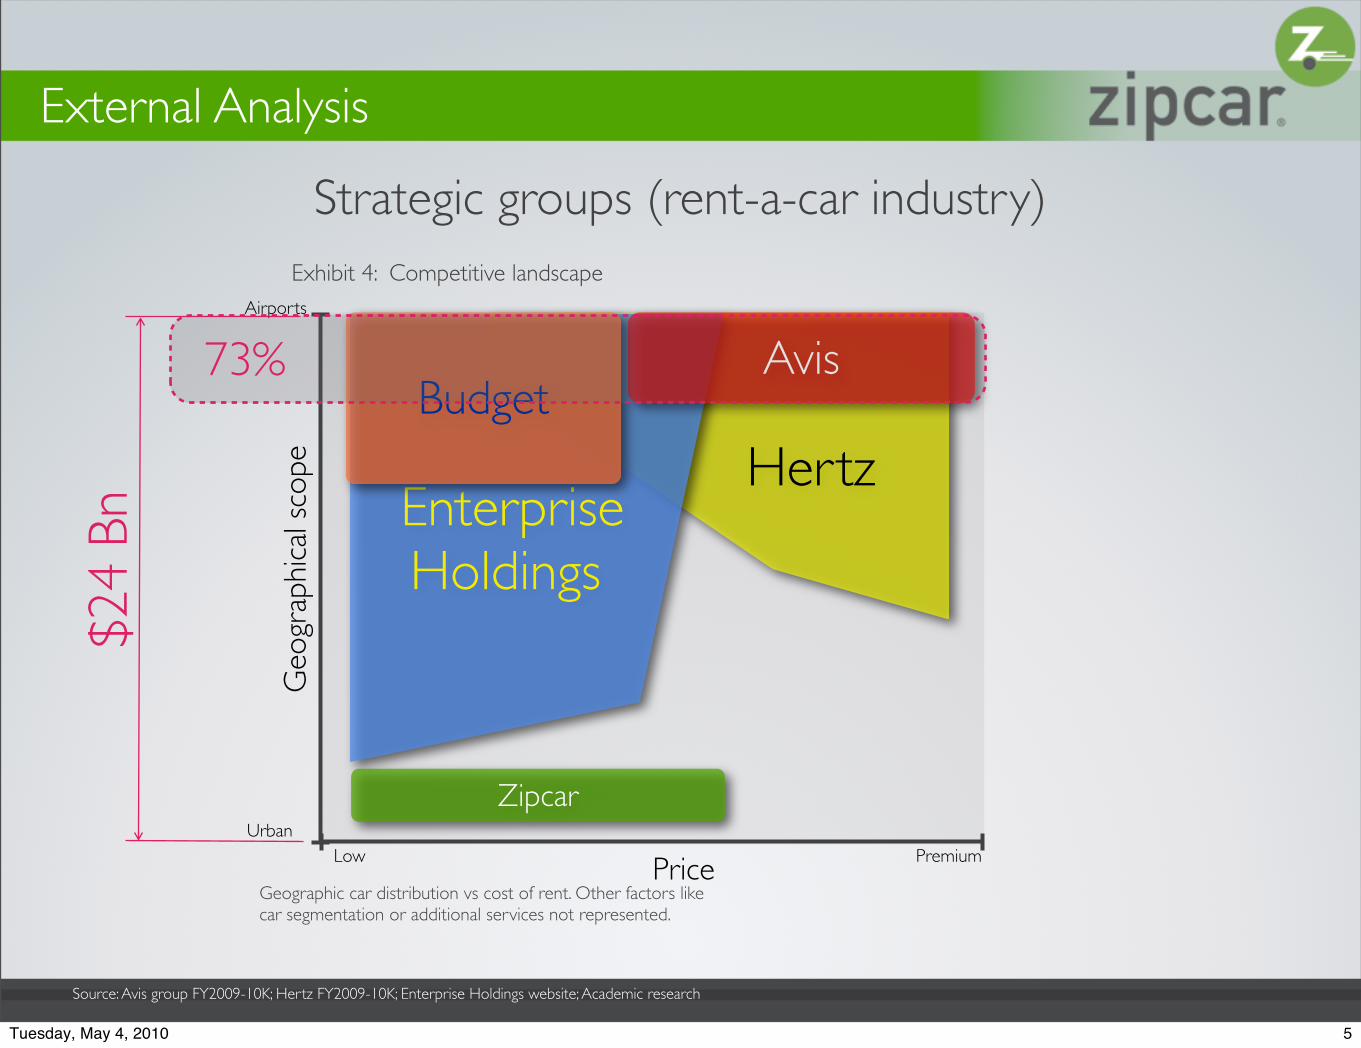
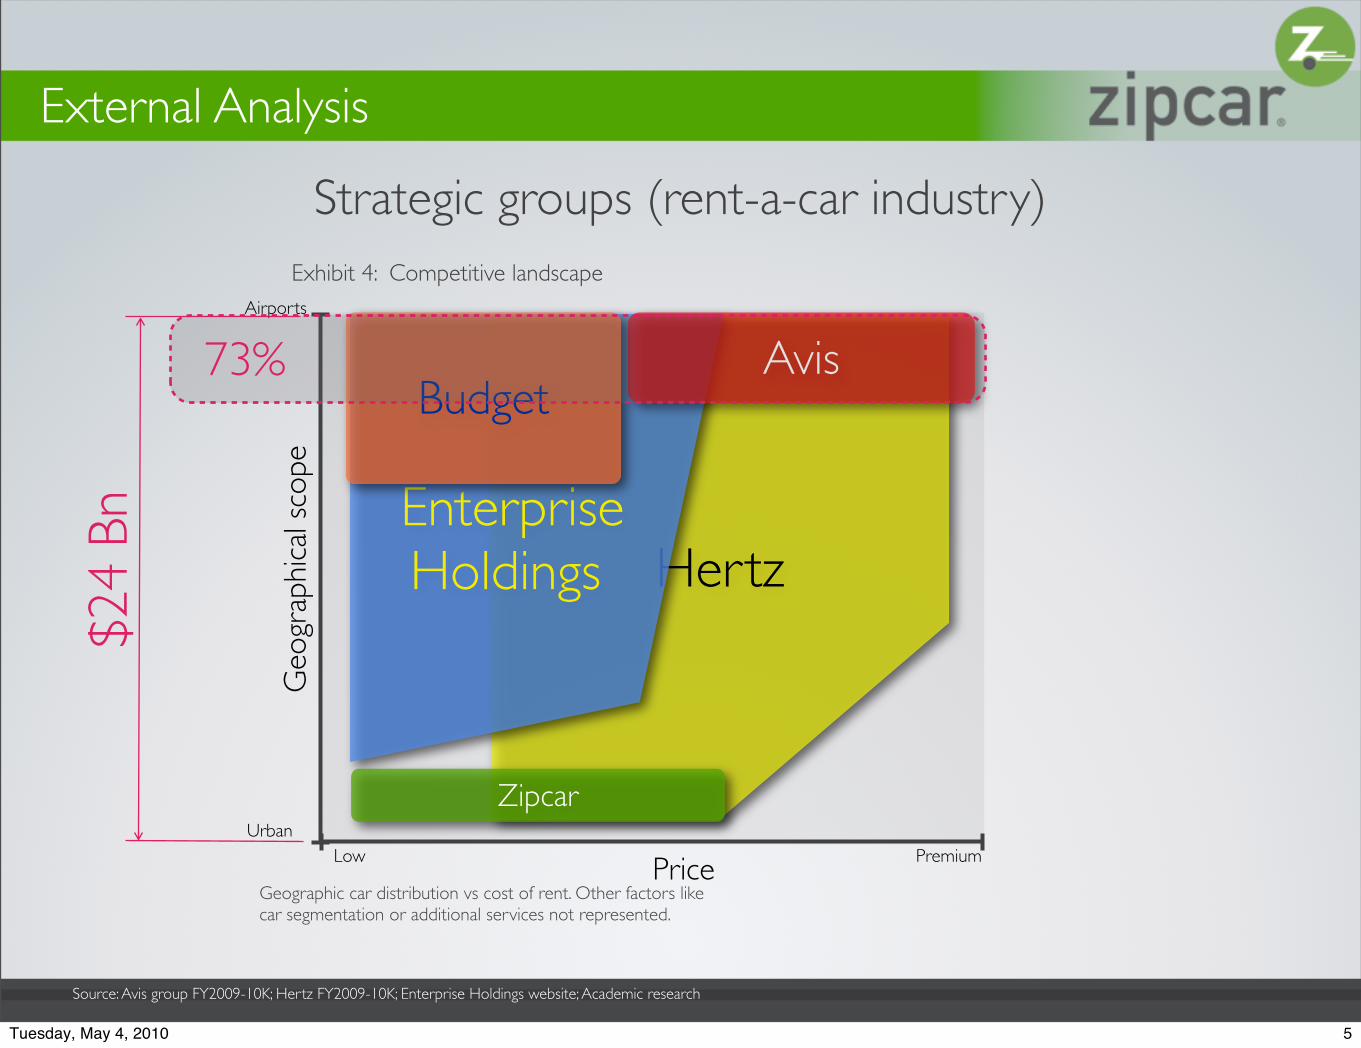
Strategic groups (rent-a-car industry)
Hertz
Airports
Urban
Geo
grap
hica
l sco
pe
PriceLow Premium
Exhibit 4: Competitive landscape
Geographic car distribution vs cost of rent. Other factors like car segmentation or additional services not represented.
Enterprise Holdings
AvisBudget
Zipcar
73%
External Analysis $2
4 Bn
Source: Avis group FY2009-10K; Hertz FY2009-10K; Enterprise Holdings website; Academic research
5Tuesday, May 4, 2010
Strategic groups (rent-a-car industry)
Airports
Urban
Geo
grap
hica
l sco
pe
PriceLow Premium
Exhibit 4: Competitive landscape
Geographic car distribution vs cost of rent. Other factors like car segmentation or additional services not represented.
HertzEnterprise Holdings
AvisBudget
Zipcar
73%
External Analysis $2
4 Bn
Source: Avis group FY2009-10K; Hertz FY2009-10K; Enterprise Holdings website; Academic research
5Tuesday, May 4, 2010

Ostrich Strategy
6Tuesday, May 4, 2010
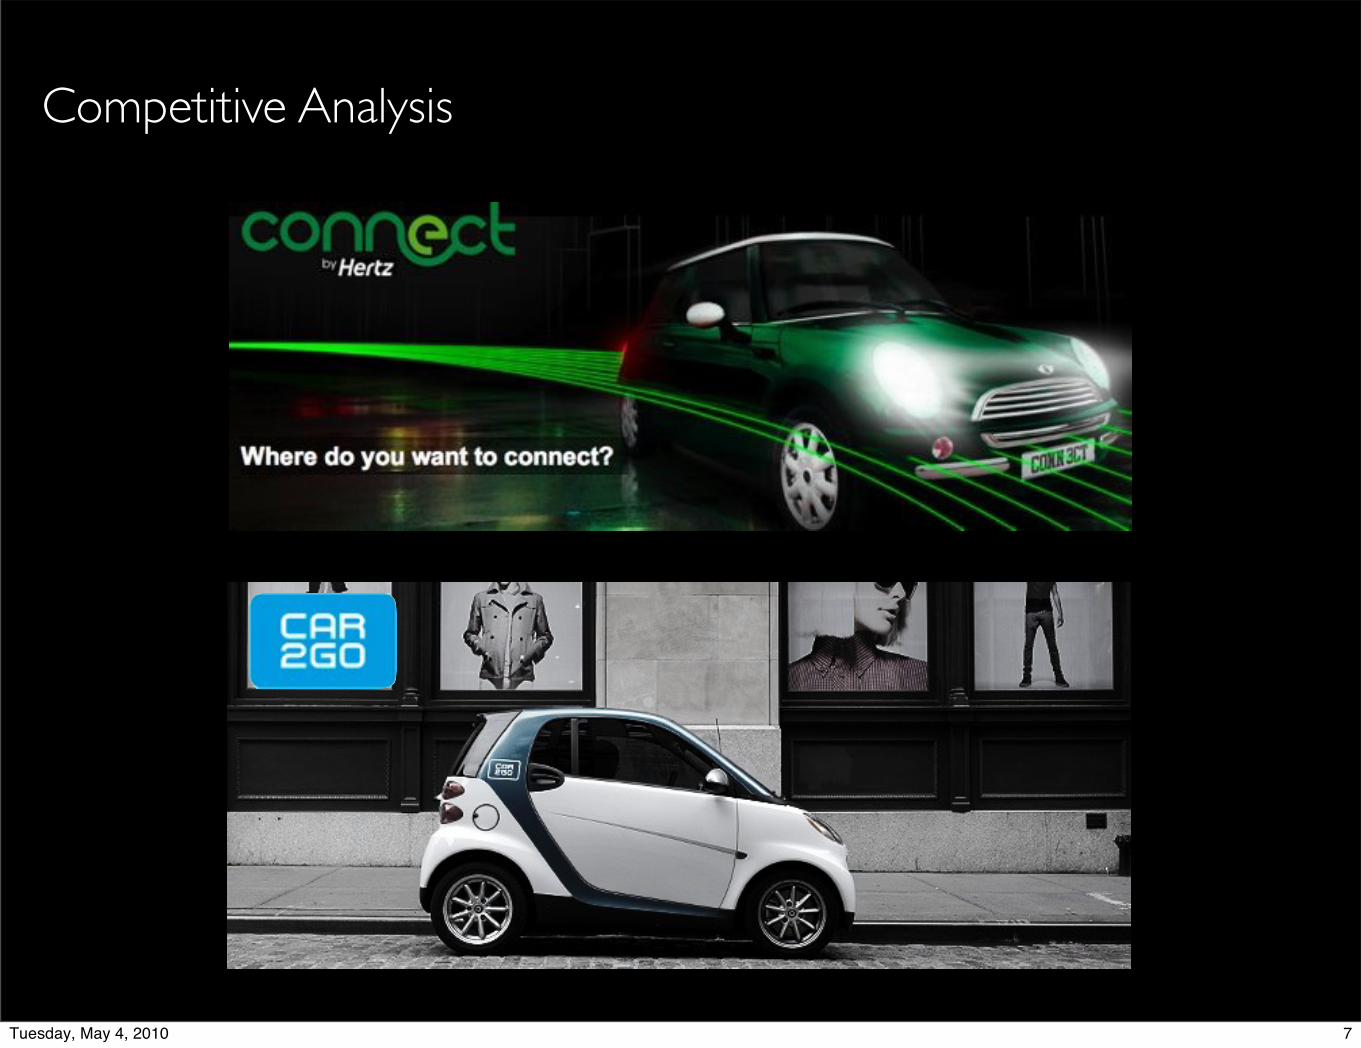
Competitive Analysis
7Tuesday, May 4, 2010
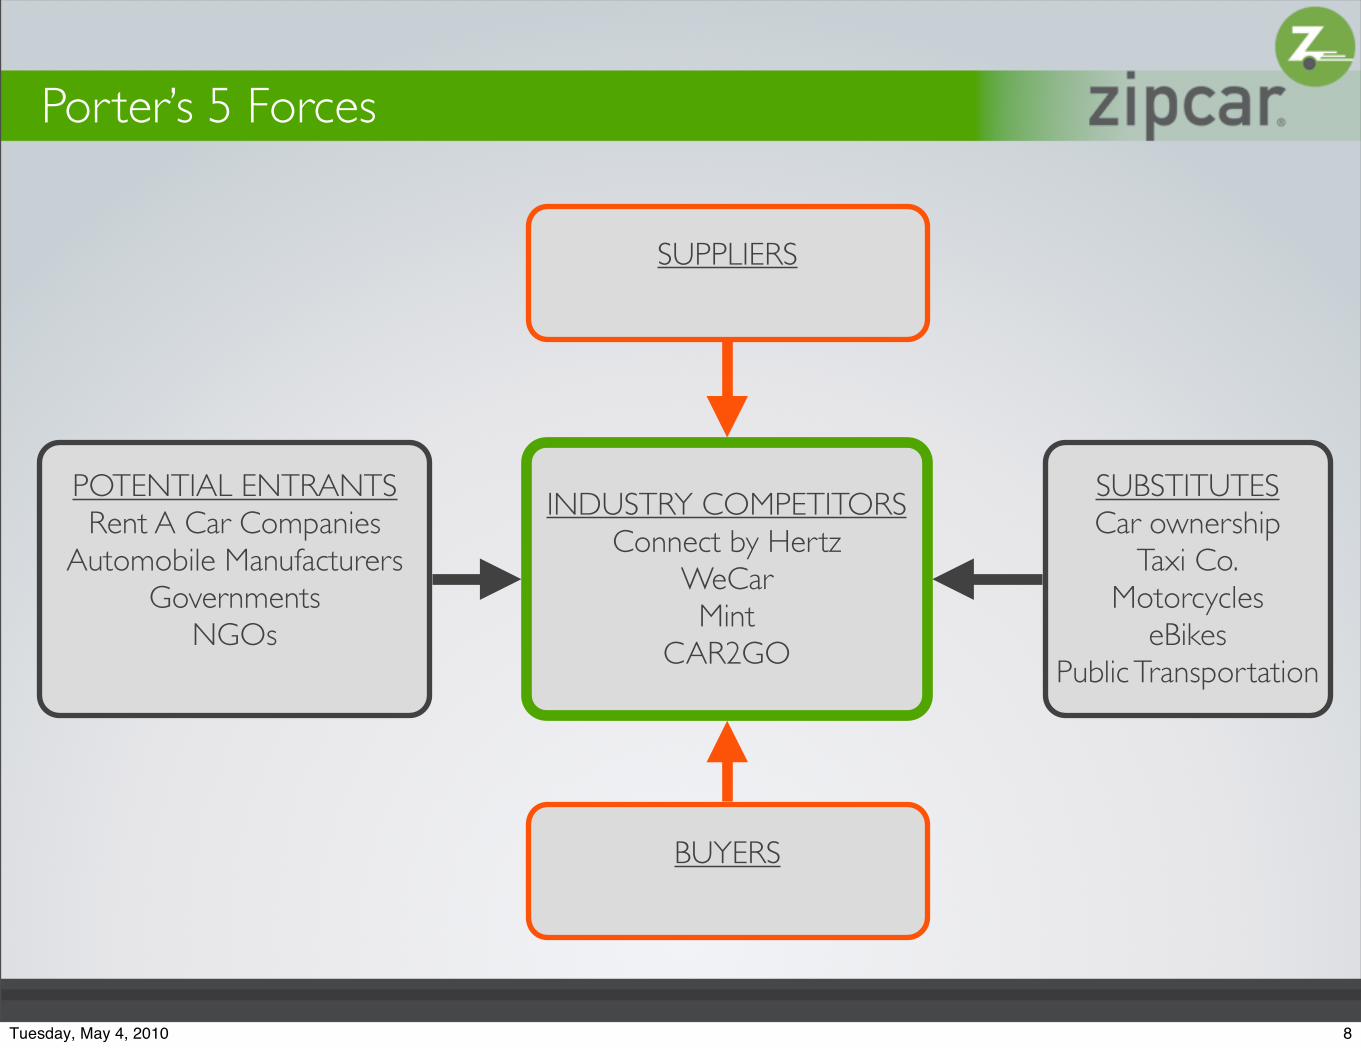
SUBSTITUTESCar ownership
Taxi Co.Motorcycles
eBikesPublic Transportation
POTENTIAL ENTRANTSRent A Car Companies
Automobile ManufacturersGovernments
NGOs
INDUSTRY COMPETITORSConnect by Hertz
WeCarMint
CAR2GO
SUPPLIERS
BUYERS
Porter’s 5 Forces
8Tuesday, May 4, 2010
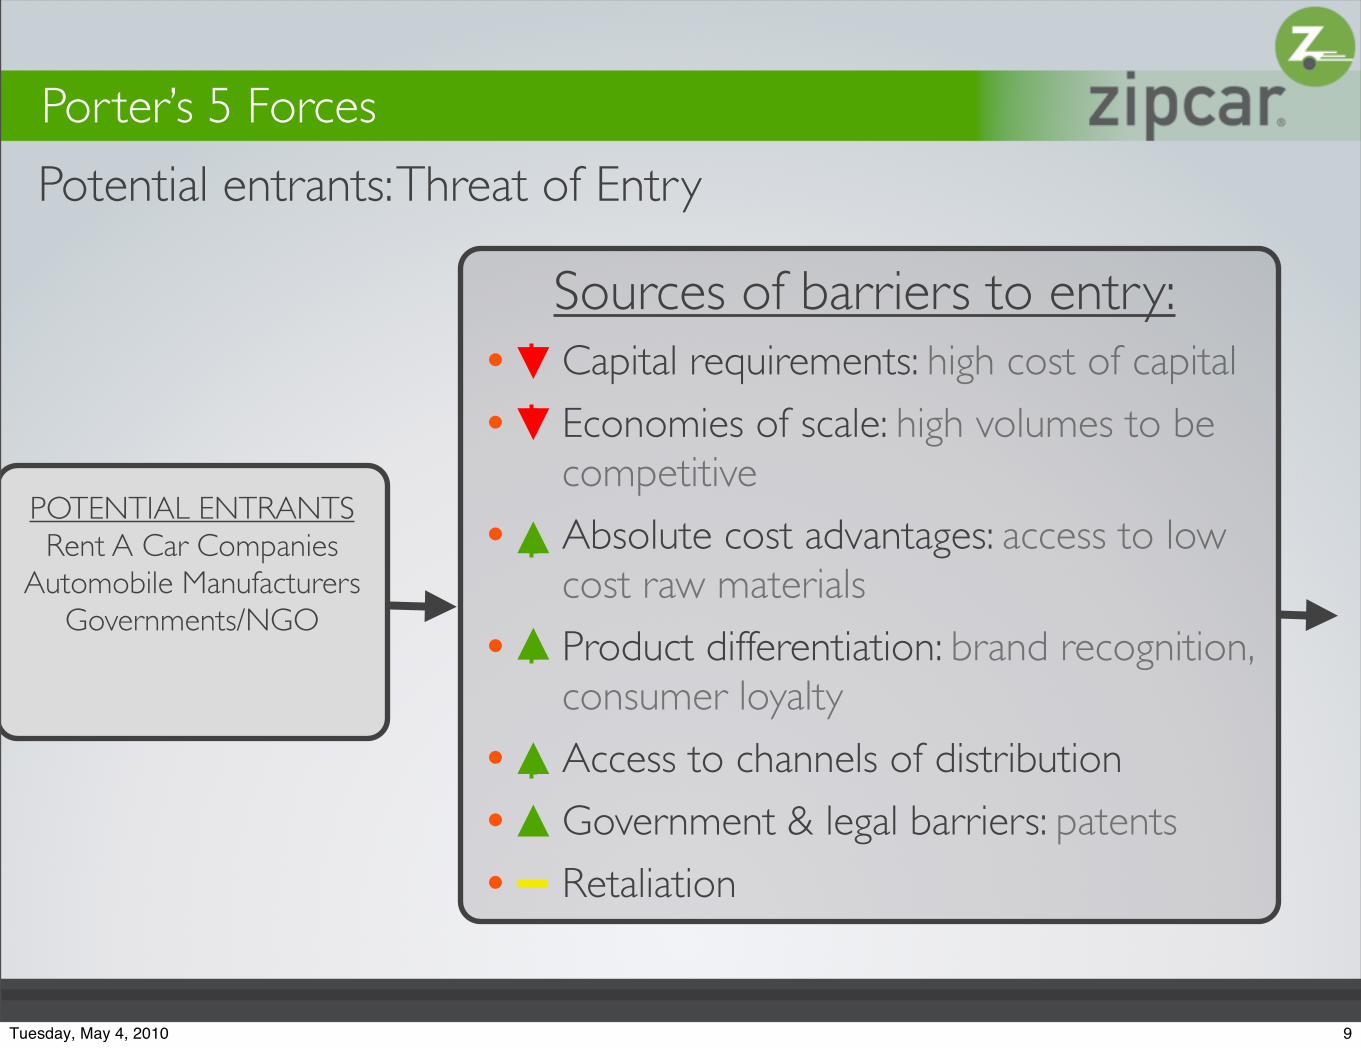
Potential entrants: Threat of Entry
Sources of barriers to entry:• Capital requirements: high cost of capital
• Economies of scale: high volumes to be competitive
• Absolute cost advantages: access to low cost raw materials
• Product differentiation: brand recognition, consumer loyalty
• Access to channels of distribution
• Government & legal barriers: patents
• Retaliation
POTENTIAL ENTRANTSRent A Car Companies
Automobile ManufacturersGovernments/NGO
Porter’s 5 Forces
9Tuesday, May 4, 2010
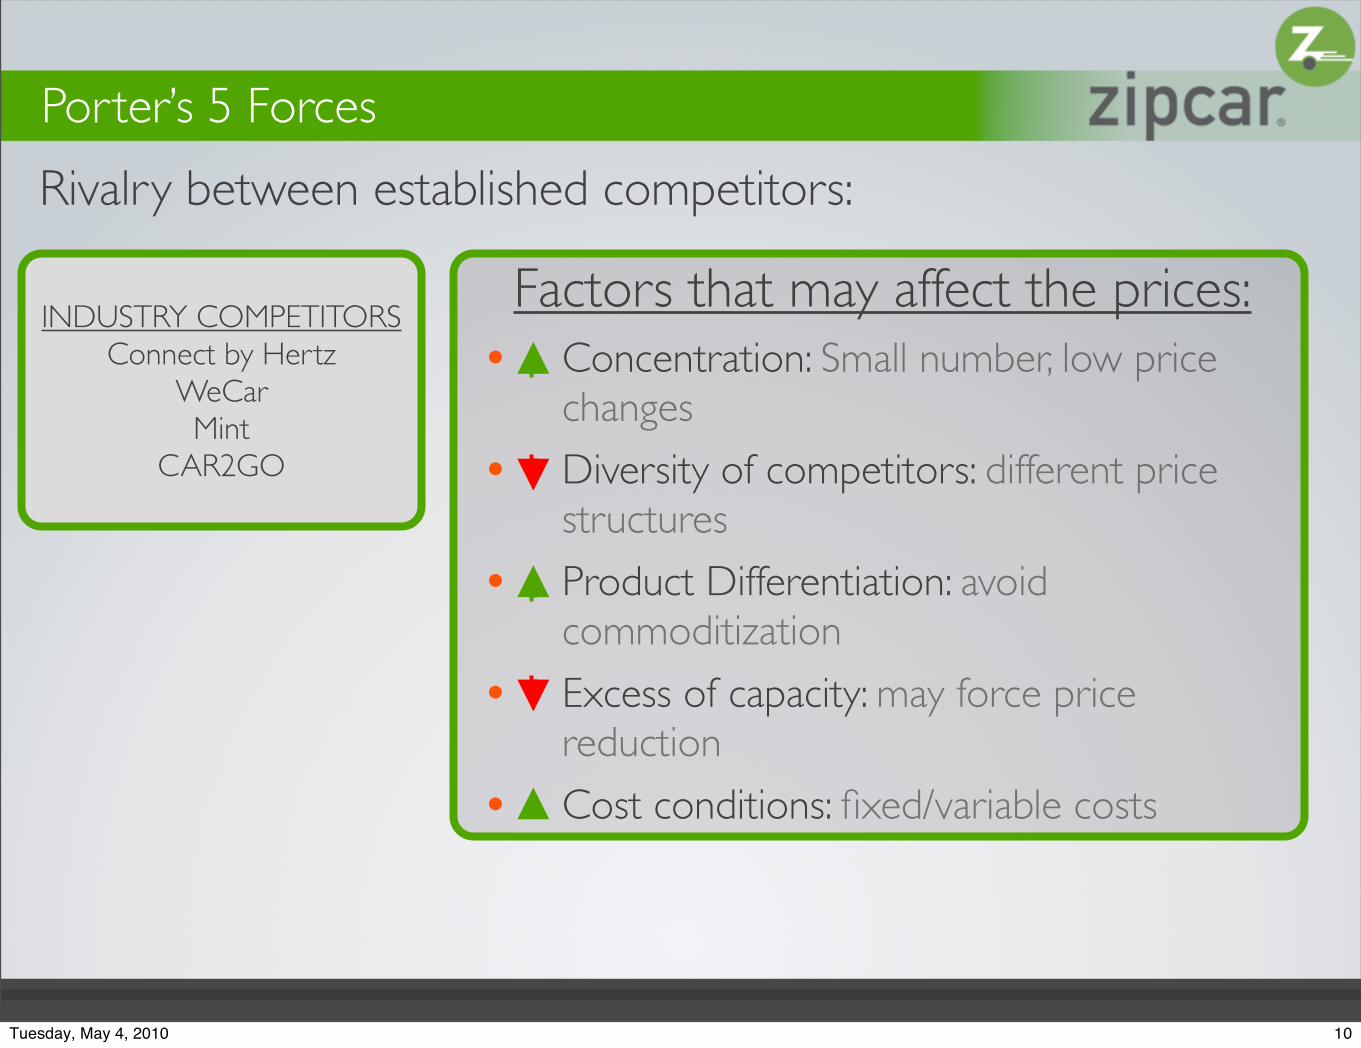
Rivalry between established competitors:
Factors that may affect the prices:• Concentration: Small number, low price
changes
• Diversity of competitors: different price structures
• Product Differentiation: avoid commoditization
• Excess of capacity: may force price reduction
• Cost conditions: fixed/variable costs
INDUSTRY COMPETITORSConnect by Hertz
WeCarMint
CAR2GO
Porter’s 5 Forces
10Tuesday, May 4, 2010
High
Low
Flex
ibilit
y ne
eded
Distance of travelLow High
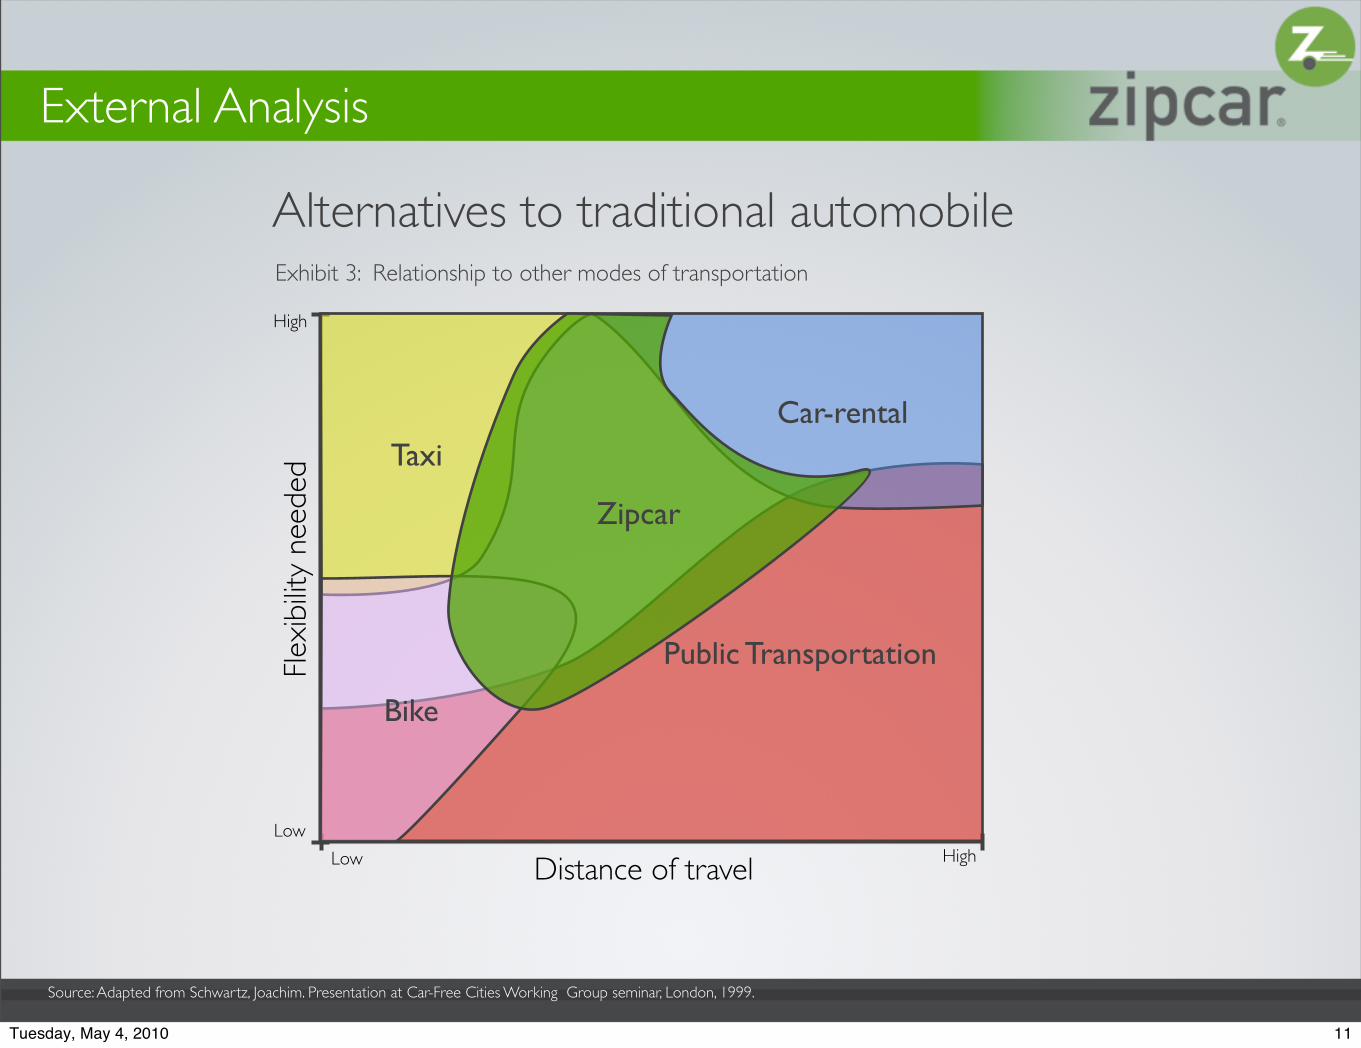
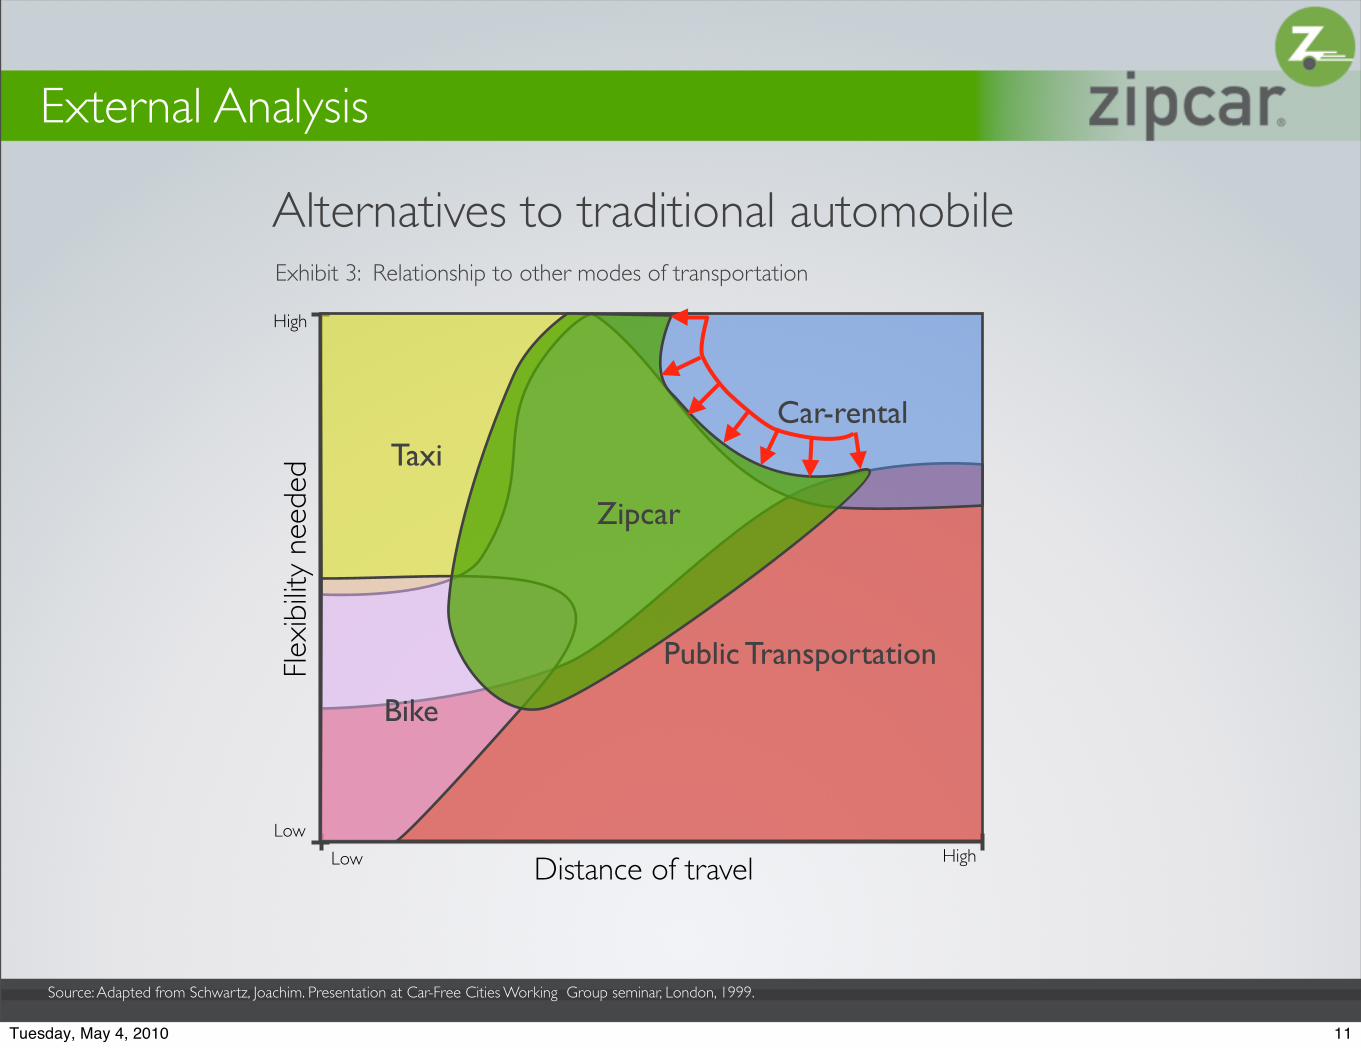
Source: Adapted from Schwartz, Joachim. Presentation at Car-Free Cities Working Group seminar, London, 1999.
Public Transportation
Taxi
Bike
Car-rental
Exhibit 3: Relationship to other modes of transportation
Zipcar
External Analysis
Alternatives to traditional automobile
11Tuesday, May 4, 2010
High
Low
Flex
ibilit
y ne
eded
Distance of travelLow High
Source: Adapted from Schwartz, Joachim. Presentation at Car-Free Cities Working Group seminar, London, 1999.
Public Transportation
Taxi
Bike
Car-rental
Exhibit 3: Relationship to other modes of transportation
Zipcar
External Analysis
Alternatives to traditional automobile
11Tuesday, May 4, 2010
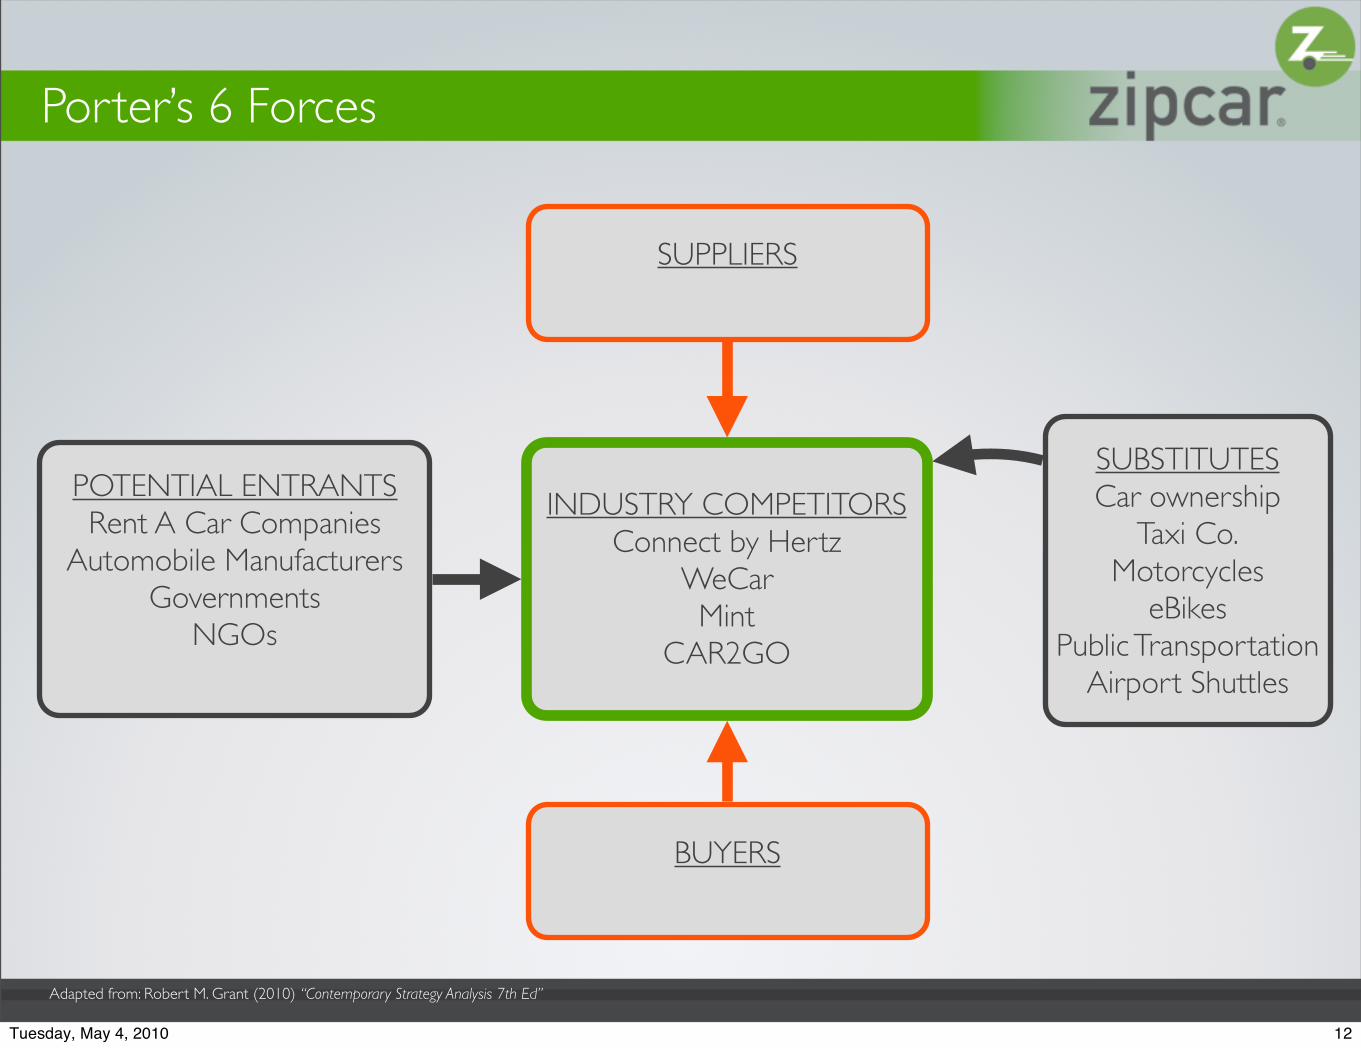
POTENTIAL ENTRANTSRent A Car Companies
Automobile ManufacturersGovernments
NGOs
INDUSTRY COMPETITORSConnect by Hertz
WeCarMint
CAR2GO
COMPLEMENTSeBikes
Public TransportationAirport Shuttles
SUPPLIERS
BUYERS
Porter’s 6 Forces
Adapted from: Robert M. Grant (2010) “Contemporary Strategy Analysis 7th Ed”
SUBSTITUTESCar ownership
Taxi Co.Motorcycles
eBikesPublic Transportation
Airport Shuttles
12Tuesday, May 4, 2010
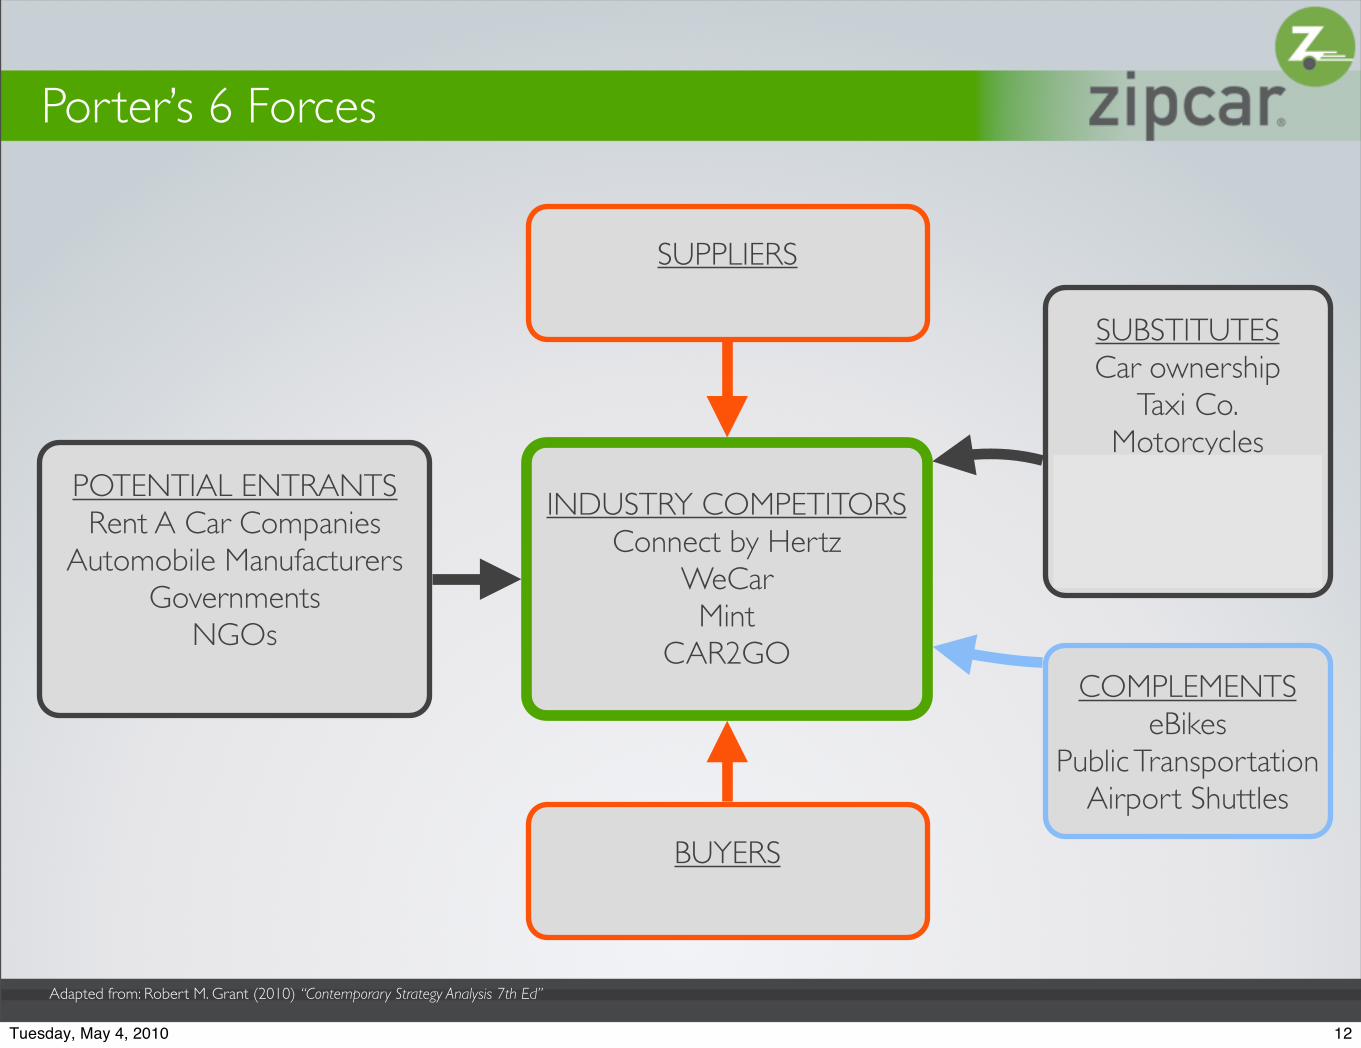
POTENTIAL ENTRANTSRent A Car Companies
Automobile ManufacturersGovernments
NGOs
INDUSTRY COMPETITORSConnect by Hertz
WeCarMint
CAR2GOCOMPLEMENTS
eBikesPublic Transportation
Airport Shuttles
SUPPLIERS
BUYERS
Porter’s 6 Forces
Adapted from: Robert M. Grant (2010) “Contemporary Strategy Analysis 7th Ed”
SUBSTITUTESCar ownership
Taxi Co.Motorcycles
eBikesPublic Transportation
Airport Shuttles
12Tuesday, May 4, 2010
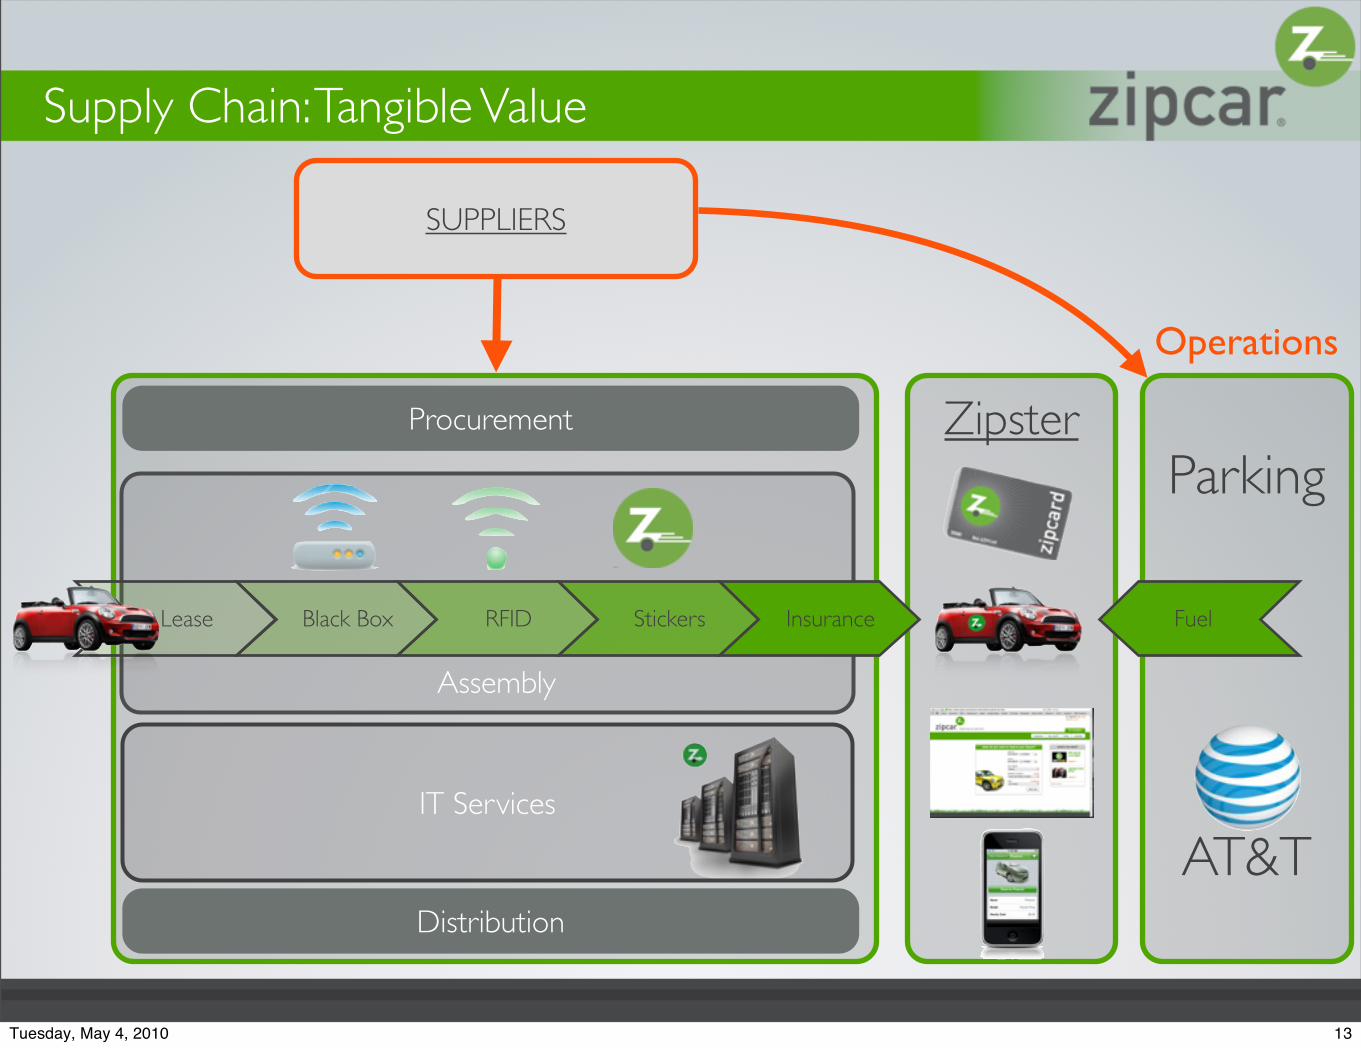
Supply Chain: Tangible Value
InsuranceStickersRFIDBlack BoxLease
SUPPLIERS
Procurement
Distribution
Operations
Assembly
IT Services
ZipsterParking
Fuel
AT&T
13Tuesday, May 4, 2010
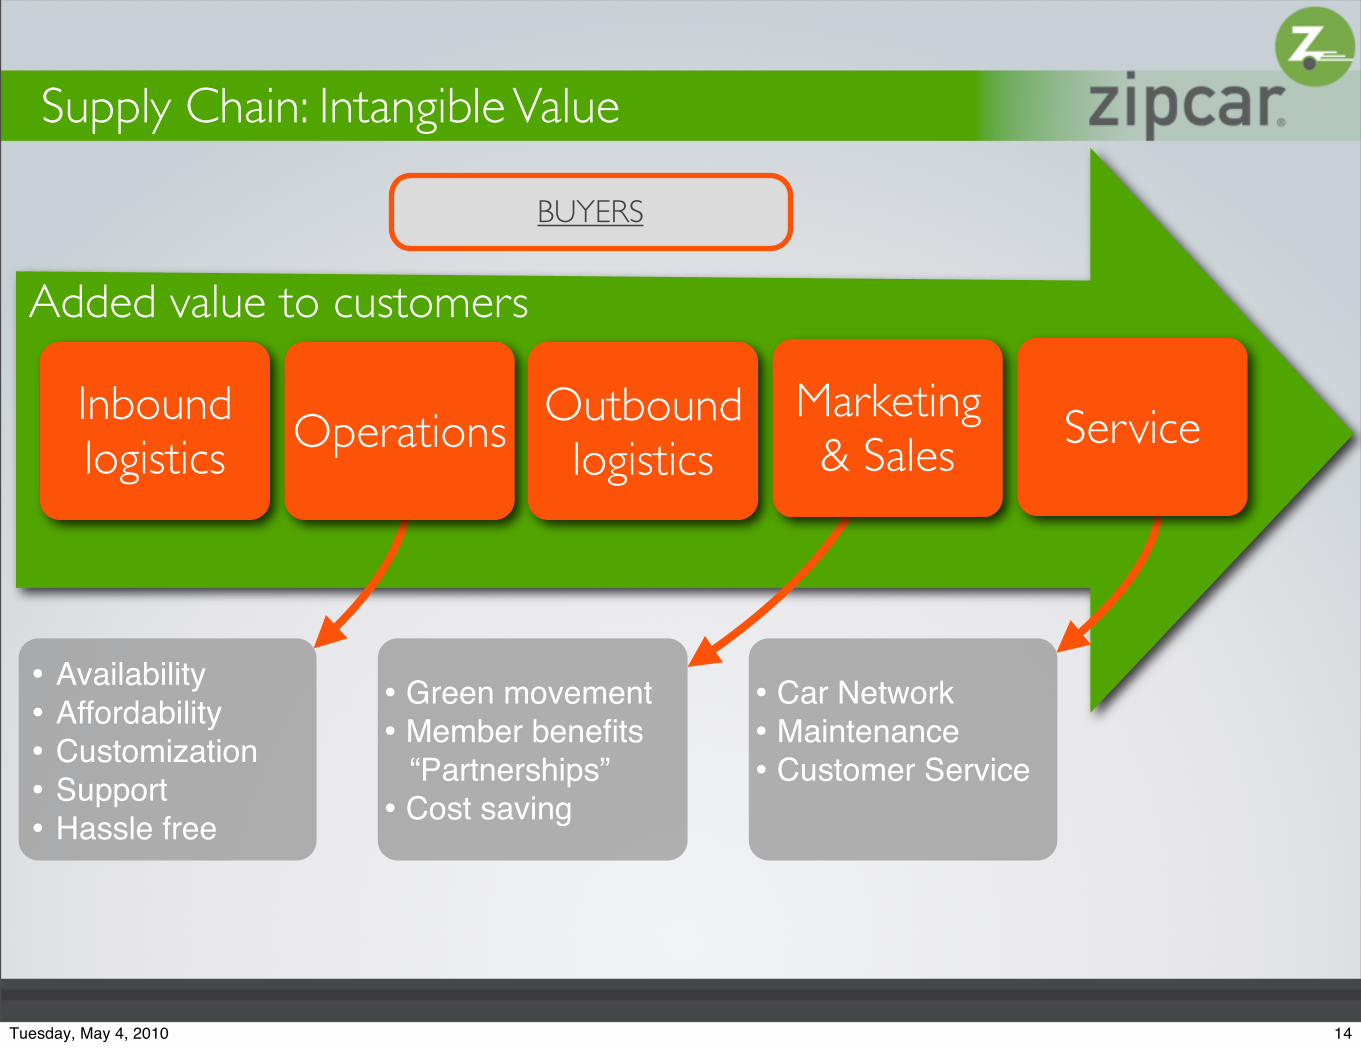
Supply Chain: Intangible Value
Inbound logistics Operations
Outbound logistics
Marketing & Sales
Service
• Green movement• Member benefits “Partnerships”• Cost saving
• Availability• Affordability• Customization• Support• Hassle free
• Car Network• Maintenance• Customer Service
Added value to customers
BUYERS
14Tuesday, May 4, 2010
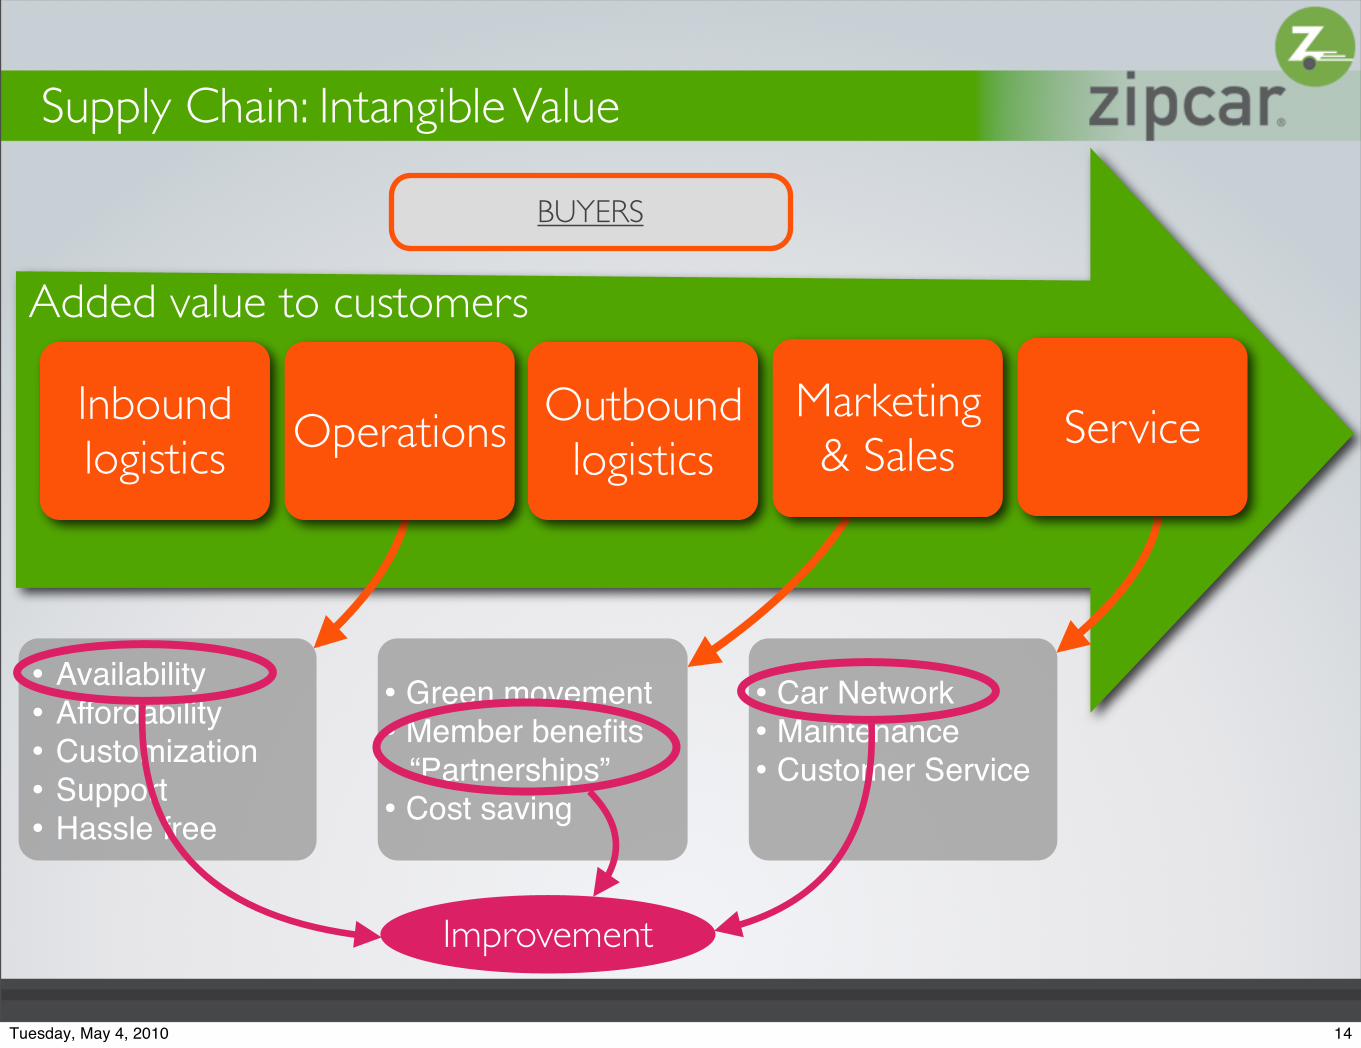
Supply Chain: Intangible Value
Inbound logistics Operations
Outbound logistics
Marketing & Sales
Service
• Green movement• Member benefits “Partnerships”• Cost saving
• Availability• Affordability• Customization• Support• Hassle free
• Car Network• Maintenance• Customer Service
Added value to customers
Improvement
BUYERS
14Tuesday, May 4, 2010
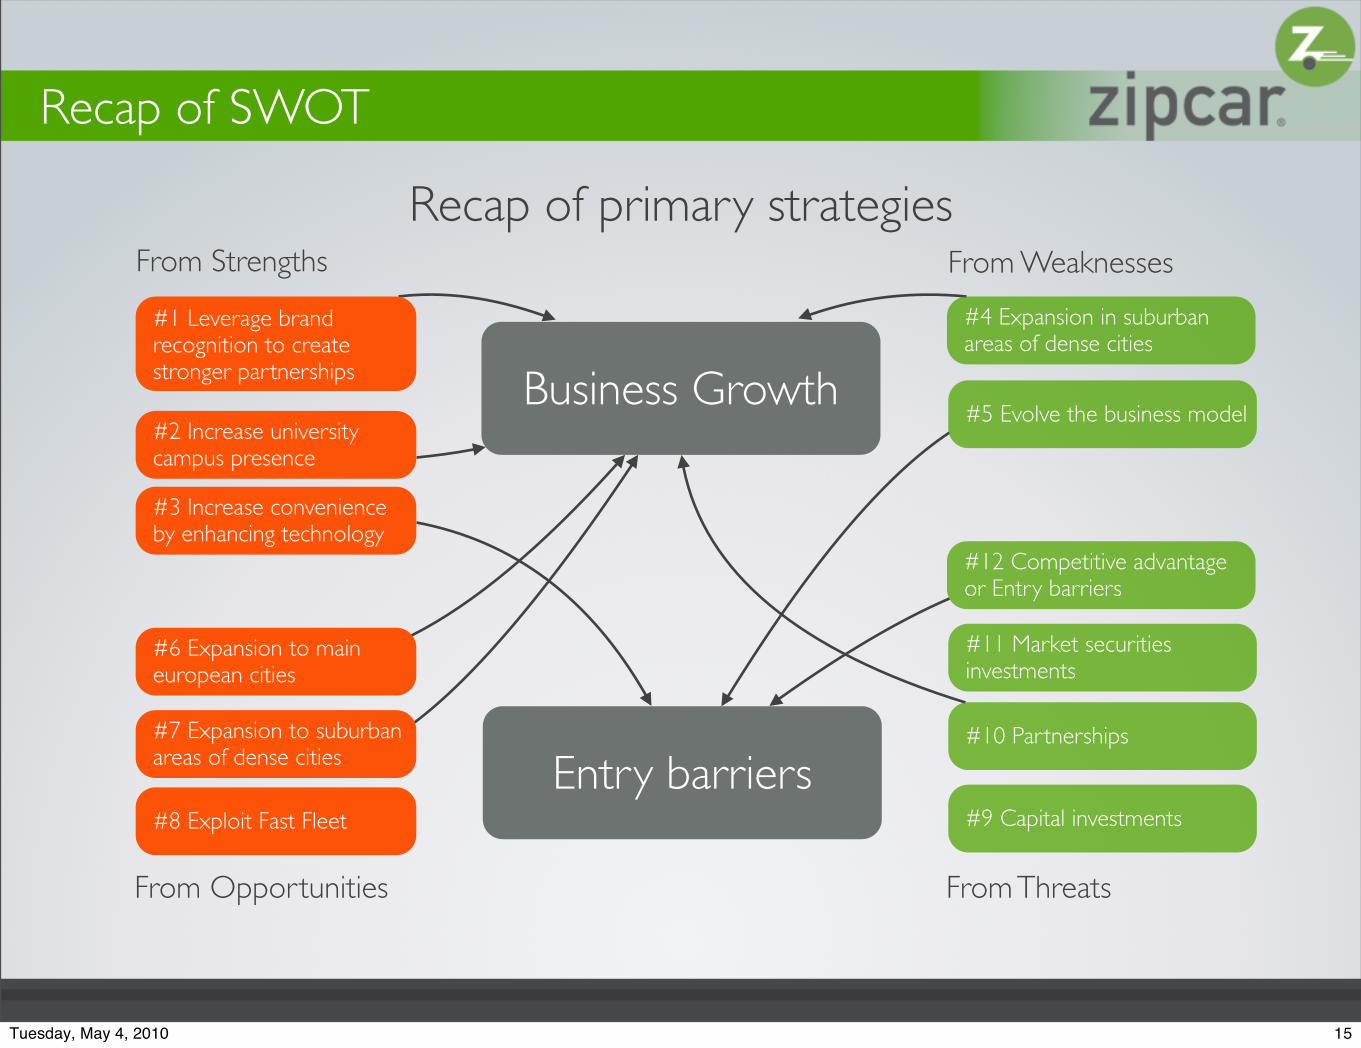
Recap of primary strategies
#1 Leverage brand recognition to create stronger partnerships
#3 Increase convenience by enhancing technology
#2 Increase university campus presence
#4 Expansion in suburban areas of dense cities
#5 Evolve the business model
#7 Expansion to suburban areas of dense cities
#6 Expansion to main european cities
#9 Capital investments
#11 Market securities investments
#12 Competitive advantage or Entry barriers
#10 Partnerships
Recap of SWOT
From Strengths From Weaknesses
From Opportunities From Threats
Business Growth
Entry barriers#8 Exploit Fast Fleet
15Tuesday, May 4, 2010
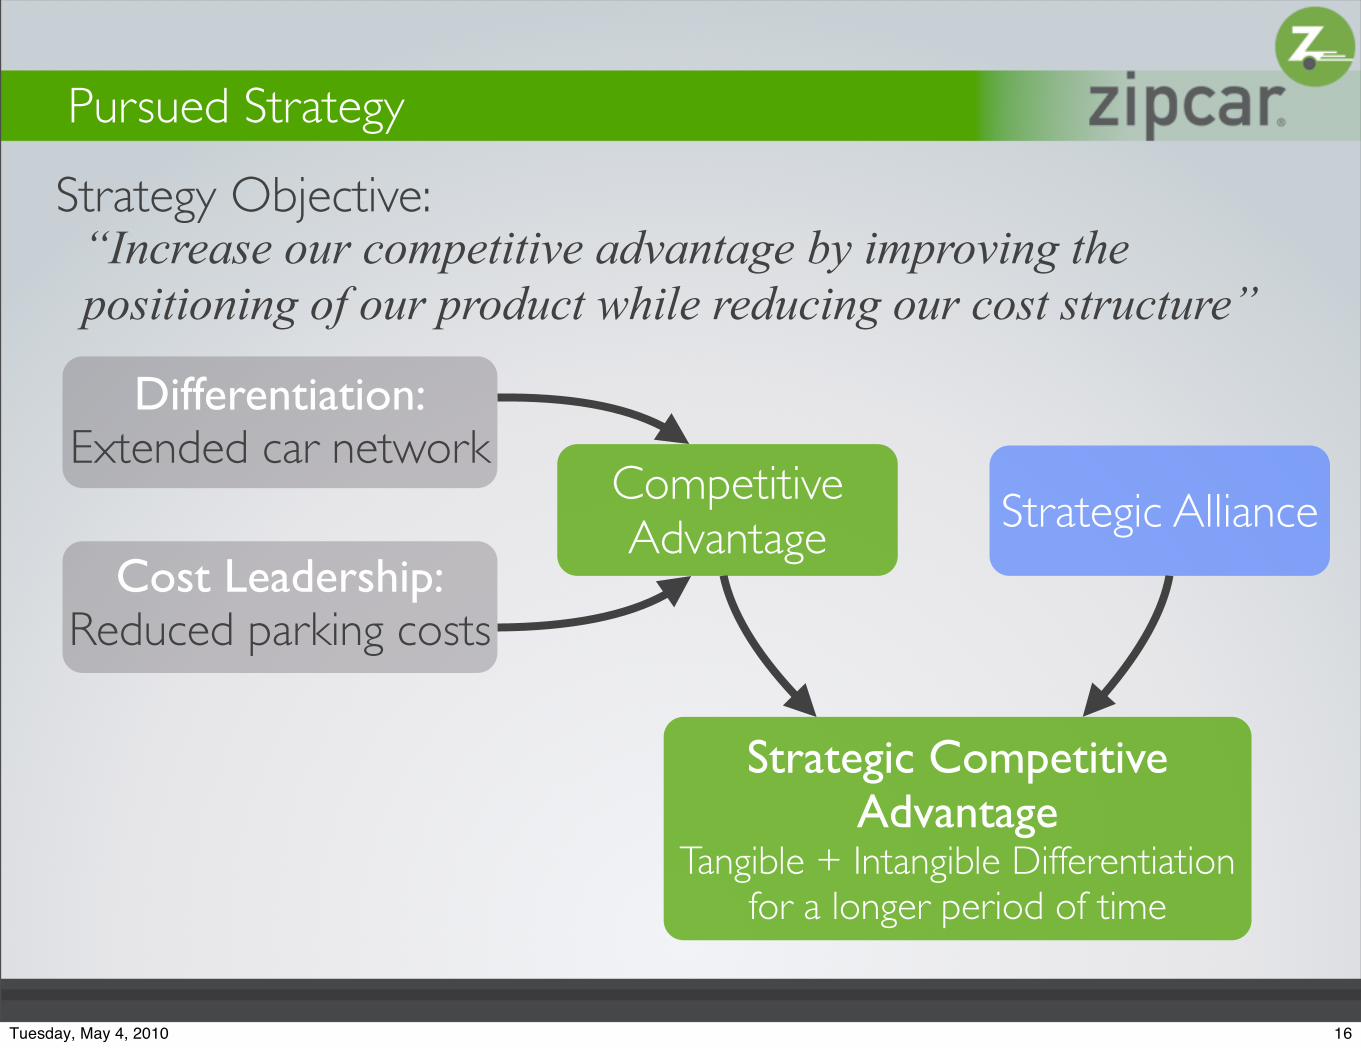
Strategy Objective:“Increase our competitive advantage by improving the positioning of our product while reducing our cost structure”
Differentiation:Extended car network
Cost Leadership:Reduced parking costs
Competitive Advantage Strategic Alliance
Strategic Competitive Advantage
Tangible + Intangible Differentiation for a longer period of time
Pursued Strategy
16Tuesday, May 4, 2010
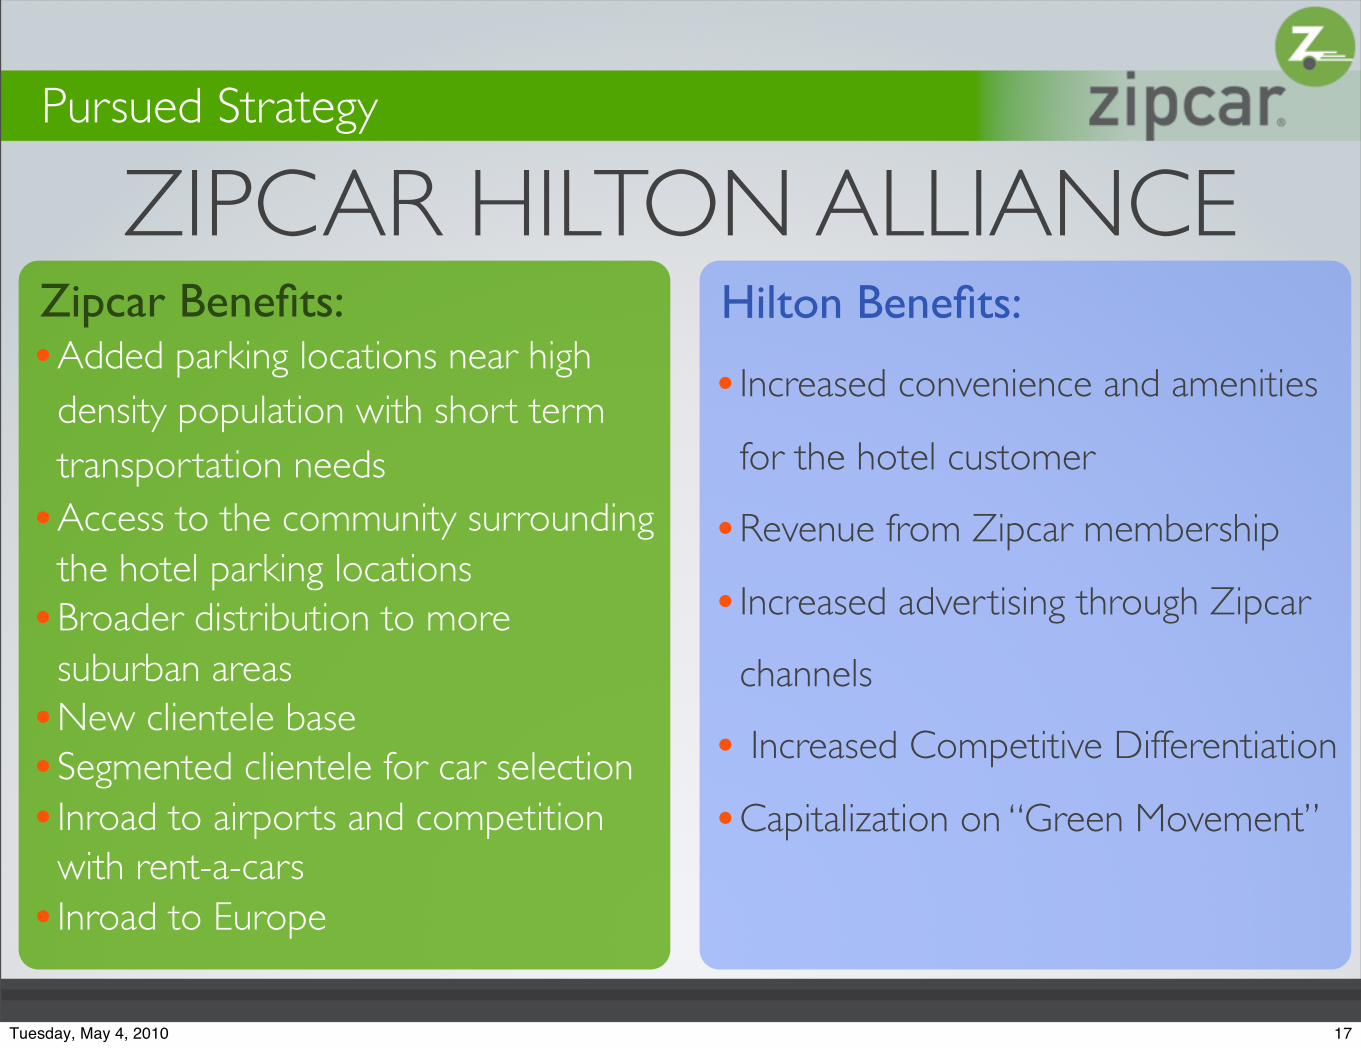
ZIPCAR HILTON ALLIANCEZipcar Benefits:•Added parking locations near high
density population with short term transportation needs
•Access to the community surrounding the hotel parking locations
•Broader distribution to more suburban areas
•New clientele base•Segmented clientele for car selection•Inroad to airports and competition
with rent-a-cars•Inroad to Europe
Hilton Benefits:
•Increased convenience and amenities
for the hotel customer
•Revenue from Zipcar membership
•Increased advertising through Zipcar
channels
• Increased Competitive Differentiation
•Capitalization on “Green Movement”
Pursued Strategy
17Tuesday, May 4, 2010
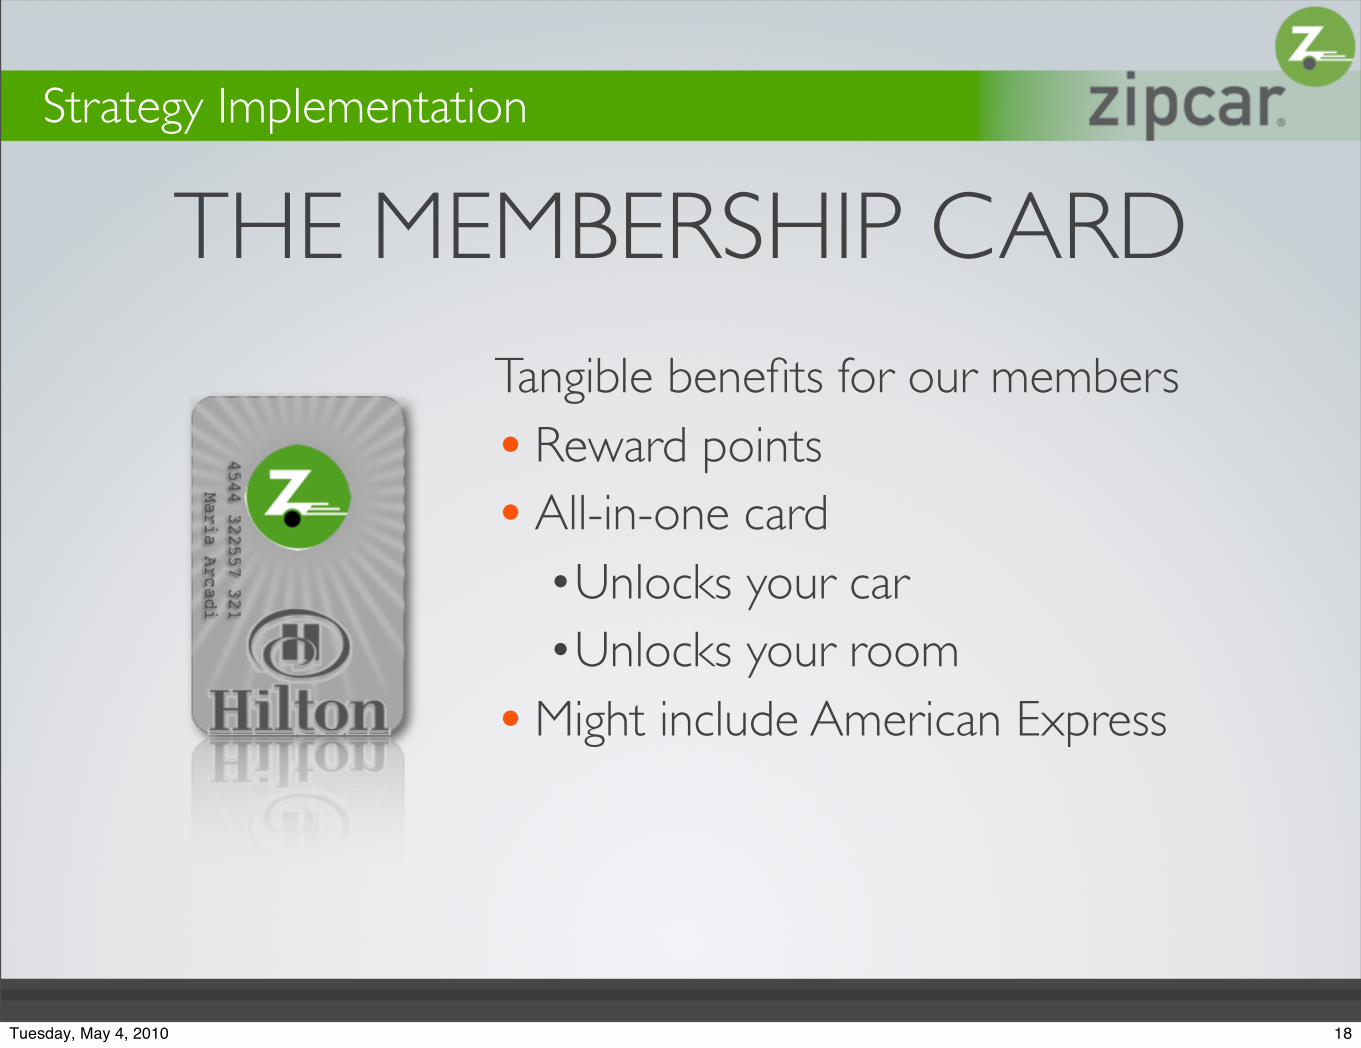
THE MEMBERSHIP CARDTangible benefits for our members
• Reward points• All-in-one card
•Unlocks your car•Unlocks your room
• Might include American Express
Strategy Implementation
18Tuesday, May 4, 2010
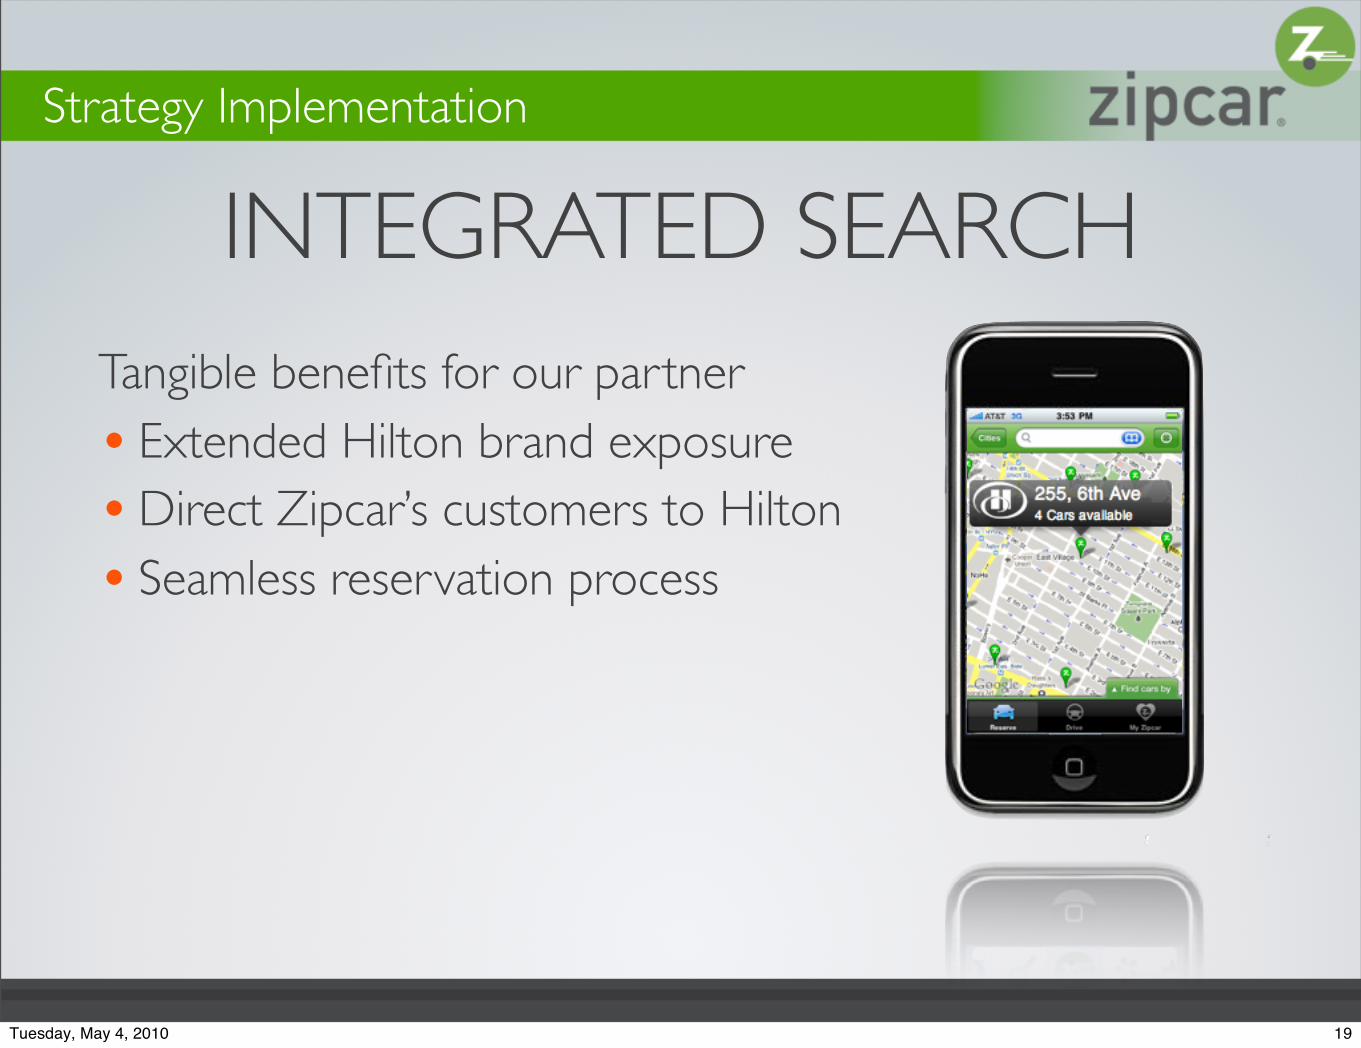
INTEGRATED SEARCHTangible benefits for our partner
• Extended Hilton brand exposure• Direct Zipcar’s customers to Hilton
• Seamless reservation process
Strategy Implementation
19Tuesday, May 4, 2010
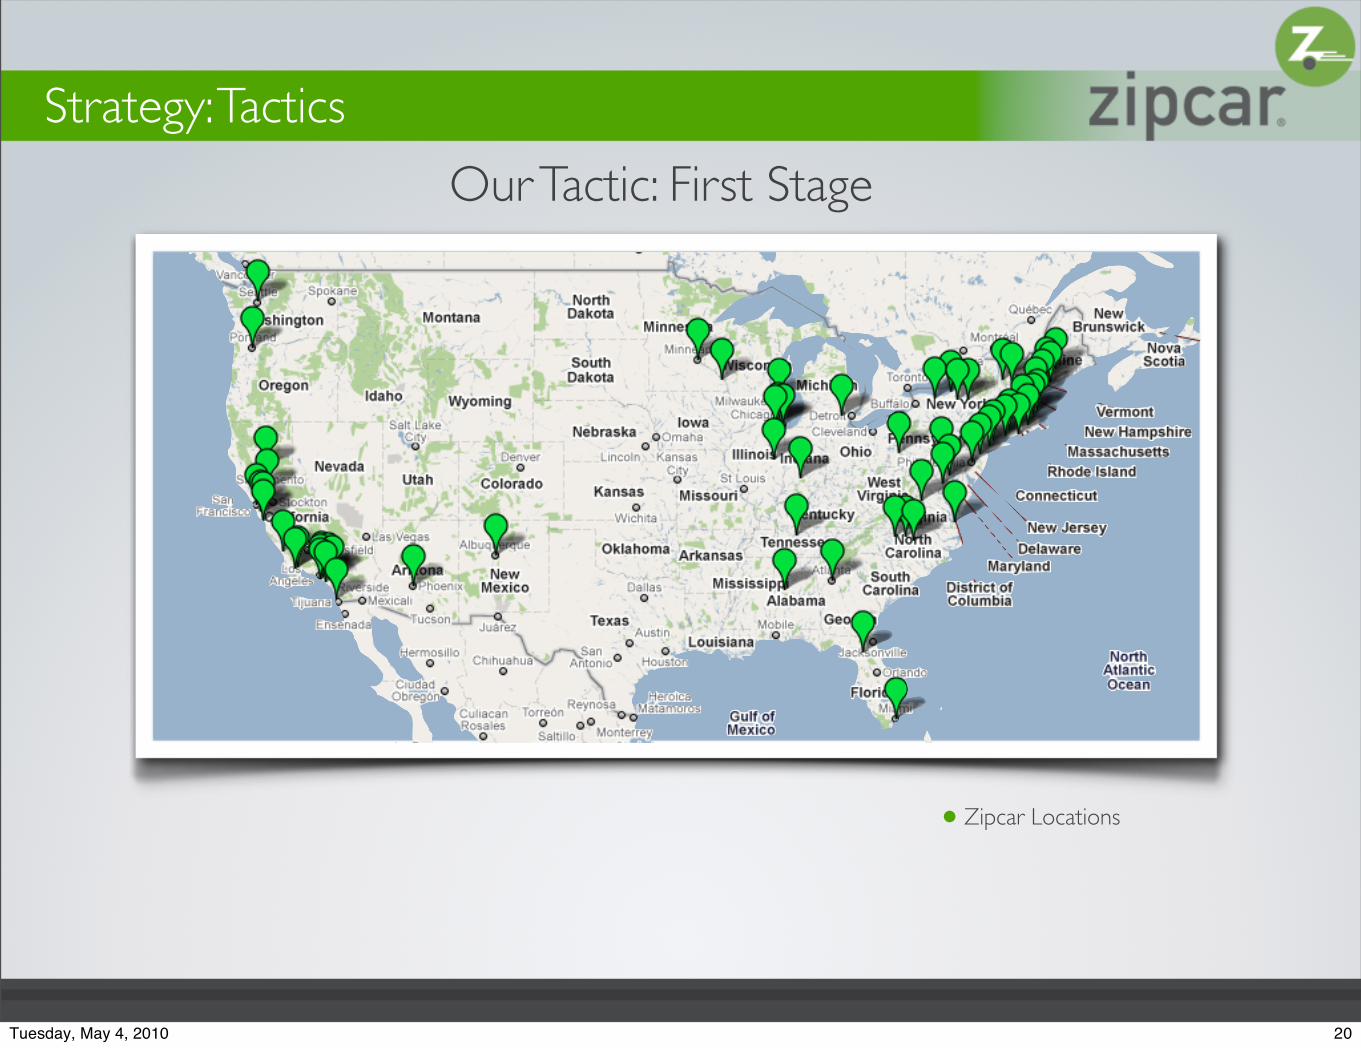
•Zipcar Locations
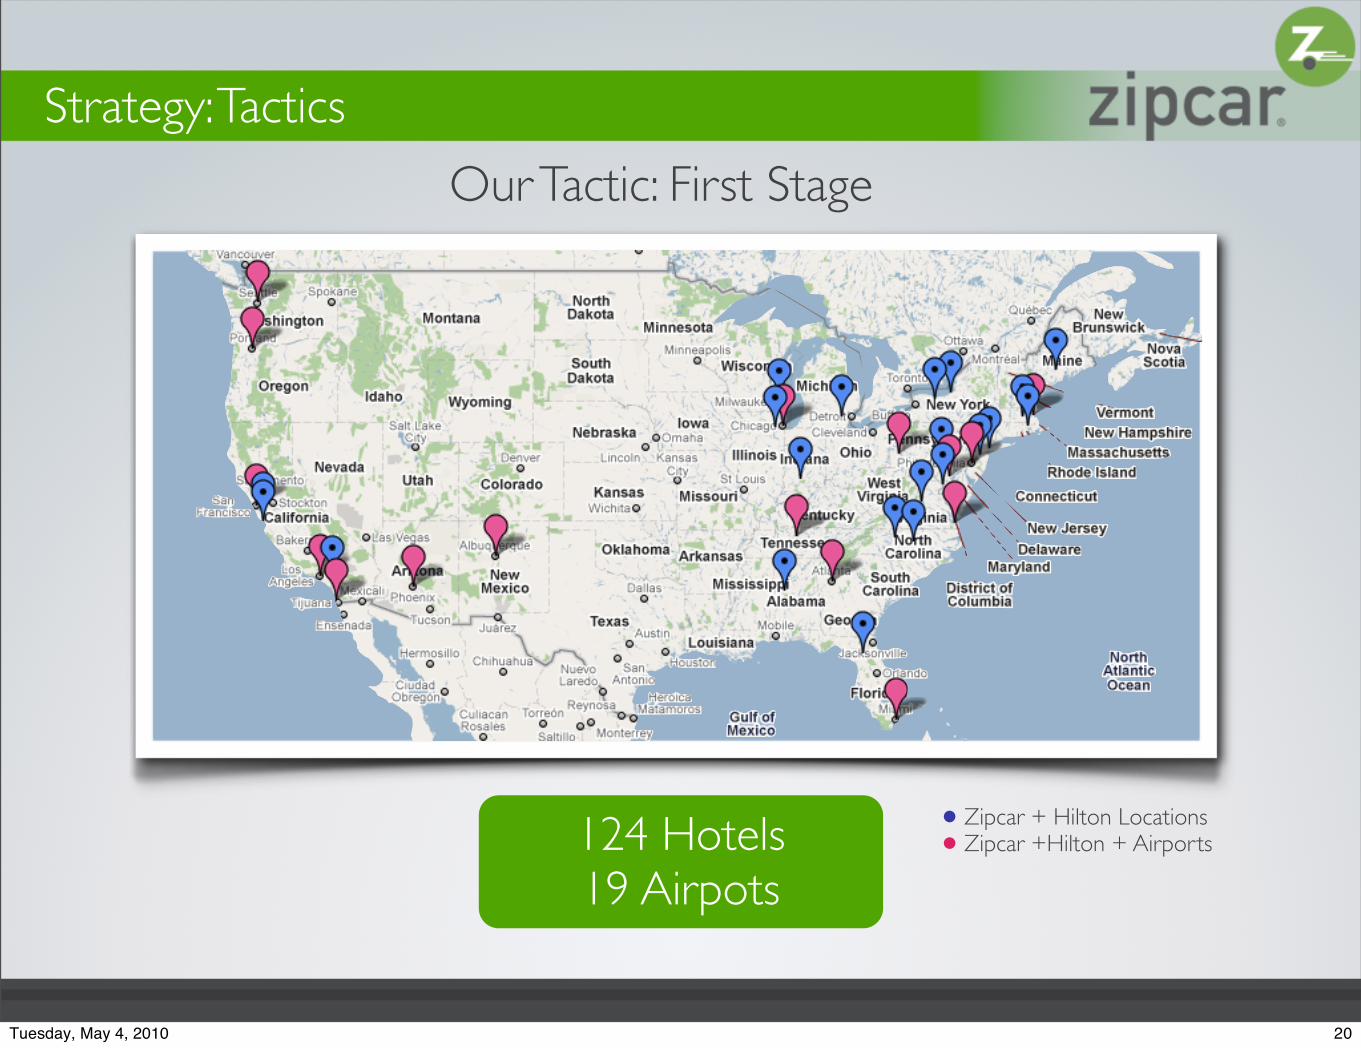
Strategy: Tactics
Our Tactic: First Stage
20Tuesday, May 4, 2010
Strategy: Tactics
Our Tactic: First Stage
•Zipcar + Hilton Locations
•Zipcar +Hilton + Airports124 Hotels19 Airpots
20Tuesday, May 4, 2010
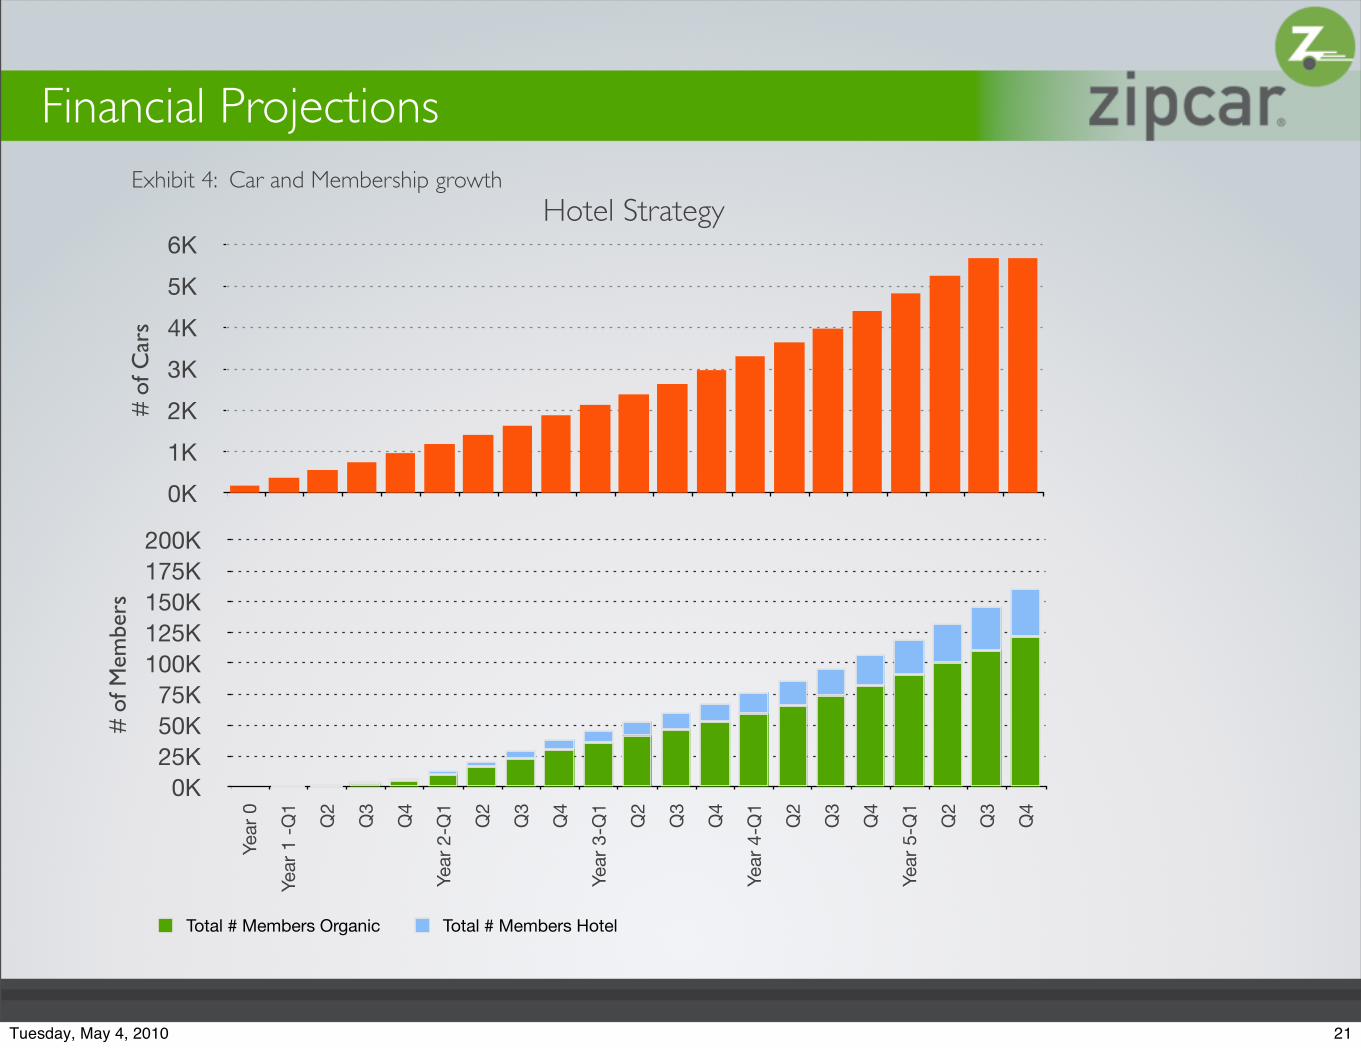
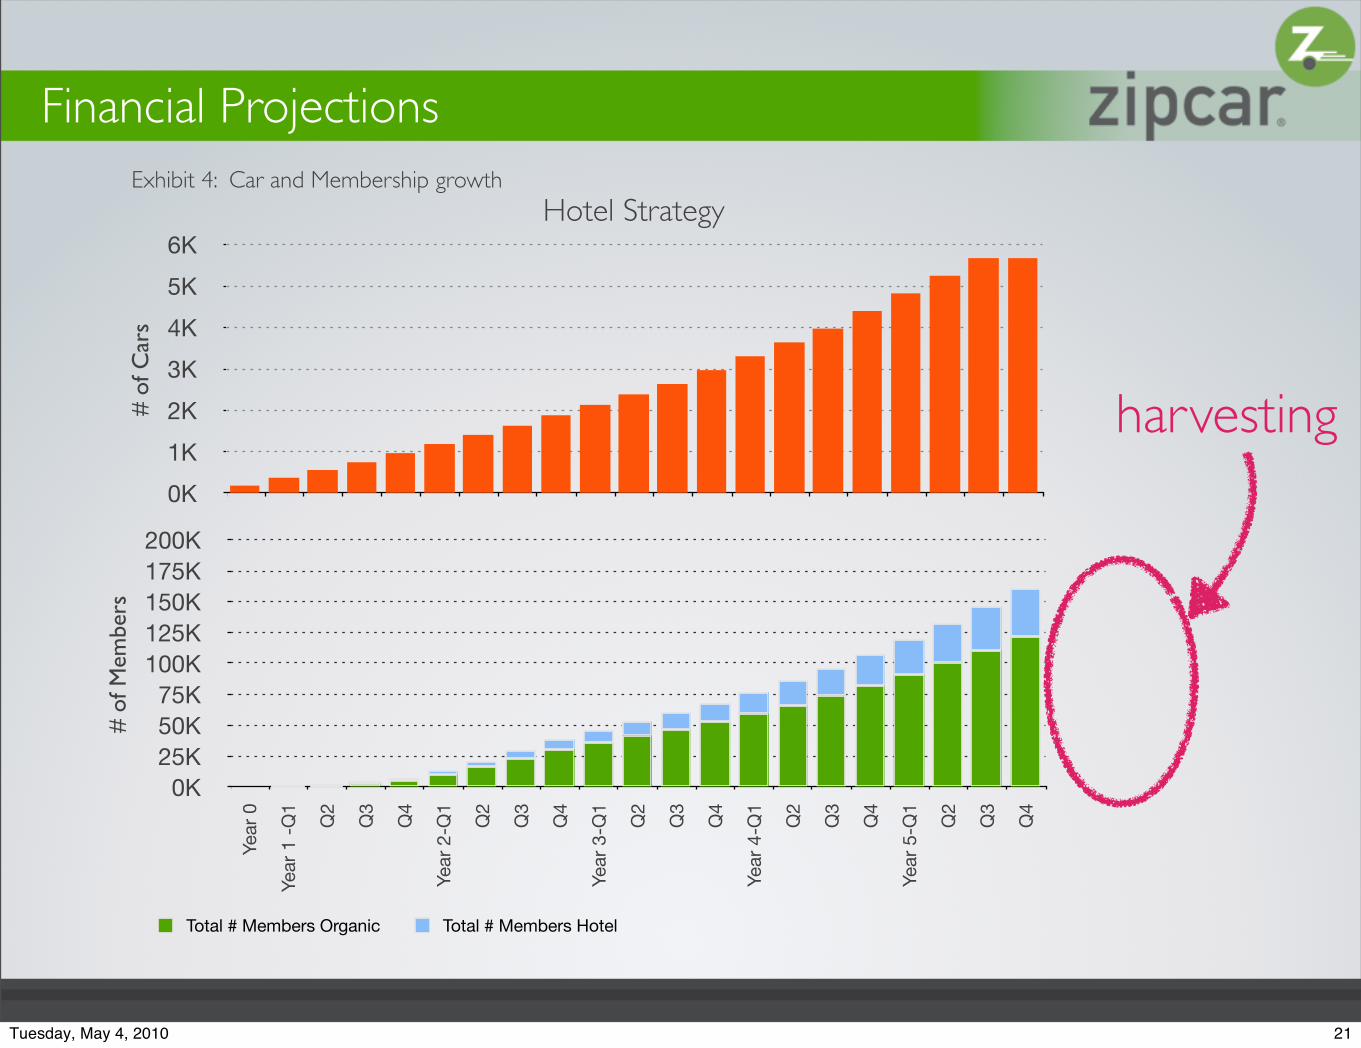
Financial Projections
0K
1K
2K
3K
4K
5K
6KHotel Strategy
# o
f Car
s
0K25K50K75K
100K125K150K175K200K
Year
0
Year
1 -
Q1
Q2
Q3
Q4
Year
2-Q
1
Q2
Q3
Q4
Year
3-Q
1
Q2
Q3
Q4
Year
4-Q
1
Q2
Q3
Q4
Year
5-Q
1
Q2
Q3
Q4
# o
f Mem
bers
Total # Members Organic Total # Members Hotel
Exhibit 4: Car and Membership growth
21Tuesday, May 4, 2010
Financial Projections
0K
1K
2K
3K
4K
5K
6KHotel Strategy
# o
f Car
s
0K25K50K75K
100K125K150K175K200K
Year
0
Year
1 -
Q1
Q2
Q3
Q4
Year
2-Q
1
Q2
Q3
Q4
Year
3-Q
1
Q2
Q3
Q4
Year
4-Q
1
Q2
Q3
Q4
Year
5-Q
1
Q2
Q3
Q4
# o
f Mem
bers
Total # Members Organic Total # Members Hotel
harvesting
Exhibit 4: Car and Membership growth
21Tuesday, May 4, 2010
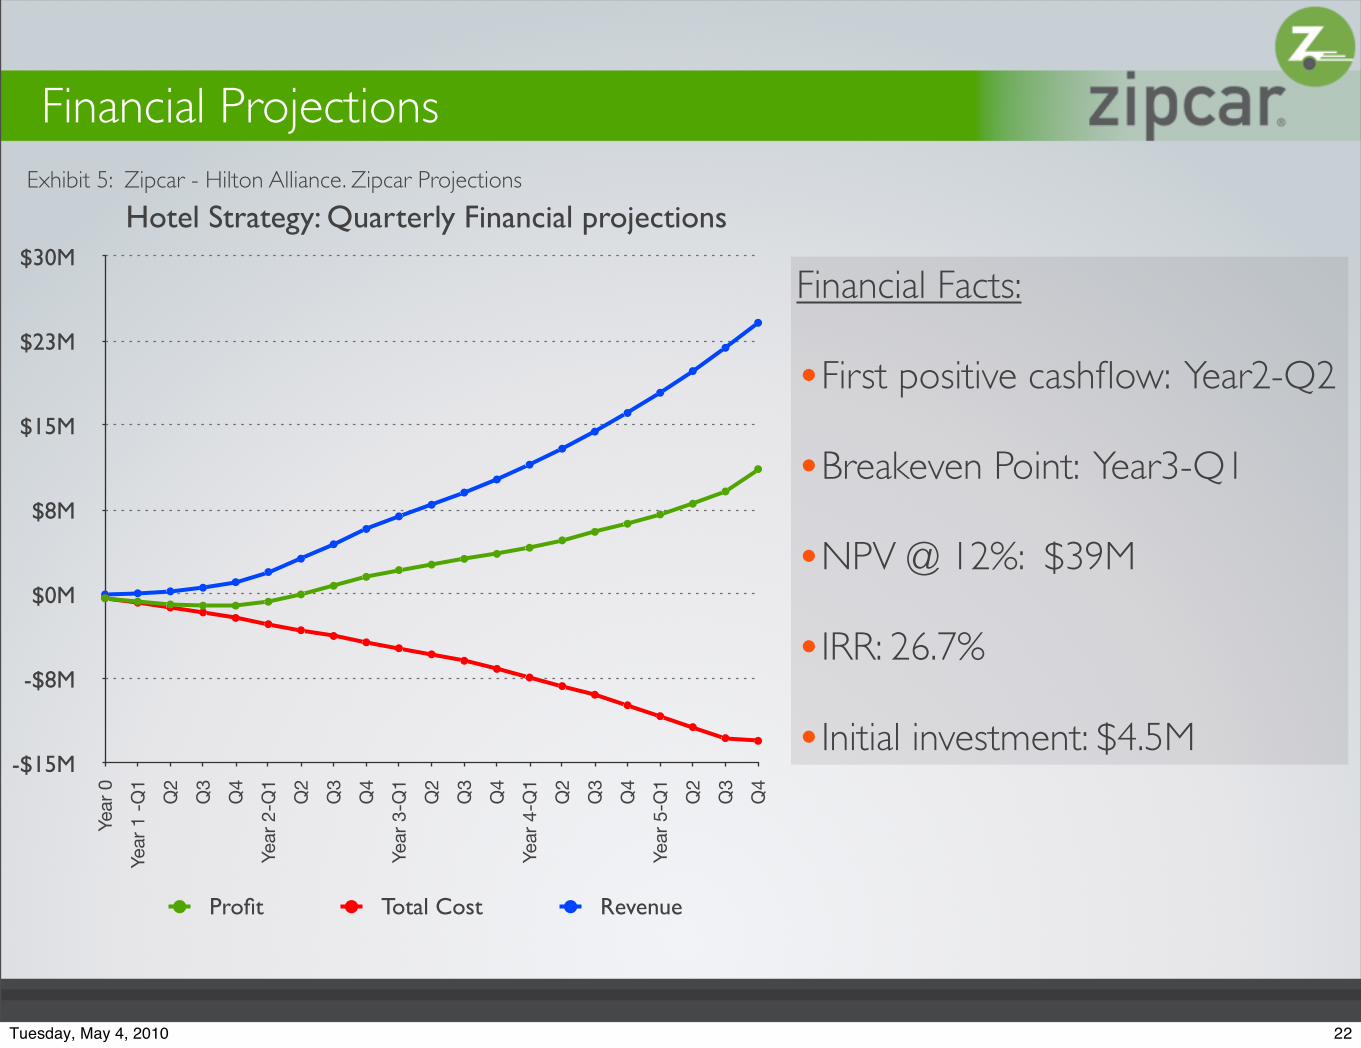
Financial Projections
Financial Facts:
•First positive cashflow: Year2-Q2
•Breakeven Point: Year3-Q1
•NPV @ 12%: $39M
•IRR: 26.7%
•Initial investment: $4.5M-$15M
-$8M
$0M
$8M
$15M
$23M
$30M
Year
0
Year
1 -
Q1
Q2
Q3
Q4
Year
2-Q
1
Q2
Q3
Q4
Year
3-Q
1
Q2
Q3
Q4
Year
4-Q
1
Q2
Q3
Q4
Year
5-Q
1
Q2
Q3
Q4
Hotel Strategy: Quarterly Financial projections
Profit Total Cost Revenue
Exhibit 5: Zipcar - Hilton Alliance. Zipcar Projections
22Tuesday, May 4, 2010
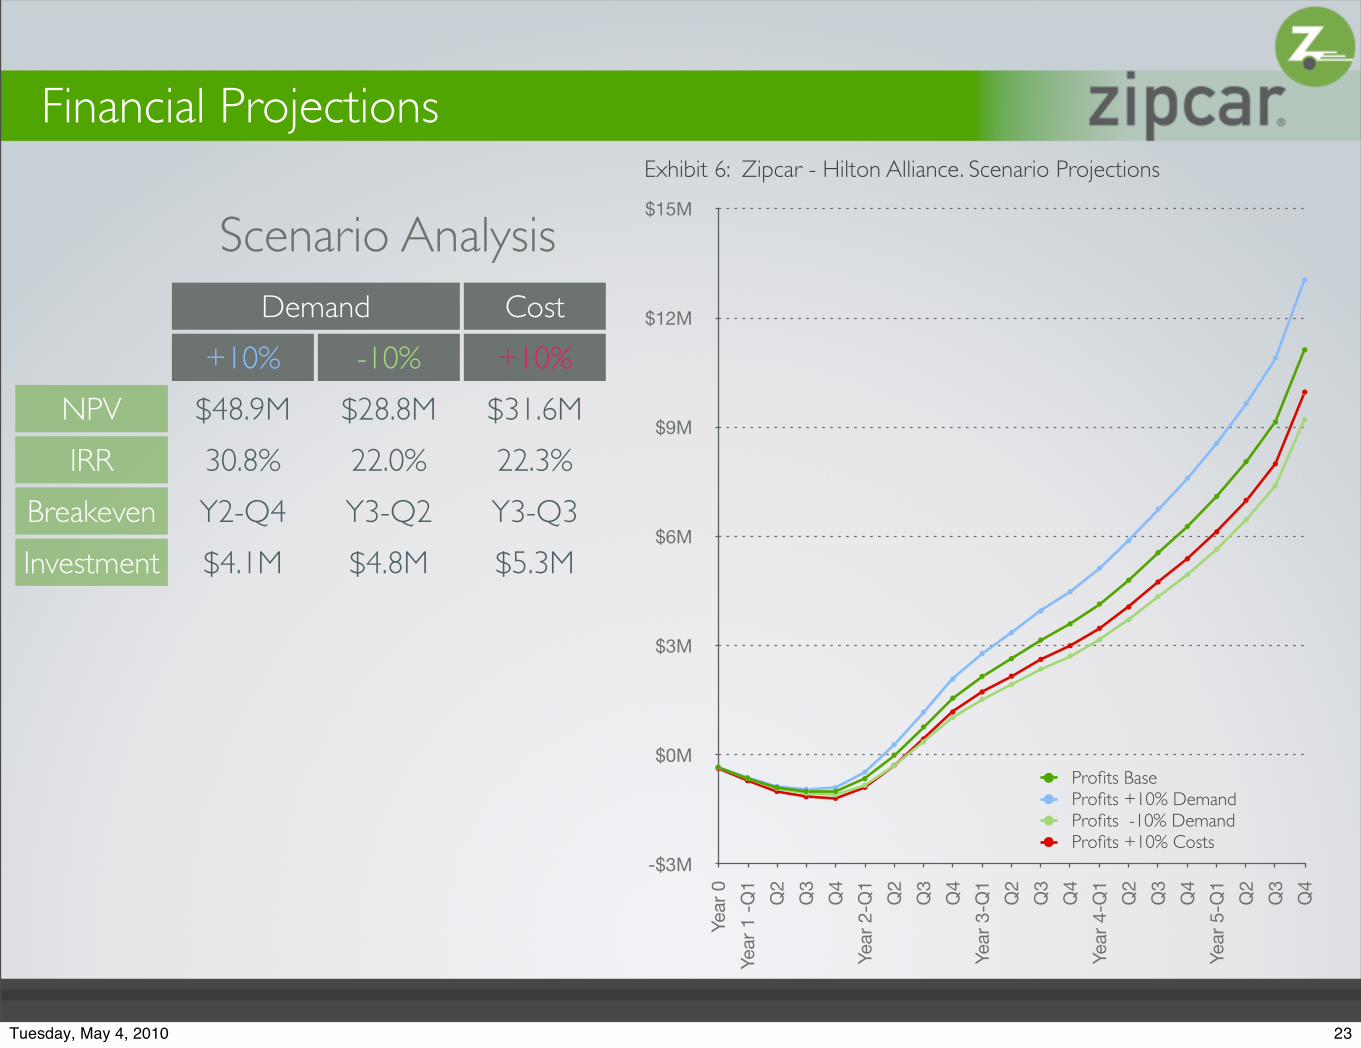
Scenario Analysis
Financial Projections
DemandDemand Cost
+10% -10% +10%
NPV
IRR
Breakeven
Investment
$48.9M $28.8M $31.6M
30.8% 22.0% 22.3%
Y2-Q4 Y3-Q2 Y3-Q3
$4.1M $4.8M $5.3M
-$3M
$0M
$3M
$6M
$9M
$12M
$15M
Year
0
Year
1 -
Q1
Q2
Q3
Q4
Year
2-Q
1
Q2
Q3
Q4
Year
3-Q
1
Q2
Q3
Q4
Year
4-Q
1
Q2
Q3
Q4
Year
5-Q
1
Q2
Q3
Q4
Profits Base Profits +10% DemandProfits -10% DemandProfits +10% Costs
Exhibit 6: Zipcar - Hilton Alliance. Scenario Projections
23Tuesday, May 4, 2010

The new Zipcar world:3,375 New Hotels30+ New Airports
24Tuesday, May 4, 2010
Wheels when you want them
THANK YOU25Tuesday, May 4, 2010

Wheels when you want them
&aq
THANK YOU25Tuesday, May 4, 2010
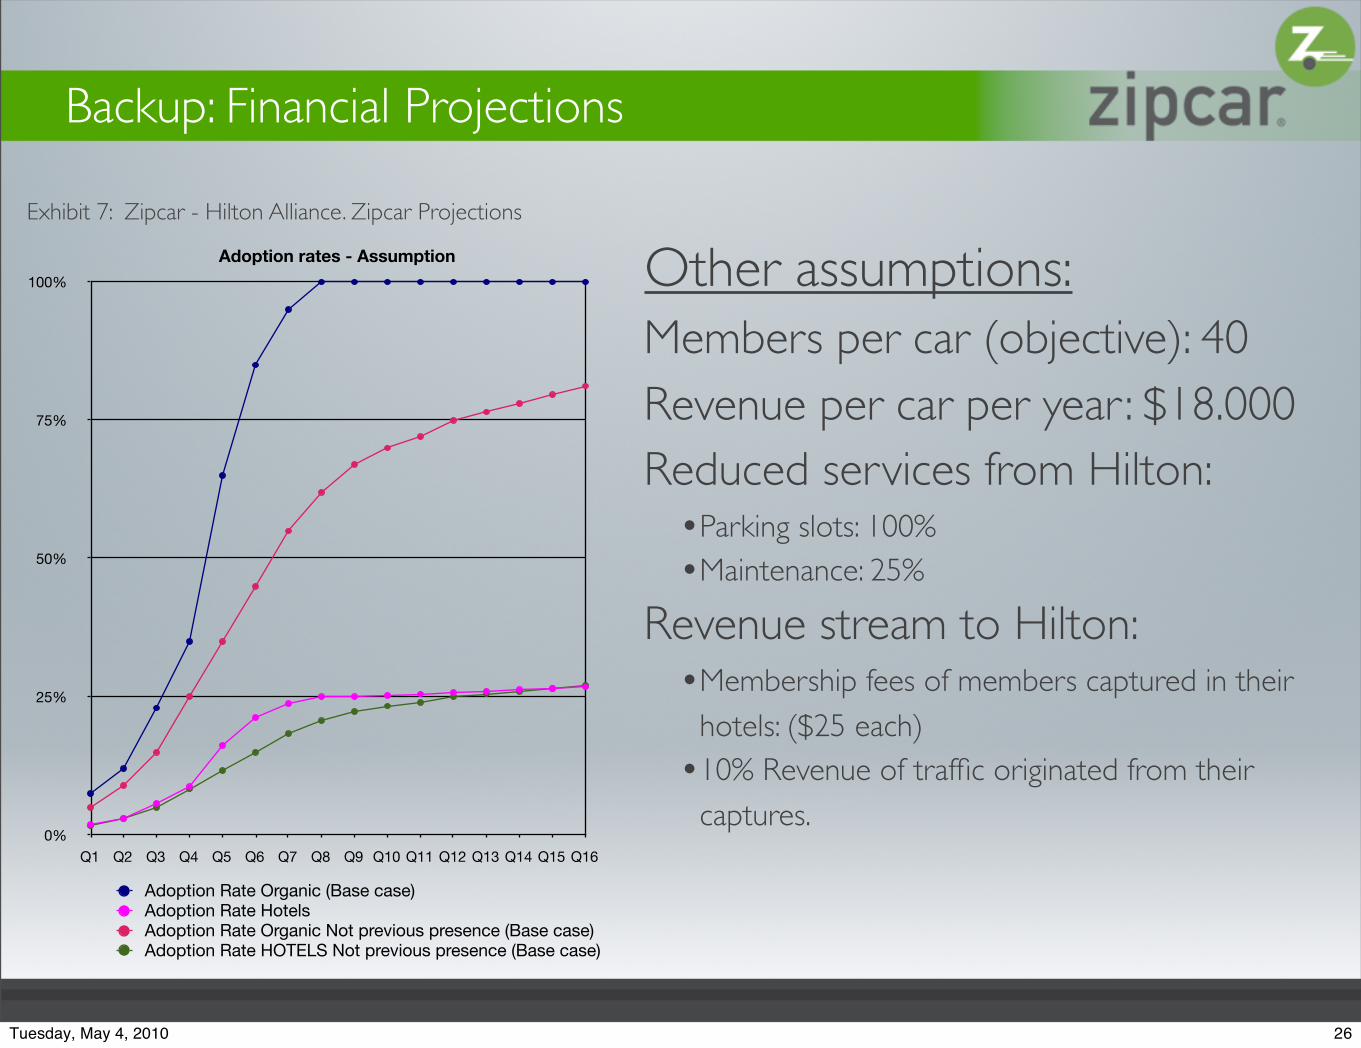
0%
25%
50%
75%
100%
Q1 Q2 Q3 Q4 Q5 Q6 Q7 Q8 Q9 Q10 Q11 Q12 Q13 Q14 Q15 Q16
Adoption rates - Assumption
Adoption Rate Organic (Base case)Adoption Rate HotelsAdoption Rate Organic Not previous presence (Base case)Adoption Rate HOTELS Not previous presence (Base case)
Backup: Financial Projections
Other assumptions:Members per car (objective): 40Revenue per car per year : $18.000Reduced services from Hilton:
•Parking slots: 100%
•Maintenance: 25%
Revenue stream to Hilton:•Membership fees of members captured in their
hotels: ($25 each)
•10% Revenue of traffic originated from their captures.
Exhibit 7: Zipcar - Hilton Alliance. Zipcar Projections
26Tuesday, May 4, 2010
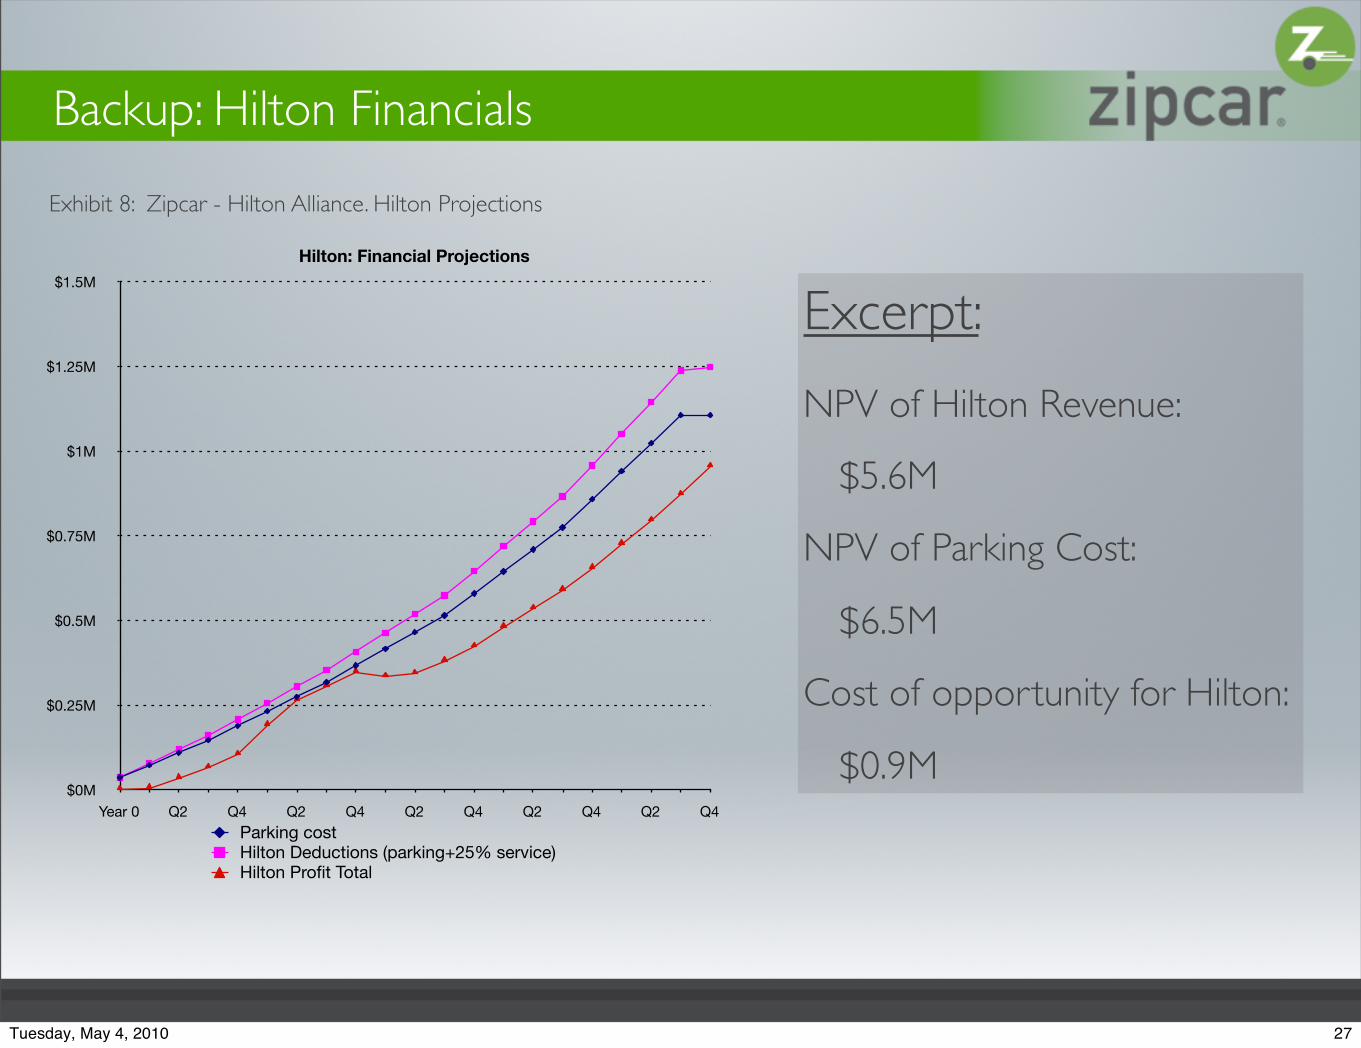
$0M
$0.25M
$0.5M
$0.75M
$1M
$1.25M
$1.5M
Year 0 Q2 Q4 Q2 Q4 Q2 Q4 Q2 Q4 Q2 Q4
Hilton: Financial Projections
Parking costHilton Deductions (parking+25% service)Hilton Profit Total
Excerpt:
NPV of Hilton Revenue:
$5.6M
NPV of Parking Cost:
$6.5M
Cost of opportunity for Hilton:
$0.9M
Backup: Hilton Financials
Exhibit 8: Zipcar - Hilton Alliance. Hilton Projections
27Tuesday, May 4, 2010
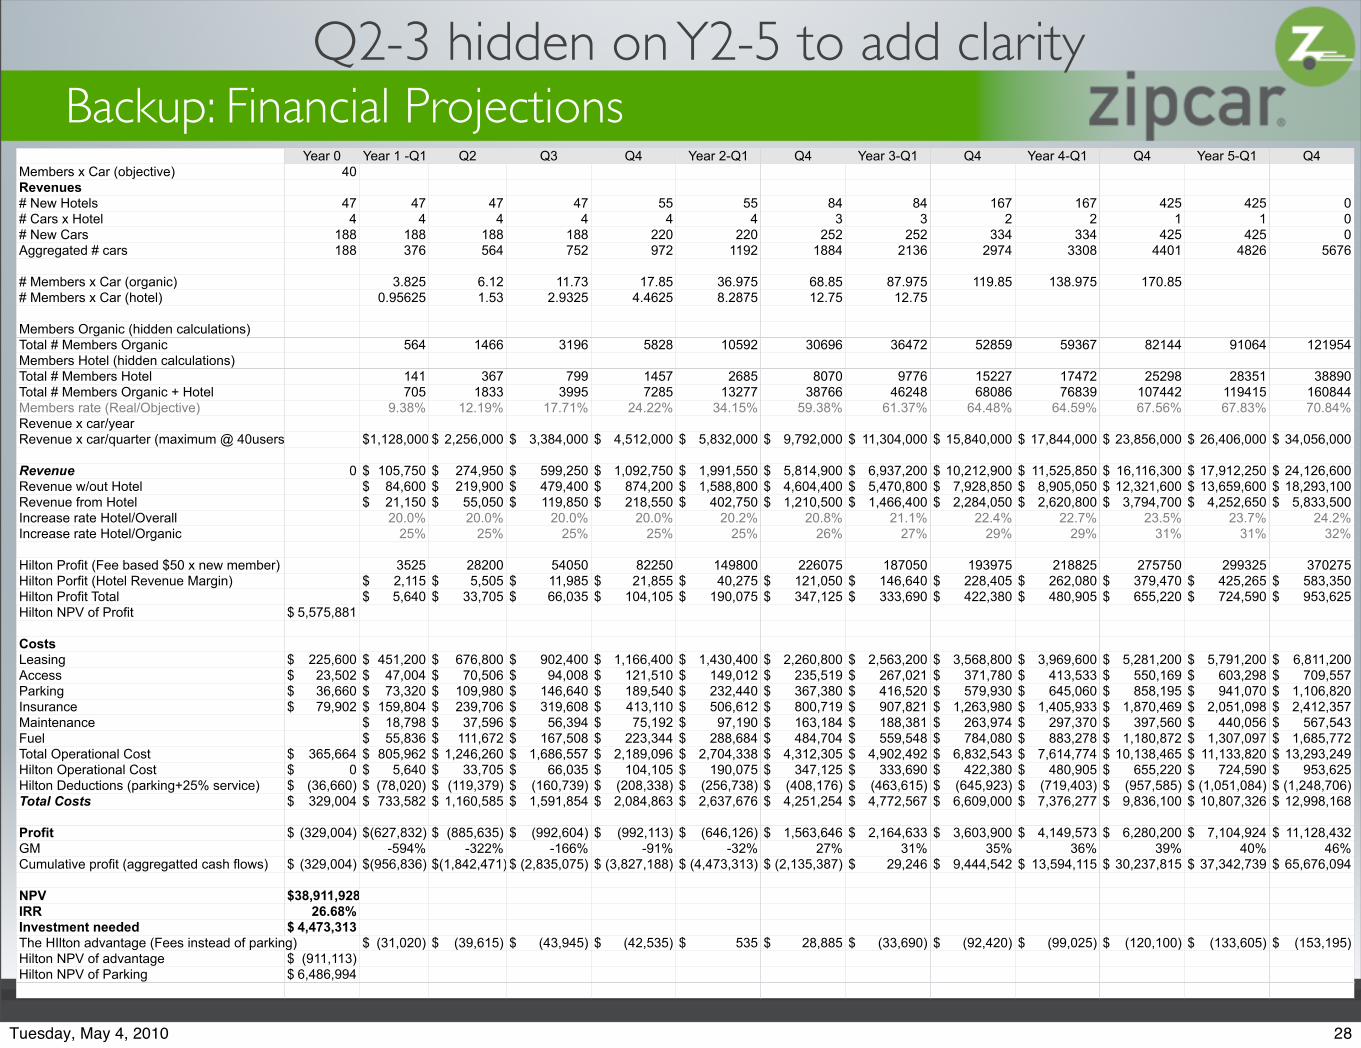
Year 0 Year 1 -Q1 Q2 Q3 Q4 Year 2-Q1 Q4 Year 3-Q1 Q4 Year 4-Q1 Q4 Year 5-Q1 Q4Members x Car (objective) 40Revenues# New Hotels 47 47 47 47 55 55 84 84 167 167 425 425 0# Cars x Hotel 4 4 4 4 4 4 3 3 2 2 1 1 0# New Cars 188 188 188 188 220 220 252 252 334 334 425 425 0Aggregated # cars 188 376 564 752 972 1192 1884 2136 2974 3308 4401 4826 5676
# Members x Car (organic) 3.825 6.12 11.73 17.85 36.975 68.85 87.975 119.85 138.975 170.85# Members x Car (hotel) 0.95625 1.53 2.9325 4.4625 8.2875 12.75 12.75
Members Organic (hidden calculations)Total # Members Organic 564 1466 3196 5828 10592 30696 36472 52859 59367 82144 91064 121954Members Hotel (hidden calculations)Total # Members Hotel 141 367 799 1457 2685 8070 9776 15227 17472 25298 28351 38890Total # Members Organic + Hotel 705 1833 3995 7285 13277 38766 46248 68086 76839 107442 119415 160844Members rate (Real/Objective) 9.38% 12.19% 17.71% 24.22% 34.15% 59.38% 61.37% 64.48% 64.59% 67.56% 67.83% 70.84%Revenue x car/yearRevenue x car/quarter (maximum @ 40users) $ 1,128,000 $ 2,256,000 $ 3,384,000 $ 4,512,000 $ 5,832,000 $ 9,792,000 $ 11,304,000 $ 15,840,000 $ 17,844,000 $ 23,856,000 $ 26,406,000 $ 34,056,000
Revenue 0 $ 105,750 $ 274,950 $ 599,250 $ 1,092,750 $ 1,991,550 $ 5,814,900 $ 6,937,200 $ 10,212,900 $ 11,525,850 $ 16,116,300 $ 17,912,250 $ 24,126,600Revenue w/out Hotel $ 84,600 $ 219,900 $ 479,400 $ 874,200 $ 1,588,800 $ 4,604,400 $ 5,470,800 $ 7,928,850 $ 8,905,050 $ 12,321,600 $ 13,659,600 $ 18,293,100Revenue from Hotel $ 21,150 $ 55,050 $ 119,850 $ 218,550 $ 402,750 $ 1,210,500 $ 1,466,400 $ 2,284,050 $ 2,620,800 $ 3,794,700 $ 4,252,650 $ 5,833,500Increase rate Hotel/Overall 20.0% 20.0% 20.0% 20.0% 20.2% 20.8% 21.1% 22.4% 22.7% 23.5% 23.7% 24.2%Increase rate Hotel/Organic 25% 25% 25% 25% 25% 26% 27% 29% 29% 31% 31% 32%
Hilton Profit (Fee based $50 x new member) 3525 28200 54050 82250 149800 226075 187050 193975 218825 275750 299325 370275Hilton Porfit (Hotel Revenue Margin) $ 2,115 $ 5,505 $ 11,985 $ 21,855 $ 40,275 $ 121,050 $ 146,640 $ 228,405 $ 262,080 $ 379,470 $ 425,265 $ 583,350Hilton Profit Total $ 5,640 $ 33,705 $ 66,035 $ 104,105 $ 190,075 $ 347,125 $ 333,690 $ 422,380 $ 480,905 $ 655,220 $ 724,590 $ 953,625Hilton NPV of Profit $ 5,575,881
CostsLeasing $ 225,600 $ 451,200 $ 676,800 $ 902,400 $ 1,166,400 $ 1,430,400 $ 2,260,800 $ 2,563,200 $ 3,568,800 $ 3,969,600 $ 5,281,200 $ 5,791,200 $ 6,811,200Access $ 23,502 $ 47,004 $ 70,506 $ 94,008 $ 121,510 $ 149,012 $ 235,519 $ 267,021 $ 371,780 $ 413,533 $ 550,169 $ 603,298 $ 709,557Parking $ 36,660 $ 73,320 $ 109,980 $ 146,640 $ 189,540 $ 232,440 $ 367,380 $ 416,520 $ 579,930 $ 645,060 $ 858,195 $ 941,070 $ 1,106,820Insurance $ 79,902 $ 159,804 $ 239,706 $ 319,608 $ 413,110 $ 506,612 $ 800,719 $ 907,821 $ 1,263,980 $ 1,405,933 $ 1,870,469 $ 2,051,098 $ 2,412,357Maintenance $ 18,798 $ 37,596 $ 56,394 $ 75,192 $ 97,190 $ 163,184 $ 188,381 $ 263,974 $ 297,370 $ 397,560 $ 440,056 $ 567,543Fuel $ 55,836 $ 111,672 $ 167,508 $ 223,344 $ 288,684 $ 484,704 $ 559,548 $ 784,080 $ 883,278 $ 1,180,872 $ 1,307,097 $ 1,685,772Total Operational Cost $ 365,664 $ 805,962 $ 1,246,260 $ 1,686,557 $ 2,189,096 $ 2,704,338 $ 4,312,305 $ 4,902,492 $ 6,832,543 $ 7,614,774 $ 10,138,465 $ 11,133,820 $ 13,293,249Hilton Operational Cost $ 0 $ 5,640 $ 33,705 $ 66,035 $ 104,105 $ 190,075 $ 347,125 $ 333,690 $ 422,380 $ 480,905 $ 655,220 $ 724,590 $ 953,625Hilton Deductions (parking+25% service) $ (36,660) $ (78,020) $ (119,379) $ (160,739) $ (208,338) $ (256,738) $ (408,176) $ (463,615) $ (645,923) $ (719,403) $ (957,585) $ (1,051,084) $ (1,248,706)Total Costs $ 329,004 $ 733,582 $ 1,160,585 $ 1,591,854 $ 2,084,863 $ 2,637,676 $ 4,251,254 $ 4,772,567 $ 6,609,000 $ 7,376,277 $ 9,836,100 $ 10,807,326 $ 12,998,168
Profit $ (329,004) $ (627,832) $ (885,635) $ (992,604) $ (992,113) $ (646,126) $ 1,563,646 $ 2,164,633 $ 3,603,900 $ 4,149,573 $ 6,280,200 $ 7,104,924 $ 11,128,432GM -594% -322% -166% -91% -32% 27% 31% 35% 36% 39% 40% 46%Cumulative profit (aggregatted cash flows) $ (329,004) $ (956,836) $ (1,842,471) $ (2,835,075) $ (3,827,188) $ (4,473,313) $ (2,135,387) $ 29,246 $ 9,444,542 $ 13,594,115 $ 30,237,815 $ 37,342,739 $ 65,676,094
NPV $ 38,911,928IRR 26.68%Investment needed $ 4,473,313The HIlton advantage (Fees instead of parking)The HIlton advantage (Fees instead of parking) $ (31,020) $ (39,615) $ (43,945) $ (42,535) $ 535 $ 28,885 $ (33,690) $ (92,420) $ (99,025) $ (120,100) $ (133,605) $ (153,195)Hilton NPV of advantage $ (911,113)Hilton NPV of Parking $ 6,486,994
Backup: Financial ProjectionsQ2-3 hidden on Y2-5 to add clarity
28Tuesday, May 4, 2010
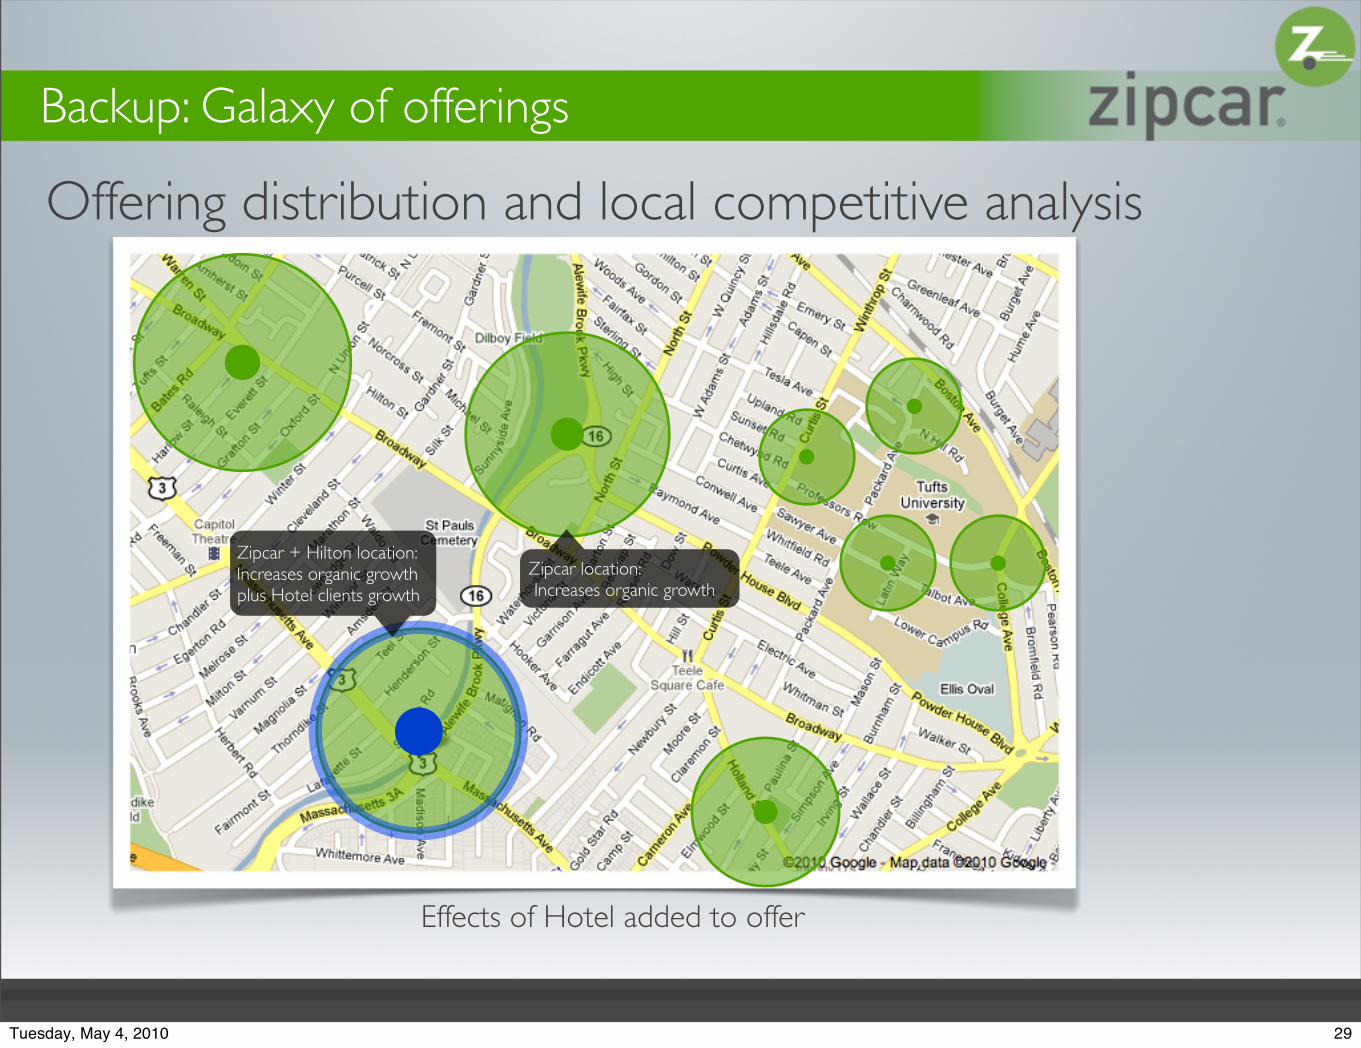
Offering distribution and local competitive analysis
Effects of Hotel added to offer
Backup: Galaxy of offerings
Zipcar location: Increases organic growth
Zipcar + Hilton location:Increases organic growthplus Hotel clients growth
29Tuesday, May 4, 2010
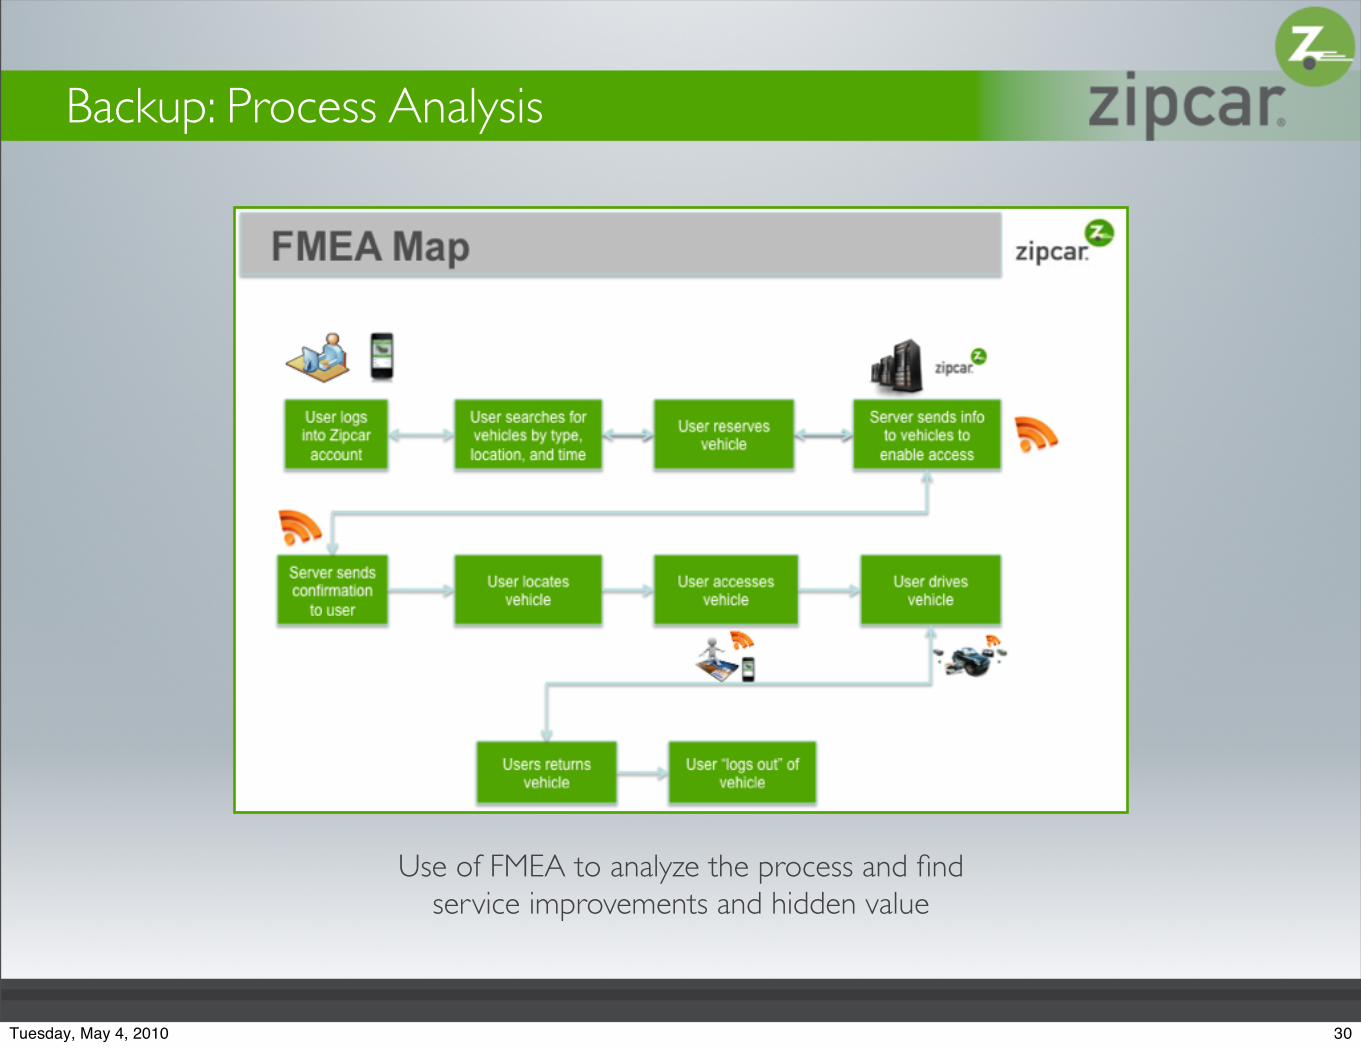
Backup: Process Analysis
Use of FMEA to analyze the process and find service improvements and hidden value
30Tuesday, May 4, 2010