businessjvisj14, ieee vis workshop 1 visual exploration of
TRANSCRIPT

BUSINESS|VIS|14, IEEE VIS WORKSHOP 1
Visual Exploration of Journal Entries to DetectAccounting Irregularities and Fraud
Andrada Tatu, Marco Schreyer, Jan Hagelauer, and Jixuan Wang
Abstract—Nowadays, companies and organizations register millions of accounting transactions each year. Although most ofthese journal entries are legitimate, auditors face legal and financial obligations to discover transactions that are fraudulent. Inthis work, we present a visual analytics workflow to quickly identify unusual transactions in accounting data. In a first step featuresare derived from journal entries and are clustered to identify transactional patterns. In a second step the data is visualized tosupport the identification and investigation of unusual transactions. Following this workflow auditors are given the chance toidentify new suspicious transactions that might correspond to fraud. We evaluated the proposed approach in a real world scenarioby analyzing accounting data and discussed the results with auditors.
Index Terms—Visual Analytics, Forensic Accounting, Financial Statement Fraud, Journal Entry Testing
F
1 INTRODUCTION
A CCORDING to a recent survey among over fivethousand companies, 37% of the companies re-
ported that their organization had experienced eco-nomic crime in the period 2011 - 2014 [1]. Accountingfraud received a significant response (22%), making itone of the most frequently reported types of fraudexperienced. Similarly, the Association of CertifiedFraud Examiners (ACFE) shows in its 2014 surveyreport that the annual median loss per company fromfinancial statement fraud is more than $1 million [2].
The majority of audit techniques for detecting fraudoperate at the financial statement level, a highly ag-gregated summary of a company’s financial activity,e. g. by applying ratio analytics. In general, these tech-niques offer limited guidance to an auditor beyond abroad indicator of risk at a certain company. There-fore, there is an urgent need for analytics that operateat a much more detailed level, and more specificallyon the transactions recorded in a company’s generalledger. Such transactions are generally referred to asjournal entries and exhibit information like account,amount, document type, debit or credit sign, etc.
At the same time, in today’s digital age, companiesusually register millions of journal entries each yearin Enterprise Resource Planning (ERP) systems. Suchsystems provide a high degree of automation of thevarious business processes within an organizationand are designed to process and record accountingrelevant information.
• A. Tatu, M. Schreyer and J. Hagelauer are with the PricewaterhouseC-oopers AG WPG Forensic Services Group, Friedrichstrasse 14, 70104Stuttgart, Germany (Contact: [email protected]).
• J. Wang is with Technical University (TU) Munich, Arcisstrasse 21,80333 Munich, Germany.
The exhaustive volume of journal entries makes itincreasingly difficult for auditors to detect fraud andsuspicious behavior. This holds in particular given thestrict time and budget constraints faced at year-endaudits. Applying advanced visual analytics [3] is onepromising direction to overcome these challenges andto improve audit procedures.
In this work, we present a visual analytics approachto support the auditor’s work in financial statementaudit and to detect anomalous as well as potentialfraudulent journal entries. To achieve this, we com-bine an (1) algorithmic and (2) visualization stepto visualize and analyze a large number of journalentries.
In the algorithmic step, similar transactions aregrouped and anomalous transactions in the data areidentified. In the visualization step, the auditor isgiven a holistic perspective on all the transactionsto be audited. This perspective empowers auditorsto visually investigate different transaction patterns,trends and correlations that are hidden in the data.Furthermore, it allows to spot possible anomaloustransactions that can be examined in more detail withprocess owners, or internal auditors.
The proposed approach is evaluated investigatinganonymous transactions of a case company. The setof sample transactions covers all outgoing vendorpayments recorded in the company’s ERP systemfor two fiscal years. We believe that the case studyresults demonstrate the promising potential of visualanalytics in the context of financial statement audits.
2 RELATED WORK
2.1 ERP Data ForensicsThe topic of fraud detection in financial account-ing has received growing attention in research and

BUSINESS|VIS|14, IEEE VIS WORKSHOP 2
academia [4]. However, the forensic analysis of trans-actional records from ERP systems is relatively new.Recent publications show promising and interestingmethods to detect fraudulent activities based on trans-actional data.
In [5] Kahn et al. generated transaction profiles ofERP system users based on an analysis of the transac-tion audit log for each user. Anomalous transactionsprofiles were identified and investigated in detail af-terwards. Islam et al. [6] followed a different approachby defining fraud scenarios and their correspondingaudit log signatures.
Bay et al. [7] defined a set of discriminative featuresto model fraudulent general ledger account behav-ior based on ERP transactions. Afterwards, classifierswere trained to identify suspicious accounts. McGlo-hon et al. [8] enhanced this approach by modelingthe interrelation of general ledger accounts utilizingnetwork propagation techniques.
In [9], business process mining as well as uni- andmultivariate latent clustering algorithms are appliedto event logs of ERP purchase orders obtained froman SAP system of a financial institution. The detectedprocess anomalies were audited afterwards in a jointeffort with internal audit experts.
2.2 Categorical Data Visualization and Clustering
Categorical data needs particular attention when vi-sualized or analyzed automatically using clusteringtechniques. Therefore, a series of specific techniqueshave been developed for this type of data.
A commonly used approach is to compute frequen-cies of each category and represent the categories bya visual entity scaled according to their frequency.Mosaic Displays [10] use such frequency-scaled rect-angles to recursively divide the space and displaythe attributes. Hofmann [11] extends this technique tointeractive mosaic plots and includes domain knowl-edge for a better visual exploration. Bargrams [12]display each attribute in a row and their categorieswith rectangles scaled by their frequency. All of thesemethods however lack the ability to compare multi-dimensional relations between attributes and do notscale well with a higher number of dimensions.
Parallel Sets [13] are a well known Parallel Co-ordinates [14] technique for categorical data. Eachattribute is plotted as a separate axis which is sub-divided into sections for each of the attribute values.Parallelograms connect the axes to show the relationsbetween different attributes. Color can be used todifferentiate the attribute values of one axis facili-tating the tracing of their distribution among otherattributes. Interaction is provided to better understandthe data, as we will show later in Section 4.
Due to the size of our data and the relationshipsamong multiple attributes that are relevant for ourtask, we decided to use Parallel Sets for our approach.
Clustering categorical data also brings up the needfor specialized algorithms compared to numericaldata. One distinction is the definition of similarityamong objects. A complete survey of currently avail-able techniques can be found in [15]. One promi-nent approach is K-modes [16], a modification ofthe K-means paradigm. To deal with categoricaldata, K-modes uses the simple-matching dissimilaritymeasure. Agglomerative hierarchical clustering [17]groups a dataset by creating a cluster tree. For cat-egorical data, the similarity is adapted, either bytransforming the categorical variables into bit vectors,or simple matching.
The ROCK [18] algorithm, also a agglomerativehierarchical clustering algorithm, is specifically de-veloped to cluster a dataset with solely categoricalattributes. It introduces the concept of a link, definedas the number of common neighbors between twoobjects and uses this to form clusters.
3 PROPOSED ANALYTICAL WORKFLOW
We propose a visual analytics approach to support theexploration of journal entries making use of algorith-mic grouping in combination with visual-interactiverepresentations for user-based filtering and explo-ration (see Figure 1).
ERP Data InteractiveView
Anomalies (Fraud)
Transaction Grouping
InteractiveView
Fig. 1: Analytical workflow: ERP data is (1) visuallyanalyzed as a whole, (2) grouped, and (3) visualized tointeractively support auditors to analyze and exploreanomalies, possible fraudulent activities.
As a first step the ERP data is visualized by creatinga Parallel Sets [13] view. We believe this technique isone of the most promising methods currently avail-able to represent multidimensional relations amongcategorical data. By interacting with the visualizationthe auditor is given the chance to gain an initialunderstanding of the data and derive an early hypoth-esis. Afterwards, categorical clustering techniques areapplied to identify groups that correspond to typicalaccounting patterns. We observed that agglomerativehierarchical clustering techniques using single linkageare best suited for this analytical task. Finally, theinteractive visualization is enriched by the clusteringresults. This can, for example, be achieved via addingan additional axis to the Parallel Sets view. Usingthe enriched interactive view the auditor can browsethrough the different clusters and verify or falsify theinitial hypothesizes. Furthermore, new insights canbe gained by linking the information across multipleattributes.

BUSINESS|VIS|14, IEEE VIS WORKSHOP 3
Fig. 2: Visual data overview with Parallel Sets, where each attribute is a horizontal axis and the color representsthe journal entry creator (User). The width of each category instance gives the proportion of occurrences ofthe category’s value. MBPs are visible by wide connection areas, SBPs are marked with red rectangles, andABTs with a blue circle.
4 CASE STUDY: VENDOR PAYMENTS4.1 Analyzed DataThe dataset analyzed in this work consists of account-ing data corresponding to outgoing vendor paymentsof an ERP system. These transactions are especiallyrelevant for assessing fraud risks, as many fraudschemes involve illegitimate payments directly or in-directly benefiting the fraudster.
After the data preprocessing phase encompassinganonymization and binning, the final dataset consistsof approximately 25 thousand transactions coveringthe most relevant characteristics: amount, transactioncode, fiscal year, document number (range), document type,user, G/L account, vendor (range), entry date (month), andentry time (hour). Through binning, we were able togroup attribute values based on domain knowledgeand obtain a lower number of categories for eachattribute.
4.2 Visual ExplorationTraditional audit methods involve an initial analyticalstep to reduce the high number of transactions. Asmall subset is then inspected manually in more de-tail and plausibilized. Our proposed visual analyticsapproach enables the auditor to gain a holistic under-standing of the data, that leads him to a subset oftransactions useful for in depth auditing.
Figure 2 represents a Parallel Sets view of all trans-actions. Each attribute is represented as a horizontalaxis and the creator of the journal entry (the user)is distinguished by the different coloring. The widthof each category instance gives the proportion ofoccurrences of the category’s value.
Starting from this view, the auditor can performan in-depth analysis of the entire dataset, to identifysuspicious transactions that may require further in-vestigation. Visual exploration helps in understanding(1) main business processes, (2) secondary businessprocesses, and (3) anomalous transactions in the data.Automatic transaction grouping facilitates this task.
As Main Business Processes (MBPs), we de-scribe processes that correspond to an usual businesstransaction. In the Parallel Sets visualization (Fig-ure 2) this is visible by wide paths across multi-ple axes. In this case, two MBPs are visible: auto-matic vendor payments represented by transactioncode (Trans Code) F110, and manual payments rep-resented by Trans Code FB05. These MBPs are likelyto be known by the auditor and will therefore notrequire in depth analyses.
We define Secondary Business Processes (SBPs)as somewhat unusual transactions which still occurtoo frequently than to be considered as anomalies.In Figure 2, we can see narrow paths across multipleaxis (marked by red rectangles), e.g. cheque payments,cash payments, or vendor offsetting. These observa-tions might be of interest for the auditor, since theyreflect significant deviations from the main businessprocess.
Anomalous Business Transactions (ABTs) are pat-terns that don’t correspond to any MBPs or SBPsbecause of the limited number of occurrences of thespecific attribute combinations. Such entries (markedin Fig. 2 with a blue circle) could lead the auditor tosuspect anomalies. To investigate this further, auditorscan apply (1) filtering, excluding the primary pro-
BUSINESS|VIS|14, IEEE VIS WORKSHOP 4
cesses that are not considered relevant for the auditingprocess, or (2) clustering to group MBPs and SBPsautomatically.
4.3 Visual Analytics of Anomalous Transactions
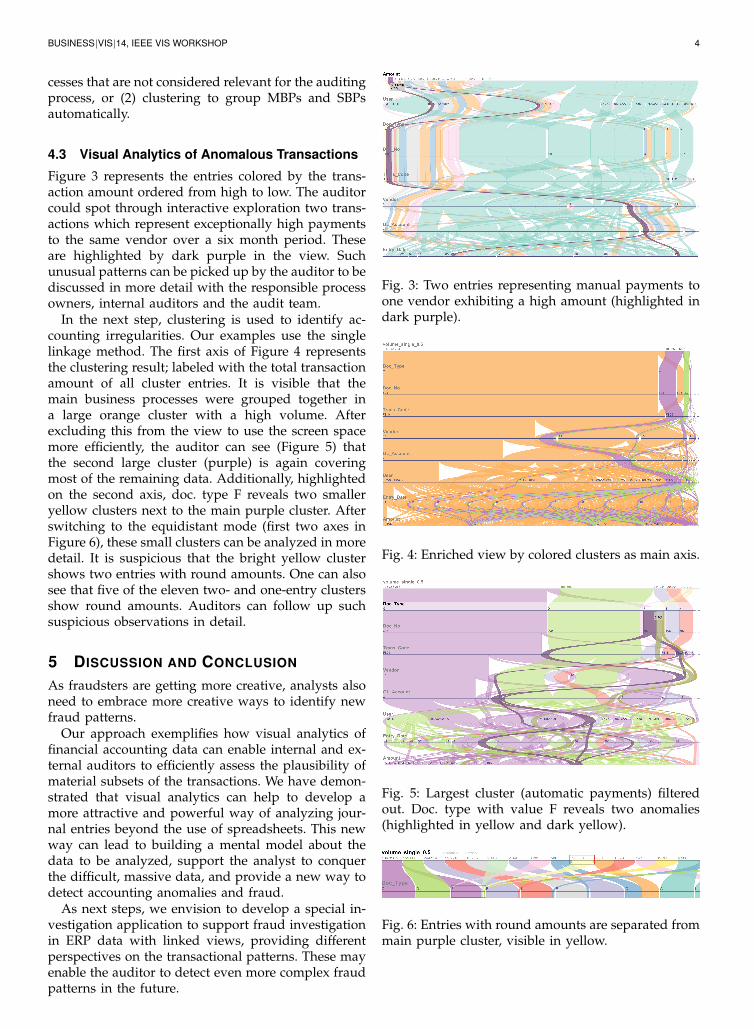
Figure 3 represents the entries colored by the trans-action amount ordered from high to low. The auditorcould spot through interactive exploration two trans-actions which represent exceptionally high paymentsto the same vendor over a six month period. Theseare highlighted by dark purple in the view. Suchunusual patterns can be picked up by the auditor to bediscussed in more detail with the responsible processowners, internal auditors and the audit team.
In the next step, clustering is used to identify ac-counting irregularities. Our examples use the singlelinkage method. The first axis of Figure 4 representsthe clustering result; labeled with the total transactionamount of all cluster entries. It is visible that themain business processes were grouped together ina large orange cluster with a high volume. Afterexcluding this from the view to use the screen spacemore efficiently, the auditor can see (Figure 5) thatthe second large cluster (purple) is again coveringmost of the remaining data. Additionally, highlightedon the second axis, doc. type F reveals two smalleryellow clusters next to the main purple cluster. Afterswitching to the equidistant mode (first two axes inFigure 6), these small clusters can be analyzed in moredetail. It is suspicious that the bright yellow clustershows two entries with round amounts. One can alsosee that five of the eleven two- and one-entry clustersshow round amounts. Auditors can follow up suchsuspicious observations in detail.
5 DISCUSSION AND CONCLUSION
As fraudsters are getting more creative, analysts alsoneed to embrace more creative ways to identify newfraud patterns.
Our approach exemplifies how visual analytics offinancial accounting data can enable internal and ex-ternal auditors to efficiently assess the plausibility ofmaterial subsets of the transactions. We have demon-strated that visual analytics can help to develop amore attractive and powerful way of analyzing jour-nal entries beyond the use of spreadsheets. This newway can lead to building a mental model about thedata to be analyzed, support the analyst to conquerthe difficult, massive data, and provide a new way todetect accounting anomalies and fraud.
As next steps, we envision to develop a special in-vestigation application to support fraud investigationin ERP data with linked views, providing differentperspectives on the transactional patterns. These mayenable the auditor to detect even more complex fraudpatterns in the future.
Fig. 3: Two entries representing manual payments toone vendor exhibiting a high amount (highlighted indark purple).
Fig. 4: Enriched view by colored clusters as main axis.
Fig. 5: Largest cluster (automatic payments) filteredout. Doc. type with value F reveals two anomalies(highlighted in yellow and dark yellow).
Fig. 6: Entries with round amounts are separated frommain purple cluster, visible in yellow.

BUSINESS|VIS|14, IEEE VIS WORKSHOP 5
ACKNOWLEDGMENTS
The authors would like to thank to Robert Kosara forproviding Parallel Sets open source for other analysts.
REFERENCES[1] PricewaterhouseCoopers International Limited, “Economic
crime: A threat to business globally,” PwC’s 2014 Global Eco-nomic Crime Survey, 2014.
[2] Association of Certified Fraud Examiners (ACFE), “Report tothe nations on occupational fraud and abuse,” 2014 GlobalFraud Study, 2014.
[3] D. A. Keim, F. Mansmann, J. Schneidewind, J. Thomas, andH. Ziegler, “Visual Analytics: Scope and Challenges,” in VisualData Mining: Theory, Techniques and Tools for Visual Analytics.Springer, 2008, lNCS.
[4] A. Sharma and P. K. Panigrahi, “A review of financial account-ing fraud detection based on data mining techniques,” Int.Journal of Computer Applications, vol. 39, no. 1, pp. 37–47, 2012.
[5] R. Q. Khan, M. W. Corney, A. J. Clark, and G. M. Mohay,“Transaction mining for fraud detection in erp systems,” In-dustrial Engineering and Management Systems, vol. 9, no. 2, pp.141–156, 2010.
[6] A. Islam, M. Corney, G. Mohay, A. Clark, S. Bracher, T. Raub,and U. Flegel, “Detecting collusive fraud in enterprise resourceplanning systems,” in Advances in Digital Forensics VII, ser. IFIPAdvances in Information and Communication Technology,G. Peterson and S. Shenoi, Eds. Springer, 2011, vol. 361, pp.143–153.
[7] S. Bay, K. Kumaraswamy, M. G. Anderle, R. Kumar, and D. M.Steier, “Large scale detection of irregularities in accountingdata,” in 6th Int. Conf. on Data Mining. IEEE, 2006, pp. 75–86.
[8] M. McGlohon, S. Bay, M. G. Anderle, D. M. Steier, andC. Faloutsos, “Snare: a link analytic system for graph labelingand risk detection,” in Proc. of the 15th ACM SIGKDD Int. Conf.on KDD. ACM, 2009, pp. 1265–1274.
[9] M. Jans, N. Lybaert, and K. Vanhoof, “A framework forinternal fraud risk reduction at it integrating business pro-cesses: the ifr2 framework,” The Int. journal of digital accountingresearch, vol. 9, p. 7, 2010.
[10] J. A. Hartigan and B. Kleiner, “Mosaics for contingency tables.”Computer Science and Statistics: Proc. of the 13th Symp. on theInterface, pp. 268—273, 1981.
[11] H. Hofmann, “Exploring categorical data: interactive mosaicplots,” Metrika, vol. 51, no. 1, pp. 11–26, 2000.
[12] K. Wittenburg, T. Lanning, M. Heinrichs, and M. Stanton, “Par-allel bargrams for consumer-based information explorationand choice,” in Proc. of the 14th Annual ACM Symp. on UserInterface Software and Technology. ACM, 2001, pp. 51–60.
[13] R. Kosara, F. Bendix, and H. Hauser, “Parallel sets: Interactiveexploration and visual analysis of categorical data,” Transac-tions on Visualization and Computer Graphics, vol. 12, pp. 558–568, 2006.
[14] A. Inselberg and B. Dimsdale, “Parallel coordinates: A toolfor visualizing multi-dimensional geometry,” in Proc. of the 1stConf. on Visualization ’90. IEEE CS Press, 1990, pp. 361–378.
[15] S. A. Elavarasi and J. Akilandeswari, “Survey on clustering al-gorithm and similarity measure for categorical data,” ICTACTJournal on Soft Computing, vol. 04, p. 8, 2014.
[16] Z. Huang, “Extensions to the k-means algorithm for clusteringlarge data sets with categorical values,” Data Min. Knowl.Discov., vol. 2, no. 3, pp. 283–304, Sep. 1998.
[17] J. Ward Jr, “Hierarchical grouping to optimize an objectivefunction,” Journal of the American statistical association, vol. 58,no. 301, pp. 236–244, 1963.
[18] S. G. Rajeev, R. Rastogi, and K. Shim, “Rock: A robustclustering algorithm for categorical attributes,” in InformationSystems, 1999, pp. 512–521.