buy-to-let index quarterly report - lendinvest · buy-to-let index quarterly report with special...
TRANSCRIPT
1+44 (0)20 7118 1900 | lendinvest.com | Two Fitzroy Place, 8 Mortimer Street, London, W1T 3JJ
Buy-to-Let Index Quarterly ReportWith special feature 'Biggest Climbers of 2017'
December 2017
020 7118 1900 | lendinvest.com | Two Fitzroy Place, 8 Mortimer Street, London, W1T 3JJ
2+44 (0)20 7118 1900 | lendinvest.com | Two Fitzroy Place, 8 Mortimer Street, London, W1T 3JJ
Buy-to-Let Index Report
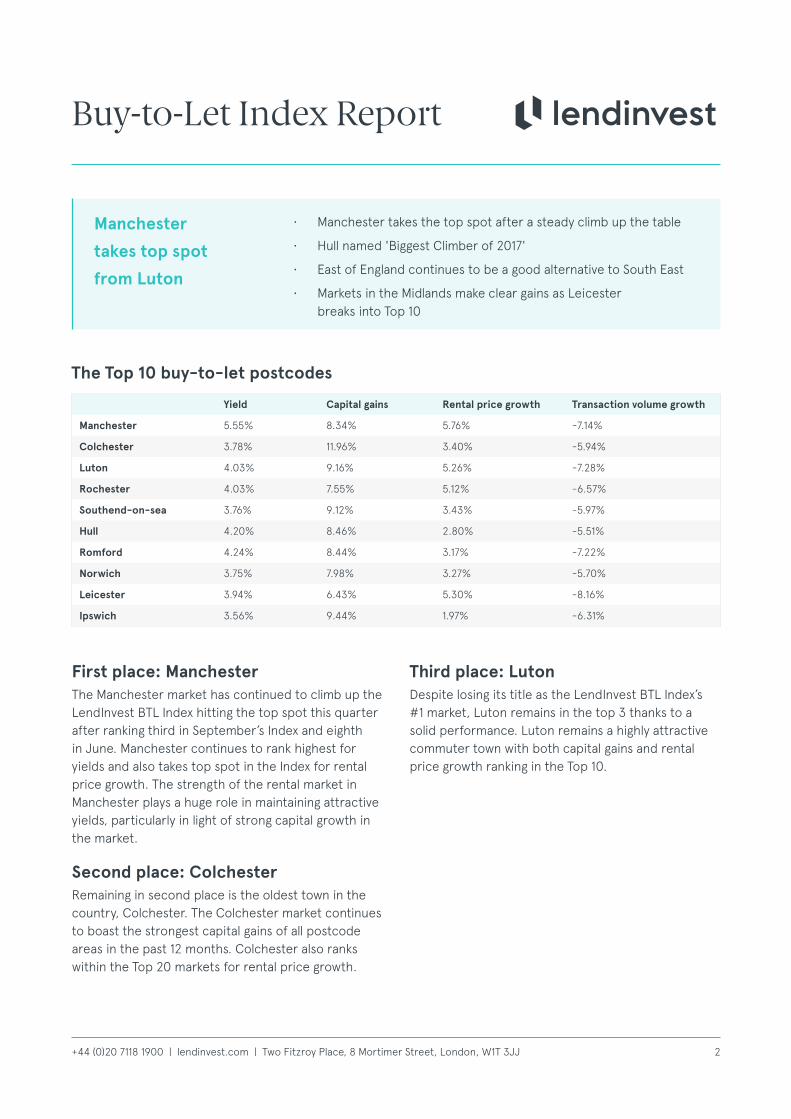
First place: ManchesterThe Manchester market has continued to climb up the LendInvest BTL Index hitting the top spot this quarter after ranking third in September’s Index and eighth in June. Manchester continues to rank highest for yields and also takes top spot in the Index for rental price growth. The strength of the rental market in Manchester plays a huge role in maintaining attractive yields, particularly in light of strong capital growth in the market.
Second place: ColchesterRemaining in second place is the oldest town in the country, Colchester. The Colchester market continues to boast the strongest capital gains of all postcode areas in the past 12 months. Colchester also ranks within the Top 20 markets for rental price growth.
• Manchester takes the top spot after a steady climb up the table
• Hull named 'Biggest Climber of 2017'
• East of England continues to be a good alternative to South East
• Markets in the Midlands make clear gains as Leicester breaks into Top 10
Manchester
takes top spot
from Luton
The Top 10 buy-to-let postcodes
Yield Capital gains Rental price growth Transaction volume growth
Manchester 5.55% 8.34% 5.76% -7.14%
Colchester 3.78% 11.96% 3.40% -5.94%
Luton 4.03% 9.16% 5.26% -7.28%
Rochester 4.03% 7.55% 5.12% -6.57%
Southend-on-sea 3.76% 9.12% 3.43% -5.97%
Hull 4.20% 8.46% 2.80% -5.51%
Romford 4.24% 8.44% 3.17% -7.22%
Norwich 3.75% 7.98% 3.27% -5.70%
Leicester 3.94% 6.43% 5.30% -8.16%
Ipswich 3.56% 9.44% 1.97% -6.31%
Third place: LutonDespite losing its title as the LendInvest BTL Index’s #1 market, Luton remains in the top 3 thanks to a solid performance. Luton remains a highly attractive commuter town with both capital gains and rental price growth ranking in the Top 10.
3+44 (0)20 7118 1900 | lendinvest.com | Two Fitzroy Place, 8 Mortimer Street, London, W1T 3JJ
New Entrants The East of England is proving to be a compelling alternative to the South East in the Index, with Norwich joining Ipswich in the Top 10 (#8 and #10 respectively) for the first time. Rental price growth has been a prominent feature across markets in the East of England, supported by strong rental growth in Norwich over the past 12 months.
Markets in the Midlands were earmarked in September’s report as ‘markets to watch’ when they began to knock on the door of the Top 10 of the Index. This quarter Leicester (#9) has risen a remarkable 17 places (#26 in September 2017) to win a position in the Top 10. Rental price growth in Leicester's residential market is key to its rise up the rankings and adds to the appeal of the market to buy-to-let investors.
Markets to watchThe Midlands remain the region to which it’s worth paying the closest attention: Leicester’s (#9) rise is followed closely by Birmingham (#11) as it continues to rise up the Index (#18 in September and #42 in June) due to a strong rental market driving an attractive yield. Nottingham (#24) isn’t far behind marking a clear win for the Midlands in this Index.
Birmingham is home to the largest professional service sector outside of London, and as such the tenant pool for the rental market is substantial. HS2, the forthcoming high-speed rail line, which will connect London to Birmingham as well as significant regeneration in the city, suggests there may not be a better time to invest into Birmingham’s residential market.
Elsewhere in the UK, rental yields are particularly attractive in the North West of England with a number of postcodes dominating the Top 10 yielding markets.
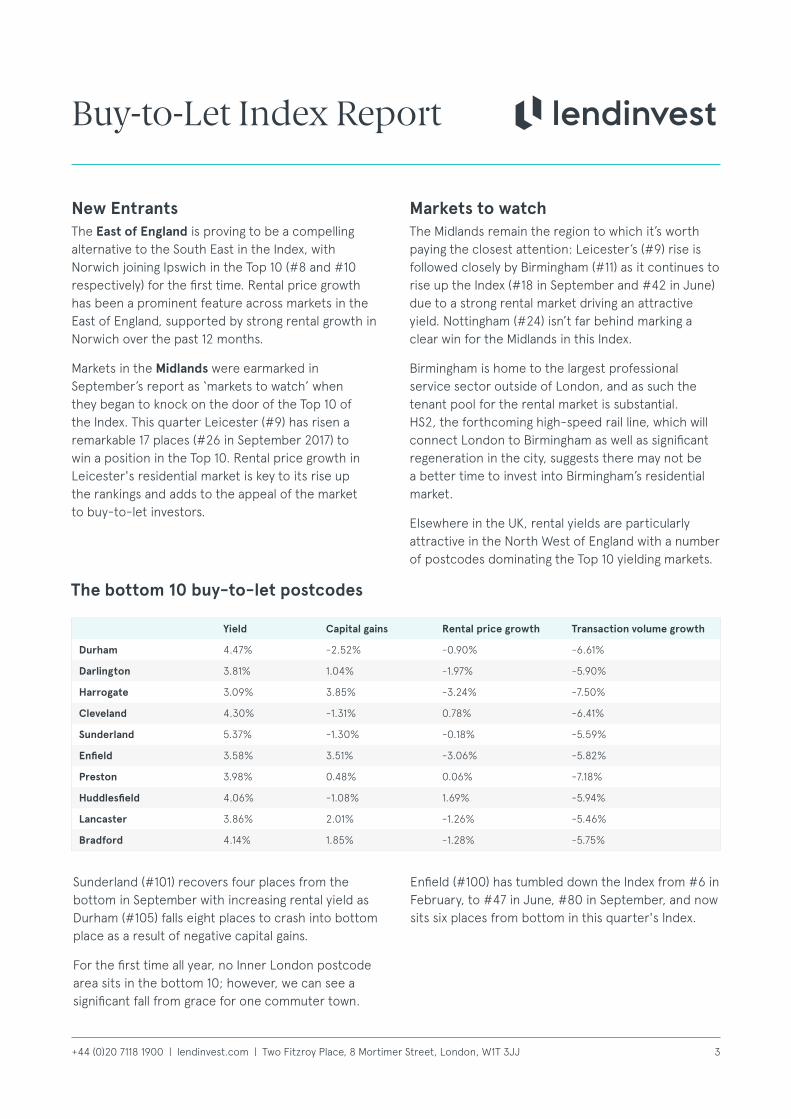
The bottom 10 buy-to-let postcodes
Yield Capital gains Rental price growth Transaction volume growth
Durham 4.47% -2.52% -0.90% -6.61%
Darlington 3.81% 1.04% -1.97% -5.90%
Harrogate 3.09% 3.85% -3.24% -7.50%
Cleveland 4.30% -1.31% 0.78% -6.41%
Sunderland 5.37% -1.30% -0.18% -5.59%
Enfield 3.58% 3.51% -3.06% -5.82%
Preston 3.98% 0.48% 0.06% -7.18%
Huddlesfield 4.06% -1.08% 1.69% -5.94%
Lancaster 3.86% 2.01% -1.26% -5.46%
Bradford 4.14% 1.85% -1.28% -5.75%
Buy-to-Let Index Report
Sunderland (#101) recovers four places from the bottom in September with increasing rental yield as Durham (#105) falls eight places to crash into bottom place as a result of negative capital gains.
For the first time all year, no Inner London postcode area sits in the bottom 10; however, we can see a significant fall from grace for one commuter town.
Enfield (#100) has tumbled down the Index from #6 in February, to #47 in June, #80 in September, and now sits six places from bottom in this quarter's Index.
4+44 (0)20 7118 1900 | lendinvest.com | Two Fitzroy Place, 8 Mortimer Street, London, W1T 3JJ
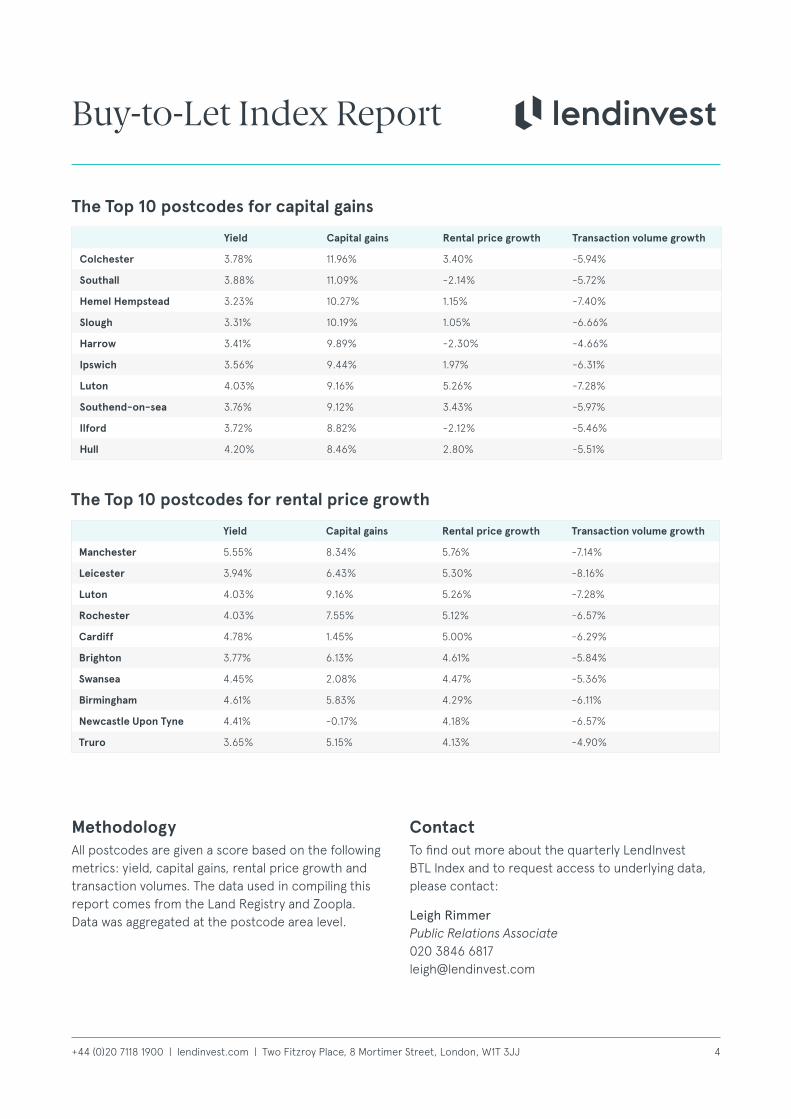
The Top 10 postcodes for rental price growth
Yield Capital gains Rental price growth Transaction volume growth
Manchester 5.55% 8.34% 5.76% -7.14%
Leicester 3.94% 6.43% 5.30% -8.16%
Luton 4.03% 9.16% 5.26% -7.28%
Rochester 4.03% 7.55% 5.12% -6.57%
Cardiff 4.78% 1.45% 5.00% -6.29%
Brighton 3.77% 6.13% 4.61% -5.84%
Swansea 4.45% 2.08% 4.47% -5.36%
Birmingham 4.61% 5.83% 4.29% -6.11%
Newcastle Upon Tyne 4.41% -0.17% 4.18% -6.57%
Truro 3.65% 5.15% 4.13% -4.90%
Methodology All postcodes are given a score based on the following metrics: yield, capital gains, rental price growth and transaction volumes. The data used in compiling this report comes from the Land Registry and Zoopla. Data was aggregated at the postcode area level.
Contact To find out more about the quarterly LendInvest BTL Index and to request access to underlying data, please contact:
Leigh Rimmer Public Relations Associate 020 3846 6817 [email protected]
The Top 10 postcodes for capital gains
Yield Capital gains Rental price growth Transaction volume growth
Colchester 3.78% 11.96% 3.40% -5.94%
Southall 3.88% 11.09% -2.14% -5.72%
Hemel Hempstead 3.23% 10.27% 1.15% -7.40%
Slough 3.31% 10.19% 1.05% -6.66%
Harrow 3.41% 9.89% -2.30% -4.66%
Ipswich 3.56% 9.44% 1.97% -6.31%
Luton 4.03% 9.16% 5.26% -7.28%
Southend-on-sea 3.76% 9.12% 3.43% -5.97%
Ilford 3.72% 8.82% -2.12% -5.46%
Hull 4.20% 8.46% 2.80% -5.51%
Buy-to-Let Index Report
5+44 (0)20 7118 1900 | lendinvest.com | Two Fitzroy Place, 8 Mortimer Street, London, W1T 3JJ
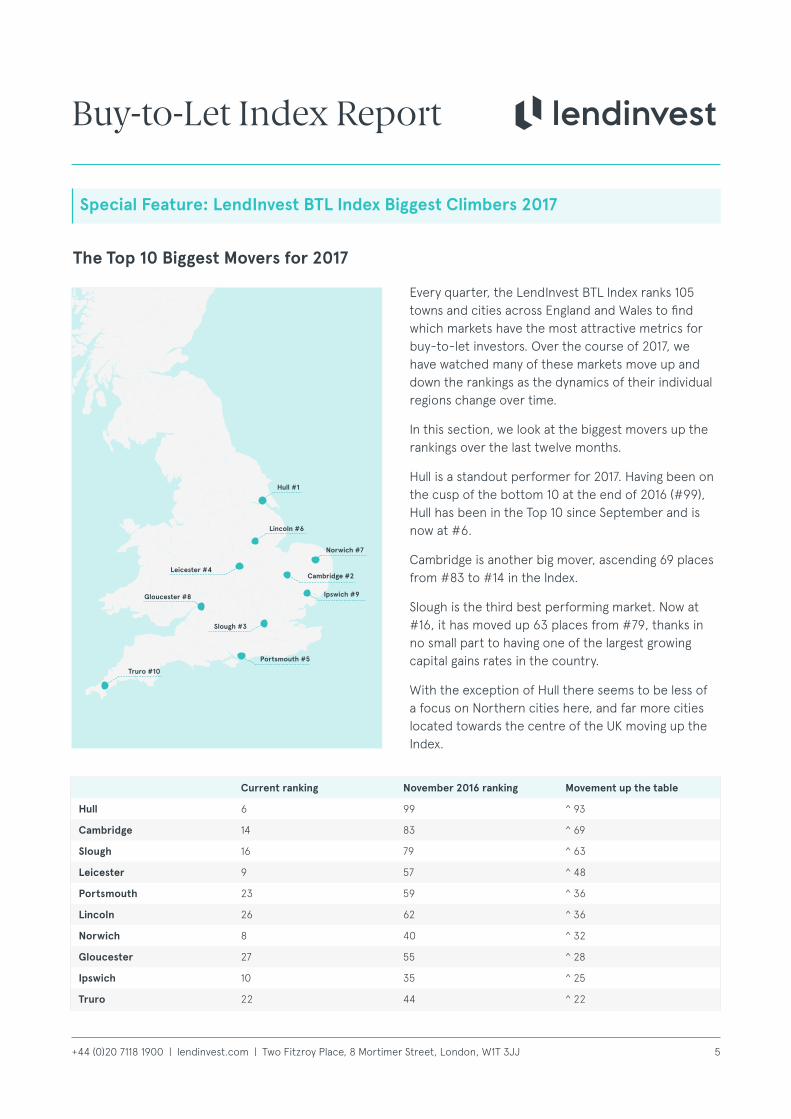
Every quarter, the LendInvest BTL Index ranks 105 towns and cities across England and Wales to find which markets have the most attractive metrics for buy-to-let investors. Over the course of 2017, we have watched many of these markets move up and down the rankings as the dynamics of their individual regions change over time.
In this section, we look at the biggest movers up the rankings over the last twelve months.
Hull is a standout performer for 2017. Having been on the cusp of the bottom 10 at the end of 2016 (#99), Hull has been in the Top 10 since September and is now at #6.
Cambridge is another big mover, ascending 69 places from #83 to #14 in the Index.
Slough is the third best performing market. Now at #16, it has moved up 63 places from #79, thanks in no small part to having one of the largest growing capital gains rates in the country.
With the exception of Hull there seems to be less of a focus on Northern cities here, and far more cities located towards the centre of the UK moving up the Index.
Special Feature: LendInvest BTL Index Biggest Climbers 2017
Current ranking November 2016 ranking Movement up the table
Hull 6 99 ^ 93
Cambridge 14 83 ^ 69
Slough 16 79 ^ 63
Leicester 9 57 ^ 48
Portsmouth 23 59 ^ 36
Lincoln 26 62 ^ 36
Norwich 8 40 ^ 32
Gloucester 27 55 ^ 28
Ipswich 10 35 ^ 25
Truro 22 44 ^ 22
Buy-to-Let Index Report
The Top 10 Biggest Movers for 2017
Hull #1
Cambridge #2
Slough #3
Leicester #4
Lincoln #6
Portsmouth #5
Norwich #7
Gloucester #8 Ipswich #9
Truro #10