bw global fixed income fund jun 12 final-ch
DESCRIPTION
TRANSCRIPT
Legg Mason BrandywineGlobal Fixed Income Fund
Brian Hess, Associate PM and Senior Research Analyst
19 June 2012
Fund data as of 31 May 2012
This document is aimed exclusively at Qualified Investors as defined by Art 10, Section 3 of the Swiss Collective Investment Schemes Act of 23 June 2006 (“CISA”) and must not be provided to, or used by retail investors.
Page 1
About Brandywine Global

Page 2
Legg Mason Subsidiary Focused on Value Investing
• U$37 billion* in AUM
• Headquartered in Philadelphia, with offices in San Francisco, Singapore and London
• Almost 160 employees worldwide
An Active and Experienced High-Conviction Manager
Managing global fixed income portfolios since 1998
Manages over $27bn in fixed income assets
Strong Team-Oriented Investment Approach
• Top-down, value-oriented approach
• Head PMs have been partners since 1995 and team has over 90 years of combined experience
• Culture of partnership and teamwork
Assets Under Management (by strategy type; USD billions)
Source: Brandywine as of 31 March 2012. * Brandywine Global named the 2012 winner of Institutional Investor‟s 3rd Annual US Investment Management Awards for Global Fixed Income.
An Award-Winning Investment Manager*: Brandywine Global

Page 3
Brandywine‟s Global Fixed Income Team
• A focused, cohesive and agile team
• Over three decades of fixed income experience
• Joint responsibility for investment policy
• Stephen and David have managed the Fund together since its inception
• No leavers from investment team since Fund inception on 30 September 2003
Brandywine Global Investment Management (Asia) Pte., Ltd., formally known as Brandywine Asset Management (Asia) Pte., Ltd.; Established in September 2003 as a wholly owned subsidiary of Brandywine Asset Management, LLC, Brandywine Asset Management (Asia) Pte., Ltd., provides a full
range of investment advisory and fund management services to institutional clients in Singapore.
Source: Brandywine as of 31 March 2012.
Francis A Scotland,
Director of Global Macro Research
Inv exp: 33 yearsJoined: 2006
Tracy Chen CFA CAIA,
Senior Research Analyst – Credit
Specialist
Inv exp: 13 yearsJoined: 2008
Carole Lye,
Research Analyst
Inv exp: 4 yearsJoined: 2008
Min Tian,
Global Macro Research Specialist
Inv exp: 4 yearsJoined: 2006
Stephen S Smith,
Managing Director and Portfolio
Manager
Inv exp: 35+ yearsJoined: 1991
David F Hoffman,
Managing Director and Portfolio
Manager
Inv exp: 35+ yearsJoined: 1995
Jack P McIntyre CFA, Associate
Portfolio Manager, Senior Research
Analyst
Inv exp: 24 yearsJoined: 1991
Brian R Hess,
Associate Portfolio Manager
Inv exp: 10 yearsJoined: 2003
Global Fixed Income Portfolio Managers
Fixed Income Research and Implementation
Christopher R Coolidge CFA,
Manager, Portfolio Implementation
Inv exp: 13 yearsJoined: 2010
Co-Heads Global Fixed Income
Dennis W. Dow,
Head Trader, Fixed Income
Inv exp: 19 yearsJoined: 2000
Renato Latini CFA,
Trader, Fixed Income
Inv exp: 6 yearsJoined: 2006
Travis Crumley,
Trader, Fixed Income
Inv exp: 8 yearsJoined: 2005
Kristen Mugan,
Trader, Fixed Income
Inv exp: 4 yearsJoined: 2007

Page 4
Investment Process & Philosophy

Investment Approach and Goals
Brandywine Global doesn’t believe in ’Benchmark hugging’
• Benchmark investing favours investing in the biggest debtors instead of the most disciplined
• It believes benchmark investing is more likely to increase risk rather than lower it
Brandywine Global’s Investment Philosophy
Brandywine Global aims to exploit over- and under-valuations in bond and currency markets that result from price
imbalances in order to generate returns.
Brandywine Global seeks returns in the portfolio by:
- Investing in bonds from around the world with the highest real yields
- Actively managing currency exposures in order to protect capital and enhance returns
- Patiently rotating among countries
- Controlling risk and preserving capital by purchasing undervalued securities
Page 5

Page 6
Investment Process

Page 7
Investment Process Overview
Source: Brandywine Global Investment Management LLC.
Macro Economic Research
Establishing Investment Themes
Alpha Decisions
• Country Allocation
Portfolio Construction and Market Risk Analysis
Strategy Review and Monitoring Feedback• Currency Allocation• Duration
•Analysing macro economic factors
• Identifying macro risks• Identifying high real yield countries

Investment Process is Driven by Macro Themes
Diversification within macro themes helps to reduce risk:• Macro themes can be diversified across a variety of countries and currencies (diverse investment ideas allow for the
same theme to play out slightly differently across different assets)
• Diversification smoothes out day-to-day volatility
Select
commodity
currencies
Theme #1
Global growth improving
Theme #2
Driver of global growth shifts from G3 to G20
Theme #3
EU debt crisis unresolved
Reduce US
and UK
duration
Hold
EM Debt
Hold
peripherals
Hold
Asia/EM
currencies
No Euro
Maintain
some
Treasuries
and USD
Bias away from
EU debt
Source: Brandywine, as at 31 March 2012. The views expressed above are those of Brandywine Global Investment Management, LLC, and are not intended as a recommendation, investment advice, forecast or guarantee of future results. It should not be assumed that investment in the regions or currencies listed and account quality
ratings or duration ranges were or will prove profitable, or that investment decisions it makes in the future will be profitable. International securities and ADRs may be subject to market/currency fluctuations, investment risks, and other risks involving foreign economic, political, monetary, taxation, auditing and/or legal factors. There may be additional risks
associated with international investments. International investing may not be suitable for everyone. There is no guarantee that the investment strategy will meet its objective. Past performance is no guarantee of future results.
Page 8

Page 9
Three Sources of Alpha – Country Allocation
Brandywine Global’s country allocation process seeks
to identify relative value worldwide, analysing:
• Secular and political analysis, critically examines and
monitors
– Long-term shifts in inflation
– Political changes that impact fiscal and monetary policy
– Debt and pension liability trends
– Trade Dynamics
– Immigration Dynamics
• Each country‟s business and liquidity cycle through
– Inflation pressures
– Employment
– Fiscal/monetary policy
– Capacity constraints
– Real interest rates
Source: Brandywine, as at 31 March 2012
0 %
10 %
20 %
30 %
4 0 %
50 %
60 %
70 %
80 %
90 %
10 0 %
95 96 97 98 99 0 0 0 1 0 2 0 3 0 4 0 5 0 6 0 7 0 8 0 9 10 11
A ustralia* Canada Denm ark ECU Finland France Germ any* Iceland
Ireland Italy * Malaysia* Mexico* New Zealand* Norway Poland* Singapore
South A frica* South Korea* Spain Sweden U.K.* U.S.*

Page 10
Three Sources of Alpha – Currency Allocation
Brandywine Global approaches currency allocation
as a long-term investor, looking for:
• Currency valuation extremes, as defined by purchasing
power parity
• JPM Real Trade Weighted Index: Currency valuations
relative to other currencies
• Circumstances in which valuation extremes change
economic behaviour
• Geopolitical factors
• Currencies with high, real interest rates relative to other
countries
• Its focus on high real yields leads the portfolio to
undervalued currencies with the potential to appreciate
• It hedges if currencies are so overvalued that the
overvaluation is changing economic behaviour
Short-term factors are also considered:
• Market sentiment, hedging costs, technicals
0 %
25%
50 %
75%
10 0 %
97 98 99 0 0 0 1 0 2 0 3 0 4 0 5 0 6 0 7 0 8 0 9 10 11
A ustralia Canada Chile China Denm ark ECU
Net core Euro posit ion Finland France Germ any Iceland IrelandItaly Japan Korea Malaysia Mexico New Zealand
Norway Poland Singapore South A frica Spain SwedenU.K. U.S.
Source: Brandywine, as at 31 December 2011

0
1
2
3
4
5
6
7
8
9
10
95 96 97 98 99 0 0 0 1 0 2 0 3 0 4 0 5 0 6 0 7 0 8 0 9 10 11
B randywine Global Fixed Incom e
Representative A ccount
Cit igroup W GB I
Years
Mont hl y
Page 11
Three Sources of Alpha – Duration Decision
Brandywine Global determines its duration in each
country through an analysis of:
– Real interest rates
– Secular trends
– Position in the business liquidity cycle
– Monetary policy
Brandywine Global believes longer duration
securities offer higher potential returns:
• Investors participate fully as rates decline
• Duration “risk” limited by investing in only a select group of
high yield countries while avoiding investments in markets
with poor return potential
Brandywine Global believes shorter duration
securities offer defensive characteristics:
• When real yields are well below historical norms
• When inflation pressures are increasing
Historical Duration*
Source: Brandywine, as at 31 March 2012

Risk Management is at the Core of the Investment Process
• Brandywine believes that risk is the probability of permanent capital loss and is not a relative measure
Focus is on avoiding capital loss rather than budgeting risk relative to a benchmark.
• Although it is a high conviction manager, it diversifies positions within broad themes.
• The risk that a security (or portfolio of securities) will decline in value
• Exists when the current price is well above Brandywine‟s view of intrinsic value
• Generated from events that will affect intrinsic value in the future
• What is the macro story and what is the potential for surprise?
• Market perception often lags reality in recognising changes and sustainability of fundamental trends.
Price Risk Information Risk
Page 12
• Its emphasis on valuation anomalies in the macro process fundamentally reduces risk.
• Its focus on buying assets that are out of favor and deeply discounted is relative to their intrinsic value.
How does Brandywine minimise this risk?
• Its consideration of which key secular macro trends should minimise this risk.
How does Brandywine minimise this risk?

Risk Management is at the Core of the Investment Process (cont.)
• Two-part sign off - conviction from both Steve Smith and David Hoffman required
• Gradually adding to positions as comfort increases
• Restrict maximum allocation to less liquid markets (0% allocation if no conviction on position)
• Do not believe that tracking error is a relevant measure of risk
• Risk systems used include Wilshire Axiom and Barclays Point
Page 13

Page 14
Portfolio Construction - Typical Investment Parameters
Source: Brandywine.
1 Client-approved adjustments to guideline allocations may occur depending on market conditions. 2 NRSO is the acronym for Nationally Recognised Statistical Rating Organisation 3 The fund is permitted to invest up to 10% in investment grade rated
Emerging Markets debt as set out in the prospectus.

Page 15
Macro Outlook
Page 16
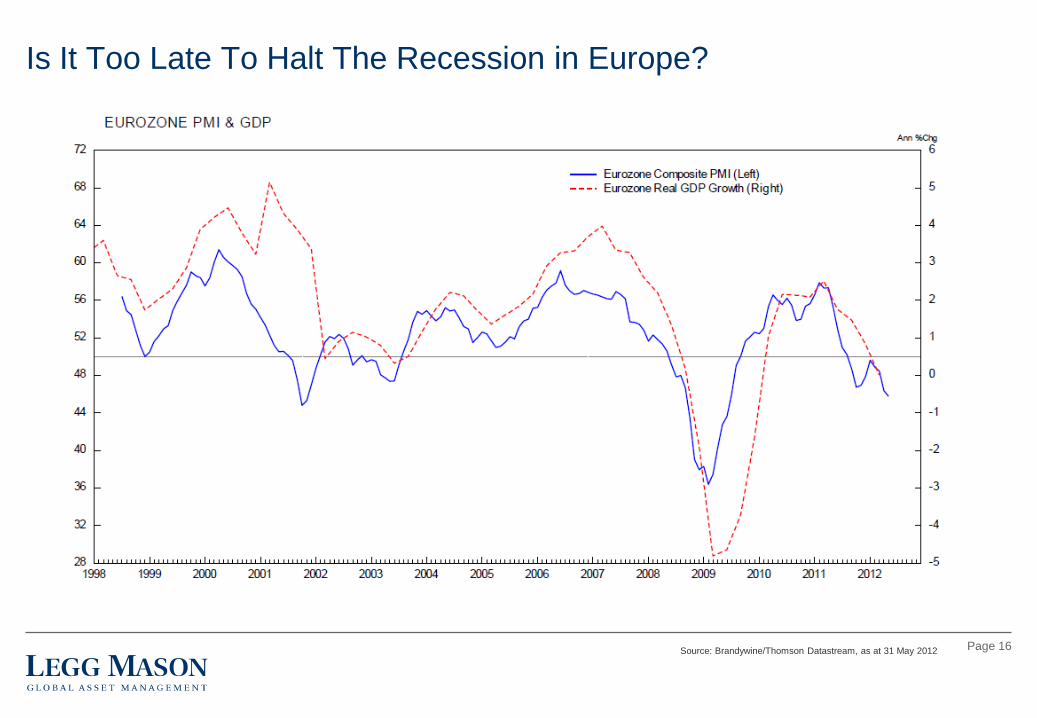
Is It Too Late To Halt The Recession in Europe?
Source: Brandywine/Thomson Datastream, as at 31 May 2012

Page 17
China Is Getting What It Wants, A Slowing Economy
Source: Brandywine/Thomson Datastream, as at 30 April 2012

Page 18
US Households Are “Cleaning Up” Their Balance Sheets
Source: Brandywine/Thomson Datastream, as at 31 December 2011
US Household Debt (Quarterly Change, Annualised)

Page 19
Tame German & Chinese Inflation Measures Are Key For Further Stimulus
Source: Brandywine/Thomson Datastream, as at 30 April 2012

Page 20
Coordinated Global Liquidity By G4 Central Banks, Part One Of Reflation
Source: Brandywine/Thomson Datastream, as at 25 May 2012
*Rebased to 100, as at Jan 2007

Page 21
Brandywine Remains Uninvested In The Yen
Source: Brandywine/Thomson Datastream, as at 31 December 2011

Page 22
Despite The G3‟s Woes, The Global Economy Has A Solid Base
Source: Brandywine/Thomson Datastream, as at 31 December 2011

Page 23
The Need for Diversification Outside of Your Domestic Market
• Bond and Currency returns vary significantly from country to country, year over year
• Restricting your global bond allocations to G3 economies will restrict your diversification and
opportunity set
• Global flexibility and high conviction are key to maximise total return potential from bonds, currencies
and duration allocations
– Allocate to global bond funds that are not driven by benchmarks

Page 24Data is obtained through Thomson Inc. ©2011, which Brandywine Global believes to be reliable and accurate. Thomson provides Brandywine Global with Fixed Income Index
returns and characteristics. This data is provided for informational use only. Please refer to the Performance Disclosure and Footnotes in the Appendix at the end of this presentation for a description of the indices that Brandywine Global uses in connection with this strategy. Indices are unmanaged and not available for direct investment. The
countries & currencies discussed herein should not be perceived as investment recommendations. It should not be assumed that investments in the countries & currencies listed were or will prove to be profitable, or that the investment decisions we make in the future will be profitable. International securities may be subject to market and currency
fluctuations and other investment risks. Fixed income securities are subject to credit risk and interest rate risk. Past performance is no guarantee of future results.
-10 %
0 %
10 %
20 %
30 %
4 0 %
50 %
85 86 87 88 89 90 91 92 93 94 95 96 97 98 99 0 0 0 1 0 2 0 3 0 4 0 5 0 6 0 7 0 8 0 9 10 11
Total Return Country Return Currency Return
Fra
nce
Italy
U.K
.
Austr
alia
Canada
U.K
.
Austr
alia
Japan
Japan
Belg
ium
Sw
eden
Italy
U.K
.
Fra
nce
Japan
U.S
.
Pola
nd
Norw
ay
Austr
alia
Pola
nd
Canada
Pola
nd
Canada
Japan
Austr
alia
Austr
alia
Sw
itzerland
As at 30 June 2011
The Benefits of Not Being Constrained by a BenchmarkAllows active managers to select those countries and currencies they believe will outperformFor illustrative purposes onlyBest Performing Countries and Currencies by Year, Sources of Return based in EUR)

Page 25Data is obtained through Thomson Inc. ©2011, which Brandywine Global believes to be reliable and accurate. Thomson provides Brandywine Global with Fixed Income Index
returns and characteristics. This data is provided for informational use only. Please refer to the Performance Disclosure and Footnotes in the Appendix at the end of this presentation for a description of the indices that Brandywine Global uses in connection with this strategy. Indices are unmanaged and not available for direct investment. The
countries & currencies discussed herein should not be perceived as investment recommendations. It should not be assumed that investments in the countries & currencies listed were or will prove to be profitable, or that the investment decisions we make in the future will be profitable. International securities may be subject to market and currency
fluctuations and other investment risks. Fixed income securities are subject to credit risk and interest rate risk. Past performance is no guarantee of future results.
-60 %
-50 %
-4 0 %
-30 %
-20 %
-10 %
0 %
10 %
20 %
30 %
85 86 87 88 89 90 91 92 93 94 95 96 97 98 99 0 0 0 1 0 2 0 3 0 4 0 5 0 6 0 7 0 8 0 9 10 11
Total Return Country Return Currency Return
Austr
alia U
.K.
U.S
.
Sw
itzerland
Japan C
anada
Sw
itzerland
Italy
Canada
Japan
Sw
itzerland
Norw
ay
Irela
nd
Japan
Japan Canada
U.S
.
U.S
.
Japan
Japan
U.K
.
U.S
.
Irela
nd
Port
ugal
U.K
.
Austr
ia
Sw
eden
As at 30 June 2011
The Benefits of Not Being Constrained by a BenchmarkAllows active managers to select those countries and currencies they believe will outperformFor illustrative purposes onlyWorst Performing Countries and Currencies by Year, Sources of Return based in EUR)

Page 26
Increased Dispersion of Return Equals Increased Opportunity
Data is obtained through Thomson Inc. ©2011, which Brandywine Global believes to be reliable and accurate. Thomson provides Brandywine Global with Fixed Income Index returns and characteristics. This data is provided for informational use only. Please refer to the Performance Disclosure and Footnotes in the Appendix at the end of this
presentation for a description of the indices that Brandywine Global uses in connection with this strategy. Indices are unmanaged and not available for direct investment. The countries & currencies discussed herein should not be perceived as investment recommendations. It should not be assumed that investments in the countries & currencies
listed were or will prove to be profitable, or that the investment decisions we make in the future will be profitable. International securities may be subject to market and currency fluctuations and other investment risks. Fixed income securities are subject to credit risk and interest rate risk. Past performance is no guarantee of future results.
Source: Brandywine, as at 31 March 2012
For illustrative purposes only

Page 27
Portfolio Positioning & Performance

Page 28
Portfolio Characteristics & Comparisons – 31 May 2012
Source: Brandywine at 31 May 2012. For illustrative purposes only. The fund is permitted to invest up to 10% in investment grade rated Emerging Markets debt as set out in the prospectus.
Legg Mason Brandywine Global Fixed Income Fund

Page 29
Portfolio Characteristics & Comparisons – 31 May 2012
Source: Brandywine at 31 May 2012. For illustrative purposes only. **USD Short-term corporate paper issued with an explicit government guarantee
Legg Mason Brandywine Global Fixed Income Fund
*

Page 30
Portfolio Characteristics & Comparisons – 31 May 2012
Source: Brandywine at 31 May 2012. For illustrative purposes only.. *Denotes calculations that include only fixed income
Legg Mason Brandywine Global Fixed Income Fund
*
Page 31
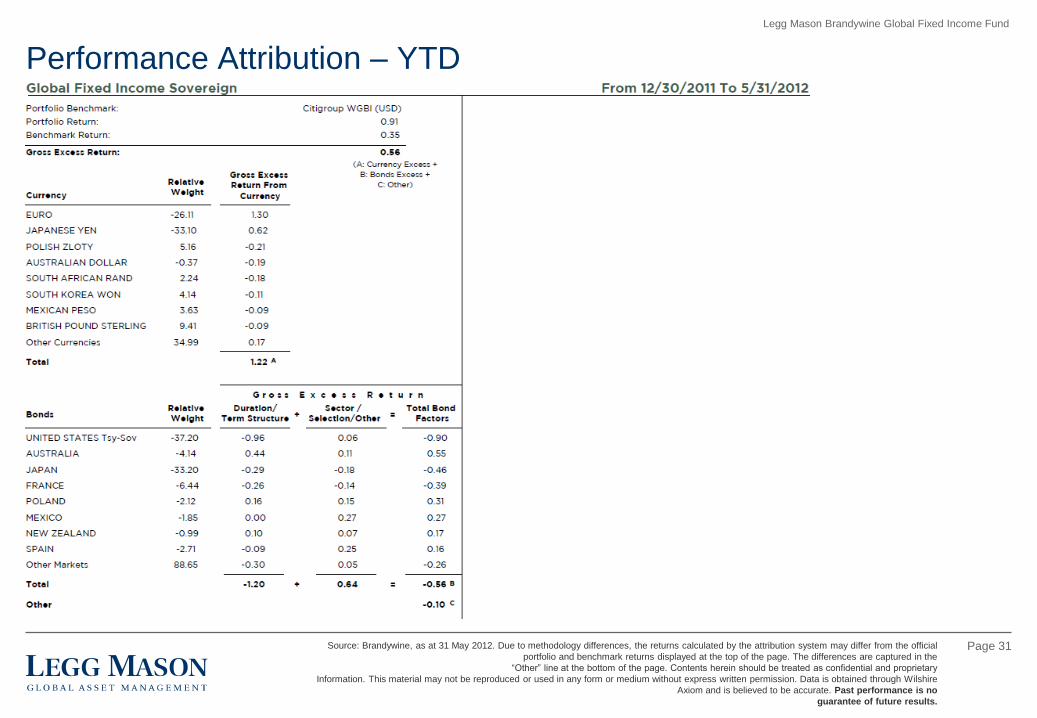
Performance Attribution – YTD
Source: Brandywine, as at 31 May 2012. Due to methodology differences, the returns calculated by the attribution system may differ from the official
portfolio and benchmark returns displayed at the top of the page. The differences are captured in the
“Other” line at the bottom of the page. Contents herein should be treated as confidential and proprietary
Information. This material may not be reproduced or used in any form or medium without express written permission. Data is obtained through Wilshire
Axiom and is believed to be accurate. Past performance is no
guarantee of future results.
Legg Mason Brandywine Global Fixed Income Fund

Portfolio Positioning Summary
• We believe that we are selectively positioned to take advantage of economic reacceleration in the United States, China, and most of the
emerging world while at the same time being defensively positioned with respect to the continuing financial stresses in Europe.
Page 32
Country Themes Currency Themes
Source: Brandywine at 31 May 2012.
Legg Mason Brandywine Global Fixed Income Fund
Pan Europe:
• Reduced exposure in the Eurozone including Ireland, Spain, Germany, France and Greece, among others.
• Preference for British bonds
United States:
• Reduced duration exposure in the US.
Japan:
• Remain un-invested in Japanese government bonds.
Pan Europe:
• Minimal exposure to the euro.
• Preference for the British pound sterling.
United States:
• Preference for the US Dollar
Japan:
• Remain un-invested in Japanese yen
Emerging Markets:
• Exposure to undervalued EM currencies
Asia ex Japan:
• The capital allocation from Brandywine‟s zero weight in the Japanese yen is used to fund currency positions in the Malaysian ringgit and South Korean won, among others.
Page 33
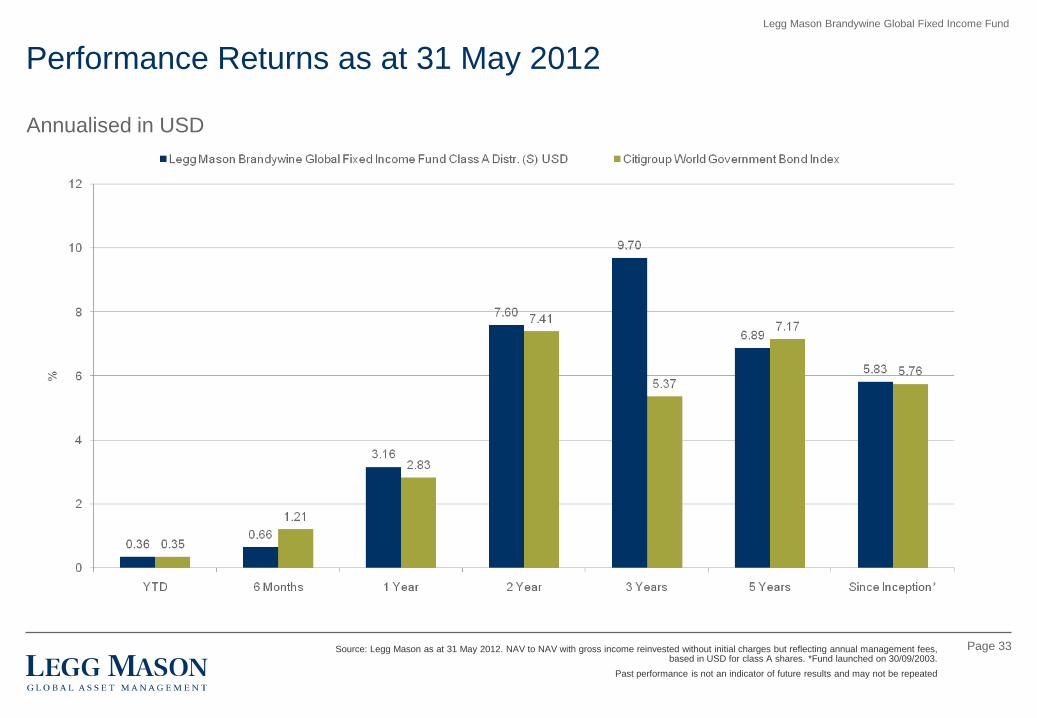
Performance Returns as at 31 May 2012
Annualised in USD
Source: Legg Mason as at 31 May 2012. NAV to NAV with gross income reinvested without initial charges but reflecting annual management fees, based in USD for class A shares. *Fund launched on 30/09/2003.
Past performance is not an indicator of future results and may not be repeated
Legg Mason Brandywine Global Fixed Income Fund

Page 34
Summary: Why Brandywine for Global Bonds?
Legg Mason Brandywine Global Fixed Income Fund
High conviction, Brandywine Global‟s conviction levels drive the composition of the Fund, not a benchmark.
Active management allows investors to gain overweight exposure to countries that are likely to outperform and
underweight exposure to those who are likely to underperform.
Top down approach that can capitalise on shifting geographic and macro trends.
Superior risk adjusted returns designed to capture market upside but aiming to avoid market downside, and to provide
long term performance.
Access to high real yields with diversification outside of G3 countries.
Taking advantage of currency risk to enhance returns.
Page 35
Appendix

95%
10 0 %
10 5%
110 %
115%
120 %
125%
10 % 30 % 50 % 70 % 90 % 110 %
Page 36
Performance driven, but defensive style: Brandywine returned 21% more than the
market during up periods and avoided 72% of the market downside.
Defensive Strategy with Strong Upside/Downside Capture
Since July 1995 / Based on Quarterly Returns / Single Computation
The performance of the Brandywine Global Fixed Income Investment Grade (IG) Composite has been used to demonstrate the portfolio manager‟s longer term track record in managing global bonds
Source: Brandywine / Zephyr Style Advisor as at 31 March 2012.
Based on Global Fixed Income (IG) composite return. The composite includes all fully discretionary, fee- paying actively managed Global Fixed Income accounts with a minimum market value of $3 million. Returns are presented gross of fees and assume reinvestment of dividends, interest, capital gains and other earnings. There
are differences between the composite return and the Legg Mason Brandywine Global Fixed Income Fund including differences in the amount of assets under management, cash flows, fees and expenses, and applicable regulatory requirements, including investment and borrowing restrictions. The past performance of the
Brandywine Fixed Income product is, therefore, not indicative of the future performance of the Legg Mason Brandywine Global Fixed Income Fund.
Upsid
e C
aptu
re
Downside Capture
Global Fixed Income – IG (Gross)
Global Fixed Income – IG (Net)
Citigroup World Government Bond Index
Page 37
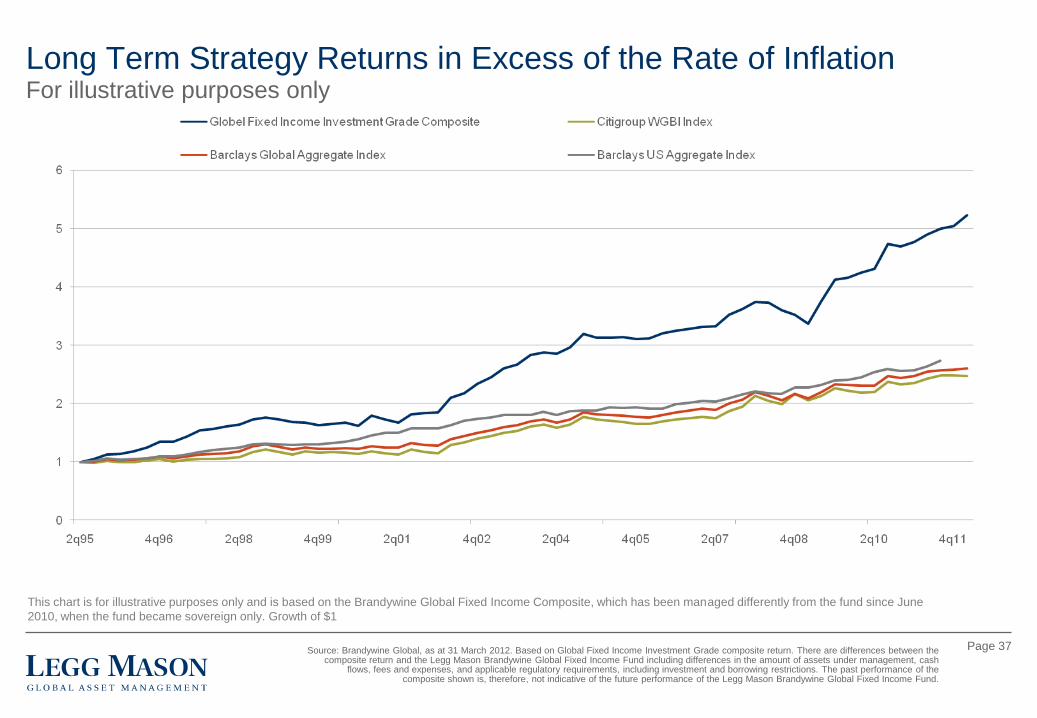
Long Term Strategy Returns in Excess of the Rate of InflationFor illustrative purposes only
Source: Brandywine Global, as at 31 March 2012. Based on Global Fixed Income Investment Grade composite return. There are differences between the composite return and the Legg Mason Brandywine Global Fixed Income Fund including differences in the amount of assets under management, cash
flows, fees and expenses, and applicable regulatory requirements, including investment and borrowing restrictions. The past performance of the composite shown is, therefore, not indicative of the future performance of the Legg Mason Brandywine Global Fixed Income Fund.
This chart is for illustrative purposes only and is based on the Brandywine Global Fixed Income Composite, which has been managed differently from the fund since June
2010, when the fund became sovereign only. Growth of $1

Page 38
Key Technical Details
Investment objective: Maximise total return, consisting of income and capital appreciation
Launch date: 30 September 2003
Benchmark: Citigroup WGBI Un-Hedged (USD)
Portfolio Manager: Team approach
Base Currency: USD
Other Currencies: EUR, GBP, JPY and CHF
Management fee (Class A Dist (S) USD shares): 1.10% p.a.
ISIN BLOOMBERG WKN VALOREN Sedol
Legg Mason Brandywine Global Fixed
Income Fund (Class A Dist (S) USD
shares)
IE0033637442 LEGGLOB ID A0B9F1 1701474 3363744
Legg Mason Brandywine Global Fixed Income Fund
Page 39
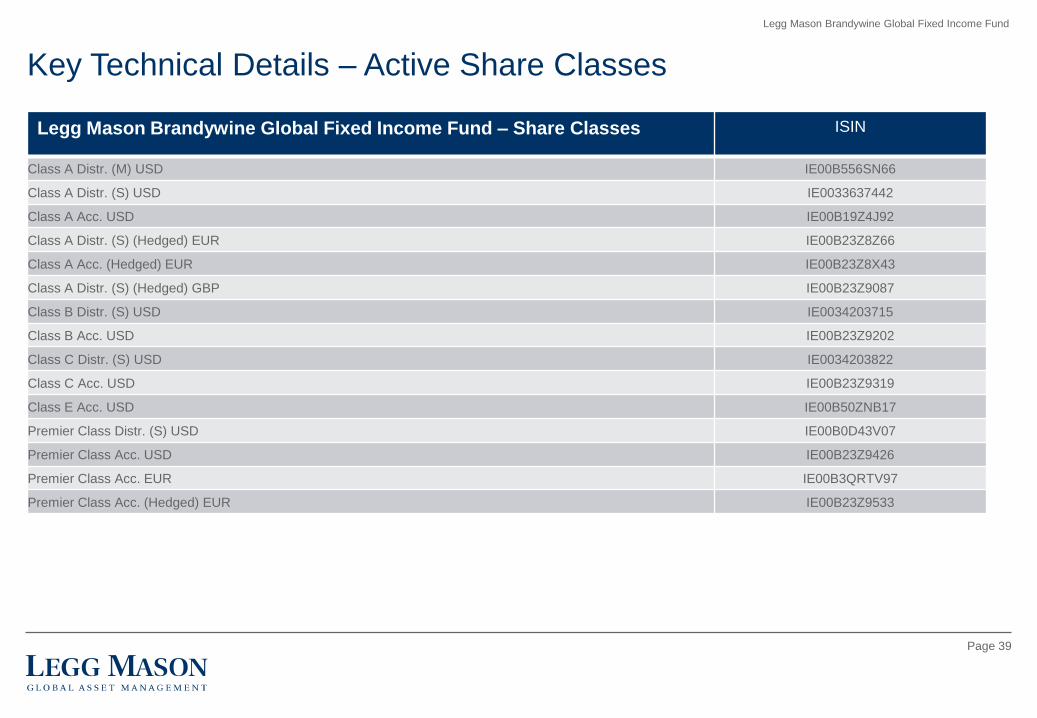
Key Technical Details – Active Share Classes
Legg Mason Brandywine Global Fixed Income Fund – Share Classes ISIN
Class A Distr. (M) USD IE00B556SN66
Class A Distr. (S) USD IE0033637442
Class A Acc. USD IE00B19Z4J92
Class A Distr. (S) (Hedged) EUR IE00B23Z8Z66
Class A Acc. (Hedged) EUR IE00B23Z8X43
Class A Distr. (S) (Hedged) GBP IE00B23Z9087
Class B Distr. (S) USD IE0034203715
Class B Acc. USD IE00B23Z9202
Class C Distr. (S) USD IE0034203822
Class C Acc. USD IE00B23Z9319
Class E Acc. USD IE00B50ZNB17
Premier Class Distr. (S) USD IE00B0D43V07
Premier Class Acc. USD IE00B23Z9426
Premier Class Acc. EUR IE00B3QRTV97
Premier Class Acc. (Hedged) EUR IE00B23Z9533
Legg Mason Brandywine Global Fixed Income Fund

Page 40
Investment Manager Track Record – Best/Worst Quarterly Performance
Source: Brandywine Global Investment Management LLC as at 31 December 2011.
Based on Global Fixed Income Investment Grade composite return. The composite (Global Fixed Income Investment Grade composite) includes all fully discretionary, fee paying actively managed Global Fixed Income accounts with a minimum market value of $3 million. Returns are presented gross of fees
and assume reinvestment of dividends, interest, capital gains and other earnings. There are differences between the composite return and the Legg Mason Brandywine Global Fixed Income Fund including differences in the amount of assets under management, cash flows, fees and expenses, and applicable regulatory requirements, including investment and borrowing restrictions. The past performance of the composite shown is, therefore, not
indicative of the future performance of the Legg Mason Brandywine Global Fixed Income Fund.

CW GB I¹ B CGA ² CW GB I¹ B CGA ²
1 Year 9.52 8.93 5.12 5.26 4.40 4.26 2012 3.59 3.45 -0.51 0.87 4.10 2.72
3 Year 15.71 15.07 6.23 7.53 9.48 8.18 2011 7.61 7.02 6.35 5.64 1.26 1.97
5 Year 9.58 8.98 6.78 6.37 2.80 3.21 2010 12.90 12.29 5.17 5.55 7.73 7.35
7 Year 7.62 7.04 5.18 5.29 2.44 2.33 2009 17.85 17.22 2.55 6.94 15.30 10.91
10 Year 10.94 10.34 7.88 7.33 3.06 3.61 2008 -2.60 -3.13 10.89 4.79 -13.49 -7.39
2007 10.32 9.73 10.95 9.48 -0.63 0.84
2006 5.55 4.97 6.12 6.64 -0.57 -1.09
2005 -2.83 -3.36 -6.87 -4.48 4.04 1.65
2004 12.74 12.13 10.35 9.27 2.39 3.47
2003 21.29 20.64 14.91 12.51 6.38 8.78
2002 27.07 26.39 19.49 16.53 7.58 10.54
Com posite Return Gross of Fees (%)
Com posite Return Net of Fees (%)
¹CW GB I (Citig ro u p W o rld Go ve rn m e n t B o n d In d e x (Un h e d g e d ) )
²B CGA (B arclay s Cap ital Glo b al Ag g re g ate B o n d In d e x)
Excess Gross Return
10.10
Calendar Year Performance
CW GB I¹
Return
(%)
B CGA ²
Return (%)
Com posite
Return Gross
of Fees (%)
CW GB I¹
Return
(%)
Excess Gross ReturnPeriod
Com posite
Return Gross
of Fees (%)
B CGA ²
Return
(%)
Annualized Performance
Com posite
Return Net
of Fees (%)
*Supplemental Information
Since
Inception*
(7/1/1992)
9.50 6.42
Com posite
Return Net
of Fees (%)
6.35 3.68
Year
3.75
0
2
4
6
8
10
12
14
16
18
1 Year 3 Year 5 Year 7 Year 10 Year Since
Inception*
(7/1/1992)
-10
-5
0
5
10
15
20
25
30
20122011201020092008200720062005200420032002
Page 41
Global Fixed Income Investment-Grade Composite
Based on Global Fixed Income Investment Grade composite return. The composite (Global Fixed Income Investment Grade composite) includes all fully discretionary, fee paying actively managed Global Fixed Income accounts with a minimum market value of $3 million. Returns are presented gross of fees and assume reinvestment of dividends, interest, capital gains and other earnings. There are differences between the composite return and the Legg Mason Brandywine Global Fixed Income Fund
including differences in the amount of assets under management, cash flows, fees and expenses, and applicable regulatory requirements, including investment and borrowing restrictions. The past performance of the composite shown is, therefore, not indicative of the future performance of the Legg Mason Brandywine Global Fixed
Income Fund.
Source: Brandywine as at 31 March 2012. Results shown in USD.
Annualised Performance Calendar Year Performance

Page 42
Global Fixed Income Investment-Grade Composite Disclosure
As of 31 March 2012 / Results shown in $USD
¹CWGBI = Citigroup World Government Bond Index (Unhedged)
²BlendedA = 90% CWGBI ; 5% ML High Yield ; 5% JPM Emrg Markets
Year
or
YTD
Com posite
Return Gross
of Fees (%)
Com posite
Return Net
of Fees (%)
CW GB I¹
Return
(%)
B lendedA ²
Return
(%) # of A ccts
Market
Value
($MM)
Firm
A ssets
($MM)
Com posite
Dispersion
(%)
Com posite
St. Dev.
(% 3-Year
Rolling)
CW GB I¹
St. Dev.
(% 3-Year
Rolling)
B lendedA ²
St. Dev.
(% 3-Year
Rolling) Period
Com posite
Return Gross
of Fees (%)
Com posite
Return Net
of Fees (%)
CW GB I¹
Return (%)
B lendedA ²
Return (%)
2012 3.30 3.18 -0.51 0.00 34 7,394 37,184 0.17 7.55 6.78 6.47 1 Year 9.86 9.37 5.12 5.55
2011 8.64 8.15 6.35 6.42 35 6,993 33,122 0.45 8.33 7.57 7.19 3 Year 16.68 16.17 6.23 7.57
2010 13.77 13.27 5.17 6.00 32 5,542 31,996 0.67 11.26 9.26 8.90 5 Year 9.22 8.74 6.78 6.98
2009 21.10 20.57 2.55 5.97 33 5,532 29,199 1.14 10.95 8.83 8.44 7 Year 8.15 7.64 5.18 5.62
2008 -8.30 -8.71 10.89 7.73 36 5,120 32,755 1.25 9.17 7.39 7.12 10 Year 12.01 11.46 7.88 8.17
2007 10.71 10.19 10.95 10.29 35 6,394 49,208 0.24 5.16 5.48 5.01
2006 8.59 8.00 6.12 6.62 31 4,390 39,241 0.49 5.08 5.86 5.50
2005 -0.72 -1.26 -6.87 -5.53 23 2,616 26,332 0.82 6.53 7.24 6.88
2004 14.27 13.65 10.35 10.46 13 1,543 18,547 0.34 6.72 7.50 6.93
2003 27.30 26.62 14.91 16.24 9 726 12,680 1.19 8.20 7.69 7.06
2002 27.03 26.34 19.49 18.22 8 567 7,990 0.44 9.25 7.34 6.67
Year Q1 Q2 Q3 Q4 Q1 Q2 Q3 Q4 Q1 Q2 Q3 Q4 Q1 Q2 Q3 Q4
2012 3.30 - - - 3.18 - - - -0.51 - - - 0.00 - - -
2011 2.15 2.91 2.48 0.84 2.03 2.79 2.37 0.73 0.66 3.32 2.38 -0.12 0.82 3.26 1.75 0.46
2010 2.55 1.68 10.10 -0.89 2.43 1.57 9.98 -1.01 -1.33 0.29 8.18 -1.76 -0.78 0.33 8.14 -1.54
2009 -2.67 12.86 9.49 0.69 -2.78 12.74 9.37 0.58 -4.81 3.48 6.16 -1.93 -3.96 4.74 6.79 -1.36
2008 2.19 0.16 -5.41 -5.29 2.07 0.05 -5.51 -5.39 9.66 -4.23 -2.97 8.81 8.53 -3.76 -3.36 6.72
2007 0.98 0.92 5.82 2.66 0.85 0.80 5.71 2.55 1.15 -1.54 7.20 3.92 1.30 -1.46 6.65 3.60
2006 0.91 2.55 1.98 2.89 0.77 2.41 1.84 2.75 -0.41 3.17 1.44 1.80 -0.14 2.74 1.84 2.04
2005 -2.27 1.21 0.82 -0.45 -2.40 1.07 0.69 -0.59 -2.58 -1.43 -1.12 -1.92 -2.45 -0.82 -0.77 -1.59
2004 1.28 -0.57 4.48 8.60 1.15 -0.70 4.34 8.46 1.86 -3.33 3.28 8.50 1.95 -3.32 3.65 8.13
2003 6.93 7.83 2.57 7.63 6.79 7.69 2.43 7.49 3.11 3.88 1.97 5.21 3.53 4.55 2.03 5.25
2002 0.56 12.00 3.07 9.42 0.43 11.86 2.93 9.27 -1.61 11.65 3.87 4.73 -1.04 9.80 3.29 5.34
6.139.47
¹CWGBI = Citigroup World Government Bond Index (Unhedged) ²BlendedA = 90% CWGBI ; 5% ML High Yield ; 5% JPM Emrg Markets
Since
Inception*
(1/1/1998)
6.438.92
B lendedA ² Re tu rn (%)CW GB I¹ Re tu rn (%)
*Supplemental Information
Com posite Return Net of Fees (%)Com posite Return Gross of Fees (%)

Page 43
Global Fixed Income Investment-Grade Composite Disclosure
Organization: Brandywine Global Investment Management, LLC (the "Firm"), is a wholly owned, independently operated, subsidiary of Legg Mason, Inc. The Firm has prepared and presented this report in compliance with the Global Investment Performance Standards (GIPS®). For the periods July 1, 2000 through June 30, 2006, the Firm has been verified by Kreischer Miller. A verification includes assessing whether the Firm (1) complied with the composite construction requirements of the GIPS standards on a firm-wide basis, and (2) designed its processes and procedures to calculate and present performance results in compliance with the GIPS standards. Kreischer Miller has also performed an examination of the composite performance presentation from the composite Inception Date through June 30, 2006. A composite examination includes testing a specific composite in order to assess whether that composite’s performance presentation is presented, in all material respects, in conformity with the GIPS standards. Copies of the verification and composite examination reports are available upon request. Disclosed total firm assets represent the total market value of all discretionary and nondiscretionary, fee-paying and non-fee-paying assets under the Firm's management. Composite Description: Global Fixed Income Investment Grade Composite (the "Composite") Inception date: July 1, 1992. Creation date: July 1, 1992. The Composite includes all fully discretionary, fee-paying portfolios managed in the Global Fixed Income Investment Grade Strategy. The strategy invests only in U.S. and foreign investment grade fixed income securities from 8 - 12 countries. The minimum portfolio size for inclusion in the Composite is $3 million. The Composite utilizes over-the-counter forward exchange rate contracts to manage its currency exposure. These contracts are valued daily using closing forward exchange rates. Brandywine uses WM/Reuters daily FX rates taken at 4 p.m. London time. Benchmark indices' exchange rates may vary from Brandywine's exchange rates periodically. The Composite returns are benchmarked to the Citigroup World Government Bond Index (CWGBI) and Lehman Brothers Global Aggregate Index (LB Global Agg). The CWGBI measures the performance of developed countries' global fixed income markets invested in debt issues of U.S. and non-U.S. governmental entities. The LB Global Agg provides a broad-based measure of the global investment-grade fixed income markets by including agencies, corporates and asset backed issues. Performance Calculation: Preliminary data, if so noted, reflects unreconciled data for the most recent reporting period. Portfolios are valued daily on a trade date basis and include dividends and interest as well as all realized and unrealized capital gains and losses. Return calculations at the portfolio level are time-weighted to account for periodic contributions and withdrawals. Performance results are calculated on a before tax, total return basis. Prior to July 1, 2007, portfolios were included in the Composite beginning with the first full quarter of performance through the last full quarter of performance. After July 1, 2007, portfolios are included in the Composite beginning with the first full month of performance through the last full month of performance. The Composite returns consist of size-weighted portfolio returns using beginning of period values to weight the portfolio returns. Monthly linking of interim performance results is used to calculate quarterly and annual returns. Composite's valuations and returns are computed in U.S. Dollars ("USD"). The results are presented in USD or in other currencies (to accommodate overseas investors), the latter by converting monthly USD returns into other currency returns using the appropriate currency exchange rate returns. Gross returns reflect the deduction of trading expenses. Net of fee returns reflect the deduction of trading expenses and the highest investment management fees charged within the composite membership as stated in the fee schedule below. Composite dispersion is calculated using the asset-weighted standard deviation method for all portfolios that were in the Composite for the entire year. Composite dispersion is not presented for periods with five or fewer portfolios. The number of accounts and market values are as of the end of the period. Past performance is no guarantee of future results. A complete list describing the Firm's composites as well as any additional information regarding the Firm’s policies for calculating and reporting performance results is available upon request. As a result of our internal review process during the quarter ended September 30, 2007, the performance results shown reflect certain immaterial revisions to performance information previously reported by the Firm for periods through June 30, 2007. Fee Schedule: Institutional Client Separate Account Management Fee Schedule (minimum initial investment: $50 million): 0.450% on the first $50 million; 0.400% on the next $50 million, and 0.350% on any portion of assets in excess of $100 million. Institutional Client Commingled Account Management Group Trust Fee Schedule (minimum initial investment: $1 million): 0.550% flat fee on all assets. Institutional Client Commingled Account Management Global Investment Trust Fee Schedule (minimum initial investment: $1 million): 0.450% on the first $$50 million; 0.400% on the next $50 million, and 0.350% on any portion of the assets in excess of $100 million. Additional information on the Firm's fee schedule can be found in Form ADV Part II which is available upon request.
Source: Brandywine as at 31 March 2012

Page 44
Important Information
The Legg Mason Brandywine Global Fixed Income Fund is a sub-fund of Legg Mason Global Funds plc, an umbrella fund with segregated liability between sub-
funds, established as an open-ended investment company with variable capital and incorporated with limited liability under the laws of Ireland with registered number
278601. It qualifies, and is authorised in Ireland by the Central Bank of Ireland as an undertaking for collective investment in transferable securities and is a section 264
Scheme as recognised by the FSA.
This document does not constitute an invitation to invest. The value of investments and the income from them can go down as well as up and investors may not get
back the amounts originally invested. Fluctuations in exchange rates can affect the value of the Fund and the income from it.
This fund may invest in „non-investment grade‟ bonds, which carry a higher degree of default risk than „investment grade‟ bonds.
This information has been prepared from sources believed reliable but is not guaranteed by Legg Mason and is not a complete summary or statement of all available.
Opinions expressed are subject to change without notice and do not take into account the particular investment objectives, financial situation or needs of individual
investors.
This Fund is offered solely to non-US investors under the terms and conditions of the Fund‟s current prospectus – please refer to the Simplified Prospectus and
Prospectus documentation, which describe the full objective and risk factors associated with this Fund. Before investing you should carefully read the Prospectus.. The
prospectus, the simplified prospectus as well as the Memorandum and Articles of Association, the annual and semi-annual reports can be obtained free of charge from
the Swiss representative and paying agent, Banque Genevoise de Gestion SA, Rue Rodolphe-Toepffer 15, CH-1206 Geneva.
This document is aimed exclusively at Qualified Investors as defined by Art 10, Section 3 of the Swiss Collective Investment Schemes Act of 23 June 2006
(“CISA”) and must not be provided to, or used by retail investors. This information has been prepared from sources believed reliable but is not guaranteed by Legg
Mason Investments (Europe) Limited and is not a complete summary or statement of all available data. Opinions expressed are subject to change without notice and do
not take into account the particular investment objectives, financial situation or needs of individual investors.
Issued and approved by Legg Mason Investments (Europe) Limited, registered office 201 Bishopsgate, London EC2M 3AB. Registered in England and Wales,
Company No. 1732037. Authorised and regulated by the Financial Services Authority.
June 2012 P0116-CH
This document is aimed exclusively at Qualified Investors as defined by Art 10, Section 3 of the Swiss Collective Investment Schemes Actof 23 June 2006 (“CISA”) and must not be provided to, or used by retail investors.