bwg-p-09-22 revised testing and accreditation documents
TRANSCRIPT

Page 1 of 1
BWG-P-09-22
Revised testing and accreditation documents
This paper is provided for information and comment. It consists of a revised set of documents detailing testing procedures and accreditation of LCEBs which LowCVP commissioned Millbrook Proving Ground to produce based on the documents previously produced for the Low Carbon Bus programme.
Attached are the set of the revised documents detailing the testing and accreditation procedures for the Low Carbon Emission Bus programme. The set of testing and accreditation documents consist of the main document and four annexes for each of the types of driveline envisaged. These are:
Vehicle Accreditation Requirements Low Carbon Emission Bus
Annex A1 – Test Procedure for Measuring Fuel Economy and Emissions from Low Carbon Buses fitted with Conventional Powertrains.
Annex A2 – Test Procedure for Measuring Fuel Economy and
Emissions of Low Carbon Buses fitted with Charge Sustaining Hybrid Powertrains.
Annex A3 – Test Procedure for Measuring Fuel Economy and
Emissions of Low Carbon Buses fitted with Charge Depleting Hybrid Powertrains.
Annex A4 – Test Procedure for Measuring Fuel Economy and
emissions of Low Carbon Buses fitted with Pure Electric Drivelines. Attached are the complete set of documents with the exception of A1 which is awaiting confirmation from DfT as to how to treat biofuels.

LCEB ACCREDITATION GUILDLINES 07102009
1 of 11
Vehicle Accreditation Requirements
Low Carbon Emission Buses

LCEB ACCREDITATION GUIDELINES 07102009
Table of Contents Introduction 3 Scope 4 Definition of a Low Carbon Emission Bus 4 Low Carbon Technologies 4 Eligible Vehicles 4 Low Carbon Bus Emissions Requirements 4 Test Requirements 6 Eligible Test Centres 8 Test Fuel 9 Accreditation 9 Right of Suspension and/or Termination 9 Appendix 1 – Millbrook London Transport Bus (MLTB) Drive-Cycle 10 Appendix 2 – Low Carbon Bus CO2 emissions target line 11
2 of 11

LCEB ACCREDITATION GUIDELINES 07102009
Introduction In April 2009, the Department for Transport introduced a change to the Bus Service Operators Grant (BSOG) for bus operators using Low Carbon Emission Buses (LCEBs). From 1 April 2009, an additional payment of 6p per kilometre will be paid for all eligible kilometres (including dead kilometres) operated by LCEBs. This document sets out the requirements and conditions for manufacturers and converters of Low Carbon Emission Buses, that wish to certify a vehicle as having Low Carbon Emission Bus status i.e. for identification of a Vehicle Type for claiming the LCEB incentive under BSOG. A Vehicle Type is defined by its make, model and variant and by its powertrain and fuel system. In order to identify that a particular vehicle is eligible for the LCEB incentive, the vehicle’s manufacture will need to issue the bus operator with a certificate, certifying the vehicle as a LCEB based upon an independently witnessed emission test of a vehicle of the same type. Details of the certificate and the information it must provide can be obtained from the DfT and are contained in the document “Certification of a Low Carbon Emission Bus, Guidance for bus manufacturers” available from the DfT website www.dft.gov.uk/pgr/regional/buses/busgrants/bsog. To comply as a Low Carbon Emission Bus a vehicle must meet legislative and safety requirements and its emissions over a given test cycle must meet LCEB target. Approved vehicles and details of which companies are approved to supply them will be listed on the Low Carbon Emission Bus register at www.lowcvp.org.uk/lceb. An original certificate must be provided for every LCEB purchased by a bus operator. In addition to providing a copy of the certificate to the bus company, manufacturers should send a copy of all certificates they issue to the Department for Transport’s BSOG Administration team and to the LowCVP at the following addresses: BSOG Administration Department for Transport Room F14, Ashdown House Sedlescombe Road North St Leonards on Sea East Sussex TN37 7GA
The Low Carbon Vehicle Partnership 83 Victoria Street London SW1H 0HW
3 of 11

LCEB ACCREDITATION GUIDELINES 07102009
Scope This document sets out the requirements and conditions that must be met by providers of Low Carbon Emission Bus technologies that wish to certify a vehicle as a Low Carbon Emission Bus. Definition of a Low Carbon Emission Bus The specific definition of a Low Carbon Bus is as follows: “A Low Carbon Bus produces at least 30% fewer Greenhouse Gas Emissions than a current Euro 3 equivalent diesel bus of the same total passenger capacity. The Greenhouse Gas (GHG) emissions will be expressed in grams of carbon dioxide equivalent measured over a standard test, and will cover “Well-to-Wheel” (WTW) performance, thereby taking into account both the production of the fuel and its consumption on board”. The principal Greenhouse Gases (GHG) of interest are Carbon Dioxide (CO2) Methane (CH4) and Nitrous Oxide (N2O). The relative “global warming potentials” for these 3 gases are 1:21:310 respectively. Low Carbon Technologies The probable means of producing a Low Carbon Emission Bus is by one of the following, either individually or in combination: a) Use of a rechargeable energy storage system (RESS) to augment the primary power produced
by an internal combustion engine e.g. diesel-electric hybrid. This may be either charge sustaining or charge depleting.
b) Electric drive vehicles using a sustainable source of electricity. c) Use of fuels that are inherently low in greenhouse gases e.g. Rapeseed Methyl Ester (RME) d) Use of fuel cells using sustainable sources of Hydrogen. Eligible Vehicles These guidelines apply to OEM vehicles, OEM approved and warranted conversions, and after-market conversions. All road-licensed buses complying with Directive 2001/85/EC Classes I and II (from 22 passenger capacity and upwards) may apply for Low Carbon Bus approval.
Low Carbon Bus Emissions Requirements The LowCVP Bus Working Group has defined the target to be met to achieve Low Carbon Emission Bus status. This is shown in Appendix 2. Target fulfilment must include an objective test
4 of 11

LCEB ACCREDITATION GUIDELINES 07102009
of vehicle performance. The test will be carried out on a whole vehicle chassis dynamometer to determine “Tank-to-Wheel” (TTW) emissions and energy consumption. The gas values of methane and nitrous oxide, if measured, will be converted to carbon dioxide equivalent by applying the weightings given earlier. The whole vehicle emissions results will be used to calculate the GHG emissions performance of the vehicle on a WTW basis appropriate to the fuel as used in the approval test and as used in service. “Well-to-Tank” (WTT) emissions and energy consumption will be determined using an appropriate analysis such as those carried out by CONCAWE or by L-B-Systemtechnik GmbH or similar body, subject to approval by the Fuels Working Group of LCVP. The results are expressed in grams of carbon dioxide equivalent per MJ of fuel delivered. Knowing the fuel consumption of a vehicle in MJ/km, the WTT GHG figure can be expressed in g/km. WTW emissions and energy consumption will be determined from the sum of TTW and WTT performance with greenhouse gas emissions expressed as grams of carbon dioxide equivalent per kilometre and energy consumption expressed as MJ per kilometre. Both measures will be assessed against passenger carrying capacity. In order to be accredited as a “Low Carbon Emission Bus”, vehicles must have GHG emissions either on the target line, or below that determined for their passenger carrying capacity. The target line will be used to accredit the bus in “worse case” condition i.e. at the minimum payload corresponding to its CO2 equivalent emissions performance. Buses found to have CO2 equivalent emissions higher than that corresponding to its passenger capacity will not be afforded Low Carbon Bus status. To qualify as a Low Carbon Emission Bus, the vehicle must be certified as a PCV and have a Certificate of Fitness. The whole vehicle emissions when tested on an appropriate chassis dynamometer to LowCVP Low Carbon Bus test requirements must be reported. Low Carbon Emission Bus status will be conferred on all vehicles similar to those presented for test, as long as the vehicles use similar fuels and energy management strategies Whole vehicle testing The test cycle used will be the Millbrook London Transport Buses (MLTB) cycle based on Route 159 in London. This is described in Appendix 1. In the case of vehicles fitted with internal combustion prime movers, both GHG and air quality emissions (HC, CO, NOx and PM) will be determined over the cycle by use of a full-flow constant volume sampling (CVS) system and appropriate analysis equipment. Fuel consumption will be derived from carbon dioxide and other carbon containing emissions by the carbon-balance method. In the case of vehicles fitted with catalysed particulate traps, Selective Catalytic Reduction (SCR) systems, or those powered by lean-burn natural gas engines NOx speciation will be carried out by use of Fourier Transfer Infra-red Spectroscopy (FTIR) The Low Carbon Emission Bus Target Line is shown in Appendix 2. Green House Gas emissions are defined against total passenger capacity by the following linear relationship:
CO2 (WTW) = 6.0 × total number of passengers + 480 The mass of a passenger is defined as 63 kg.
5 of 11

LCEB ACCREDITATION GUIDELINES 07102009
The mass of the vehicle in running order will be determined by weighing each bus prior to test. The mass of the vehicle in running order is defined in Directive 97/27/EC as: The mass of an unladen vehicle with bodywork, and with coupling device in the case of a towing vehicle, in running order, or the mass of the chassis with cab if the manufacturer does not fit the bodywork and/or coupling device ( including coolant, oils, 90% of fuel, 100% of other liquids except used waters, tools, spare wheel, driver (75kg), and, for buses and coaches, the mass of the crew member (75 kg) if there is a crew seat in the vehicle). For the purposes of these guidelines the mass of a bus in running order is defined as: The mass of the unladen vehicle with bodywork, in running order, ( including coolant, oils, 90% of fuel, 100% of other liquids except used waters, tools, spare wheel [if carried] and driver (75kg), and the mass of the crew member (75 kg) if there is a crew seat in the vehicle). Total passenger capacity will be calculated by subtracting the measured “mass in running order” from the manufacturer’s declared plated gross vehicle weight (GVW) and dividing by 63. Any differences between the calculated passenger capacity and that declared by the bus manufacturer/supplier will be discussed between the technical service carrying out the test and the manufacturer. The specific test requirements for vehicles will be dependent on the type of powertrain technology employed and is described below Test Requirements Vehicles fitted with conventional powertrain drivelines The test requirements are described in Annex A1 – Test Procedure for Measuring Fuel Economy and Emissions from Low Carbon Buses fitted with Conventional Powertrains. The test is required, in essence, to be repeated 3 times and an average of the three valid tests presented for accreditation. For the tests to be valid the CO2 emissions must be within 5% across all three tests. Annex A1 includes associated appendices as follows: Appendix 1: MLTB Drive cycle Appendix 2: Well-to-Wheel calculations Appendix 3: Passenger capacity vs. Greenhouse Gas Emissions (CO2 equivalence) Appendix 4: Essential characteristics of the vehicle powered by an internal combustion engine
only and information concerning the conduct of the test Appendix 5: Test report and Approval
6 of 11

LCEB ACCREDITATION GUIDELINES 07102009
Vehicles fitted with charge sustaining hybrid powertrain incorporating a rechargeable energy storage system (RESS) The test requirements are described in Annex A2 – Test Procedure for Measuring Fuel Economy and Emissions of Low Carbon Buses fitted with Charge Sustaining Hybrid Powertrains. For vehicles fitted with hybrid powertrains the state of charge of the RESS may be different at the end of the test cycle to that at the start of the test cycle. This must be considered when determining pollutant emission levels and energy use. If the Net Energy Change (NEC) of the RESS is less than 1% of total energy used over the cycle, then the emissions and energy consumption test results can be used without correction. If the NEC is greater than 1% a method of correction for change in state of charge (SOC) of the RESS during the test must be employed. Appropriate data i.e. RESS SOC, energy inflow/outflow shall be provided from the vehicle’s energy management system on a second-by-second basis during the test. This is analysed to provide a correction for emissions and fuel consumption at an equivalent zero change of SOC. This requires a minimum of three valid tests to be presented. For a test to be valid, the NEC over the drive cycle must be less than 5% of total energy used over the cycle. Tests with NEC of greater than 5% will be considered invalid. Annex A2 includes associated appendices as follows: Appendix 1: MLTB Drive cycle Appendix 2: Well-to-Wheel calculations Appendix 3: Passenger capacity vs. Greenhouse Gas Emissions (CO2 equivalence) Appendix 4: Essential characteristics of the vehicle powered by a charge sustaining hybrid
powertrain and information concerning the conduct of the test Appendix 5: Test report and Approval Vehicles fitted with charge depleting hybrid powertrain incorporating a rechargeable energy storage system (RESS) The test requirements are described in Annex A3 – Test Procedure for Measuring Fuel Economy and Emissions of Low Carbon Buses fitted with Charge Depleting Hybrid Powertrains.
Tailpipe mass emissions from charge-depleting hybrid vehicles are likely to be less than those of charge-sustaining hybrid vehicles because charge-depleting hybrid vehicles draw down the stored energy of the RESS, which means less energy is provided by the prime mover. Therefore, to provide a true accounting of the emissions and fuel economy of the vehicle, emissions and energy associated with consumed electricity generation for the RESS must be accounted for.
After conducting a test run, the energy required (kilowatt-hours) to recharge the RESS to the SOC at the beginning of the test run must be measured at the wall meter upstream from the vehicle charger. The energy consumed is then divided by the total distance traveled by the vehicle over the test run as noted by the dynamometer or the target cycle distance, whichever is lower. The resulting energy input (kilowatt-hours per kilometre) is then assigned a CO2 generation value determined from the generation mix appropriate to the supply. This generation value will be added to the CO2 results determined directly from the vehicle test. The test is required, in essence, to be repeated 3 times and an average of the three valid tests presented for accreditation. For the tests to be valid the total CO2 emissions must be within 5%
7 of 11

LCEB ACCREDITATION GUIDELINES 07102009
across all three tests. Annex A3 includes associated appendices as follows: Appendix 1: MLTB Drive cycle Appendix 2: Well-to-Wheel calculations Appendix 3: Passenger capacity vs. Greenhouse Gas Emissions (CO2 equivalence) Appendix 4: Essential characteristics of the vehicle powered by a charge depleting hybrid
powertrain and information concerning the conduct of the test Appendix 5: Test report and Approval Vehicles fitted with pure electric drivelines The test requirements are described in Annex A4 – Test Procedure for Measuring Fuel Economy and emissions of Low Carbon Buses fitted with Pure Electric Drivelines. Starting from a known RESS SOC (normally 100% of standard operating SOC), the vehicle is driven over two complete drive cycles. After conducting a test run, the energy required (kilowatt-hours) to recharge the RESS to the SOC at the beginning of the test run must be measured at the wall meter upstream from the vehicle charger. The energy consumed is then divided by the total distance travelled by the vehicle over the test run as noted by the dynamometer or the target cycle distance, whichever is lower. The resulting energy input (kilowatt-hours per kilometre) is then assigned a CO2 generation value determined from the generation mix appropriate to the supply. Annex A4 includes associated appendices as follows: Appendix 1: MLTB Drive cycle Appendix 2: Well-to-Wheel calculations Appendix 3: Passenger capacity vs. Greenhouse Gas Emissions (CO2 equivalence) Appendix 4: Essential characteristics of the vehicle powered by a pure electric powertrain and
information concerning the conduct of the test Appendix 5: Test report and Approval Alternative drive cycles The test must use either the Millbrook London Transport Bus (MLTB) test cycle, based on Route 159 in London, or an equivalent alternative test cycle. If an alternative test cycle is used, it must be based on a similar average speed as the MLTB test and have similar number of stops per kilometre. Any non-MLTB test must be approved in the advance by the Department for Transport. This issue will be discussed with the Low Carbon technology provider and the test cycle will be defined prior to any test work.
Eligible Test Centres Performance and emissions testing of Low Carbon Buses must be carried out by a vehicle testing agency that is acceptable to the Type Approval Authority of an EU Member State.
8 of 11

LCEB ACCREDITATION GUIDELINES 07102009
Test Fuel
Composition Emissions tests for vehicles running on conventional diesel will use commercial low-sulphur, ultra-low sulphur or sulphur-free diesel complying with BS EN590 2000. Emissions tests for vehicles running on natural gas must use “Reference Fuel G25” as defined in Annex IX of Directive 98/69/EC. Emissions tests for vehicles running on LPG must use “Reference Fuel B” as defined in Annex IX of Directive 98/69/EC. For vehicles running on bio-diesel or other “alternative fuels”, the fuel specification and composition will be declared prior to the test. In order to determine Well-to-Tank GHG emissions, the fuel pathway must be known and the appropriate GHG value agreed for the method of extraction/production. Fuel sampling A sample of the test fuel will be obtained from the vehicle immediately prior to testing on the chassis dynamometer
Accreditation
Information contained within Appendices 4 and 5 of the test procedure appropriate for the type of powertrain employed will be retained by the technology provider and maybe required to be presented to officials from the DfT as part of an audit of BSOG claims. Copies should also be sent to the LowCVP.
Right of Suspension and/or Termination DfT reserves the right to suspend for such period as it thinks fit, or terminate, the Low Carbon Emission Bus status of any product (and having done so, to remove the product in question from the Low Carbon Emission Bus Register) by sending notice in writing to the relevant Company at any time if any of the information provided by or on behalf of the Company in support of its application for Vehicle Approval status is found to be inaccurate or untrue
9 of 11

LCEB ACCREDITATION GUIDELINES 07102009
Appendix 1 – MILLBROOK LONDON TRANSPORT BUS (MLTB) DRIVE-CYCLE This test cycle was specifically developed for use with buses and was derived from data logged from a bus in service within inner London. The drive cycle consists of two phases, a medium speed ‘Outer London’ phase simulating a journey from Brixton Station to Trafalgar Square and a low speed ‘Inner London’ phase simulating a journey from Trafalgar Square to the end of Oxford Street. The cycle is composed of two phases: (1) Outer London Phase, nominal distance 6.45 km, 1,380 seconds in duration (2) Inner London Phase, nominal distance 2.47 km, 901 seconds duration
0
10
20
30
40
50
60
0 200 400 600 800 1000 1200 1400 1600 1800
Test Time (secs)
General information The overall length of the test is 2,281 seconds and the nominal distance covered is 8.92 km. Test cell ambient temperature for duration of test = 18C 2C
10 of 11

LCEB ACCREDITATION GUIDELINES 07102009
11 of 11
Appendix 2 - Low Carbon Bus CO2 emissions target line
0
500
1000
1500
2000
2500
0 20 40 60 80 100 120 140 160
Total passenger capacity
CO
2 (g
/km
)
Low Carbon Bus target line - 30% lower than E3
Euro 3 CO2 emissions trendline -Route 159 drive

Annex_A2
Annex A2: Test Procedure for Measuring Fuel Economy and Emissions of Low Carbon Emission Buses Powered by Charge Sustaining Hybrid Powertrains
1 of 28

Annex_A2
2 of 28
TABLE OF CONTENTS
1 Scope 2 Definitions and Terminology 3 State of Charge – Charge-Sustaining Hybrid Vehicles 3.1 SOC Terminology 3.2 Net Energy Change (NEC) 3.3 Determining NEC Variance 3.4 Determination Procedure 3.5 SOC Correction Procedure 3.6 SOC Correction Example 4. Test Preparations 4.1 Test Site 4.2 Pre-Test Data Collection 4.3 Operation of the vehicle 4.4 Condition of the Vehicle 4.5 Conditioning of Rechargeable Energy Storage System 4.6 Dynamometer Specifications 4.7 Dynamometer Calibrations 4.8 Inertial Load 4.9 Road Load 4.10 Dynamometer Load Coefficient Determination 4.11 Dynamometer Settings 4.12 Test Instrumentation 5. Test Procedure 5.1 Vehicle Propulsion System Starting and Restarting 5.2 Dynamometer Driving Procedure 5.3 Dynamometer Warm-up 5.4 Practice and Warm Up Runs 5.5 Emission Tests 5.6 Test Termination 5.7 Air Conditioning 5.8 Data Recording 5.9 State of Charge 5.10 Deviations from Standard Procedure 6. Test Validation 7. Reporting Appendix 1: Millbrook London Transport Bus (MLTB) Drive Cycle Appendix 2: Well-to-Wheel Calculations Appendix 3: Passenger Capacity vs. Greenhouse Gas Emissions (CO2 equivalent) Appendix 4: Essential Characteristics of the Vehicle powered by a Charge
Sustaining Hybrid Powertrain Appendix 5: Test Report and Approval
Annex_A2
1. Scope This document provides an accurate and reproducible procedure for simulating the operation of buses powered by charge sustaining hybrid powertrains on dynamometers for the purpose of measuring emissions and fuel economy. A hybrid vehicle is defined as having both a rechargeable energy storage system (RESS) capable of releasing and capturing energy and an energy-generating device that converts consumable fuels into propulsion energy. This procedure specifically includes batteries, capacitors and flywheels, although other types of RESS can be evaluated by following the guidelines provided. The procedure also provides a detailed description of state of charge (SOC) correction for charge-sustaining HEVs in order to correct for changes that occur over the length of the test. It should be noted that most buses addressed in this recommended practice are expected to be powered by engines that are certified separately for emissions. In these cases the engine certification procedure appears in Regulation 77/88/EC. This test procedure does not make specific provisions or recommendations for testing of bus emissions with air conditioning deployed because the complexity of such tests is significant. All auxiliary loads will be turned off during the test, unless they affect the normal operation of the vehicle. The intention is to test the vehicle in it's normal road-going condition and operating strategy as far as reasonably practical, within the constraints of the equipment and cycle. Potential exceptions to this include antilock brakes and traction control. Any aspect of vehicle operation which needs to be modified for the test shall be discussed with the test centre and recorded in the test report. The procedure requires the calculation of Well-to-Wheel (WTW) Greenhouse Gas (GHG) emissions in order to determine if the vehicle qualifies as a Low Carbon Emission Bus. The vehicle will be tested over the Millbrook London Transport Bus (MLTB) drive cycle representing intermediate-speed bus operation in London. Details of this cycle can be found in Appendix 1 of this document. Regulated emissions (HC, CO, NOx and PM) and carbon dioxide shall be sampled over the entire cycle and the results presented as gm/km. For all buses, the concentration of nitrous oxide (N2O) shall be determined using Fourier Transfer Infra-Red spectroscopy (FTIR) techniques. For all buses, the concentration of methane (CH4) shall be determined by separate analysis.
3 of 28

Annex_A2
2. Definitions and Terminology BATTERY -- A device that stores chemical energy and releases electrical energy. BATTERY C/3 CURRENT RATE -- The constant current (Amperes) at which the battery can be discharged from its rated capacity in three hours to its manufacturer’s recommended minimum. Battery manufacturers typically provide ratings from C/1 to C/6. These ratings have no direct impact on this recommended practice. BATTERY DEPTH OF DISCHARGE (DOD) -- The percentage of rated capacity to which a cell/battery is discharged. State of charge (SOC) % + DOD% = 100%. BATTERY RATED AMPERE-HOUR CAPACITY -- The manufacturer-rated capacity of a battery in Ampere-hours, obtained from a battery discharged at the manufacturer’s recommended discharge rate (C/1 - C/6) such that a specified minimum cut-off terminal voltage or state of charge is reached. BATTERY STATE OF CHARGE (SOC) – Based on the actual measured energy content of a battery and expressed in Ampere hours, or as a percentage of the battery’s maximum rated Ampere hour (Ah) capacity. CAPACITOR -- A device that stores energy electrostatically and releases electrical energy. CAPACITOR STATE OF CHARGE (SOC) – Based on the actual measured energy content of a capacitor and expressed as a percentage of the capacitor’s maximum rated voltage squared (V2). CHARGE-SUSTAINING HEV -- A charge-sustaining HEV derives all of its energy from on board fuel under normal usage. Over a short period of time charge-sustaining hybrid-electric vehicles may be either charge depleting or charge increasing. The definition means that that in the long term (24 hours) a RESS charge is sustained. The procedure includes provisions for calculating SOC corrections in the short term that reflect emissions from the vehicle as if it was charge sustaining in the short term. CONSUMABLE FUEL -- Any solid, liquid, or gaseous material that releases energy and is depleted as a result. ELECTROMECHANICAL FLYWHEEL -- A device that stores rotational kinetic energy and can release that kinetic energy to drive the vehicle, either directly, or via an electric motor-generator system. ELECTROMECHANICAL FLYWHEEL STATE OF CHARGE (SOC) – Based on the actual measured energy content of an electromechanical flywheel and expressed as a percentage of the flywheel’s maximum-rated revolutions per minute squared (rpm2). HYBRID-ELECTRIC VEHICLE (HEV) -- A road vehicle that can draw propulsion energy from both of the following on-vehicle sources of stored energy: 1) one consumable fuel and 2) one (or more) RESS that is recharged by an on-board electric generating system, or an off-board charging system, or recovered kinetic energy. NET ENERGY CHANGE (NEC) -- The net change in energy level of an RESS expressed in Joules (watt-seconds), or as a percentage of the Total Cycle Energy.
4 of 28

Annex_A2
PRIME MOVER – Power unit which provides the primary source of mechanical energy used to move the vehicle PROPULSION ENERGY -- Energy that is derived from the vehicle’s consumable fuel and/or rechargeable energy storage system to drive the wheels. If an energy source is supplying energy only to vehicle accessories (e.g., a 12-volt battery on a conventional vehicle), it is not acting as a source of propulsion energy. PROPULSION SYSTEM -- A system that, when started, provides propulsion for the vehicle in an amount proportional to what the driver commands. REGENERATIVE BRAKING -- Deceleration of the vehicle caused by operating an energy recovery system, thereby returning energy to the vehicle propulsion system and providing charge to the RESS or to operate on-board auxiliaries. RECHARGEABLE ENERGY STORAGE SYSTEM (RESS) -- A component or system of components that stores energy and for which its supply of energy is rechargeable by an electric motor-generator system, an off-vehicle electric energy source, or recovered kinetic energy, or a combination of thereof. Examples of RESS for HEVs include batteries, capacitors, and electromechanical flywheels. STATE OF CHARGE – see “Battery state of charge” TOTAL CYCLE ENERGY -- The total energy expended by the vehicle in driving the test cycle. This is equal to the Total Fuel Energy minus the RESS Net Energy Change in Joules. TOTAL FUEL ENERGY -- The total energy content of the fuel in MJ consumed during a test as determined by carbon balance or other acceptable method and calculated based on the lower heating value of the fuel.
5 of 28

Annex_A2
3. State of Charge – Charge-Sustaining Hybrid Vehicles When a conventional vehicle completes a chassis dynamometer test, the energy provided by the combustion engine is equal to the total energy necessary to complete the cycle, and this value is consistent from test run to test run. There is no energy storage on board the vehicle other than consumable fuel, and no need for state of charge (SOC) correction. However, in a Hybrid Electric Vehicle (HEV), for example, a significant amount of motive energy is stored on board the vehicle within the RESS, and the vehicle may remove or add energy to this energy reservoir over short periods of time. In order to compare the emission results of an HEV to a conventional vehicle, the data from the HEV must be corrected so that the net change in RESS energy is essentially zero (i.e., all of the energy and emissions are essentially provided by the Prime Mover). This procedure allows for some level of tolerance between the initial SOC and final SOC to avoid correcting the fuel economy and emission results unnecessarily. A net energy change of 1% or less in stored energy, compared to total cycle energy, is considered negligible and does not require SOC correction calculations. If the percentage change is greater than 1% but less than 5%,a correction procedure can be applied, providing a clear relationship between NEC and emissions and fuel economy can be established. This procedure is outlined below in Section 3.4. If the vehicle has a NEC greater than 5%, the collected data may not be reliably corrected and the test should be considered invalid. If a vehicle repeatedly produces test results where the NEC is above 5% then it should be considered to be a charge depleting hybrid and tested according to the procedure in Annex A3.
3.1 SOC Terminology The following terms are used to distinguish between the different values of SOC referred to in the test procedure.
SOCinitial : SOC at the beginning of the test run (Ah, V2 or rpm2) SOCfinal : SOC at the end of the test run (Ah, V2 or rpm2) SOCdelta Change in SOC measured during a test
NEC calculations are presented in Joules (watt-seconds).
3.2 Net Energy Change (NEC) Provision should be made for recording the RESS SOC at the start and stop of each test run, although in practice this is not always achievable. It is therefore essential that second by second logging of energy flows in and out of the RESS be carried out for the duration of each test run. For each different vehicle and test cycle a minimum of three test runs must be performed to provide sufficient data for a SOC correction, if needed. It is also desirable that at least one test run have a net positive and another a net negative NEC value so that net SOC calculations are based on interpolation and not extrapolation. Since different types of RESS store energy differently, each type of RESS will use different equations to define NEC. The following section gives the NEC calculations for batteries, capacitors and electro-mechanical flywheels. The appropriate calculations for NEC where other types of RESS are fitted must be determined as necessary on a case by case basis.
6 of 28

Annex_A2
BATTERIES
Equations 1(a) and 1(b) calculate the NEC for batteries.
NEC = [SOCfinal – SOCinitial] * Vsystem * K1 (Equation 1a) where: Vsystem = Battery’s DC nominal system voltage as specified by the
manufacturer, in volts (V) K1 = Conversion factor = 3600 (seconds/hour) (not used if
SOCfinal and SOCinitial values are in Ampere-seconds) or, NEC = [SOCdelta] * Vsystem * K1 (Equation 1b) where: Vsystem = Battery’s DC nominal system voltage as specified by the
manufacturer, in volts (V) K1 = Conversion factor = 3600 (seconds/hour) (not used if
SOCfinal and SOCinitial values are in seconds)
CAPACITORS
Equation 2 calculates NEC for capacitors.
NEC = (C/2) * [SOCfinal – SOCinitial] (Equation 2) where: C = Rated capacitance of the capacitor as specified by the
manufacturer, in Farads (F)
ELECTROMECHANICAL FLYWHEELS
Equation 3 calculates NEC for electromechanical flywheels. NEC = (1/2) * I * [SOCfinal – SOCinitial] * K2 (Equation 3) where: I = Rated moment of inertia of the flywheel system, in
kilogram-meter2 (kg/m2) K2 = Conversion factor = 42/3600 (rad2/sec2/rpm2)
3.3 Determining NEC Variance
TOTAL CYCLE ENERGY
This procedure uses total cycle energy to determine NEC tolerances, as opposed to total fuel energy, which can vary from test run to test run. To remain consistent with the calculations for NEC, either the total cycle energy must be reported in watt-seconds or the NEC must be converted to kWh.
7 of 28

Annex_A2
Total Cycle Energy = Total Fuel Energy – NEC (Equation 4)
Total fuel energy is the energy value of the fuel consumed by the internal combustion engine during the test and is calculated as shown in equation 5.
Total Fuel Energy = NHVfuel * mfuel (Equation 5)
where NHVfuel = Net heating value in Joules per kilogram (J/kg)
mfuel = Total mass of fuel consumed over test, in kilograms (kg)
3.4 Determination Procedure To determine if a test run has an acceptable NEC that does not require SOC correction, divide NEC, in Joules, by total cycle energy. If the absolute value of the calculation yields a number less than or equal to 1%, as shown in equation 6, then the NEC variance is within tolerance levels and the emissions and fuel economy values for that test run do not need to be corrected.
(Equation 6)
NEC total cycle energy * 100% < 1%
If the absolute value of the calculation yields a number greater than 1%, but less than or equal to 5%, as shown in equation 7, then the emission and fuel economy values from the test run need to be corrected for SOC as described below. Test runs with NEC variance greater than 5% are considered invalid, or, if the vehicle is consistently charge depleting, may have to be tested under the charge-depleting vehicle recommendations. (Equation 7)
3.5 SOC Correction Procedure In order to calculate the state of charge correction for each emission species and for fuel economy, the emission and fuel economy values for each run must be plotted against the NEC for each run. A linear interpolation (in some cases extrapolation may be allowed) is then performed to establish the fuel economy or emissions at a NEC of zero.
3.6 SOC Correction Example
A worked example from a test on a diesel-electric series hybrid bus is provided in Appendix 2. This shows the correction factor applied due to NEC variation and calculates CO2 emissions on a Well-to-Wheel basis.
ACCURACY COMBINED WITH SOC CORRECTION
On a hybrid vehicle, NEC values approaching 5% of the total cycle energy can result in emission data that varies significantly from the zero NEC case. This is because the vehicle was propelled by energy that is not accounted for. The only way to determine acceptable values is to correct the data using the SOC correction procedure. Because
NEC total cycle energy * 100% < 5% 1% <
8 of 28

Annex_A2
the SOC correction procedure effectively turns multiple test values into a single value, the coefficient of determination, R2, of the linear best fit is used to determine whether the collected data is valid. For the purposes of this procedure the data is considered acceptable if the R2, which compares the predicted and actual values of the linear regression, is equal to or greater than 0.80.
9 of 28

Annex_A2
4. Test Preparations
4.1 Test Site The ambient temperature levels encountered by the test vehicle shall be maintained at 18C 2C throughout the test Ambient temperatures must be recorded at the beginning and end of the test period. Test conditions specified in 70/220/EEC and 77/88/EEC shall apply, where appropriate. Adequate test site capabilities for safe venting and cooling of batteries, containment of flywheels, protection from exposure to high voltage, or any other necessary safety precaution shall be provided during testing. One or more speed tracking fans shall direct cooling air to the vehicle in an attempt to maintain the engine operating temperature as specified by the manufacturer during testing. These fans shall only be operating when the vehicle is in operation and shall be switched off for all key off dwell periods. Fans for brake cooling can be utilized at all times. Additional fixed speed fans should be used if required and must be documented in the test report.
4.2 Pre-Test Data Collection Prior to testing, detailed characteristics of the vehicle should be recorded. These requirements are specified in Appendix 4 of this Annex. The chassis test laboratory will be used to measure actual cycle distance during a test, as it is generally considered a more accurate method of calculation; as a result, an odometer on the vehicle is not required. For all tests, a fuel sample shall be taken for potential analysis at a later date. The vehicle will be tested using the fuel with which it arrives at the test facility. Fuels should meet the requirements of EN590 and any exceptions to this should be advised by the vehicle manufacturer for reporting purposes. 4.3 Operation of the vehicle If the vehicle is capable of several operating modes (e.g. delivery, electric-only, limp-home, normal, etc.), and these can be selected by the driver then it shall be operated in the most appropriate mode for the drive cycle. This mode shall be decided by the manufacturer and recorded in the test report. If the vehicle is unable to be driven on the chassis dynamometer in a conventional operating mode then the reasons for this should be provided by the manufacturer in advance of the tests for reporting purposes. Any deviations from standard operation must be approved by the LowCVP prior to the issue of a LCEB certificate (where appropriate).
10 of 28

Annex_A2
4.4 Condition of the Vehicle Vehicle Stabilization -- Prior to testing, the vehicle shall be stabilized to a minimum distance of 3000km. This will be documented in the test report. Vehicle Test Weight -- Buses shall be tested at curb weight plus driver weight (75kg) and one quarter of the specified total passenger load using a weight of 63 kg per passenger. The curb weight of the vehicle shall be determined prior to test by the technical service carrying out the test. For buses which have previously been tested for Transport for London bus approval, this procedure can be followed retrospectively. In this case, the change in CO2 emissions due to the difference between the LCEB test inertia and the TfL test inertia shall be calculated using the following equation.
ΔCO2 = 0.0637 * ΔTI (Equation 8) where: ΔTI = Difference in test inertia, in kilograms (kg) Tyres -- Manufacturer’s recommended tyres shall be used and shall be the same size as would be used in service This will be documented in the test report. Tyre Pressure -- For dynamometer testing, tyre pressures should be set at the beginning of the test to manufacturer’s recommended pressure. This will be documented in the test report. Lubricants -- The vehicle lubricants normally specified by the manufacturer shall be used. This specification shall be supplied by the manufacturer in advance of the tests and recorded in the test report. Gear Shifting – The vehicle shall be driven with appropriate accelerator pedal movement to achieve the time versus speed relationship prescribed by the drive cycle. Both smoothing of speed variations and excessive acceleration pedal perturbations are to be avoided and may cause invalidation of the test run. In the case of test vehicles equipped with manual transmissions, the transmission shall be shifted in accordance with procedures that are representative of shift patterns that may reasonably be expected to be followed by vehicles in use. Vehicle Preparation & Preconditioning -- as a minimum, should include: The vehicle should be preconditioned using a complete run of the test cycle
followed by the appropriate key off dwell period (see Appendix1) Initial SOC setting (if necessary)
4.5 Conditioning of Rechargeable Energy Storage System RESS Failure -- In the event that the RESS is damaged or has an energy storage capability below the manufacturer’s specified rating, the RESS shall be repaired or replaced and stabilized, and then the test procedure should be repeated. Data from tests with a faulty RESS shall be considered invalid. The RESS must have undergone a minimum of 300km of vehicle operation prior to the test to allow for initial 'running-in' and shakedown.
11 of 28

Annex_A2
4.6 Dynamometer Specifications The evaluation of the emissions and fuel economy from a low carbon bus powered by hybrid powertrain should be performed using a laboratory that incorporates a chassis dynamometer, a full-scale dilution tunnel, and laboratory-grade exhaust gas analyzers as described in 70/220/EEC (Light-duty vehicles) and 88/77/EC (Heavy-duty engines). The chassis dynamometer should be capable of simulating the transient inertial load, aerodynamic drag and rolling resistance associated with normal operations of the vehicle. The transient inertial load should be simulated using appropriately sized flywheels and/or electronically controlled power absorbers. The aerodynamic drag and rolling resistance may be implemented by power absorbers with an appropriate computer control system. The drag and rolling resistance should be established as a function of vehicle speed. The actual vehicle weight for the on-road coast down should be the same as the anticipated vehicle testing weight as simulated on the dynamometer. The vehicle should be mounted on the chassis dynamometer so that it can be driven through a test cycle. The driver should be provided with a visual display of the desired and actual vehicle speed to allow the driver to operate the vehicle on the prescribed cycle.
4.7 Dynamometer Calibrations The dynamometer laboratory should provide evidence of compliance with calibration procedures as recommended by the manufacturer.
4.8 Inertial Load Inertial load must be simulated correctly from a complete stop (e.g., total energy used to accelerate the vehicle plus road and aerodynamic losses should equal theoretical calculations and actual coastdowns). For HEVs this may be determined by measuring the power delivered to the dynamometer at the drive motors. 4.9 Road Load Road load and wind losses should be simulated by an energy device such as a power absorber. Road load should be verified by comparison to previously tested vehicles having similar characteristics or by coastdown analysis on the track.
4.10 Dynamometer Load Coefficient Determination The dynamometer coefficients that simulate road-load forces shall be determined as specified in Directive 70/220/EEC, with the following provisions:
a) Vehicles equipped with regenerative braking systems that are actuated only by the brake pedal shall require no special actions for coastdown testing on both the test track and dynamometer.
b) Vehicles equipped with regenerative braking systems that are activated at
least in part when the brake pedal is not depressed shall have regenerative braking disabled during the deceleration portion of coastdown testing on both the test track and dynamometer, preferably through temporary software changes in the vehicle’s control system. Mechanical changes to the vehicle to deactivate regenerative braking (such as completely removing the drive shaft) are discouraged. However, if this practice becomes necessary as a last resort, every safety precaution shall be taken during vehicle operation, and the same mechanical modifications shall occur on both the test track and
12 of 28

Annex_A2
dynamometer. Methods to accelerate a vehicle without a drive shaft on both the test track and the dynamometer shall be determined by the manufacturer. However, pushing the vehicle with another vehicle is not an option.
c) The vehicles shall be weighted to the correct dynamometer test weight when
the on road coastdowns are performed.
4.11 Dynamometer Settings The dynamometer’s power absorption and inertia simulation shall be set as specified in 70/220/EEC. It is preferable to insure that the dynamometer system provides the appropriate retarding force at all speeds, rather than simply satisfying a coastdown time between two specified speeds. The remaining operating conditions of the vehicle should be set to the same operating mode during coastdowns on road and on the dynamometer (e.g., air conditioning off, etc).
4.12 Test Instrumentation Equipment referenced in 70/220/EEC and 88/77/EC (including exhaust emissions sampling and analytical systems) is required for emissions measurements, where appropriate. All instrumentation shall be traceable. to national standards. The following instruments are likely to be required for determination of change of SOC on an as-needed usage. DC wideband Ampere-hour meter: Any meter using an integration technique
shall have an integration frequency of 10Hz or higher so that abrupt changes of current can be accommodated without introducing significant integration errors.
An instrument to measure a capacitor’s voltage An instrument to measure an electromechanical flywheel’s rotational speed AC Watt-hour meter to measure AC Recharge Energy A voltmeter and ammeter for as-needed usage
13 of 28

Annex_A2
5. Test Procedure
5.1 Vehicle Propulsion System Starting and Restarting The vehicle’s propulsion system – specifically, the unit that provides the primary motive energy, e.g., the internal combustion engine -- shall be started according to the manufacturer’s recommended starting procedures in the owner’s manual. Only equipment necessary to the primary propulsion of the vehicle during normal service shall be operated. The air conditioner and other auxiliary on-board equipment not generally used during normal service shall be disabled during testing.
5.2 Dynamometer Driving Procedure The emission test sequence starts with a “hot” vehicle that can be utilized to warm the dynamometer to operating temperature and allow for vehicle rolling loss calibration.
5.3 Dynamometer Warm-up The test vehicle is used to warm the dynamometer and operated to allow for proper laboratory and vehicle loss calibrations.
5.4 Practice and Warm Up Runs The test vehicle will be operated through a preliminary run of the desired test cycle. During this preliminary cycle, the driver will become familiar with the vehicle operation, and the suitability of the selected operating range of gas analyzers will be verified. Additional preliminary runs will be made, if necessary, to assure that the vehicle, driver, and laboratory instrumentation are performing satisfactorily.
5.5 Emission Tests During the actual emission tests the test facility shall measure all emission data from the moment the vehicle is started, excluding the actual start event. If the vehicle has not been operated for more than 30 minutes then it shall be started and warmed to operating temperature utilizing the same test cycle that will be used for emission characterization. Once the vehicle is at operating temperature it shall be turned off and will be restarted within 30 minutes. The test cycle shall then begin and emission measurements will be taken. At the end of the test cycle the vehicle shall be returned to the “key off” condition. Analysis will be carried out between test cycles The number of tests runs performed must be sufficient to provide a minimum of three test runs with valid results i.e. NEC < +5% total cycle energy used. If the test sequence lapses in timing, another preliminary warm up run must be performed, after which the schedule can be resumed. Valid data gained prior to the breaking of the schedule may be preserved and reported. It is important to adhere to the time schedule and soak periods because engines and aftertreatment devices are sensitive to operating temperature.
5.6 Test Termination The test shall terminate at the conclusion of the test run. However, sufficient idle time should be included at the end of a run, such that the analyzers are not missing emissions that are still in the sampling train.
14 of 28

Annex_A2
5.7 Air Conditioning Emissions from air conditioning systems are outside of the scope of this procedure. Air conditioning and conventional heating systems will therefore be switched off for the duration of the test
5.8 Data Recording The emissions from the vehicle exhaust will be ducted to a full-scale dilution tunnel where the gaseous emissions of carbon monoxide, oxides of nitrogen (both nitric oxide and nitrogen dioxide) and carbon dioxide will be analysed as an integrated bag sample. Emissions of hydrocarbons, methane and nitrous oxide shall be measured on a continuous basis at a frequency of 5 Hz or greater. It is recommended that emissions of carbon monoxide, oxides of nitrogen and carbon dioxide are also measured on a continuous basis, and that these levels be compared to the integrated bag measurements as a quality assurance check. Particulate matter will be measured gravimetrically using fluorocarbon-coated glass fibre filters by weighing the filters before and after testing. Filters will be conditioned to temperature and humidity conditions as specified by 88/77/EEC For each constituent, a background sample using the same sampling train as used during the actual testing must be measured before and after the emission test, and the background correction must be performed as specified by 70/220/EEC. In cases where some speciality fuels are examined by the test procedure, it may prove necessary to sample for additional species, including alcohols, aldehydes, ketones, or organic toxics if it is suspected that the levels of these additional species might be significantly higher than is normally found for diesel fuel. It is recommended that the tunnel inlet be filtered for PM with a HEPA filter to aid in lowering the detection limits. Fuel consumed shall typically be determined by carbon balance from the gas analyzers, and the actual distance travelled by the dynamometer roll surface shall be used to provide the distance travelled during the driving cycles. Alternative methods for fuel consumption, such as direct mass measurement of the fuel tank, shall be considered if they are sufficiently accurate. This would require that the mass measurement system has an accuracy of greater than 1% of the fuel amount consumed during the test cycle. This method would be required for vehicles consuming hydrogen fuel. Mass measurement is preferred to volumetric measurement. In the case where the vehicle is to be tested and operated on multiple fuels with different GHG pathways (e.g. biodiesel and fossil fuel diesel) it is essential that the individual flows of each fuel can be resolved to an accuracy of 1% or better, either by measuring the flow of each fuel separately, or by introducing them at a fixed ratio into the engine. In this case the GHG analysis in Annex 5 shall be performed separately for each fuel and the final values combined.
5.9 State of Charge The SOC of the RESS must be recorded at the beginning and the end of the test to an accuracy of + 1% or better. If it is not possible to reliably measure SOC to this accuracy then the starting SOC shall be declared by the vehicle manufacturer and the real-time SOC data shall be calculated continuously from energy flow measurements (at a rate of 10Hz or greater) and recorded throughout the test.
15 of 28 Recorded data must then be time integrated against the emission data to provide a

Annex_A2
calculated end of test SOC. Provided the SOC is measured, OR declared, time sequenced and integrated according to the procedures listed earlier in this document, only the actual beginning and ending SOC values are necessary in the final test report. It is recommended that both Ah and system voltage be recorded, where appropriate, during the test as outlined in the method for determining NEC.
5.10 Deviations from Standard Procedure It is permissible to deviate from the prescribed procedure in cases where it can clearly be shown that this would result in a more realistic simulation of real-world vehicle operation. For example:
Where technology exists to enable the internal combustion engine to be switched off at bus stops, the MLTB cycle may be modified to include a series of simulated stops. In this case the stops are defined as all periods where the vehicle remains stationary for 15 seconds or more and this results in 19 simulated stops with a total duration of 411 seconds. During each 'stop' the bus may be operated in a manner which is consistent with normal operation, i.e. park or neutral transmission, park brake applied, doors opened.
Any deviations from the standard test procedure must be recorded in the test report and approved by the LowCVP prior to the issue of a LCEB certificate (where appropriate).
16 of 28

Annex_A2
6. Test Validation The value of the mass emission rates for each species will be averaged over the test distance (i.e. reported in g/km). There will be a minimum of three valid runs for each type of drive cycle. The coefficient of variance will be determined for each species. If the coefficient of variance is poor, additional runs should be performed until acceptable repeatability of emissions values are obtained. For hybrid vehicles the SOC correction is conducted first, and the R2 of the linear best fit must be greater than 0.8. If a hybrid vehicle has three valid runs with less than the 1% NEC delta, then the data can be used without SOC correction. Under these circumstances, the R2 of the best fit would be poor since all data points are essentially on the same axis (0% SOC correction). Any obvious error in the data should be identified and removed from the dataset; however, a minimum of three successful runs should be used in reporting the data. At the end of each run, the total distance travelled by the vehicle over the test run will be noted from the dynamometer distance measurements. Adherence of the driver to the test cycle target speeds will be noted, and a regression will be performed to compare actual speeds with target speeds on a second-by-second basis. Target speed (x) and actual speed (y) should be charted in 1Hz increments and a trend line inserted with a zero intercept. If the resulting trend line has a slope that varies from unity by more than 10% or an R2 of less than 0.8 the test run should be considered an invalid representation of that test cycle. The actual distance travelled by the dynamometer roller(s) should be used for the test cycle distance value. If at any point during the test, vehicle propulsion is not possible or the driver is warned by the vehicle to discontinue driving because the RESS energy supply is too low, the test is considered invalid. The RESS should be recharged and the testing procedure restarted from the beginning of the interrupted test run.
17 of 28

Annex_A2
18 of 28
7. Reporting The final test report shall include all measured parameters including vehicle configuration, vehicle statistics, test cycle, measured parameters and calculated test results. See Appendix 5. The following information will be included in the report: Exhaust Emissions and Fuel Economy - The exhaust emissions and fuel economy of the vehicle shall be measured during each test. The measurements shall be reported in grams per kilometre and litres per 100 kilometre, respectively. Total fuel energy shall be reported in MJ. Actual Distance Travelled - The actual distance that the dynamometer roll surface travelled shall be measured during each test phase. SOC Difference and NEC - The state of charge difference of the RESS shall be measured during the test and reported along with the RESS NEC. Tank-to Wheel emissions - Values for TTW emissions will be presented for CO, HC, NOx, PM, CO2, N2O and CH4 Well-to-Tank GHG emissions - Values for WTT GHG emissions will be presented as appropriate to the fuel in-use Well-to-Wheel GHG emissions - Values for WTW GHG emissions will be presented as appropriate to the fuel in-use

Annex_A2
Appendix 1: MILLBROOK LONDON TRANSPORT BUS (MLTB) DRIVE-CYCLE (Also known as Route 159 Drive Cycle) This test cycle was specifically developed for use with buses and was derived from data logged from a bus in service within inner London. The drive cycle consists of two phases, a medium speed ‘Outer London’ phase simulating a journey from Brixton Station to Trafalgar Square and a low speed ‘Inner London’ phase simulating a journey from Trafalgar Square to the end of Oxford Street. The cycle is composed of two phases: (1) Outer London Phase, nominal distance 6.45 km, 1,380 seconds in duration (2) Inner London Phase, nominal distance 2.47 km, 901 seconds duration
0
10
20
30
40
50
60
0 200 400 600 800 1000 1200 1400 1600 1800
Test Time (secs)
General information The overall length of the test is 2,281 seconds and the nominal distance covered is 8.92 km. Test cell ambient temperature for duration of test = 18C 2C
19 of 28

Annex_A2
Appendix 2 : Well-to-Wheel Calculations
Worked Examples from a test on a charge sustaining hybrid single deck bus
Base Vehicle Data: 36 seated passengers, 17 standees, total 53 Passengers.
Using the bag mass emissions generated from the tests carried out and using the current data supplied from the data logging system, it was possible to derive the NEC corrections required from the chassis dynamometer tests in order to interpolate the level of CO2 emitted from the test vehicle at zero energy change. NEC = [SOCdelta ] * Vsystem
SOC = state of charge
V = nominal system voltage volts From the recorded fuel consumption figures it was possible to calculate the fuel energy consumed across each test
Test number Fuel consumption Fuel used over cycle Net heating energy Total fuel energylitres/100km litres MJ/litre MJ
2006121 25.22 2.2916153 35.67485429 81.753041932006123 26.62 2.4005916 35.67485429 85.640755552006124 25.7 2.304519 35.67485429 82.213379542006125 24.86 2.2217382 35.67485429 79.260186562006126 24.5 2.19422 35.67485429 78.27847879
It was then possible to derive the NEC variance across each test and determine suitability of the test for interpolation
NEC (kW hr)
NEC - Mega Joules (Mwatt seconds)
Total Cycle Energy (MJ)
NEC Variance (%) Test Number
2006121 -0.49764 -1.79149 83.5445 -2.14% 2006123 1.09048 3.92571 81.7151 4.80% 2006124 1.93729 6.97423 75.2391 9.27%
2006125 -1.05876 -3.81155 83.0717 -4.59% 2006126 -0.11043 -0.39754 78.6760 -0.51%
The procedure requires that test results can be used without correction if the NEC is less than 1% of total energy used over the drive cycle. If the NEC is between 1 and 5% of total cycle energy, the test results can be corrected by using a linear interpolation method. Test runs 2006121, 2006123 and 2006125 were used for interpolation
20 of 28

Annex_A2
The chassis dynamometer results are shown in the table below:
Test No. CO2 2006121 668.8 2006123 706.0 2006125 659.8
By plotting the test data and interpolating the data points it is possible to determine the CO2 levels from the vehicle at zero NEC:
Similar interpolations are used to give values for the other important greenhouse gases, methane and nitrous oxide, to allow calculation of the total TTW GHG emissions:
CO2 Emissions
CH4 Emissions
CO2 Equivalent
N2O Emissions
CO2 Equivalent
Calculated GHG Emissions (TTW)
(g/km) (g/km) (g/km) (g/km) (g/km) (CO2 Equivalent g/km)
Zero NEC 681.2 0.000 0.0 0.006 1.9 683.0
Finally, an interpolation is used to give the fuel consumed at zero NEC to allow calculation of the TTW GHG contribution for the fuel pathway:
Fuel Used Over Cycle
Net Heating Energy
Total Fuel Energy
WTT GHG Equivalence
Factor *
Calculated WTT GHG Emissions
Calculated WTW GHG Emissions
(Litres) (MJ/Litre) (MJ) (CO2 Equivalent
g/MJ)
(CO2 Equivalent
g/km) (CO2 Equivalent
g/km)
Zero NEC 2.274 35.67 81.11 14.2 129.1 812.2
CO2 Interpolation
y = 5.0689x + 681.17
R2 = 0.9976
400
450
500
550
600
650
700
750
800
850
900
-6.00 -4.00 -2.00 0.00 2.00 4.00 6.00
NEC Kw
g/k
m
Series1
Linear (Series1)
21 of 28

Annex_A2
Note, this procedure must be carried out separately for each fuel, if more than one has been used during the test.
The bus was found to have a CO2 output, when corrected for zero NEC, of 681.2 g/km. This was equivalent to a TTW GHG output of 683.0 g/km This would result in a WTW (well to wheel) GHG level of 812.2 g/km. WTW GHG target for a bus with a total passenger capacity of 53 passengers is 798 g/km Overall Well-to-Wheel is 812.2 g/km. Low Carbon Status: FAIL
* Equivalence factor from JRC-CONCAWE-EUCAR WTW Report Version 2, 3rd November 2008
22 of 28

Annex_A2
Appendix 3: Passenger Capacity vs. Greenhouse Gas Emissions (CO2 equivalent)
Passengers g/km Passengers g/km Passengers g/km22 612.0 61 846.0 100 1080.023 618.0 62 852.0 101 1086.024 624.0 63 858.0 102 1092.025 630.0 64 864.0 103 1098.026 636.0 65 870.0 104 1104.027 642.0 66 876.0 105 1110.028 648.0 67 882.0 106 1116.029 654.0 68 888.0 107 1122.030 660.0 69 894.0 108 1128.031 666.0 70 900.0 109 1134.032 672.0 71 906.0 110 1140.033 678.0 72 912.0 111 1146.034 684.0 73 918.0 112 1152.035 690.0 74 924.0 113 1158.036 696.0 75 930.0 114 1164.037 702.0 76 936.0 115 1170.038 708.0 77 942.0 116 1176.039 714.0 78 948.0 117 1182.040 720.0 79 954.0 118 1188.041 726.0 80 960.0 119 1194.042 732.0 81 966.0 120 1200.043 738.0 82 972.0 121 1206.044 744.0 83 978.0 122 1212.045 750.0 84 984.0 123 1218.046 756.0 85 990.0 124 1224.047 762.0 86 996.0 125 1230.048 768.0 87 1002.0 126 1236.049 774.0 88 1008.0 127 1242.050 780.0 89 1014.0 128 1248.051 786.0 90 1020.0 129 1254.052 792.0 91 1026.0 130 1260.053 798.0 92 1032.0 131 1266.054 804.0 93 1038.0 132 1272.055 810.0 94 1044.0 133 1278.056 816.0 95 1050.0 134 1284.057 822.0 96 1056.0 135 1290.058 828.0 97 1062.0 136 1296.059 834.0 98 1068.0 137 1302.060 840.0 99 1074.0 138 1308.0
LCEB 30% WTW GHG Emission Reduction Target in g/km vs. Maximum Passenger Capacity
Valid for:
MLTB test cycle only. Vehicles tested at: Mass of vehicle in running order (including 75kg driver),
plus 25% of total passenger load. Passengers assumed to weigh 63kg each. "Maximum passenger capacity" = Manufacturer stated capacity, OR
(GVW – Mass of vehicle in running order)/63, whichever is the lower.
23 of 28

Annex_A2
Appendix 4: Essential Characteristics of the Vehicle powered by a Charge Sustaining Hybrid Electric Powertrain
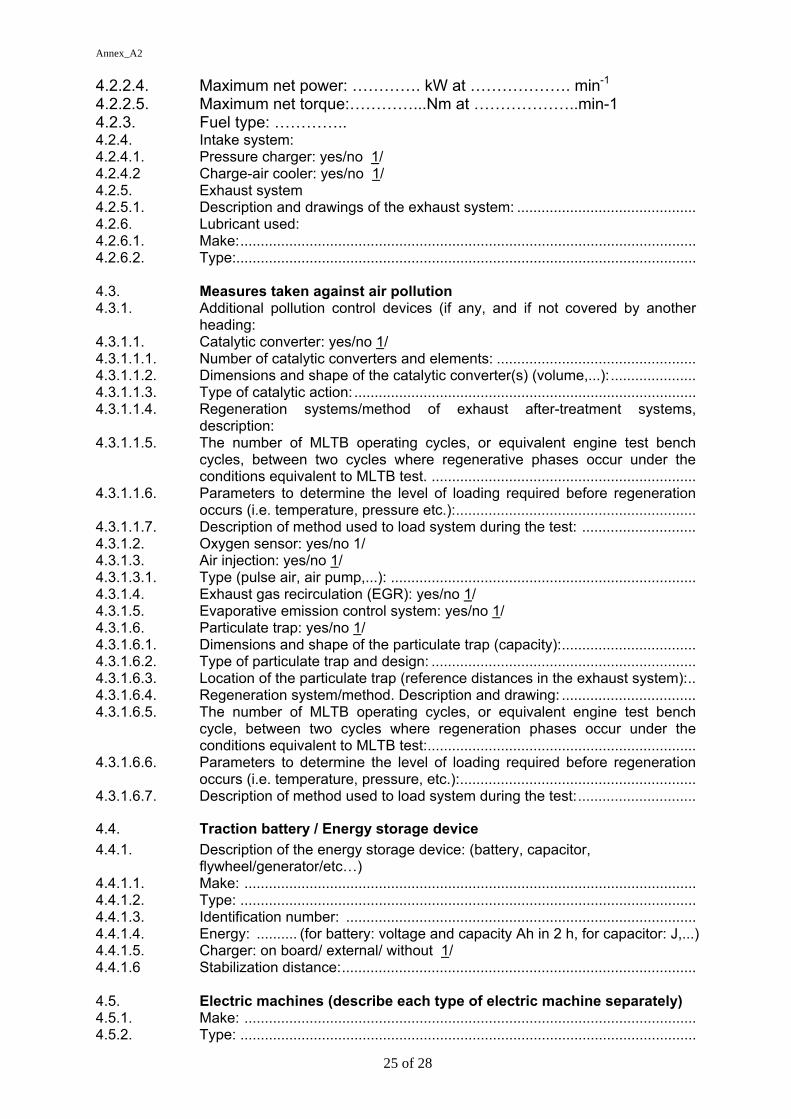
The following information, when applicable, shall be supplied. If there are drawings, they shall be to an appropriate scale and show sufficient detail. They shall be presented in A4 format or folded to that format. In the case of microprocessor controlled functions, appropriate operating information shall be supplied. 1. GENERAL 1.1. Make (name of manufacturer):............................................................... 1.2. Type and commercial description (mention any variants): ..................... 1.3. Means of identification of type, if marked on the vehicle: ....................... 1.3.1. Location of that mark:............................................................................. 1.4. Name and address of manufacturer:...................................................... 1.5. Name and address of manufacturer’s authorized representative where appropriate: 1.6. Vehicle stabilization distance: .............................................................. 2. GENERAL CONSTRUCTION CHARACTERISTICS OF THE VEHICLE 2.1. Photographs and/or drawings of a representative vehicle:..................... 2.2. Powered axles (number, position, interconnection): .............................. 3. MASSES (kilograms) (refer to drawing where applicable) 3.1. Mass of the vehicle with bodywork in running order (including coolant,
oils, fuel, tools, spare wheel and driver): ................................................ 3.2. Technically permissible maximum laden mass as stated by the
manufacturer:......................................................................................... 3.3. Vehicle test mass: .................................................................................. 3.4. Theoretical maximum passenger capacity (3.2. – 3.1.)/63:.................... 4. DESCRIPTION OF POWER TRAIN AND POWER TRAIN COMPONENTS 4.1. Description of the hybrid electric vehicle 4.1.1. Category of Hybrid Electric vehicle: Off Vehicle Charging/Not Off Vehicle
charging 1/ 4.1.2. Operating mode switch : with/without 1/ 4.1.2.1. Selectable modes: 4.1.2.1.1. Pure electric : yes/no 1/ 4.1.2.1.2. Pure fuel consuming : yes/no 1/ 4.1.2.1.3. Hybrid modes : yes/no 1/ (if yes, short description) 4.1.3. General description of Hybrid Electric power train 4.1.3.1. Drawing of the hybrid powertrain system layout (engine/ motor/ transmission
combination 1/): ............................................................................................... 4.1.3.2. Description of the general hybrid powertrain working principle: ...................... 4.1.4. Manufacturer’s recommendation for preconditioning: ..................................... 4.2. Internal combustion engine 4.2.1. Engine manufacturer: 4.2.2. Manufacturer’s engine code (as marked on the engine, or other means of
identification): 4.2.2.1. Working principle: positive-ignition/compression-ignition, four-stroke/two-
stroke 1/ 4.2.2.2. Number and arrangement of cylinders: .................................................. 4.2.2.3. Engine capacity: 2/ ........cm3
24 of 28
Annex_A2
4.2.2.4. Maximum net power: …………. kW at ………………. min-1
4.2.2.5. Maximum net torque:…………...Nm at ………………..min-1 4.2.3. Fuel type: ………….. 4.2.4. Intake system: 4.2.4.1. Pressure charger: yes/no 1/ 4.2.4.2 Charge-air cooler: yes/no 1/ 4.2.5. Exhaust system 4.2.5.1. Description and drawings of the exhaust system: ............................................ 4.2.6. Lubricant used: 4.2.6.1. Make:................................................................................................................ 4.2.6.2. Type:................................................................................................................. 4.3. Measures taken against air pollution 4.3.1. Additional pollution control devices (if any, and if not covered by another
heading: 4.3.1.1. Catalytic converter: yes/no 1/ 4.3.1.1.1. Number of catalytic converters and elements: ................................................. 4.3.1.1.2. Dimensions and shape of the catalytic converter(s) (volume,...):..................... 4.3.1.1.3. Type of catalytic action: .................................................................................... 4.3.1.1.4. Regeneration systems/method of exhaust after-treatment systems,
description: 4.3.1.1.5. The number of MLTB operating cycles, or equivalent engine test bench
cycles, between two cycles where regenerative phases occur under the conditions equivalent to MLTB test. .................................................................
4.3.1.1.6. Parameters to determine the level of loading required before regeneration occurs (i.e. temperature, pressure etc.):...........................................................
4.3.1.1.7. Description of method used to load system during the test: ............................ 4.3.1.2. Oxygen sensor: yes/no 1/ 4.3.1.3. Air injection: yes/no 1/ 4.3.1.3.1. Type (pulse air, air pump,...): ........................................................................... 4.3.1.4. Exhaust gas recirculation (EGR): yes/no 1/ 4.3.1.5. Evaporative emission control system: yes/no 1/ 4.3.1.6. Particulate trap: yes/no 1/ 4.3.1.6.1. Dimensions and shape of the particulate trap (capacity):................................. 4.3.1.6.2. Type of particulate trap and design: ................................................................. 4.3.1.6.3. Location of the particulate trap (reference distances in the exhaust system):.. 4.3.1.6.4. Regeneration system/method. Description and drawing: ................................. 4.3.1.6.5. The number of MLTB operating cycles, or equivalent engine test bench
cycle, between two cycles where regeneration phases occur under the conditions equivalent to MLTB test:..................................................................
4.3.1.6.6. Parameters to determine the level of loading required before regeneration occurs (i.e. temperature, pressure, etc.):..........................................................
4.3.1.6.7. Description of method used to load system during the test:.............................
4.4. Traction battery / Energy storage device
4.4.1. Description of the energy storage device: (battery, capacitor, flywheel/generator/etc…) 4.4.1.1. Make: ............................................................................................................... 4.4.1.2. Type: ................................................................................................................ 4.4.1.3. Identification number: ...................................................................................... 4.4.1.4. Energy: .......... (for battery: voltage and capacity Ah in 2 h, for capacitor: J,...) 4.4.1.5. Charger: on board/ external/ without 1/ 4.4.1.6 Stabilization distance:....................................................................................... 4.5. Electric machines (describe each type of electric machine separately) 4.5.1. Make: ............................................................................................................... 4.5.2. Type: ................................................................................................................
25 of 28

Annex_A2
4.5.3. Primary use: traction motor / generator 1/ 4.5.4. Maximum power: ........................................................................................ kW 4.6. Internal combustion engine control unit 4.6.1. Manufacturer: .................................................................................................. 4.6.2. Type: ................................................................................................................ 4.6.3. Software Identification number: ....................................................................... 4.6.4 Calibration identification number: .................................................................... 4.7. Hybrid system control unit 4.7.1. Manufacturer: .................................................................................................. 4.7.2. Type: ................................................................................................................ 4.7.3. Software Identification number: ....................................................................... 4.7.4 Calibration identification number: ....................................................................
4.8. Transmission (if fitted) 4.8.1. Clutch (type): .................................................................................................... 4.8.1.1. Maximum torque conversion: ........................................................................... 4.8.2. Gearbox: 4.8.2.1. Type:................................................................................................................. 4.8.2.2. Location relative to the engine:......................................................................... 4.8.3. Control Unit:...................................................................................................... 4.8.3.1. Type: ................................................................................................................ 4.8.3.2. Software Identification number: ....................................................................... 4.8.3.3. Calibration identification number: ....................................................................
5. SUSPENSION 5.1. Tyres and wheels 5.1.1. Tyre/wheel combination(s) (for tyres indicate size designation, minimum
load-capacity index, minimum speed category symbol; for wheels, indicate rim size(s) and off-set(s):
5.1.1.1. Axle 1:............................................................................................................... 5.1.1.2. Axle 2:............................................................................................................... 5.1.1.3. Axle 3:............................................................................................................... 5.1.1.4. Axle 4: etc......................................................................................................... 5.1.2. Tyre pressure(s) as recommended by the manufacturer: ......................... kPa
6. BODYWORK
6.1. Seats: 6.1.1. Number of seats: 6.1.2. Number of standing passengers permitted
_____________ 1/ Strike out what does not apply. 2/ This value must be calculated with π = 3.1416 and rounded to the nearest cm3.
26 of 28
Annex_A2
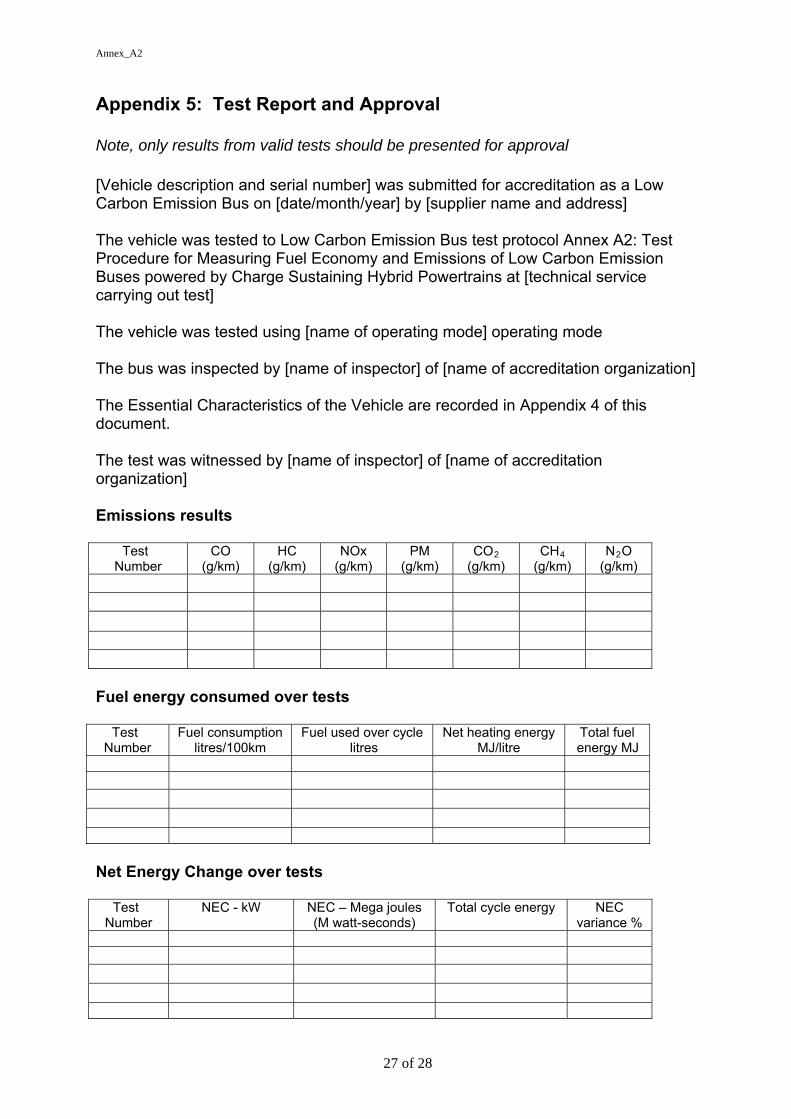
Appendix 5: Test Report and Approval Note, only results from valid tests should be presented for approval [Vehicle description and serial number] was submitted for accreditation as a Low Carbon Emission Bus on [date/month/year] by [supplier name and address] The vehicle was tested to Low Carbon Emission Bus test protocol Annex A2: Test Procedure for Measuring Fuel Economy and Emissions of Low Carbon Emission Buses powered by Charge Sustaining Hybrid Powertrains at [technical service carrying out test] The vehicle was tested using [name of operating mode] operating mode The bus was inspected by [name of inspector] of [name of accreditation organization] The Essential Characteristics of the Vehicle are recorded in Appendix 4 of this document. The test was witnessed by [name of inspector] of [name of accreditation organization] Emissions results
Test Number
CO (g/km)
HC (g/km)
NOx (g/km)
PM (g/km)
CO2
(g/km) CH4
(g/km) N2O
(g/km)
Fuel energy consumed over tests
Test Number
Fuel consumption litres/100km
Fuel used over cycle litres
Net heating energy MJ/litre
Total fuel energy MJ
Net Energy Change over tests
Test Number
NEC - kW NEC – Mega joules (M watt-seconds)
Total cycle energy NEC variance %
27 of 28

Annex_A2
28 of 28
Interpolated emissions results at zero NEC (graphical representation to be attached)
CO (g/km)
HC (g/km)
NOx (g/km)
PM (g/km)
CO2
(g/km) CH4
(g/km) N2O
(g/km) Fuel consumption
(Litres)
Total Tank-to-Wheel GHG – CO2 equivalence
CO2
(g/km) CH4
(g/km ×21) N2O
(g/km ×310) Total TTW GHG (g/km)
Total Well-to-Tank GHG – CO2 equivalence
Fuel Used Over Cycle
Net Heating Energy
Total Fuel Energy
WTT GHG Equivalence Factor *
Calculated WTT GHG Emissions
(Litres) (MJ/Litre) (MJ) (CO2 Equivalent g/MJ) (CO2 Equivalent g/km)
Well-to- Wheel calculations Total Tank-to-Wheel GHG (g/km)
Fuel Energy Consumption (MJ)
Fuel type
Fuel Well-to-Tank pathway value (g/MJ)
Fuel Well-to-Tank GHG (g/km)
Total Well-to-Wheel GHG (g/km)
Target WTW for [passenger capacity of bus] Passengers (g/km)
Approved as Low Carbon Bus
Yes/No
Approval Low Carbon Vehicle Partnership approves the following vehicle(s) as a Low Carbon Emission Bus for [number of passengers] and above Manufacturer Vehicle Type Limitations All vehicle characteristics to be as defined in Appendix 4 of this document

Annex_A3
Annex A3: Test Procedure for Measuring Fuel Economy and Emissions of Low Carbon Emission Buses Powered by Charge Depleting Hybrid Powertrains
1 of 30

Annex_A3
2 of 30
TABLE OF CONTENTS
1 Scope 2 Definitions and Terminology 3 State of Charge – Charge-Depleting Hybrid Vehicles 3.1 SOC Terminology 3.2 Net Energy Change (NEC) 3.3 Determining NEC Variance 3.4 Determination Procedure 4. Test Preparations 4.1 Test Site 4.2 Pre-Test Data Collection 4.3 Operation of the vehicle 4.4 Condition of the Vehicle 4.5 Conditioning of Re-chargeable Energy Storage System 4.6 Dynamometer Specifications 4.7 Dynamometer Calibrations 4.8 Inertial Load 4.9 Road Load 4.10 Dynamometer Load Coefficient Determination 4.11 Dynamometer Settings 4.12 Test Instrumentation 5. Test Procedure 5.1 Vehicle Propulsion System Starting and Restarting 5.2 Dynamometer Driving Procedure 5.3 Dynamometer Warm-up 5.4 Practice and Warm Up Runs 5.5 Emission Tests 5.5.1 Initial Charge of RESS 5.5.2 The Emission Test 5.5.3 Re-charge of the RESS 5.5.4 Calculation of Energy Consumption and Correction of GHG Values 5.6 Test Termination 5.7 Air Conditioning 5.8 Data Recording 5.9 State of Charge 5.10 Re-charge Energy 5.11 Deviations from Standard Procedure 6. Test Validation 7. Reporting Appendix 1: Millbrook London Transport Bus (MLTB) Drive Cycle Appendix 2: Well-to-Wheel Calculations Appendix 3: Passenger Capacity vs. Greenhouse Gas Emissions (CO2 equivalent) Appendix 4: Essential Characteristics of the Vehicle powered by a Charge Depleting
Hybrid Powertrain Appendix 5: Test Report and Approval

Annex_A3
1. Scope This document provides an accurate and reproducible procedure for simulating the operation of buses powered by charge depleting hybrid powertrains on dynamometers for the purpose of measuring emissions and fuel economy. A hybrid vehicle is defined as having both a rechargeable energy storage system (RESS) capable of releasing and capturing energy and an energy-generating device that converts consumable fuels into propulsion energy. This procedure specifically includes batteries, capacitors and flywheels, although other types of RESS can be evaluated by following the guidelines provided. The procedure also provides a detailed description of correction for external charging of charge-depleting HEVs in order to correct for RESS energy consumed during the test. It should be noted that most buses addressed in this recommended practice are expected to be powered by engines that are certified separately for emissions. In these cases the engine certification procedure appears in Regulation 77/88/EC. This test procedure does not make specific provisions or recommendations for testing of bus emissions with air conditioning deployed because the complexity of such tests is significant. All auxiliary loads will be turned off during the test, unless they affect the normal operation of the vehicle. The intention is to test the vehicle in it's normal road-going condition and operating strategy as far as reasonably practical, within the constraints of the equipment and cycle. Potential exceptions to this include antilock brakes and traction control. Any aspect of vehicle operation which needs to be modified for the test shall be discussed with the test centre and recorded in the test report. The procedure requires the calculation of Well-to-Wheel (WTW) Greenhouse Gas (GHG) emissions in order to determine if the vehicle qualifies as a Low Carbon Emission Bus. The vehicle will be tested over the Millbrook London Transport Bus (MLTB) drive cycle representing intermediate-speed bus operation in London. Details of this cycle can be found in Appendix 1 of this document. Regulated emissions (HC, CO, NOx and PM) and carbon dioxide shall be sampled over the entire cycle and the results presented as gm/km. For all buses, the concentration of nitrous oxide (N2O) shall be determined using Fourier Transfer Infra-Red spectroscopy (FTIR) techniques. For all buses, the concentration of methane (CH4) shall be determined by separate analysis.
3 of 30

Annex_A3
2. Definitions and Terminology BATTERY -- A device that stores chemical energy and releases electrical energy. BATTERY C/3 CURRENT RATE -- The constant current (Amperes) at which the battery can be discharged from its rated capacity in three hours to its manufacturer’s recommended minimum. Battery manufacturers typically provide ratings from C/1 to C/6. These ratings have no direct impact on this recommended practice. BATTERY DEPTH OF DISCHARGE (DOD) -- The percentage of rated capacity to which a cell/battery is discharged. State of charge (SOC) % + DOD% = 100%. BATTERY RATED AMPERE-HOUR CAPACITY -- The manufacturer-rated capacity of a battery in Ampere-hours, obtained from a battery discharged at the manufacturer’s recommended discharge rate (C/1 - C/6) such that a specified minimum cut-off terminal voltage or state of charge is reached. BATTERY STATE OF CHARGE (SOC) – Based on the actual measured energy content of a battery and expressed in Ampere hours, or as a percentage of the battery’s maximum rated Ampere hour (Ah) capacity. CAPACITOR -- A device that stores energy electrostatically and releases electrical energy. CAPACITOR STATE OF CHARGE (SOC) – Based on the actual measured energy content of a capacitor and expressed as a percentage of the capacitor’s maximum rated voltage squared (V2). CHARGE-DEPLETING HEV -- A charge-depleting HEV derives part, or all of its energy from a RESS under normal usage. The vehicle is designed so that the RESS is periodically recharged from an external power supply. The procedure includes provisions for calculating GHG corrections for the energy consumed from the RESS during the test in order to calculate the overall greenhouse gas (GHG) emissions from the vehicle. CONSUMABLE FUEL -- Any solid, liquid, or gaseous material that releases energy and is depleted as a result. ELECTROMECHANICAL FLYWHEEL -- A device that stores rotational kinetic energy and can release that kinetic energy to drive the vehicle, either directly, or via an electric motor-generator system. ELECTROMECHANICAL FLYWHEEL STATE OF CHARGE (SOC) – Based on the actual measured energy content of an electromechanical flywheel and expressed as a percentage of the flywheel’s maximum-rated revolutions per minute squared (rpm2). HYBRID-ELECTRIC VEHICLE (HEV) -- A road vehicle that can draw propulsion energy from both of the following on-vehicle sources of stored energy: 1) one consumable fuel and 2) one (or more) RESS that is recharged by an on-board electric generating system, or an off-board charging system, or recovered kinetic energy. NET ENERGY CHANGE (NEC) -- The net change in energy level of an RESS expressed in Joules (watt-seconds), or as a percentage of the Total Cycle Energy. PRIME MOVER – Power unit which provides the primary source of mechanical energy
4 of 30

Annex_A3
used to move the vehicle PROPULSION ENERGY -- Energy that is derived from the vehicle’s consumable fuel and/or rechargeable energy storage system to drive the wheels. If an energy source is supplying energy only to vehicle accessories (e.g., a 12-volt battery on a conventional vehicle), it is not acting as a source of propulsion energy. PROPULSION SYSTEM -- A system that, when started, provides propulsion for the vehicle in an amount proportional to what the driver commands. REGENERATIVE BRAKING -- Deceleration of the vehicle caused by operating an energy recovery system, thereby returning energy to the vehicle propulsion system and providing charge to the RESS or to operate on-board auxiliaries. RECHARGEABLE ENERGY STORAGE SYSTEM (RESS) -- A component or system of components that stores energy and for which its supply of energy is rechargeable by an electric motor-generator system, an off-vehicle electric energy source, or recovered kinetic energy, or a combination of thereof. Examples of RESS for HEVs include batteries, capacitors, and electromechanical flywheels. STATE OF CHARGE – see “Battery state of charge” TOTAL CYCLE ENERGY -- The total energy expended by the vehicle in driving the test cycle. This is equal to the Total Fuel Energy minus the RESS Net Energy Change in Joules. TOTAL FUEL ENERGY -- The total energy content of the fuel in MJ consumed during a test as determined by carbon balance or other acceptable method and calculated based on the lower heating value of the fuel.
5 of 30

Annex_A3
3. State of Charge – Charge-Depleting Hybrid Vehicles When a conventional vehicle completes a chassis dynamometer test, the energy provided by the combustion engine is equal to the total energy necessary to complete the cycle, and this value is consistent from test run to test run. There is no energy storage on board the vehicle other than consumable fuel, and no need for state of charge (SOC) correction. However, in a Charge Depleting Hybrid Electric Vehicle (HEV), for example, a significant amount of motive energy is stored on board the vehicle within the RESS, and the vehicle may remove or add energy to this energy reservoir over short periods of time. In order to compare the emission results of an HEV to a conventional vehicle, the data from the HEV must be corrected so that it includes GHG emissions caused during the generation of the power used to recharge the RESS. This procedure allows for some level of tolerance between the initial SOC and final SOC to avoid correcting the fuel economy and emission results unnecessarily. A net energy change of 1% or less in stored energy, compared to total cycle energy, is considered negligible and does not require SOC correction calculations. If the percentage change is greater than 1% but less than 5%,a correction procedure can be applied, providing a clear relationship between NEC and emissions and fuel economy can be established. In this case the vehicle should be tested using the procedures outlined in Annex A2 of this document. If a vehicle repeatedly produces test results where the NEC is above 5% then it should be considered to be a charge depleting hybrid and a correction for GHG produced during the generation of the electricity used to recharge the RESS must be applied in accordance with section 5.5.4.
3.1 SOC Terminology The following terms are used to distinguish between the different values of SOC referred to in the test procedure.
SOCinitial : SOC at the beginning of the test run (Ah, V2 or rpm2) SOCfinal : SOC at the end of the test run (Ah, V2 or rpm2) SOCdelta Change in SOC measured during a test
NEC calculations are presented in Joules (watt-seconds).
3.2 Net Energy Change (NEC) Provision should be made for recording the RESS SOC at the start and stop of each test run, although in practice this is not always achievable. It is therefore essential that second by second logging of energy flows in and out of the RESS be carried out for the duration of each test run. For each different vehicle and test cycle a minimum of three test runs must be performed to provide sufficient data for a SOC correction, if needed. Since different types of RESS store energy differently, each type of RESS will use different equations to define NEC. The following section gives the NEC calculations for batteries, capacitors and electro-mechanical flywheels. The appropriate calculations for NEC where other types of RESS are fitted must be determined as necessary on a case by case basis.
BATTERIES
Equations 1(a) and 1(b) calculate the NEC for batteries.
6 of 30

Annex_A3
NEC = [SOCfinal – SOCinitial] * Vsystem * K1 (Equation 1a) where: Vsystem = Battery’s DC nominal system voltage as specified by the
manufacturer, in volts (V) K1 = Conversion factor = 3600 (seconds/hour) (not used if
SOCfinal and SOCinitial values are in Ampere-seconds) or, NEC = [SOCdelta] * Vsystem * K1 (Equation 1b) where: Vsystem = Battery’s DC nominal system voltage as specified by the
manufacturer, in volts (V) K1 = Conversion factor = 3600 (seconds/hour) (not used if
SOCfinal and SOCinitial values are in seconds)
CAPACITORS
Equation 2 calculates NEC for capacitors.
NEC = (C/2) * [SOCfinal – SOCinitial] (Equation 2) where: C = Rated capacitance of the capacitor as specified by the
manufacturer, in Farads (F)
ELECTROMECHANICAL FLYWHEELS
Equation 3 calculates NEC for electromechanical flywheels. NEC = (1/2) * I * [SOCfinal – SOCinitial] * K2 (Equation 3) where: I = Rated moment of inertia of the flywheel system, in
kilogram-meter2 (kg/m2) K2 = Conversion factor = 42/3600 (rad2/sec2/rpm2)
3.3 Determining NEC Variance
TOTAL CYCLE ENERGY
This procedure uses total cycle energy to determine NEC tolerances, as opposed to total fuel energy, which can vary from test run to test run. To remain consistent with the calculations for NEC, either the total cycle energy must be reported in watt-seconds or the NEC must be converted to kWh.
Total Cycle Energy = Total Fuel Energy – NEC (Equation 4)
7 of 30

Annex_A3
Total fuel energy is the energy value of the fuel consumed by the internal combustion engine during the test and is calculated as shown in equation 5.
Total Fuel Energy = NHVfuel * mfuel (Equation 5)
where NHVfuel = Net heating value in Joules per kilogram (J/kg)
mfuel = Total mass of fuel consumed over test, in kilograms (kg)
3.4 Determination Procedure To determine if a test run has an acceptable NEC that does not require SOC correction, divide NEC, in Joules, by total cycle energy. If the absolute value of the calculation yields a number less than or equal to 1%, as shown in equation 6, then the NEC variance is within tolerance levels and the emissions and fuel economy values for that test run do not need to be corrected.
(Equation 6)
NEC total cycle energy * 100% < 1%
If the absolute value of the calculation yields a number greater than 1%, but less than or equal to 5%, as shown in equation 7, then the emission and fuel economy values from the test run need to be corrected for SOC and the vehicle should be tested using the procedure described in Annex A2. Vehicles which are consistently charge depleting with NEC variances of greater than 5% should be tested using this procedure. (Equation 7)
NEC total cycle energy * 100% < 5% 1% <
8 of 30

Annex_A3
4. Test Preparations
4.1 Test Site The ambient temperature levels encountered by the test vehicle shall be maintained at 18C 2C throughout the test Ambient temperatures must be recorded at the beginning and end of the test period. Test conditions specified in 70/220/EEC and 77/88/EEC shall apply, where appropriate. Adequate test site capabilities for safe venting and cooling of batteries, containment of flywheels, protection from exposure to high voltage, or any other necessary safety precaution shall be provided during testing. One or more speed tracking fans shall direct cooling air to the vehicle in an attempt to maintain the engine operating temperature as specified by the manufacturer during testing. These fans shall only be operating when the vehicle is in operation and shall be switched off for all key off dwell periods. Fans for brake cooling can be utilized at all times. Additional fixed speed fans should be used if required and must be documented in the test report.
4.2 Pre-Test Data Collection Prior to testing, detailed characteristics of the vehicle should be recorded. These requirements are specified in Appendix 4 of this Annex. The chassis test laboratory will be used to measure actual cycle distance during a test, as it is generally considered a more accurate method of calculation; as a result, an odometer on the vehicle is not required. For all tests, a fuel sample shall be taken for potential analysis at a later date. The vehicle will be tested using the fuel with which it arrives at the test facility. Fuels should meet the requirements of EN590 and any exceptions to this should be advised by the vehicle manufacturer for reporting purposes. 4.3 Operation of the vehicle If the vehicle is capable of several operating modes (e.g. delivery, electric-only, limp-home, normal, etc.), and these can be selected by the driver then it shall be operated in the most appropriate mode for the drive cycle. This mode shall be decided by the manufacturer and recorded in the test report. If the vehicle is unable to be driven on the chassis dynamometer in a conventional operating mode then the reasons for this should be provided by the manufacturer in advance of the tests for reporting purposes. Any deviations from standard operation must be approved by the LowCVP prior to the issue of a LCEB certificate (where appropriate).
9 of 30

Annex_A3
4.4 Condition of the Vehicle Vehicle Stabilization -- Prior to testing, the vehicle shall be stabilized to a minimum distance of 3000km. This will be documented in the test report. Vehicle Test Weight -- Buses shall be tested at curb weight plus driver weight (75kg) and one quarter of the specified total passenger load using a weight of 63 kg per passenger. The curb weight of the vehicle shall be determined prior to test by the technical service carrying out the test. For buses which have previously been tested for Transport for London bus approval, this procedure can be followed retrospectively. In this case, the change in CO2 emissions due to the difference between the LCEB test inertia and the TfL test inertia shall be calculated using the following equation.
ΔCO2 = 0.0637 * ΔTI (Equation 8) where: ΔTI = Difference in test inertia, in kilograms (kg) Tyres -- Manufacturer’s recommended tyres shall be used and shall be the same size as would be used in service This will be documented in the test report. Tyre Pressure -- For dynamometer testing, tyre pressures should be set at the beginning of the test to manufacturer’s recommended pressure. This will be documented in the test report. Lubricants -- The vehicle lubricants normally specified by the manufacturer shall be used. This specification shall be supplied by the manufacturer in advance of the tests and recorded in the test report. Gear Shifting – The vehicle shall be driven with appropriate accelerator pedal movement to achieve the time versus speed relationship prescribed by the drive cycle. Both smoothing of speed variations and excessive acceleration pedal perturbations are to be avoided and may cause invalidation of the test run. In the case of test vehicles equipped with manual transmissions, the transmission shall be shifted in accordance with procedures that are representative of shift patterns that may reasonably be expected to be followed by vehicles in use. Vehicle Preparation & Preconditioning -- as a minimum, should include: Initial SOC setting (RESS discharge and recharge)
4.5 Conditioning of Rechargeable Energy Storage System RESS Failure -- In the event that the RESS is damaged or has an energy storage capability below the manufacturer’s specified rating, the RESS shall be repaired or replaced and stabilized, and then the test procedure should be repeated. Data from tests with a faulty RESS shall be considered invalid. The RESS must have undergone a minimum of 300km of vehicle operation prior to the test to allow for initial 'running-in' and shakedown.
10 of 30

Annex_A3
4.6 Dynamometer Specifications The evaluation of the emissions and fuel economy from a low carbon bus powered by hybrid powertrain should be performed using a laboratory that incorporates a chassis dynamometer, a full-scale dilution tunnel, and laboratory-grade exhaust gas analyzers as described in 70/220/EEC (Light-duty vehicles) and 88/77/EC (Heavy-duty engines). The chassis dynamometer should be capable of simulating the transient inertial load, aerodynamic drag and rolling resistance associated with normal operations of the vehicle. The transient inertial load should be simulated using appropriately sized flywheels and/or electronically controlled power absorbers. The aerodynamic drag and rolling resistance may be implemented by power absorbers with an appropriate computer control system. The drag and rolling resistance should be established as a function of vehicle speed. The actual vehicle weight for the on-road coast down should be the same as the anticipated vehicle testing weight as simulated on the dynamometer. The vehicle should be mounted on the chassis dynamometer so that it can be driven through a test cycle. The driver should be provided with a visual display of the desired and actual vehicle speed to allow the driver to operate the vehicle on the prescribed cycle.
4.7 Dynamometer Calibrations The dynamometer laboratory should provide evidence of compliance with calibration procedures as recommended by the manufacturer.
4.8 Inertial Load Inertial load must be simulated correctly from a complete stop (e.g., total energy used to accelerate the vehicle plus road and aerodynamic losses should equal theoretical calculations and actual coastdowns). For HEVs this may be determined by measuring the power delivered to the dynamometer at the drive motors. 4.9 Road Load Road load and wind losses should be simulated by an energy device such as a power absorber. Road load should be verified by comparison to previously tested vehicles having similar characteristics or by coastdown analysis on the track.
4.10 Dynamometer Load Coefficient Determination The dynamometer coefficients that simulate road-load forces shall be determined as specified in Directive 70/220/EEC, with the following provisions:
a) Vehicles equipped with regenerative braking systems that are actuated only by the brake pedal shall require no special actions for coastdown testing on both the test track and dynamometer.
b) Vehicles equipped with regenerative braking systems that are activated at
least in part when the brake pedal is not depressed shall have regenerative braking disabled during the deceleration portion of coastdown testing on both the test track and dynamometer, preferably through temporary software changes in the vehicle’s control system. Mechanical changes to the vehicle to deactivate regenerative braking (such as completely removing the drive shaft) are discouraged. However, if this practice becomes necessary as a last resort, every safety precaution shall be taken during vehicle operation, and the same mechanical modifications shall occur on both the test track and dynamometer. Methods to accelerate a vehicle without a drive shaft on both
11 of 30

Annex_A3
the test track and the dynamometer shall be determined by the manufacturer. However, pushing the vehicle with another vehicle is not an option.
c) The vehicles shall be weighted to the correct dynamometer test weight when
the on road coastdowns are performed.
4.11 Dynamometer Settings The dynamometer’s power absorption and inertia simulation shall be set as specified in 70/220/EEC. It is preferable to insure that the dynamometer system provides the appropriate retarding force at all speeds, rather than simply satisfying a coastdown time between two specified speeds. The remaining operating conditions of the vehicle should be set to the same operating mode during coastdowns on road and on the dynamometer (e.g., air conditioning off, etc).
4.12 Test Instrumentation Equipment referenced in 70/220/EEC and 88/77/EC (including exhaust emissions sampling and analytical systems) is required for emissions measurements, where appropriate. All instrumentation shall be traceable. to national standards. The following instruments are likely to be required for determination of change of SOC on an as-needed usage. DC wideband Ampere-hour meter: Any meter using an integration technique
shall have an integration frequency of 10Hz or higher so that abrupt changes of current can be accommodated without introducing significant integration errors.
An instrument to measure a capacitor’s voltage An instrument to measure an electromechanical flywheel’s rotational speed AC Watt-hour meter to measure AC Recharge Energy A voltmeter and ammeter for as-needed usage
12 of 30

Annex_A3
5. Test Procedure
5.1 Vehicle Propulsion System Starting and Restarting The vehicle’s propulsion system – specifically, the unit that provides the primary motive energy, e.g., the internal combustion engine -- shall be started according to the manufacturer’s recommended starting procedures in the owner’s manual. Only equipment necessary to the primary propulsion of the vehicle during normal service shall be operated. The air conditioner and other auxiliary on-board equipment not generally used during normal service shall be disabled during testing.
5.2 Dynamometer Driving Procedure The emission test sequence starts with a “hot” vehicle that can be utilized to warm the dynamometer to operating temperature and allow for vehicle rolling loss calibration.
5.3 Dynamometer Warm-up The test vehicle is used to warm the dynamometer and operated to allow for proper laboratory and vehicle loss calibrations.
5.4 Practice and Warm Up Runs The test vehicle will be operated through a preliminary run of the desired test cycle. During this preliminary cycle, the driver will become familiar with the vehicle operation, and the suitability of the selected operating range of gas analyzers will be verified. Additional preliminary runs will be made, if necessary, to assure that the vehicle, driver, and laboratory instrumentation are performing satisfactorily.
5.5 Emission Tests The vehicle test includes the following basic steps: 1/ Initial charge of the RESS 2/ Emission test of the vehicle to the appropriate drive cycle (see Appendix 1) 3/ Recharge of the RESS 4/ Calculation of the energy consumption and correction of the GHG values
5.5.1 Initial Charge of RESS Prior to the first vehicle test only, it is necessary to discharge the RESS to a known level. This shall be accomplished by running the vehicle at 70% +5% of it's maximum 30 minute operating speed on the track or chassis dynamometer with the internal combustion engine disabled. The vehicle is operated at steady speed until one of the following conditions occurs:
The vehicle speed drops below 65% of it's maximum 30 minute speed The driver receives an instruction to stop from the standard vehicle
instrumentation The vehicle has covered 100km
The vehicle is then moved, preferably by towing, to a charging station where it shall be charged using the on-board charger. If no on-board charger is fitted to the vehicle then a charger which has been approved by the manufacturer and operates under the normal
13 of 30

Annex_A3
overnight charging pattern for the vehicle may be used. Charging must be carried out under the same temperature conditions as the test (18C 2C). The energy supplied to the vehicle or external charger (if used) during charging must be measured and recorded in the test report. It is important that the charging system delivers a conventional overnight charge. Special charging procedures, such as equalisation or maintenance must be avoided. The RESS shall be charged for 8 hours, unless the driver is given a clear indication, by the standard instrumentation, that at the end of this period charging is still incomplete. If the charge is incomplete at 8 hours then it shall continue to a maximum total duration of: (Equation 8)
Time (hours) = 3 * Stated RESS Capacity (Wh) Charger Power Supply (W)
The start and end times of charging shall be recorded in the test report along with the total energy delivered to the charger.
5.5.2 The Emission Test During the actual emission tests the test facility shall measure all emission data from the moment the vehicle is started, excluding the actual start event. The emission test shall start within four hours of the end of charging, otherwise the discharge and recharge cycle must be repeated. The test cycle shall begin by using the standard vehicle start up procedure, and emission measurements will be taken. At the end of the test cycle the vehicle shall be returned to the “key off” condition. Analysis will be carried out between test cycles. The number of tests runs performed must be sufficient to provide a minimum of three test runs with valid results. If the test sequence lapses in timing, another discharge/recharge cycle must be performed, after which the schedule can be resumed. Valid data gained prior to the breaking of the schedule may be preserved and reported. It is important to adhere to the time schedule and soak periods because engines and aftertreatment devices are sensitive to operating temperature. During a series of emission tests it is permissable to use the re-charging cycle at the end of one test to act as the charging cycle prior to the next one. That is, there is no requirement to run a discharge cycle between the tests unless more than four hours have elapsed between the recharge cycle and the next test.
5.5.3 Recharge of the RESS Within 30 minutes of the end of the emission test, the vehicle shall be connected to the external power supply, or charger, and recharged according to the process used in 5.5.1. No discharge is required before the recharge. The start and end times of charging shall be recorded in the test report along with the total energy delivered to the charger.
14 of 30

Annex_A3
5.5.4 Calculation of Energy Consumption and Correction of GHG Values The electrical energy required to drive the test cycle is equal to the energy supplied to the charger or vehicle (if the charger is on-board) during the recharge operation in 5.5.3. It is necessary to calculate the amount of greenhouse gases that have been emitted during the generation of this electricity in order to correct the WTW GHG from the internal combustion engine. This is done by multiplying the electrical energy consumed by a WTT correction factor. Values for this correction factor are available from several sources but for consistency the latest version of the 'Defra GHG conversion factors for company reporting' should be used (http://www.defra.gov.uk/environment/business/reporting/conversion-factors.htm). In addition, because this data is updated yearly, the 5-year grid rolling average value for total GHG should be used in order to reduce the effect of fluctuations on the certification process. This is currently 0.54418 kg CO2 equivalent per kWh (2007 value, document updated June 2009). The electrical WTT GHG value should be added to the WTW GHG value for the exhaust emissions measured during the test in order to give the overall vehicle WTW result. Note, the electrical WTT emissions are equivalent to the electrical WTW values because no further emissions are generated between the electrical 'tank' and the wheels. (Equation 9) Electrical WTW GHG = ERecharge * WTTE Conv Factor
* 1000 Distance
where Electrical WTW GHG = CO2 equivalent GHG emission (g/km) ERecharge = Energy supplied to the charger during vehicle recharge (kWh)
WTTE Conv Factor = Electrical Well to Tank conversion factor (kg/kWh) Distance = Test distance (km)
It is not currently possible to calculate correction factors for the other pollutants produced during the generation of electricity (e.g. particulates and carbon monoxide) because this data is not readily available. However, GHG emissions represent a global issue so their production location is immaterial and therefore it is important that they are included in the vehicle's emission inventory and assessment. Whereas, particulate matter and carbon monoxide etc. represent local air quality pollutants so they do not affect the location where the vehicle is operated and hence are not be included in the 'tailpipe inventory'. In addition, pollutant emissions from power stations are already the subject of separate legislation.
5.6 Test Termination
The test shall terminate at the conclusion of the test run. However, sufficient idle time should be included at the end of a run, such that the analyzers are not missing emissions that are still in the sampling train. 5.7 Air Conditioning Emissions from air conditioning systems are outside of the scope of this procedure. Air conditioning and conventional heating systems will therefore be switched off for the
15 of 30

Annex_A3
duration of the test
5.8 Data Recording The emissions from the vehicle exhaust will be ducted to a full-scale dilution tunnel where the gaseous emissions of carbon monoxide, oxides of nitrogen (both nitric oxide and nitrogen dioxide) and carbon dioxide will be analysed as an integrated bag sample. Emissions of hydrocarbons, methane and nitrous oxide shall be measured on a continuous basis at a frequency of 5 Hz or greater. It is recommended that emissions of carbon monoxide, oxides of nitrogen and carbon dioxide are also measured on a continuous basis, and that these levels be compared to the integrated bag measurements as a quality assurance check. Particulate matter will be measured gravimetrically using fluorocarbon-coated glass fibre filters by weighing the filters before and after testing. Filters will be conditioned to temperature and humidity conditions as specified by 88/77/EEC For each constituent, a background sample using the same sampling train as used during the actual testing must be measured before and after the emission test, and the background correction must be performed as specified by 70/220/EEC. In cases where some speciality fuels are examined by the test procedure, it may prove necessary to sample for additional species, including alcohols, aldehydes, ketones, or organic toxics if it is suspected that the levels of these additional species might be significantly higher than is normally found for diesel fuel. It is recommended that the tunnel inlet be filtered for PM with a HEPA filter to aid in lowering the detection limits. Fuel consumed shall typically be determined by carbon balance from the gas analyzers, and the actual distance travelled by the dynamometer roll surface shall be used to provide the distance travelled during the driving cycles. Alternative methods for fuel consumption, such as direct mass measurement of the fuel tank, shall be considered if they are sufficiently accurate. This would require that the mass measurement system has an accuracy of greater than 1% of the fuel amount consumed during the test cycle. This method would be required for vehicles consuming hydrogen fuel. Mass measurement is preferred to volumetric measurement. In the case where the vehicle is to be tested and operated on multiple fuels with different GHG pathways (e.g. biodiesel and fossil fuel diesel) it is essential that the individual flows of each fuel can be resolved to an accuracy of 1% or better, either by measuring the flow of each fuel separately, or by introducing them at a fixed ratio into the engine. In this case the GHG analysis in Annex 5 shall be performed separately for each fuel and the final values combined.
5.9 State of Charge
The SOC of the RESS must be recorded at the beginning and the end of the test to an accuracy of + 1% or better. If it is not possible to reliably measure SOC to this accuracy then the starting SOC shall be declared by the vehicle manufacturer and the real-time SOC data shall be calculated continuously from energy flow measurements (at a rate of 10Hz or greater) and recorded throughout the test.
16 of 30
Recorded data must then be time integrated against the emission data to provide a calculated end of test SOC. Provided the SOC is measured, OR declared, time sequenced and integrated according to the procedures listed earlier in this document, only the actual beginning and ending SOC values are necessary in the final test report. It is recommended that both Ah and system voltage be recorded, where appropriate, during the test as outlined in the method for determining NEC.

Annex_A3
5.10 Recharge Energy The total energy supplied to the charger during charging must be recorded to an accuracy of + 1% or better. If the energy flow is measured continuously and subsequently integrated to give the total energy then it must be recorded at a frequency of 10Hz or greater throughout the charging period.
5.11 Deviations from Standard Procedure It is permissible to deviate from the prescribed procedure in cases where it can clearly be shown that this would result in a more realistic simulation of real-world vehicle operation. For example:
Where technology exists to enable the internal combustion engine to be switched off at bus stops, the MLTB cycle may be modified to include a series of simulated stops. In this case the stops are defined as all periods where the vehicle remains stationary for 15 seconds or more and this results in 19 simulated stops with a total duration of 411 seconds. During each 'stop' the bus may be operated in a manner which is consistent with normal operation, i.e. park or neutral transmission, park brake applied, doors opened.
Any deviations from the standard test procedure must be recorded in the test report and approved by the LowCVP prior to the issue of a LCEB certificate (where appropriate).
17 of 30

Annex_A3
6. Test Validation The value of the mass emission rates for each species will be averaged over the test distance (i.e. reported in g/km). There will be a minimum of three valid runs for each type of drive cycle. For a group of three tests to be valid the 'total GHG emissions' from each test, including the electrical contribution, must lie within a 5% range. Any obvious error in the data should be identified and removed from the dataset; however, a minimum of three successful runs should be used in reporting the data. At the end of each run, the total distance travelled by the vehicle over the test run will be noted from the dynamometer distance measurements. Adherence of the driver to the test cycle target speeds will be noted, and a regression will be performed to compare actual speeds with target speeds on a second-by-second basis. Target speed (x) and actual speed (y) should be charted in 1Hz increments and a trend line inserted with a zero intercept. If the resulting trend line has a slope that varies from unity by more than 10% or an R2 of less than 0.8 the test run should be considered an invalid representation of that test cycle. The actual distance travelled by the dynamometer roller(s) should be used for the test cycle distance value. If at any point during the test, vehicle propulsion is not possible or the driver is warned by the vehicle to discontinue driving because the RESS energy supply is too low, the test is considered invalid. The RESS should be discharged and re-charged and the testing procedure restarted from the beginning of the interrupted test run.
18 of 30

Annex_A3
19 of 30
7. Reporting The final test report shall include all measured parameters including vehicle configuration, vehicle statistics, test cycle, measured parameters and calculated test results. See Appendix 5. The following information will be included in the report: Exhaust Emissions and Fuel Economy - The exhaust emissions and fuel economy of the vehicle shall be measured during each test. The measurements shall be reported in grams per kilometre and litres per 100 kilometre, respectively. Total fuel energy shall be reported in MJ. Actual Distance Travelled - The actual distance that the dynamometer roll surface travelled shall be measured during each test phase. SOC Difference and NEC - The state of charge difference of the RESS shall be measured during the test and reported along with the RESS NEC. Electrical Re-charge Energy - The energy required to re-charge the RESS after each emission test Tank-to-Wheel Emissions - Values for TTW emissions will be presented for CO, HC, NOx, PM, CO2, N2O and CH4 Well-to-Tank GHG Emissions - Values for WTT GHG emissions will be presented for the consumable fuel and the electrical energy supplied Well-to-Wheel GHG Emissions - Values for the total WTW GHG emissions will be presented, including the electrical component, as appropriate to the fuel in-use

Annex_A3
Appendix 1: MILLBROOK LONDON TRANSPORT BUS (MLTB) DRIVE-CYCLE (Also known as Route 159 Drive Cycle) This test cycle was specifically developed for use with buses and was derived from data logged from a bus in service within inner London. The drive cycle consists of two phases, a medium speed ‘Outer London’ phase simulating a journey from Brixton Station to Trafalgar Square and a low speed ‘Inner London’ phase simulating a journey from Trafalgar Square to the end of Oxford Street. The cycle is composed of two phases: (1) Outer London Phase, nominal distance 6.45 km, 1,380 seconds in duration (2) Inner London Phase, nominal distance 2.47 km, 901 seconds duration
0
10
20
30
40
50
60
0 200 400 600 800 1000 1200 1400 1600 1800
Test Time (secs)
General information The overall length of the test is 2,281 seconds and the nominal distance covered is 8.92 km. Test cell ambient temperature for duration of test = 18C 2C
20 of 30

Annex_A3
Appendix 2 : Well-to-Wheel Calculations
Worked Example from a test on a charge depleting hybrid single deck bus
Base Vehicle Data: 30 seated passengers, 18 standees, total 48 Passengers.
NEC Variance Test Using the bag mass emissions generated from the tests carried out and using the current data supplied from the data logging system, it was possible to derive the NEC corrections required from the chassis dynamometer tests in order to interpolate the level of CO2 emitted from the test vehicle at zero energy change. NEC = [SOCdelta ] * Vsystem
SOC = state of charge
V = nominal system voltage volts From the recorded fuel consumption figures it was possible to calculate the fuel energy consumed across each test
Test No. Fuel Consumption Fuel Used over Cycle Net Heating Energy Total Fuel Energy
(l/100km) (litres) (MJ/litre) (MJ) 1 12.55 1.143 35.67 40.77 2 13.36 1.205 35.67 42.98 3 12.60 1.155 35.67 41.20 4 12.22 1.113 35.67 39.70 5 12.58 1.104 35.67 39.38
It was then possible to derive the NEC variance across each test and determine whether the vehicle represents a charge depleting hybrid.
Test No. NEC NEC Total Cycle Energy NEC Variance (kWh) (MJ) (MJ) (%) 1 -2.983 -10.74 51.51 -20.8% 2 -2.690 -9.68 52.67 -18.4% 3 -3.059 -11.01 52.21 -21.1% 4 -3.127 -11.26 50.96 -22.1% 5 -3.154 -11.35 50.73 -22.4%
This procedure requires that the tests show consistent results with NEC values in excess of 5% of the total cycle energy so all of these tests are acceptable for this analysis.
21 of 30

Annex_A3
Calculation of GHG Emissions from Consumable Fuel The chassis dynamometer emission results are shown in the table below:
CO2 Emissions
CH4 Emissions
CO2 Equivalent
N2O Emissions
CO2 Equivalent
Calculated GHG Emissions (TTW) Test No.
(g/km) (g/km) (g/km) (g/km) (g/km) (CO2 Equivalent g/km)
1 341.5 0.000 0.0 0.006 1.9 343.4 2 352.5 0.000 0.0 0.007 2.2 354.7 3 344.8 0.000 0.0 0.005 1.6 346.4 4 357.1 0.000 0.0 0.006 1.9 359.0 5 349.2 0.000 0.0 0.007 2.2 351.4
Average 350.9
The bus was found to have an average Tank to Wheel (TTW) GHG output of 350.9g/km from the internal combustion engine alone based on all five tests. Adding the WTT GHG contribution gives:
Fuel Used Over Cycle
Net Heating Energy
Total Fuel Energy
WTT Diesel GHG Equivalence
Factor* Calculated WTT GHG Emissions
Calculated WTW GHG Emissions from
Consumable Fuel Test No.
(Litres) (MJ/Litre) (MJ) (CO2 Equivalent
g/MJ) (CO2 Equivalent
g/km) (CO2 Equivalent
g/km)
1 2.250 35.67 80.24 14.2 127.7 471.1 2 2.375 35.67 84.70 14.2 134.8 489.5 3 2.218 35.67 79.13 14.2 126.0 472.3 4 2.352 35.67 83.91 14.2 133.6 492.5 5 2.300 35.67 82.05 14.2 130.6 482.0
Average 481.5
Note, this procedure must be carried out separately for each fuel, if more than one has been used during the test. The average Well to Wheel (WTW) GHG emissions of the bus were calculated to be 481.5g/km from the internal combustion engine alone based on all five tests. Calculation of GHG Emissions from RESS Recharge Energy The Well to Wheel GHG contribution for electricity used to recharge the RESS is calculated below:
Recharge Energy
Electrical WTT Conversion
Factor Test
Distance
Calculated Electrical WTT
GHG Emissions**
Total WTW GHG
Emissions
Variation from
Average
Variation from Avg.
excl. 4 Test No.
(kWh) (CO2equiv
kg/kWh) (km) (CO2equiv g/km) (CO2equiv
g/km) (%) (%) 1 4.087 0.54418 8.910 249.6 720.7 -1.73% -0.39% 2 3.881 0.54418 8.940 236.2 725.7 -1.05% 0.31% 3 3.977 0.54418 8.909 242.9 715.2 -2.48% -1.15% 4 4.602 0.54418 8.925 280.6 773.1 5.41% 6.85% 5 4.100 0.54418 8.910 250.4 732.4 -0.14% 1.23%
Average of all tests 248.7 733.4 244.8 723.5 Average of tests 1, 2, 3, 5
Note, test 4 has been excluded from the final result because it lies outside the 5% validation range for GHG emissions (see section 6). Once this test has been removed from the overall average the remaining tests are checked again to see if they are within the 5% range of the new average, which they do. So the final WTW GHG value is the average of tests 1, 2, 3 and 5.
22 of 30

Annex_A3
The bus was found to have a WTW GHG output of 481.5 g/km from the engine alone, based on all five tests. Once test 4 had been excluded this dropped to 478.7 g/km. The bus was found to have a WTW GHG output of 248.7 g/km from energy supplied to recharge the RESS, based on all five tests. Once test 4 had been excluded this dropped to 244.8 g/km. The combined WTW GHG from both energy sources (RESS and internal combustion engine) is 723.5 g/km. WTW GHG target for a bus with a total passenger capacity of 48 passengers is 768 g/km Overall Well-to-Wheel is 723.5 g/km. Low Carbon Status OK * WTT GHG Equivalence factor for diesel taken from JRC-CONCAWE-EUCAR WTW Report Version 2, 3rd November
**
WTT GHG conversion factor for UK grid electricity taken from 'Defra GHG conversion factors for company reporting' (http://www.defra.gov.uk/environment/business/reporting/conversion-factors.htm)
23 of 30

Annex_A3
Appendix 3: Passenger Capacity vs. Greenhouse Gas Emissions (CO2 equivalent)
Passengers g/km Passengers g/km Passengers g/km22 612.0 61 846.0 100 1080.023 618.0 62 852.0 101 1086.024 624.0 63 858.0 102 1092.025 630.0 64 864.0 103 1098.026 636.0 65 870.0 104 1104.027 642.0 66 876.0 105 1110.028 648.0 67 882.0 106 1116.029 654.0 68 888.0 107 1122.030 660.0 69 894.0 108 1128.031 666.0 70 900.0 109 1134.032 672.0 71 906.0 110 1140.033 678.0 72 912.0 111 1146.034 684.0 73 918.0 112 1152.035 690.0 74 924.0 113 1158.036 696.0 75 930.0 114 1164.037 702.0 76 936.0 115 1170.038 708.0 77 942.0 116 1176.039 714.0 78 948.0 117 1182.040 720.0 79 954.0 118 1188.041 726.0 80 960.0 119 1194.042 732.0 81 966.0 120 1200.043 738.0 82 972.0 121 1206.044 744.0 83 978.0 122 1212.045 750.0 84 984.0 123 1218.046 756.0 85 990.0 124 1224.047 762.0 86 996.0 125 1230.048 768.0 87 1002.0 126 1236.049 774.0 88 1008.0 127 1242.050 780.0 89 1014.0 128 1248.051 786.0 90 1020.0 129 1254.052 792.0 91 1026.0 130 1260.053 798.0 92 1032.0 131 1266.054 804.0 93 1038.0 132 1272.055 810.0 94 1044.0 133 1278.056 816.0 95 1050.0 134 1284.057 822.0 96 1056.0 135 1290.058 828.0 97 1062.0 136 1296.059 834.0 98 1068.0 137 1302.060 840.0 99 1074.0 138 1308.0
LCEB 30% WTW GHG Emission Reduction Target in g/km vs. Maximum Passenger Capacity
Valid for:
MLTB test cycle only. Vehicles tested at: Mass of vehicle in running order (including 75kg driver),
plus 25% of total passenger load. Passengers assumed to weigh 63kg each. "Maximum passenger capacity" = Manufacturer stated capacity, OR
(GVW – Mass of vehicle in running order)/63, whichever is the lower.
24 of 30

Annex_A3
Appendix 4: Essential Characteristics of the Vehicle powered by a Charge Depleting Hybrid Electric Powertrain
The following information, when applicable, shall be supplied. If there are drawings, they shall be to an appropriate scale and show sufficient detail. They shall be presented in A4 format or folded to that format. In the case of microprocessor controlled functions, appropriate operating information shall be supplied. 1. GENERAL 1.1. Make (name of manufacturer):............................................................... 1.2. Type and commercial description (mention any variants): ..................... 1.3. Means of identification of type, if marked on the vehicle: ....................... 1.3.1. Location of that mark:............................................................................. 1.4. Name and address of manufacturer:...................................................... 1.5. Name and address of manufacturer’s authorized representative where appropriate: 1.6. Vehicle stabilization distance: .............................................................. 2. GENERAL CONSTRUCTION CHARACTERISTICS OF THE VEHICLE 2.1. Photographs and/or drawings of a representative vehicle:..................... 2.2. Powered axles (number, position, interconnection): .............................. 3. MASSES (kilograms) (refer to drawing where applicable) 3.1. Mass of the vehicle with bodywork in running order (including coolant,
oils, fuel, tools, spare wheel and driver): ................................................ 3.2. Technically permissible maximum laden mass as stated by the
manufacturer:......................................................................................... 3.3. Vehicle test mass: .................................................................................. 3.4. Theoretical maximum passenger capacity (3.2. – 3.1.)/63:.................... 4. DESCRIPTION OF POWER TRAIN AND POWER TRAIN COMPONENTS 4.1. Description of the hybrid electric vehicle 4.1.1. Category of Hybrid Electric vehicle: Off Vehicle Charging/Not Off Vehicle
charging 1/ 4.1.2. Operating mode switch : with/without 1/ 4.1.2.1. Selectable modes: 4.1.2.1.1. Pure electric : yes/no 1/ 4.1.2.1.2. Pure fuel consuming : yes/no 1/ 4.1.2.1.3. Hybrid modes : yes/no 1/ (if yes, short description) 4.1.3. General description of Hybrid Electric power train 4.1.3.1. Drawing of the hybrid powertrain system layout (engine/ motor/ transmission
combination 1/): ............................................................................................... 4.1.3.2. Description of the general hybrid powertrain working principle: ...................... 4.1.4. Manufacturer’s recommendation for preconditioning: ..................................... 4.2. Internal combustion engine 4.2.1. Engine manufacturer: 4.2.2. Manufacturer’s engine code (as marked on the engine, or other means of
identification): 4.2.2.1. Working principle: positive-ignition/compression-ignition, four-stroke/two-
stroke 1/ 4.2.2.2. Number and arrangement of cylinders: .................................................. 4.2.2.3. Engine capacity: 2/ ........cm3
25 of 30

Annex_A3
4.2.2.4. Maximum net power: …………. kW at ………………. min-1
4.2.2.5. Maximum net torque:…………...Nm at ………………..min-1 4.2.3. Fuel type: ………….. 4.2.4. Intake system: 4.2.4.1. Pressure charger: yes/no 1/ 4.2.4.2 Charge-air cooler: yes/no 1/ 4.2.5. Exhaust system 4.2.5.1. Description and drawings of the exhaust system: ............................................ 4.2.6. Lubricant used: 4.2.6.1. Make:................................................................................................................ 4.2.6.2. Type:................................................................................................................. 4.3. Measures taken against air pollution 4.3.1. Additional pollution control devices (if any, and if not covered by another
heading: 4.3.1.1. Catalytic converter: yes/no 1/ 4.3.1.1.1. Number of catalytic converters and elements: ................................................. 4.3.1.1.2. Dimensions and shape of the catalytic converter(s) (volume,...):..................... 4.3.1.1.3. Type of catalytic action: .................................................................................... 4.3.1.1.4. Regeneration systems/method of exhaust after-treatment systems,
description: 4.3.1.1.5. The number of MLTB operating cycles, or equivalent engine test bench
cycles, between two cycles where regenerative phases occur under the conditions equivalent to MLTB test. .................................................................
4.3.1.1.6. Parameters to determine the level of loading required before regeneration occurs (i.e. temperature, pressure etc.):...........................................................
4.3.1.1.7. Description of method used to load system during the test: ............................ 4.3.1.2. Oxygen sensor: yes/no 1/ 4.3.1.3. Air injection: yes/no 1/ 4.3.1.3.1. Type (pulse air, air pump,...): ........................................................................... 4.3.1.4. Exhaust gas recirculation (EGR): yes/no 1/ 4.3.1.5. Evaporative emission control system: yes/no 1/ 4.3.1.6. Particulate trap: yes/no 1/ 4.3.1.6.1. Dimensions and shape of the particulate trap (capacity):................................. 4.3.1.6.2. Type of particulate trap and design: ................................................................. 4.3.1.6.3. Location of the particulate trap (reference distances in the exhaust system):.. 4.3.1.6.4. Regeneration system/method. Description and drawing: ................................. 4.3.1.6.5. The number of MLTB operating cycles, or equivalent engine test bench
cycle, between two cycles where regeneration phases occur under the conditions equivalent to MLTB test:..................................................................
4.3.1.6.6. Parameters to determine the level of loading required before regeneration occurs (i.e. temperature, pressure, etc.):..........................................................
4.3.1.6.7. Description of method used to load system during the test:.............................
4.4. Traction battery / Energy storage device
4.4.1. Description of the energy storage device: (battery, capacitor, flywheel/generator/etc…) 4.4.1.1. Make: ............................................................................................................... 4.4.1.2. Type: ................................................................................................................ 4.4.1.3. Identification number: ...................................................................................... 4.4.1.4. Energy: .......... (for battery: voltage and capacity Ah in 2 h, for capacitor: J,...) 4.4.1.5. Charger: on board/ external/ without 1/ 4.4.1.6 Stabilization distance:....................................................................................... 4.5. Electric machines (describe each type of electric machine separately) 4.5.1. Make: ............................................................................................................... 4.5.2. Type: ................................................................................................................
26 of 30

Annex_A3
4.5.3. Primary use: traction motor / generator 1/ 4.5.4. Maximum power: ........................................................................................ kW 4.6. Internal combustion engine control unit 4.6.1. Manufacturer: .................................................................................................. 4.6.2. Type: ................................................................................................................ 4.6.3. Software Identification number: ....................................................................... 4.6.4 Calibration identification number: .................................................................... 4.7. Hybrid system control unit 4.7.1. Manufacturer: .................................................................................................. 4.7.2. Type: ................................................................................................................ 4.7.3. Software Identification number: ....................................................................... 4.7.4 Calibration identification number: ....................................................................
4.8. Transmission (if fitted) 4.8.1. Clutch (type): .................................................................................................... 4.8.1.1. Maximum torque conversion: ........................................................................... 4.8.2. Gearbox: 4.8.2.1. Type:................................................................................................................. 4.8.2.2. Location relative to the engine:......................................................................... 4.8.3. Control Unit:...................................................................................................... 4.8.3.1. Type: ................................................................................................................ 4.8.3.2. Software Identification number: ....................................................................... 4.8.3.3. Calibration identification number: .................................................................... 4.9. External Charger (if used) 4.9.1. Manufacturer: .................................................................................................. 4.9.2. Type: ................................................................................................................ 4.9.3. Charging mode used (if selectable): ................................................................
5. SUSPENSION 5.1. Tyres and wheels 5.1.1. Tyre/wheel combination(s) (for tyres indicate size designation, minimum
load-capacity index, minimum speed category symbol; for wheels, indicate rim size(s) and off-set(s):
5.1.1.1. Axle 1:............................................................................................................... 5.1.1.2. Axle 2:............................................................................................................... 5.1.1.3. Axle 3:............................................................................................................... 5.1.1.4. Axle 4: etc......................................................................................................... 5.1.2. Tyre pressure(s) as recommended by the manufacturer: ......................... kPa
6. BODYWORK
6.1. Seats: 6.1.1. Number of seats: 6.1.2. Number of standing passengers permitted
_____________ 1/ Strike out what does not apply. 2/ This value must be calculated with π = 3.1416 and rounded to the nearest cm3.
27 of 30

Annex_A3
Appendix 5: Test Report and Approval Note, only results from valid tests should be presented [Vehicle description and serial number] was submitted for accreditation as a Low Carbon Emission Bus on [date/month/year] by [supplier name and address] The vehicle was tested to Low Carbon Emission Bus test protocol Annex A3: Test Procedure for Measuring Fuel Economy and Emissions of Low Carbon Emission Buses powered by Charge Depleting Hybrid Powertrains at [technical service carrying out test] The vehicle was tested using [name of operating mode] operating mode The bus was inspected by [name of inspector] of [name of accreditation organization] The Essential Characteristics of the Vehicle are recorded in Appendix 4 of this document. The test was witnessed by [name of inspector] of [name of accreditation organization] Emissions results
Test Number
CO (g/km)
HC (g/km)
NOx (g/km)
PM (g/km)
CO2
(g/km) CH4
(g/km) N2O
(g/km)
NEC Variance Test Fuel energy consumed over tests
Test Number
Fuel consumption litres/100km
Fuel used over cycle litres
Net heating energy MJ/litre
Total fuel energy MJ
Net Energy Change over tests
Test Number
NEC - kWh NEC – MJ Total cycle energy NEC variance %
28 of 30
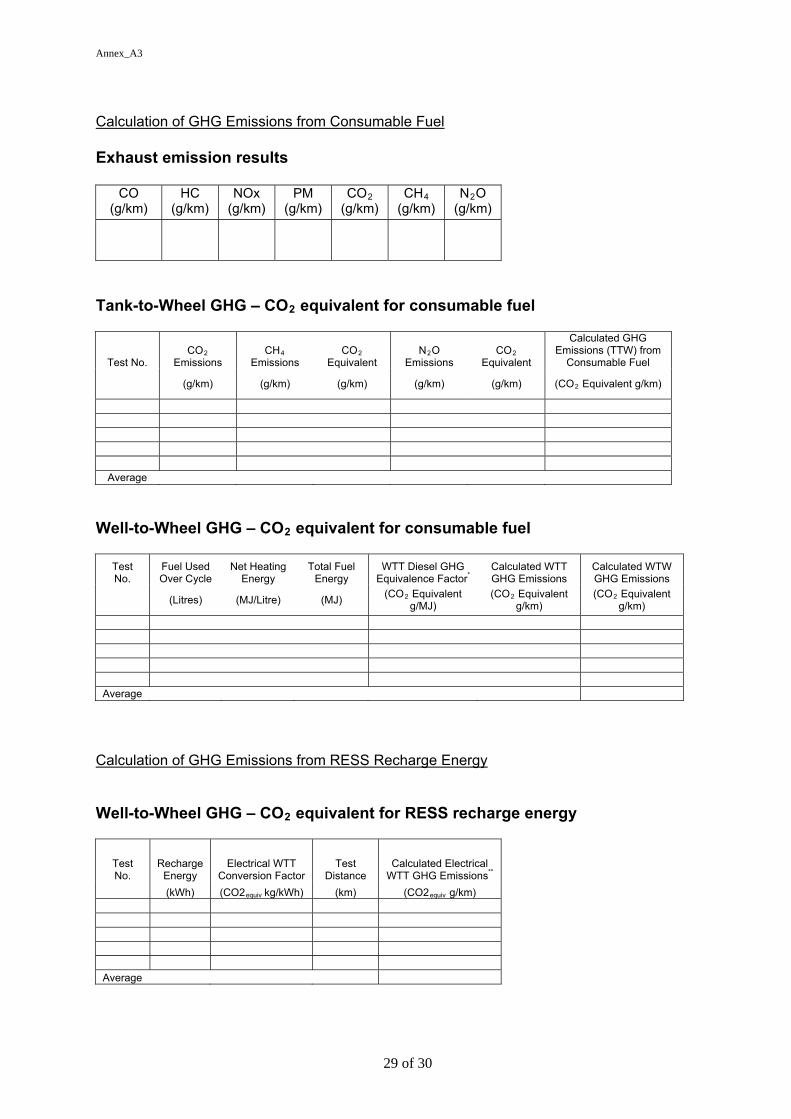
Annex_A3
Calculation of GHG Emissions from Consumable Fuel Exhaust emission results
CO (g/km)
HC (g/km)
NOx (g/km)
PM (g/km)
CO2
(g/km) CH4
(g/km) N2O
(g/km)
Tank-to-Wheel GHG – CO2 equivalent for consumable fuel
CO2 Emissions
CH4 Emissions
CO2 Equivalent
N2O Emissions
CO2 Equivalent
Calculated GHG Emissions (TTW) from
Consumable Fuel Test No.
(g/km) (g/km) (g/km) (g/km) (g/km) (CO2 Equivalent g/km)
Average
Well-to-Wheel GHG – CO2 equivalent for consumable fuel
Fuel Used Over Cycle
Net Heating Energy
Total Fuel Energy
WTT Diesel GHG Equivalence Factor*
Calculated WTT GHG Emissions
Calculated WTW GHG Emissions
Test No.
(Litres) (MJ/Litre) (MJ) (CO2 Equivalent
g/MJ) (CO2 Equivalent
g/km) (CO2 Equivalent
g/km)
Average
Calculation of GHG Emissions from RESS Recharge Energy Well-to-Wheel GHG – CO2 equivalent for RESS recharge energy
Test No.
Recharge Energy
Electrical WTT Conversion Factor
Test Distance
Calculated Electrical WTT GHG Emissions**
(kWh) (CO2equiv kg/kWh) (km) (CO2equiv g/km)
Average
29 of 30

Annex_A3
30 of 30
Calculation of Total GHG Emissions from Vehicle
Test No. Total WTW GHG
Emissions Variation from
Average
(CO2equiv g/km) (%)
Average
Well-to- Wheel Summary Consumable Fuel Tank-to-Wheel GHG (g/km)
Consumable Fuel Energy Consumption (MJ)
Consumable Fuel type
Consumable Fuel Well-to-Tank pathway value (g/MJ)
Consumable Fuel Well-to-Tank GHG (g/km)
Consumable Fuel Well-to-Wheel GHG (g/km)
Electrical Energy Consumption (MJ)
Electrical Pathway Correction (g/MJ)
Electrical Well-to-Tank GHG (g/km) (equivalent to WTW)
Overall Vehicle Well to Wheel GHG (g/km)
Target WTW for [passenger capacity of bus] Passengers (g/km)
Approved as Low Carbon Bus
Yes/No
Approval Low Carbon Vehicle Partnership approves the following vehicle(s) as a Low Carbon Emission Bus for [number of passengers] and above Manufacturer Vehicle Type Limitations All vehicle characteristics to be as defined in Appendix 4 of this document

Annex_A4
Annex A4: Test Procedure for Measuring Fuel Economy and Emissions of Low Carbon Emission Buses Powered by Pure Electric Powertrains
1 of 22

Annex_A4
2 of 22
TABLE OF CONTENTS
1 Scope 2 Definitions and Terminology 3. Test Preparations 3.1 Test Site 3.2 Pre-Test Data Collection 3.3 Operation of the vehicle 3.4 Condition of the Vehicle 3.5 Conditioning of Re-chargeable Energy Storage System 3.6 Dynamometer Specifications 3.7 Dynamometer Calibrations 3.8 Inertial Load 3.9 Road Load 3.10 Dynamometer Load Coefficient Determination 3.11 Dynamometer Settings 3.12 Test Instrumentation 4. Test Procedure 4.1 Vehicle Propulsion System Starting and Restarting 4.2 Dynamometer Driving Procedure 4.3 Dynamometer Warm-up 4.4 Practice and Warm Up Runs 4.5 Emission Tests 4.5.1 Initial Charge of RESS 4.5.2 The Emission Test 4.5.3 Re-charge of the RESS 4.5.4 Calculation of Energy Consumption and GHG Values 4.6 Test Termination 4.7 Air Conditioning 4.8 Re-charge Energy 4.9 Deviations from Standard Procedure 5. Test Validation 6. Reporting Appendix 1: Millbrook London Transport Bus (MLTB) Drive Cycle Appendix 2: Well-to-Wheel Calculations Appendix 3: Passenger Capacity vs. Greenhouse Gas Emissions (CO2 equivalent) Appendix 4: Essential Characteristics of the Vehicle Powered by a Pure Electric
Powertrain Appendix 5: Test Report and Approval

Annex_A4
1. Scope This document provides an accurate and reproducible procedure for simulating the operation of buses powered by pure electric powertrains on dynamometers for the purpose of measuring emissions and fuel economy. An electric vehicle is defined as having a rechargeable energy storage system (RESS) capable of releasing and capturing electrical energy. This procedure specifically includes batteries, capacitors and flywheels, although other types of RESS can be evaluated by following the guidelines provided. The procedure also provides a detailed description of correction for external charging of the EV in order to correct for RESS energy consumed during the test. This test procedure does not make specific provisions or recommendations for testing of bus emissions with air conditioning deployed because the complexity of such tests is significant. All auxiliary loads will be turned off during the test, unless they affect the normal operation of the vehicle. The intention is to test the vehicle in it's normal road-going condition and operating strategy as far as reasonably practical, within the constraints of the equipment and cycle. Potential exceptions to this include antilock brakes and traction control. Any aspect of vehicle operation which needs to be modified for the test shall be discussed with the test centre and recorded in the test report. The procedure requires the calculation of Well-to-Wheel (WTW) Greenhouse Gas (GHG) emissions in order to determine if the vehicle qualifies as a Low Carbon Emission Bus. The vehicle will be tested over the Millbrook London Transport Bus (MLTB) drive cycle representing intermediate-speed bus operation in London. Details of this cycle can be found in Appendix 1 of this document.
3 of 22

Annex_A4
2. Definitions and Terminology BATTERY -- A device that stores chemical energy and releases electrical energy. BATTERY C/3 CURRENT RATE -- The constant current (Amperes) at which the battery can be discharged from its rated capacity in three hours to its manufacturer’s recommended minimum. Battery manufacturers typically provide ratings from C/1 to C/6. These ratings have no direct impact on this recommended practice. BATTERY DEPTH OF DISCHARGE (DOD) -- The percentage of rated capacity to which a cell/battery is discharged. State of charge (SOC) % + DOD% = 100%. BATTERY RATED AMPERE-HOUR CAPACITY -- The manufacturer-rated capacity of a battery in Ampere-hours, obtained from a battery discharged at the manufacturer’s recommended discharge rate (C/1 - C/6) such that a specified minimum cut-off terminal voltage or state of charge is reached. BATTERY STATE OF CHARGE (SOC) – Based on the actual measured energy content of a battery and expressed in Ampere hours, or as a percentage of the battery’s maximum rated Ampere hour (Ah) capacity. CAPACITOR -- A device that stores energy electrostatically and releases electrical energy. CAPACITOR STATE OF CHARGE (SOC) – Based on the actual measured energy content of a capacitor and expressed as a percentage of the capacitor’s maximum rated voltage squared (V2). ELECTROMECHANICAL FLYWHEEL -- A device that stores rotational kinetic energy and can release that kinetic energy to drive the vehicle, either directly, or via an electric motor-generator system. ELECTROMECHANICAL FLYWHEEL STATE OF CHARGE (SOC) – Based on the actual measured energy content of an electromechanical flywheel and expressed as a percentage of the flywheel’s maximum-rated revolutions per minute squared (rpm2). NET ENERGY CHANGE (NEC) -- The net change in energy level of an RESS expressed in Joules (watt-seconds), or as a percentage of the Total Cycle Energy. PROPULSION ENERGY -- Energy that is derived from the vehicle’s rechargeable energy storage system to drive the wheels. If an energy source is supplying energy only to vehicle accessories (e.g., a 12-volt battery on a conventional vehicle), it is not acting as a source of propulsion energy. PROPULSION SYSTEM -- A system that, when started, provides propulsion for the vehicle in an amount proportional to what the driver commands. REGENERATIVE BRAKING -- Deceleration of the vehicle caused by operating an energy recovery system, thereby returning energy to the vehicle propulsion system and providing charge to the RESS or to operate on-board auxiliaries. RECHARGEABLE ENERGY STORAGE SYSTEM (RESS) -- A component or system of components that stores energy and for which its supply of energy is rechargeable by an electric motor-generator system, an off-vehicle electric energy source, or recovered
4 of 22

Annex_A4
kinetic energy, or a combination of thereof. Examples of RESS for HEVs include batteries, capacitors, and electromechanical flywheels. STATE OF CHARGE – see “Battery state of charge” TOTAL CYCLE ENERGY -- The total energy expended by the vehicle in driving the test cycle.
5 of 22
Annex_A4
3. Test Preparations
3.1 Test Site The ambient temperature levels encountered by the test vehicle shall be maintained at 18C 2C throughout the test Ambient temperatures must be recorded at the beginning and end of the test period. Test conditions specified in 70/220/EEC and 77/88/EEC shall apply, where appropriate. Adequate test site capabilities for safe venting and cooling of batteries, containment of flywheels, protection from exposure to high voltage, or any other necessary safety precaution shall be provided during testing. One or more speed tracking fans shall direct cooling air to the vehicle in an attempt to maintain the engine operating temperature as specified by the manufacturer during testing. These fans shall only be operating when the vehicle is in operation and shall be switched off for all key off dwell periods. Fans for brake cooling can be utilized at all times. Additional fixed speed fans should be used if required and must be documented in the test report.
3.2 Pre-Test Data Collection Prior to testing, detailed characteristics of the vehicle should be recorded. These requirements are specified in Appendix 4 of this Annex. The chassis test laboratory will be used to measure actual cycle distance during a test, as it is generally considered a more accurate method of calculation; as a result, an odometer on the vehicle is not required. 3.3 Operation of the vehicle If the vehicle is capable of several operating modes (e.g. delivery, limp-home, normal, etc.), and these can be selected by the driver then it shall be operated in the most appropriate mode for the drive cycle. This mode shall be decided by the manufacturer and recorded in the test report. If the vehicle is unable to be driven on the chassis dynamometer in a conventional operating mode then the reasons for this should be provided by the manufacturer in advance of the tests for reporting purposes. Any deviations from standard operation must be approved by the LowCVP prior to the issue of a LCEB certificate (where appropriate).
3.4 Condition of the Vehicle
Vehicle Stabilization -- Prior to testing, the vehicle shall be stabilized to a minimum distance of 3000km. This will be documented in the test report. Vehicle Test Weight -- Buses shall be tested at curb weight plus driver weight (75kg) and one quarter of the specified total passenger load using a weight of 63 kg per
6 of 22
Annex_A4
passenger. The curb weight of the vehicle shall be determined prior to test by the technical service carrying out the test. For buses which have previously been tested for Transport for London bus approval, this procedure can be followed retrospectively. In this case, the change in CO2 emissions due to the difference between the LCEB test inertia and the TfL test inertia shall be calculated using the following equation.
ΔCO2 = 0.0637 * ΔTI (Equation 1) where: ΔTI = Difference in test inertia, in kilograms (kg) Tyres -- Manufacturer’s recommended tyres shall be used and shall be the same size as would be used in service This will be documented in the test report. Tyre Pressure -- For dynamometer testing, tyre pressures should be set at the beginning of the test to manufacturer’s recommended pressure. This will be documented in the test report. Lubricants -- The vehicle lubricants normally specified by the manufacturer shall be used. This specification shall be supplied by the manufacturer in advance of the tests and recorded in the test report. Gear Shifting – The vehicle shall be driven with appropriate accelerator pedal movement to achieve the time versus speed relationship prescribed by the drive cycle. Both smoothing of speed variations and excessive acceleration pedal perturbations are to be avoided and may cause invalidation of the test run. In the case of test vehicles equipped with manual transmissions, the transmission shall be shifted in accordance with procedures that are representative of shift patterns that may reasonably be expected to be followed by vehicles in use. Vehicle Preparation & Preconditioning -- as a minimum, should include: Initial SOC setting (RESS discharge and recharge)
3.5 Conditioning of Rechargeable Energy Storage System RESS Failure -- In the event that the RESS is damaged or has an energy storage capability below the manufacturer’s specified rating, the RESS shall be repaired or replaced and stabilized, and then the test procedure should be repeated. Data from tests with a faulty RESS shall be considered invalid. The RESS must have undergone a minimum of 300km of vehicle operation prior to the test to allow for initial 'running-in' and shakedown.
3.6 Dynamometer Specifications The evaluation of the emissions and fuel economy from a low carbon bus powered by pure electric powertrain should be performed using a laboratory that incorporates a chassis dynamometer as described in 70/220/EEC (Light-duty vehicles) and 88/77/EC (Heavy-duty engines). The chassis dynamometer should be capable of simulating the transient inertial load, aerodynamic drag and rolling resistance associated with normal
7 of 22
Annex_A4
operations of the vehicle. The transient inertial load should be simulated using appropriately sized flywheels and/or electronically controlled power absorbers. The aerodynamic drag and rolling resistance may be implemented by power absorbers with an appropriate computer control system. The drag and rolling resistance should be established as a function of vehicle speed. The actual vehicle weight for the on-road coast down should be the same as the anticipated vehicle testing weight as simulated on the dynamometer. The vehicle should be mounted on the chassis dynamometer so that it can be driven through a test cycle. The driver should be provided with a visual display of the desired and actual vehicle speed to allow the driver to operate the vehicle on the prescribed cycle.
3.7 Dynamometer Calibrations The dynamometer laboratory should provide evidence of compliance with calibration procedures as recommended by the manufacturer.
3.8 Inertial Load Inertial load must be simulated correctly from a complete stop (e.g., total energy used to accelerate the vehicle plus road and aerodynamic losses should equal theoretical calculations and actual coastdowns). For EVs this may be determined by measuring the power delivered to the dynamometer at the drive motors. 3.9 Road Load Road load and wind losses should be simulated by an energy device such as a power absorber. Road load should be verified by comparison to previously tested vehicles having similar characteristics or by coastdown analysis on the track.
3.10 Dynamometer Load Coefficient Determination The dynamometer coefficients that simulate road-load forces shall be determined as specified in Directive 70/220/EEC, with the following provisions:
a) Vehicles equipped with regenerative braking systems that are actuated only by the brake pedal shall require no special actions for coastdown testing on both the test track and dynamometer.
b) Vehicles equipped with regenerative braking systems that are activated at
least in part when the brake pedal is not depressed shall have regenerative braking disabled during the deceleration portion of coastdown testing on both the test track and dynamometer, preferably through temporary software changes in the vehicle’s control system. Mechanical changes to the vehicle to deactivate regenerative braking (such as completely removing the drive shaft) are discouraged. However, if this practice becomes necessary as a last resort, every safety precaution shall be taken during vehicle operation, and the same mechanical modifications shall occur on both the test track and dynamometer. Methods to accelerate a vehicle without a drive shaft on both the test track and the dynamometer shall be determined by the manufacturer. However, pushing the vehicle with another vehicle is not an option.
c) The vehicles shall be weighted to the correct dynamometer test weight when
the on road coastdowns are performed.
3.11 Dynamometer Settings The dynamometer’s power absorption and inertia simulation shall be set as specified in
8 of 22

Annex_A4
70/220/EEC. It is preferable to insure that the dynamometer system provides the appropriate retarding force at all speeds, rather than simply satisfying a coastdown time between two specified speeds. The remaining operating conditions of the vehicle should be set to the same operating mode during coastdowns on road and on the dynamometer (e.g., air conditioning off, etc).
3.12 Test Instrumentation Equipment referenced in 70/220/EEC and 88/77/EC (including exhaust emissions sampling and analytical systems) is required for emissions measurements, where appropriate. All instrumentation shall be traceable. to national standards. The following instruments are likely to be required for determination of change of SOC on an as-needed usage. DC wideband Ampere-hour meter: Any meter using an integration technique
shall have an integration frequency of 10Hz or higher so that abrupt changes of current can be accommodated without introducing significant integration errors.
An instrument to measure a capacitor’s voltage An instrument to measure an electromechanical flywheel’s rotational speed AC Watt-hour meter to measure AC Recharge Energy A voltmeter and ammeter for as-needed usage
9 of 22

Annex_A4
4. Test Procedure
4.1 Vehicle Propulsion System Starting and Restarting The vehicle’s propulsion system shall be started according to the manufacturer’s recommended starting procedures in the owner’s manual. Only equipment necessary to the primary propulsion of the vehicle during normal service shall be operated. The air conditioner and other auxiliary on-board equipment not generally used during normal service shall be disabled during testing.
4.2 Dynamometer Driving Procedure The emission test sequence starts with a “hot” vehicle that can be utilized to warm the dynamometer to operating temperature and allow for vehicle rolling loss calibration.
4.3 Dynamometer Warm-up The test vehicle is used to warm the dynamometer and operated to allow for proper laboratory and vehicle loss calibrations.
4.4 Practice and Warm Up Runs The test vehicle will be operated through a preliminary run of the desired test cycle. During this preliminary cycle, the driver will become familiar with the vehicle operation. Additional preliminary runs will be made, if necessary, to assure that the vehicle, driver, and laboratory instrumentation are performing satisfactorily.
4.5 Emission Tests
The vehicle test includes the following basic steps: 1/ Initial charge of the RESS 2/ Operation of the vehicle to the appropriate drive cycle (see Appendix 1) 3/ Recharge of the RESS 4/ Calculation of the energy consumption and the GHG values
4.5.1 Initial Charge of RESS Prior to the first vehicle test only, it is necessary to discharge the RESS to a known level. This shall be accomplished by running the vehicle at 70% +5% of it's maximum 30 minute operating speed on the track or chassis dynamometer. The vehicle is operated at steady speed until one of the following conditions occurs:
The vehicle speed drops below 65% of it's maximum 30 minute speed The driver receives an instruction to stop from the standard vehicle
instrumentation The vehicle has covered 100km
The vehicle is then moved, preferably by towing, to a charging station where it shall be charged using the on-board charger. If no on-board charger is fitted to the vehicle then a charger which has been approved by the manufacturer and operates under the normal overnight charging pattern for the vehicle may be used. Charging must be carried out under the same temperature conditions as the test (18C 2C).
10 of 22

Annex_A4
The energy supplied to the vehicle or external charger (if used) during charging must be measured and recorded in the test report. It is important that the charging system delivers a conventional overnight charge. Special charging procedures, such as equalisation or maintenance must be avoided. The RESS shall be charged for 8 hours, unless the driver is given a clear indication, by the standard instrumentation, that at the end of this period charging is still incomplete. If the charge is incomplete at 8 hours then it shall continue to a maximum total duration of: (Equation 1)
Time (hours) = 3 * Stated RESS Capacity (Wh) Charger Power Supply (W)
The start and end times of charging shall be recorded in the test report along with the total energy delivered to the charger.
4.5.2 The Emission Test The emission test shall start within four hours of the end of charging, otherwise the discharge and recharge cycle must be repeated. If the vehicle is designed to receive energy during normal operation (e.g. via a pantograph or inductive pickup) then it is necessary to replicate this supply during the test. This must be performed in a manner which replicates real world operation as closely as reasonably practical. The energy supplied must be measured up-stream of the charging system and this value added to the recharge energy before calculation of GHG emissions. The operation of the system must be fully detailed in the test report. The test cycle shall begin by using the standard vehicle start up procedure,. At the end of the test cycle the vehicle shall be returned to the “key off” condition. The number of tests runs performed must be sufficient to provide a minimum of three test runs with valid results. If the test sequence lapses in timing, another discharge/recharge cycle must be performed, after which the schedule can be resumed. Valid data gained prior to the breaking of the schedule may be preserved and reported. It is important to adhere to the time schedule and soak periods because engines and aftertreatment devices are sensitive to operating temperature. During a series of emission tests it is permissable to use the re-charging cycle at the end of one test to act as the charging cycle prior to the next one. That is, there is no requirement to run a discharge cycle between the tests unless more than four hours have elapsed between the recharge cycle and the next test.
4.5.3 Recharge of the RESS Within 30 minutes of the end of the emission test, the vehicle shall be connected to the external power supply, or charger, and recharged according to the process used in 5.5.1. No discharge is required before the recharge. The start and end times of charging shall be recorded in the test report along with the total energy delivered to the charger.
11 of 22

Annex_A4
4.5.4 Calculation of Energy Consumption and GHG Values The electrical energy required to drive the test cycle is equal to the energy supplied to the charger or vehicle (if the charger is on-board) during the recharge operation in 5.5.3. It is necessary to calculate the amount of greenhouse gases that have been emitted during the generation of this electricity in order to correct the WTW GHG from the internal combustion engine. This is done by multiplying the electrical energy consumed by a WTT correction factor. Values for this correction factor are available from several sources but for consistency the latest version of the 'Defra GHG conversion factors for company reporting' should be used (http://www.defra.gov.uk/environment/business/reporting/conversion-factors.htm). In addition, because this data is updated yearly, the 5-year grid rolling average value for total GHG should be used in order to reduce the effect of fluctuations on the certification process. This is currently 0.54418 kg CO2 equivalent per kWh (2007 value, document updated June 2009). Note, the electrical WTT emissions are equivalent to the electrical WTW values because no further emissions are generated between the electrical 'tank' and the wheels. (Equation 2) Electrical WTW GHG = ERecharge * WTTE Conv Factor
* 1000 Distance
where Electrical WTW GHG = CO2 equivalent GHG emission (g/km) ERecharge = Energy supplied to the charger during vehicle recharge (kWh)
WTTE Conv Factor = Electrical Well to Tank conversion factor (kg/kWh) Distance = Test distance (km)
It is not currently possible to calculate correction factors for the other pollutants produced during the generation of electricity (e.g. particulates and carbon monoxide) because this data is not readily available. However, GHG emissions represent a global issue so their production location is immaterial and therefore it is important that they are included in the vehicle's emission inventory and assessment. Whereas, particulate matter and carbon monoxide etc. represent local air quality pollutants so they do not affect the location where the vehicle is operated and hence are not be included in the 'tailpipe inventory'. In addition, pollutant emissions from power stations are already the subject of separate legislation.
4.6 Test Termination The test shall terminate at the conclusion of the test run. 4.7 Air Conditioning Emissions from air conditioning systems are outside of the scope of this procedure. Air conditioning and conventional heating systems will therefore be switched off for the duration of the test
4.8 Recharge Energy The total energy supplied to the charger during charging must be recorded to an
12 of 22

Annex_A4
accuracy of + 1% or better. If the energy flow is measured continuously and subsequently integrated to give the total energy then it must be recorded at a frequency of 10Hz or greater throughout the charging period.
4.9 Deviations from Standard Procedure It is permissible to deviate from the prescribed procedure in cases where it can clearly be shown that this would result in a more realistic simulation of real-world vehicle operation. Any deviations from the standard test procedure must be recorded in the test report and approved by the LowCVP prior to the issue of a LCEB certificate (where appropriate).
13 of 22

Annex_A4
5. Test Validation There will be a minimum of three valid runs for each type of drive cycle. For a group of three tests to be valid the 'total GHG emissions' calculated for each test must lie within a 5% range. Any obvious error in the data should be identified and removed from the dataset; however, a minimum of three successful runs should be used in reporting the data. At the end of each run, the total distance travelled by the vehicle over the test run will be noted from the dynamometer distance measurements. Adherence of the driver to the test cycle target speeds will be noted, and a regression will be performed to compare actual speeds with target speeds on a second-by-second basis. Target speed (x) and actual speed (y) should be charted in 1Hz increments and a trend line inserted with a zero intercept. If the resulting trend line has a slope that varies from unity by more than 10% or an R2 of less than 0.8 the test run should be considered an invalid representation of that test cycle. The actual distance travelled by the dynamometer roller(s) should be used for the test cycle distance value. If at any point during the test, vehicle propulsion is not possible or the driver is warned by the vehicle to discontinue driving because the RESS energy supply is too low, the test is considered invalid. The RESS should be discharged and re-charged and the testing procedure restarted from the beginning of the interrupted test run.
14 of 22

Annex_A4
15 of 22
6. Reporting The final test report shall include all measured parameters including vehicle configuration, vehicle statistics, test cycle, measured parameters and calculated test results. See Appendix 5. The following information will be included in the report: Actual Distance Travelled - The actual distance that the dynamometer roll surface travelled shall be measured during each test phase. Electrical Re-charge Energy - The energy required to re-charge the RESS after each emission test Well-to-Wheel GHG Emissions - Values for the WTW GHG emissions will be presented
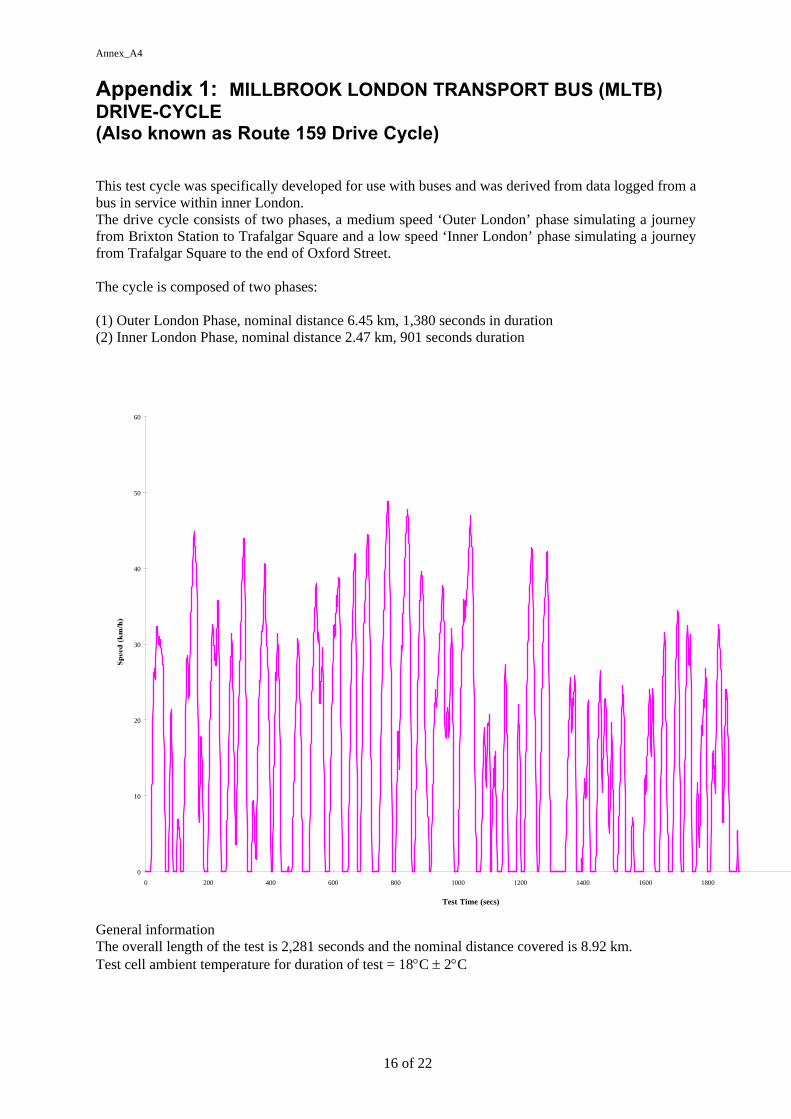
Annex_A4
Appendix 1: MILLBROOK LONDON TRANSPORT BUS (MLTB) DRIVE-CYCLE (Also known as Route 159 Drive Cycle) This test cycle was specifically developed for use with buses and was derived from data logged from a bus in service within inner London. The drive cycle consists of two phases, a medium speed ‘Outer London’ phase simulating a journey from Brixton Station to Trafalgar Square and a low speed ‘Inner London’ phase simulating a journey from Trafalgar Square to the end of Oxford Street. The cycle is composed of two phases: (1) Outer London Phase, nominal distance 6.45 km, 1,380 seconds in duration (2) Inner London Phase, nominal distance 2.47 km, 901 seconds duration
0
10
20
30
40
50
60
0 200 400 600 800 1000 1200 1400 1600 1800
Test Time (secs)
General information The overall length of the test is 2,281 seconds and the nominal distance covered is 8.92 km. Test cell ambient temperature for duration of test = 18C 2C
16 of 22

Annex_A4
Appendix 2 : Well-to-Wheel Calculations
Worked Example from a test on a pure electric single deck bus
Base Vehicle Data: 50 seated passengers, 25 standees, total 75 Passengers.
Calculation of GHG Emissions from RESS Recharge Energy The Well to Wheel GHG contribution for electricity used to recharge the RESS is calculated below:
Recharge Energy
Electrical WTT Conversion
Factor Test
Distance Calculated Electrical
WTT GHG Emissions**
Variation from
Average Variation from Avg. excl. 4
Test No.
(kWh) (CO2equiv kg/kWh) (km) (CO2equiv g/km) (%) (%) 1 14.457 0.54418 8.910 883.0 -2.19% -0.45% 2 14.542 0.54418 8.940 885.2 -1.94% -0.20% 3 14.483 0.54418 8.909 884.7 -2.00% -0.26% 4 15.839 0.54418 8.925 965.7 6.98% 8.88% 5 14.653 0.54418 8.910 895.0 -0.86% 0.90%
Average of all tests 902.7 Average of tests 1, 2, 3, 5 886.9
Note, test 4 has been excluded from the final result because it lies outside the 5% validation range for GHG emissions (see section 6). Once this test has been removed from the overall average the remaining tests are checked again to see if they are within the 5% range of the new average, which they do. So the final WTW GHG value is the average of tests 1, 2, 3 and 5. The bus was found to have a WTW GHG output of 902.7 g/km from energy supplied to recharge the RESS, based on all five tests. Once test 4 had been excluded this dropped to 886.9 g/km. WTW GHG target for a bus with a total passenger capacity of 75 passengers is 930 g/km Overall Well-to-Wheel is 886.9 g/km. Low Carbon Status OK
**
WTT GHG conversion factor for UK grid electricity taken from 'Defra GHG conversion factors for company reporting' (http://www.defra.gov.uk/environment/business/reporting/conversion-factors.htm)
17 of 22

Annex_A4
Appendix 3: Passenger Capacity vs. Greenhouse Gas Emissions (CO2 equivalent)
Passengers g/km Passengers g/km Passengers g/km22 612.0 61 846.0 100 1080.023 618.0 62 852.0 101 1086.024 624.0 63 858.0 102 1092.025 630.0 64 864.0 103 1098.026 636.0 65 870.0 104 1104.027 642.0 66 876.0 105 1110.028 648.0 67 882.0 106 1116.029 654.0 68 888.0 107 1122.030 660.0 69 894.0 108 1128.031 666.0 70 900.0 109 1134.032 672.0 71 906.0 110 1140.033 678.0 72 912.0 111 1146.034 684.0 73 918.0 112 1152.035 690.0 74 924.0 113 1158.036 696.0 75 930.0 114 1164.037 702.0 76 936.0 115 1170.038 708.0 77 942.0 116 1176.039 714.0 78 948.0 117 1182.040 720.0 79 954.0 118 1188.041 726.0 80 960.0 119 1194.042 732.0 81 966.0 120 1200.043 738.0 82 972.0 121 1206.044 744.0 83 978.0 122 1212.045 750.0 84 984.0 123 1218.046 756.0 85 990.0 124 1224.047 762.0 86 996.0 125 1230.048 768.0 87 1002.0 126 1236.049 774.0 88 1008.0 127 1242.050 780.0 89 1014.0 128 1248.051 786.0 90 1020.0 129 1254.052 792.0 91 1026.0 130 1260.053 798.0 92 1032.0 131 1266.054 804.0 93 1038.0 132 1272.055 810.0 94 1044.0 133 1278.056 816.0 95 1050.0 134 1284.057 822.0 96 1056.0 135 1290.058 828.0 97 1062.0 136 1296.059 834.0 98 1068.0 137 1302.060 840.0 99 1074.0 138 1308.0
LCEB 30% WTW GHG Emission Reduction Target in g/km vs. Maximum Passenger Capacity
Valid for:
MLTB test cycle only. Vehicles tested at: Mass of vehicle in running order (including 75kg driver),
plus 25% of total passenger load. Passengers assumed to weigh 63kg each. "Maximum passenger capacity" = Manufacturer stated capacity, OR
(GVW – Mass of vehicle in running order)/63, whichever is the lower.
18 of 22

Annex_A4
Appendix 4: Essential Characteristics of the Vehicle powered by a Pure Electric Powertrain
The following information, when applicable, shall be supplied. If there are drawings, they shall be to an appropriate scale and show sufficient detail. They shall be presented in A4 format or folded to that format. In the case of microprocessor controlled functions, appropriate operating information shall be supplied. 1. GENERAL 1.1. Make (name of manufacturer):............................................................... 1.2. Type and commercial description (mention any variants): ..................... 1.3. Means of identification of type, if marked on the vehicle: ....................... 1.3.1. Location of that mark:............................................................................. 1.4. Name and address of manufacturer:...................................................... 1.5. Name and address of manufacturer’s authorized representative where appropriate: 1.6. Vehicle stabilization distance: .............................................................. 2. GENERAL CONSTRUCTION CHARACTERISTICS OF THE VEHICLE 2.1. Photographs and/or drawings of a representative vehicle:..................... 2.2. Powered axles (number, position, interconnection): .............................. 3. MASSES (kilograms) (refer to drawing where applicable) 3.1. Mass of the vehicle with bodywork in running order (including coolant,
oils, fuel, tools, spare wheel and driver): ................................................ 3.2. Technically permissible maximum laden mass as stated by the
manufacturer:......................................................................................... 3.3. Vehicle test mass: .................................................................................. 3.4. Theoretical maximum passenger capacity (3.2. – 3.1.)/63:.................... 4. DESCRIPTION OF POWER TRAIN AND POWER TRAIN COMPONENTS 4.1. Description of the pure electric vehicle 4.1.1. Category of Electric vehicle: Off Vehicle Charging/Not Off Vehicle
charging 1/ 4.1.2. Operating mode switch : with/without 1/ 4.1.2.1. Selectable modes: 4.1.2.1.1. Pure electric : yes/no 1/ 4.1.2.1.2. Pure fuel consuming : yes/no 1/ 4.1.2.1.3. Operating modes : yes/no 1/ (if yes, short description) 4.1.3. General description of Electric power train 4.1.3.1. Drawing of the powertrain system layout (engine/ motor/ transmission
combination 1/): ............................................................................................... 4.1.3.2. Description of the general powertrain working principle: ................................. 4.1.4. Manufacturer’s recommendation for preconditioning: .....................................
4.2. Traction battery / Energy storage device
4.2.1. Description of the energy storage device: (battery, capacitor, flywheel/generator/etc…) 4.2.1.1. Make: ............................................................................................................... 4.2.1.2. Type: ................................................................................................................ 4.2.1.3. Identification number: ...................................................................................... 4.2.1.4. Energy: .......... (for battery: voltage and capacity Ah in 2 h, for capacitor: J,...) 4.2.1.5. Charger: on board/ external/ without 1/
19 of 22

Annex_A4
4.2.1.5 Stabilization distance:....................................................................................... 4.3. Electric machines (describe each type of electric machine separately) 4.3.1. Make: ............................................................................................................... 4.3.2. Type: ................................................................................................................ 4.3.3. Primary use: traction motor / generator 1/ 4.3.4. Maximum power: ........................................................................................ kW 4.4. External charger 4.4.1. Manufacturer: .................................................................................................. 4.4.2. Type: ................................................................................................................ 4.4.3. Charging mode used: ...................................................................................... 4.5. Powertrain control unit 4.5.1. Manufacturer: .................................................................................................. 4.5.2. Type: ................................................................................................................ 4.5.3. Software Identification number: ....................................................................... 4.5.4 Calibration identification number: ....................................................................
4.6. Transmission (if fitted) 4.6.1. Clutch (type): .................................................................................................... 4.6.1.1. Maximum torque conversion: ........................................................................... 4.6.2. Gearbox: 4.6.2.1. Type:................................................................................................................. 4.6.2.2. Location relative to the engine:......................................................................... 4.6.3. Control Unit:...................................................................................................... 4.6.3.1. Type: ................................................................................................................ 4.6.3.2. Software Identification number: ....................................................................... 4.6.3.3. Calibration identification number: ....................................................................
5. SUSPENSION 5.1. Tyres and wheels 5.1.1. Tyre/wheel combination(s) (for tyres indicate size designation, minimum
load-capacity index, minimum speed category symbol; for wheels, indicate rim size(s) and off-set(s):
5.1.1.1. Axle 1:............................................................................................................... 5.1.1.2. Axle 2:............................................................................................................... 5.1.1.3. Axle 3:............................................................................................................... 5.1.1.4. Axle 4: etc......................................................................................................... 5.1.2. Tyre pressure(s) as recommended by the manufacturer: ......................... kPa
6. BODYWORK
6.1. Seats: 6.1.1. Number of seats: 6.1.2. Number of standing passengers permitted
_____________ 1/ Strike out what does not apply. 2/ This value must be calculated with π = 3.1416 and rounded to the nearest cm3.
20 of 22

Annex_A4
Appendix 5: Test Report and Approval Note, only results from valid tests should be presented for approval [Vehicle description and serial number] was submitted for accreditation as a Low Carbon Emission Bus on [date/month/year] by [supplier name and address] The vehicle was tested to Low Carbon Emission Bus test protocol Annex A4: Test Procedure for Measuring Fuel Economy and Emissions of Low Carbon Emission Buses powered by Pure Electric Powertrains at [technical service carrying out test] The vehicle was tested using [name of operating mode] operating mode The bus was inspected by [name of inspector] of [name of accreditation organization] The Essential Characteristics of the Vehicle are recorded in Appendix 4 of this document. The test was witnessed by [name of inspector] of [name of accreditation organization] Well-to-Wheel GHG – CO2 equivalent for RESS recharge energy
Recharge Energy
Electrical WTT Conversion Factor
Test Distance
Calculated Electrical WTT GHG Emissions**
Variation from Average Test No.
(kWh) (CO2equiv kg/kWh) (km) (CO2equiv g/km) (%)
Average
Well-to- Wheel Summary Electrical Energy Consumption (MJ)
Electrical Pathway Correction (g/MJ)
Well-to-Tank GHG (g/km) (equivalent to WTW)
Target WTW for [passenger capacity of bus] Passengers (g/km)
Approved as Low Carbon Bus
Yes/No
21 of 22

Annex_A4
22 of 22
Approval Low Carbon Vehicle Partnership approves the following vehicle(s) as a Low Carbon Emission Bus for [number of passengers] and above Manufacturer Vehicle Type Limitations All vehicle characteristics to be as defined in Appendix 4 of this document