by abdul samad mahomed submitted in partialfulfillment
TRANSCRIPT

A PHYTOCHEMICAL INVESTIGATIONOF ACRIDOCARPUS NATALITIUS
AND TYPHA CAPENSIS
By Abdul Samad Mahomed
Submitted in partial fulfillment of therequirements for the degree of Master of Science
in the Department of Chemistry, University ofDurban-Westville, Durban
4000

I
PREFACE
The experimental work described in this dissertation was carried out in Department ofChemistry, University of Durban-Westville, Durban, from February 1999 toSeptember 2000 under the supervision ofDr. F. O. Shode.
This study represents original work by the author and has not been submitted in anyother form to another university. Where use was made of the work of others, it hasbeen duly acknowledged in the text.
Signed:
--~----"---A. S. Mahomed
I hereby certify that the above statement is correct.
Signed:~ ~SG..o~
-----Jl!-~------------------ _Dr. F. O. Shode

II
ACNOWLEDGEMENTS
I thank Almighty God for the privelege of an education, for the knowledge he has
bestowed on me and for his guidance.
I also wish to express my sincere gratitude to:
Dr. F.a. Shode for his continuous support, his guidance, constructive criticism and
encouraging enthusiasm during this study. His friendship and loyalty, his willingness
to help with the most trivial of problems and his patience has been invaluable. A
great deal of the knowledge that I have acquired during this work was due to his
unselfish need to let others learn, for this I am truly grateful.
Professor C.B. Rogers for his assistance, advice, his patience amidst my continuous
interruptions and for guiding me whenever I went astray.
Dr. Neil Crouch for collection of plant material, for the slides and for his assistance in
the literature survey ofAcridocarpus natalitius. Mr. P. Poorun for his assistance in
collection and identification of plant material.
Mr. D. Jagjivan of the University of Natal for kindly recording NMR spectra, for his
advice and for his friendship.
Dr. P. Boshoff at the Cape Technikon for the running of high-resolution mass spectra
and Dr. D. Pienaar for running mass spectra at the University of Durban-Westville.
Mr. S. Singh for his friendship, guidance and assistance during my stay at this
university. Mr. L. Naidoo, Mrs. M. Padayachee, Mr. S. Sewsanker, Mr. M.
Nundkumar, Mrs. S . Sooklall, Mr. S. Naidoo, Mrs. P. Govender, Mr. A. Bissessur
and Miss R. Singh for their help and friendship. Miss 1. Toplan, for her assistance in
correcting this manuscript, chemicals and apparatus, and her invaluable friendship.
To all my friends past and present, especially Mr. 1. Chetty, Miss. A. Hariram, Mr. L.
Qwabe, Mr. S. Sarabjeet, Miss P. Gengan, Mr. V. Chunilall and Mr S. Ntlahla.

III
My parents, for all the years of sacrifice, guidance, good advice, patience, love and
good example.
My family and relatives for their moral support and finally Sasol and the University of
Durban-Westville for financial assistance.

IV
ABSTRACT
In the present study, a phytochemical investigation of two medicinal plants, namely,
Acridocarpus natalitius and Typha capensis is presented.
The roots ofA. natalitius afforded a variety of pentacyclic triterpenoids, namely,
friedelin [41], epi-friedelinol [42], lupeol [43] and oleanolic acid [44], including
stigmasterol [45] from the hexane extract, whilst the methanolic extract produced a
flavonoid, (-)-epicatechin [4] and carbohydrates which included glucose [64] and
sucrose [65].
Two new bibenzyls were isolated from the hexane extract of the rhizhomes of T
capensis, namely, typharin [47J and typhaphthalide [48]. P-Sitosterol [49] was also
isolated. The acetone extract afforded several flavan-3-0Is which were isolated in
their free phenolic form. These include, afzelechin [10], epiafzelechin [23], (+)
catechin [11] and (-)-epicatechin [4]. A biological survey was carried out on the
crude methanolic extract in an independent survey and a brief discussion is presented
here.
All the compounds were isolated using a series of chromatographic techniques and
structures were elucidated by means ofNMR spectroscopy, infrared spectroscopy and
mass spectrometry.

I3C NMR
IHNMR
A
Ac-MVA
ADEPT
B
brs
CDCh
CoA
COSY
d
D20
dd
DMAPP
2,4-DNPH
EA
FPP
GGPP
GFPP
GPP
H
HETCOR
Hz
IPP
IR
M/MeOH
m
MEP
MP
MS
LIST OF ABBREVIATIONS
- carbon-I 3 magnetic resonance spectroscopy
- proton magnetic resonance spectroscopy
- acetone
- acetate mevalonic acid
- distortionless enhancement by polarisation transfer
- benzene
- broad singlet
- deuterated chloroform
- coenzyme A
- correlation nuclear magnetic resonance spectroscopy
- doublet
- deuterated water
- doublet of doublets
- dimethylallyl diphosphate
- 2,4 dinitrophenyl hydrazine
- ethyl acetate
- farnesyl pyrophosphate
- geranylgeranyl pyrophosphate
- geranylfarnesyl pyrophosphate
- geranyl pyrophosphate
- hexane
- heteronuclear shift correlation nuclear magnetic resonance
- hertz
- inosine pyrophosphate/isopentenyl diphosphate
- infrared spectroscopy
- methanol
- multiplet
- 2-C-methyl erythritol 4-phosphate
- melting point
- mass spectrometry
v

NADH
NADPH
NOESY
PE
PLC
ppm
q
s
t
TLC
UV
- nicotinamide adenine dinucleotide
- nicotinamide adenine dinucleotide phosphate
- nuclear overhauser effect spectroscopy
- petroleum ether
- preparative layer chromatography
- parts per million
- quartet
- quartet of quartets
- singlet
- triplet
- thin layer chromatography
- ultra violet
VI

VII
LIST OF FIGURES
Chapter Four Page
Figure 4.1: Bark 46
Figure 4.2: Flowers 46
Figure 4.3: Fruits resembling 'moths' of A. natalitius 46
Figure 4.4: Leaves (broad, lanceolate) 47
Figure 4.5: Roots in their natural habitat 47
Figure 4.6: Expansion ofEF-l showing H-3 doublet of epi-friedelinol 59
Figure 4.7: Stereochemistry offriedelin A-ring 59
Chapter Five
Figure 5.1: Distribution of T. capensis in Southern Africa
Figure 5.2: Flowering and fruiting stalks of T. capensis
Figure 5.3: Rhizomes as they are sold for medicinal use
Figure 5.4: Typhasterol
Figure 5.5: Fragment A}
Figure 5.6: Fragment B Structure elucidation oftypharin
Figure 5.7: Fragment C
Figure 5.8: Expansion ofH-3 quartet
Figure 5.9: Fragment D
Figure 5.10: Fragment E Structure elucidation oftypharin
Figure 5.11: Fragment F
Figure 5.12: Fragment G
Figure 5.13: (E)- propenylbenzene
Figure 5.14: [47] showing long range coupling
Figure 5.15: 3-D structures of [47]
Figure 5.16: Fragments A and B} Structure elucidation oftyphaphthalide
Figure 5.17: Fragment C
Figure 5.18: 3-D structures of [48]
61
62
62
63
67
68
69
70
70
71
71
72
72
73
73
77
78
79

Chapter Six
Figure 6.1: Set-up for flash column chromatography
VIII
89

IX
LIST OF TABLES
Chapter Two Page
Table 2.1: Suggested names for naturally occurring Flavan-3-o1s 11
Table 2.2: I3C chemical-shift ranges for various carbon types encountered in
flavonoids 17
Table 2.3: List of enzymes leading to various flavonoid classes 21
Chapter Three
Table 3.1: Chemical shifts of the different species of carbons in pentacyclic
triterpenoids 34
Table 3.2: Effect of 3-oxo group on C-23 of selected friedelanes 36
Table 3.3: Effect of3-0H group on C-23 of selected friedelanes 36
Chapter Five
Table 5.1: Comparative l3C NMR (ppm) data of (E)-propenylbenzene and fragment
G oftypharin 72
Table 5.2: l3C NMR data (ppm) of [47] and [57] (selected carbons) 75
Table 5.3: Comparative IH NMR data (ppm) of [47] and [58] 76
Table 5.4: NMR data of selected atoms [60], [61] and [48] 80
Chapter Seven
Table 7.1: Summary of fractions ofhexane extract ofA. natalitius
Table 7.2: Summary of fractions of methanol extract of A. natalitius
Chapter Eight
Table 8.1: Summary of fractions ofhexane extract of T capensis
Table 8.2: Summary of fractions of acetone extract of T capensis
94
99
103
106

x
LIST OF SCHEMES
Chapter Two Page
Scheme 2.1: Structures of monomeric flavonoids 7
Scheme 2.2: Structures of natural flavan-3-0Is (2R,3S configuration) 12
Scheme 2.3: Structures of basic skeletons of the Flavanoids 15
Scheme 2.4: Biosynthetic pathways to major flavonoid classes 22
Chapter Three
Scheme 3.1: Common terpenoid skeleta 26
Scheme 3.2: Pentacyclic triterpenoid skeleta 28
Scheme 3.3: Terpenoid skeleta (to C2S) derived from the MAP 38
Scheme 3.4: Formation of squalene 40
Scheme 3.5: Formation ofthe protosteryl cation (tetracyclic precursor) 41
Scheme 3.6: Formation of the dammarenyl cation (pentacyclic precursor) 42
Scheme 3.7: Formation of the lupenyl and oleanyl cations 43
Scheme 3.8: "Friedo" rearrangement 44
Appendix
Scheme M1: Fragmentation of Typhaphthalide [48] 161
Scheme M2: Fragmentation of Afzelechin tetraacetate [54] and Epiafzelechin
tetraacetate [55] 164

STRUCTURE LIST OF COMPOUNDS ISOLATED
XI
Compound Page
i) Friedelin [41] 49
ii) Epi-Friedelinol [42] 51
iii) Lupeol [43] 52
iv) Oleanolic Acid [44] 53
v) Stigmasterol [45] 54
vi) (-)-Epicatechin [4] 55
vii) (-)-Epicatechin pentaacetate [46] 55
viii) Glucose [64J 56
ix) Sucrose [65] 57
x) Typhaphthalide [48] 64xi) Typharin [47] 65
xii) P-Sitosterol [49] 66xiii) Afzelechin [10] 81xiv) Afzelechin tetraacetate [54] 81xv) Epiafzelechin [23] 82xvi) Epiafzelechin tetraacetate [55J 82xvii) (+)-Catechin [11] 84xviii) (+)-Catechin pentaacetate [56] 84

TABLE OF CONTENTS
Preface I
Acknowledgements 11
Abstract IV
List of Abbreviations V
List of Figures VII
List of Tables IX
List of Schemes X
Structure list of compounds isolated XI
PART A
Chapter One: Introduction
Chapter Two: The flavonoids
2.1 Introduction
2.2 The flavan-3-0Is
2.3 Structure elucidation of the flavonoids
2.4 Biosynthesis of the flavonoids
Chapter Three: The Triterpenoids
3.1 Introduction to the terpenoids
3.2 The pentacyc1ic triterpenoids
3.3 Structure elucidation of the pentacyc1ic triterpenoids
3.4 Biosynthesis of the terpenoids
1
4
8
13
19
23
27
33
37

PARTB
ResultslDiscussion
Chapter Four: Extractives from A. natalitius
4.1 Introduction
4.2 Pentacyclic triterpenoids and stigmasterol
4.3 (-)-Epicatechin and carbohydrates
4.4 Attempted synthesis of epi-friedelinol
Chapter Five: Extractives from T capensis
5.1 Introduction
5.2 Bibenzyls and ~-Sitosterol
5.3 Structure elucidation oftypharin
5.4 Structure elucidation of typhaphthalide
5.5 Flavan-3-ols
5.6 Spray Colours
5.7 Biological Activity
PARTC
Experimental
Chapter Six: Standard experimental procedure
6.1 Chromatographic Methods
6.2 Spectroscopic Methods
6.3 Chemical Methods
45
48
55
58
61
64
67
76
81
86
86
88
91
92
Chapter Seven: Isolation of extractives from Acridocarpus natalitius
7.1 Extraction of root
7.2 Separation
7.2.1 Hexane extract
7.2.2 Methanol extract
7.3 Attempted synthesis of epi-friedelinol
Chapter Eight: Isolation of compounds from Typha capensis
8.1 Extraction of root
8.2 Separation
8.2.1 Hexane Extract
8.2.2 Acetone Extract
8.3 Spray reagents
8.4 Biological Activity
PARTD
Appendix
9. 1D-NMR spectroscopy
9.1 IHNMR
9.2 13CNMR
9.3 ADEPT
10. 2D-NMR spectroscopy
11.1 COSY
11.2 HETCOR
11.3 NOESY
93
93
93
98
100
102
102
102
106
109
109
111
131
131
147
147
147

11. IR spectroscopy
12. Mass spectrometry
13. NMR data tables
References
154
154
165
176

PART A
INTRODUCTION ANDLITERATURE SURVEY

1
CHAPTER ONE
INTRODUCTION
Biodiversity is a term commonly used to denote the variety of species and the
multiplicity of forms of life. But this variety is deeper than is generally imagined. In
addition to the process of primary metabolism that involve essentially the same
chemistry across great swathes of life, there are a myriad of secondary metabolites
natural products - usually confined to a particular group of organisms, or to a single
species, or even to a single strain growing under certain conditions. In most cases we
do not really know what biological role these compounds play, except that they
represent a treasure trove of chemistry that can be of both interest and benefit to us.
Tens of thousands of natural products have been described, but in a world where we
are not even close to documenting all the extant species, there are almost certainly
many more thousands of compounds waiting to be discovered! .
Many scientists would echo this sentiment and this is the driving force behind any
study of this kind. In addition, we are fortunate that here in South Africa we have a
wide cultural diversity amongst the many different race groups; many of whom have
chosen to carry on the traditions of their forefathers. Hence a huge library of
knowledge has been established with regards to how the different ethnic groups use
plants for a wide variety of applications, which include medicinal, cosmetic and even
spiritual.
It has become common practice for many people the world over, to resort to
alternative medicine rather than take the conventional path. This behavior of
obtaining 'remedies' from nature is an age-old tradition especially amongst the
indigenous people from all the continents. From the rain forests of the Amazon to the
deserts of Asia, plants have proved a rich source of therapeutic substances.
In the past, studies of medicinal plants were governed by their uses by the native
people. Although this was a limiting approach, it proved very successful in the light
of numerous drugs being identified from such plants. However, the impact of modem

2
diseases like Aids for example, has encouraged scientists to look at plants that were
not considered significant as medicinal plants.
The excitement of the discovery of novel compounds is heightened when such
compounds show biological activity. It must be remembered however, that although
certain compounds may not show immediate activity in their standard form, a mere
modification or functionalisation of the compound might render it a potent drug or
biologically active. Hence, the work of a natural product chemist does not end at the
isolation and identification stage, but continues until all avenues of scientific and/or
biological research are exhausted. A monotonous and time consuming process indeed
but, one that pays dividends for both the discoverer as well as those who will benefit
from its therapeutic properties.
Taking into account the vast number of plant species that still remain hidden from the
onslaught of modem natural chemistry, it was the aim of this work to study the
chemistry of two plants that fell on opposite sides of the spectrum in terms of what is
a medicinal plant and what is not. The first is a plant that as tradition would have it, is
used for a variety of different medicinal applications, while the second is used mainly
as a 'charm' plant, the use of which is invoked by the deep spiritual needs of the
indigenous people.
The approach was to study the same part of both plants, gain an understanding of their
chemistry and finally draw conclusions with reference to their use. The methodology
was simple and involved some mechanical means to crush the plant parts used and
chemical means to extract and isolate the compounds of interest. Finally, various
instrumental analytical techniques were used to identify as many of the compounds as
possible. By no means does this imply that the chemical study of these plants is
exhausted, quite the contrary, as many minor components need to be searched out and
identified. Another point of note is the fact that certain compounds or metabolites
occur at different stages of growth in plants; therefore, depending at which stage of
development the particular part of the plant was harvested, this could have severe
implications as to the type of compounds isolated and the relative composition of
these metabolites. As a result, different samples of each plant were studied and
comparisons drawn therefrom.

3
The study proved fruitful in the light of the fact that these plants were studied for the
first time. As a result valuable information regarding their phytochemistry was
established.

4
CHAPTER TWO
THE FLAVONOIDS
2.1 INTRODUCTION
The flavonoids, which are one of the most diverse and widespread groups of natural
constituents, have invoked a great deal of interest due to their many properties and
applications. The attractive colours of flowers, leaves and fruit are mainly due to the
water soluble anthocyanins, tannins and flavones. Some flavonoids have commercial
importance and play a role in the tanning of leather, the manufacture of cocoa, the
flavouring qualities of foodstuffs and many adhesive applications in the wood industry2.
The near ubiquitous distribution of flavonoids in green plants, their relative chemical
stability and the ease with which most can be identified have made them particularly
useful as taxonomic markers in plant classification.
Flavonoids occur in a wide variety of structural forms (Scheme 2.1). They all contain
fifteen carbon atoms in their parent nucleus and share the common structural feature of
two phenyl rings linked by a three-carbon chain, i.e. diphenyl propane derivatives. The
three-carbon chain may be formed into a third, five- or six- member ring through oxygen
on one of these phenyl rings generating a tricyclic system. The tricyclic ring compounds
possessing a five-member heterocyclic ring are referred to as auronoids, whereas those
possessing a six-member heterocyclic ring are designated flavonoids. Similar tricyclic
compounds derived from 1,2-diphenylpropane systems are known as isoflavonoids, 3
phenylcoumarins and pterocarpans, while those derived from 1,1-diphenylpropane are
called neoflavonoids3.
In tricyclic compounds of the flavonoid, auronoid and isoflavonoid types; rings are
labeled A, Band C, and the individual carbon atoms are referred to by a numbering

5
system which utilizes ordinary numerals for the A- and C-rings and 'primed' numerals for
the B-ring [1].
I
3
7
6
o
[1]
,4
I
5
Natural flavonoids and isoflavonoids are usually oxygenated and bear hydroxyl and/or
methoxyl substituents. The structure and numbering of the common naturally occurring
classes of monomeric flavonoids are illustrated in Scheme 2.1 3.
A large number of flavonoids occur as O-glycosides in which one or more of the hydroxyl
groups of the flavonoid are bound to a sugar or sugars via an acid labile acetal bond. In
flavonoid C-glycosides, the sugar is C-linked and this linkage is acid resistant. The effect
of glycosylation is to render the flavonoid less reactive and more water-soluble.
Flavonoids also occur as dimers. These may be linked by a C-C or an - 0 - linkage and
are termed biflavonoids, e.g. 3,3"-biapgenin4• When the monomeric units are flavan-3
ols, the C-C linked dimeric flavonoids are referred to as condensed proanthocyanins, e.g.
(-)-fisetinidol- (4 -.8)-(+)-catechin4.

OH
6
OH
OH
OH
3,3 "-Biapgenin (a biflavonoid)
OH
& OH
HO~Ol""OQ0 OH OH
OHOH
(-)-fisetinidol-(4a - 8)-(+)-catechin
(a proanthocyanidin)

1,3..cJi phenyl propane
Flavanoids(2- phenyl benzopyran)
4'
Neoflavonoids
3 - Phenylcoum arins
Auronoids
o
Flavonoids
1,2..cJiphenyl propane
Pterocarpans
7
oCbalconoid
1,1· dipbenylpropane
5'
Isoflavanoids
Isoflavonoids
Scheme 2.1: Structures ofmonomeric flavonoids

8
2.2 THE FLAVAN-3-0LS
2.2.1 Nomenclature
The flavan-3-ols are also known as the catechins or flavanoids. For the purpose of this
work, the name flavan-3-o1 will be used.
A list of the naturally occurring flavan-3-ols with the 2R,3S configuration is given in
Table 2.1 4 . Those compounds with the 2R,3R configuration are prefixed with 'epi', e.g.
epicatechin [4].
The numbering system is adopted from the flavone skeleton [1], as shown for epicatechin
[4].
OH
2' 3' OH
O 6'6 ,)
10 "OH5 4OH
[4]
2.2.2 Occurrence
The most widely distributed members of this class of phenolic flavan-3-ols in nature are
the diastereomeric pair, (+)-catechin [11] and (-)-epicatechin [4]. The structures and
absolute configuration of other naturally occurring flavan-3-ols are shown in Table 2.1

9
and Scheme 2.24, while the plant sources for most are given in a comprehensive list in
. 567vanous texts ' , .
A list of modified flavan-3-0Is, for example, glycosides together with their sources is
given by Porter7. Undoubtedly, the most important addition to this group was the
discovery of flavan-3-0Is with the (+)-epi-configuration in nature. Marini-Bettolo et a18,
isolated (+)-epiafzelechin [20] and (+)-epicatechin [21] from several Palmae species.
Drewes and Roux9 showed the presence of (+)-epifisitinidol [22] in Colophospermum
mopane heartwood. These have the 2S,3S-configuration.
Afzelechin [10] was first isolated from Eucalyptus calophylla by Hillis and Carle lO.
Other sources include Nothofagus fusca 11, Saxifraga ligulata root l2, Desmoncus
plycanthus leaf13, Juniperus communis fruit l4
, Prunus persica l5, Kardelia candel bark l6
and Cassia abbreviata bark17.
HO
[20][21][22]
R1=OH,R2=HR1=R2=OHR1=H,R2=OH

Table 2.1 Suggested names for naturally occurring Flavan-3-ols
10
COMPOUND SUBSTITUTION PATTERN
3 5 7 8 3' 4' 5'
Cassiaflavan [5] H H OH H H OH H
Apigegeniflavan [6] H OH OH H H OH H
Luteoflavan [7] H OH OH H OH OH H
Tricetiflavan [8] H OH OH H OH OH OH
Distenin [9] OH OH OH H H H H
Afzelechin [10] OH OH OH H H OH H
Catechin [11] OH OH OH H OH OH H
Gallocatechin [12] OH OH OH H OH OH OH
Guibourtinidol [13] OH H OH H H OH H
Fisetinidol [14] OH H OH H OH OH H
Robinetinidol [15] OH H OH H OH OH OH
Oritin [16] OH H OH OH H OH H
Mesquitol [17] OH H OH OH OH OH H
Peltogynane [18] OCHr 6' H OH H OH OH H
Mopane [19] OCH2-6' H OH H H OH OH

11
Epiafzelechin [23) was isolated from Afzelea species and characterised by chemical
means by King and co-workers18. The compound was also isolated from Cassia
. b 19 C . fi I 20 C . bb . t 17 L' . 21 r ., .Sle rana, aSSlG lStu a, aSSlG a reVlG a, anx specIes , Jumpens commums
fruit l4 and Ephedra species22.
(+)-Catechin [11) was first isolated from Uncaria gambir23 while (-)-epicatechin [4) was
isolated from Acacia catechu24. Both now show a very wide distribution in both the
Monocotyledoneae and the Dicotyledoneae.
HO
OH
~OH
,,,,,,,,0
[23)

H0'lA(0l """ryOH~"~
(5)
(9) RI = R2 = R3 = R4 = H[101 RI = R3 = R4 = H, R2 = OHIll) R I =R2 =OH,R3 =R4 =H(12) RI = R2 = R3 = OH, R4 = H
RI
&OH
H0L60:oH
° """ ~~ "
OH
(16) RI = H(17) RI = OH
12
RI
OH
~" R
OH
(6) RI = R2= H(7) RI = OH, R2 = H(8) RI = R2 = OH
RI
c&oHH0lQ(X0""" ~ 2~." R
OH
(13) RI = R2 =H[14] RI = OH, R2 = H[IS) RI = R2 = OH
OH
H0lQ(x"'"~~ ", R2
°(18) RI = OH, R2 = H[19] R I =H,R2 =OH
Scheme 2.2: Structures of natural Flavan-3-ols (2R,3S configuration)

13
2.3 STRUCTURE ELUCIDATION OF THE FLAVONOIDS
2.3.1 Proton Magnetic Resonance eH NMR)
2.3.1.1 The Aromatic Protons25
The coupling patterns for the flavonoid aromatic protons are typical for the benzenoid
system with combinations of ABX, AB, AX and AA'BB'. The chemical shifts of
these protons occur from 6.0 ppm to 8.0ppm, with J-values of 8-, 2- and 1,0 Hz for the
ortho, meta and para coupled protons respectively.
In 5,7-dihydroxy flavonoids, for example, epicatechin [4] the protons at C-6 and C-8
appear separately as doublets (meta-coupled, J~2Hz), with the H-6 doublet occurring
at higher field than the H-8 doublet. When a 7-hydroxyflavonoid (ABX system) has a
C-4 keto group, the C-5 proton is deshielded and appears as a doublet due to ortho
coupling (J~8Hz) with H-6. In 4' oxygenated flavonoids, for example, afzelechin
[10], the H-3', H-5' doublet appears upfield from the H-2', H-6' doublet due to the
deshielding effect of the oxygens of the C-ring functions on H-2' and H-6'.
In 3', 4', 5' -oxygenated flavonoids, for example, gallocatechin [12], H-2' and H-6'
appear as a two-proton singlet because of magnetic equivalence. O-Methylation of
the 3' or 5' hydroxyl may lead to non-equivalence of H-2' and H-6' resulting in a
distinct doublet (J = 2 Hz).
2.3.1.2 Methoxyl and Acetoxyl protons
Methoxyl proton signals appear in the range 3.5-4.1 ppm while aromatic acetoxyl. 1 . h 26proton sIgna s occur III t e range 2.25-2.50 ppm . Protons ortho and para to acetoxyl
groups are shifted downfield by about 0.3 ppm to 0.5 ppm respectively while meta
protons are shifted very slightly. The C-ring acetoxyl protons resonate between 1.6
2.0ppm.

14
2.3.1.3 Heterocyclic Ring Protons25
The chemical shi-fts (ppm) and coupling constants of the heterocyclic (C-ring) protons
ofthe flavonoids may be summarised as follows:
27a) Flavones
b) Isoflavones28
c) Flavanones29 (e.g. [1])
d) Dihydroflavonols3o
e) Flavan-3-01 (e.g. [4])
f) Flavan-4-0Is (Scheme 2.3)
H-3: 6.3 (s)
H-2: 7.6 -7.9 (s)
H-2: 5.0 - 5.5 (q, J = Il trans Hz, 5cis Hz)
H-3: 2.8 (qq, J = 17 Hz)
H-2: 4.8 - 5.0 (d, J = 11 Hz)
H-3: 4.1 - 4.3 (d, J = 11 Hz)
H-2: 4.2 - 6.0 (d, J = 8Hz)
H-3: 3.5 - 4.3 (m)
H-4eq: 2.3 - 3.4 (dd, J = 6Hz and 16Hz)
H-4ax: 2.3 - 3.4 (dd, J= 9Hz and 16Hz)
H-2: 4.2 - 6.0 (dd, J =ca. 11.5 Hz)
H-3: 1.8 - 2.3 (m)
H-4: 4.2 - 6.0 (t, J = 5.5 Hz)
2.3.2 Carbon-13 Magnetic Resonance Spectroscopy (BC NMR)3
Carbon-13 NMR spectrum of an unknown flavonoid permits ready differentiation
between 4-keto flavonoids, flavonoids which lack a keto group, 2,3-unsaturated
flavonoids and 2,3-saturated flavonoids. The 4-keto flavonoids possess a carbonyl
carbon resonance in the range 170-205 ppm, which is not present in flavanoids which
lack the 4-keto function. All fifteen signals due to the flavonoid nucleus resonate in
the region 90-210 ppm in the case of 2,3-unsaturated flavonoids and isoflavonoids.
2,3-Saturated flavonoids and isoflavonoids however, possess only thirteen signals in

15
this region, the two additional signals resonating at higher field. The flavans and their
derivatives, together with pterocarpanoids and chalcanes possess three aliphatic
resonances and twelve aromatic resonances in above mentioned chemical shift range.
The presence of many signals in the 60-80 ppm region is generally indicative of
glycosidic carbons. Compilations of 13C NMR data of the monomeric flavanoids
seem to be scattered through the literature. However, Agrawal et aP, have compiled
an extant 13C NMR literature and discussed its utility for structural and stereochemical
elucidation of the various classes of flavan derivatives.
The 13C NMR chemical shifts of the compounds shown in Scheme 2.3 may generally
be divided into three groups:
1) Those of carbons 2,3 and 4 in the heterocyclic ring, occurring normally in the
region 19-85 ppm.
2) Those of the remaining carbons, on the A- and B- rings, which are aromatic
carbons, occur in the region 95-160ppm.
3) Those arising from non-flavanoid co-metabolites, which may be substituents
(either 0 or C) such as O-glycosides, O-gallates and O-cinnamate derivatives.
Flavan
OH
Flavan-4-ol
Fhvan-3-ol
OH
Flavan-3,4-diol
Scheme 2.3: The structures of the basic skeletons of the Flavanoids

16
2.3.2.1 Flavan-3-o1s
This group contains the most commonly occurring natural products in this class:
catechin [11] and epicatechin [4], and will thus be discussed in more detail. A
detailed discussion of the BC NMR chemical shifts of the other groups in this class
including the proanthocyanidins is given by Agrawal et aP.
By analogy with studies on cyclohexane31 the chemical shifts for the C-ring carbons
will be dependent on both the electronegativity of the substituents and the relative
stereochemistry of these substituents. In the case of catechin and epicatechin these
chemical shifts will be controlled by the orientation of the 3-hydroxyl group.
However, it can be mentioned that among the oxymethine signals for C-2 and C-3, the
C-2 signal resonates 12-15 ppm downfield from C-3 and therefore the signal
assignments are straightforward. Thus, resonances due to C-2, C-3 and C-4 appear at
76.7-82.3,65.1-69.5 and 24.0-32.6 ppm respectively.
The three quaternary carbons C-l', C-9 and C-I0 show relatively constant shifts
among the different flavanoids of 129-133 ppm, 155-158 ppm and 99-102 ppm
respectively.
The carbons of the aromatic A- and B-rings show shifts, which depends on the
substitution pattern of each. The A- ring oxygenated carbons are found in the region
155-158 ppm and non-oxygenated carbons, 90-100 ppm. The B-ring oxygenated
carbons resonate at around 140-150 ppm and non-oxygenated carbons at about 110
120 ppm.
Acetylation of the 3-hydroxy group usually causes an upfield shift of the C-2, C-3 and
C-4 carbons with shifts of 2-5 ppm, 0.2-0.5 ppm and 3-5 ppm respectively.
Acetylation of the aromatic OH groups usually causes an upfield shift of the
oxygenated carbons by 6.6-15.6 ppm and a downfield shift of the non-oxygenated
carbons with ortho- signals moving downfield by 4.1-12.1 ppm and para-carbon
signals by 2-7.9 ppm. C-1' and C-10 are also drastically affected, with C-1'
experiencing a downfield shift by approximately 5-6ppm and C-10 by as much as 10
17
ppm. Carbon-9 shows a shift of about 1.5-2ppm upfield as compared to the' fully
hydroxylated compounds.
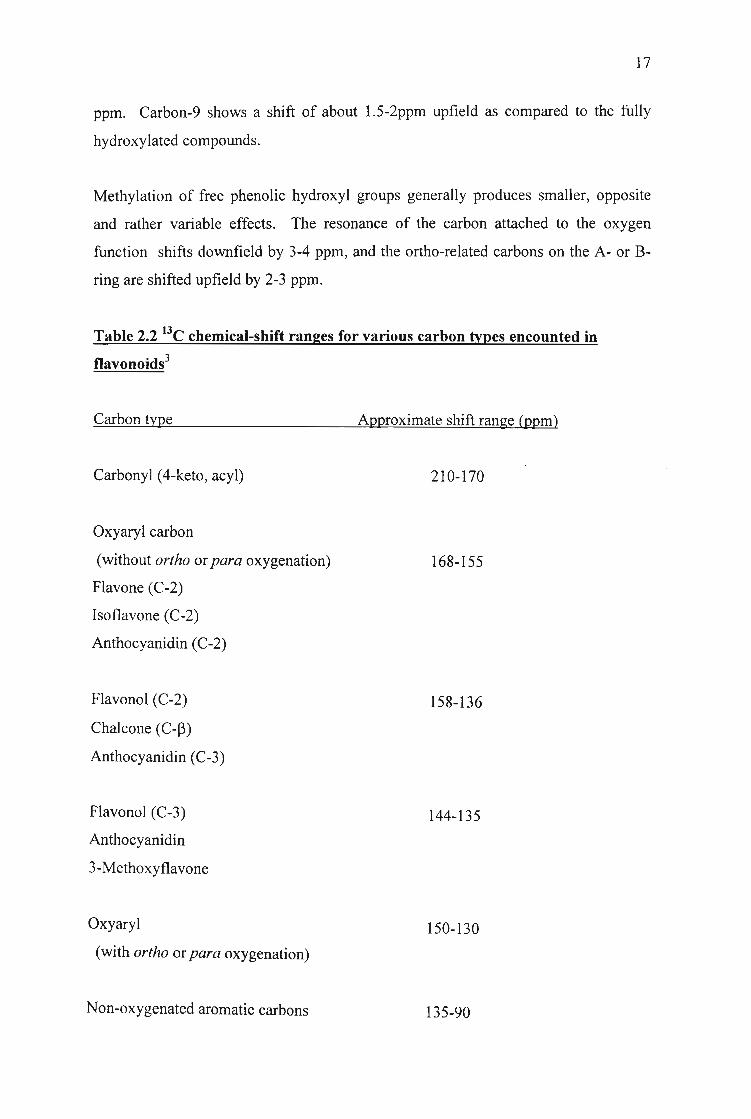
Methylation of free phenolic hydroxyl groups generally produces smaller, opposite
and rather variable effects. The resonance of the carbon attached to the oxygen
function shifts downfield by 3-4 ppm, and the ortho-related carbons on the A- or B
ring are shifted upfield by 2-3 ppm.
Table 2.2 13C chemical-shift ranges for various carbon types encounted in
flavonoids3
Carbon type
Carbonyl (4-keto, acyl)
Oxyaryl carbon
(without ortho or para oxygenation)
Flavone (C-2)
Isoflavone (C-2)
Anthocyanidin (C-2)
Flavonol (C-2)
Chalcone (C-P)
Anthocyanidin (C-3)
Flavonol (C-3)
Anthocyanidin
3-Methoxyflavone
Oxyaryl
(with ortho or para oxygenation)
Non-oxygenated aromatic carbons
Approximate shift range (ppm)
210-170
168-155
158-136
144-135
150-130
135-90

Flavone (C-3)
Isoflavone (C-3)
Chalcone (C-a)
Flavanone (C-2)
Flavanol (C-2, C-3)
Flavan-3-o1 (C-2, C-3)
Flavan-3,4-diol (C-2, C-3, C-4)
Sugar (CH20H, CHOH)
C-glycoside (C-l)
Flavan-4-o1 (C-4; with 5-0-substituent)
3-Methoxyflavone (3-0CH3)
Aromatic OCH3 (ortho-disubstituted)
Flavanone (C-3)
Flavan-4-o1 (C-3)
89-65
78-56
59-58
63-59
52-40
40-34
18
Flavan-3-o1 (C-4) 33-25
Flavan (C-3)
Acetoxy-CH3 26-19
Flavan (C-4)
Aromatic C-CH3 ca. 20
Aliphatic C-CH3 ca. 17

19
2.4 BIOSYNTHESIS OF THE FLAVONOIDS
In the last two decades, considerable progress has been made in elucidating the
biosynthesis of flavonoids. In particular, knowledge of enzymology has developed
rapidly.
From these studies, it became fully established that all classes of flavonoids derive their
carbon skeleton from compounds of intermediary cell metabolism through the action of
two consecutive pathways. The first is called, General Polypropanoid metabolism, and
the second, which is the major part, deals with the reactions of the various flavonoid
pathways4.
Information on the subject is now included in various texts4, 5, 32, 33, 34 and reviews5
, hence
a detailed discussion is unnecessary, however, the biosynthesis of the flavan-3-0Is will be
given little more attention. A general overview incorporating both pathways is given in
Scheme 2.44. Ring B and part of the heterocyclic ring of the flavonoid skeleton are
provided by a suitable hydroxy-cinnamic acid-CoA ester, while the A-ring originates
from three acetate units via malonyl-CoA. Both precursors are derived from
carbohydrates. The scheme shows the synthesis being initiated by the amino acid
phenylalanine which is itself synthesized via the shikimate/arogenate pathway and
leading to the formation via enzyme catalysed reactions to the various flavonoid
products. Table 2.3 gives the list of the enzymes involved4.
2.4.1 The Flavan-3-o1s
Generally, the flavan-3-0Is are formed directly from the leucocyanidins. For example,
the formation of catechin [11] was first demonstrated by Stafford and Lester35 , with a
crude extract from Pseudotsuga cell suspension cultures using 2,3-trans-3,4-cis
leucocyanidins as substrate and NADPH. The enzyme catalysing this reaction was called
Leucocyanidin-4-reductase or flavan-3,4-cis diol 4-reductase. The leucocyanidin is
derived from dihydroflavanols. Kristiansen36 demonstrated the dependence of flavan-3-

20
01 fonnation on NADPH while the leucocyanidin could fonn with NADH. The final
products depend on the A- and B-ring substitution pattern of the precursors. For
example, afzelechin [10] is derived from dihydrokampferol [24] while catechin [11] and
gallocatechin [12] are derived from dihydroquercetin [25] and dihydromyricetin [26]
respectively.
The hydroxylation pattern of the B-ring was found not to start from the polypropanoid
pathway but was due to modifications of the flavone precursor by enzymes specific for
this purpose. Enzymatic studies revealed that hydroxylation in position 3' and 5' for
example, is achieved by specific enzymes acting at the C'5 level. Two enzymes were
identified as, flavonoid-3'-hydroxylase (F3'H) and flavonoid-3', 5'-hydroxylase (F3', 5'H).
The A-ring hydroxylation however, remains less defined. The 5 and/or 7 position is
hydroxylated during the synthesis of the flavonoid skeleton. Additional hydroxyl groups
are found in positions 6 and 8. Attempts to hydroxylate the A-ring in these positions in
vitro have not been achieved4.
HO
OH
[24]
[25]
[26]
o
R'=R2=H
R'=OH,R2=H
R'=R2=OH
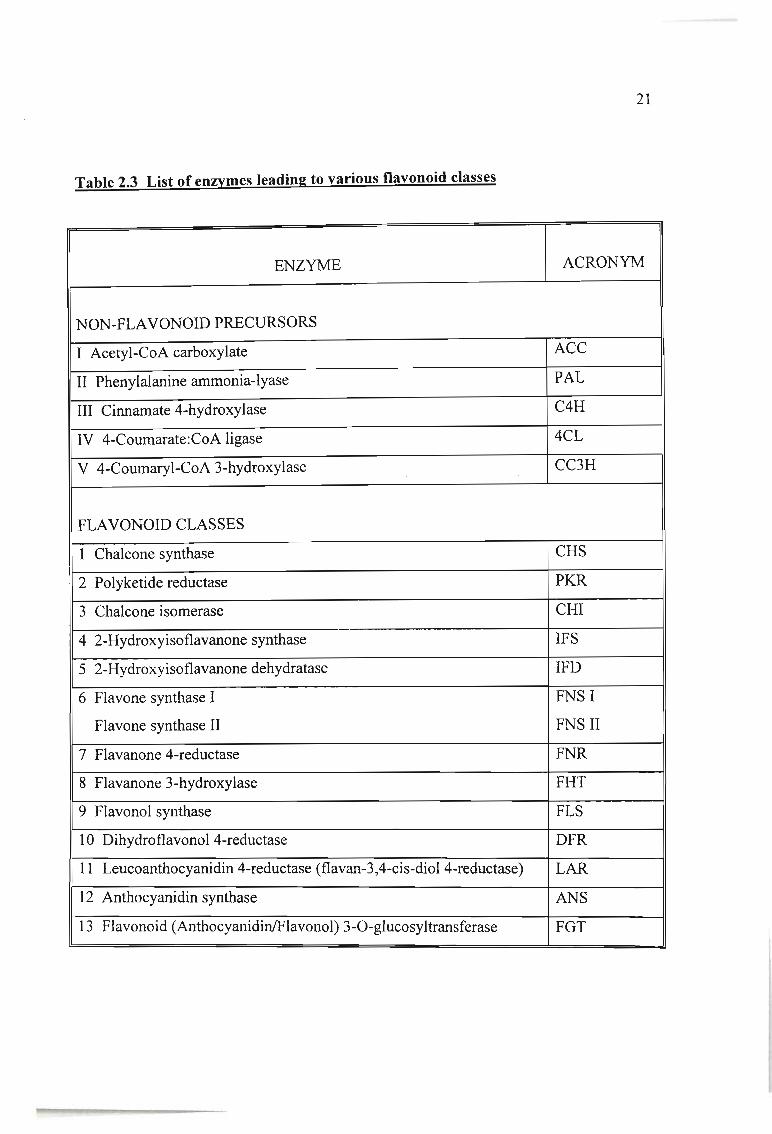
Table 2.3 List of enzymes leading to various flavonoid classes
21
ENZYME ACRONYM
NON-FLAVONOID PRECURSORS
I Acetyl-CoA carboxylate ACC
Il Phenylalanine ammonia-lyase PAL
III Cinnamate 4-hydroxylase C4H
IV 4-Coumarate:CoA ligase 4CL
V 4-Coumaryl-CoA 3-hydroxylase CC3H
FLAVONOID CLASSES
1 Chalcone synthase CHS
2 Polyketide reductase PKR
3 Chalcone isomerase CHI
4 2-Hydroxyisoflavanone synthase IFS
5 2-Hydroxyisoflavanone dehydratase IFD
6 Flavone synthase I FNS I
Flavone synthase Il FNS Il
7 Flavanone 4-reductase FNR
8 Flavanone 3-hydroxylase FHT
9 Flavonol synthase FLS
10 Dihydroflavonol 4-reductase DFR
11 Leucoanthocyanidin 4-reductase (flavan-3,4-cis-dioI4-reductase) LAR
12 Anthocyanidin synthase ANS
13 Flavonoid (Anthocyanidin/Flavonol) 3-0-glucosyltransferase FOT

22
rlem<:aTJ1..n~
S-lJeolyn8vonnids
~OllIIOD?'·V--+ . ~
°
\Nnring~ni"
I
CARBOIlYORAltS------------l
~ ~O:. I ~O~ D::: Accl~-CnA110} ~ C""S) ~ 0"'5) -_ j
° U ° ,4-C""morale 4-Cn.""....yl:CoA Calfeoyl-CnA
~ M.luny'·Co"~l
,,"w"n ''''#oo~_""-c:rrD""110 () 0 0
2',4' ,6' ,4-Telrahydtolyc:hakone IsnHquhiliKenin
~ , j. 0°11-- ~1I0y-'y0'y'
~ "r"Y'110 °
Cinnamalt!:
"-+~I~
°
+Shikimale
~A.ogena'e
+rhenylalanine
~l)~l)I'II0 W ~
110 °A"'lenln
lI°nol "'1. 'l; DIm
Ge";,'e;,,
w-00ll
110 ° --110 0
4.6.4' -Trihyd""'fBu.olle
w:?'OIl
IIU °011
110 0
Koe""./••,,)
r?'("011
IIOyyoyV~(I"IIU
" Ilel••hin
,"y0l1
1l°y"f°·yV~Oll f""'y0ll
::g)yOyV~'l110
rrnl",l.r~nn;dinD-)
,-f"'y0ll
Hoyyol"VVy'oll110 0
Dihyd.okaemple.oI
1'0II0WO..OOIl
11--.011
ItO 011
Leucopela'gOllidin
ill1I0.......--.....~floll
YJOI~110
rela,gu";"i,,
..,~;:n°o'Wou~c
011
re'••gnnidin .1·gl"c,,~ide
~OltIIOW"V110 UII
A"iforol
W'l" 011
110 ('"+
110
Al'i~enillidin
''''JP"''UGle
ApiKe"inidi" S'glue05ide
Scheme 2.4: Biosynthetic pathways to major flavonoid classes4

23
CHAPTER THREE
3.1 INTRODUCTION TO THE TERPENOIDS
The terpenoids are amongst the most widespread and chemically interesting groups of
natural products. They can be defined as a group of natural products whose structure
may be divided into Cs isoprene units. This immediately leads to a rational classification
b f h · . 37of the terpenoids depending upon the num er 0 suc Isoprene umts .
Monoterpenoids - Cl0
Sesquiterpenoids - C1S
Diterpenoids - C20
Sesterterpenoids - C2S
Triterpenoids _C30
Carotenoids - C40
Rubber - (Cs)n
In practice, it is possible to discern a further subdivision of the terpenoids. The
terpenoids up to C2S contain isoprene units linked in a head-to-tail fashion. The
triterpenoids and carotenoids are made up of two C1S and C20 units respectively linked in
a tail-to-tail fashion37.
The utility of the terpenoids spans the centuries of civilization. Essential oils,
particularly, oil ofterpentine, were known to the Ancient Egyptians. Astringent and toxic
properties of sesquiterpenoids and diterpenoid bitter principles figure in many folk
medicines. Camphor was introduced to Europe from the East by the Arabs and is
recorded in several eleventh-century manuscripts37.
It is no surprise then, that the chemical study of the terpenoids also started at an early
stage with analysis of oil of terpentine recorded in 1818 by J.J. Houton de la Billardiere
who showed that the carbon-hydrogen ratio was 5 to 8. Physical and chemical data on

24
many oils were recorded from 1830 onwards. Structure elucidation began in earnest in
the late nineteenth century but it was not until the advent of spectroscopic techniques by
the mid twentieth century that an immense explosion in terpenoid chemistry, if not all
natural product chemistry, was stimulated.
Terpenoids have also been shown to be responsible for the biological activity of various
systems. A number of antibiotics have been developed based on sesqui- and
diterpenoids. The insect juvenile hormones appear to be derived from sesquiterpenoids,
whilst gibberellin plant growth hormones are diterpenoids. Several sesquiterpenoids
have been found to be active against experimental tumours37. The biological activities of
triterpenoids are discussed in more detail in section 3.2.
3.1.1 Nomenclature
The nomenclature of the terpenoids has been dealt with by numerous authors in quite
some detail, including discussion of each of the different groups37. In practice however,
trivial names have been given to most of the terpenoids, often because they were isolated
and described in literature long before their structure was known. As with many natural
products, the rules for nomenclature are constantly under revision. The common skeleta
and numbering system for some typical terpenoids are set out in Scheme 3.1 37.
3.1.2 The Triterpenoids38
The triterpenoids constitute by far the largest terpenoid class. They have been known and
investigated for over 140 years but it is only within the latter half of the twentieth century
that serious progress has been made towards the elucidation of their structures. They are
widely distributed in nature, for the most part, in the vegetable kingdom. They may
occur as esters, glycosides or in their free state. The sugar moieties in the glycoside
include pentoses, such as arabinose, xylose and rhamnose and hexoses such as glucose,
fructose and galactose.

25
Historically, the triterpenoids were classified into three groups as follows: (a) ambrein
and squalene, (b) the tetracyclic triterpenoids and (c) the pentacyclic triterpenoids. The
last group, being the largest of the three, was further subdivided into three groups. These
were, the a-amyrin, p-amyrin and lupeol groups. This division was somewhat arbitrary.
It arose when full structures were not known and substances were related to the simplest
alcohol with the same skeleton. Since then, the full structures and still more recently
conversion from one group into another have been accomplished. Section 3.2 discusses
the various pentacyclic triterpenoids, while section 3.4 gives a brief description of their
biosynthesis.
10 710
5 7 2
4 8 5 642
10 5 3
9 10 94
2,6-dimethyIoctane p-menthol eucarvone bornane
Typical monoterpenoid skeleta
Sesquiterpenoid skeleta

12
{S---i6""""17
12 tI 1412
201
15\\\\",,117
22
3
------ 1919 ---18
labdane kaurane
Diterpenoid Skeleta
26
gibbereIlane
lanostane
Typical triterpenoid skeleta
Scheme 3.1 Common terpenoid skeleta
oleanane

27
3.2 THE PENTACYCLIC TRITERPENOIDS
The pentacyclic triterpenoids are the dominant constituents of the triterpenoid class. They
are derived from squalene via squalene epoxide, as discussed in section 3.4, and show a
variety of structural forms. The nomenclature as mentioned in section 3.1 is usually
based on the source of isolation, or modification based on the parent skeleton.
Despite the remarkable diversity that is already known to exist among the carbon
skeletons of the pentacyclic triterpenoids, new variants continue to emerge. Several
review articles have covered this subject 39, 40, however, for the purpose of this work a
general scheme showing the typical skeletons is presented (Scheme 3.2), with their
numbering. In their review of the triterpenoids, Mahato et afo have also presented new
carbon skeletons.
3.2.1 Oleanes or Oleananes
This forms perhaps the largest group amongst the pentacyclic triterpenoids. The most
notable of the group is ~-amyrin [27]. The typical features are gemdimethyls at C-4 and
C-20. Modifications to the oleane skeleton include double bonds in the 12:13, 13(18),
11: 12, 9(11), and 5:6 positions. The most common functional group is the 3~-OH which
is a remnant from the squalene precursor. Hydroxyl groups may also be found in other
positions but usually in positions C-2, C-16, C-22, C-23 and C-28. Other functional
groups include aldehydes, epoxides, carboxylic acid esters, ketones and carboxylic acids
e.g. oleanolic acid [44], which is an ubiquitous example of the f3-amyrin group.
3.2.2 The Ursanes
This group is second only to the oleanes in terms of numbers. Its most famous member
being a-amyrin [29].

28
30 29
Oleane or Oleanane Taraxarane
30 29
E
DH
cH
2930
Ursane Friedelane
29
2 I..30JOl ····t9 21
22
19 20
Lupane Hopane
Scheme 3.2 Pentacyclic triterpenoid skeleta
Like the oleanes, it possesses a gemdimethyl at C-4 but not at C-20, rather, two methyl
groups are found at C-19 and C-20 respectively. Modifications of the skeleton are
similar to the oleanes.

29
[27]
3.2.3 The Taxaranes
HO
[29]
The group is almost identical, structurally speaking, to the oleanes, except that the C-27
methyl group is found at C-13 instead of at C-14. The usual skeletal modifications apply.
3.2.4 The Lupanes
This group is differentiated from the others in that the gemdimethyl groups (C-29 and C
30), of ring E, form an isopropyl side chain with C-20 resulting in ring E conforming to a
cyclopentane ring rather than the typical cyclohexane system. The most notable
modification being a 20(29) terminal double bond in the isopropyl moiety, for example,
lupeol [43].
3.2.5 The Hopanes
The hopanes are similar to the lupanes except that the isopropyl group is now attached at
C-2l, with C-22 incorporated in the side chain. Also, C-28 is at C-18, not at the usual C
17 position.

30
3.2.6 The Friedelanes
This group possesses the typical pentacyclic structure having five cyclohexane ring
systems. However, it is the arrangement of the methyl groups that make this group
unique. A dramatic shift in the methyl groups as discussed in Section 3.4, results in the
structure shown. The C-29, C-30 gemdimethyl groups are retained, but the C-23 and C
24 groups are found at C-4 and C-5 respectively. C-25, C-26 and C-27 are also
subsequently affected. Modifications of the skeleton as for the other groups allow for a
myriad of different compounds. An example of note in this group is friedelin [41].
Brief mention should also be made of glycoside triterpenoids. Here the usual functional
groups are replaced by sugars e.g. glucose, rhamnose, etc. The glycoside units usually
occur as monomers. A typical example is shown in 23-hydroxyimberbic acid 23-0-u-L
rhamnoside41.
OH
oRh= a - L - rhamnos ide
23-hydroxyim berbic acid 23-0-a- L-rhamnos ide

Aue
31
3.2.7 Biological Activity
The occurrence and structural diversity of this group of natural products has certainly
attracted attention for evaluation of their biological activity. Although applications of
these secondary metabolites as successful therapeutic agents is very limited, extensive
exploratory activities in this area have been underway in recent years40.
3.2.7.1 Antitumor and anticancer activity
The relation between chemical structure and anticancer activity of some pentacyclic and
tetracyclic triterpenoids was studied by Ling et at2. The anticancer effects were tested
against several human cancer cell lines. Several of the terpenoids studied showed
cytotoxic activity. A detailed explanation is given by Mahato et ato.
3.2.7.2 Action on Metabolism
Several studies have shown the effects of terpenoids on both human and animal
metabolism. Tests have shown positive effects on the rat renal system43, prostaglandin
E2 release into gastric juice was examined in peptic ulcer patients under the influence of
carbenoxolone which resulted in a decrease in acidity44, and another triterpenoid,
glycyrrhetinic acid45 induced a decrease in blood cholesterol in rats.
3.2.7.3 Anti-inflammatory activity
The anti-inflammatory action of some triterpenoid derivatives of the oleane series was
examined on arachidonic acid induced ear edema in mice46. Several of the compounds
examined showed a strong inhibition of ear edema on both topical and oral
administration.

32
The presence of 12-0leane derivatives isolated from Maesa chisis var. angustifolia
showed anti-inflammatory, analgesic and antipyretic activities In vanous
pharmacological tests in experimental animals47
.
3.2.7.4 Miscellaneous
Oleanolic acid was effective in the prevention of experimental liver injury induced by
injection of CCl4 in rats48. Carbenoxolone was shown to provide a protective effect to
experimentally induced lower urinary tract infections in the rabbit model49. The
antitussive and expectorant activities of glycyrrhetinic acid choline were evaluated in
guinea pigs and mice5o. The antiviral activity of some dammar resin triterpenoids was
investigated by Poehland et at l. The circulatory effects of oleanolic acid sodium
hydrogen succinate (aSS), an analogue of the anti-ulcer drug carbenoxolone, were
investigated by Filczewski et at2.

33
3.3 STRUCTURE ELUCIDATION OF THE PENTACYCLIC
TRITERPENOIDS
The application of spectroscopic techniques has tremendously eased the problem of
structure elucidation of natural products, which, in most cases, is now successfully
achieved without resorting to the conventional chemical degradative procedures. It
was the development of NMR spectroscopy that catapulted the enhancement of
structural elucidation of the terpenoids.
IH NMR alone is not satisfactory for structure elucidation because of inadequate
dispersion in the upfield region of the spectrum. l3C NMR however, is now
frequently employed for the structural analysis of triterpenoids using various methods
of signal assignment e.g. attached proton transfer (APT), insensitive nucleus
enhancement by polarisation transfer (DEPT), 2-D spectroscopy and single frequency
off-resonance decoupling39.
Carbon-13 NMR data of a large number of pentacyclic triterpenoids have been
bl ' h d53 54 55 56 57 A '1' f Id" f II .pu IS e ' , , '. compI atlOn 0 se ecte vanetIes 0 natura y occumng
pentacyclic triterpenoids is given by Mahato and Kundu39.
3.3.1 Proton Magnetic Resonance eH NMR)
The bulk of the proton signals are found in the region 0.8ppm to 2.0 ppm.
Methyl groups are usually found between 0.8 ~ 1.0 ppm. An obvious downfield shift
is observed if they are attached to electron-withdrawing groups. The methylenes are
located in the region 1.5 - 2.0 ppm.
If a proton is substituted by a hydroxyl group, the a-proton experiences a downfield
shift to between 3.5 - 4.0 ppm. The p-protons are affected to a lesser extent.
Carbonyl functionalities cause a shift of a-protons to between 2.0 - 2.5 ppm. Alpha
methyls resonate between 1.95 - 2.2 ppm. Olefinic protons occur in the 4.0 - 6.0
ppm range. Hydroxyl groups are variable; aldehydic protons are found in a relatively
34
small range of 9.5 - 10.0 ppm, while the acids are found very much downfield
between 10.0 - 13.0 ppm.
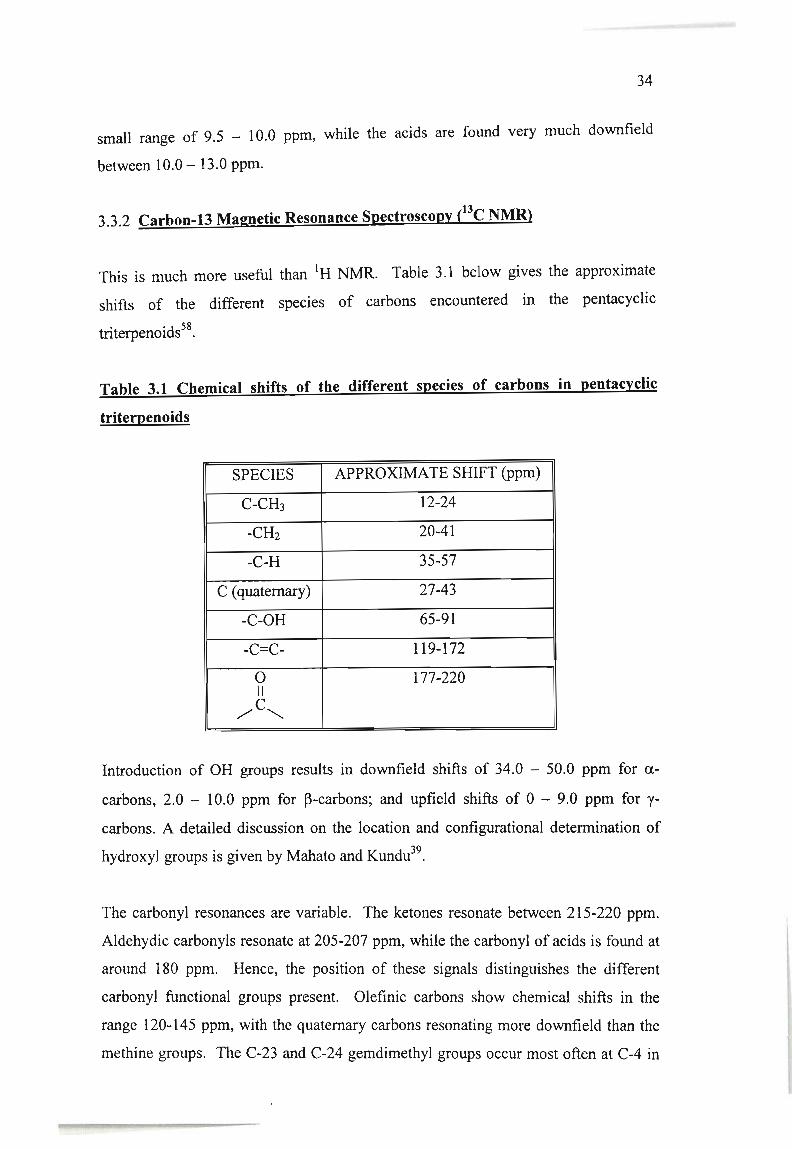
3.3.2 Carbon-13 Magnetic Resonance Spectroscopy (13C NMR)
This is much more useful than IH NMR. Table 3.1 below gives the approximate
shifts of the different species of carbons encountered in the pentacyclic
. ·d 58tnterpenOl s .
Table 3.1 Chemical shifts of the different species of carbons in pentacyclic
triterpenoids
SPECIES APPROXIMATE SHIFT (ppm)
C-CH3 12-24
-CH2 20-41
-C-H 35-57
C (quaternary) 27-43
-C-OH 65-91
-C=C- 119-172
0 177-22011
/C"
Introduction of OH groups results in downfield shifts of 34.0 - 50.0 ppm for a
carbons, 2.0 - 10.0 ppm for p-carbons; and upfield shifts of 0 - 9.0 ppm for y
carbons. A detailed discussion on the location and configurational determination of
hydroxyl groups is given by Mahato and Kundu39.
The carbonyl resonances are variable. The ketones resonate between 215-220 ppm.
Aldehydic carbonyls resonate at 205-207 ppm, while the carbonyl of acids is found at
around 180 ppm. Hence, the position of these signals distinguishes the different
carbonyl functional groups present. Olefinic carbons show chemical shifts in the
range 120-145 ppm, with the quaternary carbons resonating more downfield than the
methine groups. The C-23 and C-24 gemdimethyl groups occur most often at C-4 in

35
most of the triterpenoid classes except the friedelanes. They resonate at about 34 and
22 ppm respectively with no C-3 substituents. A C-3-0H group causes an upfield
shift of these groups of about 4-6 and 6 ppm respectively. A C-3 carbonyl with no
other substituents in the vicinity has the same effect, causing C-23 to resonate at 26.5
ppm and C-24 at 21.5 ppm. The C-29 and C-30 show characteristic shifts of33.2 and
23.6 ppm respectively with no E-ring substitution.
Because of the rearrangement of the skeleton in the friedelanes, some umque
chemical shifts are observed which deserve some attention.
(30) 3-oxo, 15a-OH
(31) 3-oxo, 16~-OH
(32) 3-oxo, 28-0H
[33] 3-oxo, 17a-OH, 28-nor
(34) 3-oxo, 29-0H
[35) 3-oxo, 27 -. 15a olide
(36) 3~-OH, 27-COOH
(37) 3~-OH, 26-nor, 6 14
(38) 3~-OH, 7-oxo
(39) 2a, 3a-OH
A carbonyl at C-3 causes the C-23 methyl to resonate upfield at about 6.8 ppm. This
is demonstrated with the l3C NMR data of compounds [30-35)39 (Table 3.2).

36
Table 3.2 Effect of 3-oxo group on C-23 of selected friedelanes
COMPOUND C-23 (ppm)
30 6.8
31 6.8
32 6.7
33 6.8
34 6.8
35 6.8
However, if the carbonyl group is replaced by an OH group, this causes the C-23
methyl to move downfield. The shift however, is dependent on the orientation of the
OH group. If the OH group is beta (axial) the shift is about 4.8 ppm and hence
resonates at 11.6 or 11.7 ppm. If it is alpha (equatorial), then the C-23 methyl
resonates between 9.5 and 10.0 ppm, a downfield shift of about 3 ppm. Compounds
[36_38]39 (Table 3.3) support this argument. This information was useful in the
structure elucidation of epi-friedelinol [42]. The C-24 methyl also shows an upfield
shift resonating between 14.5 and 14.7 ppm.
Table 3.3 Effect of 3-0H group on C-23 of selected friedelanes
COMPOUND C-3 (PPM) C-23 (ppm)
36 72.7 11.6
37 72.7 11.6
38 72.0 11.6
39 73,2 9.6
epi-friedelinol 72,76 11.62

37
3.4 BIOSYNTHESIS OF THE TERPENOIDS
Recent studies have now shed new light on the biosynthesis of terpenoids. The research
has presented a new pathway for the synthesis of the Cs (isoprene) building blocks
namely, the 2-C-methyl erythritol 4-phosphate (MEP) pathway, completely distinct from
the acetate-mevalonate (Ac-MVA) pathway. This new route begins with the
condensation of glyceraldehyde phosphate and pyruvate to form I-deoxyxylulose 5
phosphate. In plants, the MEP pathway appears to be localized in the plastids and is the
likely source of substrate for plastid-associated terpenoids, such as phytol and
carotenoids. In contrast, the mevalonate pathway seems restricted to the
cytosol/endoplasmic reticulum because all known pathway genes are targeted to this
compartmentS9.
However, an accompanying study drew critical questions that have led to the idea of the
co-existence of the two pathways. A model, based on the medicinal plant Marrubium
vulgare, was used to study the regulatory aspects of both pathways. Shoot cultures were
shown to produce sterols built via the Ac-MVA pathway, and furanic labdane
diterpenoids which were shown to be built via the new pathwalo, 61. Hence, the Ac
MVA pathway cannot be discounted, since from the above study, it is clear that at this
stage, either pathway cannot be considered independent of each other. As a result, the·
general biosynthetic scheme shown, (Scheme 3.3), which offers a brief explanation as to
the steps leading up to the different terpenoids is based on the Ac-MVA pathway,
considering the limited information available on the MEP pathway.
The studies above have also made major advances in the study of terpenoid enzymology,
including structure determination and reaction mechanisms.
W· h h . d f 62 d . 62 h b' .It t e myna 0 texts an reVIews on t e lOsynthesIs of the terpenoids currently
available, it seemed inappropriate to rewrite the text on the subject. However, attention
was paid to the triterpenoid biosynthesis, especially the pentacyclic triterpenoids, in the
hope of showing a biogenetic link between the various forms in this class with reference
to the compounds isolated.

~oppDMAPP (Cs)
Mevalonic Acid
~~opp
IPP (C~
Hemiterpenoi ds
38
~oppMonoterpenoids
opp
Sesqui terpenoids
opp
Diterpenoids
GFPP (~s)
opp
Sesterterpenoids
Scheme 3.3: Terpenoid skeleta (to C2S) derived from the Mevalonic Acid Pathway
The scheme shows the initiation of the sequence, after the initial primer formation, with
the CID monoterpenoid units formed by the combination of dimethylallyl pyrophosphate
(DMAPP) and isopentenyl pyrophosphate (IPP) to yield geranyl pyrophosphate (GPP).

39
Modest changes of this precursor lead to a range of linear and cyclic products. Addition
of a further IPP unit to GPP leads to the fundamental sequiterpenoid precursor farnesyl
pyrophosphate (FPP). The diterpenoid and sesquiterpenoid precursors are formed by a
similar chain extension mechanism, where IPP adds to FPP to form geranylgeranyl
pyrophosphate (GGPP) for diterpenoids and IPP adds to GGPP to yield geranylfarnesyl
pyrophosphate (GFPP), the sesquiterpenoid precursor.
3.4.1 Triterpenoids
The triterpenoids are not formed by an extension of the familiar process of adding IPP to
the growing chain. Instead, two molecules of FPP are joined tail-to-tail to yield the
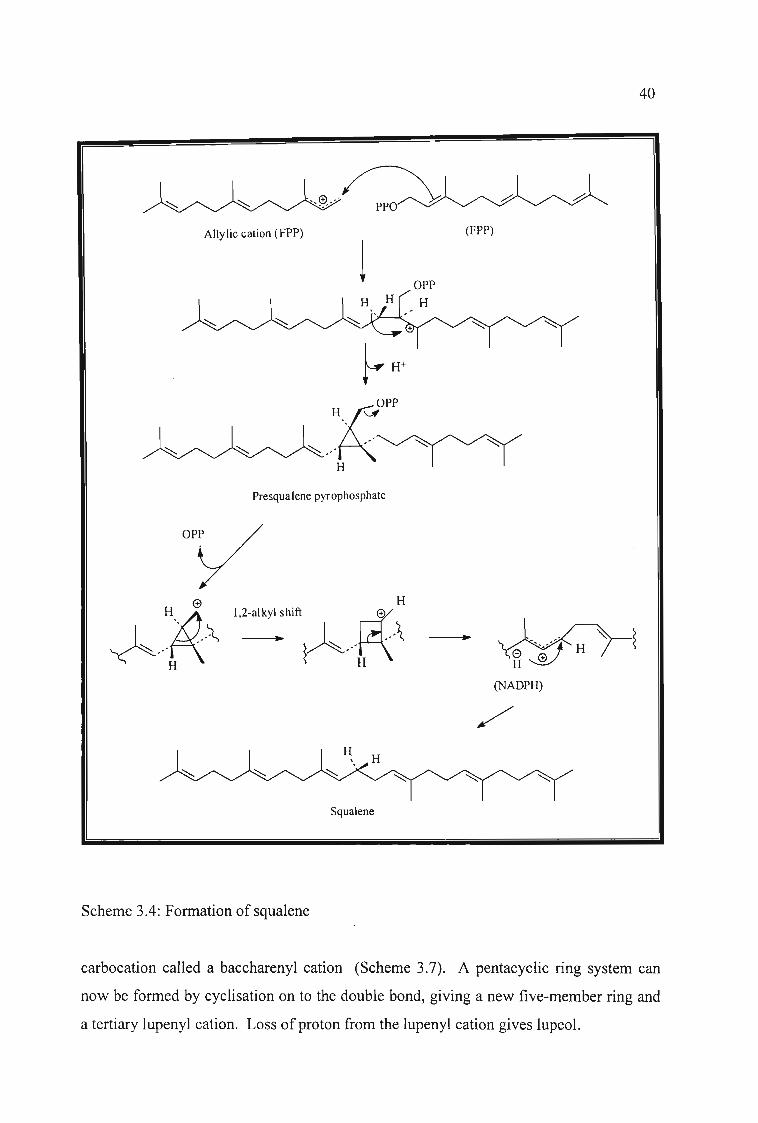
hydrocarbon squalene. Scheme 3.4 shows the formation of squalene from two molecules
of FPP to first yield an intermediate called presqualene pyrophosphate, which is formed
when the tertiary carbocation cyclises to form the cyclopropane ring. Loss of the
diphosphate give a primary cation which being not very stable, induces a 1,2-alkyl shift
(Wagner-Meerwein rearrangement) to generate a more favourable secondary cation and
less strained cyclobutane ring. Bond cleavage leads to the formation of an allylic cation,
and the generation of squalene is completed by supply of hydride from NADPH.
The tetracyclic triterpenoids are formed when squalene cyclises via the intermediate
squalene-2,3-oxide. Following this, an intermediate protosteryl cation is formed by
cyclisation of the squalene oxide. For the formation of this cation the squalene oxide
must be in the chair-boat-chair-boat conformation (Scheme 3.5). The cyclisation is
followed by a series of Wagner-Meerwein migrations of methyls and hydrides in two
different ways to give lanosterol in animals and cycloartenol in plants62 .
3.4.2 The pentacyclic triterpenoids62
When squalene oxide is in the chair-chair-chair-boat conformation, the damaryl cation
(Scheme 3.6) is formed which undergoes a 1,2-alkyl shift to produce a secondary
40
"0'.~•.... PPG
Allylic cation (FPP) (FPP)
H·roPP
~·K~H
Presqualene pyrophosphate
H1,2-alkyl shift ~
_~ I ...\~~"'H
I. .~.~~H/
(NADPH)
Squalene
Scheme 3.4: Formation of squalene
carbocation called a baccharenyl cation (Scheme 3.7). A pentacyclic ring system can
now be formed by cyclisation on to the double bond, giving a new five-member ring and
a tertiary lupenyl cation. Loss of proton from the lupenyl cation gives lupeol.

Squalene
JNADPH
O2
chai r-boat -chair-boatsqualene oxide
J
Protosteryl cation
J
Lanosterol (animals) or Cycloartenol (plants)
Scheme 3.5: Formation of the protosteryl cation (tetracyclic precursor)
Ring expansion in the lupenyl cation by bond migration gives the oleanyl system, from
which the widely distributed p-amyrin is derived. Formation of the isomeric a-amyrin
involves first the migration of a methyl in the oleanyl cation then discharge of the new
taraxasteryl cation by three hydride migrations and loss of a proton (Scheme 3.7).
41

42
The formation of a- and ~-amyrin from the oleanyl cation involves basically rings C, D
and E. With the friedelanes however, a dramatic hydride/methyl shift occurs involving
all five rings.~!!!!!!!!!!!!!!!!!!!!!!!!!!!!!!!!!!!!!!!!!!!!!!!!!!!!!!!!!!!!!!!!!!!!!!!!!!!!!!!!!!!!!!!!!!!!!!!!!!!!!!!!!!!!!!!!!!!!!!!!!!!!!!!!!!!!!!!!!!!!!!!!!!!!!!,
chair-chair-chair- boatsqualene oxide
1
HO
Dammarenyl cation
1Bacchareny I cat ion
Scheme 3.6: Formation of the dammerenyl cation (pentacyclic precursor)
Instead of the 12,13-double bond formation by loss of a proton, hydride/methyl shifts
continue until the enol of friedelin is formed. Friedelin being formed by subsequent
reduction of the enol. This rearrangement is termed "friedo" rearrangement. The

43
formation of friedelinol IS likely to involve enzymatic reduction by a hydrogenase
enzyme (Scheme 3.8).
Bacchareny I cat ion
Lupenyl cation
fr) JH -~J
OH
OH
~h:;lkY/.
/OH
OH
Oleanyl cation
OH
oleanyl cation
Lupeol
OH
1 /3-amyrin
OH
1,2 hydri de shi fts..OH
Taraxasteryl cation a- amyrin
Scheme 3.7: Formation of the lupenyl and oleanyl cations

Oleanyl cation
T®
HHO
44
Enol
HO
hydrogenase enzyme..reduction
Friedelinol
Scheme 3.8: "Friedo" rearrangement
Friedelin

PARTB
RESULTS AND DISCUSSION

45
CHAPTER FOUR
EXTRACTIVES FROM ACRIDOCARPUS NATALITIUS
4.1 INTRODUCTION
Acridocarpus natalitius Adr. Juss. (Malpighiaceae) is one of many traditional medicinal
plants used as charm plants by the native people. African doctors (sangomas) use them in
the preparation of an ointment, which is believed to safeguard warriors in battle. Both
Pondos and Zulus believe that the leaves have the power to prevent a person from
performing some undesirable deed, from uttering undesirable words or passing on secret
information63.
The plant root is claimed to possess gentle laxative properties and produce a natural
movement of the bowels. It is either ingested in raw powdered form, a teaspoon at a time
or made into an infusion and drunk like a tea. Half a cup is prescribed twice a day to
relieve constipation64.
Two subspecies of Acridocarpus exist in Natal namely, A. natalitius Juss var.
linearifolius Launert and A. natalitius Juss. var. natalitius. The second type was used in
the present study. The plant is described as a shrub with a marked tendency to scramble,
sometimes reaching the forest canopy, but sometimes develops into a small tree up to 5m
in height. The bark is grey (fig. 4.1) with the tips of the branches often twining and the
leaves are alternate, simple, oblong to linear-lanceolate and leathery (fig. 4.4). The
flowers are deep yellow, about 3cm in diameter, produced in sturdy, pyramidal spikes
(fig. 4.2). Fruits are twin nutlets, each with a broad membranous wing (fig 4.3). The two
wings together resembling a dark reddish-brown moth, hence the common name, Moth
fruit tree. The roots are longitudinal, with a soft outer covering and a hard, woody core
(fig. 4.5)63.

Fig. 4.2 Flowers
46
Fig. 4.3 Fruits resembling 'moths' Fig.4.1 Bark

Fig. 4.4 Leaves (broad, lanceolate)(courtesy: Dr. N. Crouch, Natal Herbarium)
Fig. 4.5 Roots in their natural habitat(courtesy: Dr. N. Crouch, Natal Herbarium)
47

48
Cl 'fi . 63assl lcatlOn :
Family: Malpighiaceae
Genus: Acridocarpus
Species: natalitius
The present study of the roots of A. natalitius has revealed the presence of several
pentacyclic triterpenoids and stigmasterol from the hexane extract. The methanol extract
produced (-)-epicatechin [4] as the major metabolite, together with glucose and sucrose.
a) Friedelin [41]
b) epi-Friedelinol [42]
c) Lupeol [43]
d) Oleanolic acid [44]
e) Stigmasterol [45]
f) (-)-Epicatechin [4]
g) Glucose [64]
h) Sucrose [65]
All the above compounds have previously been isolated and identified from other plant
. 24 65 Th' . h fi . h h d h b .,specIes '. IS IS t e lrst tIme t at t ese compoun save een reported m thIS plant.
4.2 PENTACYCLIC TRITERPENOIDS AND STIGMASTEROL
4.2.1 Friede1an-3-one [41]
[Friedelin 41]
Friedelin [41] was obtained as colourless crystals as described in 7.2.1.1.

49
30 29~'"''
""21
1222
16
0
23
[41]
The 'H NMR [plate H-1] of friedelin [41] showed eight conspicuous methyl resonances
in the upfield region of the spectrum. This information coupled with the thirty-carbon
figure from the l3C NMR data [plate C-1, Table AI], led to the conclusion that the
compound was a triterpenoid. The compound showed properties of lacking any polar
constituents due to its behaviour during TLC analysis.
Inspection of the l3C NMR showed a resonance at 213.26 ppm from which the presence
of a carbonyl functionality was suspected. This was confirmed from the IR data [plate 1
1], which showed a strong peak at 1718.79cm"'. The compound also gave a positive test
to 2,4-DNPH. As no aldehydic protons were present, a ketone functionality was
concluded. The carbonyls of aldehydes usually resonate at about 207 ppm. Also, the
aldehyde proton would be present in the 'H NMR spectrum, resonating between 9-11
ppm.
The pentacyclic nature of the compound was arrived at from the study of tetracyclic
triterpenoids. Structurally, all tetracyclic triterpenoids contain a side chain attached at c17 that is comprised of 8 to 10 carbon atoms. The side chain can be saturated or have at
least one double bond.
The isopropyl methyl protons (C-26, C-27) appear at roughly 0.87ppm as doublets (1=
5.4Hz), due to them coupling to the C-25 proton. With a 24, 25-double bond, two
50
broadened three-proton singlets occur at 1.7 and 1.6 ppm. The C-21 methyl also appears
as a doublet (1= 6Hz), because of coupling with H-20.
Friedelin [41] however, showed three methyl resonances at 0.70, 0.84 and 0.86 ppm, the
most upfield of the methyl resonances. All appeared as three proton singlets. Further
evidence was furnished from the I3C NMR data, which negated the presence of a side
chain. Thus, the only way to accommodate thirty carbons without a side chain is the
formation of an additional ring, suggesting a pentacyclic triterpenoid.
A study of a compilation of 13e NMR data of pentacyclic triterpenoids was used as the
basis for the final structure elucidation of friedelin [41). A conspicuous methyl signal
found considerably upfield in the 13e NMR of friedelin (6.8 ppm) was used as a
fingerprint to compare and verify the structure from the reported data. A detailed
explanation of structure elucidation of pentacyclic triterpenoids is given in section 3.3.
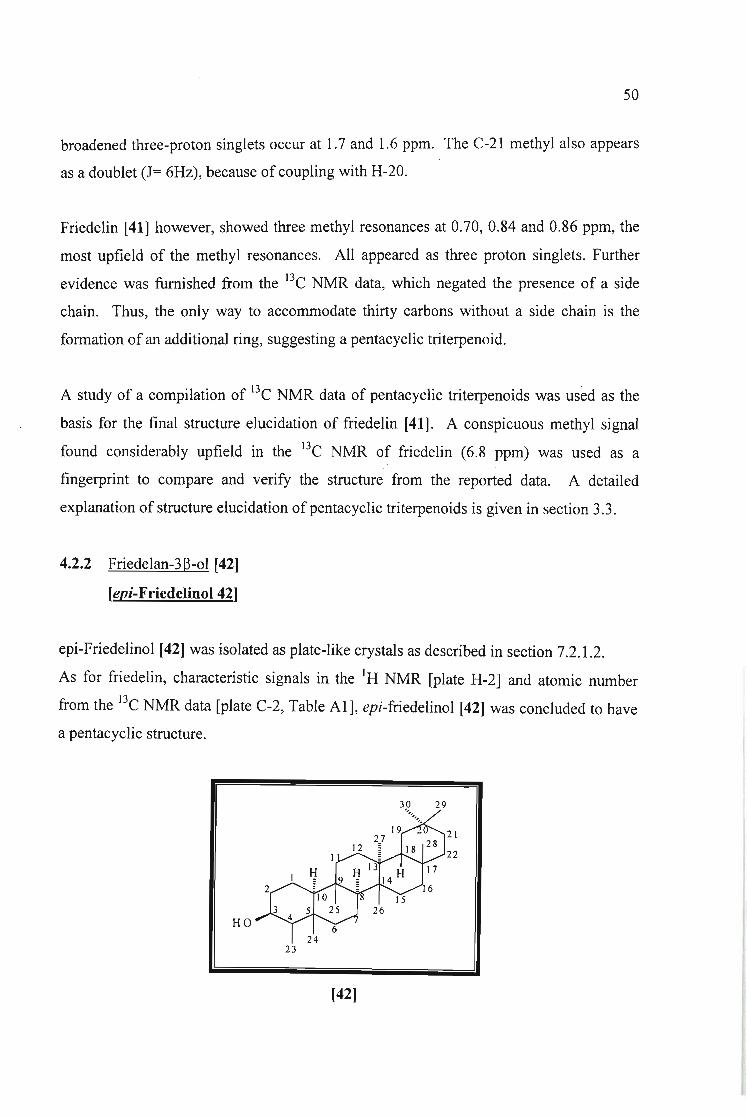
4.2.2 Friedelan-3fl-ol [42]
[epi-FriedelinoI42]
epi-Friedelinol [42) was isolated as plate-like crystals as described in section 7.2.1.2.
As for friedelin, characteristic signals in the IH NMR [plate H-2] and atomic number
from the 13e NMR data [plate C-2, Table AI], epi-friedelinol [42) was concluded to have
a pentacyclic structure.
HO
21
22
23
[42)

51
A broad doublet at 3.72 ppm (J=1.8 Hz) was indicative of an alcoholic a-proton. Further
evidence of an OH group was given by the l3C NMR, which showed a peak resonating at
72.76 ppm. Inspection and comparison of the l3C NMR data with that of friedelin
revealed many similarities. Thus, the absence of the carbonyl group and the presence of
an OH functionality led to the proposal that the compound was the reduced form of
friedelin. An argument given in section 3.3 about the effect of substituting the carbonyl
group with an OH group further established the above proposal. Information gained from
the melting point again strengthened this conclusion, since the a-isomer melts at 3000 C
whilst the p-isomer melts between 283.50- 2850 C65
.
The reduction offriedelin [41] as discussed in section 7.366 did not go to completion even
after several attempts. However, TLC analysis showed that a product of the reduction
had the same characteristics as epi-friedelinol [42], but was in too small a quantity for
isolation purposes. The lH NMR of the reduction mixture shows unreacted friedelin [41]
as the major compound; however, expansion of the spectrum clearly shows the one
proton doublet (1=1.8 Hz) that is characteristic in the proton spectrum of epi-friedelinol
[42].
From the data accumulated and the results of the reduction of friedelin [41] (see section
4.4). It was concluded that the compound was epi-friedelinol [42] having an axial OH
group at C-3.
4.2.3 3B-Hydroxylup-20(29)-ene [43]
[Lupeol43]
Lupeol [43] was isolated as colourless crystals as described in section 7.2.1.3.

--
52
[43]
The spectral data of lupeol [43] was not very dissimilar to the IH NMR and l3C NMR
spectra of the previous two terpenoids, revealing characteristics that allowed a
pentacyclic triterpenoid structure to be arrived at.
The IH NMR [plate H-3] spectrum showed a multiplet at 2.35 ppm that was due to the
geminal protons at C-2 coupling with H-la, H-lb and H-3. A doublet of doublets at
3.17ppm due to H-3 suggested an alcoholic a-proton. The region of resonance was
indicative of this. Further evidence of the OH group was provided by the BC NMR,
which showed a resonance at 79.02 ppm. An AB coupled doublet at 4.6 ppm was
indicative of olefinic geminal protons. Also the l3C NMR showed shifts in the region
appropriate for olefinic carbons (109.33 and 150.99 ppm), their positions however, were
suggestive of only one ofthem being protonated.
Mahato and Kundu39, from their compilation of l3C NMR data, showed that the lupanes
contained a side chain isopropylidene group. The hopanes (Scheme 3.2), another class of
pentacyclic triterpenoids, may also possess a very similar skeleton to the lupanes,
however the position of C-28 is found at C-18 rather than at C-17. The effect of this is
that the C-27 is deshielded in the hopanes in comparison to the lupanes, due to the loss of
the y-effect from C-18 and the gain of 8-effect from C_2839.

53
4.2.4 3p-Hydroxy-12-0Ieanen-28-oic acid [44]
[Oleanolic Acid 44]
The acid [44] was isolated as a white powder from the hexane extract as discussed in
section 7.2.1.5.
[44]
The proton spectrum of oleanolic acid [44] [plate H-4] showed only seven methyl
resonances in the appropriate region. A multiplet at 3.21 ppm was indicative of proton
alpha to an alcohol functionality showing coupling to H-la and H-lb and H-2a and H-2b.
The doublet of doublets at 2.8 ppm is due to H-2a and H-2b coupling to H-3. Signals at
143.4 and 122.1 ppm in the l3C NMR spectrum [plate C-4, Table AI] were indicative ~f
olefinic carbons. However, since only one proton signal (integral) was observed in the
olefinic region in the IH NMR (brs, 5.26 ppm), this suggested that the double bond was
located at the ring junction. The presence of an acid was first suspected from the TLC
characteristics (low mobility in solvent system) together with a distinct resonance in the
l3C NMR spectrum at 184 ppm. The one methyl deficit in the IH NMR led to the
conclusion that the acid was in a position previously occupied by the methyl substituent.
A study of the literature showed that the methyl shifts in oleanolic acid were very similar
to those compounds that contained the oleane skeleton (Scheme 3.2). Hence, the

54
structure of oleanolic acid was arrived at by comparison of spectral data and the fact that
it co-migrated with an authentic specimen.
4.2.5 24B-Ethylcholest-5,22-dien-3B-ol [45]
[Stigmasterol 45]
The isolation of stigmasterol [45] is described in section 7.2.1.4.
29
2
2122~ t
18 20 2312
16 27
8 :H
HO 7
[45]
The IH NMR [plate H-5] and 13C NMR [plate C-5, Table AI] data of stigmasterol [45] is
well established. The characteristic signals were easily identified thus establishing the
identity of stigmasterol by comparison with published data57. Confirmation was also
obtained from TLC analysis with an authentic sample. Due to the widespread
distribution of stigmasterol, it proved insignificant to pursue any further investigations
pertaining to this compound.

55
4.3 (-l-EPICATECHIN AND CARBOHYDRATES
4.3.1 (2R,3R)-2,3-cis-F1avan-3,3',4',5,7-pento1 [4J
[(-l-Epicatechin 4J
(-)-Epicatechin [4J was obtained as a brown amorphous, non-crystalline compound by
subjecting the methanol extract to different chromatographic techniques as discussed in
section 7.2.2.
RO
OR
OR
~' OR
2'
~,,,,,./i) ;:6'
3"""OR
[4J R = H
[46] R = Ac
Two meta-coup1ed doublets at 5.94 and 6.04 ppm (J=2.4 Hz) due to H-6 and H-8 were
evident in the lH NMR spectrum [Plate H-6]. An ABX system defined the B-ring
substitution pattern. H-2' was seen as a meta coupled doublet at 7.07 ppm (1=2.1 Hz). H
5' occurred as a doublet at 6.81 ppm (ortho coupled, J=8.1 Hz). H-6' appeared as a
doublet of doublets at 6.86 ppm (1=2.1 and 8.1 Hz) due to ortho coupling with H-5' and
meta coupling with H-2'. A one-proton singlet at 4.90 ppm and a one-proton multiplet at
3.66 ppm indicated the cis orientation of H-2 and H-3 respectively. Finally, the geminal
protons of H-4 were seen as a doublet of doublets for each. H-4ax resonating at 2.76
ppm and H-4eq at 2.89 ppm.

56
The phenolic carbons of rings A and B were clearly distinguished in the 13C NMR [plate
C-6]. Those of ring-A resonating at 156.5 and 156.4 ppm while those of ring-B showed
resonances at 144.1 and 144.3 ppm. The comparatively lower field positions of ring-A
phenolic carbons were due to the deshielding effect of the electron withdrawing aliphatic
ring. The aliphatic carbon signals are also clearly indicative of the flavan-3-ol aliphatic
ring system. Signals at 78.3, 65.8 and 27.9 ppm were due to C-2, C-3 and C-4
respectively.
Analysis of the IH NMR [plate H-7] and BC NMR [plate C-7] of the acetylated
derivative unambiguously indicated structural allocation and substitution pattern for [46]
in congruence with, and thereby confirming that obtained for epicatechin [4]. The
structure was finally verified by comparison with published data3 and TLC with an
authentic sample.
4.3.2 a-D-, B-D-Glucopyranoside [64]
[Glucose 64]
Glucose [64] was isolated as an amorphous brown solid from the methanol extract as
described in section 7.2.2.3
HO
[64]
OH
Examination of the IH NMR [plate H-8] spectrum of glucose showed that it was a
mixture of the a- and ~-anomers. The signal at 5.24 ppm (d, 3,9 Hz) is due to the
anomeric proton of the a-anomer, whilst the anomeric proton of the ~-anomer is

57
represented by a doublet (1= 7.8 Hz) at 4.66 ppm. The compound was verified by
comparison of IH NMR data and migration on TLC plate with an authentic, pure sample.
4.3.3 ~-D-Fructofuranosyl a-D-glucopyranoside [65]
[Sucrose 65]67
Sucrose [65] was isolated as colourless crystals from the same extract that gave glucose
as described in section 7.2.2.4.
HO
HOH
OH
[65]
The compound was found to be readily soluble in water. From this information, together
with the characteristic green colour observed during TLC analysis, a sugar was suspected.
The IH NMR spectrum [plate H-9] contained several multiplets in the region 3.4-3.9
ppm, which is indicative of a typical sugar. The compound was suggested to be sucrose
[65] by comparison ofTLC results and the IH NMR spectrum of an authentic sample.
The doublet at 5.41 ppm (1=3.9 Hz) was ascribed to the anomeric proton of the glucosyl
moiety. Further doublets at 4.21 (1=8.7 Hz) and 3.82 ppm (J=2.1 Hz) were due to H-3'
and H-6,-6' respectively. Triplets at 4.05 (J=8.4 Hz), 3.46 (1=9.3 Hz) and 3.76 (J=9.6 Hz)
were ascribed to H-4', H-4 and H-3 respectively. H-l' was seen as a broad singlet at 3.67
ppm.

58
4.4 ATTEMPTED SYNTHESIS OF EPI-FRIEDELINOL [42J
TLC analysis of the product obtained revealed two spots co-migrating with friedelin and
epi-friedelinol. However, the spot co-migrating with friedelin [41] was darker when
compared to the second spot. Thus, it was concluded that friedelin [41] was reduced only
to a small extent. Repetition of the experiment showed no improvement in the yield. The
amount of epi-friedelinol [42] present was too small to isolate and analyse and so the
entire mixture, designated EF-1, was analysed.
The lH NMR spectrum of EF-1 [plate H-lO] revealed the presence of a doublet at
3.72ppm(J=1.8Hz). The expansion of this doublet is seen in fig. 4.6. The IH NMR of
epi-friedelinol [42] [plate H-2] also displays this doublet at 3.72 ppm (1= 1.8 Hz).
Figure 4.7 gives a partial structure of friedelin [41] [A] showing the stereochemistry of
the cyclohexanone A-ring. Cherest and Felkin68, 69, 70 considered the stereochemistry of
organometallic compound addition to cyclohexanones to be influenced by two factors:
(1) steric interaction of the incoming group with the 1,5 axial substituents and (2) the
torsional strain of the incoming group with the 2,4-axial substituents. Torsional litrain
implies bond repulsion between the forming C-R bond and the 2,4-axial hydrogen bonds.
The methyl group at position C-3 is axial, and will hence influence steric interaction
between itself and the forming OH group, [B] and [C], depending on the orientation of
the OH group.

.-
59
".4 4.2 4.0 3.8 3.6 3.4 3.2 3.0 2.8 2.6
Fig. 4.6 Expansion ofEF-1 showing H-3 doublet of epi-friedelinol [42]
B
..---Jarge interaction
..
8
small interactio
\
c
I3-face
a-face
FigA.7 Stereochemistry of friedelin A-ring

60
Since reduction of a keto group is perpendicular to the plane of the carbonyl and the least
hindered side is favoured, this implies that for friedelin [41) the a-face is favoured (se~
figure 4.7, p59). This results in a 3P-OH (axial) and a C-3 a H (equatorial). Even though
friedelinol [C) looks the more favourable product, its formation is thermodynamically
less favourable.

61
CHAPTER FIVE
EXTRACTIVES FROM TYPHA CAPENSIS
5.1 INTRODUCTION
Typha capensis (Rohrb.) N.E.Br (Typhaceae) is also known as ibuma (Zulu), bulrush
(English) and papkuil (Afrikaans). The plant is very common in South Africa, found in
all parts, but sparse in the North Western Cape region. It is usually found in wet or71seasonally wet places .
Fig. 5.1 Distribution of T capensis in Southern Africa
The plant is described as a robust, reed-like plant of up to three metres in height (fig. 5.2).
The rhizomes are thick, fleshy and spongy and creep horizontally (fig 5.3). Erect stems
protrude from the rhizomes to end in thick, strappy, hairless leaves. The characteristic
flower stalk has minute male flowers towards the tip with the female flowers packed
below the male part in a thick brown mass (fig 5.2). The bulrush 'flower' is formed when
the male flowers fall off71.
Medicinal uses of the rhizomes include prescription during pregnancy to ensure easy
delivery, for venereal diseases, dysmennorhea, diarrhoea, dysentery and to enhance the

Fig. 5.2 Flowering and fruiting stalks of T capensis
Fig. 5.3 Rhizomes as they are sold for medicinal use
62

63
male potency and libido. Other uses include treatment of genital problems, promotion of
fertility in women and to improve blood circulation. Its use in childbirth stems from the
claim that it strengthens uterine contractions and promotes expulsion of the placenta72, 73.
The patient is prescribed one or two cups of a decoction of the roots in boiling water,
which is taken daily for a week74.
The phytochemistry of several specIes of Typha have been documented75. Several
flavones and other phenolic compounds, long chain hydrocarbons as well as various
triterpenoids with a steroidal skeleton e.g. typhasterol (fig 5.4) have been isolated76.
HO""
o
Fig. 5.4 Typhasterol
The plant is classified7l as:
Family: Typhaceae
Genus: Typha
Species: capensis

64
No triterpenoid like steroids were detected in the present study, however, the hexane
extract has revealed two new phenolic compounds, namely, i) typharin [47] and ii)
typhaphthalide [48], including iii) p-sitosterol [49].
The acetone extract has also produced several known flavan-3-ols, which were isolated as
mixtures in their free phenolic form; these include, i) afzelechin [10], ii) epiafzelechin
[23], iii) (+)-catechin [11], and iv) (-)-epicatechin [4].
All the above compounds except [47] and [48] have been previously isolated from other
plant species.
5.2 BIBENZYLS AND B-SITOSTEROL
5.2.1 7- Hydroxy-3-benzylphthalide [48]
[Typhaphthalide 48]
Compound [48J was isolated as fine, white crystals as described in section 8.2.1.1.
5'
4'
[48J

65
The IH NMR [plate H-ll] and l3C NMR [plate C-8] revealed the following properties of
compound [48];
a) The compound had two aromatic rings,
b) A carbonyl functionality, confirmed from the lR [plate 1-2] and NMR data.
c) A hydroxyl group; confirmed by deuterium exchange,
d) A CH2 group attached to an aromatic ring (from mass spectrum and NMR data)
The complete structural analysis is discussed in section 5.3.
5.2.2 8-Hydroxy-3-[2-(phenyl)ethenyl]dihydroisocoumarin [47]
[Typharin 47]
Typharin [47] was isolated as a non-crystalline, yellow compound as described in section
8.2.1.2
5'6' ~ 4'
H 8' I~ ~ 3'
7'I'
2'
OH 0
[47]
The aromatic nature of [47] was determined from the IH NMR [plate H-12] which
showed signals in the region from 6.0 to 7.5 ppm. The IH NMR spectrum also displayed
olefinic signals between 4 and 6 ppm and from the coupling constants, a trans orientation
was deduced. The l3C NMR revealed the presence of a carbonyl functionality and a
hydroxyl group. The presence of the hydroxyl group was established by deuterium

66
exchange experiments. The detailed analytical discussion of the structural elucidation is
given in section 5.4.
5.2.3 24a-Ethylcholest-5-en-3B-ol [49]
m-sitosterol 49]
~-sitosterol [49], as discussed in section 8.2.1.3, was isolated as opaque, needle-like
crystals from the roots of T capensis.
Like stigmasterol, the spectral data of ~-sitosterol is well recognized and the IH NMR
[plate H-13] displays characteristic peaks, which easily distinguishes ~-sitosterol from
stigmasterol. The compound was verified from TLC results and NMR data of an
authentic sample. No further investigations or analyses of [49] were pursued.
HO
[49]

67
5.3 STRUCTURE ELUCIDATION OF [47)
5.3.1 The aromatic fragments
The IH NMR of [47] showed a multitude of signals between 6 and 7.5 ppm, which
integrated for 10 protons, assuming the smallest integral to be one. The multiplet
between 7.2 and 7.5 ppm is characteristic of a mono-substituted ring. This provided a
good point for structure modelling and was designated fragment A.
B
:GJ~ \C
B B'~
R A'
Fig.5.5 Fragment A
Further evidence came from the l3C NMR [plate C-9], which showed magnetically
equivalent carbons at 128.73 and 126.79 ppm, which showed a 2:1 integration with the
other methine carbons. A peak at 128.53 ppm that integrated for one carbon, was shown
from the ADEPT [plate AD-2] analysis to be a methine group. The HETCOR [plate HE
2] and COSY [plate CO-2] plots showed a direct correlation of this proton with the ones
previously mentioned. Hence, it was deduced that these five protons formed an AA'BB'C
system as shown in fragment A. However, the signals between 7.2 and 7.5 ppm
integrated for six protons. Since five of these were accommodated for in fragment A, it
was deduced that the sixth proton was from another aromatic system.
Inspection of the HH-COSY revealed a single proton (7.42 ppm) coupling to two other
protons at 6.90 (d, J= 8.4Hz) and 6.72 ppm (d, J= 8.1Hz). The lone proton at 7.42 ppm
was considered a fused doublet of doublets (J = 8.0 and 8.1 Hz). Two further protons at
6.78 and 6.30 ppm were discounted as being aromatic by virtue of their coupling
constants and also because they showed no direct correlation to the latter mentioned

68
aromatic protons. From these results and in the absence of any further aromatic groups, it
was concluded that the second aromatic system was tri-substituted and designated
fragment B.
Fig.5.6 Fragment B
5.3.2 The aliphatic fragments
The two protons at 6.78 and 6.30 ppm had a coupling constant of 16Hz and by virtue of
their position were considered olefinic with a trans orientation. The proton at 6.30 pp:::
also showed strong coupling to another methine proton at 5.23 ppm. This explained why
it was split into a doublet of doublets. Further analysis of the HH-COSY showed that this
proton was also coupled to a methylene group found at 3.12 ppm with a somewhat
strange splitting pattern, a doublet and a singlet. Fragment C (fig. 5.7) was arrived at
from this coupling pattern.

69
~ H4 I 8' ICH2-CH-C=C~~ 3 h 7'
Fig.5.7 Fragment C
At first glance, H-3 was considered as olefinic, but, this notion was negated due to it
resonating at 5.23 ppm which is too upfield for an olefinic proton. The splitting pattern
of this proton on expansion (fig. 5.8) showed that it was actually a multiplet although the
spectrum shows the resonance as a quartet. The NOESY [plate NO-2] shows long range
coupling with H-7' (see fig. 5.14, p.73) which would account for the splitting. Due to the
splitting pattern of H-4a and H-4b which did not show distinct geminal protons, an AA'
system was assumed rather than an AB system. Since H-3 was not olefinic, its downfield
position could be explained by it being connected to a heteroatom or a carbonyl group.
Inspection of the 13C NMR revealed a carbonyl group at 169.49 ppm, confirmed from the
IR spectrum [plate 1-3], which showed a strong carbonyl stretching at 1689.6 cm-I.
However a methine group attached to a carbonyl group resonates at higher field than that
shown77. If the carbon was attached directly to a nitrogen, the range is 60-70 ppm77,
however, if it was attached directly to an oxygen atom then a shift of 82 ppm was
possible77. Hence, fragment C was modified to yield fragment D (fig. 5.9).

70
5.30
5.30
5.25 5.20
~ ~'1, ~
on~~~~ I
u-iu-i '1 11I I
5.25 5.20
Fig. 5.8 Expansion ofH-3 quartet
Fig.5.9 Fragment D
5.3.3 Construction of compound
A sharp singlet at 10.97 ppm represented an OH functionality due to its suppression by
deuterium exchange. A signal at 162.26 ppm in the l3C NMR was indicative of a
phenolic carbon. This had to be found on fragment B as shown in fragment E (fig. 5.10).
At this stage, all atoms were accounted for.

71
H
H 5 RI6~
A I0
9
H 7~ R28
OH
Fig.S.1O Fragment E
The connectivity of the methylene carbon (C-4) was determined by its relative downfield
shift and confirmed by the NOESY, which showed long range coupling between H-4 and
H-5 (see frag. F). Since no coupling was seen between H-4 and the OH group the
substitution seen in fragment E was assumed correct. This result led to the conclusion
that the carbonyl group had to be connected to the ring in the absence of any further
carbons giving fragment F (fig. 5.11).
,tH H
\7'
H
OH 0
FigS11 Fragment F
The connectivity ofH-T and H-8' to fragment A (see fig. 5.12, fragment G) was evident
from the NOESY (long range coupling ofH-2' and H-T, see fig. 5.14). Comparison of
the 13C NMR data with that of(E)- propenylbenzene (fig. 5.13, Table 5.1) gives further
evidence for this argument.

H H H H
72
Fig. 5.12 Fragment G Fig. 5.13 (E)-propenylbenzene
Table 5.1 Comparative n C NMR (ppm) data of (E)-propenylbenzene and
Fragment G
Carbon No. (E)-propenylbenzene Fragment G
I' 138.0 138.89
2' 126.8 126.79
3' 128.5 128.73
4' 125.9 128.53
5' 128.5 128.73
6' 126.8 126.79
7' 131.2 133.96
8' 125.4 125.145
With all connectivities now deduced, the structure of [47] was derived, as shown.

73
,-I \
",.- - '" ; t 5'I \ 6' ~4'l ,
I B4~H 8'~
l'# 3'
7' 2'\ 1f ~ ~0-- \ ,-
OH 0
Fig. 5.14 [47] (------ = long range coupling)
The orientation ofH-3 is yet to be determined. A 3-D model based on bond angles and
bond lengths is shown in fig. 5.15.
1
Fig. 5.15 3-D structures of [47]
5.3.4 Literature survey
2 3
A survey of the phytochemical literature revealed several compounds with a closely
related structure. Mizuno et az78 isolated several isocoumarins from Achlys triphylla
which were called achlisocoumarin-I [50], -Il [51], -Ill [52] and -IV [53].

74
HO
OH~
HO
OH
OH 0
[SOJ
OH 0
[51J Rt=gerany~ R2=H[52J Rt=H, R2=(l-1
HO
OH 0
o ~
[53]
OH
o
Mizuno et az78 declared that the skeleton was novel and according to the source used for
the literature survey, no further compounds with the same skeleton have been identified.
Thus, [47] is believed to be a new compound according to the references sourced75 . Due
to the different substituents and substitution pattern of compounds [50] to [53], few
similarities were seen in the chemical shifts between them and [47J. Two further
compounds were sourced to verify the connectivities of rings A and C; namely,
hydrangenol 4' -O-glucoside [57] 79 and phyllodulcin [58] 80.

6
o
[57]
3' 0,4' GLUCOSE
[58]
3'
75
Table 5.2 shows l3C NMR data (ppm) of selected carbons of [57] and [47] and Table 5.3
shows comparative IH NMR data (ppm) of [47] and [58].
Table 5.2 ne NMR data (ppm) of [47J and [57J (selected carbons)
Carbon no. [47] [57]
1 169.49 169.3
3 79.65 80.2
4 33.48 33.6
5 118.05 118.5
6 136.32 136.5
7 116.46 115.6
8 162.26 161.0
9 109.31 108.5
10 138.89 140.6

76
Table 5.3 Comparative I" NMR data (ppm) of [47J and [58J
Proton no. [47] [58]
3 5.23 (q, J= 6.2, 14.3 Hz) 5.56 (q, J= 5, 11 Hz)
4 3.12 (m) 3.13 (m)
8-0H (phenolic) 10.97 10.48
5.4 STRUCTURE DETERMINATION OF [48J
5.4.1 Preliminary data
A constituent of the hexane extract of T capensis, [48] showed a somewhat low melting
point (70o-75°C), and supported a molecular formula of ClsHIZ03 (m/z 240.0786)
Oxygenation suggested hydroxyl and/or carbonyl functionalities. This contention was
supported by the IR spectrum [plate 1-2] of [48] which showed a characteristic carbonyl
stretching at 1713 cm-1
while bands at 3436 and 3543cm-r could be attributed to a phenyl
moiety's O-H stretching vibration. Further evidence was given by the 13C NMR data
(plate C-8), which showed signals at 171.93 and 156.49 ppm, indicative of a carbonyl. .
group and a hydroxyl group, respectively.
The aromatic nature of the compound was deduced from NMR data. The IH NMR (plate
H-ll) revealed approximately eight protons (integral) in the region between 6.5 to 7.5
ppm, indicative of aromatic protons. The I3C NMR data also showed signals in the
aromatic region (see table A4). From the number of protons and the double bond
equivalence calculations two rings were suspected.
A low field methine signal (82.59 ppm) was believed to be connected to a heteroatom, in
this case, oxygen. This would account for the third oxygen atom considering the
presence of one hydroxyl and one carbonyl group. Finally, from the HH COSY (long
range coupling, plate CO-I) a methylene at 40.69 ppm was shown to be attached to an

77
unsubstituted aromatic ring as well as the fact that the mass spectrum showed a fragment
with a mass of 91.055, which indicated a molecular formula of C7H7• The base peak at
rn/z 149.024 is the difference obtained between the molecular mass of [48J and the C7H7
fragment. The next step involved the connectivities of the atoms.
5.4.2 The aromatic fragments
Fragment A (fig. 5.16) was known from the mass spectral data and NMR data. Hence,
the substitution pattern of the second ring system needed to be determined. With the
knowledge that the system was phenolic, an inspection of the HH-COSY showed a triplet
(1=8.0 and 7.6 Hz) coupled directly to two doublets (J=8.0 and 7.2 Hz). Thus, fragment
B was deduced (fig. 5.16)
Fig. 5.16 Fragment A Fragment B
5.4.3 The aliphatic fragment
An AB system due to geminal protons was seen as two doublet of doublets at 3.14 ppm
(1=6.2 and 14.1 Hz) and 3.25 ppm (1=6.7 and 14.1 Hz). These protons showed direct
coupling to a deshielded methine proton at 5.68 ppm (t, J=6.5 and 6.3 Hz). From the
preliminary study it was known that the carbon was directly bonded to oxygen. The
carbonyl stretching for cyclic ketones in the IR spectrum would be expected between
1740-1780cm-l. Since the observed stretching vibration was lower, a lactone was
suspected. Asakawa et ai81 showed that for phthalides, the IR absorption bands of a non-

78
OH bonded CO is found between 1754-1764 cm-], while OH bonded CO is found
between 1734-1738 cm-I, Thus, although the signal was lower than expected the IR
provided two clues, 1) the two oxygens formed a lactone ring and 2) the OH showed
hydrogen bonding with the carbonyl group. This led to fragment B being modified to
give fragment C (fig. 5.17).
H
Fig. 5.17 Fragment C
The fragment was supported by the mass spectral data, which showed a peak for rn/z 149
(100%).
5.4.4 Construction of [48)
Knowing the connectivities of the methylene and methine groups, fragments A and C
were combined to give [48].
H6'
10 5'f"
~I'4'
:::::--....2' 3'
0
[48]

79
Like [47] the stereochemistry at the epimeric carbon (C-3) is uncertain. The most
probable stereochemical arrangement is given in the 3-D structures below (fig. 5.18).
1
Fig. 5.18 3-D structures of [48)
5.4.5 Literature Survey
2 3
Several compounds with a similar skeleton as [48) were found in literature. Asakawa et
a181, isolated a novel compound from Radula complanata called redulanolide [59). From
Frullaniajalciloba82 they isolated [60) and, compound [61) from Balantiopsis rosea83.
[59)
MeO
MeO
[60]
OMe
MeO
[61]
OMe

80
Yoshikawa et al84 showed the presence of thunberginol F [62] and hydramacrophyllol A
[63] in Hydrangea dulcis folium.
[62]
OH
[63]
OH
A comparison of the NMR data of selected atoms of [60], [61] and [48] is given in Table
5.4.
Table 5.4 NMR data of selected atoms of [60J, [61J and [48J
No. [60] [61] [48]
IHNMR IJC IH UC IH l3C
1 174.4 168.2 171.93
3 5.59 (t, 6.2) 82.3 5.35 (t, 6.2) 80.1 5,68 (t, 6.4) 82.59
lOa 3.09 (dd, 13.7, 40.2 2.97 (dd, 40.0 3.14 (dd, 40.69
6.2) 14.3,6.2) 14.1, 6.2)
lOb 3.20 (dd, 13.7, 3.04 (dd, 3.26 (dd,
6.2) 14.3,6.2) 14.1,6.7)

81
5.5 FLAVAN-3-0LS
5.5.1 (2R,3S)-2,3-trans-Flavan-3,4',5,7-tetraacetate [54]
[Afzelechin tetraacetate 54] 17
Afzelechin tetraacetate was obtained as an amorphous solid as described in sections
8.2.2.1 and 8.2.2.2. In the free phenolic fonn, afzelechin [10] was isolated as a mixture
with epiafzelechin [23].
Ring A
RO
3'2,~OR
,),:,@::2 6'
[10] R= H
[54] R= Ac
H-6 and H-8 were seen as meta-coupled doublets at 6.56 and 6.64 ppm respectively (J=
2,1 Hz) in the I H NMR of the acetate derivative [plate H-16].
Ring B
A doublet for H-2',6' (J=8.4 Hz) was seen at 7.33 ppm while the H-3',5' doublet (J=8.7
Hz) resonated at 7.07 ppm. This AA'BB' system was concluded from the integration of
the IHNMR.

82
Ring C
A one-proton doublet at 5.15 ppm (J=6.0 Hz) and a one-proton multiplet at 5.26 ppm
indicated the trans-orientated H-2 and H-3 respectively. H-4ax and H-4eq were seen as
doublet of doublets for each at 2.64 ppm (J=6.0 and 16.9 Hz) and 2.81 ppm (J=5.l and
16.8 Hz) respectively.
On consideration of the above allocations, the three acetate singlets (2.25, 2.26, 2.27 and
1.96 ppm) were attributed to 5-0Ac, 7-0Ac, 4'-OAc and 3-0Ac.
5.5.2 (2R,3R)-2,3-cis-Flavan-3,4',5,7-tetraacetate [55]
[Epiafzelechin tetraacetate 55] 17
The acetylated derivative of epiafzelechin [23] was obtained as a light brown, non
crystalline solid from the isomeric mixture of afzelechin [10] and epiafzelechin [23] as
described in sections 8.2.2.1 and 8.2.2.3. Epiafzelechin [23] was isolated as a mixture
with [10].
3'2,~OR
.).:.@::2 6'
j""'OR
[23] R= H
[55] R= Ac

83
A-ring
The H-6 and H-8 doublets were found at 6.55 ppm (J=2.1 Hz) and 6.65 ppm (1=2.4 Hz)
respectively; a downfield shift for H-8 and an upfield shift for H-6 as compared to H-8
and H-6 of afzelechin tetraacetate.
B-ring
An AA'BB' system (7.43 ppm, d, J=8.4 Hz, H-2',6') and (7.10 ppm, d, J=8.7 Hz, H-3',5')
defined the B-ring substitution pattern.
C-ring
H-2, unlike H-2 of afzelechin, resonated as a broad singlet at 5.10 ppm whilst the H-3
multiplet showed a downfield shift to 5.37 ppm indicating the eis-configuration of the
two protons. The H-4 protons also displayed downfield shifts in comparison to
afzelechin, with the H-4ax doublet of doublets at 2.84 ppm (1=2.0 and 18.0 Hz) and the
H-4eq signal at 2.97 ppm (1= 4.5 and 18.0 Hz). The acetate groups of rings A and B
showed resonances at 2.26 (s), 2.28 (s) and 2.29 (s) ppm, while the three-proton aliphatic
singlet was found at 1.89 ppm.
5.5.3 C2R,3S)-2,3-trans-Flavan-3,3',4',5,7-pentaacetate [56]
[Catechin pentaacetate 56]
The isolation of catechin pentaacetate [56] is described in sections 8.2.2.4 and 8.2.2.5.
Ring-A
The meta-coupled doublets of ring-A representing H-6 and H-8 were found at 6.57 ppm
(1=2. I Hz) and 6.63 ppm (J=2.1 Hz) respectively.

84
OR
~'
2' . OR(;\ 4'
l'~\\\\ 5''2 6'
[I1J R= H
[56J R= Ac
Ring-B
An ABX system defined the B-ring with H-2', H-5' and H-6' represented by signals at
7.22, 7.18 and 7.15 ppm respectively.
Ring-C
The aliphatic C-ring was defined by an ABMX system with a doublet (1=6.3 Hz) at 5.12
pprn and a multiplet at 5.23 ppm being attributed to H-2 and H-3 respectively. The
splitting pattern was reminiscent of a trans-configuration. H-4ax and H-4eq were seen at
2.608 ppm (dd, J=6.6 and 16.8 Hz) and 2.84 ppm (dd, J=5.1 and 16.8 Hz) respectively.
The signals between 2.25 and 2.26 ppm integrated for four methyl groups, which were
attributed to the four aromatic acetate groups while the signal at 1.98 ppm was indicative
of an aliphatic acetate group.

85
5.5.4 C2R,3R)-2,3-cis-Flavan-3,3',4',5,7-pentaacetate [46J
[Epicatechin pentaacetate 46J
Epicatechin pentaacetate [46J was obtained by acetylation and subsequent PLC
separation of the same fraction that afforded catechin pentaacetate [56J as described in
sections 8.2.2.4 and 8.2.2.6. Epicatechin [4] was isolated as a mixture with catechin [11].
OR
2'~' OR4'
l' B..".... 0 5,2 6'
[4] R= H
[46] R= Ac
A-ring
The substitution pattern continues in [46] with H-6 and H-8 resonating at 6.55 and 6.65
ppm respectively (d, 1=1.8 Hz) [plate H-7].
B-ring
The 'H NMR exhibited an ABX system for ring-B with H-2' at 7.33 ppm. H-6' and H-5'
were seen as doublets at 7.26 and 7.17 ppm respectively.

86
C-ring
A broad singlet at 5.09 ppm attributed to H-2 and a one-proton multipiet at 5.36 ppm
attributed to H-3 defined a 2,3-cis relative configuration. A doublet of doublets at 2.96
ppm (J=4.5 and 17 Hz) and another at 2.74 ppm (1=1.5 and 17 Hz) attributed to H-4eq
and H-4ax respectively completed definition of an ABMX pattern.
5.6 SPRAY COLOURS
On spraying (standard experimental section 6.1.5) of the TLC plates with the
anisaldehyde reagent, the flavan-3-ols displayed a brown to reddish-brown colour, and
the dihydroisocoumarin a colour light purple to grey. Typhaphthalide [48] was
unreactive to anisaldehyde spray reagent but showed a brown colour with Dragendorff
reagent.
5.7 BIOLOGICAL ACTIVITy85
5.7.1 Antibacterial activity
The crude methanolic extract of T capensis showed inhibition of growth of some of the
bacteria, which are believed to be pathogenically responsible for the conditions, which
this plant is used to treat. The micro-organisms against which the extract was found to be
active include;
Staphylococcus aureus
Enterobacter aerogenes
Klebsiella pneumonia
Citobacter frendii

87
5.7.2 Antifungal activity
No anti-fungal activity was displayed by the extract. This confirms observations of
fungal growth on an aqueous preparation of the crude extract when left at room
temperature for seven days in an open vessel.
5.7.3 Cytotoxic activity
The results of cytotoxic testing shows that the extract had negligible activity. Since the
plant is used as an aid during child birth, the results are appropriate in light of this.
5.7.4 Uterotonic activity
A consistent finding was that in the presence of the plant extract, irrespective of
concentration and of the concentration of acetylcholine, the muscle did not recover to
resting length, that is, the muscle remained in a partially contracted state. It was therefore
apparent that application of the extract on its own is not a smooth muscle stimulant, but
that it augments the action of a stimulant such as acetylcholine. The result of this test is
in agreement with the claim that the plant root strengthens uterine contractions in woman.

PARTe
EXPERIMENTAL

88
CHAPTER SIX
STANDARD EXPERIMENTAL PROCEDURE
6.1 CHROMATOGRAPHIC METHODS
6.1.1 Column Chromatography
Various sizes of glass columns were used, with variable dimensions.
a) 30mm x 1000mm
b) 20mm x 500mm
c) standard 50 ml burette
d) pasteur pipette 150 mm
6.1.1.1 Silica gel as absorbent
Depending on whether the column was of the open, flash or pipette type, different mesh
sizes of silica were used. Merck Kieselgel (Art. 7734, 170-230 mesh) was used for the
open column, which was packed by adding a slurry to the column. The slurry was
prepared by using the same solvent as used for the eluent. The solvent was run through
the column several times to ensure a tight packing as well as to remove any air bubbles.
The ratio of material to be separated to silica gel was in the ratio 1 : 30. Fractions were
collected in test tubes of different sizes.
6.1.1.2 Flash column
The silica was prepared and packed as described above except that Merck Kieselgel (Art.
7773.333) was used as the stationery phase. The column was then flushed with eluting
solvent under applied pressure. Fig. 6.1 shows the flash set up. Samples were applied as
for the open column. The separation was carried out under pressure at an elution rate

89
dependent on column and fraction size. Compressed air proved satisfactory for this
purpose; ideally, nitrogen should be used, however it is expensive.
-+-- Air supply(compressed air)
cal vessel (- 500 mm)water
rl-+-- Pressure tubing
r-
F=P h 0.~ IT
h -+--Clamp
-+ -+-- Column;--
~
~ :
· -+-- Elongated cylindri·V · filled to 90% with····..
Stand
Fig. 6.1 Set-up for flash column chromatography86
6.1.2 Thin Layer Chromatography (TLC)
Commercially obtained TLC plates were used for isolation (Merck Art. 5554). Between
5 and 10 mg of sample was applied. After development in an appropriate solvent system,
the plates were air dried and viewed under DV light. The relevant bands were then
marked and scraped off. The silica was extracted thereafter with an appropriate solvent.
The sample was finally isolated by removing the solvent under vacuum.

90
6.1.3 Preparative Layer Chromatography (PLC)
PLC plates were prepared by using Merck Kieselgel (Art 7747) on 200mm x 200mm
glass plates. The slurry was made by adding 450ml of water to 200g of silica. The slurry
was swirled for approximately 20min and thereafter uniformly spread over the plates
using a spreader. Plates of 1,5mm and 2mm thickness were prepared. The plates were
air dried in a draft free environment for 24 hours and then activated at 1200 C for one
hour. Sample sizes varied from 10mg to 25mg per plate. Compounds of interest were
isolated and recovered as for TLC above.
6.1.4 Pasteur Pipettes
Silica used for PLC was also packed into pasteur pipettes for final purification. The silica
was first added dry to a height of about 60%. This was then removed and mixed with the
eluting solvent into a slurry. A cotton wool plug was placed at the tapered end of the
pipette and a little purified sand was added. The slurry was then loaded using another
pasteur pipette. Elution of the mobile phases was carried out under gravity. Sample sizes
varied from 10 to 40mg. Fraction sizes were approximately 1ml.
6.1.5 Spray reagents
6.1.5.1 Anisaldehyde / H2S04
Chromatograms were sprayed light} with the above,
para-anisaldehyde 5%
absolute ethanol or methanol 45% Solution A
H2S04 5% }
absolute ethanol or methanol 45% Solution B
mixed as follows:

91
Solutions A and B were mixed in the ratio 1: 1. After spraying, the plates were heated at
1200 C until maximum colour was developed. It was observed that HZS04 that contained
abnonnally high concentration of SOz caused the spray reagent to become discolored in a
short period of time. Fresh concentrated HZS04 proved very satisfactory maintaining the
colourless status of the solution. Solutions A and B were kept in the freezer. Once
mixed, in small aliquots, the solution could be kept in the refrigerator until desired.
6.1.5.2 Dragendorff reagent
This solution was prepared as follows:
17 g bismuth subnitrate and 200 g tartaric acid in 800 ml water: Solution A
160 g potassium iodide in 400 ml water: Solution B
A + B = stock solution (1: 1)
Spray reagent: 50 ml stock solution + 500 ml water + 100 g tartaric acid
The chromatograms were sprayed lightly with the reagent, and spots evaluated in visible
light. The spots appeared orangelbrown against a light yellow background.
6.2 SPECTROSCOPICMETHODS
6.2.1 Nuclear magnetic resonance spectroscopy
IH NMR spectra were recorded on a Varian 300 (300 MHz). I3C NMR spectra were
recorded at 75 MHz. All spectra were recorded at room temperature. Chemical shifts are
given on the delta (C» scale and coupling constants (J) in hertz (Hz).

92
6.2.2 Mass spectrometry
High resolution mass spectra were recorded on a Kratos 9/50 HRMS instrument by Dr. P.
Boshoff at Cape Technikon. Low resolution spectra were recorded on MAT Finnigin
GCQ spectrometer.
6.2.3 Infrared Spectroscopy
A Nicolet Impact 420 spectrophotometer was used to record FTIR spectra in KBr.
6.2.4 Optical Rotation
Optical rotation was measured at ambient temperature in chloroform using an Optical
Activity AA-5 Polarimeter together with a Series A-2 stainless steel (4x200rnm)
unjacketed flow tube. Concentration was quoted in g/1 OOm!.
6.3 CHEMICAL METHODS
6.3.1 Preparation of acetate derivatives87
The sample or dried extract was dissolved in a minimum of pyridine and an excess of
acetic anhydride was added. The solution was then heated at 70°C for 8 hrs and the
acetate derivative isolated by addition of crushed ice to the mixture. The precipitate was
filtered and washed free of excess pyridine and acetic anhydride, with ice water.

93
CHAPTER SEVEN
ISOLATION OF EXTRACTIVES FROM ACRIDOCARPUS NATALITIUS
The roots were kindly supplied by Dr. Neil Crouch of the Natal Herbarium, Durban
(Voucher No., Crouch 810, NH). They were collected from Nagome Forest, KwaZulu
Natal.
7.1 EXTRACTION OF ROOTS
The root was composed of a soft, corky outer covering with a woody inner core. The soft
covering was removed and each part was treated separately. Both the inner and outer
parts of the roots were air dried to give the following masses:
Outer root (500g) [A]
Inner root (300g) [B]
After drying, both A and B were extracted with hexane for 72 hours. The solvent was
recovered under vacuum to yield a waxy residue; 2g for A and 1g for B. TLC analysis
showed that both A and B had very similar fingerprints except that the major compounds
were more pronounced in A than in B. The inner root was then extracted with methanol
for 48 hours. Removal of the solvent produced a dark brown, resin-like residue (25g).
7.2 SEPARATION
7.2.1 Hexane Extract

94
The extract obtained from A was then separated using column chromatography (Silica gel
Merck-7734). Eluents of about 20ml were collected in test tubes with hexane, petroleum
ether, and petroleum ether/EtOAc as follows:
100% Hex - 2000ml
100% Pet ether - 500ml
PE/EA: (97:3)-500ml
(95:5)-2000ml
(94:6)-500ml
(93 :7)-1 OOOml
(90: 10)-1500ml
(80:20)-1500ml
The fractions were monitored by TLC and combinations were made to give enriched
fractions as summarised in Table 7.1.
Table 7.1 Summary of fractions
FRACTION NO. TEST TUBES
1 1-40
2 41-161
3 162-167
4 168-179
5 180-190
6 191-262
7 263-300
8 301-335
9 336-420
10 421-500

95
Fractions 1, 3 and 4 produced fatty acids, which were identified by their characteristic
green colour with anisaldehyde/H2S04, as well as by their IH NMR results [plate H-19].
7.2.1.1 Friedelan-3-one [41]
[Friedelin 41]
Friedelin [41] (25mg) was isolated pure without further purification from fraction 2.
M.P.
Rf:
I.R.
IHNMR:
13CNMR:
0.6 (H:EA 9:1 v/v), Mass Spec.: [Plate MS-I]
plate I-I Ymax (cm-I): 2932 (bulk CH2), 1719 (C = 0 stretching)
8[CDCh, 300MHz, 298K, plate H-I]
8[CDCh, 75MHz, 298K, plate C-I, Table AI]
DV activity: none
Spray reagent: anisaldehyde-[purplelblue]
7.2.1.2 Friedelan-3 p-ol [42]
[epi-FriedelinoI42]
epi-Friedelinol [42] (l2mg) was obtained as colourless plate like crystals after solvent
recovery and recrystallisation with ether, from fraction 5.

Rf:
IHNMR:
13CNMR:
0.42 (H:EA 9:1 v/v), Mass Spec.: [Plate MS-2]
8[CDC1], 300MHz, 298K, plate H-2]
8[CDC1], 75MHz, 298K, plate C-2, Table AI]
96
DV activity: none
Spray reagent: anisaldehyde- [purple]
7.2.1.3 313-Hydroxylup-20(29)-ene [43]
[LupeoI43]
Fraction 6 deposited colourless crystals in a yellow coloured waxy residue. TLC showed
lupeol [43] as a major component with several minor impurities. The fraction was
purified by using a 150mm pasteur pipette and flash silica gel to give lupeol, as colourless
crystals (10.2 mg).
Rf: 0.32 (H:EA 9: 1 v/v)
IH NMR: 8[CDC1], 300MHz, 298K, plateH-3, Table A8]
13C NMR: 8[CDC1], 75MHz, 298K, plate C-3, Table AI]
DV activity: none
Spray reagent: anisaldehyde- [light blue after few minutes]

97
7.2.1.4 24a-Ethylcholest-5,22-dien-313-o1 [45]
[Stigmasterol 45]
The test tubes of fraction 8 showed a large concentration of white longitudinal crystals on
its walls. Hence combination and removal of solvent gave stigmasterol [45] (12 mg).
M.P.
Rf:
IHNMR:
13CNMR:
0.39 (H:EA 8:2 v/v)
8[CDCi), 300MHz, 298K, plate H-5, Table A7]
8[CDCi), 75MHz, 298K, plate C-5, Table AI]
UV activity: none
Spray reagent: anisaldehyde- [blue]
7.2.1.5 3I3-Hydroxy-12-oleanen-28-oic acid [44]
[Oleanolic acid 44]
Oleanolic acid [44] was observed as a white powdery substance on the sides of the test
tubes. Subsequent combinations gave fraction 10. The minor impurities were removed
by washing the solid with a minimum of hexane, repeatedly, until the product was
relatively pure by TLC (6.8 mg)
Rf:
IHNMR:
0.29 (H:EA 8:2 v/v)
8[CDCi), 300MHz, 298K, plate H-4, Table AIO]

98
13C NMR: 8[CDCh, 75MHz, 298K, plate C-4, Table AI]
UV activity: none
Spray reagent: anisaldehyde- [blue]
7.2.2 Methanol Extract
Two grams of the methanol extract was loaded on a flash column and eluted with ethyl
acetate until TLC analysis of the fractions showed epicatechin as a single brown spot with
anisaldehyde/H2S04 spray reagent.
7.2.2.1 (2R,3R)-2,3-cis-Flavan-3,3',4',5,7-pentol [4]
[(-)-Epicatechin 4]
(-)-Epicatechin [4] was isolated as a brown, amorphous solid (l2mg) as described above.
I HNMR:
13CNMR:
8[Acetone-d6, 300MHz, 298K, plate H-6, Table A12]
8[Acetone-d6, 75MHz, 298K, plateC-6, Table All]
Spray reagent: anisaldehyde- [mustard brown]
7.2.2.2 (2R,3R)-2,3-cis-Flavan-3,3',4',5,7-pentaacetate [46]
[(-)-Epicatechin pentaacetate 46]
Acetylation of epicatechin [4] (standard experimental section 6.3.1) produced l5mg of
the acetate [46}, also as a brown amorphous solid.

'HNMR:
13CNMR:
8[CDCl), 300MHz, 298K, plate H-7, Table A3]
8[CDCl), 75MHz, 298K, plate C-7, Table A13]
99
The column was then eluted with ethyl acetate:methanol:water mixtures as follows:
EA:M:H20 - 35:15:1
35:17:1
35:17:2
These gave fractions, which were pooled as shown in Table 7.2
Table 7.2 Summary of factions
Fraction No Test tubes
1 1-6
2 7-9
3 10-14
4 15-100
7.2.2.3 a-D- and 13-D-Glucopyranoside [64]
[Glucose 64]
Fraction 1 gave glucose [64] as a brown, gummy residue (5.4 mg).
IHNMR: 8[D20, 300MHz, 298K, plate H-8]
UV activity: none

lOO
Spray reagent: anisaldehyde- [green]
7.2.2.4 P-D-Fructofuranosyl-a-D-glucopyranoside [65]
[Sucrose 65]
Sucrose [65] was isolated as crystals from fraction 2 (lOmg).
IH NMR: 8[D20, 300MHz, 298K, plate H-9, Table A9]
DV activity: none
Spray reagent: anisaldehyde- [green]
Fractions 3 and 4 produced mixtures having the same characteristic colours as the
previous carbohydrates with anisaldehyde spray reagent.
7.3 ATTEMPTED SYNTHESIS OF EPI-FRIEDELINOL66
All apparatus were thoroughly dried in a hot (>120°C) oven before use. The LiAIH4
(50mg) was weighed into a 25ml round bottomed flask as rapidly as possible, and
covered with 5ml of sodium-dried ether. The flask was set up for reflux. Friedelin [41]
(12mg) was weighed in a 10ml Erlenmeyer flask, and dissolved in approx. 2ml of sodium
dried ether (ultra-sonic bath) and this solution was added dropwise by pipette down the
condenser at such a rate that the stirred mixture refluxed gently. The contents of the
Erlenmeyer flask were rinsed out with a small amount of dry ether, and this was added to
the mixture as well. The mixture was gently refluxed for 18-hours and then allowed to
cool. During the reflux-period, some wet ether was prepared by shaking 10ml of ether
with an equal volume of water in a separatory funnel for 5min. The upper organic layer
1030125

101
was retained. About 3ml of the wet ether was added to the cooled reaction mixture, while
shaking the solution to decompose excess hydride.
After addition of wet ether, the mixture was refluxed for a further 10 min. to complete
decomposition of the hydride. After cooling, the mixture was transferred to a separatory
funnel and approx. 1,5ml of 5% H2S04 was added, followed by thorough shaking to
decompose the aluminium complex. The organic phase was retained while the aqueous
phase was re-extracted with a further 2ml of ether. The solution was dried over MgS04,
filtered and the solvent removed on the rotary evaporator. This gave a colourless,
crystalline solid, which was recrystallised from ether (10mg).
The solid was dissolved in CHCh and subjected to TLC analysis together with pure
friedelin [41] and epi-friedelinol [42].
102
CHAPTER EIGHT
ISOLATION OF COMPOUNDS FROM TYPHA CAPENSIS
Samples were obtained from the Muti-Market (Durban) and Pinetown. Samples were
verified by Mr. Praveen Poorun at the Herbarium, Department of Botany, UDW.
8.1 EXTRACTION OF ROOTS
The air-dried roots, which were chopped and crushed (300g), were first extracted with
hexane for 48 hours and this was followed by extraction with acetone for a further 48
hours. The solvents were removed under vacuum to yield a light yellow waxy residue
(lg) for the hexane extract and a brown friable solid for the acetone extract (l2,5g).
8.2 SEPARATION
8.2.1 Hexane extract
The extract on standing for several days produced a white crystalline solid. The residue
was washed repeatedly with hexane. The solid was isolated pure by filtration (6.8 mg).
The washings were combined and after removal of the hexane, were subjected to flash
chromatography.
The column was eluted consecutively with H: EA mixtures of95:5 (500 ml) and 9:1
(lOOOml) and the fractions collected in test tubes as shown in Table 8.1.

103
Table 8.1 Summary of fractions
FRACTION TEST TUBES
1 1-20
2 21-30
3 31-35
4 36-40
5 41-43
6 45-55
8.2.1.1 7-Hydroxy-3-benzylphthalide [48]
[Typhaphthalide 48]
Typhaphthalide [48] was obtained as pale white crystals as described in 8.2.1 (6.8 mg) ..
Mass spec: HRMS: [M+] at m/z 240.0786, C1sH\203 requires 240.0786
ElMS: m/z (reI. int.): 240 (53.2) [M+], 149 (lOO), 121 (5.4),91 (8.1)
[Plate MS-3, Scheme M1]
lHNMR:
l3C NMR:
COSY:
8[CDCi), 300MHz, 298K, plate H-11, Table A4]
8[CDCi), 75MHz, 298K, plate C-8, Table A4]
plate CO-I
104
HETCOR: plate HE-1
NOESY: plate NO-1
I.R.: plate 1-2 V max (cm-I): 3544,3437 (chelated OH, phenolic), 2922 (CH2,
CH3), 1714 (C = 0 stretching), 1624, 1607 (aromatic) 1471 (aromatic
C = C stretching),
UVactivity: blue (254nm) Optical Rotation: [a]D25 = -9.191 (conc.= 0.136)
Rf: 0.65 (H:EA 8:2 v/v)
Spray reagent: Dragendorff-[brown]
8.2.1.2 8-Hydroxy-3-[2-Cphenyl)ethenyll-3.4-dihydroisocoumarin [47]
[Typharin 47]
TLC analysis of fraction 3 (H : EA, 9 : 1, v/v) produced a single spot which appeared
purple after spraying with anisaldehyde / H2S04 spray reagent and developing at 1200 C.
The spot appeared an intense blue under UV light (366nrn). Typharin [47] was isolated
as a yellow solid, insufficient to yield an accurate melting point.
Mass spec.: ElMS: m/z (rei. int.): 266 (85.5) [M+], 248 (100), 230 (63.8), 219(40.9)
[Plate MS-4]
IHNMR:
l3C NMR:
8[CDCi), 300MHz, 298K, plate H-12, Table A5]
8[CDCi), 75Mhz, 298K, plate C-9, Table A5]

COSY:
HETCOR:
NOESY:
IR:
105
plate CO-2
plate HE-2
plate NO-2
plate 1-3 Vrnax (cm-I): 3440 (0 - H stretching), 3063 (CH2) 1690 (C = 0
stretching 1600, 1580, 1475 (C = C stretching), 1000 (C-OO-C
stretching), 980 (-CH = CH-, trans)
DV activity: light blue (254nm) Optical Rotation: [a]D25 = +3.571 (cone. = 0.07)
Rf: 0.49 (H:EA 9: I v/v]
Spray reagent: anisaldehyde-[light purple]
8.2.1.3 24a-Ethylcholest-5-ene-3l3-o1 [49)
m-Sitosterol 49)
The sterol [49) was obtained relatively pure as white needle-like crystals from fraction 6
(9.1 mg). Its structure was identified by comparison with an authentic specimen on an
analytical TLC plate, and by comparison of the spectral characteristics of the compound
obtained and the authentic sample.
M.P.
IHNMR:
13CNMR:
8[CDCi), 300MHz, 298K, plate H-13, Table A7]
8[CDCi), 75MHz, 298K, plate C-ll]

106
UV activity: none
Rf: 0.72 (H:EA 8:2 v/v)
Spray reagent: anisaldehyde-[blue]
8.2.2 Acetone Extract
A portion of the solid material obtained from the acetone extract (2g) was separated by
means of flash chromatography [Silica gel, Mesh 230-400]. Eluents of approximately 20
ml were collected in test tubes by eluting with B:EA:A mixtures of (6:3:2, 500ml) and
(6:3:3, 1000m1).
E1uents were monitored by TLC (B:EA:A) and combinations were made according to that
shown in Table 8.2.
Table 8.2 Summary of Fractions
FRACTION NUMBER TEST TUBE
1 1-23
2 25-30
3 31-35
4 37-40
5 41-60
6 63-76

107
8.2.2.1 Mixture of afzelechin nOJ and epiafzelechin [23J
TLC analysis of fraction 2 (B:A 8:6 v/v) produced one spot with Rf 0,43. The fraction
was a mixture of afzelechin [10] and epiafzelecin [23] (18.3 mg). Acetylation of the
mixture allowed a greater Rf range thus allowing the separation of the two compounds as
their acetates. PLC separation of the acetylated mixture produced two bands at Rf 0.64
and 0.55.
8.2.2.2 C2R3S)-2,3-trans-Flavan-3,4',5,7-tetraacetate [54]
[Afzelechin tetraacetate 54]
The band with Rf 0.64 gave afzelechin tetraacetate [54] as a brown non-crystalline solid
(3mg).
IH NMR: o[CDCh, 300MHz, 298K, plate H-16, Table A2]
Mass Spec.: [Plate MS-5, Scheme M2]
Spray reagent: anisaldehyde-[brown]
8.2.2.3 C2R,3R)-2,3-cis-Flavan-3,4',5,7-tetraacetate [55]
[Epiafzelechin tetraacetate 55]
Epiafzelechin tetraacetate [55] was also obtained as a brown, amorphous solid from the
band with RfO,55 (ca. 2mg).
IH NMR: o[CDCh, 300MHz, 298K, plate H-17, Table A2]
Mass Spec.: [Plate MS-5, Scheme M2]

108
were made to separate the isomers in their free phenolic form. Like the previous
isomeric pair, the mixture was acetylated and subject to PLC separation
producing two bands with Rf 0.49 and 0.42 (B:A 9: 1 v/v).
8.2.2.5 (2RJS)-2J-trans-Flavan-3J',4',5,7-pentaacetate [56]
[Catechin pentaacetate 56]
The band with Rf 0.49 yielded catechin pentaacetate [56] (15mg).
lHNMR:
l3CNMR:
8[CDCh, 300MHz, 298K, plate H-18, Table A3]
8[CDCh, 75MHz, 298K, plate C-8, Table A14]
spray reagent: anisaldehyde-[brown]
8.2.2.6 (2RJR)-2,3-cis-Flavan-3,3',4',5,7-pentaacetate [46]
[Epicatechin pentaacetate 46]
The second band (Rf 0.42), produced epicatechin pentaacetate [46] as a light brown, non
crystalline solid (22mg).
IHNMR:
l3C NMR:
8[CDCh, 300MHz, 298K, plate H-7, Table A3]
8[CDCh, 75MHz, 298K, plate C-7, Table All]
Spray reagent: anisaldehyde-[brown]

109
8.3 SPRAY REAGENTS
Two spray reagents were employed namely, anisaldehyde/H2S04 and Dragendorff
reagent. Reagents were prepared as described in section 6.1.5. Colours are discussed in
section 5.6.
8.4 BIOLOGICAL ACTIVITy85
A preliminary screening of the biological activity of the crude methanolic extract of T
capensis was carried out in an independent study. A brief description of each test is
given. A more detailed explanation of experimental technique, methodology and
experimental materials used is given in the appropriate reference.
8.4.1 Antibacterial activity
The disc diffusion test method in agar medium was used to test for antibacterial activity.
The following microorganisms were tested:
Staphylococcus aureus
Klebsiella pneumoniae
Escherichia coli
Pseudomonas aeroginusa
Citobacter freundii
Proteus mirabilis
Salmonella typhi
Shigella flexneri
Enterobacter aerogenes
Candida albicans

110
8.4.2 Antifungal activity
Spores of seven day cultures ofAspergillis niger and Penicillium sp. were sprayed on tic
plates which were spotted with the crude extract and run in an appropriate solvent system.
After a prescribed incubation period the plates were examined for zones of inhibition.
8.4.3 Cytotoxic activity
The brine shrimp bioassay was used to test for cytotoxic activity in the crude extract.
8.4.4 Determination of uterotonic activity
Female Dunkin Hartley guinea pigs were used in this investigation. A specimen of the
uterine muscle tissue was examined for the above activity in a suitably prepared organ
bath in the presence of a muscle stimulant; in this case, acetylcholine.

PARTD
APPENDIX
INDEX-I" NMR
PLATE COMPOUND PAGE
H-l Friedelin [41] 112
H-2 epi-Friedelinol [42] 113
H-3 Lupeol [43] 114
H-4 01eanolic acid [44] 115
H-5 Stigmasterol [45] 116
H-6 Epicatechin [4] 117
H-7 Epicatechin pentaacetate [46] 118
H-8 Glucose [64] 119
H-9 Sucrose [65] 120
H-lO EF-1 mixture of friedelin and epi-friedelinol 121
H-ll Typhaphthalide [48] 122
H-12 Typharin [47] 123
H-13 ~-Sitosterol [49] 124
H-14 Afzelechin [10] /Epiafzelechin [23] mixture 125
H-15 Catechin [11] / Epicatechin [4] mixture 126
H-16 Afzelechin tetraacetate [54] 127
H-17· Epiafzelechin tetraacetate [55] 128
H-18 Catechin pentaacetate [56] 129
H-19 Fatty acid 130
III
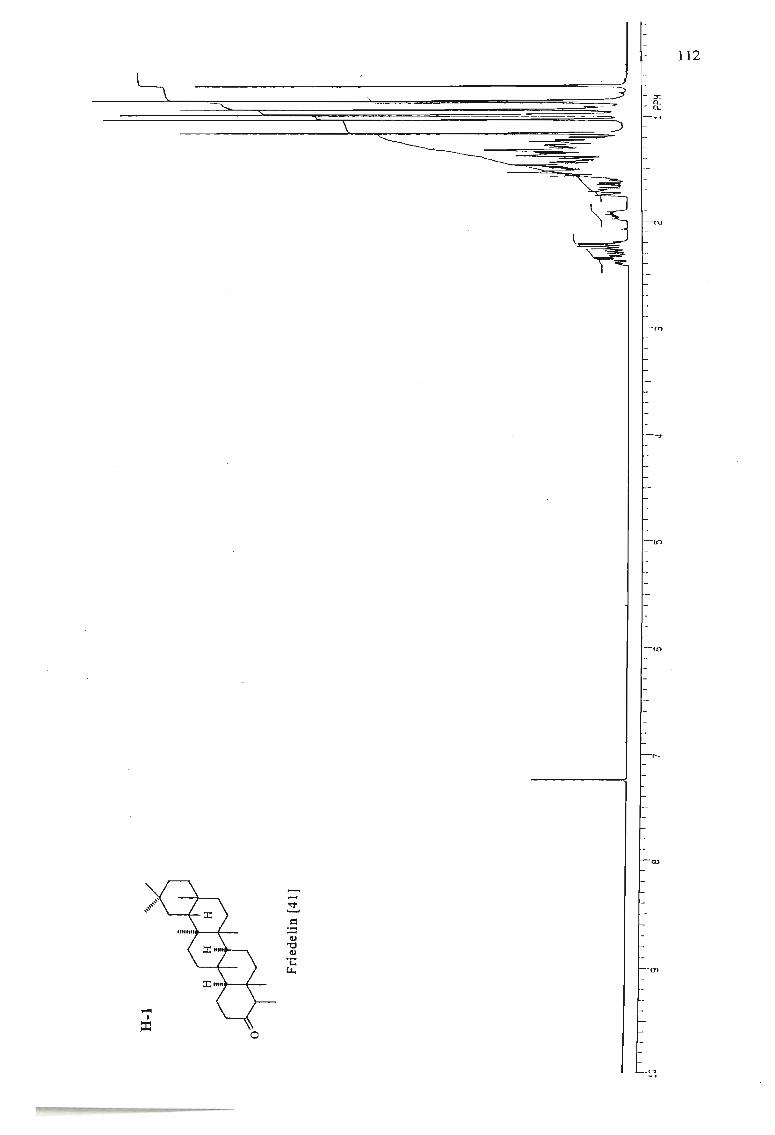
112
\~ '"
o
--In
QJ

113
----------------------------------
o::r:
---------

114
o
lD
)--- CD.......r<)
"'t'......0V0-::s
...J./
en
M 0r :I:=:
0~

~.~-="--...--~
~_.~----_._-
115
o
:::E0...0...
Ln
to
----~
CD
,.....,'T'T"--'
:'2u~
.~
m
0c(IS
~
0..".
0
0
I
:I::
-.
:::

.-r:)
--0)
l 116
:r:o
-..~

~----~
--~--------
C>
'"
117
::t0
5-{ > :I: ..-.0 v.......
~ ~f .S~
.J:C,)0 Q)-CI:$
::t ()
0 '50UJI,e
I::: 0::t

H-7
OAeI
AeO 0-..:::: OAe
'Q:)0 \
~ I \\\\\ ~
'"OAc "'OAc
Epicatechin pentaacetate [46]
~oI
9I , , , I , I I I I I
I
5I I ,
('
i I I
i, i • : • I I •
6i i I
~I I i i I
4I I
3, I I
2• • j i I I I i j I
~ PPM
-'-'00

119
Cl
::En.n.
- ......
ru
ID
lO
-r---
::c0
.--,"<:t\0........
::c QJVI
CD0 0N 0::c ..Eu 0
00I
t:r:lm
Cl.....

o::r:
::r:.0
GJlI)
oMU:::l
Cl)
120
C>
~CLCL
C\J
lD
CD

-N-
EF-I: Friede lin/epi-Friedelino I
H-IO
r I I I I I I i i i I I I i i I i i i I I I I I I I I i i i I I i i i i i i i i i i i i i i i iA k ~ 1'1 _
H-3 of epi-Friedelinol
1 ~----------"-...._-------------

122
\
ID
.......\
00~.......~
:-g
c:c
cd..s::.......s::
::r: 0-
.... cd
.... 0 ..s::I
0-
tI:>.
f-<m
o......

123
~
0...CL
l,\
LD
to
MI
0::
E~aJI
17EL6·0~- ----IMo... ,

~-
tLL
L
;---...r,.
LI,-;
I"~ -~In~.
~~ i-
,L
'--~. to
ri-
124
:z::o
J;-LL
t-r-.__ L
o
r.-L
:--L
~-""
tLI
r-t-

:r::0
.5
..c::(J
~0
~.~ ,-...0.. 0
~ ~c: ....:r:: .- .~0 ~ E
"':t
~'-'
.... 0
0
I
:r::~
::I:~
125
o

126
o
10I
=
:co
:co
o:c
:co
.5
..c::uI1J.....~--._ I1J
0.'"'wZ--- ~c .-:.a Eu'-"I1J.....~
U m
o~

H-16
AeO O~OAe
y:xo \~ I \\\\\ ~
OAe
OAc
Afzelechin tetraacetate [54]
-If\ .....,
-r I, I I I I I I i i I i i ill I i i I I i i I I j I j , i I i i i i i I i i i I i i i i I I i i i I i i i i I i i i i i i i I i I i j I I I i i i i I i i I i I i i i i I i I t i I I i I i I i i I i I ....10 9 8 7 6 .I) 4 3 2 1 PPM 0 ~

H-17
Aea . o~OAe
'900 \. ~ I \\\\\ 0
""".. OAcOAe
Epiafzeleehin tetraaeetate [55]
, .. ,V llt r lA' P '.• • '" ,... , ,.: .,~~'-- .... 1 t ,.. ' •• ~L, ,. LJ.Ip. J' I. - I I V I ~IV_ Id Si". "ta,",,' , .... ~ If , .. ~~ ~I I I i I I I I 1 i I i i I i I i j I i I I ( 1 I 1 i i i I I i i I i I i i I i I i i I I I i i i i I i i I I I i i i I I i I i i I I i i i I i I i i I i i i i I i i I i I I i i I I i i i i I i i i I I
10 9 8 7 6 5 4 3 2 1 PPM 0.....N00

Catechin pentaacetate [56]
...,........,.C\J
.....I
H-18
AeO
OAc
LOM"""u
OAc
I -r I I I i i i i I i i i i I i i i I I i I i i
7.25 7.20 7.15 7. la PP14
N'0
rr
/ NW..........,-J-"1
-.. L_--.Jl.&-=::::~~ IVI
... , 'Ul... _
....
In
~ CT)o------.... ,....,....~
a:l....a:l....
!\

:r.U- ,'-
r--'
-,'1
--.--
130
~u~
0'1
~.-4I
:I: ~
-DJ

PLATE
INDEX - nC NMR
COMPOUND PAGE
131
C-l Friedelin [41J 132
C-2 epi-Friedelinol [42] 133
C-3 Lupeol [43] 134
C-4 Oleanolic acid [44] 135
C-5 Stigmasterol [45] 136
C-6 Epicatechin [4] 137
C-7 Epicatechin pentaacetate [46] 138
C-8 Typhaphthalide [48] 139
C-9 Typharin [47] 140
C-1O P-Sitosterol [49J 141
C-ll Catechin pentaacetate [56J 142
C-12 Afzelechin [10] / Epiafzelechin [23] mixture 143
C-13 Catechin [11] / Epicatechin [4] mixture 144
INDEX - ADEPT
iL&
PLATE
AD-l
AD-2
COMPOUND
Typhaphthalide [48]
Typharin [47]
145
146

o
.......,-
<:>to
-0cv
<:>o~.
0=>
'"(\)
132

o:J:
_ T.
U.CL
<;>
'"
133

o:I:
-ooC.::l
.....1
134
::L0..0..
o
olD

C-4
HO
Oleanolic Acid [44]
I r-T! I I I I I I I j i i I I i i I i I i I i i I i i I i I I I i I I i i i i I i I I I I I i i i I i I i I I i ,", i I i i i I I I I i i I I I I I I I I i i I i i i I I i I i I 11 I i I I I i I I I i i i I I I i I i I220 200 180 160 140 120 100 80 60 40 20 PPM 0
.....VJVI

:I:o
_0c>cv
136

<:>
'"
<:><0
C>CD
C>o-
:I:0
5-{ > C>::I: .......
e:l0 ~'"-'
" ~
" -- .5" :;-.c(,)0....tU
:I: (,)
0 'e-0
u.J
=C\J
'CI
U 0:I:
=C\J
-'"
137

C-7
OAc
AeO '7 0 6~OAc'('rV"f\\\ h~""/
OAe 'OAc
Epieatechin pentaacetate [46]
ill-IT I i I I I I I I I • I i I , j I I I I I I I , I I j l I I
60 40 20 pp~
I I II I
BDI I I I II I j ~ i i i I i I
100
I Jl LI' 1 .1.- ,...I j I i j t i I I I I I
140 120
: I I i I I I I l 11 I I i I I t I I I I i i I J i i i! I I' i I I I ',::0 200 ieo 160
_. H •• , ••• , >' _ J~ .. .J. JJ~-:-,.....,. ' «" 1~ •
.....t.;J00

139
aLD
oo-<>ru.......
0LD-
......,00"':1"........(I)
-0
a
.-cr:>
(;
.......
...c::r: .....
...cIX> 0 0..
ICl:!
U...c0..>-.f-
a0ru
aruru

140
C>
::::E0...0...
C>C\.l
olD
oCD
C>to.......
.........
/;r-.:!.s::
"C C>ro CD
..s:: ......0..
0 ;>..r--
::r:Q'I
0 0I 0
U C\.l
C>C\.lC\.l

t-L..;
r
141
~o
rl-f--
~...-gf- ~.
L..I
I
[ir
.fL
.0Co>cv
_ C>n._",

-.4No20 PPM4060
I80
I100
I120
I140lEO180200220
C-llOAe
aOA'AeO 0 \\",,1 :-:?
I~
OAe
OAe
Catechin pentaacetate [56]
, .I I I
I i I i i I I I I I i I i i i I III i I I I I I I I i I I I , I I I I , I II I I I , I I I I I I i I I I i l i i I I I , I I I I I I I I I i I 1 i I I I I J I • , , ' •••• , , • i i ' . i i .. I I I i I I i i . , I

C-12
HO
OH
OH
AfzelechinIEpiafzelechin(mixture)
I I I I I I I i i i I i I i i I i I i I I i i i i I , I i i i I i i i , i i i I ( i , i I I t I i i , i i i i I i i i I I i i I i ( i i i i I i I i I I i 1 i i l i i t i 0, i i i i I i i I i I i , i I I ' i I I I I I I I I220 200 180 160 140 120 100 80 60 40 20 PFM 0
."w

C-13
OH
HO
OH
OH
Catechin/Epicatechin(mixture)
160 140I
120 100 eo 60 40 ........

145
oCD
oill
:z:0..0..
oru
r-
-f-
~f-
- -
I-
-
-...
, -
'-
- f-
....
t--
-I-
-
f-
....
c::r:f.J ---' ~
l-..
--' ._--
:I: __
CJ
------
-
-
-
ru:r:CJ
(T)
:I:
CJ

146
_ .... 1
:::L0...n-oru
C>to
._0
~~
~
fr---"<t"~
c::.....~
t':S..s::::
J0.
0 >. C>~ ru
...-l
N ::cI 0Cl< J
(T) ru
~::l: :r:U U 0'.~t

PLATE
COSY
CO-l
CO-2
HETCOR
HE-l
HE-2
NOESY
NO-l
NO-2
COMPOUND
Typhaphthalide
Typharin
Typhaphthalide
Typharin
Typhaphthalide
Typharin
INDEX - 2D - NMR
PAGE
148
149
150
151
152
153
147

OH
Typhaphthalide [48]
CO-l
...-0-03::
I -;j
-i-j
ID I w~
-.j:>.00
I3.5 3.0
"&\
El
g
m.,·s··I
6.0 5.5 5.0 4.5 4.0
F2 (PPM)
c.s'
7.5 7.0 6.5
J
j
I-oa
· .... · I-'Li ... ~ m . • Ji £l . j~~~~~. - . ----;
SlE!.'" =:"....:;~~~~~=====~==-",..J [I
~ ~;:=:;=-~=::::::::~......jl
~. ~l
~ 11U'l
3

,..-,t'-"T'--'
s::os::«l
..c0-
0;>-,
f-<N :r::I
0 0
U
149
rrTTTTnTITlTI I I , I I I' , , , I 1 I I I I I I I I T' 1 I I 11 I I I I I I~TITTTTTTlTT'TTTTTT1Trrnl'
7 6 5 4 3 2 1 PPM
,'1.' (T)
D ::E0-
t> 0-
~""'"ru.. 1.L.
D •
n"
to
m El
cifItff mmr
~t--
il €fIf-e
r

.......00~'--'(U
:9(IS
..r::.....
..r::0..
::r: (IS
.-1 ..c::, 0 0..~ ;>,
et: f-o
150
l-nTTj"TTTTT'TTTf" I I IA 1 6
<.:>(0
rTTlIrI I I I3 rPH
-
-
'-'111
_o;~.
<->I..:.')
., ~ I
._-c::')('.1"
.,--<.,.,
I'· - ---. ·.-r-·-------......,----.....-----r----y-----r-.·-·.· .--

o
::r:o
151
-
oto
------- ------- - . --- ------- -
~_._------
"- -L. C)
c:>- _.
-----~-----
-
---- .... _. c:>
~
-..------ -
I T I

~ ~ ~f1 ~(ppmJ{
NO-!
~(I0
0
) 3. 5~I
~
4.0-1
r:l(),.
4.5-1
··tt
OH v
./Typhaphth .
1 J
ahde [48]
5.0
~ 1
(1'
5.5-.:1
0
efJ°
i ~
ocf
6.0
d0
~~
8.0-J 0
VIN
3.06.0 5.5 5.0
F2 (ppm)6.57.0
: /~'J)
• t
7.5
o
lj I 11 1 I ~~._" I' , ! I
4.5 4.0 3.58.0
6.5
7.0
7.5

151
<::I ,.......I/) E
0.0.
I/)Nu..
IJ)
Cl
<D
I/)
<D
I/)
<::I
IJ)
. I/)
- <::I
I I
00 ~
I I I I I II I I II I I I II/)
I I I
I/) Cl
I I J I I I
I/) <::II/) Cl
lO lO
E Cl
I/)o:t I/)
0.o:t.-t 0. f') f')
u. '-'
NIo
Z
o
:co

PLATE
1-1
1-2
1-3
PLATE
INDEX - INFRARED (lR)
COMPOUND
Friedelin [44]
Typhaphthalide [48]
Typharin [47]
INDEX - MASS SPECTROMETRY (MS)
COMPOUND
PAGE
155
156
157
154
MS-l
MS-2
MS-3
MS-4
MS-5
Friedelin [41] 158
epi-Friedelinol [42] 159
Typhaphthalide [48] 160
Typharin [47] 162
Afzelechin tetraacetate [54] / Epiafzelechin tetraacetate [55] 163

1-1
-VlVl
·1393.94
~18.79
2359.22
-----:--._-_._.__ ...---_.. -_ ..__ ._.._---_ ..-._._-_._..._---_....__.__..._-_._--_ .....__._---_._----,. 11
I,!I
2932.04
Friedelin [41]
o.................~/
7B
76
72
70
74
68
66
64
62
60 -t $ : , , i ' : $ , i ' , , , i ' , , , ; ' : , i ' , : i ' , : i ' : , i ' , , i ' , : i ' , : i ' » .. 14(0) 3500 3c()() 2500 2(0) 1BOO 1600 1400 1200 1000 BOO 600 I
Wavenumbers (cm-i) .-J-----_.~_.__ ._~.- __._--_._-_._..-- --_.._.-.' --_.__._.._---------- .._----_ ..-.__.__._--_.._..- ,------- ._._,-_ - _. -- .._---_. ---

.J
'-'VIc;
600800
---
1200 10001400
I1 i·'· \
Iri\,\.\l
IHl'::~~ I!I ~
, I' .!\IH.~. . ; 1'/'{:
I:~, i;;Ut • .1 ~
. \" 11
fA A ~~' f'n'~ i'\ j1~dI H~ ~ ~\ ~ rlYl 1I;~t\! vii 11/1/ 1it~\1i I
1f1
1 I \ I1
\ i \hl lJ \.! ii ~ \i f 11
f :1
/ 11 .' I: il'!!!' 1 I' ;I IIf ¥~ 1 IlH.'Jt yi..i l' I~ i:
I ~ ~/~ I I ~ . I ·
2000 1800 1600
"a~umbers (cm:.::..-........1L-)__
250030003500
1-2
~.~
\11626.67
/3436.89 \ \ ~
2922.33I
)1471.52 \ 1
3543.69
1607.27
/'1713.94
I
4000
M82
80
78
76
7472
7068
68
64_
62
60
58
56
54
52
50
48
46
44
4240
r.TransmIltance

.....Vl-:I
1689;6
856.3
2933.0
3063.5
Typharin [47]
OH 0
o
1
m1t
%Trans
'-rr' I I I I I I I I I I I I I I I i I I I I I I I I I I I I I I I I I I i I I I I j I I I I I I I I I I I'4000 3800 3600 3400 3200 3000 2800 2600 2400 2200 2000 1800 1600 1400 1200 1000 800 600
Wavenumbers (cm-1)
, 501 1-3
-1
45~,,1
4°1.;
35~
30]J
25 .,l-i."
20~"1-;i
15 -i~-;
10~
~51

163189 218
203 I /246
50 % 83
INT
67
50
109
149
135
o
231
Friedelin [41]
273
287341
350 400
426
631
j-Pl'j650
VIOQ

50 %
INT
MS-2
HO
epi-Friedelinol [42]
191205
217
233
259
247
275 288 301332
316344
413 428
446
r 1- ,- I-'-r' I I I I I I I I I200 220 240 260 280 300 320 340 500
.....v.'0

100
J80.i
eo
70
.~
:;«)
..50
:~ ''\C 11'~ ~-J;l
40-I
30
20
fO
•.03871...r
MS-3
OH
Typhaphthalide [48]
91.0664S,··83.03473
,...·.
100
121.02922
14&.~449,
179.034
.~ 1;'.05S!4
185.08Q88
220.08262
24~:~935;,'
210.0889
..-0\o

-;/
0~
\/ OH 0
CISH1203240.08
161
Q;H ItI 0
~ IOH 0
~ -2xCO
C~50 93.03
Scheme Ml: Fragmentation of Typhaphthalide

100 %
INT
MS-4248
5'
H 01 I1 I [I 266
7' I' 2'
OH 0230
Typharin [47]
219
191
202
165 III77 ~~- 1___
300 I I 0"-
I, 1.1.N
, 1.i111 I ,
r II I I I
60 80 140 240 300 320

MS-5
100 % OOAC 323A,o~l.& 281
OAc
OAc
298Afzelechin tetraacetate [54]
I 1340
256
OOAC. IA'O~~J" .&
::::-.. ""'OAc
OAc
I I I I I382
I IINT Epiafzelechin tetraacetate [55]
239
I107
139
67 I I I 11 , 167 --- I I I I !I I I I t I1,1 1209 -0\v.l
I II ' I' I 1 I i I' I 'I' I i I i 1'1 I I 1 I 1 I i I i I i I j Ill' I' I i I1I '1'1' I' I 1 I 1 I' I' I I I' I ' I f I ' I 11' I f I ' I 'I I I' I' I 'I' I I I' I I I' I I r'T'11 I ' I I I ' r
50 100 150 200 250 300 350 400 450 500 550 600 650

O-C- CH311
o
O-C-CH311
o
164
HO
C23H2209 442
~CH3C02Hm/z 382
~CH3COm/z 340
~CH3CO
m/z 298
~CH3CO
OH
"",,()I
OHm/z 256
Scheme M2: Fragmentation pattern of afzelechinlepiafzelechin tetraacetate

TABLE
INDEX - NMR DATA TABLES
PAGE
165
Al 13C NMR data of pentacyclic triterpenoids from A. natalitius 166
A2 1H NMR of afze1echin tetraacetate and epiafze1echin tetraacetate 167
A3 'H NMR of catechin pentaacetate and epicatechin pentaacetate 168
A4 1H NMR and 13C NMR of typhaphthalide 169
A5 IH NMR and 13C NMR oftypharin 170
A6 IH NMR of stigmasterol 171
A7 IH NMR of ~-sitosterol 171
A8 IH NMR of 1upeo1 172
A9 IH NMR of sucrose 172
AI0 1H NMR of oleanolic acid 173
All 13C NMR of epicatechin 173
A12 1H NMR of epicatechin 174
A13 I3C NMR of epicatechin pentaacetate 174
A14 I3C NMR ofcatechin pentaacetate 175

Table AI: BC NMR data of pentacyclic triterpenoids from A. natalitius
166
CARBON FRIEDELIN FRIEDELINOL LUPEOL OLEANOLIC STIGMASTEROLACID
1 22.3 15.7 38.7 38.4 37.3
2 41.5 35.0 27.4 27.5 31.7
3 213.2 72.7 78.9 79.0 71.8
4 58.2 49.17 38.8 38.7 42.3
5 42.1 37.1 55.3 55.2 140.8
6 41.3 41.7 18.3 18.3 121.77 18.2 17.5 34.2 32.6 31.98 53.1 53.2 40.8 39.3 31.99 37.4 37.8 50.4 47.6 50.210 59.4 61.3 37.1 37.1 36.511 35.6 35.3 20.9 23.0 21.112 30.5 30.6 25.1 122.6 39.713 39.7 39.7 38.0 143.6 42.314 38.3 38.3 42.8 41.6 56.915 32.4 32.3 27.4 27.7 24.416 36.0 36.1 35.5 23.4 28.917 30.0 30.0 43.0 46.5 56.118 42.8 42.8 48.2 41.0 12.119 35.3 35.5 47.9 45.9 19.420 28.2 28.2 150.9 30.7 40.521 32.7 32.8 29.8 33.8 21.122 39.2 39.3 40.0 32.4 138.323 6.8 11.6 28.0 28.1 129.424 14.6 16.4 15.4 15.6 51.225 17.9 18.2 16.1 15.3 31.926 20.2 20.1 15.9 17.1 19.027 18.6 18.7 14.5 25.9 21.228 32.1 32.1 18.0 182.4 25.429 35.0 31.8 109.3 33.1 12.330 31.8 35.2 19.3 23.6

Table A2: IH NMR (300 MHz. 298K. CDCI~) signals (ppm) of:
Afzelechin tetraacetate [54]
Epiafzelechin tetraacetate (55]
[Splitting patterns and J values (Hz) in parenthesis]
RING PROTON NO. [54] [55]
A 6 6.56{d, 2.4) 6.55 (d, 2.4)8 6.64 (d, 2.4) 6.65 (d, 2.1)
B 2',6' 7.33 (d, 8.4) 7.43 (d, 8.4)3',5' 7.07 (d, 8.7) 7.10Cd, 8.7)
C 2 5.15 (d, 6.0) 5.10 (br. s)3 5.26 (m) 5.38 (m)
4ax 2.63 (dd, 6.0, 16.9) 2.85(dd, 2.1, 20. f)4eq 2.81 (dd, 5.1, 16.8) 2.98 (dd, 5.0, 18.2)
OAc 2.25 (s) 2.26 (s)2.26 (s) 2.28 (s)2.27 (s) 2.29 (s)
1.96 (s, 3-0Ac) 1.89 (s, 3-0Ac)
167

Table A3: IH NMR (300 MHz, 298K, CDCh) signals (ppm) of:
Catechin pentaacetate [56]
Epicatechin pentaacetate [46]
[Splitting patterns and J values (Hz) in parenthesis]
RING PROTON r561 r461A 6 6.63 (d, 2.1) 6.65 (d, 2.1)
8 6.57 (d, 2.1) 6.55 (d, 2.1)
B 2' 7.22 (d, 2.1) 7.335' 7.18 (d, 8.4) 7.17 (d, 8.1)6' 7.15 (dd, 2.1,8.4) 7.26 (dd, 1.8,9.0)
C 2 5.12 (d, 6.3) 5.09 (br. s)3 5.23 (m) 5.36 (m)4ax 2.61 (dd, 6.6, 16.8) 2.74 (dd, 1.5, 17)4eq 2.84 (dd, 5.1, 16.8) 2.96 (dd, 4.5, 17)
OAc 2.26 (s) 2.28 (s)2.26 (s) 2.28 (s)2.25 (s) 2.26 (s)- -1.98 (s, 3-0Ac) 1.90 (s, 3-0Ac)
168

Table A4: IH NMR (300 Mbz, 298K, CDCh) and nC NMR (75 MHz) signals(ppm) of:
Typhaphthalide [48]
[Splitting patterns and J values (Hz) in parenthesis]
Proton and IHNMR 13CNMR
carbon no.1 171.93
3 5.68 (t, 6.5, 6.3) 82.594 6.87 (d, 8.22) 115.51
5 7.46 136.646 6.63 (d, 7.4) 113.687 7.71 (br. s, -OH) 156.498 - 111.09 - 149.38lOa 3.26 (dd, 6.7, 14) 40.69lOb 3.14 (dd, 6.2, 14) 134.76
1' -2',6' 1\ 129.673',5' 1\ 128.57"4' 1\ 127.27
* = interchangeable
1\ = unassignable due to overlap of signals
169

Table AS: IH NMR (300 Mbz, 298K, CDCh) and BC NMR (75 MHz) signals(ppm) of:
Typharin [47]
[Splitting patterns and J values (Hz) in parenthesis]
PROTON AND CARBON NO. lHNMR uCNMR
1 - 169.493 5.23 (q, 6.2, 14.3) 79.654 3.12 (m) 33.475 6.72 (d, 8.1) 118.056 7.42 (dd, 8.0, 8.1) 136.327 6.90 (d, 8.4) 116.468 10.97 (s, -OH) 162.269 - 109.3010 - 138.89
l' - 135.622',6' /\ 128.73'3',5' /\ 126.794' /\ 128.537' 6.78 (d, 16) 125.148' 6.30 (dd, 6.4, 16) 133.96
* = interchangeable
/\ = unassignable due to overlap of signals
170

Table A6: III NMR (300 MIIz, 2981(, CDCI~ signals (oom) of:
Stigmasterol [45]
[Splitting patterns and J values (Hz) in parenthesis]
PROTON STIGMASTEROL [45]
3 3.50 (m)6 5.35 (brs)18 0.66 (s)19 0.69 (s)21 0.99 (d, 6.7)22 5.00 (dd, 7.5 and 15.4)23 5.15 (dd, 11.5 and 15.4)24 2.21 (m)26 0.90 (d, 6.5)27 0.78 (d, 6.35)29 0.80 (t, 6.5)
Table A7: ID NMR (300 MUz, 2981{, CDCI~) signals (oom) of:
13-Sitosterol [49]
[Splitting patterns and J values (Hz) in parenthesis]
PROTON 13-SITOSTEROL [49]
3 3.50 (m)6 5.33 (d, 5.4)18 0.66 (s)19 0.82 (s)21 0.98 (d, 6.7)24 2.21 (m)26 0.90 (d, 6.5)27 0.78 (d, 6.35)29 0.80 (t, 6.6)
171

Table AS: ID NMR (300 MIIz, 29SK, CDCI~) signals (DDm) of:
Lupeol [43]
[Splitting patterns and J values (Hz) in parenthesis]
PROTON LUPEOL [43]
2 2.35 m)3 3.17 dd, 5.1 and 10.8)23 0.94 s24 0.73 s)25 0.80 (s26 1.00 s27 0.92 s28 0.76 s)29a 4.54 d,2.4)29b 4.66 d,2.4)30 1.65 (s)
Table A9: ID NMR (300 MHz, 29SK, »20) signals (Dpm) of:
Sucrose [65]
[.Splitting patterns. and J values (Hz) in parenthesis]
PROTON SUCROSE [65]
1 5.41 (d,3.9)2 3.55 (m)3 3.76 (t, 9.6)4 3.46 (t, 9.3)5 3.86 (m)6 3.82 (d, 2.1)l' 3.67 (brs)2' -3' 4.21 (d,8.7)4' 4.05 (t, 8.4)5' 3.90 (m)6' 3.82 (d, 2.1)
172

Table AIO: IH NMR (300 MHz, 298K, CDCh) signals (ppm) of:
Oleanolic Acid [44]
[Splitting patterns and J values (Hz) in parenthesis]
PROTON OLEANOLIC ACID [44]
2a 2.35 (m)2b 2.50 (m)3 3.21 (m)
23 0.94 (s)24 0.73 (s)25 0.80 (s)26 1.00 (s)27 0.92 (s)
Table All: nC NMR (75 MHz, 298K) signals (ppm) of:
Epicatechin [4]
CARBON NO. (-)-EPICATECHIN [4] LITERATURE
2 78.27 79.13 65.82 66.84 27.94 28.65 156.0 156.76 95.04 96.87 156.41 156.78 95.04 96.09 156.46 157.110 98.65 100.31' 131.09 131.82' 114.12 115.43' 144.14 145.04' 144.26 145.25' 114.35 116.46' 118.21 119.6
173

Table An: IH NMR (300 MHz, 298K, CDCh) signals (uum) of:
(-)-Epicatechin [4]
[Splitting patterns and J values (Hz) in parenthesis]
RING PROTON EPICATECHIN [4] LITERATURE4
A 6 5.94 (d, 2,1) 5.72 (d, 1,7)
8 6.04 (d, 2,1) 5.89 (d, 1,7)
B 2' 7.07 (d, 2,1) 6,90 (d, -)5' 6.81 (d, 8,1) 6.66 (d, 8,7)6' 6.86 (dd, 2, land 8,1) 6.66 (dd, 8,7 and-)
C 2 4.89 4.74 (d, -)3 4.23 (m) 4.01 (m)4ax 2.75 (dd, 3 and 16,8) 2.48 (dd, 3,3 and 16,3)4eq 2,89 (dd, 5 and 16,7) 2.79 (dd, 4,2 and 16,3)
Table AB: 13C NMR (75 MHz, 298K) signals (uum) of
Epicatechin pentaacetate [46]
CARBON NO. (-)-EPICATECHIN PENTACETATE LITERATURE3
r4612 76.70 76.73 66.67 66.74 26.04 26.05 149.74 149.86 108.78 108.87 149.69 149.88 108.08 108.09 154.98 155.010 109.62 109.71' 135.86 135.92' 122.06 122.13' 141.91 142.04' 142.03 142.15' 123.25 123.26' 124.39 124.4
*= exchangeable carbons
174

Table A14: 13C NMR (75 MHz, 298K) signals (ppm) of
(+)-Catechin pentaacetate [56]
CARBON NO. (+)-CATECHIN PENTAACETATE LITERATURE3
2 77.62 77.83 68.26 68.44 23.89 24.05 149.41 149.86 108.78 108.87 149.84 150.08 107.69 107.79 154.36 154.510 110.17 110.21' 136.14 136.22' 121.77 121.83' 142.07 142.24' 142.07 142.25' 123.71 123.76' 124.41 124.4
175

176
REFERENCES
1. Cannell, J.P. (Editor), Natural products isolation, Humana Press Inc., New Jersey,
(1998).
2. Roux, D.G., Ferreira, D., Hundt, H.K.L. and E. Malan, Applied Polymer
Symposium No 28, 335 - 353, (1975).
3. Agrawal, P.K. (Editor), Carbon-13-NMR ofFlavonoids, Elsevier, Amsterdam,
pp. 3 and 433, (1989).
4. Porter, L.J., The Flavonoids: Advances in Research since 1986 (Editor, Harbome,
lB.), Chapman and Hall, London, p.23, (1994).
5. The Flavonoids: Advances in Research (Editors, Harbome, lB. and Mabry T.J.),
Chapman and Hall, London, (1982).
6. Haslam, E., The Flavonoids (Editors, Harbome, J.B., Mabry, T.J. and Mabry H.),
Academic Press, New York, (1975).
7. Porter, L.J., The Flavonoids: Advances in Research since 1980 (Editor, Harbome,
J.B.), Chapman and Hall, London, pp. 21-62, (1988).
8. Marini-Bettolo, G.B., Ferrari, F., Monache, F.D. and A. Poce-Tuce, (1972),
Phytochemistry, 11,2333.
9. Drewes, S.E. and D.G. Roux (1966), J Chem. Soc. (C), 1644.
10. Hillis, W.E. and A. Carle,Aust. J Chem., (1960),13,390.
11. Hillis, W.E. and T. Inoue, Phytochemistry, (1967), 6, 59
12. Poce-Tuce, A., Monasche, F.D. and G.B. Marini-Bettolo,Ann. 1stSanita, (1969),
5,555.
13. Marletti, F., Monarche, F.D., Marini-Bettolo, G.B. and LL.D' Albuquerque,
Phytochemistry, (1976),15,443.
14. Friedrich, H. and R.Engelstowe, Planta Med, (1978),33,251.
15. Ohigashi, H., Minami, S., Fukui, H., Koshimizu, K., Mizutani, F., Sugiara, A. and
T. Tomana, Agric. BioI. Chem., (1982), 46, 2555.
16. Hsu, F., Nonaka, G. and L Nishioka, Chem. Pharm. Bull., (1985),33,3142.

177
17. Swinny, E.E., The Structure and synthesis ofnatural products isolatedfrom
Cassia abbreviata, Distemonanthus benthamianis and Combretum apiculatum,
Doctota1 Thesis, UDW, (1995).
18. King, F.E., C1ark-Lewis, J.W. and W.F.Forbes, J Chem. Soc., (1955), 2948.
19. Waterrnan, P.G. and D.F. Fau1kner, Planta Med., (1979), 37, 178.
20. Pati1, AD. and V.H. Deshpande, Ind. J Chem., (1962), 21B, 626.
21. Shen, Z., Fa1shaw, c.P., Has1am, E. and MJ. Beg1ey, J Chem. Soc. Chem.
Commun., (1985),1135.
22. Hikino, H., Shimoyama, N., Kasahara, Y., Takahashi, M. and C. Konao,
Heterocycles, (1982),19, 1381.
23. Freudenberg, K., Die Chemie der Naturlichen Gerbstoffe, Springer-Verlag,
Berlin, (1920).
24. Runge, F.F., Wiss. Phytochem., (1821), 245.
25. Swinny, E.E., The Structure and Synthesis ofMetabolites from Virgilia oroboides
and Chlorophora excelsa, Masters Dissertation, UDW, (1989).
26. Mabry, T.J., Markham, KR. and M.B.Thomas, The Systematic Identification of
Flavonoids, Springer-Verlag, New York, p. 260, (1970).
27. Seikel, M.K and T.J. Mabry, Tetrahedron Letters, (1965), 16, 1105.
28. Seshadri, T.R., Phytochemistry, (1964), 11, 881.
29. C1ark-Lewis, J.W., Jackman, L.M. and T. MeL. Spotswood,Aust. J Chem.,
(1964),17,632.
30. C1ark-Lewis, J.W., Jemison, R.W. and V. Naif, Aust. J Chem., (1968), 21, 3015.
31. Schneider, H.J. and V. Hoppen,J Org. Chem., 43, 3866.
32. Koukal, J. and E. Conn, J Bio!. Chem., (1961), 236, 2692.
33. Russell, D.W., J Bio!. Chem., (1971),246,3870.
34. Rhodes, M.J.C. and L.S.C. Wooltorton, Phytochemistry, (1973), 12,2381.
35. Stafford, H.A and H.H Lester. (1985), Plant Physio!., 78, 791.
36. Kristiansen, KN. (1986), Carlsberg Res. Commun., 51, 51.
37. Newman AA, Chemistry ofTerpenes and Terpenoids, Academic Press, London,
(1972).

178
38. de Mayo, P., The Chemistry ofNatural Products-The higher terpenoids,
lnterscience Publishers, N. York, (1959).
39. Mahato, S.B. and AP. Kundu, Phytochemistry, (1994), 37,1517.
40. Mahato, S.B., Nandy AK. and G. Roy, Phytochemistry, (1992),31,2199.
41. Rogers, e.B., Phytochem., (1988), 27, 3217
42. Ling, RC., King M.L., Chen e.F., Hsu K.P., Su M.H. and M.H. Un, Chung-hua
1 Hsuch Tsa Chih, (1982), 29, 308, Chem. Abs., (1982), 97, 120120p.
43. Armanini, D., Karbowiak 1., Krozowski Z., Finder 1.W. and W.R. Adam,
Endocrinology, (1982),111, 1683.
44. Rask-Maden, 1., Bukhave K. Madsen P.E.R and e. Bekker, Eur. J Clin. Invest.,
(1983), 13, 351.
45. Suetina, LV., Bio!. Nauki., (1982), 47.
46. lnoue, H., Mori T., Suibata S. and Y. Koshihara, J Pharm. Pharmaco!., (1988),
40,272.
47. Ganes, A., Sharma R.M. and BJ. RayGhatak, Indian J Exp. Bioi., (1987), 25,
826.
48. Ma, X., Zhao Y., Yin L, Han D. and C. li, Yaoxue Xuebao, (1982),17,93.
49. Mooreville, M., Fritz R W. and S.G. Mulholland, J Uro!., (1983),130,607.
50. Bian, R, Xie Q. and H. Guo, Zhejiang Yike Daxue Xuebao, (1982), 11, 273.
51. Phoeland, B.L., Carte B.K., Francis T.A, Hayland 1.1., Allaudeen H.S. and N.
Troupe, J Nat. Prod, (1987), 50, 706.
52. Filczewski, M., Kosmala M. and K. Oledska, Po!' J Pharmaco!., (1988), 40, 233.
53. Wehrli, F.W. and T. Nishid, Progress in the Chemistry ojOrganic Natural
Products, Vol. 36, p.l, Springer, N. York, (1979).
54. Agrawal, P.K. and D.C. lain, Progress in NMR Spectroscopy, (1992), 24, 1.
55. Akisha, T., Yamamoto, K., Tammura, T., Kamura, Y., lida, T., Nambara, T. and
F.e. Chang, Chem. Pharm. Bull., (1992), 40, 789.
56. Patra, A, and S.K. Chaudhuri, Magn. Reson. Chem., (1987),25,95.
57. Patra, A., Mukhopadhyay, A.K. and AK. Mitra, Org. Magn. Reson., (1981),17,
166.

179
58. Breitmaier, E. and W. Voelter, Carbon-J3 NMR Spectroscopy, (3rd ed.), VeH.,
Germany, (1990)
59. Gershenzon, J., Joint Meeting-Book ofAbstracts, L04, Amsterdam, (1999).
60. Knoss, W., Joint Meeting-Book ofAbstracts, L32, Amsterdam, (1999).
61. Knoss, W., Reuter B. and J. Zapp, Biochem J, (1997),326,449.
62. Dewick, P.M., Medicinal Natural Products-A biosynthetic Approach, 1. Wiley
and Sons, Chichester, (1997).
63. Pooley, E., The Complete Field Guide to Trees ofNatal, Natal Flora Publications
Trust, Durban, (1993).
64. Ferraira, F.H., The Trees and Shrubs ofSouth Africa, Pretoria, (1952).
65. Glasby, 1. S., Encyclopaedia ofthe Terpenoids, Wi1ey-Interscience, Chichester,
(1982).
66. Hardwood, L.M. and C.J. Moody, Experimental Organic Chemistry-Principles
and Practice, Blackwell Scientific Publications, London, (1989).
67. Naidoo, N., Extractives from the Meliaceae and the Annonaceae, Masters
Dissertation, University of Natal-Durban, (1997).
68. Cherest, M. and H. Felkin, Tetrahedron Letters, (1968), 2205.
69. Cherest, M., Felkin, H. and C. Frajerman, Tetrahedron Letters, (1971), 379.
70. Cherest, M. and H. Felkin, Tetrahedron Letters, (1971), 383.
71. van Wyk, B.E., van Oudtshoom B. and N. Gericke, Medicinal Plants of80 Africa,
Briza Publications, Pretoria, (1997).
72. Watt, J.M. and M.G. Breyer-Brandwijk, The Medicinal and Poisonous Plants of
Southern and Eastern Africa, (2nd edition), Livingstone, London, (1962).
73. Hutchings, A., Zulu Medicinal Plants, Natal University Press, Pietermaritzburg,
(1996).
74. Pujol, J., Naturafrica-The Herbalist Handbook, Jean Pujol Natural Healers'
Foundation, Durban, (1990).
75. Dictionary ofNatural Products on CD-ROM, release 9:1, Chapman and Hall,
London, (2000).
76. Dictionary of Natural Products on CD-ROM, release 4:2, Chapman and Hall,
London, (1996).

180
77. Breitmaier, E., Structure Elucidation by NMR in Organic Chemistry-A Practical
Guide, Wiley and Sons, England, (1993).
78. Mizuno, M., Yoshida S., !inuma M., Tanaka T., Lang F.A. and K. Goto, Chem.
Pharm. Bull., (1990), 38, 2075.
79. Yoshikawa, M., Uchida E., Chatani N., Kobayashi H., Naitoh Y, Okuno Y.,
Matsuda H., Yamahara 1. and N. Murakami, Chem. Pharm. Bull., (1992), 40,
3352.
80. Takeuchi, N., Ochi K., Murase M. and S. Tobinaga., Chem. Pharm. Bull., (1983),
31,4360.
81. Asakawa, Y. Takikawa K., Toyota M. and T. Takemoto, Phytochem., (1982), 21,
2481.
82. Asakawa, Y., Takikawa K. and M. Tori, Phytochem., (1987), 26, 1023.
83. Asakawa, Y., Takikawa K., Tori M. and E.O. Campbell, Phytochem., (1986), 25,
2543.
84. Yoshikawa, M., Harada E., Vagi N., Okuno Y., Muraoka 0., Aoyama H. and N.
Murakami, Chem. Pharm. Bull., (1994),42, 721.
85. Krishinchand, N. and D. Naidoo, The preliminary screening ofthe biological
activities ofTypha capensis, Dissertation-BSc. Pharm., UDW, (1999).
86. Walton, N.l. and D.E. Brown, Chemicals from Plants-Perspectives on Plant
Secondary Products, Imperial College Press, London, (1999).
87. King, F.E. and W. Bottomley, Chem. And Ind., (1953), 1368.