by antoine cordray
TRANSCRIPT

PHOSPHORUS REMOVAL CHARACTERISTICS ON BIOGENIC FERROUS
IRON OXIDES
By
ANTOINE CORDRAY
A thesis submitted in partial fulfillment of the requirements for the degree of
MASTER OF SCIENCE IN ENVIRONMENTAL ENGINEERING
WASHINGTON STATE UNIVERSITY Department of Civil and Environmental Engineering
DECEMBER 2008
ii
To the faculty of Washington State University:
The members of the Committee appointed to examine the thesis of ANTOINE CORDRAY find it satisfactory and recommend that it be accepted. ______________________________
______________________________
______________________________
Chair

iii
ACKNOWLEDGMENTS
I would like to thank my advisor, Dr. Jeremy Rentz, whose expertise, availability, and
advice in many different fields made my graduate program a rich experience. I would also like to
thank the members of my committee, Dr. Jeffrey Ullman and Dr. David Yonge. They took time
to share their knowledge and contribute to my work. Finally, I would like thank Dr. David
McLean and Gisela Bouzon who both made this international experience possible by working on
a partnership between Washington State University and EPF “Ecole d’ingénieurs”.
I acknowledge Haley Falconer whose help was invaluable throughout the summer. She
has been largely involved in the sampling and experimentation efforts. She, and my other office
mate Katherine Schaffnit also helped me improve my English skills for the thesis writing. I am
grateful to two undergraduate students, Cameron Turtle and Andrew McDonald, who worked
during the summer in our laboratory and participated actively in my research experiments.
Finally, I would like to thank my family members, Michèle Sembeille, Jean-Pierre
Cordray, Agathe Cordray, Jean-Baptiste Cordray, Maude Decombat, Philippe Corre, Axel and
Romane Corre, and Corinne Bonnet for their long distance support during this year and a half
and for the love they have given me. I would like to thank my two friends and roommates
Guillaume Paternostre and Michael Miraglio, both graduate students, for the mutual help,
motivation, and good times we spent together. I am grateful to Marine Fagot, who since high
school has been a close friend and has always supported me.

iv
PHOSPHORUS REMOVAL CHARACTERISTICS ON BIOGENIC FERROUS
IRON OXIDES
Abstract
By Antoine Cordray, Masters. Washington State University
December 2008
Chair: Jeremy A. Rentz Phosphorus is a main aquatic pollutant, which has led to an evolution in treatment
technologies. However, it remains a cause of water body degradation. Filters using iron rich or
iron oxide containing substrates appear to be an effective method to remove phosphorus from
water. A recent study revealed that biogenic iron oxides used within a filter are an improved and
more cost effective method (Rentz et al., 2008). Phosphorus resources are depleted, and recovery
methods are studied for phosphorus reuse in both agriculture and industry. In order to investigate
the characteristics of biogenic iron oxides generated by Leptothrix ochracea and their behavior
on phosphorus adsorption and release, we used batch equilibrium experiment methods. Biogenic
iron oxides adsorbed 19.02 mg P/g solids on average against 6.27 mg P/g solids for synthetic or
chemical substrates. Variations in pH dramatically enhanced phosphorus adsorption. Fresh
samples showed an increase in phosphorus by 315% and 307% between low and high pH. Older
samples increased by only 50% and 78%. Results suggest that adsorption of phosphorus to
biogenic iron oxides is made by weak electronic linkage. Hydroxide sodium was the best
chemical to break down these linkages and release phosphorus. Sample released from 159.3%
and 295.3% of the initially adsorbed phosphorus. DI water showed the second best phosphorus

v
release potential of 40.60% averaged over the four samples. The KCl solution had an average
potential of 30.37% and the saline solution 20.23%. The origin of the released phosphorus is in-
situ phosphorus adsorption or cell disruption. Release potential for fresh samples was greater
than old samples only using sodium hydroxide. High sorption capacity, adsorption enhancement
by lowering the pH, and great phosphorus release capacity should be incorporated to the next
step of this project of phosphorus filtration.

vi
TABLE OF CONTENTS
ACKNOWLEDGMENTS ........................................................................................................................ iii
ABSTRACT ............................................................................................................................................... iv
TABLE OF CONTENTS ......................................................................................................................... vi
LIST OF TABLES ................................................................................................................................... vii
LIST OF FIGURES ................................................................................................................................ viii
CHAPTER ONE ......................................................................................................................................... 1
CHAPTER TWO ........................................................................................................................................ 4
CHAPTER THREE .................................................................................................................................... 8
CHAPTER FOUR .................................................................................................................................... 25
CHAPTER FIVE ...................................................................................................................................... 27
APPENDIX A ........................................................................................................................................... 28
APPENDIX B ........................................................................................................................................... 32
1. Phosphorus uses .................................................................................................................... 33 2. Phosphorus removal .............................................................................................................. 35 ● Chemical precipitation ................................................................................................... 36 ● Enhanced Phosphorus Biological Removal (EPBR) ...................................................... 38 ● Limitations ..................................................................................................................... 38
3. Phosphorus Recovery ............................................................................................................ 39 4. Iron Cycle (Oxidation/Reduction) ......................................................................................... 39 ● Iron oxidation ................................................................................................................. 40 ● Iron reduction ................................................................................................................. 41 ● Relation between iron oxidizing and iron reducing bacteria .......................................... 43
5. FeOB habitats and diversity .................................................................................................. 45 6. Focus on Gallionella .............................................................................................................. 47 7. Focus on Leptothrix .............................................................................................................. 47
APPENDIX C ........................................................................................................................................... 50
A. Scope and Application: ...................................................................................................... 52 B. Objectives: ......................................................................................................................... 52 C. Field Sampling & Data Collection:.................................................................................... 52 D. Laboratory Data Collection ................................................................................................ 56 E. Personnel Qualifications .................................................................................................... 64 F. Quality Control .................................................................................................................. 65 G. Additional Documents: Fe-Oxide (FOX) Record Sheet ................................................... 67
BIBLIOGRAPHY .................................................................................................................................... 69

vii
LIST OF TABLES
Table 1. Chemical and physical characteristics of biogenic iron oxides ..................................... 10
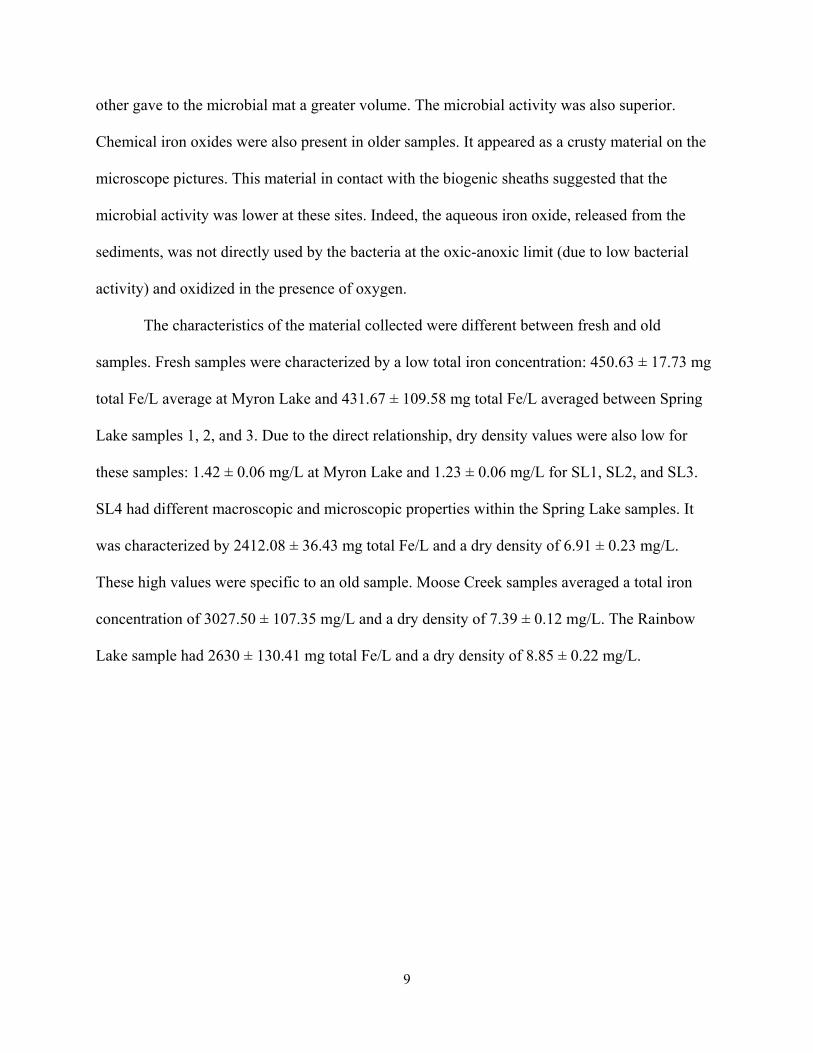
Table 2. Isotherm coefficients for biogenic iron oxide/phosphorus systems. .............................. 16
Table 3. Phosphorus removal and recovery technologies. Adapted from Morse et al., 1998. ..... 37
Table 4. Review of habitat characteristics requirements for iron oxidizing bacteria growth. ..... 46

viii
LIST OF FIGURES
Figure 1. Iron oxide sheaths characteristic of Leptothrix ochracea that dominated the four sampling sites ................................................................................................................................ 10 Figure 2. Iron oxide sheaths of Leptothrix ochracea from Moose Creek Sample #4 .................. 11 Figure 3. Representative isotherms showing phosphorus sorption to biogenic iron oxides . Error! Bookmark not defined. Figure 4. Maximum phosphate loadings (Langmuir ΓMax Solids) for various iron rich substrates. ...................................................................................................................................... 17 Figure 5. Impact of pH on phosphorus sorption to biogenic iron oxides..................................... 19 Figure 6. Chemical impact of pH variation on phosphate adsorption potential .......................... 20 Figure 7. Phosphorus desorption from biogenic iron oxides facilitated by various solutions ..... 22 Figure 8. Simplified engineered wastewater treatment for phosphorus removal and recovery ... 26 Figure 9. Isotherms showing phosphorus sorption to biogenic iron oxides................................. 29 Figure 10. Impact of pH on phosphorus sorption to biogenic iron oxides .................................. 30 Figure 11. Calculated isotherm coefficients ................................................................................ 31 Figure 12. Repartition of phosphorus water into the surface water in Western Europe .............. 34 Figure 13. Biologically induced abiotic iron reduction ............................................................... 43 Figure 14. Circum neutral iron cycle within freshwater wetlands ............................................... 44 Figure 15. (a) Low- and (b) high- magnification of Leptothrix Ochracea sheath by scanning electron microscopy (from Hashimoto et al., 2007). .................................................................... 49 Figure 16. Leica DMLB fluorescence microscope picture .......................................................... 66

1
CHAPTER ONE INTRODUCTION
Phosphorus pollution contributes to water body degradation (Moore and Hicks, 2004). It
often results in loss of aquatic life due to oxygen depletion by eutrophication, diminished water
quality, and depleted recreational activities. Phosphorus regulations have become increasingly
strict and several methods have been developed to remove this contaminant (de-Bashan and
Bashan, 2004). Chemical precipitation and enhanced phosphorus biological removal (EPBR) are
currently the technologies used most frequently by wastewater treatment plants (Morse et al.,
1998). Used at different steps during the wastewater treatment process, chemical precipitation
offers high water quality. EPBR represents an effective method to treat larger amounts of
wastewater than chemical precipitation (GLS, 2006). However, both of these technologies, even
coupled, can have difficulties meeting limitation requirements. Often, meeting limits is cost
prohibitive. New methods must be investigated to provide sustainable solutions to this excessive
problem. Filtration using highly selective substrates represents one effective, simple, and cost
effective way to improve phosphorus removal and water quality (Riahi et al., 2008). Added as
tertiary treatment systems, filters could improve phosphorus removal during municipal and
industrial wastewater treatment (Jeon et al., 2002).
Previous studies examined several substrates for phosphorus removal, particularly iron
oxides that strongly bind phosphorus (Sparks, 1995; Kreller et al., 2002). This element is
widespread in both soils and water bodies. As a result, it reacts with various elements, resulting
in a wide variety of iron forms that are available at low prices to provide a sustainable substrate.
Pure iron oxides such as goethite and akaganeite revealed phosphorus adsorption potential

2
(Chitrakar et al., 2006). Sand coated with iron oxides also showed phosphate removal
capabilities (Boujelben et al., 2008; Arias et al., 2006; Del Bubba et al., 2003). Filters using iron
rich recycled and engineered material as substrates showed their capacity for phosphorus
removal (Boujelben et al., 2008; Bastin et al., 1999; Zeng et al., 2004; Han et al., 2005). A first
attempt to use biogenic iron oxides resulted in high phosphorus loading (Rentz et al., 2008).
Biogenic iron oxides are naturally synthesized in water environments under specific
conditions. Chemical iron oxidation occurs spontaneously in aerobic environments. However,
iron oxidizing bacteria are able to increase this oxidation rate up to 18% and thus compete with
chemical oxidation (Rentz et al., 2007; Neubauer, 2007). This reaction occurs in both marine and
freshwater environments. Most of the steps in biogenic iron oxide formation are known, but the
complete process remains unclear (Fortin and Langley, 2005). Reactions take place at the
interface between the oxic and anoxic zone where the oxygen concentration is low.
Different bacteria have the potential for biogenic iron oxide synthesis as a metabolic
byproduct. Sideroxydans paludicola oxidizes iron in the rhizosphere under microaerobic
conditions to produce insoluble ferric hydroxide Fe(OH)3 (Neubauer et al., 2007; Rentz et al.,
2007; Weiss et al., 2007). Bacteria from the genus Gallionella produce an insoluble ferric
hydroxide that develops a helical, stalk-like filament formation from excreted polymers
(Emerson and Moyer, 2002). Gallionella ferruginea and Leptothrix ochracea share metabolism
similarities.
Leptothrix ochracea is one freshwater iron oxidizing bacteria that produces tubular iron
oxides with high surface area. Leptothrix ochracea belongs to the group Sphaerotilus-Leptothrix.
This bacteria is a gram-negative and autotrophic betaproteobacterium. It grows in slow running
iron-containing water poor in readily decomposable organic material (Emerson and Revsbech,

3
1994). Their respiratory pathway oxidizes Fe (II)-oxides to insoluble Fe (III)-oxides. Leptothrix
ochracea cells live in close association, orienting themselves linearly forming a chain of
organisms. As the bacteria grow, iron oxides accumulate on the outside of the cell that are
associated with the exopolymers, forming an iron oxide sheath (Emerson et al., 1992; Emerson et
al., 1993). Scanning electron microscopy, energy dispersive X-ray spectrometry, and X-ray
dispersion descriptions of these sheaths have indicated large surface areas both inside and
outside a tubular shape that suggest a potential for high adsorption (Hashimoto et al., 2007).
Previously, our laboratory showed that biogenic iron oxides removed phosphorus well
from solution, but the studied biogenic iron oxides were collected from only one location (Rentz
et al., 2008). For this study, we expended our experiments to showcase sorption and desorption
characteristics for biogenic iron oxides from four geographically distinct sites. The objectives of
this study were: (1) to confirm the previous studies that showed iron oxides were strong
phosphorus adsorbents, (2) to evaluate how variations in pH affect phosphorus sorption, (3) to
investigate the potential for phosphorus desorption, and (4) to characterize differences between
iron oxides from different sites in order to predict sorption and desorption capacities.

4
CHAPTER TWO MATERIALS AND METHODS
Sixteen samples of biogenic iron oxides were collected from four different freshwater
locations. Three of them at Moose Creek Reservoir, ID (M10A and M10B collected the same
day at two different site locations, and M12). The first attempt to study biogenic iron oxides used
only samples from Moose Creek Reservoir (Rentz et al., 2008). In order to investigate biogenic
iron oxides from different sites, four samples were collected at Myron Lake in Yakima, WA
(YK1, YK2, YK3, and YK4), four at Spring Lake, WA (SL1, SL2, SL3, and SL4), and one at
Rainbow Lake, WA (RL1). Samples Moose Creek 14 (M14), Yakima 5 (YK5), Spring Lake 5
(SL5), and Rainbow Lake 3 (RL3) were dedicated to the phosphorus recovery experiments. Each
of these sites was characterized visually by significant amounts of orange iron oxides.
Samples were collected between April 2008 and August 2008, using sterile plastic
pipettes. Samples SL3 and SL4 were collected using a clean plastic bucket. Sample RL1 was
collected directly using a 1L bottle in which the sample was conserved. Samples were
concentrated by letting the biogenic iron oxides settle during collection, decanting overlying
water, and filling bottles with additional iron oxides. For each sample collected, in situ
parameters were measured for the water directly overlying collected iron oxides, including pH,
temperature, and ferrous iron (Hach FerroVer). Samples were transported to the lab on ice and
stored at 4ºC prior to analysis and experimentation.
Biogenic iron oxides were chemically, physically, and morphologically characterized to
compare samples with each other and with other iron-based substrates. Total iron was
determined using the Hach FerroVer method following a 24 hour oxalic acid (0.25M) digestion
(Rentz et al., 2007); three replicates were conducted for each sample. Total solids content and

5
organic content were determined by gravimetric methods using four replicates per sample. Iron
oxide morphology was captured for each sample using a Leica DMLB light microscope with
SPOT software (Diagnostic Instruments Inc.); acridine orange (10 mg/L) was used to visualize
microbial cells. Aqueous total organic carbon and phosphorus were measured using the Hach
Method 10129 and Hach Method 8048, respectively. pH of the settled sample supernatant was
also recorded.
Prior to use in batch equilibrium or desorption experiments, the biogenic iron oxides were
washed with a 100 mM sodium chloride solution to remove background phosphorus. A dilute
saline solution was used as an isotopic solution that would not interfere with subsequent
experimentation. This procedure replaced between 40% and 60% of initial water. All samples
were once again chemically and physically characterized following this wash step.
Batch equilibrium experiments were performed using standard methods (Rentz et al.,
2008). Saline washed biogenic iron oxide samples were evenly distributed to sterile plastic tubes.
The nature of the sample determined the total iron concentration in the reaction tubes. Fresh and
gelatinous iron mats were supplied at 150 mg Fe/L. Experiments on older and settled biofilms
required 350 mg Fe/L. The volume of washed sample added to the tubes was adjusted
accordingly. Initial phosphorus concentrations from 0.163 to 20.9 mg P/L were created using a
326 mg P/L stock solution and were examined with five replicates each. DI water was added to
achieve a final 50 mL tube volume. All tubes were mixed by rotation (20 r.p.m.) for 24 hours, a
time kinetic studies previously suggested was adequate to reach equilibrium (Rentz et al., 2008).
Tubes were then centrifuged (4100 r.p.m. for 10 min) and supernatant phosphate concentrations
were measured for each tube using Hach Method 8048.

6
In order to investigate pH impact on phosphorus sorption to biogenic iron oxides, pH
adjusted batch equilibrium experiments were conducted similarly, as above. Prior to the batch
equilibrium, samples were washed with a buffered saline wash solution (0.1M NaCl and 10mM
sodium bicarbonate). pH was adjusted using either a 100 mM NaOH solution or 100mM HNO3
solution to yield a range of 2.5 to 9. Once the pH was adjusted, the samples were added to
reaction tubes (four replicates per initial pH) and phosphorus solution was added to reach a
concentration of 20.9 mg P/L. DI water completed the volume of the 50mL tube. Subsequent
steps were similar to the batch equilibrium experiment: rotation, centrifugation, and phosphate
concentration readings. Finally, supernatant pH was recorded in every reaction tube following
centrifugation.
The desorption experiments also used a modified batch equilibrium process. A 24 hour
rotation cycle was run with 16 reaction tubes containing 20.9 mg P/L and saline washed samples
as described previously. The tubes were then centrifuged and the supernatant phosphate was
measured. Supernatant (30 mL) was removed and replaced with one of four stock solutions:
deionized water, a 0.1 M saline wash solution, a 0.01 M KCl solution and a 0.01 M NaOH
solution. Each solution was conducted in quadruplicate. These tubes were rotated again for 24
hours, centrifuged, and the supernatant phosphate concentration measured. Again 30 mL of
supernatant was replaced by an equal volume of desorption solution. This 24 hour cycle was
repeated four times. Prior to phosphorus analyses, pH was adjusted to 6-8 with 0.3 M MES
buffer solution.
Batch equilibrium data were fit using non-linear curve fitting (Igor Pro, Wavemetrics,
Portland, OR U.S.A.), producing 95% confidence interval statistics. The strength of various fit
equations was estimated using Pearson analysis to generate R2 values (Microsoft Excel). Five

7
isotherm fitting equations were used to describe batch equilibrium data: Langmuir (Eq. 1),
Freundlich (Eq. 2), Temkin (Eq. 3), Redlich-Peterson (Eq.4), and Langmuir-Freundlich (Eq.5). Γ
was the sorbed phosphorus concentration (mg P/g), C was the aqueous equilibrium concentration
(mg P/L), ΓMax was the maximum sorbed concentration (mg P/g), b was the Langmuir
equilibrium constant, Kf was the Freundlich sorption capacity, n was the Freundlich sorption
intensity constant. A1 is an adjustable parameter and B1 is the Temkin adsorption coefficient. A2
and B2 were Redlich-Peterson isotherm constants determined by regression of the experimental
data.
Γ=(ΓMaxbC)/(1+bC) (1)
Γ=Kf C^(1⁄n) (2)
Γ=A1+B1lnC (3)
Γ=A2C/(1+B2Cn ) (4)
Γ= (ΓMaxbC1⁄n)/(1+bC1⁄n ) (5)
All equations were plotted and the coefficients were calculated. For each sample the Langmuir
and Freundlich fitting curves were represented. The fitting equation ((3), (4), or (5)) that led to
the greatest R² value was also plotted.
8
CHAPTER THREE RESULTS AND DISCUSSION
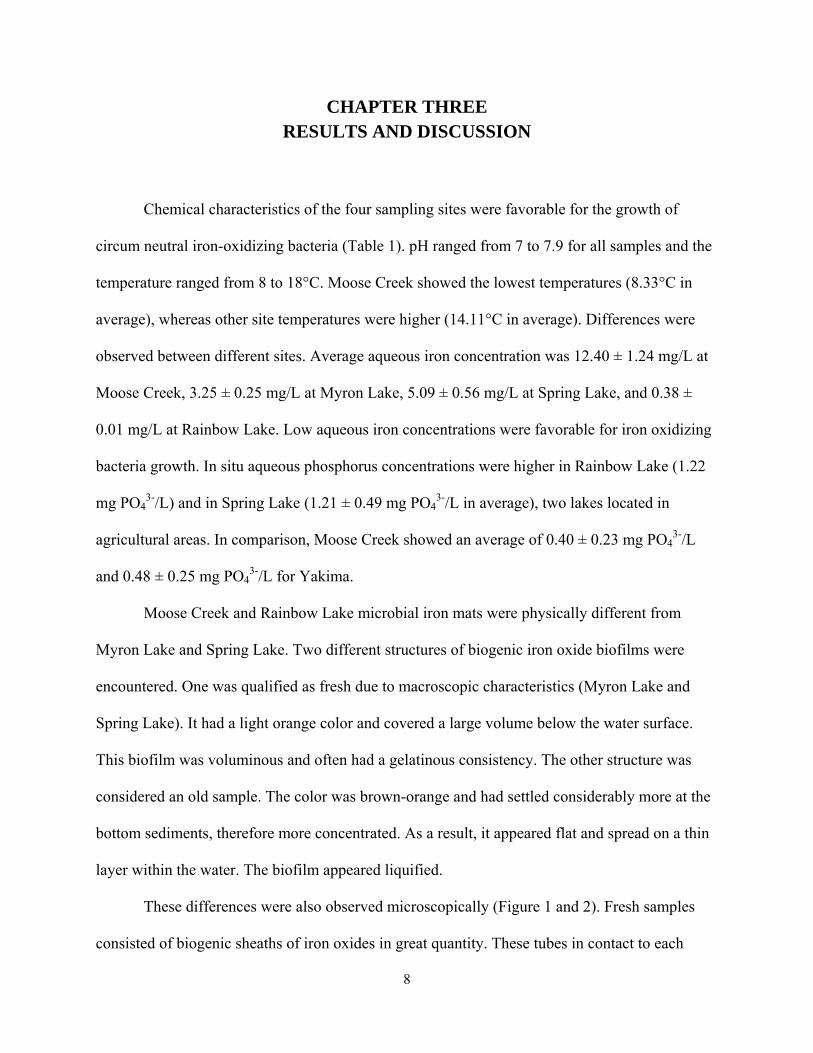
Chemical characteristics of the four sampling sites were favorable for the growth of
circum neutral iron-oxidizing bacteria (Table 1). pH ranged from 7 to 7.9 for all samples and the
temperature ranged from 8 to 18°C. Moose Creek showed the lowest temperatures (8.33°C in
average), whereas other site temperatures were higher (14.11°C in average). Differences were
observed between different sites. Average aqueous iron concentration was 12.40 ± 1.24 mg/L at
Moose Creek, 3.25 ± 0.25 mg/L at Myron Lake, 5.09 ± 0.56 mg/L at Spring Lake, and 0.38 ±
0.01 mg/L at Rainbow Lake. Low aqueous iron concentrations were favorable for iron oxidizing
bacteria growth. In situ aqueous phosphorus concentrations were higher in Rainbow Lake (1.22
mg PO43-/L) and in Spring Lake (1.21 ± 0.49 mg PO4
3-/L in average), two lakes located in
agricultural areas. In comparison, Moose Creek showed an average of 0.40 ± 0.23 mg PO43-/L
and 0.48 ± 0.25 mg PO43-/L for Yakima.
Moose Creek and Rainbow Lake microbial iron mats were physically different from
Myron Lake and Spring Lake. Two different structures of biogenic iron oxide biofilms were
encountered. One was qualified as fresh due to macroscopic characteristics (Myron Lake and
Spring Lake). It had a light orange color and covered a large volume below the water surface.
This biofilm was voluminous and often had a gelatinous consistency. The other structure was
considered an old sample. The color was brown-orange and had settled considerably more at the
bottom sediments, therefore more concentrated. As a result, it appeared flat and spread on a thin
layer within the water. The biofilm appeared liquified.
These differences were also observed microscopically (Figure 1 and 2). Fresh samples
consisted of biogenic sheaths of iron oxides in great quantity. These tubes in contact to each
9
other gave to the microbial mat a greater volume. The microbial activity was also superior.
Chemical iron oxides were also present in older samples. It appeared as a crusty material on the
microscope pictures. This material in contact with the biogenic sheaths suggested that the
microbial activity was lower at these sites. Indeed, the aqueous iron oxide, released from the
sediments, was not directly used by the bacteria at the oxic-anoxic limit (due to low bacterial
activity) and oxidized in the presence of oxygen.
The characteristics of the material collected were different between fresh and old
samples. Fresh samples were characterized by a low total iron concentration: 450.63 ± 17.73 mg
total Fe/L average at Myron Lake and 431.67 ± 109.58 mg total Fe/L averaged between Spring
Lake samples 1, 2, and 3. Due to the direct relationship, dry density values were also low for
these samples: 1.42 ± 0.06 mg/L at Myron Lake and 1.23 ± 0.06 mg/L for SL1, SL2, and SL3.
SL4 had different macroscopic and microscopic properties within the Spring Lake samples. It
was characterized by 2412.08 ± 36.43 mg total Fe/L and a dry density of 6.91 ± 0.23 mg/L.
These high values were specific to an old sample. Moose Creek samples averaged a total iron
concentration of 3027.50 ± 107.35 mg/L and a dry density of 7.39 ± 0.12 mg/L. The Rainbow
Lake sample had 2630 ± 130.41 mg total Fe/L and a dry density of 8.85 ± 0.22 mg/L.

Table 1.
ND – No
SampleM10AM10B M12RL1YK1YK2YK3YK4SL1SL2SL3SL4
Figure 1. sampling sRL1) wereshaped irobiogenic i
Chemical an
ot determined
pH T7.87.17.97.87.67.17.57.27.57.17.27.0
Iron oxide sites. Showne old as illuson oxides. Saron oxide sh
nd physical
d because no
Temp. (°C)889131214121813141516
sheaths charn here are Mstrated by theamples YK2heaths.
characteristi
o pre-wash s
PO43- (mg/L0.290.660.241.220.380.450.270.841.251.271.760.57
racteristic ofM10A, YK2, R
e presence o2 and SL2 we
10
ics of evalua
sample was r
L) Fe2+ (mg21.9 ± 214.7 ± 10.61 ± 00.38 ± 03.29 ±04.27 ± 03.66 ± 01.77 ± 011.4 ± 06.30 ± 11.53 ± 01.16 ± 0
f Leptothrix oRL1, and SL
of both smooere fresh hig
ated biogenic
reserved for
g/L) Tot.2.23 261.01 330.470.01 260.06 40.27 220.03 550.65 570.87 391.21 440.15 450.01 24
ochracea thaL2. The left hoth regular shghlighted by
c iron oxides
experimenta
Fe (mg/L)78 ± 92.2
378 ± 123ND
630 ± 130455 ± 3522 ± 5.0551 ± 17.575 ± 13.491 ± 11149 ± 28.155 ± 17712 ± 36.4
at dominatedhand sampleheaths and cthe high con
s.
ation.
Dry wt. (g7.98 ± 0.6.08 ± 0.
ND8.85 ± 0.0.845 ± 00.317 ± 0.1.37 ± 0.03.15 ± 0.00.843 ± 0.1.19 ± 0.01.67 ± 0.06.91 ± 0.2
d the four es (M10A anrusty irregulncentration o
g/L).11.13
.220.12.026036064.025074093226
nd lar of

11
Figure 2. Iron oxide sheaths of Leptothrix ochracea from Moose Creek. This fluorescent picture showed the present of iron oxidizing bacteria within iron sheaths (yellow rods). These bacteria were present at the four sampling sites proof that the material is biogenic.

12
All samples showed potential for phosphorus adsorption and produced expected
isotherms (Figure 3), which were consistent with previous studies (Zeng et al., 2004). The fitting
equations used gave Pearson R² values between 0.939 and 0.972 for Langmuir, 0.814 and 0.895
for Freundlich, 0.981 for Redlich-Peterson, 0.946 for Langmuir-Freundlich, and 0.955 and 0.977
for Temkin. The Langmuir equation appeared to provide a better fit than the Freundlich equation,
suggesting that a maximum sorption occurred and biogenic iron oxides were saturated with
phosphorus. Redlich-Peterson, Langmuir-Freundlich, or Temkin equations always had the best
R² values, because the calculated theoretical values were more similar to experimental data. The
fitting coefficients were calculated to trace these isotherms (Table 2). The two old samples were
coherent and lower than the fresh samples. Sample RL1 had less sorption, with a Γmax value of
24.21 ± 0.69 mg P/ mg Fe. Sample M12 showed a maximum sorption capacity of 29.14 ± 0.63
mg P/ mg Fe. Sample SL1 showed a Γmax value of 36.04 ± 1.42 mg P/ mg Fe and 40.37 ± 1.42
mg P/ mg Fe for YK2. The Langmuir parameter b value was between 0.91 ± 0.12 and 1.08 ±
0.11 for every sample except for M12 parameter that was five times higher. The Freundlich
fitting equation gave a n value almost identical for each sample; between 2.61 ± 0.20 and 3.69 ±
0.28. Sample M10A had the greatest ΓMax value (106.82 mg P/ mg Fe) within the Moose Creek
group. However, this sample was not represented because it was an outlier in this group. The
initial concentration of biogenic iron oxides was too high, and the isotherm produced was not
accurate enough for data analysis.
These biogenic iron oxides were efficient phosphorus sorbents and the phosphate
sorption compared favorably to previous studies that evaluated iron rich or iron-oxide containing
substrates (Figure 4). Here, phosphorus sorption was normalized to total solids composition
(Table 3) and all samples were represented. Previously studied iron substrates all showed

13
significant phosphorus removal; biogenic iron oxides from Moose Creek Reservoir (Rentz et al.,
2008), iron oxide coated sand, engineered materials (gypsum and brick), pure iron oxides
(goethite and akaganeite), and recycled materials (tailings and two juniper fibers). The average
adsorption of all of these iron-based substrates was 59.29 ± 7.28 mg P/ mg Fe and 14.80 ± 4.11
mg P/ mg solids. Thus, iron oxides are competitive substrates for phosphorus removal when
compared to other substrates (Johansson Westholm, 2006).
Iron oxides possess different capabilities for phosphorus sorption. Biogenic substrates
adsorbed more than three times the phosphorus than chemical iron oxides, thus representing a
substrate of choice for phosphorus removal. The only Moose Creek sample studied for total
solids normalization was consistent with the previous samples. The maximum sorption was
35.84 ± 17.48 mg P/ mg solids for Moose Creek sample. This value was the second highest.
Samples M10A, YK1 (24.51 ± 1.22 mg P/ mg solids), YK2 (27.97 ± 0.98 mg P/ mg solids), YK3
(22.07 ± 1.67 mg P/ mg solids) were all above the highest value reported for engineered
materials and recycled materials, which contained primarily iron oxides. Iron containing
substrates (sand) resulted in a low sorption compared to other substrates. When both old and
fresh samples were compared to synthetic iron oxides, a greater adsorption capacity was
highlighted. On average, biogenic iron oxides adsorbed 19.02 mg P/g solids against 6.27 mg P/g
solids for synthetic or chemical substrates referenced here.
Iron oxide characteristics determined the potential of phosphorus sorption. When
normalized to total iron content, fresh samples had a higher sorbed phosphorus equilibrium
concentration. The capacity of straight and active iron oxide sheaths to capture phosphate
molecules was greater. Further studies should investigate biogenic iron oxide surface area. A
relationship could be found between the sorbing capacity and the actual surface area of the fresh

14
and older sample. A number of environmental factors determine the surface area characteristics.
The surface area interacted with gaseous and soluble species as well as bacterial cells (Cornell,
2006). Crusty iron oxides in contact with biogenic sheath might reduce the overall iron oxide
loading capacity. It was likely that the surface area sorption potential varies dramatically from
site to site. Interestingly, the relation was inversed when the phosphate loading was normalized
to total solid content. Here, older samples had a greater capacity of sorption. This resulted in the
fact that old sample iron oxides were much more concentrated. These samples had both biogenic
and chemical iron oxides involved in the sorption processes.

15
Figure 3. Representative isotherms showing phosphorus sorption to biogenic iron oxides. Langmuir and Freundlich equations were fit using non-linear regression (Igor Pro). The equation that gave the greatest Pearson value was also represented. Coefficients are summarized in Table 2. All five replicates are shown for each initial phosphate concentration. All samples shown in appendix A.
50
40
30
20
10
0
Sorb
ed P
Con
c. (m
g P/
g Fe
)
20151050Equilibrium P Conc. (mg /L)
M12 Langmuir (R2= 0.972)
Freundlich (R2= 0.895)
Redlich-Peterson (R2= 0.981)
50
40
30
20
10
0
Sorb
ed P
Con
c. (m
g P/
g Fe
)
20151050Equilibrium P Conc. (mg /L)
RL1 Langmuir (R2= 0.971)
Freundlich (R2= 0.883)
Temkin (R2= 0.977)
50
40
30
20
10
0
Sorb
ed P
Con
c. (m
g P/
g Fe
)
20151050Equilibrium P Conc. (mg /L)
SL1 Langmuir (R2= 0.939)
Freundlich (R2= 0.814)
Temkin (R2= 0.955)
50
40
30
20
10
0
Sorb
ed P
Con
c. (m
g P/
g Fe
)
20151050Equilibrium P Conc. (mg /L)
YK2 Langmuir (R2= 0.941)
Freundlich (R2= 0.832)
Langmuir-Freundlich (R2= 0.946)
16
rMax Fe (mg/g) rMax Solids (mg/g) b Pearson R2
M10A 106.82 ± 52.10 35.84 ± 17.48 0.12 ± 0.07 0.971M12 29.14 ± 0.63 ND 5.17 ± 0.55 0.972YK1 45.79 ± 2.28 24.51 ± 1.22 0.92 ± 0.15 0.914YK2 40.37 ± 1.42 27.97 ± 0.98 1.06 ± 0.14 0.941YK3 54.86 ± 4.15 22.07 ± 1.67 0.52 ± 0.10 0.886YK4 43.19 ± 3.14 7.88 ± 0.57 0.73 ± 0.14 0.88RL1 24.21 ± 0.69 7.19 ± 0.21 1.08 ± 0.11 0.971SL1 36.04 ± 1.42 16.77 ± 0.66 0.91 ± 0.12 0.939SL2 27.05 ± 0.96 10.21 ± 0.36 2.13 ± 0.31 0.916SL3 33.96 ± 1.77 9.25 ± 0.48 1.02 ± 0.18 0.884SL4 29.83 ± 1.65 10.41 ± 0.58 1.05 ± 0.18 0.903
Kf Fe (mg/g) Kf Solids (mg/g) n Pearson R2
M10A 10.77 ± 0.33 3.61 ± 0.11 1.02 ± 0.05 0.959M12 16.38 ± 0.79 ND 3.69 ± 0.28 0.895YK1 16.83 ± 1.42 9.01 ± 0.76 2.62 ± 0.27 0.806YK2 16.76 ± 1.20 11.61 ± 0.83 3.05 ± 0.29 0.832YK3 16.12 ± 1.55 6.49 ± 0.62 2.15 ± 0.22 0.903YK4 14.06 ± 1.21 2.57 ± 0.22 2.12 ± 0.21 0.908RL1 9.24 ± 0.60 2.75 ± 0.18 2.61 ± 0.20 0.883SL1 13.95 ± 1.11 6.49 ± 0.52 2.87 ± 0.29 0.814SL2 14.15 ± 1.02 5.34 ± 0.39 4.04 ± 0.53 0.714SL3 13.98 ± 1.28 3.81 ± 0.35 3.11 ± 0.40 0.725SL4 1.22 ± 0.92 0.43 ± 0.32 2.52 ± 0.25 0.803
Langmuir
Freundlich
Table 2. Isotherm coefficients for biogenic iron oxide/phosphorus systems. Values reported with 95% confidence interval. M (Moose Creek), YK (Yakima), RL (Rainbow Lake), and SL (Spring Lake). All data represented in appendix A.

17
Figure 4. Maximum phosphate loadings (Langmuir ΓMax Solids) for various iron rich substrates. Within the Moose Creek group, only M10A was shown because the total solids were not evaluated for M12 and M10B. The values represented by the circles were either synthetic or natural sorbents investigated in previous studies. Sand substrates were determined from Boujelben et al. (2008), Arias et al. (2006), and Del Bubba et al. (2003). Engineered Materials were gypsum and brick, respectively, issued from Bastin et al. (1999) and Boujelben et al. (2008). Iron oxides were pure materials; goethite and akaganeite studied in Chitraker et al. (2006). Recycled materials were tailings from Zeng et al. (2004) and juniper fiber (precipitated acid mine drainage onto plant fibers) from Han et al. (2005).
40
30
20
10
0
Phos
phat
e Lo
adin
g (m
g P/
g)
MooseCreek
Yakima RainbowLake
SpringLake
Sand EngineeredMaterials
IronOxides
RecycledMaterials
This Study Rentz et al 2008 Other Studies

18
All samples showed that iron oxide sorption potential was dramatically increased when
pH was reduced (Figure 5). The general pattern of the pH adjusted batch equilibrium was that the
lower the pH, the greater the sorption. Phosphorus sorptions were also greater when investigating
fresh samples. Maximum sorption values were 69.68 mg P/ mg Fe and 95.17 mg P/ mg Fe for
SL1 and YK2, respectively, at the lowest pH (5.71 and 5.48, respectively). Older sample
maximum sorption was 31.41 mg P/ mg Fe RL1 and 39.37 mg P/ mg Fe for M12. The amplitude
between the lowest and the highest sorption was then greater for fresh samples.
The range of pH values was reduced during the batch equilibrium experiment. For sample
SL1, the pH ranged from 3.27 to 9.22. After the batch equilibrium, the pH ranged from 5.70 to
9.08. Sample YK2 ranged from 2.92 to 8.96 before batch equilibrium and ended at 5.48 to 9.17.
These fresh samples started and ended with a wider interval of pH in comparison with the older
samples. Sample M12 ranged from 4.26 to 7.37 and ended from 6.4 to 7.62. Sample RL1 ranged
from 4.91 to 7.32 and ended from 6.71 to 7.98.
The liaison between iron oxides and phosphorus was impacted in pH-enhanced
adsorption. When acid was added to reaction vials, quantities of H+ ions were increased in
solution. These positive ions were attracted to the surface of the iron oxides and bind to the
negatively charged hydroxyl group linked to the iron atom. The net surface charge of the iron
oxide was then positive (Figure 6). As a result, it was likely that phosphate anions bind to the
iron oxide. This linkage would be electrostatic and result from Van der Waals forces. In contrast,
when base was added to the reaction tubes to increase the pH, hydroxyl ions are increased in
solution. These anions would catch the protons at the iron oxide surface. The net surface charge
was then negative and cations are likely adsorbed. It explains the fact that phosphorus removal
was greater at a lower pH.

19
Figure 5. Impact of pH on phosphorus sorption to biogenic iron oxides. All five replicates shown for each initial pH. One sample of each site was represented. Selection of samples was made to be pertinent with Figure 3. M12 (Moose Creek), RL1 (Rainbow Lake), YK2 (Myron Lake in Yakima,WA), and SL (Spring Lake) were represented. All samples shown in appendix A.
100
80
60
40
20
0
Sorb
ed P
Con
c. (m
g P/
g Fe
)
98765Equilibrium pH
M12 100
80
60
40
20
0
Sorb
ed P
Con
c. (m
g P/
g Fe
)
98765Equilibrium pH
RL1
100
80
60
40
20
0
Sorb
ed P
Con
c. (m
g P/
g Fe
)
98765Equilibrium pH
YK2 100
80
60
40
20
0
Sorb
ed P
Con
c. (m
g P/
g Fe
)
98765Equilibrium pH
SL1

20
Figure 6. Chemical impact of pH variation on phosphate adsorption potential. Phosphate net surface charge was negatively charged. When the pH was lower, the H+ cation was in excess in solution. It bond to the hydroxyl group of the iron oxide, which results in a more positive net surface charge. Phosphate anions electrostatically (Van der Waals forces) bind the iron oxide. At higher pH, hydroxide ions are in excess and bind protons from the hydroxyl group of the iron oxide to form water molecule. This results in a negative net surface charge to which a few phosphate anions are bound. Hydroxyl groups linked to the iron oxides are not representative of the iron oxides from Leptothrix ochacea.
Previous studies have also showed that pH control was required for optimal phosphorus
adsorption. Phosphate adsorption on iron oxide tailings varied from 8.6 mg P/g solids at low pH
and 4.6 mg P/g solids at high pH (Zeng et al., 2004). Adsorption was thus increased by 87%
upon pH variation (from 9.5 to 3.2). For biogenic iron oxides, the pH intervals were smaller for
all samples. However, a dramatic increase was seen for fresh materials (315% for SL1 and 307%
for YK2). Phosphorus adsorption was 50% and 78% greater at lower pH for M12 and RL1,
respectively.
Phosphorus recycling was limited for our biogenic iron oxides. Phosphorus release
potential appeared low for all chemicals used except the basic solution (Figure 7). DI water
showed the second best phosphorus release potential with a 40.60% average for the four samples.
The KCL solution had an average potential of 30.37% and the saline solution 20.23%.
Fe
O‐
OH2OH2
OH2 OH2
Fe
OH2
O‐O‐
O‐ O‐+
++
‐ ‐+
+PO4
3‐
‐
‐‐
‐
‐‐PO4
3‐
‐
‐‐
‐
‐‐PO43‐
‐
‐‐
‐
‐‐
‐‐
+ +‐
‐
‐
PO43‐
‐
‐‐
‐
‐‐
Low pH High pH

21
Differences in release potential were observed between the different chemicals used. Different
reactions to the chemicals were also noticed from site to site. Sample M14 had the lowest release
potential with an average of 6.08% between the three chemicals used (DI water, KCl, and NaCl).
Samples RL3 and SL5 reacted similarly with averages of 34.64% and 32.13%, respectively.
Finally, the greatest reaction was observed with sample YK5, with an averaged potential of
48.76%, yet phosphorus was not released from YK5 well with sodium hydroxide. The literature
demonstrated that the adsorption process of phosphorus on iron oxides is not totally reversible,
thus limiting the potential for phosphorus recycling (Zeng et al., 2004; Arias et al., 2006). Zeng
et al. showed a desorbability of 13 to 14% using a solution of KCL regarding the initial
phosphorus concentration. Our study revealed that the desorbability of biogenic iron oxides was
two times higher than the potential of iron oxides tailings, although it may be too low in order to
use in an engineered process.
A dramatic gap was observed between the release potential of the sodium hydroxide
solution and the other solutions. This confirmed the fact that hydroxyl groups (HO-) were
involved in phosphorus detaching from the iron oxides. The sodium hydroxide solution provided
large amounts of hydroxyl groups in solution. These likely bound protons from the OH2 group at
the iron oxide surface to form a water molecule (Figure 6). This capture resulted in a negative net
surface charge on the iron oxide not favorable to keeping the phosphate molecule bound. As the
phosphate linkage was a weak electrostatic bond, the sorption of phosphorus was reversible and
phosphorus could be released. This phenomenon follows the same trends as the phosphoric acid
dissociation into phosphate and a proton (Equation 1).
(6)

22
Figure 7. Phosphorus desorption from biogenic iron oxides facilitated by various solutions. Cycle 0 represented the first batch equilibrium run. Cycle 0 was to adsorb phosphorus prior to desorption. Cycle 1 to cycle 4 were the desorption cycles. A cycle was 24 hours of batch equilibrium. Between each cycle 30mL of supernatant was removed in each tube and replaced by different chemicals. The amount of phosphorus adsorbed at cycle 0 represented 100%. Negative percentages reflected the fact that adsorption was still occurring during the first cycles for some chemicals. Error bars represent the standard deviations from the mean of four replicates. Samples SL5 and RL3 had only three replicates for cycle 3 and cycle 4.
300
250
200
150
100
50
0
Rel
ease
d P
(%)
43210Cycle
SL5300
250
200
150
100
50
0
Rel
ease
d P
(%)
43210Cycle
YK5
300
250
200
150
100
50
0
Rel
ease
d P
(%)
43210Cycle
RL3300
250
200
150
100
50
0
Rel
ease
d P
(%)
43210Cycle
M14 DI Water 0.25M NaCl Solution 0.01M KCl Solution 0.01M NaOH Solution

23
Basic conditions dramatically enhanced the phosphorus recycling potential. Samples
from every site using all the different chemicals showed an increase in phosphorus concentration.
In presence of sodium hydroxide, biogenic iron oxides yielded the highest amount of phosphorus
for every sample. Sample M14 released a maximum of 159% of the first batch equilibrium
adsorbed phosphorus. Sample RL3 released 239%, sample YK5 207%, and sample SL5 had the
greatest recovery potential with a desorbability of 295%. A previous study showed that the
increase of pH using a basic solution released most of the adsorbed phosphorus on goethite
(Strauss et al., 1997). Our data suggested that most of the phosphorus was also released but
other phenomena increased the phosphorus concentration within the reaction tubes. Biogenic
iron oxides showed a better potential for recovery, suggesting again than the nature of the liaison
between phosphate and substrate was favorable for recycling. In addition, our results suggested
that a single desorption cycle was enough to release more phosphorus than what was previously
adsorbed. After one cycle, sample M14 had a desorbability of 133%, 188% for RL3, 147% for
YK5, and 172% for SL5. This represented 84%, 78% 70%, and 58% of the total desorbed
phosphorus after four cycles for M14, RL3, YK5, and SL5, respectively.
pH variation can not be the only explanation for such great phosphorus release. The
averaged maximal release of all replicates from all sites at cycle 4 was 213% using NaOH. On
average, about two times more phosphorus was released than what was adsorbed during cycle 0.
This supplementary phosphorus can either come from in-situ already sorbed phosphorus on the
iron oxides or intra-cellular phosphorus released due to cell disruption. NaOH had the capacity to
release most of the phosphorus from both sources. Concerning the other chemicals (Di, NaCL,
and KCl), it was not possible to conclude the origin of the released phosphorus. Further studies
need to demonstrate whether the recovered phosphorus was cellular or previously sorbed.

24
The oldest sample from Moose Creek showed the lowest capacity to recover phosphorus.
Fresher samples had a higher releasing potential. Sample RL3 was actually fresher than the other
samples from the same site and was similar to sample SL5. Those two had similar releasing
behavior with chemicals other than sodium hydroxide (DI water, NaCl solution, and KCl
solution average of 34.64% for RL3 and 32.13% for SL5). The freshest sample YK5 had the
highest release activity on chemicals other than sodium hydroxide. This high capacity to release
phosphorus was due to: (1) high cellular activity leading to large amounts of phosphorus released
by cell disruption, and (2) the greater surface area of fresh iron oxides and the potential to release
previously sorbed phosphorus.

25
CHAPTER FOUR ENGINEERED APPLICATIONS
The Leptothrix group of bacteria is well known and growth conditions are already fully
described (Van Veen et al., 1978). The growth cycle of bacteria from the group Leptothrix has
already been outlined. Slow growth under minimal aeration at 20 to 25ºC on a salts-vitamin-
pyruvate medium is feasible for Leptothrix discophora (Emerson and Ghiorse, 1992). The same
experiments should be conducted with these laboratory-growing bacteria, which are iron oxide
sheath-forming as well as Leptothrix ochracea. Phosphorus adsorption potential is likely to be
the same between these two bacterial sheaths. As these two bacteria are similar phylogenetically
and morphologically, Leptothrix ochracea growth should also be investigated under the previous
growth conditions.
A limitation to chemical synthesized iron oxide is that they can not be regenerated within
a filter. This leads to substrate replenishment, which is often expensive. Biogenic iron oxides
present the potential of self-regeneration. During a standard filtration process, the phosphorus
removal potential is self-regenerated. When used iron oxide is removed from the filter for
phosphorus recycling, the microbial growth will produce iron oxides that replenish capacity. Use
in a microbial filter requires the biogenic iron oxide sheath of Leptothrix ochracea to be kept at a
certain pH range. As neutrophilic bacteria, they can not grow at pH below 6 or above 8. Ideal
results would be found with a managed growth at pH 6, which results in already great increases
in adsorption for samples SL1 and YK2 (Figure 5). Data show that even a small decrease in pH
to reach 6 leads to significant sorption improvement.
In a hypothetical wastewater treatment process using biogenic iron oxide filters, a high
pH tank would follow a low pH tank. In the low pH tank (pH=6), bacteria a grown and the

26
biogenic iron oxides formed are used to adsorb the phosphate in the wastewater. After 24 hours,
the sludge constituted of the sheaths that bounded the phosphorus are extracted from the
wastewater and introduced to a second high pH tank (pH=12). Here, phosphorus is recovered in
large amounts after a 24 hours cycle. Even though a treatment using sodium hydroxide might be
expensive, the use of a cheaper base to increase the pH should theoretically give similar results.
Figure 8. Simplified engineered wastewater treatment for phosphorus removal and recovery.
Tertiary filter pH≈6
Tank 2 pH≈12Wastewater with high phosphorus concentration
Effluent with low phosphorus concentration
24 hours 24 hours
Recovered phosphorus
Back wash: extracted
biogenic iron oxides and adsorbed phosphorus

27
CHAPTER FIVE CONCLUSIONS
Phosphate sorption characteristics to biogenic iron oxides and release were evaluated using batch
equilibrium experiments. Our results support the following conclusions:
• Adsorption isotherms followed the Langmuir model.
• Maximum adsorption using biogenic iron oxides normalized to total solids was
consistent with our previous study (Rentz et al, 2008) and was greater than reported for
iron rich or iron oxide containing substrates.
• Phosphorus adsorption was dramatically enhanced at lower pH. A reduction to pH 6
revealed a significant phosphorus adsorption increase (1.5 to 2 fold increase).
• Phosphorus was recovered using sodium hydroxide, sodium chloride, potassium
chloride, and DI water. The use of a base that increased the pH released both
experimental and in-situ adsorbed phosphorus. It also releases intracellular phosphorus
by cell disruption. Other chemicals released less phosphate and it is not possible to tell
the origin of this phosphate.
• Fresh samples gave the best result in pH enhanced phosphorus adsorption and
phosphorus release with every chemical used.
• Further studies should thus investigate fresh versus old samples differences such as
composition, organic matter, or iron oxides surface area.
• pH 6 had the best potential for allowing both bacterial life and enhanced phosphorus
removal in an engineered process.

28
APPENDIX A SUPPLEMENTARY DATA

29
Figure 9. Isotherms showing phosphorus sorption to biogenic iron oxides. All samples are represented.
50
40
30
20
10
0
Sorb
ed P
Con
c. (m
g P/
g Fe
)
20151050Equilibrium P Conc. (mg /L)
M12 Langmuir (R2= 0.972) Freundlich (R2= 0.895) Redlich-Peterson (R2= 0.981)
50
40
30
20
10
0
Sorb
ed P
Con
c. (m
g P/
g Fe
)
20151050Equilibrium P Conc. (mg /L)
RL1 Langmuir (R2= 0.971) Freundlich (R2= 0.883) Temkin (R2= 0.977)
50
40
30
20
10
0
Sorb
ed P
Con
c. (m
g P/
g Fe
)
20151050Equilibrium P Conc. (mg /L)
SL1 Langmuir (R2= 0.939) Freundlich (R2= 0.814) Temkin (R2= 0.955)
50
40
30
20
10
0
Sorb
ed P
Con
c. (m
g P/
g Fe
)
20151050Equilibrium P Conc. (mg /L)
SL2 Langmuir (R2= 0.916) Freundlich (R2= 0.714) Langmuir-Freundlich (R2= 0.948)
50
40
30
20
10
0
Sorb
ed P
Con
c. (m
g P/
g Fe
)
20151050Equilibrium P Conc. (mg /L)
SL3 Langmuir (R2= 0.884) Freundlich (R2= 0.725) Langmuir-Freundlich (R2= 0.932)
50
40
30
20
10
0
Sorb
ed P
Con
c. (m
g P/
g Fe
)
20151050Equilibrium P Conc. (mg /L)
SL4 Langmuir (R2= 0.903) Freundlich (R2= 0.803) Langmuir-Freundlich (R2= 0.914)
50
40
30
20
10
0
Sorb
ed P
Con
c. (m
g P/
g Fe
)
20151050Equilibrium P Conc. (mg /L)
M10A Langmuir (R2= 0.971) Freundlich (R2= 0.959) Langmuir-Freundlich (R2= 0.991)
50
40
30
20
10
0
Sorb
ed P
Con
c. (m
g P/
g Fe
)
20151050Equilibrium P Conc. (mg /L)
YK1 Langmuir (R2= 0.914) Freundlich (R2= 0.806) Langmuir-Freundlich (R2= 0.936)
50
40
30
20
10
0
Sorb
ed P
Con
c. (m
g P/
g Fe
)
20151050Equilibrium P Conc. (mg /L)
YK2 Langmuir (R2= 0.941) Freundlich (R2= 0.832) Langmuir-Freundlich (R2= 0.946)
50
40
30
20
10
0
Sorb
ed P
Con
c. (m
g P/
g Fe
)
20151050Equilibrium P Conc. (mg /L)
YK3 Langmuir (R2= 0.886) Freundlich (R2= 0.811) Redlich-Peterson (R2= 0.903)
50
40
30
20
10
0
Sorb
ed P
Con
c. (m
g P/
g Fe
)
20151050Equilibrium P Conc. (mg /L)
YK4 Langmuir (R2= 0.880) Freundlich (R2= 0.805) Langmuir-Freundlich (R2= 0.908)
Rainbow Lake (RL)
Moose Creek (M) Spring Lake (SL) Myron Lake (YK)

30
Figure 10. Impact of pH on phosphorus sorption to biogenic iron oxides. All samples are represented.
100
80
60
40
20
0
Sorb
ed P
Con
c. (m
g P/
g Fe
)
98765Equilibrium pH
M10A
100
80
60
40
20
0
Sorb
ed P
Con
c. (m
g P/
g Fe
)
98765Equilibrium pH
M10B
100
80
60
40
20
0
Sorb
ed P
Con
c. (m
g P/
g Fe
)
98765Equilibrium pH
M12
100
80
60
40
20
0
Sorb
ed P
Con
c. (m
g P/
g Fe
)
98765Equilibrium pH
SL1
100
80
60
40
20
0
Sorb
ed P
Con
c. (m
g P/
g Fe
)
98765Equilibrium pH
SL2
100
80
60
40
20
0
Sorb
ed P
Con
c. (m
g P/
g Fe
)
98765Equilibrium pH
SL3
100
80
60
40
20
0
Sorb
ed P
Con
c. (m
g P/
g Fe
)
98765Equilibrium pH
YK1
100
80
60
40
20
0
Sorb
ed P
Con
c. (m
g P/
g Fe
)
98765Equilibrium pH
YK2
100
80
60
40
20
0
Sorb
ed P
Con
c. (m
g P/
g Fe
)
98765Equilibrium pH
YK4
100
80
60
40
20
0
Sorb
ed P
Con
c. (m
g P/
g Fe
)
98765Equilibrium pH
RL1
Moose Creek (M) Spring Lake (SL) Myron Lake (YK)
Rainbow Lake (RL)

31
Figure 11. Calculated isotherm coefficients. All results are represented.
Samp
leM1
0AM1
2SL
1SL
2SL
3SL
4RL
1YK
1YK
2YK
3YK
4Г M
ax10
7 ± 52
.129
.1 ± 0
.628
36.0
± 1.42
27.0
± 0.96
333
.9 ± 1
.7729
.8 ± 1
.6524
.2 ± 0
.690
45.8
± 2.28
40.4
± 1.42
54.9
± 4.15
43.2
± 3.14
b0.1
17 ±
0.066
5.17 ±
0.54
80.9
14 ±
0.123
2.13 ±
0.30
51.0
2 ± 0.
180
1.05 ±
0.17
91.0
8 ± 0.
107
0.917
± 0.1
461.0
6 ± 0.
139
0.524
± 0.1
030.7
28 ±
0.136
Pears
on R2
0.971
0.972
0.939
0.916
0.884
0.903
0.971
0.914
0.941
0.886
0.88
K f10
.8 ±0
.329
16.4
± 0.78
813
.9 ± 1
.1114
.1 ± 1
.0213
.9 ± 1
.281.2
2 ± 0.
919
9.24 ±
0.60
216
.8 ± 1
.4216
.8 ± 1
.2016
.1 ± 1
.5514
.1 ± 1
.21n
1.02 ±
0.04
93.6
9 ± 0.
282
2.87 ±
0.29
24.0
4 ± 0.
533.1
1 ± 0.
398
2.52 ±
0.25
02.6
1 ± 0.
201
2.62 ±
0.26
53.0
5 ± 0.
290
2.15 ±
0.22
22.1
2 ± 0.
207
Pears
on R2
0.959
0.895
0.814
0.714
0.725
0.803
0.883
0.806
0.832
0.811
0.805
A 112
.7 ± 0
.308
20.2
± 0.30
816
.2 ± 0
.602
15.5
± 0.67
615
.5 ± 0
.825
14.6
± 0.58
511
.9 ± 0
.218
20.9
± 0.84
019
.3 ± 0
.631
20.4
± 1.07
18.7
± 0.98
2B 1
6.41 ±
0.19
64.5
0 ± 0.
196
7.15 ±
0.36
14.7
0 ± 0.
359
6.81 ±
0.51
35.8
9 ± 0.
330
4.68 ±
0.11
59.1
2 ± 0.
500
7.75 ±
0.35
510
.8 ± 0
.741
7.97 ±
0.57
2Pe
arson
R20.9
660.9
760.9
180.8
30.8
380.8
990.9
770.9
020.9
280.8
690.8
43A 2
12.4
± 0.65
418
7 ± 21
.927
.2 ± 3
.5545
.1 ± 5
.4126
.5 ± 3
.8227
.1 ± 4
.6025
.5 ± 3
.0536
.3 ± 5
.4939
.9 ± 6
.4019
.7 ± 3
.1321
.6 ± 3
.00B 2
0.015
± 0.0
377.3
1 ± 1.
080.5
33 ±
0.160
1.23 ±
0.26
40.4
50 ±
0.159
0.696
± 0.2
631.0
1 ± 0.
232
0.579
± 0.2
070.9
01 ±
0.271
0.075
± 0.0
850.0
52 ±
0.116
n4.9
9 ± 4.
490.9
31 ±
0.019
1.14 ±
0.07
11.1
4 ± 0.
047
1.23 ±
0.09
01.1
2 ± 0.
0981
1.02 ±
0.05
01.1
3 ± 0.
093
1.038
± 0.0
591.6
6 ± 0.
415
2.06 ±
0.99
1Pe
arson
R20.9
80.9
810.9
460.9
350.9
070.9
060.9
710.9
190.9
410.9
030.9
08Г M
ax20
.3 ± 0
.746
30.5
± 0.99
332
.2 ± 1
.0524
.9 ± 0
.638
29.3
± 0.93
725
.9 ± 1
.3622
.4 ± 0
.673
39.8
± 1.46
37.4
± 1.36
46.8
± 3.20
36.5
± 2.02
b2.0
8 ± 0.
310
3.19 ±
0.71
11.6
2 ± 0.
317
7.52 ±
2.53
4.52 ±
1.92
2.75 ±
1.29
1.62 ±
0.25
62.3
6 ± 0.
629
1.53 ±
0.29
60.7
41 ±
0.165
1.52 ±
0.40
0n
0.499
± 0.0
281.1
8 ± 0.
098
0.639
± 0.0
700.5
44 ±
0.063
0.404
± 0.0
690.6
26 ±
0.120
0.797
± 0.0
620.5
42 ±
0.072
0.750
± 0.0
860.6
54 ±
0.104
0.562
± 0.0
78Pe
arson
R20.9
910.9
740.9
550.9
480.9
320.9
140.9
740.9
360.9
460.9
010.9
08
Lang
muir
Freun
dlich
Temk
in
Redli
ch-Pe
terson
Lang
muir-
Freun
dlich

32
APPENDIX B LITERATURE REVIEW

33
1. Phosphorus uses
Phosphorus is a highly reactive atom that is never found as a free element on Earth. It
binds to different atoms to form phosphorus compounds as hydrides, halides, oxides, sulfides,
acids, phosphates (most widespread form of phosphorus in the environment), phosphides,
organophosphorus, and organophosphates.
As a result, this chemical is omnipresent in both natural and synthetic chemistry. First of
all, phosphorus is a nutrient, essential element for any form of life. It is a framework constituent
of bones, teeth, nucleic acids, energy carriers (ATP, NADH), proteins, and lipids (Madigan and
Martinko, 2006). This nutrient is also encountered in pharmaceuticals and cosmetics. Phosphorus
was largely used in all kinds of detergents and cleaners but due to their highly negative impact
on the environment, their use is being reduced (Hoffman and Bishop, 1994; Wind, 2007). The
largest use of phosphorus is for fertilizers (87% in Western Europe). Fertilizers are non-point
(diffuse) source that reach the surface water by run-off, erosion or drainage (Figure 12). Industry,
detergents and human wastes are the main phosphorus point-sources (direct).

34
Figure 12. Repartition of phosphorus water into the surface water in Western Europe. STP
stands for Sewage Treatment Plant (Wind, EWA, 2007).

35
The surface water receives both treated and untreated wastewater from point-sources and
straight nutrients form non point-source. This leads to excess phosphorus, as well as nitrogen,
available in lakes, rivers, and groundwater. In a water body, nutrients have the same functions as
for agricultural uses, they act like fertilizers and enhance algal growth. This excessive algal
development is a dramatic environment threat. In 1992, 19,155 acres of Washington State lake
areas were affected by algal bloom (Department of ecology, 2004). This same study listed three
environmental impacts of algal blooms:
- Loss of swimming, fishing, and aesthetic due to nuisance algal blooms,
periphyton, and macrophyte growth.
- Loss of aquatic life due to dissolved oxygen depletion caused by excess algal and
aquatic macrophyte respiration and decay.
- Loss of drinking water due to odor, clogging of filters, toxins.
2. Phosphorus removal
Efforts made to limit the inputs of phosphorus to water bodies are often unsuccessful due
to the amount of input sources (Wind, 2007). As a result, different technologies have been
developed to undergo the effect of high phosphorus concentration in water. These technologies
are continually being refined. However, they present advantages and disadvantages that must be
taken under account when designing a phosphorus removal process (Table3). Chemical
precipitation and Enhanced Phosphorus Biological Removal (EPBR) are the most documented
and used technologies (Morse et al., 1998).

36
• Chemical precipitation
Chemical precipitation was the first technology developed as an answer to the
eutrophication problems. This physico-chemical reaction is accomplished by adding metal salts
into the wastewater treatment process, primarily in the form of calcium, aluminum and iron.
Phosphorus bonds the salt and forms an insoluble molecule. After a decanting process, the
metallic phosphate is present in a sludge that is used for phosphate recovery. Calcium is a
chemical difficult to use, while aluminum shows a great removal potential but is an expensive
chemical. Thus, chemical precipitation using iron salts appears as the most attractive solution to
phosphorus removal, although it often remains insufficient (Clark et al., 1997). This widespread
process can be supplemented to other removal technologies and applied at different steps of the
wastewater treatment process (Morse et al., 1998). Used during a primary, secondary, or tertiary
treatment, this method offers high water quality.

37
Table 3. Phosphorus removal and recovery technologies. Adapted from Morse et al., 1998.
Phosphorus removal technology
Recovery value Technology advantagesTechnology
disadvantages
Chemical precipitation Low: bound is too strongEstablished technology, high potential, easy to
implement
Low recyclability, sludge production, price
extensive
Enhanced Phosphorus Biological Removal
(EPBR)
Moderate: bound more recyclable
Established technology, no chemical used
Complex technology, sludge handling difficult
Crystallisation High Retrofitting, recyclabilityRequires chemicals, process difficult
Advanced chemical precipitation
Low: possible but difficult to implement
Great potentialRequires chemicals, process difficult
Ion exchange high (struvite)High potential, use of struvite for agriculture
Requires chemicals, process difficult
Magnetic Low High potentialRequires chemicals, process difficult
Phosphorus adsorbents Low Unproven technology
Tertiary filtration NoneEasy to use, proven
technologyNo useful product
Sludge treatments High Sludge value increasedRequires chemicals, process difficult
Recovery from sludge ash
High High recovery Undeveloped technology

38
• Enhanced Phosphorus Biological Removal (EPBR)
EPBR is based on the selective growth of Polyphosphate Accumulating Organisms
(PAO). This method consists of alternating anaerobic and aerobic incubation conditions for PAO
growth in the wastewater. Under anaerobic environments, these organisms use organic matter
and other carbon sources from the wastewater. The energy source comes from previously
stocked intracellular polyphosphates by molecule cleavage. Released phosphates are expulsed
from the cell into the wastewater. The energy generated is used to convert volatile fatty acids
(VFAs) into stored poly-β-hydroxyalkanoates (PHAs) (Oehmen et al., 2007). In the following
tank, under aerobic conditions, the previously stored PHAs are used as a carbon and energy
source for uptake of large quantities of phosphates. Therefore, polyphosphates are synthesized
and stored within the organism. The final step is to remove the biomass from the wastewater.
• Limitations
Although chemical precipitation is a simple process to implement, it remains an
expensive and highly sludge productive process. The cost of the chemical precipitation is 15% of
the total costs of exploitation against 1-2% for EPBR (GLS, 2006). As a result, chemical
precipitation is not adapted to high capacity wastewater treatment plants whereas EPBR seems to
be an adapted method. However, due to insufficient knowledge on microbial metabolism,
environmental or wastewater factors are likely to disturb growth and therefore reduce efficiency
(Morse et al, 1998). The process must be monitored, which increases costs. The plant
configuration is complex and expensive. EPBR efficiency depends also on phosphorus load in
wastewater and presents an overall efficiency between 50% and 60% against 80% for chemical
precipitation. Using a coupled chemical and biological method enhances performances and

39
shows 7.5% of the total exploitation costs (GLS, 2006). Both methods present a low to moderate
phosphorus recovery potential (Morse et al, 1998). Even though EPBR recovery potential is in
theory higher than chemical precipitation, a lack of study in this field makes it difficult to assess
for both agricultural and industrial use.
3. Phosphorus Recovery
Current focus is on phosphorus recovery for reuse in both agriculture and industry.
Phosphorus originates from phosphate rock, a source that is currently depleting at high rate.
Several technologies have been studied and demonstrate potential for phosphorus recycling.
These technologies however are not well developed, resulting in difficult implementation and
leading to expensive processes and poor recovery potential (Morse et al., 1998; de-Bashan et al.,
2004). Literature indicated struvite as having the greatest potential for phosphorus recovery,
since it forms spontaneously in wastewater treatment environments under specific conditions
(Stratful et al., 2001). Sturvite is often higher quality than phosphate rock and sludge containing
struvite from wastewater treatment can be directly applied to fields. Recovery of phosphorus
from iron or aluminum oxides appears difficult because phosphorus binds tightly to these
substrates.
4. Iron Cycle (Oxidation/Reduction)
Iron is the fourth most abundant element in the Earth crust. It is naturally present under
two states of oxidation, Fe(II) (ferrous iron) and Fe(III) (ferric iron). Both chemical and biologic

40
reactions can transfer these cations from one to another in the process called iron cycle. Ferrous
iron is oxidized into ferric iron, whereas ferric iron is reduced into ferrous iron. These reactions
take place in marine and freshwater environments, such as lake sediments, aquifers, soils,
wetlands, deep-sea vent environments and in man-made settings, like mine tailings
impoundments (Fortin and Langley, 2005).
• Iron oxidation
The iron oxidation is known to occur naturally and spontaneously with oxygen.
Otherwise, Ferrous-Oxidizing Bacteria (FeOB) are involved in the increase of iron oxidation
rates. FeOB do not simply compete with the natural process, they also accelerate the oxidation
rates up to 18% (Neubauer et al., 2007). Leptothrix or Gallionella are iron oxidizers that thrive
under neutral pH conditions. This process occurs at the interface between the oxic and anoxic
zone. Iron oxidizing bacteria influence Fe(II) oxidation kinetics at circumneutral pH and very
low oxygen concentrations in the interface (Weiss et al., 2007). As ferrous iron oxides almost
spontaneously with oxygen, bacteria use it as soon as it is released from the anoxic zone.
Sideroxydans paludicola is shown to thrive under microaerobic conditions in the Fe(II) rich
rhizosphere (Neubauer et al., 2007). This organism is contributing to the formation of iron oxides
on the plant roots. The iron oxide produced forms insoluble ferric hydroxide Fe(OH)3. The
overall reaction of oxidation is:
Fe2+ + H+ + 0.25 O2 Fe3+ + 0.5 H2O Fe(OH)3

41
At neutral pH, the reaction releases energy (E0’=0.77V). At lower pH, the reaction is less
energetic but still releases energy (E0’=0.2V at pH=2).
Under acidic conditions, the Fe2+ ion is stable and thus does not oxidize spontaneously.
Acidophilic chemolithotrophs as Acidithiobacillus ferrooxidans are known to precede this
reaction. Leptosprillum ferroxidans is known to oxidize ferrous iron as well. As this reaction is
less energetic, large amounts of ferric irons have to be reduced to produce enough energy for
microbial life.
Besides, a phylogenetically diverse group of bacteria is shown to gain energy from
anaerobic iron oxidation assessing the following reaction (Weber et al., 2006).
HCO3- + 4 Fe(II) + 10 H2O + hν CH20 + 4 Fe(OH)3 + 7 H+
This oxidation utilizes light energy to fix CO2 into biomass. No Achaea has been so far
shown to assess that phototrophic reaction. However, various archaeal and bacterial genera are
able to oxidize Fe(II) anaerobically in presence of nitrate. Thus, these organisms are suspected to
be involved in both iron and nitrogen cycles. Even if that process has a minor impact on the
terrestrial environment global iron cycles, it has been shown to have a significant local impact on
iron redox cycling and mineral weathering.
• Iron reduction
The very ancient form of life rose 3.8 billon years ago from the hot, photochemical
generation of Fe(III) and H2, that were respectively electron acceptor and energy source (Vargas
et al., 1998). Thus, iron respiration may have been the first form of microbial metabolism before
42
development of oxygen, nitrate and sulphate respiration (Weber et al., 2006). Under anoxic
conditions, some iron oxides undergo iron reduction as a result of abiotic reactions or microbial
anaerobic respiration. The reduction potential of the Fe3+/Fe2+ couple is lightly electropositive
(E0’=0.2V at pH=7). Ferric iron is an electron acceptor for energy metabolism of both
chemoorganotrophic and chemolithotrophic bacteria in anaerobic respiration. Electrons travel
through the electron transport chain that terminates in a ferric iron reductase system. This
electron flow produces a proton motive force that generates ATP. Shewanella putrefaciens,
Geobacter, Geospirrillum, and Geovibrio are known to be iron reducers (Madigan and Martinko,
2006). S. putrefaciens is a facultative anaerobe and substitutes Fe(III) for oxygen as a terminal
electron acceptor to gain energy for growth and metabolism (Nealson and Saffarini, 1994). Then
the same bacteria is able to use both natural organic matter (NOM) and Fe(III) as a terminal
electron acceptor.
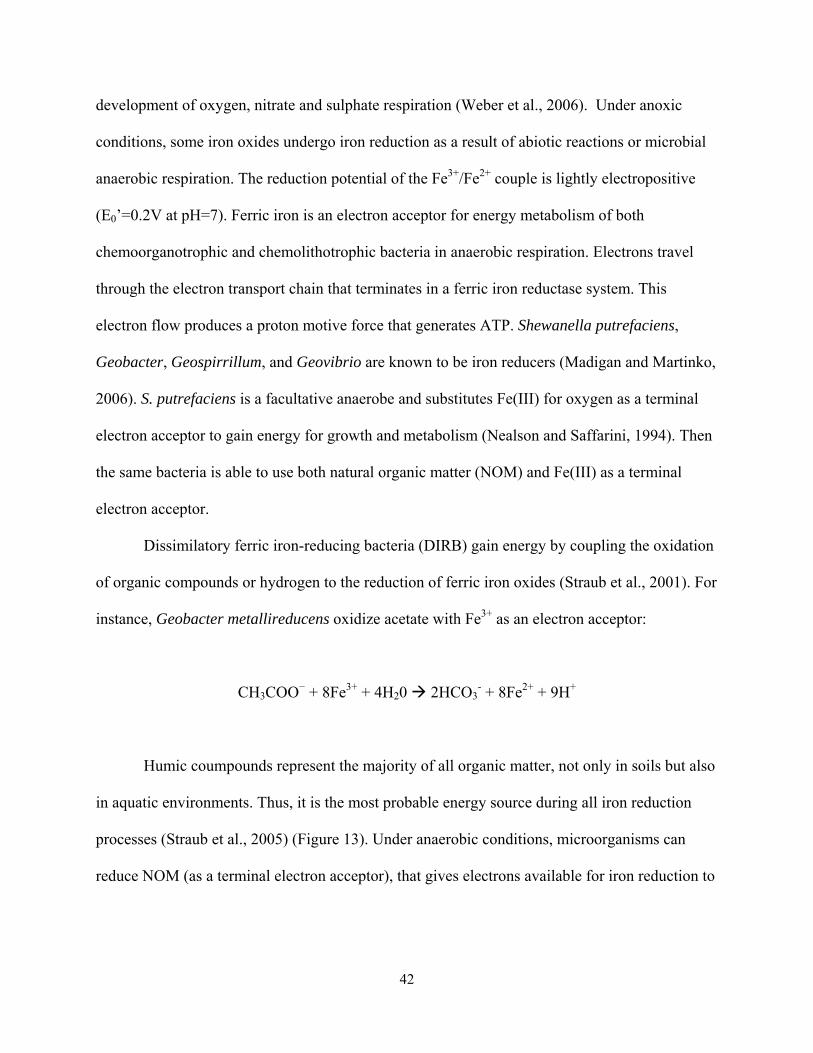
Dissimilatory ferric iron-reducing bacteria (DIRB) gain energy by coupling the oxidation
of organic compounds or hydrogen to the reduction of ferric iron oxides (Straub et al., 2001). For
instance, Geobacter metallireducens oxidize acetate with Fe3+ as an electron acceptor:
CH3COO− + 8Fe3+ + 4H20 2HCO3- + 8Fe2+ + 9H+
Humic coumpounds represent the majority of all organic matter, not only in soils but also
in aquatic environments. Thus, it is the most probable energy source during all iron reduction
processes (Straub et al., 2005) (Figure 13). Under anaerobic conditions, microorganisms can
reduce NOM (as a terminal electron acceptor), that gives electrons available for iron reduction to

reduce Fe
than the a
Figure 1in their relead to thsubstancethey com
A
occurs bi
thrive at
condition
within w
in water.
either by
released
e2+ ions. Bio
abiotic reduc
3. Biologicaespiratory pahe fromationes. The redu
me into conta
•
As we have s
iotically or a
the interface
ns, the iron r
ater if it stic
It would lik
direct respir
and ready to
ogically med
ction at circu
ally induced athway orga
n of carbon duced humic sact.
Relation b
een previous
abiotically. F
e between ox
respiration le
cks to bacteri
kely sinks in
ration or by
o approach th
diated reduct
um neutral p
abiotic iron anic matter, sdioxide and tsubstances ar
between iron
sly, in freshw
FeOBs that o
xic and anox
eads to the fo
ial sheaths (L
the sedimen
abiotic redu
he oxic zone
43
tion of Fe(III
pH (Chen et
reduction. Dsuch as carbothe electron ire able to ab
n oxidizing an
water habita
oxidized Fe(
xic environm
ormation of
Leptothrix o
nt anoxic zon
uction. Then,
e to be once
I) ions can b
al., 2003).
Dissimilatoryonhydrate, ais used to th
biotically red
nd iron redu
ats, both part
(II) into inso
ments. Under
ferric iron. I
or gallionella
ne where it w
, the free sol
again oxidiz
be orders of m
y iron-reducas the energye reduction o
duce Fe(III) t
ucing bacteri
ts of the iron
oluble Fe(III)
r these micro
It can stay in
a) or released
would be red
luble iron ox
zed (Figure 1
magnitude fa
cing bacteria y source. Thiof humic to Fe(II) whe
a
n cycle can
) are likely t
oaerobic
n suspension
d as a free io
duced by DIR
xide (Fe(II))
14).
faster
use is
en
to
n
ons
RB
is
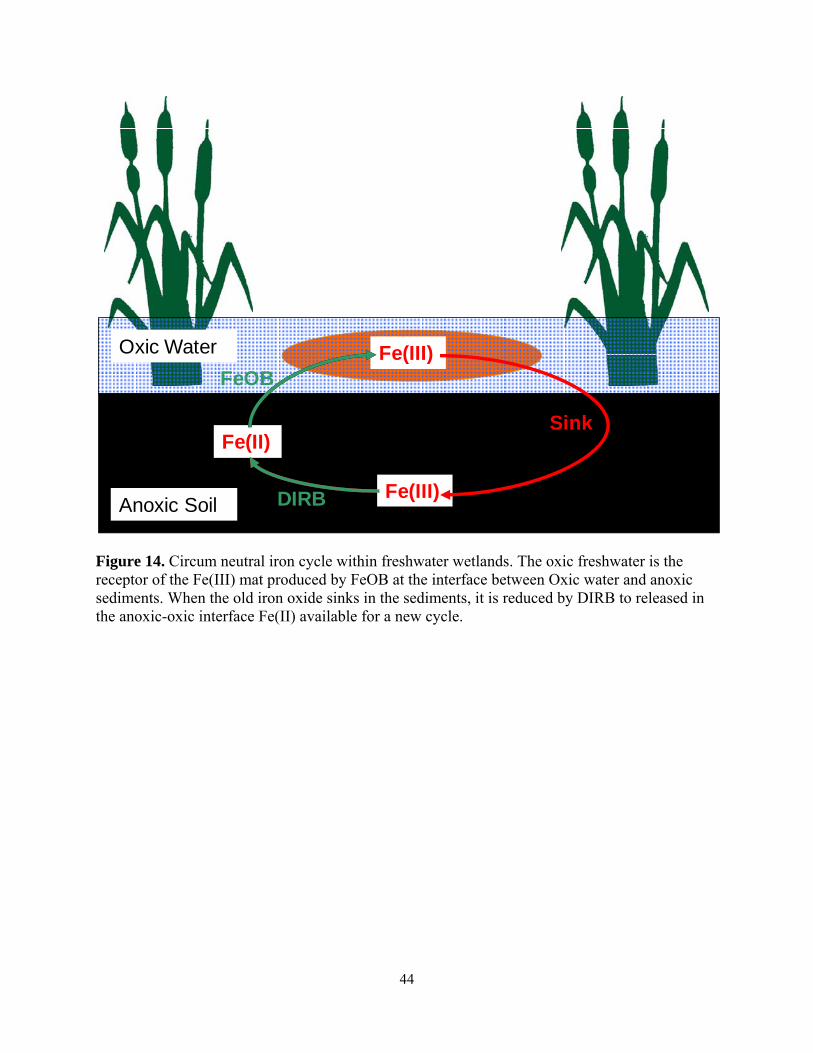
44
Figure 14. Circum neutral iron cycle within freshwater wetlands. The oxic freshwater is the receptor of the Fe(III) mat produced by FeOB at the interface between Oxic water and anoxic sediments. When the old iron oxide sinks in the sediments, it is reduced by DIRB to released in the anoxic-oxic interface Fe(II) available for a new cycle.
Fe(II)
Fe(III)
Anoxic Soil
Oxic Water
Sink
DIRB
FeOB
Fe(III)

45
5. FeOB habitats and diversity
Table 4 references five different iron oxidizing bacteria studied by five scientific journal
articles. For each bacteria, sampling site characteristics and laboratory growth requirements are
compared. All referenced bacteria are freshwater growing bacteria growing at either circum-
neutral pH (7.1 – 7.6) or acidic pH (4.0 – 4.5). However, under laboratory conditions, life can be
maintained with a larger pH range (4.5 – 7.2) for most bacteria. Site water temperature is less
than 14ºC. These organisms are thus psychrophiles but are grown in laboratory under warmer
temperatures (13 - 37ºC). They all require a low oxygen concentration, close to anoxia, and use
an opposite gradient between iron and oxygen for their respiratory pathway. Light appears to be
an important for bacterial growth as well. Some of them need total obscurity whereas others
grow under light alternation.
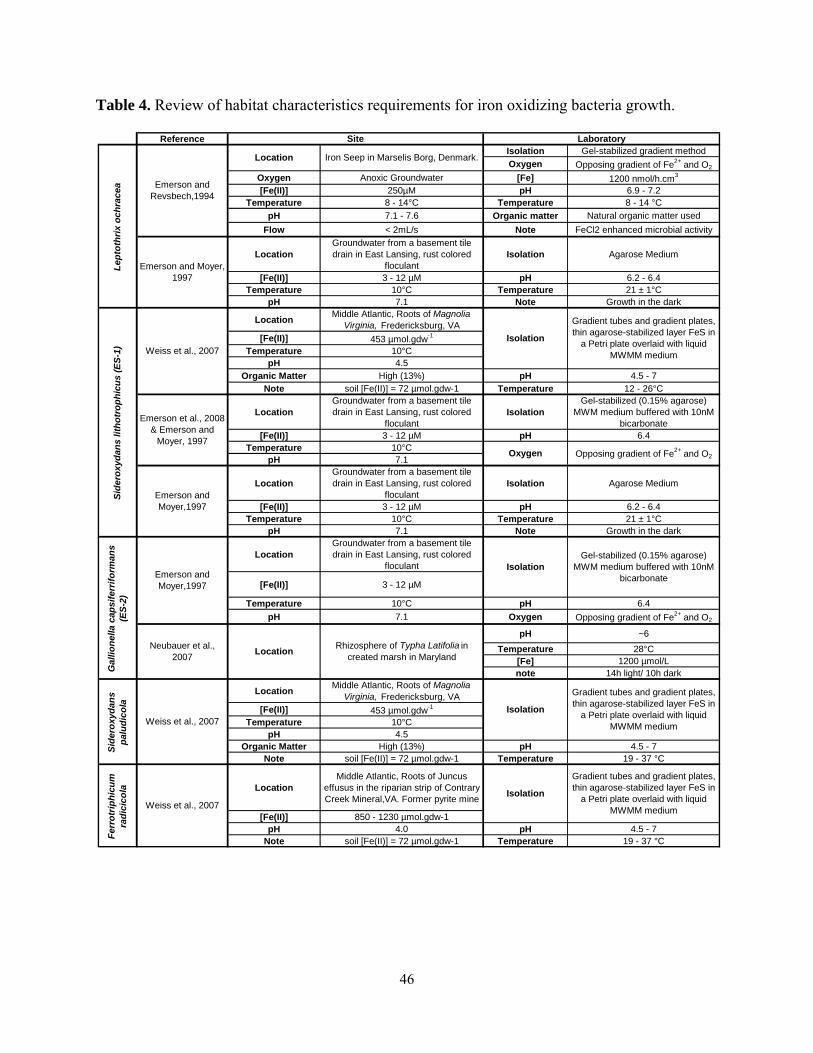
46
Table 4. Review of habitat characteristics requirements for iron oxidizing bacteria growth.
ReferenceIsolation Gel-stabilized gradient methodOxygen Opposing gradient of Fe2+ and O2
Oxygen Anoxic Groundwater [Fe] 1200 nmol/h.cm3
[Fe(II)] 250µM pH 6.9 - 7.2Temperature 8 - 14°C Temperature 8 - 14 °C
pH 7.1 - 7.6 Organic matter Natural organic matter usedFlow < 2mL/s Note FeCl2 enhanced microbial activity
LocationGroundwater from a basement tile drain in East Lansing, rust colored
floculantIsolation Agarose Medium
[Fe(II)] 3 - 12 µM pH 6.2 - 6.4Temperature 10°C Temperature 21 ± 1°C
pH 7.1 Note Growth in the dark
Location Middle Atlantic, Roots of Magnolia Virginia, Fredericksburg, VA
[Fe(II)] 453 µmol.gdw-1
Temperature 10°CpH 4.5
Organic Matter High (13%) pH 4.5 - 7Note soil [Fe(II)] = 72 µmol.gdw-1 Temperature 12 - 26°C
LocationGroundwater from a basement tile drain in East Lansing, rust colored
floculantIsolation
Gel-stabilized (0.15% agarose) MWM medium buffered with 10nM
bicarbonate[Fe(II)] 3 - 12 µM pH 6.4
Temperature 10°CpH 7.1
LocationGroundwater from a basement tile drain in East Lansing, rust colored
floculantIsolation Agarose Medium
[Fe(II)] 3 - 12 µM pH 6.2 - 6.4Temperature 10°C Temperature 21 ± 1°C
pH 7.1 Note Growth in the dark
LocationGroundwater from a basement tile drain in East Lansing, rust colored
floculant
[Fe(II)] 3 - 12 µM
Temperature 10°C pH 6.4pH 7.1 Oxygen Opposing gradient of Fe2+ and O2
pH ~6
Temperature 28°C[Fe] 1200 µmol/Lnote 14h light/ 10h dark
Location Middle Atlantic, Roots of Magnolia Virginia, Fredericksburg, VA
[Fe(II)] 453 µmol.gdw-1
Temperature 10°CpH 4.5
Organic Matter High (13%) pH 4.5 - 7Note soil [Fe(II)] = 72 µmol.gdw-1 Temperature 19 - 37 °C
LocationMiddle Atlantic, Roots of Juncus
effusus in the riparian strip of Contrary Creek Mineral,VA. Former pyrite mine
[Fe(II)] 850 - 1230 µmol.gdw-1pH 4.0 pH 4.5 - 7
Note soil [Fe(II)] = 72 µmol.gdw-1 Temperature 19 - 37 °CFerr
otrip
hicu
m
radi
cico
laLe
ptot
hrix
och
race
aSi
dero
xyda
ns li
thot
roph
icus
(ES-
1)G
allio
nella
cap
sife
rrifo
rman
s (E
S-2)
Side
roxy
dans
pa
ludi
cola Isolation
Location Rhizosphere of Typha Latifolia in created marsh in Maryland
Weiss et al., 2007
Emerson et al., 2008 & Emerson and
Moyer, 1997
Gradient tubes and gradient plates, thin agarose-stabilized layer FeS in
a Petri plate overlaid with liquid MWMM medium
Isolation
Gradient tubes and gradient plates, thin agarose-stabilized layer FeS in
a Petri plate overlaid with liquid MWMM medium
Gradient tubes and gradient plates, thin agarose-stabilized layer FeS in
a Petri plate overlaid with liquid MWMM medium
IsolationGel-stabilized (0.15% agarose)
MWM medium buffered with 10nM bicarbonate
Isolation
Opposing gradient of Fe2+ and O2
Site Laboratory
Emerson and Moyer, 1997
Emerson and Revsbech,1994
Location Iron Seep in Marselis Borg, Denmark.
Weiss et al., 2007
Emerson and Moyer,1997
Emerson and Moyer,1997
Neubauer et al., 2007
Weiss et al., 2007
Oxygen

47
6. Focus on Gallionella
The Genus Gallionella is a group of β-proteobacteria. Gallionella ferruginea specifically,
is a chemolithotroph that thrives at the interface of oxic-anoxic conditions in aquatic systems.
This organism microaerobically oxidizes iron present in water as an energy source under circum-
neutral conditions. The product of this metabolism is an insoluble ferric hydroxide that forms
with excreted polymers a helical, stalk-like filament formed by the kidney-shaped cells (Emerson
and Moyer, 2002). Unlike Leptothrix ochracea, bacteria discussed later, Gallionella ferruginea
can be cultured in the laboratory. These organisms are found in various aquatic environments
and isolation methods as well as growth conditions are well documented (Emerson and Moyer,
1997; Emerson and Moyer, 2002; Neubauer et al., 2007).
7. Focus on Leptothrix
The genera Leptothrix belongs to the Sphaerotilus-Leptothrix group (Van Veen et al.,
1978). The literature classifies this group as the third of iron oxidizing bacteria after the
autotrophic, obligatory aerobic, acidophilic Thiobacillus ferrooxidans and the microaerophilic
autotrophic Gallionella ferruginea. Leptothrix is a gram-negative and autotrophic
betaproteobacterium occurring in slowly running ferrous iron-containing water poor in readily
decomposable organic material. Nothing is known yet concerning the mobility mechanisms of
the cells. However, a gliding movement can not be excluded. As most of the bacteria from this
group, Leptothrix is known to produce a sheath of extracellular iron oxides. These bacteria are
considered to take energy from the oxidation of soluble Fe2+ cations into insoluble Fe3+ cations.
They likely utilize a great variety of organic carbon compounds as a carbon source such as
glucose, fructose, maltose, lactose, methanol, ethanol, acetate, or butyrate.

48
Leptothrix bacteria use also ammonia and nitrate as sole nitrogen source. Then, they
precipitate the iron oxide sheath such as twisted stalk or curved sheaths (Hashimoto et al., 2007).
This study stated that the sheath has an aspect ration (diameter-length) of 10-200. The hollow
sheath thickness is in average 150 nm (Figure 15). Thus, nanoparticles are involved in the sheath
composition. Those observations are shown by several pictures from the high-magnification
scanning electron microscopy. The chemical composition was finally Fe:Si:P = 80:15:5 with the
exception of oxygen, distributed uniformly. A study on the structure of the Leptothrix
discophora SP-6 added the hypothesis that this layer is covered by a diffuse outer capsular layer
of variable thickness. This second layer is a heteropolymer made of 6.5 nm diameter
heteropolysaccharide fibrils tightly associated (uronic acids and amino sugars) and covalently
linked to excreted protein involved in oxidation of both iron and manganese (Emerson and
Ghiorse, 1992). In addition, this layer has a high cationic metal-binding affinity due to the net
negative charge of the uronic acid residues (Emerson and Ghiorse, 1993). This sheath has
beneficial functions such as accumulation of nutrients, attachment, and regulation of positioning
in the environment.
Gallionella ferruginea and Leptothrix ochracea share metabolism similarities. The
environmental interest is on the potential of these biogenic iron oxides to adsorb phosphorus
(Rentz et al., 2008).

49
Figure 15. (a) Low- and (b) high-magnification of Leptothrix Ochracea sheath by scanning electron microscopy (from Hashimoto et al., 2007).

50
APPENDIX C STANDARD OPERATING PROCEDURES

51
Iron Oxide Characterization
Standard Operating Procedures (SOPs)
Washington State University
Center for Environmental, Sediment, and Aquatic Research (CESAR)
C/o Jeremy A. Rentz
Sloan Hall
Pullman, WA, 99164
Created by: Antoine Cordray, Graduate Research Assistant Date: May 08, 2008
Adapted from: Ian Turner, Graduate Research Assistant Date: November 30, 2007.
Reviewed by: Jeremy A. Rentz, Assistant Professor Date: May 20, 2008
Civil and Environmental Engineering

52
A. Scope and Application: The procedures used here apply to microbial iron mat field collection and laboratory
activities for the CESAR group of Washington State University. Procedures outlined include
field sample collection, transportation, and sample characterization.
B. Objectives: The objective of this SOP is to provide consistent, well defined methods for use in
multiple research applications.
C. Field Sampling & Data Collection:
I. Site Location: Biogenic iron-oxides are typically located where Fe2+ sources are met with an aquatic
interfacial zone. Possible attributes include:
• Mountainous areas
• Streams and seeps
• Orange flocculent indicative of oxidized iron
II. Equipment: The following equipment is to be considered for each sampling trip although each item
may not be necessary depending on the situation.

53
Copy of SOP
FOX Record Sheets
Backpack
Field Notebook
Clipboard
Labeling tape & Marker
Pencil/Pen
Automatic Pipetter, 5mL and 50mL Pipettes
Method or apparatus for scooping sample
Jars for transporting and storing samples
Thermometer & Field pH meter
15 mL Falcon Tubes & FerroVer Pillows for Iron Test
Scissors
Ice chest with ice
Waders
Sunscreen
Bug repellant
III. Field Site Characterization: Specific data needs to be collected at the sampling site in order to improve
characterization of the iron-oxides. This data is to be recorded on the FOX sheets with one sheet
used per sample.

54
Record the following on the FOX sheet for each sample:
• Sample name, date, & time
• Site description including specific location & weather.
• Names of those on the sampling trip
Label each container with the following FOX sheet information:
• Location prefix and number (ex. Y2B for Yakima 2, sample B)
• Date
• Sampler’s initials
Record the following site characterizations on each FOX sheet:
• Field pH level
• Field temperature
IV. Field Sampling Procedures: Field samples collected from a body of moving water should be performed starting at the
downstream end of the site and working upstream. This method is employed to ensure that
samples are not impacted by previous sample disturbances. It should be noted that 1L of sample
is required to perform one desired characterization analysis. If the three experiments (Batch
equilibrium, PABE, and phosphorus recovery) are being investigated, three liters of sample are
needed.

55
• Field pH:
o Place field pH meter in water and allow to equilibrate
• Field Temperature:
o Place thermometer near collection site and allow for equilibration
• Field aqueous Fe concentration (n=3):
o Pipette 5mL of near collection site water into 15mL reaction tube
o Add 1 FerroVer powder pillow to each tube and shake (Hach#8008)
o Cap tube for transportation with analysis to be performed in the lab
• Iron sample collection:
o Use 50 mL pipette to withdraw aqueous iron sample from site
o Do not pipette sediments. Try to disturb iron oxide biofilm as less as possible
o Transfer sample to 1L sample container
o Repeat process until the desired 1L is achieved
o Allow sample to settle, decant, and add more raw sample.
o Place samples on ice for transport to the laboratory refrigerator

56
D. Laboratory Data Collection Material
- Sample Characterization
- 1L jar of freshly sampled material
- 15 x 50 mL tubes
- 20 x 15mL tubes
- 3 x Phosphorus vials and pillow for HACH method 8048
- 5mL, 10mL, 25mL and 50mL Pipettes
- 0-20µL, 0-200µL, 0-1000µL tips for micropipettes
- DNA microtubes
- Slides and cover glass for microscope study
- 1mL of 10 µg/L Acridine Orange solution (2µL of AO solution in 20mL DI water)
- 300 mL of 0.25M Oxalic Acid solution(Add 11.03g of Oxalic acid powder in 500 mL DI
water)
- 20 mL of 1M NaHCO3 solution (20.985g of powder NaHCO3 in 250 mL DI water)
- FerroVer powder pillow for HACH method 8008
- 8 aluminum dishes
- Sample Washing
- 2 x 50ml tubes
- 700mL of 0.1M saline wash (700 mL DI water + 4.09 g NaCl + autoclave) or,
- 700 mL buffered saline wash (700mL of 0.1M saline wash + 0.588g of NaHCO3 powder)

57
- Batch Equilibrium
- 800 mL of washed sample at leat
- 40 x 50mL tubes
- 1 x 2mL microtube
- 40 x Phosphorus vials and pillow for HACH method 8048
- 35 mL of 1g/L PO4 solution (Add 0.4584g of K2HPO4 powder to 250mL DI water)
- 5mL, 10mL, 25mL and 50mL Pipettes
- 0-20µL, 0-200µL, 0-1000µL tips for micropipettes
- pH Adujsted Batch Equilibrium (PABE)
- 800 mL of washed and buffered sample at least
- 30 x 50mL tubes
- 30 x Phosphorus vials and pillow for HACH method 8048
- 6 x 250 mL Erlenmeyers
- 100 mL of 1g/L PO4 solution (Add 0.4584g of K2HPO4 powder to 250mL DI water)
- 50 mL of 0.1M HNO3 solution (665µL of nitric acid in 150 mL DI water)
- 5 mL of 0.1M NaOH solution (0.6g of NaOH powder in 150mL DI water)
- Phosphorus Recovery
- 800 mL of washed sample at least
- 16 x 50mL tubes
- 80 x Phosphorus vials and pillow for HACH method 8048
- 16 x 250 mL Erlenmeyers

58
- 55 mL of 1g/L PO4 solution (Add 0.4584g of K2HPO4 powder to 250mL DI water)
- 500 mL of 0.01M NaOH solution (0.4g of NaOH powder in 1L DI water)
- 500 mL of 0.01M KCl solution (0.7445g of KCl powder in 1L DI water)
- 500 mL of 0.1M NaCl saline solution (700 mL DI water + 4.09 g NaCl + autoclave)
- 20mL of 0.3M MES buffer solution (5.856g of MES powder in 100mL DI water)
Upon returning to the lab, be careful to label all experimental containers in a manner
consistent with the original field samples. Perform the following experiments sequentially on
each sample in order to characterize the samples. Record all experimental results on the
corresponding FOX record sheet. Batch equilibrium, PABE, and phosphorus recovery analysis
may be performed in conjunction with characterization experiments.
I. Pre-Wash Sample Characterization: Perform the following laboratory characterizations prior to washing to obtain information about
the natural sample. Transfer 100mL of natural sample to 2 x 50mL Falcon tubes for pre-wash
characterization (tube 1 and 2). Experience on tube 1 can be made directly since the sample has
to be well mixed. Let settle tube 2 overnight. Allow remaining sample to settle.
- Tube 1: Mixed sample
1: pH:
- Use pH meter to analyze.
2: Total Fe (n=3):
- Add 1mL mixed sample and 49mL of 0.25M oxalic acid to 50mL tubes
- Allow oxalic acid digests to sit overnight
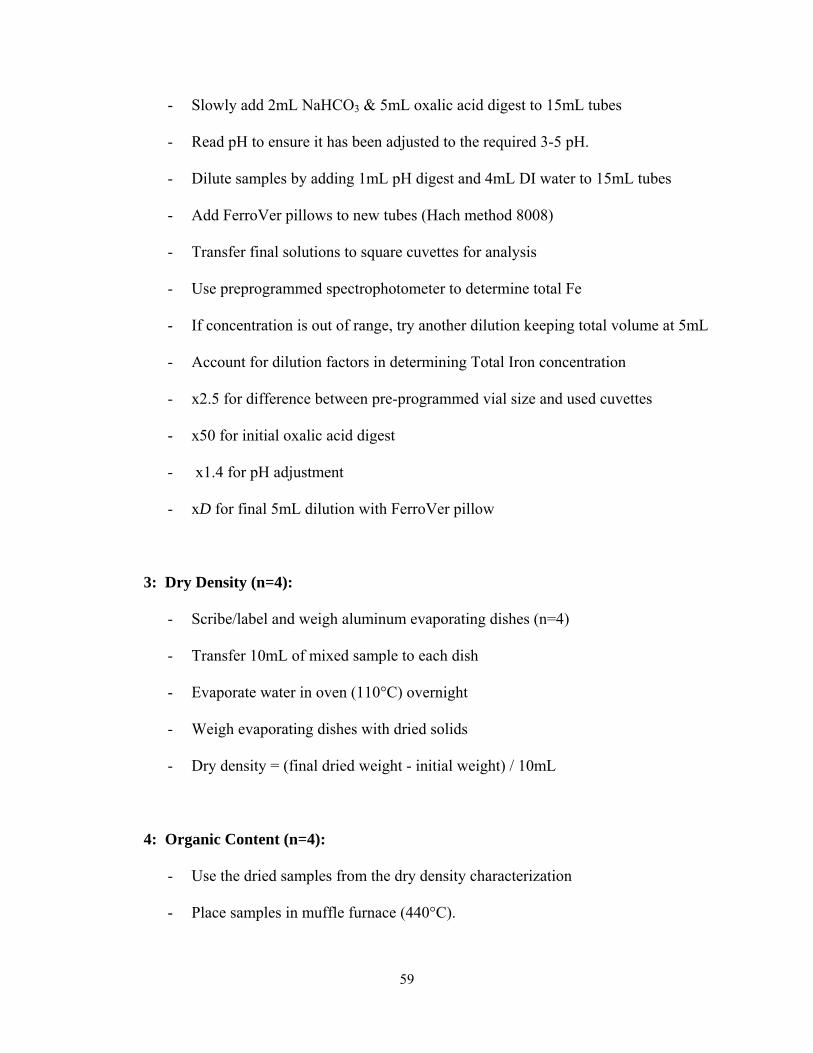
59
- Slowly add 2mL NaHCO3 & 5mL oxalic acid digest to 15mL tubes
- Read pH to ensure it has been adjusted to the required 3-5 pH.
- Dilute samples by adding 1mL pH digest and 4mL DI water to 15mL tubes
- Add FerroVer pillows to new tubes (Hach method 8008)
- Transfer final solutions to square cuvettes for analysis
- Use preprogrammed spectrophotometer to determine total Fe
- If concentration is out of range, try another dilution keeping total volume at 5mL
- Account for dilution factors in determining Total Iron concentration
- x2.5 for difference between pre-programmed vial size and used cuvettes
- x50 for initial oxalic acid digest
- x1.4 for pH adjustment
- xD for final 5mL dilution with FerroVer pillow
3: Dry Density (n=4):
- Scribe/label and weigh aluminum evaporating dishes (n=4)
- Transfer 10mL of mixed sample to each dish
- Evaporate water in oven (110°C) overnight
- Weigh evaporating dishes with dried solids
- Dry density = (final dried weight - initial weight) / 10mL
4: Organic Content (n=4):
- Use the dried samples from the dry density characterization
- Place samples in muffle furnace (440°C).

60
- Allow samples to heat for 24 hours
- Place samples in dessicator to cool for 20 minutes
- Weigh samples to determine inorganic weight
- Tube 2: Settled sample
5: Aqueous Phosphorus Concentration (n=1):
- Withdraw 5mL of supernatant from the settled sample solution
- Analyze P concentration using Hach method 8048
6: DNA/RNA Extraction:
- Perform immediately
- Extract 500μL of solids from sample by filling a 2mL microtube, centrifuging,
and getting rid of the supernatant multiple times
- Use the MO Bio Kit and procedure to extract DNA from sample solids
- Freeze extractions at -85°C
7: Photographs of Iron-oxides:
- Add 50 to 100µL of the specimen to a clean glass slide
- Add a drop of Acridine Orange (10 to 20µg/mL) to the specimen drop
- Mix to make it spread homogeneously using the pipette tip extremity
- Add a cover glass. Let one side of the cover glass touch the slide first. The
solution is going to spread on this side. Then, let the cover slide drop to avoid air
bubbles.

61
- Turn on microscope (Arclamp power supply, LEP Ltd)(Figure 1. A), camera (RT
power supply, SPOT) (Figure 1. B), polarized light (Figure 1. C) and computer
- Place glass slide on the microscope
- Rotate numerated disk and select the position 3 (fluorescence) (Figure 1. D)
- Localize an appropriate view using 10x and 40x objectives
- Add a drop of immersion oil on the cover slide and select the 100x objective
- Increase or decrease light intensity to allow more or less fluorescence
(Figure 1. F)
- Find appropriate settings to produce a desired image
- Set the vision screw either on “camera” (image just on camera) or on “50/50”
(image for user and camera) to allow camera to get the image (Figure 1. E)
- Open the software “SPOT advanced”. The shortcut is on the desktop
- On the bottom right corner, select the mode “ACAO” (Figure 2. H)
- Click on the button “get image” on the right side of the screen (Figure 1. G) or
push F9
- The settings might change during the capture of the picture. Make sure that the
clarity of the image stays the same during the capture
II. Sample Washing: Washing may be performed on a field sample in order to remove uncertainties associated
with the composition of the in situ water.
- Allow sample to settle for a period of 24 hours
- Remove supernatant by pipetting without removing any solids

62
- Save 2 x 50mL of supernatant in reaction tubes at 4°C.
- Fill sample container back up with:
- Saline solution to total volume of 1L for batch equilibrium or phosphorus
recovery analysis
- Buffered saline solution to total volume of 1L for PABE analysis
- Transfer 100mL of mixed washed sample in two Falcon 50mL tubes
III. Post-Wash Sample Characterization: After washing the sample, perform laboratory procedures 1-5 again with the two previous
tubes and record results on the FOX record sheet.
IV. Batch Equilibrium (n=5) - Add 20ml of washed sample in 40 x 50 mL tubes
- Add the amount of DI water and 1g/L PO4 solution given by the FOX sheet
- Place reactor tubes on the inversion rack for a period of 24 hours on setting #3
- Centrifuge reactor tubes at 4100 rpm during 10 minutes
- Test phosphorus in supernatant content using Hach method 8048
V. pH Adjusted Batch Equilibrium (PABE) (n=5) - Record pH of the buffered and washed sample
- Add 110mL to 6 clean Erlenmeyer
- Realize the following adjustment:
Erlenmeyer 1: add 2 mL of 100mM NaOH buffer solution
Erlenmeyer 2: add 1.5 mL of 100mM HNO3 buffer solution

63
Erlenmeyer 3: add 3.1 mL of 100mM HNO3 buffer solution
Erlenmeyer 4: add 8.1 mL of 100mM HNO3 buffer solution
Erlenmeyer 5: add 11 mL of 100mM HNO3 buffer solution
Erlenmeyer 6: add 15.4 mL of 100mM HNO3 buffer solution
- Shake and measure pH of each Erlenmeyer
- With each Erlenmeyer, add 5 times 20 mL in 50mL tubes
- Add 3.2 mL of Phosphorus stock solution and 26.8 mL of DI water in every tube
- Place reactor tubes on the inversion rack for a period of 24 hours on setting #3
- Centrifuge reactor tubes at 4100 rpm during 10 minutes
- Record pH of each tube
- Test phosphorus content in supernatant using Hach method 8048
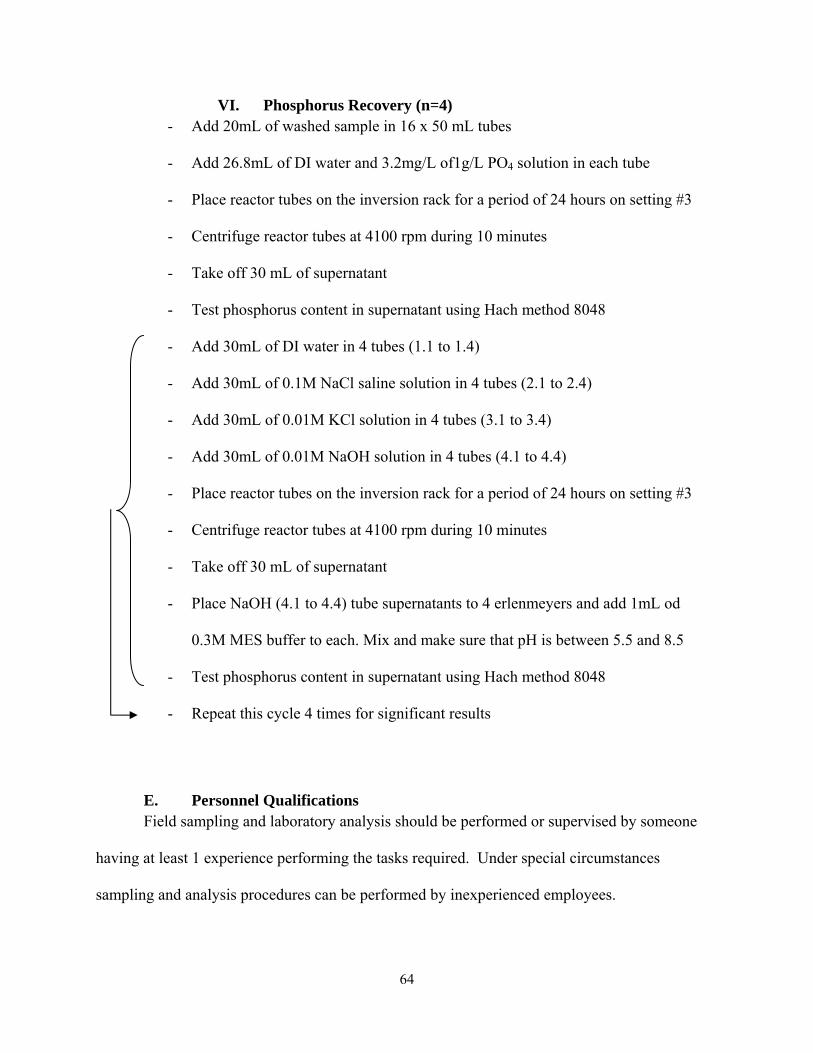
64
VI. Phosphorus Recovery (n=4) - Add 20mL of washed sample in 16 x 50 mL tubes
- Add 26.8mL of DI water and 3.2mg/L of1g/L PO4 solution in each tube
- Place reactor tubes on the inversion rack for a period of 24 hours on setting #3
- Centrifuge reactor tubes at 4100 rpm during 10 minutes
- Take off 30 mL of supernatant
- Test phosphorus content in supernatant using Hach method 8048
- Add 30mL of DI water in 4 tubes (1.1 to 1.4)
- Add 30mL of 0.1M NaCl saline solution in 4 tubes (2.1 to 2.4)
- Add 30mL of 0.01M KCl solution in 4 tubes (3.1 to 3.4)
- Add 30mL of 0.01M NaOH solution in 4 tubes (4.1 to 4.4)
- Place reactor tubes on the inversion rack for a period of 24 hours on setting #3
- Centrifuge reactor tubes at 4100 rpm during 10 minutes
- Take off 30 mL of supernatant
- Place NaOH (4.1 to 4.4) tube supernatants to 4 erlenmeyers and add 1mL od
0.3M MES buffer to each. Mix and make sure that pH is between 5.5 and 8.5
- Test phosphorus content in supernatant using Hach method 8048
- Repeat this cycle 4 times for significant results
E. Personnel Qualifications Field sampling and laboratory analysis should be performed or supervised by someone
having at least 1 experience performing the tasks required. Under special circumstances
sampling and analysis procedures can be performed by inexperienced employees.

65
F. Quality Control
I. Duplicates: Collect duplicate samples every fifth sampling trip in order to ensure that consistent
sampling procedures are being performed. The duplicates should be collected at the same time
as the actual sample and all typical analysis should be performed on it as well.
II. Sample Frequency: For specific field and laboratory characterization tests, multiple samples will be run to
produce more acceptable and precise results. Some such tests will be run with n=4, others with
n=5 samples. Each sample frequency is to be assigned its own number in order to keep the data
organized on the FOX record sheet (4.1, 4.2, etc.).
III. Standards: Make standards for iron and phosphorus spectrophotometry methods. Construct blanks
with the same water used to wash the samples. Make a 2 mg Fe/L sample using a dilution of a
100mg/L stock solution.

Figure
16. Leica DM MLB fluorescence micr
66
oscope pictuure

67
G. Additional Documents: Fe-Oxide (FOX) Record Sheet
FOx Record Sheet (1) Designation:
Sample Name: Sample Information/Description:Date:
Field:pH:Temp: DNA/RNA?:
Photomicrograph?:Aqueous [Fe]: (mg/L) Deep Freeze?:(n=3)
Mean: #DIV/0!St.Dev. #DIV/0! *Total Iron Standard:
Pre-Wash:pH: Dry Density: (g/L) n=1 n=2 n=3 n=4 Mean: St.Dev.P conc: (mg/L) *Empty M: #DIV/0! #DIV/0!
*Dry M: #DIV/0! #DIV/0!Total Fe: (mg/L) *Density: 0 0 0 0 0 0(n=3)Dilution: x Org. Content:(g/L) n=1 n=2 n=3 n=4 Mean: St. Dev.
Mean: #DIV/0! *Initial M: 0 0 0 0 0 0St. Dev. #DIV/0! *Final M: #DIV/0! #DIV/0!
*Org. Content: 0 0 0 0 0 0
Post- Wash:pH: Dry Density: (g/L) n=1 n=2 n=3 n=4 Mean: St.Dev.P conc. (mg/L): *Empty M: #DIV/0! #DIV/0!
*Dry M: #DIV/0! #DIV/0!Total Fe: (mg/L) *Density: 0 0 0 0 0 0(n=3)Dilution: x Org. Content:(g/L) n=1 n=2 n=3 n=4 Mean: St.Dev.
Mean: #DIV/0! *Initial M: 0 0 0 0 0 0St. Dev. #DIV/0! *Final M: #DIV/0! #DIV/0!
*Org. Content: 0 0 0 0 0 0
Batch Equilibrium: [Fe] used per Reactor (mL):P Soln. per Reactor: 1M
Initial [P]: 0.5 1 2 4 8 16 32 64P Stock Reqd: 25u 50u 100u 200u 400u 800u 1.6m 3.2mDI Reqd: 29.975m 29.95m 29.9m 29.8m 29.6m 29.2m 28.4m 26.8m#1#2#3#4#5Dilution:

68
FOx Record Sheet (2) Designation:
PABE: Initial [P] 64 mg/L [Fe] used per Reactor (mL):P Stock Reqd: 3,2mL P Soln. per Reactor: 1MDI Reqd: 26.2 mLpH
Buffer Initial pH #1 #2 #3 #4 #5pH[P] mg/LpH[P] mg/LpH[P] mg/LpH[P] mg/LpH[P] mg/LpH[P] mg/L
15.4mL HNO7
8.1mL HNO5
11mL HNO6
3.1mL HNO4
2mL NaOH1.5mL HNO3
tubeN 1 2 3 4 1 2 3 4t=0t=24t=48t=72t=96tubeN 1 2 3 4 1 2 3 4t=0t=24t=48t=72t=96
A (DI Water) B (0.1M saline solution)
C (0.01M KCl Solution) D (0.01M NaOH solution)
Experiment:Phosphorus Recovery

69
BIBLIOGRAPHY
- Arias, C.A., Del Bubba, M., Brix, H., 2001. Phosphorus removal by sands for use as media in subsurface flow constructed reed beds. Water Research 35, 1159-1168.
- Arias, M., Da Silva-Carballal, J., Garcia-Rio, L., Mejuto, J., Nunez, A., 2006. Retention of phosphorus by iron and aluminum-oxides-coated quartz particles. Journal of Colloid and Interface Science 295, 65-70.
- Ayoub, G.M., Kalinian, H., 2006. Removal of low-concentration phosphorus using a fluidized raw dolomite bed. Water Environment Research 78, 353-361.
- Bastin, O., Janssens, F., Dufey, J., Peeters, A., 1999. Phosphorus removal by a synthetic iron oxide-gypsum compound. Ecological Engineering 12, 339-351.
- Biswas, B.K., Inoue, K., Ghimire, K.N., Harada, H., Ohto, K., Kawakita, H., 2008. Removal and recovery of phosphorus from water by means of adsorption onto orange waste gel loaded with zirconium. Bioresource Technology 99, 8685-8690.
- Boujelben, N., Bouzid, J., Elouear, Z., Feki, M., Jamoussi, F., Montiel, A., 2008. Phosphorus removal from aqueous solution using iron coated natural and engineered sorbents. Journal of Hazardous Materials 151, 103-110.
- Chen, J., Gu, B., Royer, R.A., Burgos, W.D., 2003. The roles of natural organic matter in chemical and microbial reduction of ferric iron. The Science of the Total Environment 307, 167-178.
- Chitrakar, R., Tezuka, S., Sonoda, A., Sakane, K., Ooi, K., Hirotsu, T., 2006. Phosphate adsorption on synthetic goethite and akaganeite. Journal of Colloid and Interface Science 298, 602-608.
- Clark, T., Stephenson, T., Pearce, P.A., 1997. Phosphorus removal by chemical precipitation in a biological aerated filter. Water Research 31, 2557-2563.
- Cornell, R.M. and Schwertmann, U., 2006. The iron oxide: structure, properties, reactions, occurrences, and uses. Wiley-VCH.
- de-Bashan, L.E., Bashan, Y., 2004. Recent advances in removing phosphorus from wastewater and its future use as fertilizer (1997-2003). Water Research 38, 4222-4246.
- Del Bubba, M., Arias, C.A., Brix, H., 2003. Phosphorus adsorption maximum of sands for use as media in subsurface flow constructed reed beds as measured by the Langmuir isotherm. Water Research 37, 3390-3400.
- Emerson, D., Ghiorse, W.C., 1992. Isolation, cultural maintenance, and taxonomy of a sheath-forming strain of Leptothrix discophora and characterization of manganese-oxidizing activity associated with the sheath. Applied and Environmental Microbiology 58, 4001-4010.
- Emerson, D., Ghiorse, W.C., 1993. Ultrastructure and chemical composition of the sheath of Leptothrix discophora SP-6. Journal of Bacteriology 175, 7808-7818.

70
- Emerson, D., Moyer, C., 1997. Isolation and characterization of novel iron-oxidizing bacteria that grow at circumneutral pH. Applied and Environmental Microbiology 63, 4784-4792.
- Emerson, D., Moyer, C.L., 2002. Neutrophilic Fe-oxidizing bacteria are abundant at the Loihi Seamount hydrothermal vents and play a major role in Fe oxide deposition. Applied and Environ Microbiology 68, 3085-3093.
- Emerson, D., Revsbech, N.P., 1994. Investigation of an iron-oxidizing microbial mat community located near Aarhus, Denmark: laboratory studies. Applied and Environmental Microbiology 60, 4032-4038.
- Fortin, D., Langley, S., 2005. Formation and occurrence of biogenic iron-rich minerals. Earth-Science Reviews 72, 1-19.
- GLS, 2006. L’élimination du phosphore présent dans les eaux résiduaires urbaines. Memotec 23.
- Han, J.S., Min, S.H., Kim, Y.K., 2003. Removal of phosphorus using AMD-treated lignocellulosic material. Forest Products Journal 55, 48-53.
- Hashimoto, H., Yokoyama, S., Asaoka, H., Kusano, Y., Ikeda, Y., Seno, M., Takada, J., Fujii, T., Nakanishi, M., Murakami, R., 2007. Characteristics of hollow microtubes consisting of amorphous iron oxide nanoparticles produced by iron oxidizing bacteria, Leptothrix ochracea. Journal of Magnetism and Magnetic Materials 310, 2405-2407.
- Hoffman, F.A., Bishop, J.W., 1994. Impacts of a phosphate detergent ban on concentrations of phosphorus in the James River, Virginia. Water Research 28, 1239-1240.
- Jeon, S.-J., Kim, H.-S., Lee, Y.-W., 2003. Effect of iron media on the treatment of domestic wastewater to enhance nutrient removal efficiency. Process Biochemistry 38, 1767-1773.
- Johansson Westholm, L., 2006. Substrates for phosphorus removal--Potential benefits for on-site wastewater treatment? Water Research 40, 23-36.
- Kreller, D.I., Gibson, G., vanLoon, G.W., Horton, J.H., 2002. Chemical force microscopy investigation of phosphate adsorption on the surfaces of iron(III) oxyhydroxide particles. Journal of Colloid and Interface Science 254, 205-213.
- Lovley, D.R., Holmes, D.E., Nevin, K.P., Poole, 2004. Dissimilatory Fe(III) and Mn(IV) reduction, advances in microbial physiology. Academic Press 49, 219-286.
- Madigan, M.T., Martinko, J.M., Brock, T.D., 2006. Brock biology of microorganisms, 11th ed. Pearson Prentice Hall, Upper Saddle River, NJ.
- Moore, A.W., Hicks, M., Washington (State). Dept. of Ecology., 2004. Nutrient criteria development in Washington State: phosphorus. Washington State Dept. of Ecology, Olympia, WA.
- Morse, G.K., Brett, S.W., Guy, J.A., Lester, J.N., 1998. Review: Phosphorus removal and recovery technologies. The Science of The Total Environment 212, 69-81.

71
- Nealson, K.H., Saffarini, D., 1994. Iron and manganese in anaerobic respiration: environmental significance, physiology, and regulation. Annual Review of Microbioly 48, 311-343.
- Neubauer, S.C., Toledo-Durán, G.E., Emerson, D., Megonigal, J.P., 2007. Returning to their roots: iron-oxidizing bacteria enhance short-term plaque formation in the wetland-plant rhizosphere. Geomicrobiology journal 24, 65 - 73.
- Oehmen, A., Lemos, P.C., Carvalho, G., Yuan, Z., Keller, J., Blackall, L.L., Reis, M.A.M., 2007. Advances in enhanced biological phosphorus removal: From micro to macro scale. Water Research 41, 2271-2300.
- Rentz, J.A., Turner, I.P., Ullman, J.L., 2008. Phosphorus removal using biogenic iron oxides, a regenerable sorbent. Water research (Submitted)
- Rentz, J.A., Kraiya, C., Luther, G.W., 3rd, Emerson, D., 2007. Control of ferrous iron oxidation within circumneutral microbial iron mats by cellular activity and autocatalysis. Environmental Science and Technology 41, 6084-6089.
- Riahi, K., Mammou, A.B., Thayer, B.B., Date-palm fibers media filters as a potential technology for tertiary domestic wastewater treatment. Journal of Hazardous Materials In Press, Corrected Proof.
- Sobolev, D., Roden, E., 2002. Evidence for rapid microscale bacterial redox cycling of iron in circumneutral environments. Antonie van Leeuwenhoek 81, 587-597.
- Sparks, D.L., 1995. Environmental soil chemistry. Academic Press, San Diego. - Stratful, I., Scrimshaw, M.D., Lester, J.N., 2001. Conditions influencing the precipitation
of magnesium ammonium phosphate. Water Research 35, 4191-4199. - Straub, K.L., Benz, M., Schink, B., 2001. Iron metabolism in anoxic environments at near
neutral pH. FEMS Microbiology Ecology 34, 181-186. - Straub, K.L., Kappler, A., Schink, B., 2005. Enrichment and isolation of ferric-iron- and
humic-acid-reducing bacteria. Methods in Enzymology 397, 58-77. - Strauss, R., Brümmer, G.W., Barrow, N.J., 1997. Effects of crystallinity of goethite: II.
Rates of sorption and desorption of phosphate. European Journal of Soil Science 48, 101-114.
- van Veen, W.L., Mulder, E.G., Deinema, M.H., 1978. The Sphaerotilus-Leptothrix group of bacteria. Microbiol Rev 42, 329-356.
- Vargas, M., Kashefi, K., Blunt-Harris, E.L., Lovley, D.R., 1998. Microbiological evidence for Fe(III) reduction on early Earth. Nature 395, 65-67.
- Wathugala, A.G., Suzuki, T., Kurihara, Y., 1987. Removal of nitrogen, phosphorus and COD from waste water using sand filtration system with Phragmites Australis. Water Research 21, 1217-1224.
- Weber, K.A., Achenbach, L.A., Coates, J.D., 2006. Microorganisms pumping iron: anaerobic microbial iron oxidation and reduction. Natural Review Microbiology 4, 752-764.

72
- Weiss, J.V., Rentz, J.A., Plaia, T., Neubauer, S.C., Merrill-Floyd, M., Lilburn, T., Bradburne, C., Megonigal, J.P., Emerson, D., 2007. Characterization of neutrophilic Fe(II)-oxidizing bacteria isolated from the rhizosphere of wetland plants and description of Ferritrophicum radicicola gen. nov. sp. nov., and Sideroxydans paludicola sp. nov. Geomicrobiology Journal 24, 559 - 570.
- Zeng, L., Li, X., Liu, J., 2004. Adsorptive removal of phosphate from aqueous solutions using iron oxide tailings. Water Research 38, 1318-1326.