by bruce hilliard
TRANSCRIPT

Optimising Comprehension and Shaping Impressions
Bruce Hilliard© 2014 Page 1
THE FRAMEWORK FOR UNDERSTANDING LAYOUT PRINCIPLES
By Bruce Hilliard
1.1. What the Research
Indicates
Although layout is influenced by other attributes
listed in preceding and following handouts, the
basic arrangement of the key elements on
the screen can significantly impact on
the efficacy of visual communication
(Wu, Hu, & Shi, 2013). For example, Roberts (2007) identified that layout aspects related to
the organisation and symmetry of the visual elements on a screen is responsible for nearly half
of the perceived complexity of the material. Additionally, the layout can directly affect the
comprehension of the visual information (Seymour, Clifford, Logothetis, & Bartels, 2010;
Wheildon, 1990), the readability of any text (Leykin & Tuceryan, 2004; Pathiavadi, 2009;
Ramadan, 2011; Wästlund, Norlander, & Archer, 2008), the impressions generated by the
material on the screen (Egger, 2001; Mackiewicz, 2008; McGinley, 2009; Surenda, Nikunj, &
Spears, 2005; Um, 2008), and the application of attention (Conci & von Mühlenen, 2009; Jiang
& Chun, 2001; Rothkopf, Ballard, & Hayhoe, 2007).
The importance of layout is best understood by analysing how it is utilised for perception and
cognition. Firstly, the entire gist of a scene (e.g. the entire slide) is typically analysed initially
as a whole entity by viewers(1) (Henderson & Hollingworth, 1999; Henderson, Williams,
1. This appears to take place in a network of regions within the brain, which include the
Parahippocampal Cortex (particularly the Parahippocampal Place Area (PPA)), the Retrosplenial
Cortex (RSC) (Bar, 2004; Dickinson & Intraub, 2009), the Transverse Occipital Sulcus (TOS)
(Ward, MacEvoy, & Epstein, 2010) (see Section 1.4.1.3.1in Appendix 1), and the Perirhinal
cortex (Murray, Bussey, & Saksida, 2007) (See Section 1.4.1.3.7 in Appendix 1). This content
WHAT’S THE POINT? This handout:
is an excerpt from Chapter 2 of my thesis (hence why it refers to other
parts of the thesis in the text);
helps you to understand some key approaches for establishing the right
layout for slides and other material); and
provides an effective foundation for developing all forms of visual and
presentation material.

Optimising Comprehension and Shaping Impressions
Bruce Hilliard© 2014 Page 2
Catstelhano, & Falk, 2003). This assessment appears to generally align to the application of
the Gestalt principles (Wolfe, 2006), but this process may be better explained by a more recent
concept known as Fuzzy-Trace Theory(2) (Reyna, 2012). In either case, significant meaning is
generated through the initial gist analysis of the layout (Tileagă, 2011; Wolfe, Võ, Evans, &
Greene, 2011). For instance, object recognition within a scene is greatly influenced by the
context generated by the gist analysis (Jiang, Sigstad, & Swallow, 2013; Wolfe et al., 2011).
A good example of this is cited in the research by Wolfe et al. (2011), who found that viewers
take significantly longer to locate objects in a scene that are positioned out of context (e.g.
when looking at a kitchen scene, the viewers typically found it more difficult to find bread
positioned in the sink, because this positioning did not align to their semantic knowledge).
To further explain this concept, Sanocki et al. (2006) identified that the processing of the entire
layout appears to be managed at two levels. Firstly, very rapid automatic perceptual processes
(Intraub, Daniels, Horowitz, & Wolfe, 2008) are driven by bottom-up attention, which may be
predominantly processed rapidly through the dorsal stream (Sanocki et al., 2006; Tatler, 2009).
In this initial process up to about 13 visual objects can be assimilated (Sanocki, Sellers,
Mittelstadt, & Sulman, 2010), and these groups of visual elements (arrays/objects) are then
prioritised for top-down attention (Betz, Kietzmann, Wilming, & König, 2010) through overt
or covert shifts (Matsukura, Luck, & Vecera, 2007). Detailed analysis, and the development
of more comprehensive representations is then implemented as a part of a top-down attention
driven approach (Sanocki et al., 2006). Therefore, as cited by Noiwan and Norcio (2006)
layout is a highly important feature in shaping attention, because it helps to define how viewers
assess individual elements on the screen.
Good layout should therefore facilitate perception, cognition (Cavanagh, 2011), and the
generation of attention (Pettersson, 2010; Wolfe et al., 2011). Additionally, the layout should
also be designed to be rich and appealing, so the gist can help to generate positve attitudes
(Agarwal & Karahanna, 2000). The following sections describe STEP based findings that can
be applied to support these objectives.
is also mixed with semantic information from the hippocampi within the frontal cortex to finalise
the contextual analysis of the gist (Bar, 2004) (see Section 1.4.3.3 in Appendix 1). Therefore
gist affects both the application of bottom-up and top-down attention, and cognitive analysis
(Sanocki, Michelet, Sellers, & Reynolds, 2006).
Appendix 1 is provided at the following web location:
http://www.seahorses-consulting.com/DownloadableFiles/Appendix1.pdf
Bottom-up and top-down attention processes are explained in:
http://www.seahorses-consulting.com/DownloadableFiles/ShapingAttentionHandout.pdf
2. Fuzzy-Trace Theory (F-TT) posits that gist is utilised early in the visual analysis process to
facilitate the creation of representations, which then ‘support fuzzy (yet advanced) intuition, and
superficial verbatim representations of information, which support precise analysis’ (Reyna,
2012, p. 332). F-TT is therefore closely related to object recognition (which is described in
Section 1.2.2.2 in Attachment 1) at the gist level. A more detailed description of F-TT is beyond
the scope of this paper. However Reyna (2012) provides a useful review of the key concepts,
should the reader wish to investigate this topic further.
Optimising Comprehension and Shaping Impressions
Bruce Hilliard© 2014 Page 3
1.2. The Importance of Scan Types
According to (Mohler & Duff, 2000), good screen layout should take into account the flow of
the eye across the screen. For example, they identified that poor visual design forces greater
saccadic eye movement(3), which in turn reduces the amount of information that can be
processed by the viewer (Mohler & Duff, 2000).
The need to implement design that aligns to standard scanning techniques is espoused in
numerous PowerPoint® publications (e.g. Duarte (2008) and Gabrielle (2010)). These
respectively refer to ‘Z’ and ‘F’ shaped standard viewing paths for slides. Additionally, other
design publications (e.g. Wheildon (2005), Hanington (2006), and Bradley (2013)) also refer
to variations such as the Gutenberg diagram. Each of these three visual scan pathways can be
characterised as discussed in the following subsections.
1.2.1. Gutenberg Diagram
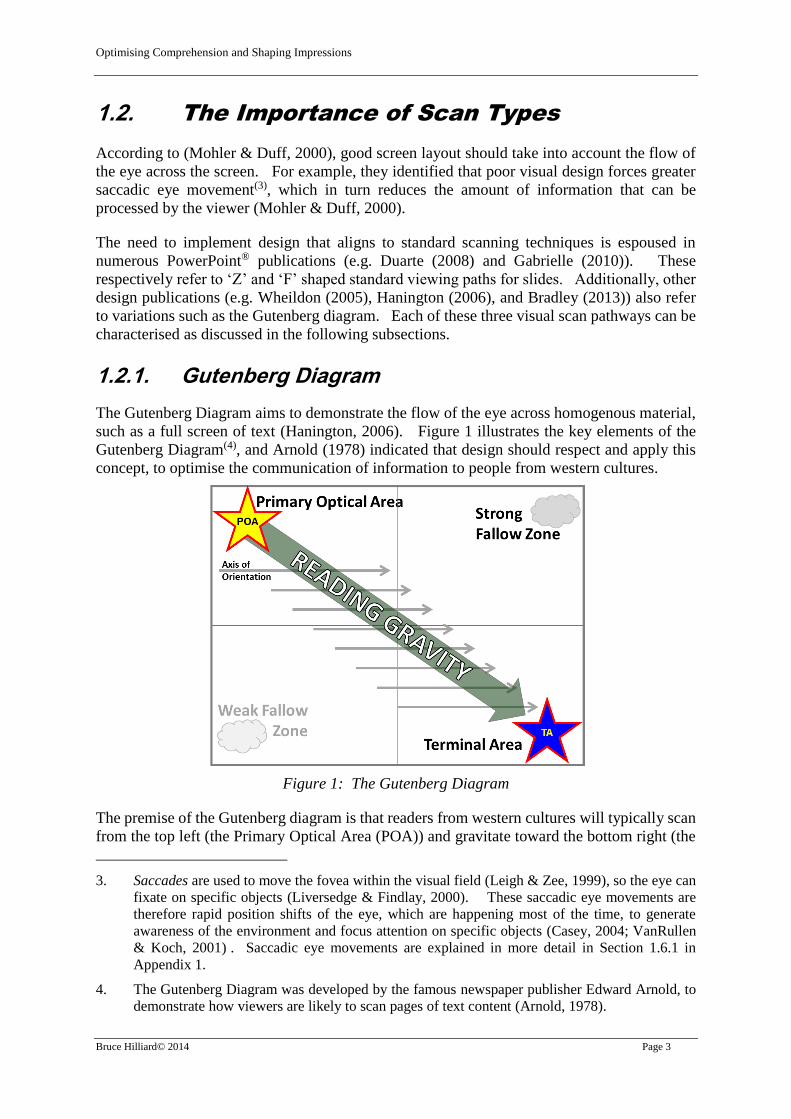
The Gutenberg Diagram aims to demonstrate the flow of the eye across homogenous material,
such as a full screen of text (Hanington, 2006). Figure 1 illustrates the key elements of the
Gutenberg Diagram(4), and Arnold (1978) indicated that design should respect and apply this
concept, to optimise the communication of information to people from western cultures.
Figure 1: The Gutenberg Diagram
The premise of the Gutenberg diagram is that readers from western cultures will typically scan
from the top left (the Primary Optical Area (POA)) and gravitate toward the bottom right (the
3. Saccades are used to move the fovea within the visual field (Leigh & Zee, 1999), so the eye can
fixate on specific objects (Liversedge & Findlay, 2000). These saccadic eye movements are
therefore rapid position shifts of the eye, which are happening most of the time, to generate
awareness of the environment and focus attention on specific objects (Casey, 2004; VanRullen
& Koch, 2001) . Saccadic eye movements are explained in more detail in Section 1.6.1 in
Appendix 1.
4. The Gutenberg Diagram was developed by the famous newspaper publisher Edward Arnold, to
demonstrate how viewers are likely to scan pages of text content (Arnold, 1978).

Optimising Comprehension and Shaping Impressions
Bruce Hilliard© 2014 Page 4
Terminal Area (TA)), by reading the content through a series of horizontal movements along
the axis of orientation (e.g. reading lines of text from left to right and from top to bottom)
(Bradley, 2013). Although the axis of orientation supports horizontal movement of the eye,
the general reading gravity is from the top left to the bottom right. The Gutenberg diagram
also splits the readable area into four quadrants, and indicates that the viewer is likely to pay
less attention to the fallow areas (Arnold, 1978). However, the viewer is likely to pay more
attention to the strong fallow area (top right corner) and very little attention to the weak fallow
area (bottom left corner) (Bradley, 2013).
The key assertions of the Gutenberg diagram are that important information should be placed
toward the top left, and the layout should facilitate the movement of the eye from the POA to
the TA (Wheildon, 2005) (e.g. from top left to bottom right).
1.2.2. Z-Pattern
The Z-Pattern indicates that viewers will begin in the top left, move horizontally to the top
right, and then diagonally to the bottom left, before gravitating horizontally to the bottom right
of the screen (Bradley, 2013). The left hand diagram in Figure 2 illustrates this concept.
Figure 2: The Z-Pattern Diagrams
Advertising and web designers (e.g. Jones (2010) and Nunn (2012)) recommend organising the
visual content within these regions of the layout, to support the ordered communication of
information (e.g. first and most important point at position 1, the next most important
information at position 2, and so on), as they believe this helps to reinforce the flow of
information.
According to Bradley (2013) the Z-Pattern is a useful representation of standard eye scanning
paths for simple designs, but for more complex content the Zig-Zag pattern (shown to the right
in Figure 2) may provide a better representation. This second visual search model has many
similarities with the Gutenberg diagram, because each horizontal path represents the axis of
orientation, and the general reading gravity is from the top left to the bottom right.
1.2.3. F-Pattern
Nielson (2006) conducted research into the standard methods for visually scanning text based
web pages, and used these experiments to identify the so-called F-Pattern. As detailed by
Bradley (2013) the F-Pattern indicates that the eye will typically:

Optimising Comprehension and Shaping Impressions
Bruce Hilliard© 2014 Page 5
• begin in the top left hand corner;
• move horizontally to the top right before returning to the left edge;
• then make a second sweep to the right, but not as far as the first saccade; and
• whilst the eye moves further down the page the horizontal sweeps will typically remain
progressively closer to the left hand margin.
A stylised representation of this F-shaped pattern is provided in Figure 3.
Figure 3: The F-Pattern Diagram
This Nielson (2006) model indicates that important information should be positioned across
the top of the design, and other key content should be biased toward the left of the screen to
support information scanning.
1.2.4. Practical Implications and Limitations of these Scan Paths
As specified by Bradley (2011), each of these patterns are predicated on viewing homogenous
information, such as a full page of text. However, these patterns appear to be applied almost
universally to layouts without the designers understanding their limitations (Bradley, 2011).
This is in spite of the fact that even relatively old research results, such as those cited in Noton
and Stark (1971), Stark and Ellis (1981) and Groner, Walder, and Groner (1984), identified
that different scanning techniques are applied when viewing different types of visual material
(e.g. the way a viewer scans text is different from the way in which they scan a picture).
Suvorov (2013) reinforced these findings, by identifying that the type of content and the context
of the visual material significantly affected the scanning and processing of information.
Therefore, because the Gutenberg Diagram, Z-Pattern, and F-Pattern are all predicated on text
scanning, they may be sensible in terms of the cognitive processes identified for reading.
However, this may also be limited to languages like English (Schuett, Heywood, Kentridge, &
Zihl, 2008), where the viewer has learned to scan from left to right and move line by line from
the top to the bottom (Schuett et al., 2008). Different cultures learn other standard scanning
techniques (Abed, 1991; Brockman, 1991). For example:
Optimising Comprehension and Shaping Impressions
Bruce Hilliard© 2014 Page 6
• Chang, Chu, and Chen (2005) identified that when a Chinese reader identifies vertical
Chinese characters they will start reading in the top right corner and scan vertically
through the column and then move to the left for successive lines (this can be defined as
a reverse N-Pattern). On the other hand Chang et al. (2005) also identified that when a
Chinese reader finds horizontal lines of text characters (e.g. headings) these will be
scanned automatically from left to right.
• Abed (1991) identified that Hebrew readers tend to focus initially on the top right when
reading text. Similar scan paths define the standard technique for reading Arabic script
(George, Anwar, & Jeyasekhar, 2011). This text scanning is defined as a reverse-Z-
Pattern, because it is the mirror image of the Z-Pattern (starting in the top right corner,
moving across the top, then diagonally toward the bottom right corner, and then
horizontally to the bottom left corner (George et al., 2011).
These standard patterns are also only valid where top-down processes drive the visual scanning
(Schuett et al., 2008)(5) (e.g. text is identified and goal driven behaviours are applied to read
the writing). However, these top-down scanning strategies can also affect the order of
processing for non-text material (e.g. when showing shapes in a row, the standard reading order
can determine the order of processing) (Abed, 1991).
Additionally, these scan patterns can be significantly disrupted by the presence of recognisable
visual patterns (Noton & Stark, 1971), direction invoking content(6), salient colours (e.g.
coloured text (Brockman, 1991)), or the presence of pictures in the vicinity of the text
(Navalpakkam, Rao, & Slaney, 2011). Therefore, bottom-up processes can significantly
impact on the standard scanning techniques that will be applied, even in text rich visual material
(Navalpakkam et al., 2011).
Alternatively, when viewing graphical scenes (e.g. showing a picture over the full extent of the
PowerPoint® slide), other types of visual scanning techniques are applied (Myers, 2007; Noton
& Stark, 1971; Rayner, 1998). For instance:
• Bindemann (2010) identified that there is a strong bias toward beginning the scan around
the centre of the screen; and
• Engmann et al. (2009) showed that scanning was typically biased to begin just to the left
of the screen centre, and the scanning was then predisposed toward regions of high
luminance and colour contrasts.
In other words in an unstructured (e.g. non-text) scene the scanning will begin around the
middle of the graphical content or screen (Bindemann, 2010), and then the following scan path
is likely to be driven significantly by bottom-up attention factors (Engmann et al., 2009).
5. These scan paths appear to be controlled through top-down attention systems within the Posterior
Parietal Cortex (see Section 1.4.2 in Appendix 1) and the Frontal Eye Fields (see Section 1.4.3.2.1
in Appendix 1) (Leff, Scott, Rothwell, & Wise, 2001).
6 ‘Viewers scan a display with their attention moving from one part to another. The underlying
pattern of the display will be the main determinant of the eye movement pattern. But if you want
viewers to “read” the display in a particular sequence or focus on some particular element then
you can use various other devices called directionals’ (Smaldino, Lowther, & Russell, 2008, p.
62) These directionals can include graphical elements (e.g. arrows that shape the direction of
eye movement), icons (e.g. graphical bullets that highlight content and direct the eye), or even
text highlighting (e.g. bold text) (Smaldino et al., 2008).

Optimising Comprehension and Shaping Impressions
Bruce Hilliard© 2014 Page 7
Therefore, the Gutenberg Diagram, Z-Pattern and F-Pattern scan paths are not applicable in
these cases. Additionally, they may also not be applicable for text based scanning by other
cultures. The recommended standard scan paths cited in the design publications may
consequently not be the most efficient approach for defining layouts in all cases.
For instance, Djonov and Van Leeuwen (2013) states that in tools like PowerPoint®, the key to
controlling the order of perception rests on:
• the application of grids, and the composition of the visual elements; while
• keeping some aspects of the standard visual scanning techniques in mind (e.g. appropriate
reading paths and salience).
Hence, grids and composition aspects may be more important for defining the layout than
relying solely on standard scan patterns. The following sections therefore explain important
concepts related to grids and composition.
1.3. Grids
A grid is a pattern of lines that is used as a foundation for implementing effective visual
composition, by providing a framework for organising the visual elements coherently (Djonov
& Van Leeuwen, 2013). However, the grid structure should be implicit, and should not
normally be seen by the viewer in the final visual content (Djonov & Van Leeuwen, 2013).
According to Pettersson (2010), these implicit grids should then be applied to set standardised
visual hierarchies. This objective is achieved by using the selected grid to provide consistent
regions and intersection points, which helps to create aesthetically pleasing and
comprehensible layouts (e.g. putting information into standard positions on the grid) (Pralle,
2007).
As viewers rapidly learn where to expect information within the grid, this can significantly
improve the shaping of attention to the correct visual content (Jiang & Song, 2005; Kunar,
Flusberg, & Wolfe, 2006; Waller & Richardson, 2008)(7). Additionally, the utilisation of
appropriate grid layouts can reduce cognitive load (Cheon & Grant, 2009), and decrease search
time for new material (Myers, 2007; Sanocki & Epstein, 1997).
However, as with various design publications, the research based findings recommend a range
of different grid patterns. For instance:
• Djonov and Van Leeuwen (2013) identified what they called Renaissance grids (single-
point perspective converging grids), and Graphic Design girds. This latter form of
gridding involves the pragmatic selection of implicit shapes and areas within the screen
to provide balance, consistency, efficient use of the space available, and visual clarity
(Djonov & Van Leeuwen, 2013). Djonov and Van Leeuwen (2013) utilised a wide range
of different grid configurations that were defined specifically to meet their objectives.
This pragmatic selection approach is also supported by Pralle (2007), who recommended
a range of different grid patterns, which utilise the aggregation of squares, rectangles and
triangles of various ratios and sizes, to cover the entire slide and provide the framework
7. This may be due to the creation of configural learning (Jiang & Song, 2005), in which the
viewer’s mind is primed (Olds & Degani, 2003) to view specific areas through contextual cueing
(Kunar et al., 2006), which can then speed attentional targeting (Jiang et al., 2013).
Optimising Comprehension and Shaping Impressions
Bruce Hilliard© 2014 Page 8
for positioning content. Interestingly, many of Djonov and Van Leeuwen’s (2013) and
Pralle’s (2007) grid models are extraordinarily complex.
• Ch’ng and Ngo (2003) and Ngo and Ch’ng (2005) applied a similar, but more formal
approach, which identified that grids based on unreal number ratios can be used to
provide harmonic subdivisions of the screen (e.g. with adjacent grid ratios based on one
to the square roots of two, three, five, and/or the golden ratio(8)). According to Ch’ng
and Ngo (2003) the application of these ratios to the grid pattern improves the aesthetic
properties of the display. However, the associated approach they detailed in Ch’ng and
Ngo (2003) and Ngo, Teo, and Byrne (2003) is much too complex for general use in
PowerPoint® design(9).
• Alternatively, Marion and Crowder (2013) recommend a standard three (columns) by
three (rows) grid. This approach is also cited as a simple method for gridding the screen,
in many other publications, such as Reilly and Roach (1984), Thompson (2008) (who
applied this to PowerPoint® design directly) and Smaldino et al. (2008). These authors
describe this approach as the ‘Rule of Thirds’.
Therefore, a range of different grid approaches can be applied. However, many of the
recommended grid patterns are very complex and may not be appropriate for normal usage in
PowerPoint® design. For this reason the ‘Rule of Thirds’ may be the most appropriate for
utilisation in PowerPoint®, as discussed in Thompson (2008)(10).
1.4. Composition
According to Djonov and Van Leeuwen (2013), good composition utilises the implicit grid,
but positions the visual content to take into account framing (array)(11), salience, and the
positioning of the information based on its importance. This last point can take into account
the scanning paths discussed earlier. For example, where the layout of the visual content is
likely to induce reading patterns for scanning, then this scan path can be utilised in positioning
the required content (e.g. for western cultures placing the most important information toward
the top and left of the screen) (Djonov & Van Leeuwen, 2013). However, Djonov and Van
8. These proportions are discussed in more detail below in Section 1.4.2.
9. Ch’ng and Ngo (2003) explain a complex system of segmentation of the screen based on a set of
mathematical ratios that rely on unreal numbers, and they also introduces a complex
mathematical formula for determining the best ratios. Ngo et al. (2003) explain this complex
mathematical formula in significantly greater detail. After analysing both papers in detail the
author believes that it would only be feasible to apply this for most design if an associated
computer program was applied. As such a program was not available at the time of drafting this
thesis, it was considered that this approach would be beyond the capabilities of most designers
to apply. For this reason, it was not utilised in this project.
10. The practical application of this ‘Rule of Thirds’ technique is explained in more detail in Section
3.7 (which will be covered in a later handout).
11. ‘Framing is the degree of connectedness or disconnectedness between layout elements, which
may be signalled by contrast or similarity in colour, font type or size, brightness, shape, spatial
orientation, distance, movement, and the grouping of elements within a given area, apart from
elements occupying other areas’ (Djonov & Van Leeuwen, 2013, p. 11). The term framing in
this context is therefore a synonym for Array within this model.

Optimising Comprehension and Shaping Impressions
Bruce Hilliard© 2014 Page 9
Leeuwen’s (2013) approach does not provide guidance on universal principles to facilitate the
optimisation of the layout within the grid.
Therefore, for this thesis, two research based models were analysed. The first applies Gestalt
theory, because as specified by Chang, Dooley, and Tuovinen (2002), the application of these
principles can significantly improve viewer impressions, and their comprehension of the visual
material. The second model investigates aesthetic qualities, because these aspects of the layout
of visual information can directly affect the acceptability, learnability and comprehensibility
of the content (Ngo, Teo, & Byrne, 2000).
1.4.1. Gestalt Principles,
The term Gestalt refers to the human mind’s(12) propensity to assess material within the field
of view as ‘a perceptual whole that is more than the sum of its parts and cannot be completely
described in terms of its parts’ (Matsumoto, 2009, p. 221). Chang et al. (2002) identified 11
important Gestalt laws(13), which can be characterised as follows(14):
• Figure-Ground. This principle states that when viewing content, some elements will
seem prominent and therefore in the foreground, and other parts of the visual field will
recede into the background (Sternberg, 1998; Yang, 2006). This is a critical element of
design, because the ability to identify the foreground is essential in determining the most
important material (Graham, 2008)(15). The concept of Figure-Ground differentials is
demonstrated in Figure 4.
Figure 4: Figure-Ground
12. This processing appears to take place predominantly within the higher order regions of the
occipital lobes, adjacent areas of the parietal lobes, and within the ventral stream (Snyder,
Shpaner, Molholm, & Foxe, 2012), and in particular within the Perirhinal cortex (O'Neil, Barkley,
& Köhler, 2013). The occipital lobe processing is explained in Section 1.3.5 in Appendix 1, and
the ventral stream is described in Section 1.4.1 in Appendix 1.
13. This thesis utilises the term ‘principles’ rather than laws to avoid creating confusion.
14. This section contains short descriptions of each Gestalt principle. The associated diagrams
(Figure 5 to Figure 14 are rationalised versions of diagrams provided in (Sternberg, 1998, pp.
178-179), or Figures 1 to 11 in (Chang et al., 2002).
15. Background concepts are discussed in more detail in the handout provided at:
http://www.seahorses-consulting.com/DownloadableFiles/ColourPsychology-Backgrounds.pdf

Optimising Comprehension and Shaping Impressions
Bruce Hilliard© 2014 Page 10
• Balance/Symmetry. The Gestalt concept of balance states that ‘a psychological sense
of equilibrium or balance is usually achieved when visual “weight”(16) is placed evenly
on each side of an axis’ (Chang et al., 2002, p. 1). Symmetry is closely aligned to
Balance and it relates to the fact that viewers group elements together if they are
perceived as being mirror images (Sternberg, 1998, pp. 178-179). Figure 5 illustrates
the concepts of Balance and Symmetry.
Figure 5: Balance/Symmetry
• Closure. Closure states that viewers ‘tend perceptually to close up or complete objects
that are not, in fact, complete’, because the open/unfinished aspects are ignored in Gestalt
perception and cognition (Sternberg, 1998, pp. 178-179). Figure 6 demonstrates the
effect of closure.
Figure 6: Closure
• Continuation. Good continuation (sometimes called continuity (Wertheimer, 1923))
reflects the concept that viewers will ‘tend to perceive smoothly flowing or continuous
forms rather than disrupted or discontinuous forms’ (Sternberg, 1998, p. 179). This
principle is explained in more detail in Figure 7 (overleaf).
16. ‘All objects in a design have a visual weight based on size, colour, form, surrounding
space, etc. Our eyes are drawn to elements with the greatest visual weight’ (Bradley,
2013, p. 26). For example, the colours identified in the research by Ou, et al. (2004a,
2004b) (see 1.4 on Page 11 of http://www.seahorses-
consulting.com/DownloadableFiles/ColourPsychology.pdf), create impressions of
visual weight. Alternatively, aspects such as location can also affect the impression of
visual weight for an object (e.g. objects closer to the centre of the screen are typically
assessed as having more weight than objects on the periphery) (Lok, Feiner, & Ngai,
2004).

Optimising Comprehension and Shaping Impressions
Bruce Hilliard© 2014 Page 11
Figure 7: Continuation
• Proximity. The proximity principle states that objects near each other tend to be grouped
together (Sternberg, 1998), whereas objects positioned further apart will be seen as
separate (Graham, 2008)(17). Figure 8 discusses the concept of proximity, and this
principle is explained in more detail in a following handout.
Figure 8: Proximity
• Similarity. This principle posits that items that are analogous (e.g. look similar) will
tend to be grouped together (Sternberg, 1998). Therefore, ‘visual elements that are
similar in shape, size, colour, … and direction are perceived as part of a group’ (Graham,
2008, p. 9). Figure 9 discusses similarity in more detail.
Figure 9: Similarity
• Isomorphic Correspondence. This principle states that viewers will utilise their
knowledge to make sense of visual information (through the application of object
recognition), and this means that viewers may cognitively process visual content
17. This concept is discussed in more detail in Section 2.7 (Array), which will be covered in a
following newsletter.

Optimising Comprehension and Shaping Impressions
Bruce Hilliard© 2014 Page 12
differently based on their experience (Chang et al., 2002). The effect of isomorphic
correspondence is illustrated in Figure 10.
Figure 10: Isomorphic Correspondence
• Prägnanz. The concept of Prägnanz (German for ‘good form’) states that individuals
will tend to order their experiences, so they are simplified, regular and orderly (Sternberg
& Mio, 2006). Therefore, in terms of visual information, individuals will apply their
experience to make sense of the visual content (Chang et al., 2002). This principle is
therefore closely related to the concept of Isomorphic Correspondence. Some of the key
implications of Prägnanz are demonstrated in Figure 11.
Figure 11: Prägnanz
• Simplicity. This Gestalt rule cites that viewers will try to simplify what is seen into what
they can understand, and this may lead to invalid communication if the content is too
complex (Chang et al., 2002; Smith-Gratto & Fisher, 1999). Figure 12 demonstrates
some of the key implications of simplicity.
Figure 12: Simplicity
• Focal Point. The principle of focal point refers to the need to provide a key point of
focus within groups of objects to create a centre of interest or point of emphasis, by

Optimising Comprehension and Shaping Impressions
Bruce Hilliard© 2014 Page 13
utilising some form of salience (Chang et al., 2002)(18). If a focal point is not provided,
or too many focal points are implemented, this can make the content confusing or
uninteresting (Chang et al., 2002). The effects of focal point on Gestalt are illustrated
in Figure 13.
Figure 13: Focal Point
• Unity/Harmony. Finally, the concept of unity/harmony states that when elements appear
to be congruent then they are more likely to be perceived as a whole entity (Chang et al.,
2002). Unity/Harmony is therefore closely linked to the preceding Gestalt principles.
For example, aspects such as similarity, proximity, simplicity and isomorphic
correspondence all have an effect on the impression of unity and harmony, as illustrated
in Figure 14.
Figure 14: Unity/Harmony
As identified in Chang et al’s. (2002, p. 7) experiments ‘all of the 11 Gestalt laws identified
were found to be useful by an overwhelming number or respondents’, in terms of creating
positive impressions and generating improved learning outcomes.
18. See Section 1.2.2.1.2 in Appendix 1 for more information on Distinctiveness.

Optimising Comprehension and Shaping Impressions
Bruce Hilliard© 2014 Page 14
Palmer, Brooks, and Nelson (2003) also identified two other important Gestalt principles that
relate to the grouping of information. These can be characterised as follows(19):
• Common Region. This Gestalt principle refers to ‘the tendency for elements that lie in
the same bounded area to be grouped (Palmer et al., 2003, p. 312). Figure 15 illustrates
the concept of common regions.
Figure 15: Common Region
• Element Connectedness. ‘Elements that share a common border’ (e.g. touch each
other) (Palmer et al., 2003, p. 313) or are visually linked in some other way, will tend to
be grouped even if the connection is relatively tenuous (Palmer & Rock, 1994). The
concept of element connectedness is shown in Figure 16.
Figure 16: Element Connectedness
• Parallelism. This principle has been identified as an important factor in ‘determining
the perceptual simplicity of line configurations’, and providing grouping cues (e.g.
grouping by the orientation of edge elements into contours) (Wagemans, Elder, et al.,
2012, p. 19). Parallelism is demonstrated in Figure 17.
Figure 17: Parallelism
There is also another set of Gestalt principles that were not utilised by Chang et al. (2002), and
these relate to animation or movement. These additional Gestalt principles include:
19. Figure 15 and Figure 16 have been developed from concepts illustrated Figure 2 in Palmer et al.
(2003), but they have been modified to take into account key concepts described in Palmer and
Rock (1994). Figure 17 is a rationalised version of Figure 1.H. at (Wagemans, Elder, et al.,
2012, p. 9).
Optimising Comprehension and Shaping Impressions
Bruce Hilliard© 2014 Page 15
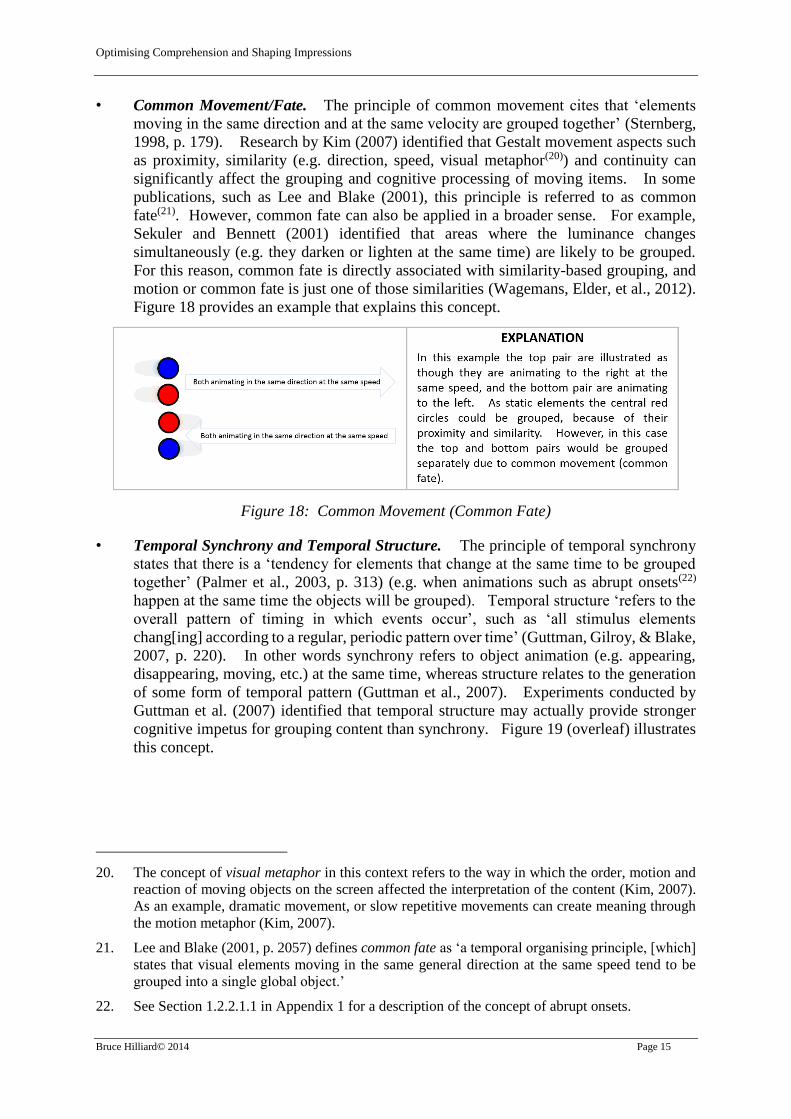
• Common Movement/Fate. The principle of common movement cites that ‘elements
moving in the same direction and at the same velocity are grouped together’ (Sternberg,
1998, p. 179). Research by Kim (2007) identified that Gestalt movement aspects such
as proximity, similarity (e.g. direction, speed, visual metaphor(20)) and continuity can
significantly affect the grouping and cognitive processing of moving items. In some
publications, such as Lee and Blake (2001), this principle is referred to as common
fate(21). However, common fate can also be applied in a broader sense. For example,
Sekuler and Bennett (2001) identified that areas where the luminance changes
simultaneously (e.g. they darken or lighten at the same time) are likely to be grouped.
For this reason, common fate is directly associated with similarity-based grouping, and
motion or common fate is just one of those similarities (Wagemans, Elder, et al., 2012).
Figure 18 provides an example that explains this concept.
Figure 18: Common Movement (Common Fate)
• Temporal Synchrony and Temporal Structure. The principle of temporal synchrony
states that there is a ‘tendency for elements that change at the same time to be grouped
together’ (Palmer et al., 2003, p. 313) (e.g. when animations such as abrupt onsets(22)
happen at the same time the objects will be grouped). Temporal structure ‘refers to the
overall pattern of timing in which events occur’, such as ‘all stimulus elements
chang[ing] according to a regular, periodic pattern over time’ (Guttman, Gilroy, & Blake,
2007, p. 220). In other words synchrony refers to object animation (e.g. appearing,
disappearing, moving, etc.) at the same time, whereas structure relates to the generation
of some form of temporal pattern (Guttman et al., 2007). Experiments conducted by
Guttman et al. (2007) identified that temporal structure may actually provide stronger
cognitive impetus for grouping content than synchrony. Figure 19 (overleaf) illustrates
this concept.
20. The concept of visual metaphor in this context refers to the way in which the order, motion and
reaction of moving objects on the screen affected the interpretation of the content (Kim, 2007).
As an example, dramatic movement, or slow repetitive movements can create meaning through
the motion metaphor (Kim, 2007).
21. Lee and Blake (2001, p. 2057) defines common fate as ‘a temporal organising principle, [which]
states that visual elements moving in the same general direction at the same speed tend to be
grouped into a single global object.’
22. See Section 1.2.2.1.1 in Appendix 1 for a description of the concept of abrupt onsets.

Optimising Comprehension and Shaping Impressions
Bruce Hilliard© 2014 Page 16
Figure 19: Temporal Synchrony and Structure
The effectiveness of Gestalt principles is also supported by other research (Fraher & Boyd-
Brent, 2010; Glicksohn & Cohen, 2011; Yonggang et al., 2013). For example, some of the
key benefits provided by Gestalt design may stem from a viewer’s ability to handle Gestalt
aligned visual information more effectively in working memory (Peterson & Berryhill, 2013;
Xu & Chun, 2007)(23).
1.4.2. Aesthetic Principles
The aesthetic qualities of the layout of visual information can also directly affect the
acceptability(24), learnability and comprehensibility of the content (Ngo et al., 2000). The key
aesthetic measures identified by Ngo et al. (2000), are categorised as follows:
23. Peterson and Berryhill (2013) postulated that these benefits may be generated by: (1) allowing
the viewer to more readily create visual chunking due to Gestalt processing (e.g. creating Gestalt
groupings from the content that can then be handled as chunks rather than having to manage each
individual object as an separate entity in working memory); or (2) alternatively the Labelled
Boolean Map (LBM) perspective may be generating benefits, because common elements sharing
a feature can be mapped simultaneously, which means that multiple objects can utilise common
mapping to reduce cognitive load. Alternatively, Glicksohn and Cohen (2011) refer to chunking,
but their research indicated that the determination of chunks is based on Bayesian rules, which
are learnt. The term Bayesian refers to the application of subjective probability, to determine
and learn visual chunks (Orban, Fiser, Aslin, & Lengyel, 2008). In other words, within their
theory, the mind utilises probabilistic analysis to identify chunks within a scene and then applies
similar rules to assess if the chunk is reoccurring, which facilitates cognitive processing (Orban
et al., 2008). It is unclear from the available information, which of these aspects plays the most
important role, or if all of these aspects are equally valid. However, for the purposes of this
thesis it is sufficient to support the concept that the utilisation of Gestalt principles assists in the
effective processing of visual information.
24. Ngo et al. (2000) utilise the terms ‘good’ or ‘bad’ to describe these design aspects. As an
example, Ngo et al. (2000) lists balance as ‘good’ and imbalance as ‘bad’. The author of this
thesis does not necessarily agree with these ‘good’ or ‘bad’ labels and sees that there is a purpose
for each dichotomy in developing an optimal layout design approach. For example, imbalance,
asymmetry, etc. can be utilised to generate psychological tension (Skolos & Wedell, 2006). Ngo,
et al’s. (2000) use of ‘good’ and ‘bad’ are therefore not included in this text, but in each case the
example to the left within Figure 20 to Figure 32 represents the so called ‘good’ design, and the
associated example to the right, indicates those design approaches that Ngo et al. (2000)
characterise as ‘bad’.

Optimising Comprehension and Shaping Impressions
Bruce Hilliard© 2014 Page 17
• Balance. Balance is ‘defined as the distribution of optical weight’ created by the
different objects on the screen (Ngo et al., 2000, p. 4). As explained in Footnote 16, the
relative perceived weight of an object is affected by visual factors such as size (larger
objects appear heavier) (Ngo et al., 2000), and colour (Otsuka & Kawaguchi, 2009;
Pilling & Gellatly, 2011), and this weight can shift the optical centre, which then affects
the balance, symmetry and equilibrium (Yang, 1995). Balance ‘in screen design is
achieved by providing an equal weight of screen elements from left and right, and from
top to bottom’ (Ngo et al., 2000, p. 4). This aesthetic quality can therefore be closely
linked to the Gestalt principle of Balance/Symmetry. Figure 20(25) demonstrates this
aesthetic concept.
Figure 20: Balance versus Imbalance
• Equilibrium. Balance is also closely related to equilibrium, which is achieved when
‘the centre of the layout coincides with that of the frame’ of the slide (Ngo et al., 2000,
p. 4). In other words, equilibrium ‘is achieved by centring the layout’ both horizontally
and vertically within the slide (Ngo et al., 2000, p. 4), as illustrated to the left in Figure
21, whereas so called ‘unstable’ design is created when the content is not centred on the
screen. This concept therefore also appears to be closely related to the Gestalt principle
of Balance/Symmetry.
Figure 21: Equilibrium – Stable versus Unstable
25. Each of the diagrams provided from Figure 20 to Figure 32 are modified versions of Figures 1 to
13 in Ngo et al. (2000). These diagrams have been modified appropriately to better illustrate the
concepts.

Optimising Comprehension and Shaping Impressions
Bruce Hilliard© 2014 Page 18
• Symmetry. Symmetry is achieved through ‘axial duplication’, which means that objects
are replicated on either side of the centreline of the screen (Ngo et al., 2000, p. 4).
Symmetry is therefore closely related to balance, but a equalised arrangement can be
achieved without symmetry, as illustrated in Figure 22. In addition to the aesthetic
quality, the provision of symmetry also appears to have a positive effect on memory
(Zimmer, 2008). This aesthetic design element is therefore also closely related to the
Gestalt principle of Balance/Symmetry.
Figure 22: Symmetry versus Asymmetry and Balance
• Sequence. This aspect refers ‘to the arrangement of objects in a layout in a way that
facilitates the eye through the information displayed’ (Ngo et al., 2000, p. 5). For
example, this concept can be associated with the Gestalt Focal Point principle, and to the
application of good form that relates to the principle of Prägnanz. The scan paths
described in Section 1.2 can also provide useful insights into the sequence of processing.
Therefore, for Western Cultures, the upper left quadrant may be processed first, unless
there are other salience issues influencing the perceptual processes (Smaldino et al.,
2008). Additionally, as cited by Ngo et al. (2000, p. 5) active attention also typically
moves from ‘big objects to small objects’ and this type of relationship can be applied to
reinforce the standard scanning techniques. This reinforcement of the sequencing is
illustrated in Figure 23.
Figure 23: Sequencing versus Randomness

Optimising Comprehension and Shaping Impressions
Bruce Hilliard© 2014 Page 19
• Unity. The term unity relates to the way in which the layout is designed to create the
perception of totality for the elements (Ngo et al., 2000). In other words, this reflects
the way in which the screen objects ‘dovetail so completely that they are seen as one
thing’ (Ngo et al., 2000, p. 5). The perception of unity is affected by aspects such as
spacing and the similarity of objects on the screen (Ngo et al., 2000). For this reason,
this aesthetic concept can be closely linked with the Gestalt principle of Unity/Harmony.
Figure 24 illustrates the concepts of unity and disunity (e.g. fragmented design).
Figure 24: Unity versus Disunity (Fragmentation)
• Cohesion. The application of ‘similar aspect ratios’ (e.g. the relationship between height
and width) of key objects in relation to the entire screen ‘promotes cohesion’ (Ngo et al.,
2000, p. 5). Therefore, as illustrated in Figure 25, the layout of objects should ideally
align to the visual ratios of the entire screen, to provide enhanced cohesion of the visual
elements (Ngo et al., 2000). This aesthetic design element does not appear to have a
strong link to any of the Gestalt principles.
Figure 25: Cohesion versus Non-Cohesiveness

Optimising Comprehension and Shaping Impressions
Bruce Hilliard© 2014 Page 20
• Proportion. According to Ngo et al. (2000) the proportions (e.g. height to width) utilised
for the screen objects may be more aesthetically pleasing if they apply the following
types of ratio: square (1:1), one to the square root of two (1:1.414), one to the golden
ratio (1:1.618); one to the square root of three (1:1.732), and double (1:2). Ngo et al.
(2000) postulated that aesthetically pleasing proportions should therefore be considered
when designing major screen objects. As an example, Figure 26 illustrates the effect of
the application of the golden ratio. However, the empirical evidence to support the
significance of the generic application of any of these proportions appears to be
inconclusive(26). However, if this approach is valid, this aspect may have implications
related to Prägnanz.
Figure 26: Proportional versus Disproportionate
• Simplicity. This aspect relates to ‘the directness and singleness of form, a combination
that results in ease in comprehending the meaning of a pattern’ (Ngo et al., 2000, p. 6).
Simplicity is ‘achieved by optimising the number of elements on a screen and minimising
the alignment points’ (Ngo et al., 2000, p. 6). In practical terms, Ngo et al. (2000) are
referring to complexity in terms of the number of objects on the screen and their
placement in terms of alignment to support unity. In other words, this aspect is closely
related to the Gestalt Simplicity principle. The effects of simplicity are illustrated in
Figure 27 (overleaf).
26. Green (1995) identified that there may be some psychological benefits associated with the
utilisation of some proportions, such as the golden ratio. However, he also indicated that the
research, and the significance of the affect, was far from clear (Green, 1995). Jacobsen (2004)
identified similar mixed findings in his experiments. For example, he found that the provision
of squares were strong predictors of positive impressions, and the more extreme the proportional
ratios were (e.g. height versus width), the more negatively the shapes were assessed (particularly
for strong vertical dominance, in shapes that were positioned orthogonally) (Jacobsen, 2004).
However, in terms of the ratios covered in this section, there was no broad consensus on the
preferred aesthetic property (Jacobsen, 2004). Such preferences may therefore be highly
individualistic (Jacobsen, 2004; Palmer & Griscom, 2013).

Optimising Comprehension and Shaping Impressions
Bruce Hilliard© 2014 Page 21
Figure 27: Simplicity versus Complexity
• Density. ‘Density is the extent to which the screen is covered with objects’ (Ngo et al.,
2000, p. 6). Ngo et al. (2000, p. 13) assessed ‘that the optimal screen density level for
graphic screens is 50%’ (in terms of objects covering the total space available on the
slide). This general guideline appears to be supported by other research. For example,
Halverson and Hornof (2004) identified that targets in sparse groups (e.g. low density)
are searched earlier, found more quickly, and are less likely to be missed. Alternatively,
Mayhoe, Shrivastava, Mruczek, and Pelz (2003) and Wolfe and Horowitz (2004) found
that higher density in visual material can significantly slow the identification of critical
information(27). Density can therefore be closely linked to the Gestalt principle of
Simplicity, and to some extent with Proximity (because lower density can support greater
variability in positioning). The application of density in design is illustrated in Figure
28.
Figure 28: Applying Density – Spacious versus Cramped
• Economy. This aesthetic design concept relates to ‘the careful and discreet use of
display elements to get the message across as simply as possible’ (Ngo et al., 2000, p. 7),
and is achieved by using as few object sizes as possible, as shown in Figure 29 (overleaf).
This approach therefore appears to be related to the Gestalt principle of Simplicity.
27. This is particularly true when the differences in salient factors between the target and distractor
elements in the scene are not large (Wolfe & Horowitz, 2004).

Optimising Comprehension and Shaping Impressions
Bruce Hilliard© 2014 Page 22
Figure 29: Economy versus Intricacy
• Regularity. This aspect refers to the ‘uniformity of elements based on some principle
or plan. Regularity in screen design is achieved through consistent spacing and grouping
of components’, and this aesthetic design element is ‘less sensitive to the number of
elements on the screen’, but to the way in which they are arrayed (Ngo et al., 2000, p. 6).
According to the research conducted by Feldman (1999), and van den Berg, Kubovy, and
Schirillo (2011), regularity could be considered analogous with the Gestalt principles of
Unity/Harmony, because this aesthetic aspect supports the generation of groupings and
the interpretation of perceptual linkages. Figure 30 demonstrates the concept of
regularity.
Figure 30: Regularity versus Irregularity
• Homogeneity. This aesthetic design component ‘is determined by how evenly the
objects are distributed among the four quadrants of the screen’ (Ngo et al., 2000, p. 7).
From the information provided by Beck (1982), homogeneity in this sense could be seen
as analogous with the Gestalt principles of Prägnanz and Unity/Harmony. The
homogeneity concept is shown in Figure 31 (overleaf).

Optimising Comprehension and Shaping Impressions
Bruce Hilliard© 2014 Page 23
Figure 31: Homogeneity versus Uneven Design
• Rhythm. ‘Rhythm in design refers to regular patterns of changes in the elements’ and
this ‘order with variation helps to make the appearance exciting’ (Ngo et al., 2000, p. 8).
As shown in Figure 32 rhythm is created by positioning the screen objects, so they can
form some recognisable and repeated pattern (Ngo et al., 2000). Kripintiris (2008)
identified that visual rhythm creates good form and supports flow through the content.
Rhythm can therefore be linked to the Gestalt principles of Prägnanz and
Unity/Harmony.
Figure 32: Rhythm versus Disorganisation
The interplay of these aesthetic measures aggregate to create impressions of order and
complexity (Ngo et al., 2000). Ngo et al. (2000) created a complex mathematical model to
quantify the effect of these measures on the perception of aesthetics, and then conducted
experiments(28) to determine the validity of this model. They found that the viewer perception
of aesthetics was generally consistent with their mathematical model (Ngo, 2001; Ngo et al.,
2000). Unfortunately, this mathematical model is far too complex for practical usage in
PowerPoint® design, but it does demonstrate that the measures appear to be valid.
However, later research conducted by Altaboli and Lin (2011) indicated that not all of these
aesthetic variables provided significant variations in the impressions generated. For instance,
28. The experiments involved 180 Malaysian University Students, who viewed graphical displays
that were laid out to demonstrate the various measures.

Optimising Comprehension and Shaping Impressions
Bruce Hilliard© 2014 Page 24
their findings indicated that balance, unity and sequence may have the most significant effect
on aesthetics.
Additionally, research conducted by Ziemkiewicz (2010) added another concept, which relates
to the application of metaphors (e.g. laying out information in shapes that create reminiscent
meaning), which aligns with key Gestalt principles such as Isomorphic Correspondence and
Prägnanz. Finally, other researchers such as Tractinsky, Inbar, Tsimhoni, and Seder (2011)
and Gault (2012) identified that animation can form an aesthetic element, in much the same
way as Kim (2007) and Sternberg (1998) listed motion as a Gestalt principle.
1.4.3. Creating a Conjoint Model
As illustrated within the preceding section, there appears to be some clear linkages between
the Gestalt principles and the identified aesthetic elements. These identified linkages are listed
in Table 1.
Gestalt Principle Aesthetic Element
Unity/Harmony Unity, Regularity, Homogeneity, Rhythm
Figure-Ground
Balance/Symmetry Balance, Equilibrium, Symmetry
Proximity Density
Similarity
Parallelism
Common Region
Element Connectedness
Continuation
Focal Point Sequence
Closure
Prägnanz Sequence, Proportion, Homogeneity,
Rhythm
Simplicity Simplicity, Density, Economy
Isomorphic Correspondence Metaphors
Motion/Change (Common Movement,
Common Fate, Temporal Synchrony,
Temporal Structure)
Animation
Cohesion
Table 1: Conjoint Model of Gestalt Principles and Aesthetic Elements

Optimising Comprehension and Shaping Impressions
Bruce Hilliard© 2014 Page 25
These Gestalt principles and aesthetic elements can therefore be applied conjointly to enhance
layout. However, the selection and application of this conjoint layout approach should also
take into account the following general rules.
1.5. General Rules for Layout
The following general rules have also been identified for optimising layout:
• Utilise relatively standard layouts. Relatively standard layouts can be very useful in
design (Durso, Pop, Burnett, & Stearman, 2011), because viewers rapidly learn where to
expect information and this can significantly improve the shaping of attention to the most
important task-specific elements on the display (Jiang & Song, 2005; Kunar et al., 2006;
Waller & Richardson, 2008). Therefore, a relatively standardised layout approach
should be utilised within most PowerPoint® slides.
• Variations are useful. By occasionally inserting novel layouts, greater attention and
processing of the different visual material can be achieved (Epstein, Harris, Stanley, &
Kanwisher, 1999). In practical terms, this means that optimal standards should be
applied predominantly, but when it is applicable, non-optimal layout approaches can be
applied to create impressions (e.g. imbalance in a slide to create psychological tension).
• Reinforce the layout. Aspects such as colour salience and contrast can also be used
effectively to reinforce the layout (Kunar et al., 2006). Additionally, the layout can be
reinforced by design aspects such as the provision of continuous shapes, forms, or
gradations (Smaldino et al., 2008). These concepts are illustrated in Figure 33.
Figure 33: Continuous Shape, Form, and Gradations
• Minimise unnecessary distractors. The number of distractors should be rationalised to
support the viewer to focus on the important content (Kunar et al., 2006).
• Be aware of cultural differences. Different cultures may find different layouts
aesthetically more pleasing (Wei, 2011). For example, Z-Pattern and F-Pattern layouts
may not be as appropriate for viewers from non-western cultures.
1.6. Layouts – Summary
As illustrated in the preceding sections, layout is an important element in slide design within
tools like PowerPoint® (Farkas, 2005). It also appears that some commonly espoused
Optimising Comprehension and Shaping Impressions
Bruce Hilliard© 2014 Page 26
principles are correct. However, some of the design recommendations should be applied with
care. For example:
• Scan patterns (e.g. Z Pattern, F Pattern, Gutenberg Diagram) are not universally
applicable, and are really only suitable when developing text-based or similarly
analogous content for viewers from western cultures. Additionally, for non-text content
the visual centre should act as the starting point, and salience issues can be more
important than the application of standard scan paths.
• PowerPoint® designers should utilise a grid to lay out the content in relatively standard
form and provide common visual structures. The most appropriate of these for general
utilisation may be based on the Rule of Thirds.
• The application of Gestalt principles and the aesthetic elements can greatly assist in
generating effective layouts. For standard slides these should be taken into account to
optimise the design, but non-optimal techniques can also be applied occasionally to gain
attention or generate specific impressions.
• These principles should be utilised as general guidelines, and should be varied as
appropriate to achieve the required visual outcomes.

Optimising Comprehension and Shaping Impressions
Bruce Hilliard© 2014 Page 27
REFERENCES
Abed, F. (1991). Cultural Influences on Visual Scanning Patterns. Journal of Cross-Cultural Psychology, 22(4), 525-534. doi: 10.1177/0022022191224006
Agarwal, R., & Karahanna, R. (2000). Time flies when you'r having fun: Cognitive absorption and beliefs about information technology usage. MIS Quarterly, 24(4), 665-694.
Altaboli, A., & Lin, Y. (2011). Investigating effects of screen layout elements on interface and screen aesthetics. Advances in Human-Computer Interaction, 1-10. doi: 10.1155/2011/659758
Arnold, E. C. (1978). Arnold's ancient axioms: Typography for Publications Editors. Mishawka, USA: Lawrence Ragan Communications.
Bar, M. (2004). Visual objects in context. Nature Reviews. Neuroscience, 5(8), 617-629. doi: 10.1038/nrn1476
Beck, J. (1982). Organisation and representation in perception. Hillsdale, N.J.: L. Erlbaum Associates.
Betz, T., Kietzmann, T. C., Wilming, N., & König, P. (2010). Investigating task-dependent top-down effects on overt visual attention. Journal of Vision, 10(3). doi: 10.1167/10.3.15
Bindemann, M. (2010). Scene and screen center bias early eye movements in scene viewing. Vision Research, 50(23), 2577-2587. doi: http://dx.doi.org/10.1016/j.visres.2010.08.016
Bradley, S. (2011). 3 Design Layouts: Gutenberg Diagram, Z-Pattern, and F-Pattern. Retrieved 19 Nov 2013, 2013, from http://www.vanseodesign.com/web-design/3-design-layouts/
Bradley, S. (2013). Design Fundamentals: Elements, Attributes, & Principles Retrieved from http://vanseodesign.com
Brockman, R. J. (1991). The unbearable distraction of colour. IEEE transactions on professional communication, 34(3), 153-159.
Casey, E. S. (2004). Attending and glancing. Continental Philosophy Review, 37(1), 83-126. doi: 10.1023/B:MAWO.0000049308.09311.8b
Cavanagh, P. (2011). Visual cognition. Vision Research, 51(13), 1538-1551. doi: 10.1016/j.visres.2011.01.015
Ch’ng, E., & Ngo, D. C. L. (2003). Screen design: a dynamic symmetry grid based approach. Displays, 24, 125-135.
Chang, D., Dooley, L., & Tuovinen, J. E. (2002). Gestalt theory in visual screen design - A new look at an old subject. Paper presented at the Seventh World Conference on Computers in Education, Copenhagen.
Chang, F., Chu, S.-Y., & Chen, C.-Y. (2005). Chinese document layout analysis using an adaptive regrouping strategy. Pattern Recognition, 38(2), 261-271. doi: http://dx.doi.org/10.1016/j.patcog.2004.05.010
Cheon, J., & Grant, M. M. (2009). Are pretty interfaces worth the time? The effects of user interface types on web-based instruction. Journal of Interactive Learning Research, 20(1), 5-33.

Optimising Comprehension and Shaping Impressions
Bruce Hilliard© 2014 Page 28
Conci, M., & von Mühlenen, A. (2009). Region segmentation and contextual cuing in visual search. Attention, Perception, & Psychophysics, 71(7), 1514-1524. doi: 10.3758/app.71.7.1514
Dickinson, C. A., & Intraub, H. (2009). Spatial asymmetries in viewing and remembering scenes: Consequences of an attentional bias? Attention, Perception, & Psychophysics, 71(6), 1251-1262. doi: 10.3758/app.71.6.1251
Djonov, E., & Van Leeuwen, T. (2013). Between the grid and composition: Layout in PowerPoint's design and use. Semiotica: Journal of the International Association for Semiotic Studies, 1+.
Duarte, N. (2008). slide:ology. Sebastopol: O'Reilly Media.
Durso, F. T., Pop, V. L., Burnett, J. S., & Stearman, E. J. (2011). Laws & Rules: Evidence-based human factors guidelines for PowerPoint Presentations. Economics in Design, 1-5. doi: 10.1177/064804611416583
Egger, F. N. (2001). Affective design of E-Commerce user interfaces: How to maximise perceived trustworthiness. Paper presented at the The International Conference on Affective Human Factors Design, London.
Engmann, S., 't Hart, B. M., Sieren, T., Onat, S., König, P., & Einhäuser, W. (2009). Saliency on a natural scene background: Effects of color and luminance contrast add linearly. Attention, Perception, & Psychophysics, 71(6), 1337-1352. doi: 10.3758/app.71.6.1337
Epstein, R., Harris, A., Stanley, D., & Kanwisher, N. (1999). The Parahippocampal Place Area: Recognition, Navigation, or Encoding? Neuron, 23(1), 115-125. doi: 10.1016/s0896-6273(00)80758-8
Farkas, D. K. (2005). Understanding and using PowerPoint. Usability and Information Design, 313-320.
Feldman, J. (1999). The role of objects in perceptual grouping. Acta Psychologica, 102(2–3), 137-163. doi: http://dx.doi.org/10.1016/S0001-6918(98)00054-7
Fraher, R., & Boyd-Brent, J. (2010). Gestalt theory, engagement and interaction. Paper presented at the CHI '10 Extended Abstracts on Human Factors in Computing Systems, Atlanta, Georgia, USA.
Gabrielle, B. R. (2010). Speaking PowerPoint. The new language of business. The business leader's guide to boardroom-style slides. Sevierville, Tennessee: Insignt Publishing.
Gault, A. W. (2012). Passive visual behavior modifiers and consumer psychophysiology online. (1510453 M.F.A.), University of Central Oklahoma, Ann Arbor. ProQuest Dissertations & Theses Full Text; ProQuest Dissertations & Theses Global database.
George, R. P., Anwar, R., & Jeyasekhar, S. (2011). Visual reading patterns on Arabic Interfaces: Insights from Eye Tracking. Journal of Computing, 3(11), 109-114.
Glicksohn, A., & Cohen, A. (2011). The role of Gestalt grouping principles in visual statistical learning. Attention, Perception and Psychophysics, 73(3), 708-713.
Graham, L. (2008). Gestalt theory in interactive media design. Journal of Humanities and Social Sciences, 2(1), 1-12.
Green, C. D. (1995). All that glitters: a review of pscyhological research on the aesthetics of the golden ratio. Perception, 24, 937-968.
Groner, R., Walder, F., & Groner, M. (1984). Looking at faces: local and gloval aspects of scan paths. In A. G. Gale & F. Johnson (Eds.), Theoretical and applied aspects of eye movement research. Amsterdam: North-Holland.

Optimising Comprehension and Shaping Impressions
Bruce Hilliard© 2014 Page 29
Halverson, T., & Hornof, A. J. (2004). Local Density Guides Visual Search: Sparse Groups are First and Faster. Proceedings of the Human Factors and Ergonomics Society Annual Meeting, 48(16), 1860-1864. doi: 10.1177/154193120404801615
Hanington, B. (2006). Human centering design across dimensions. Paper presented at the International Conference of the Design Research Society, Lisbon.
Henderson, J. M., & Hollingworth, A. (1999). High-level scene perception. Annual Review of Psychology, 50, 243-271.
Henderson, J. M., Williams, C. C., Catstelhano, M. S., & Falk, R. J. (2003). Eye movements and picture processing during recognition. Perception & Psychophysics, 65(5), 725-734.
Intraub, H., Daniels, K. K., Horowitz, T. S., & Wolfe, J. M. (2008). Looking at scenes while searching for numbers: Dividing attention multiplies space. Perception & Psychophysics, 70(7), 1337-1349. doi: 10.3758/pp.70.7.1337
Jacobsen, T. (2004). Individual and group modelling of aesthetic judgment strategies. British Journal of Psychology, 95, 41-56.
Jiang, Y., & Chun, M. M. (2001). Selective attention modulates implicit learning. A Quarterly Journal of Experimental Psychology, 54(4), 1105-1124.
Jiang, Y., & Song, J.-H. (2005). Spatial context learning in visual search and change detection. Perception & Psychophysics, 67(7), 1128-1139.
Jiang, Y. V., Sigstad, H. M., & Swallow, K. M. (2013). The time course of attentional deployment in contextual cueing. Psychonomic Bulletin & Review, 20(2), 282-288. doi: 10.3758/s13423-012-0338-3
Jones, B. (2010). Understanding the Z-Layout in web design. Retrieved 17 Nov 2013, 2013, from http://webdesign.tutsplus.com/articles/design-theory/understanding-the-z-layout-in-web-design/
Kim, K. (2007). Motion Gestalt for screen design: Applied theory of grouping principles for visual motion integrity. (PhD), Illinois Institute of Technology, Chicago, Illinois. (3270907)
Kripintiris, K. E. (2008). Web aesthetics and usability: An empirical evaluation of white space. (1459215 M.A.), Michigan State University, Ann Arbor. ProQuest Dissertations & Theses Full Text; ProQuest Dissertations & Theses Global database.
Kunar, M. A., Flusberg, S. J., & Wolfe, J. M. (2006). Contextual cuing by global features. Perception & Psychophysics, 68(7), 1204-1216.
Leff, A. P., Scott, S. K., Rothwell, J. C., & Wise, R. J. S. (2001). The Planning and Guiding of Reading Saccades: a Repetitive Transcranial Magnetic Stimulation Study. Cerebral Cortex, 11(10), 918-923. doi: 10.1093/cercor/11.10.918
Leigh, R. J., & Zee, D. S. (1999). The neurology of eye movements (3rd ed.). New York: Oxford University Press.
Leykin, A., & Tuceryan, M. (2004). Determining text readability over textured backgrounds in augmented reality systems. Department of Computer Science. Indiana University/Purdue University. Indiana.
Liversedge, S. P., & Findlay, J. M. (2000). Saccadic eye movements and cognition. Trends in Cognitive Sciences, 4(1), 6-14. doi: 10.1016/s1364-6613(99)01418-7
Lok, S., Feiner, S., & Ngai, G. (2004). Evaluation of visual balance for automated layout. Paper presented at the Proceedings of the 9th international conference on Intelligent user interfaces, Funchal, Madeira, Portugal.

Optimising Comprehension and Shaping Impressions
Bruce Hilliard© 2014 Page 30
Mackiewicz, J. (2008). Comparing Powerpoint Experts' and University Students' Opinions about Powerpoint Presentations. Journal of Technical Writing & Communication, 38(2), 149-165. doi: 10.2190/TW.38.2.d
Marion, J. S., & Crowder, J. W. (2013). Visual Research : A Concise Introduction to thinking visually Retrieved from http://murdoch.eblib.com.au/patron/FullRecord.aspx?p=1334356
Matsukura, M., Luck, S. J., & Vecera, S. P. (2007). Attention effects during visual short-term memory maintenance: Protection or prioritization? Perception & Psychophysics, 69(8), 1422-1434.
Matsumoto, D. (2009). The Cambridge Dictionary of Psychology: Cambridge University Press.
Mayhoe, M. M., Shrivastava, A., Mruczek, R., & Pelz, J. B. (2003). Visual memory and motor planning in a natural task. Journal of Vision, 3, 49-63.
McGinley, M. (2009). A theory of the viewer experience of interactive television. (Ph.D.), Murdoch University, Perth, Western Australia.
Mohler, J. L., & Duff, J. M. (2000). Designing interactive web sites. Albany, NY.: Thomson Learning.
Murray, E. A., Bussey, T. J., & Saksida, L. M. (2007). Visual perception and memory: A new view of Medial Temportal Lobe function in primates and rodents. Annual Review of Neuroscience, 30, 99-122.
Myers, C. W. (2007). Scan pattern adaptation during repeated visual search. (Doctor of Philosophy), Rensselaer Polytechnic Institute, Rensselaer Polytechnic Institute Library.
Navalpakkam, V., Rao, J., & Slaney, M. (2011). Using gaze patterns to study and predict reading struggles due to distraction. Paper presented at the CHI '11 Extended Abstracts on Human Factors in Computing Systems, Vancouver, BC, Canada.
Ngo, D. C. L. (2001). Measuring the aesthetic elements of screen designs. Displays, 22, 73-78.
Ngo, D. C. L., & Ch’ng, E. (2005). Screen design with dynamic symmetry: A discovery. Computers in Human Behavior, 21(2), 307-322. doi: http://dx.doi.org/10.1016/j.chb.2004.02.013
Ngo, D. C. L., Teo, L. S., & Byrne, J. G. (2000). Formalising guidelines for the design of screen layouts. Displays, 21, 3-15.
Ngo, D. C. L., Teo, L. S., & Byrne, J. G. (2003). Modelling interface aesthetics. Information Sciences, 152(0), 25-46. doi: http://dx.doi.org/10.1016/S0020-0255(02)00404-8
Nielson, J. (2006). How people read on the Web: The eyetracking evidence (pp. 1-355). Neilsen Norman Group: Neilsen Norman Group.
Noiwan, J., & Norcio, A. F. (2006). Cultural difference on attention and perceived usability: Investigating colour combinations of animated graphics. International Journal of Human-Comuter Studies, 64, 103-122.
Noton, D., & Stark, L. (1971). Scanpaths in eye movements during pattern perception. Science, 171(3968), 308-311. doi: 10.2307/1731012
Nunn, B. (2012). Web Design: The Z Layout. Retrieved 17 Nov 2013, 2013, from http://untame.net/2012/07/web-design-the-z-layout/
O'Neil, E. B., Barkley, V. A., & Köhler, S. (2013). Representational demands modulate involvement of perirhinal cortex in face processing. Hippocampus, 23(7), 592-605. doi: 10.1002/hipo.22117
Optimising Comprehension and Shaping Impressions
Bruce Hilliard© 2014 Page 31
Olds, E. S., & Degani, M. D. (2003). Does partial difficult search help difficult search? Perception & Psychophysics, 65(2), 238-253.
Orban, G., Fiser, J., Aslin, R. N., & Lengyel, M. (2008). Bayesian learning of visual chunks by human observers. Proceedings of the National Academy of Sciences, 105(7), 2745-2750.
Otsuka, S., & Kawaguchi, J. (2009). Direct versus indirect processing changes the influence of color in natural scene categorization. Attention, Perception, & Psychophysics, 71(7), 1588-1597. doi: 10.3758/app.71.7.1588
Ou, L.-C., Luo, M. R., Woodcock, A., & Wright, A. (2004a). A study of colour emotion and colour preference. Part I: Colour emotions for single colours. Colour Research and Application, 29(3), 232-240.
Ou, L.-C., Luo, M. R., Woodcock, A., & Wright, A. (2004b). A study of colour emotion and colour preference. Part III: Colour preference modeling. Color Research & Application, 29(5), 381-389. doi: 10.1002/col.20047
Palmer, S. E., & Griscom, W. S. (2013). Accounting for taste: Individual differences in preference for harmony. Psychonomic Bulletin & Review, 20(3), 453-461. doi: http://dx.doi.org/10.3758/s13423-012-0355-2
Pathiavadi, C. S. (2009). Exploring efficient design approaches for display of multidimensional data to facilitate interpretation of information. (3420611 Ph.D.), University of South Florida, United States -- Florida. Retrieved from http://0-search.proquest.com.prospero.murdoch.edu.au/docview/750372494?accountid=12629 ProQuest Dissertations & Theses Full Text database.
Peterson, D. J., & Berryhill, M. E. (2013). The Gestalt principle of similarity benefits visual working memory. Psychonomic Bulletin & Review, 20(6), 1282-1289. doi: 10.3758/s13423-013-0460-x
Pettersson, R. (2010). Information design-principles and guidelines. Journal of Visual Literacy, 29(2), 167+.
Pilling, M., & Gellatly, A. (2011). Visual awareness of objects and their colour. Attention, Perception and Psychophysics, 73(7), 2026-2043. doi: 10.1126/science.1158023
Pralle, M. J. (2007). Visual design in the online learning environment. (M.F.A. 1446035), Iowa State University, United States -- Iowa. Retrieved from http://search.proquest.com/docview/304857919?accountid=12629 ProQuest Dissertations & Theses (PQDT) database.
Ramadan, M. Z. (2011). Evaluating college students' performance of Arabic typeface style, font size, page layout and foreground/background color combinations of e-book materials. Journal of King Saud University - Engineering Sciences, 23, 89-100.
Rayner, K. (1998). Eye movements in reading and information processing: 20 years of research. Psychological Bulletin, 124(3), 372-422. doi: http://dx.doi.org/10.1037/0033-2909.124.3.372
Reilly, S. S., & Roach, J. W. (1984). Improved visual design for graphics display. Computer Graphics and Applications, IEEE, 4(2), 42-51. doi: 10.1109/MCG.1984.275940
Reyna, V. F. (2012). A new intuitionism: Meaning, memory, and development in Fuzzy-Trace Theory. Judgment and Decision Making, 7(3), 332-359.
Roberts, M. N. (2007). Complexity and aesthetic preference for diverse visual stimuli. (Doctoral), Universitat de les Illes Balears, Palma.
Rothkopf, C. A., Ballard, D. H., & Hayhoe, M. M. (2007). Task and context determine where you look. Journal of Vision, 7(14). doi: 10.1167/7.14.16
Optimising Comprehension and Shaping Impressions
Bruce Hilliard© 2014 Page 32
Sanocki, T., & Epstein, W. (1997). Priming Spatial Layout of Scenes. Psychological Science, 8(5), 374-378.
Sanocki, T., Michelet, K., Sellers, E., & Reynolds, J. (2006). Representations of scene layout can consist of independent, functional pieces. Perception & Psychophysics, 68(3), 415-427.
Sanocki, T., Sellers, E., Mittelstadt, J., & Sulman, N. (2010). How high is visual short-term memory capacity for object layout? Attention, Perception, & Psychophysics, 72(4), 1097-1109. doi: 10.3758/app.72.4.1097
Schuett, S., Heywood, C. A., Kentridge, R. W., & Zihl, J. (2008). The significance of visual information processing in reading: Insights from hemianopic dyslexia. Neuropsychologia, 46(10), 2445-2462. doi: http://dx.doi.org/10.1016/j.neuropsychologia.2008.04.016
Seymour, K., Clifford, C. W. G., Logothetis, N. K., & Bartels, A. (2010). Coding and Binding of Color and Form in Visual Cortex. Cerebral Cortex, 20(8), 1946-1954. doi: 10.1093/cercor/bhp265
Skolos, N., & Wedell, T. (2006). Type, image, message: A graphic design layout workshop. Gloucester, MA: Rockport Publishers.
Smaldino, S. E., Lowther, D. L., & Russell, J. D. (2008). Instructional Technology and Media for Learning (9th ed.). New Jersey: Pearson Merrill Prentice Hall.
Smith-Gratto, K., & Fisher, M. M. (1999). Gestalt Theory: A foundation for instructional screen design. Journal of educational technology systems, 27(4), 1-1. doi: 10.2190/KVVE-B0EL-B0CJ-92KM
Snyder, A. C., Shpaner, M., Molholm, S., & Foxe, J. J. (2012). Visual object processing as a function of stimulus energy, retinal eccentricity and Gestalt configuration: A high-density electrical mapping study. Neuroscience, 221(0), 1-11. doi: http://dx.doi.org/10.1016/j.neuroscience.2012.03.035
Stark, L., & Ellis, P. (1981). Scanpaths revisited: cognitive models direct active looking. In D. Fisher, R. A. Monty & J. Senders (Eds.), Eye movements: cognition and visual perception. Hillsdale, NJ.: Erlbaum.
Sternberg, R. J. (1998). In search of the human mind (2nd ed.). Orlando, Florida: Harcourt Brace & Company.
Sternberg, R. J., & Mio, J. (2006). Cognitive psychology. Belmont, California: Thomson/Wadsworth.
Surenda, N. S., Nikunj, D., & Spears, N. (2005). Understanding Web home page perception. European Journal of Information Systems(14), 288-302.
Suvorov, R. (2013). Interacting with visuals in L2 listening tests: An eye-tracking study. (3597397 Ph.D.), Iowa State University, Ann Arbor. ProQuest Dissertations & Theses Full Text; ProQuest Dissertations & Theses Global database.
Tatler, B. W. (2009). Current understanding of eye guidance. Visual Cognition, 17(6-7), 777-789. doi: 10.1080/13506280902869213
Thompson, A. M. (2008). Visual PowerPoint: Photographic principles to revitalise slides. (Master of Arts), University of Arkansas, University of Arkansas. (1453494)
Tileagă, C. (2011). Context, mental models and discourse analysis. Journal of Sociolinguistics, 15(1), 124-134. doi: 10.1111/j.1467-9841.2010.00475.x
Tractinsky, N., Inbar, O., Tsimhoni, O., & Seder, T. (2011). Slow down, you move too fast: examining animation aesthetics to promote eco-driving. Paper presented at the Proceedings of the 3rd International Conference on Automotive User Interfaces and Interactive Vehicular Applications, Salzburg, Austria.

Optimising Comprehension and Shaping Impressions
Bruce Hilliard© 2014 Page 33
Um, E. R. (2008). The effect of positive emotions on cognitive processes in multimedia-based learning. (Ph.D. 3308294), New York University, United States -- New York. Retrieved from http://search.proquest.com/docview/304528012?accountid=12629 ProQuest Dissertations & Theses (PQDT) database.
van den Berg, M., Kubovy, M., & Schirillo, J. A. (2011). Grouping by Regularity and the perception of illumination. Vision Research, 51(12), 1360-1371. doi: http://dx.doi.org/10.1016/j.visres.2011.04.013
VanRullen, R., & Koch, C. (2001). The capacity of visual awareness. Journal of Vision, 1(3), 209. doi: 10.1167/1.3.209
Waller, D., & Richardson, A. R. (2008). Correcting distance estimates by interacting with immersive virtual environments: Effects of task and available sensory information. Journal of Experimental Psychology: Applied, 14(1), 61-72. doi: 10.1145/ 1077399.1077403
Ward, E. J., MacEvoy, S. P., & Epstein, R. A. (2010). Eye-centered encoding of visual space in scene-selective regions. Journal of Vision, 10(14). doi: 10.1167/10.14.6
Wästlund, E., Norlander, T., & Archer, T. (2008). The effect of page layout on mental workload: A dual-task experiment. Computers in Human Behavior, 24(3), 1229-1245. doi: http://dx.doi.org/10.1016/j.chb.2007.05.001
Wei, D. (2011). Cultural difference in image searching. Paper presented at the PART 2 ----------- Proceedings of the 2011 annual conference extended abstracts on Human factors in computing systems, Vancouver, BC, Canada.
Wertheimer, M. (1923). Untersuchungen zur Lehre von der Gestalt II (W. Ellis, Trans.) A source book of Gestalt Psychology (pp. 71-88). London: Routledge & Kegan Paul.
Wheildon, C. (1990). Communicating or just making pretty shapes.
Wheildon, C. (2005). Type and Layout. Are you communicating, or just making pretty shapes. Hastings, Victoria: The Worsley Press.
Wolfe, C. R. (2006). Cognitive technologies for gist processing. Behavior Research Methods, 38(2), 183-189. doi: 10.3758/BF03192767
Wolfe, J. M., & Horowitz, T. S. (2004). What attributes guide the deployment of visual attention and how do they do it? Neuroscience, 5, 1-7.
Wolfe, J. M., Võ, M. L. H., Evans, K. K., & Greene, M. R. (2011). Visual search in scenes involves selective and nonselective pathways. Trends in Cognitive Sciences, 15(2), 77-84. doi: http://dx.doi.org/10.1016/j.tics.2010.12.001
Wu, O., Hu, W., & Shi, L. (2013). Measuring the Visual Complexities of Web Pages. ACM Trans. Web, 7(1), 1-34. doi: 10.1145/2435215.2435216
Xu, Y., & Chun, M. M. (2007). Visual grouping in human parietal cortex. Procedings of the National Academy of Sciences USA, 104(47), 18766-18771.
Yang, X. (1995). Visual balance: The tightrope of computer generated layout. (Master of Science), Massachusetts Insitute of Technology, Massachusetts.
Yang, Y. Z. (2006). The Role of Gestalt Principle in the Creation of Object File. (H156187 ADV DEG), Zhejiang University (People's Republic of China), Ann Arbor. ProQuest Dissertations & Theses Global database.
Yonggang, Q., Jun, G., Yi, L., Honggang, Z., Tao, X., Yi-Zhe, S., & Zheng-Hua, T. (2013, 17-20 Nov. 2013). Perceptual grouping via untangling Gestalt principles. Paper presented at the Visual Communications and Image Processing (VCIP), 2013.
Ziemkiewicz, C. (2010). Understanding the structure of information visualization through visual metaphors. (Ph.D. 3404886), The University of North Carolina at Charlotte, United States -- North Carolina. Retrieved from

Optimising Comprehension and Shaping Impressions
Bruce Hilliard© 2014 Page 34
http://search.proquest.com/docview/520167957?accountid=12629 ProQuest Dissertations & Theses (PQDT) database.
Zimmer, H. D. (2008). Visual and spatial working memory: From boxes to networks. Neuroscience & Biobehavioral Reviews, 32(8), 1373-1395. doi: 10.1016/j.neubiorev.2008.05.016