by dr mohd ayzam bin ahmad dissertation submitted in...
TRANSCRIPT
A STUDY ON PREVALENCE OF HEARING IMPAIRMENT
AND EAR DISEASES AMONG NAVY PERSONNEL OF
THE ROYAL MALAYSIAN NAVY,
LUMUT PERAK
By
DR MOHD AYZAM BIN AHMAD
Dissertation Submitted In
Partial Fulfillment Of The Requirements
For The Degree of
Master Of Medicine
(Otorhinolaryngology- Head and Neck Surgery)
UNIVERSITI SAINS MALAYSIA 2011
ACKNOWLEDGEMENTS
Praises to Allah, the Most Merciful and Most Gracious for allowed me to complete this study
without much difficulty. There has been abundant support and encouragement from many
great people around me with never ending ideas and suggestions that boosted my motivation
to complete the work.
First and foremost, I would like to thank my supervisors, Prof. Dr Dinsuhaimi B. Sidek and
Dr Shamim Ahmed Khan, who from the beginning of the study, initiated the ideas, continued
support and eased up my work to make the study become reality. I would like also to forward
my deepest gratitude to Brig. General Dato Dr Zulkaflay and Sarjan Noraini from Hospital
Angkatan Tentera, Lumut, Perak, for their support during the period of research.
I would like also forever grateful to Assc. Prof Dr Haji Rosdan B Hj Salim, the Head of the
Department of Otorhinolaryngology-Head and Neck Surgery for his support and guidance
along the study.
My sincere thanks also go to Prof Dr Syed Hatim and his team who helped me in analyzing
the data.
I would like to take this opportunity to thanks to my beloved parents, En. Ahmad and Puan
Maridzuan and family who had always supported and encouraged me in all my undertakings.
Finally, I had received enorminous continuous support, understanding and patience from my
forever loving wife, Siti Halijah Bt Hj Hashim and my cute son Muhammad Aisy Hadif.
Without their support, this study would not have been successful and memorable. Thank very
much.
Alhamdullilahirabbil Alamin.
TABLE OF CONTENTS
CONTENTS
PAGE
LIST OF TABLES vi
LIST OF FIGURES viii
LIST OF ABBREVIATIONS ix
ABSTRACT IN BAHASA MELAYU x
ABSTRACT IN ENGLISH xi
CHAPTER 1: INTRODUCTION
1.1 INTRODUCTION AND LITERATURE REVIEW 1
1.2 DEFINITION OF HEARING IMPAIRMENT AND 5
HEARING LOSS
1.3 DEFINITION OF NOISE-INDUCED HEARING LOSS 6
1.4 PATHOPHYSIOLOGY 8
1.5 CONSEQUENCES OF HEARING IMPAIRMENT 9
1.6 THE IMPORTANCE OF HEARING
CONSERVATION PROGRAMMES 10
CHAPTER 2: OBJECTIVES 11
2.1 GENERAL OBJECTIVE S
2.2 SPECIFIC OBJECTIVES
2.3 RESEARCH HYPOTHESIS
CHPATER 3: METHODOLOGY 12
3.1 STUDY DESIGN
3.2 SELECTION CRITERIA
3.2.1 INCLUSION CRITERIA
3.2.2 EXCLUSION CRITERIA
3.3 SAMPLE SIZE 13
3.4 EQUIPMENTS 14
3.4.1 QUESTIONNAIRE
3.4.2 OTOSCOPE
3.4.3 TYMPANOMETER
3.4.4 OTOACOUSTIC EMISSON
SCREENER MACHINE
3.4.5 PURE TONE AUDIOMETER
3.4.6 SOUND TREATED BOOTH
3.5 STUDY PROCEDURE 17
CHAPTER 4: RESULTS
4.0 RESULT
4.1 TOTAL NUMBER OF PARTICIPANTS 21
4.2 RACE DISTRIBUTION 21
4.3. GENDER DISTRIBUTION 22
4.4 AGE DISTRIBUTION 23
4.5. DURATION OF SERVICE 24
4.6. OTOSCOPIC EXAMINATION 25
4.7 TYMPANOMETRY RESULTS 26
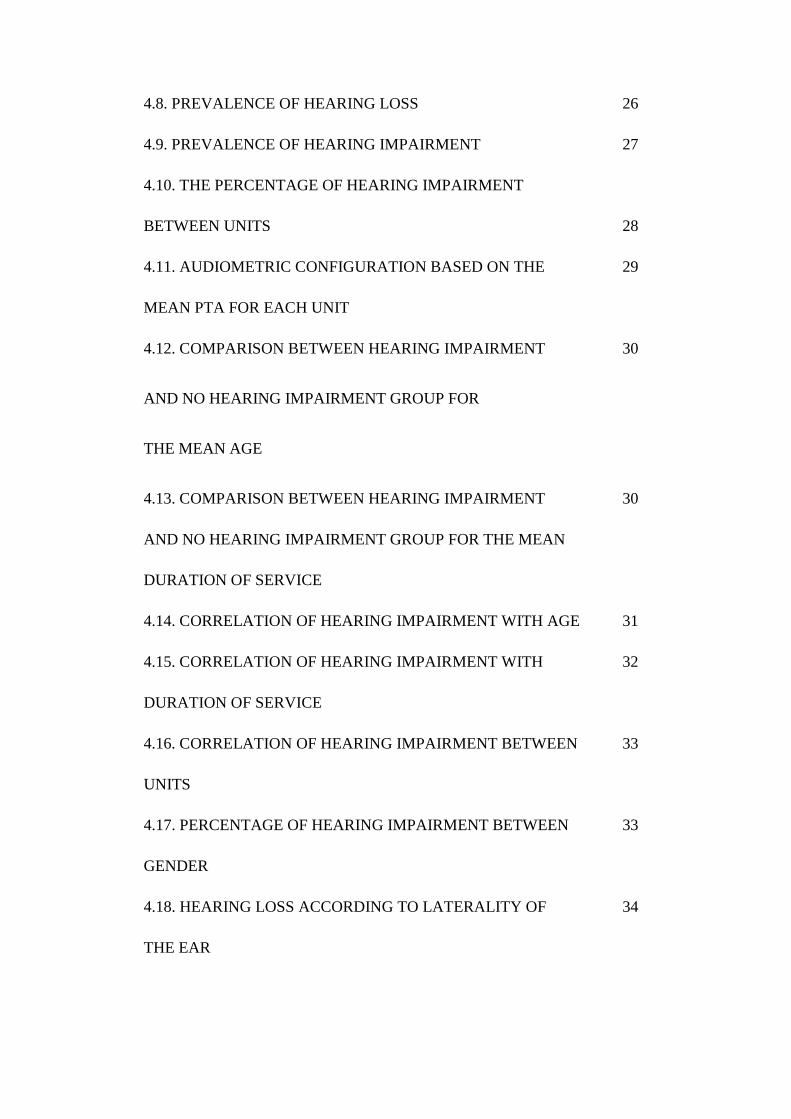
4.8. PREVALENCE OF HEARING LOSS 26
4.9. PREVALENCE OF HEARING IMPAIRMENT 27
4.10. THE PERCENTAGE OF HEARING IMPAIRMENT
BETWEEN UNITS 28
4.11. AUDIOMETRIC CONFIGURATION BASED ON THE 29
MEAN PTA FOR EACH UNIT
4.12. COMPARISON BETWEEN HEARING IMPAIRMENT 30
AND NO HEARING IMPAIRMENT GROUP FOR
THE MEAN AGE
4.13. COMPARISON BETWEEN HEARING IMPAIRMENT 30
AND NO HEARING IMPAIRMENT GROUP FOR THE MEAN
DURATION OF SERVICE
4.14. CORRELATION OF HEARING IMPAIRMENT WITH AGE 31
4.15. CORRELATION OF HEARING IMPAIRMENT WITH 32
DURATION OF SERVICE
4.16. CORRELATION OF HEARING IMPAIRMENT BETWEEN 33
UNITS
4.17. PERCENTAGE OF HEARING IMPAIRMENT BETWEEN 33
GENDER
4.18. HEARING LOSS ACCORDING TO LATERALITY OF 34
THE EAR
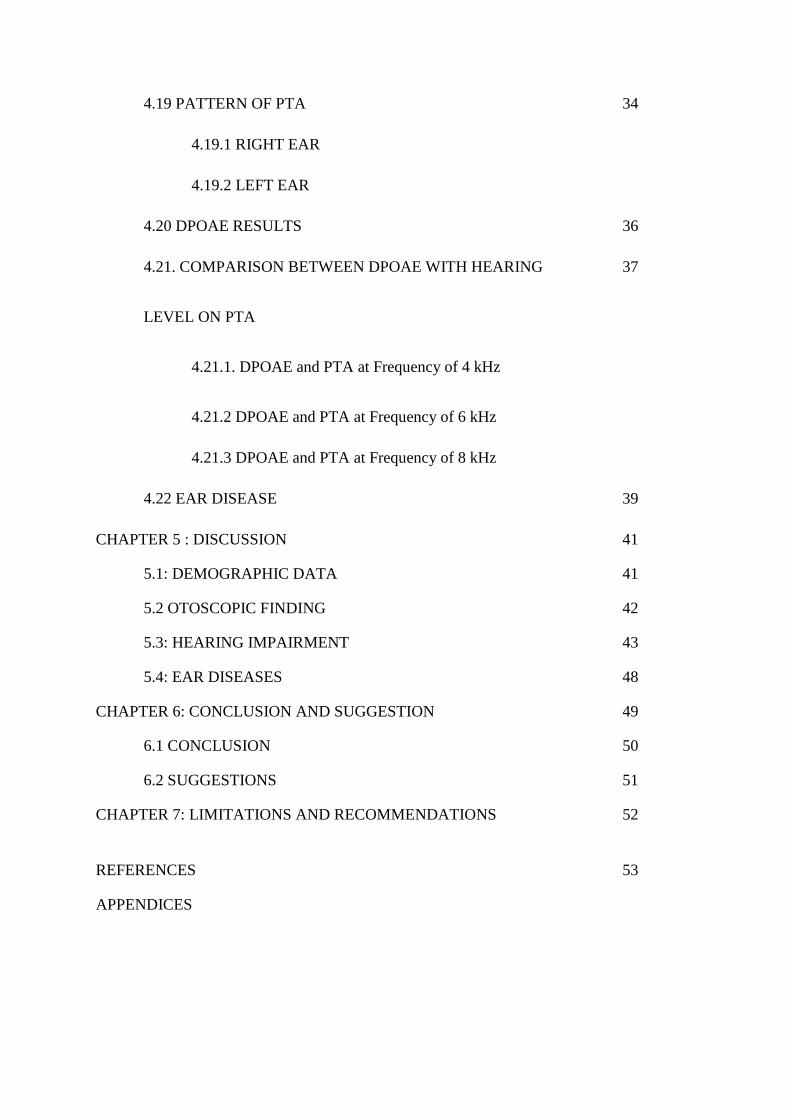
4.19 PATTERN OF PTA 34
4.19.1 RIGHT EAR
4.19.2 LEFT EAR
4.20 DPOAE RESULTS 36
4.21. COMPARISON BETWEEN DPOAE WITH HEARING 37
LEVEL ON PTA
4.21.1. DPOAE and PTA at Frequency of 4 kHz
4.21.2 DPOAE and PTA at Frequency of 6 kHz
4.21.3 DPOAE and PTA at Frequency of 8 kHz
4.22 EAR DISEASE 39
CHAPTER 5 : DISCUSSION 41
5.1: DEMOGRAPHIC DATA 41
5.2 OTOSCOPIC FINDING 42
5.3: HEARING IMPAIRMENT 43
5.4: EAR DISEASES 48
CHAPTER 6: CONCLUSION AND SUGGESTION 49
6.1 CONCLUSION 50
6.2 SUGGESTIONS 51
CHAPTER 7: LIMITATIONS AND RECOMMENDATIONS 52
REFERENCES 53
APPENDICES
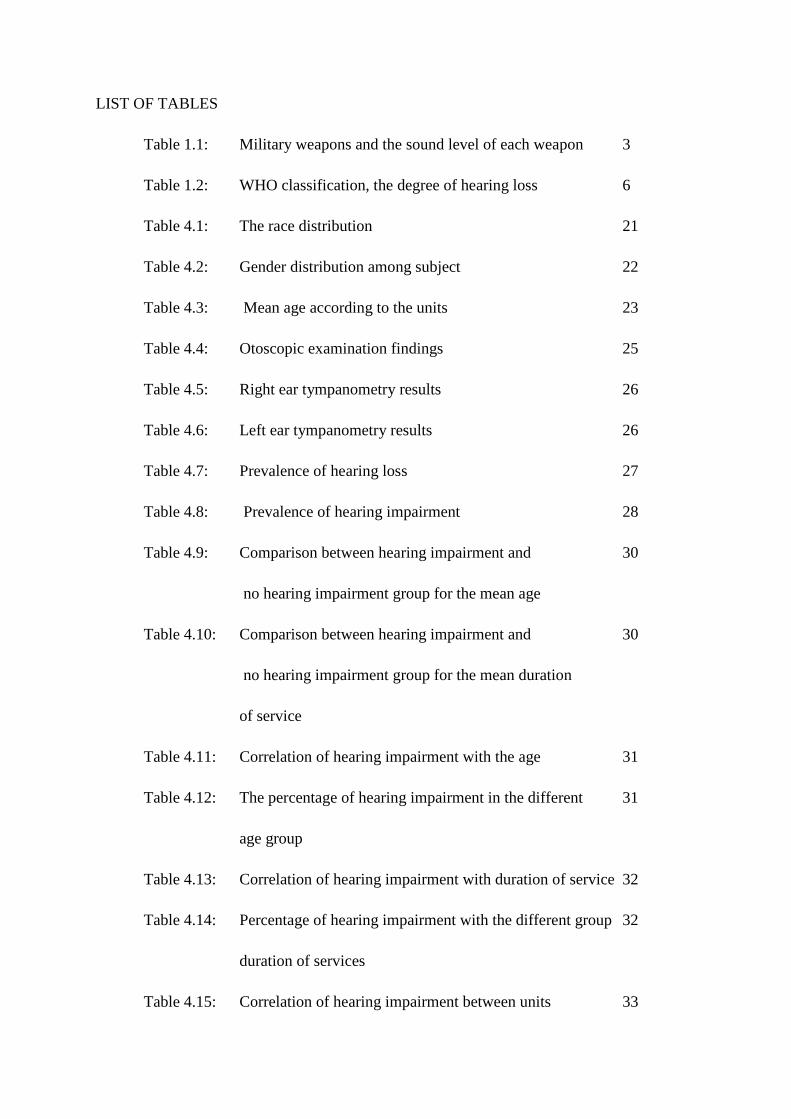
LIST OF TABLES
Table 1.1: Military weapons and the sound level of each weapon 3
Table 1.2: WHO classification, the degree of hearing loss 6
Table 4.1: The race distribution 21
Table 4.2: Gender distribution among subject 22
Table 4.3: Mean age according to the units 23
Table 4.4: Otoscopic examination findings 25
Table 4.5: Right ear tympanometry results 26
Table 4.6: Left ear tympanometry results 26
Table 4.7: Prevalence of hearing loss 27
Table 4.8: Prevalence of hearing impairment 28
Table 4.9: Comparison between hearing impairment and 30
no hearing impairment group for the mean age
Table 4.10: Comparison between hearing impairment and 30
no hearing impairment group for the mean duration
of service
Table 4.11: Correlation of hearing impairment with the age 31
Table 4.12: The percentage of hearing impairment in the different 31
age group
Table 4.13: Correlation of hearing impairment with duration of service 32
Table 4.14: Percentage of hearing impairment with the different group 32
duration of services
Table 4.15: Correlation of hearing impairment between units 33
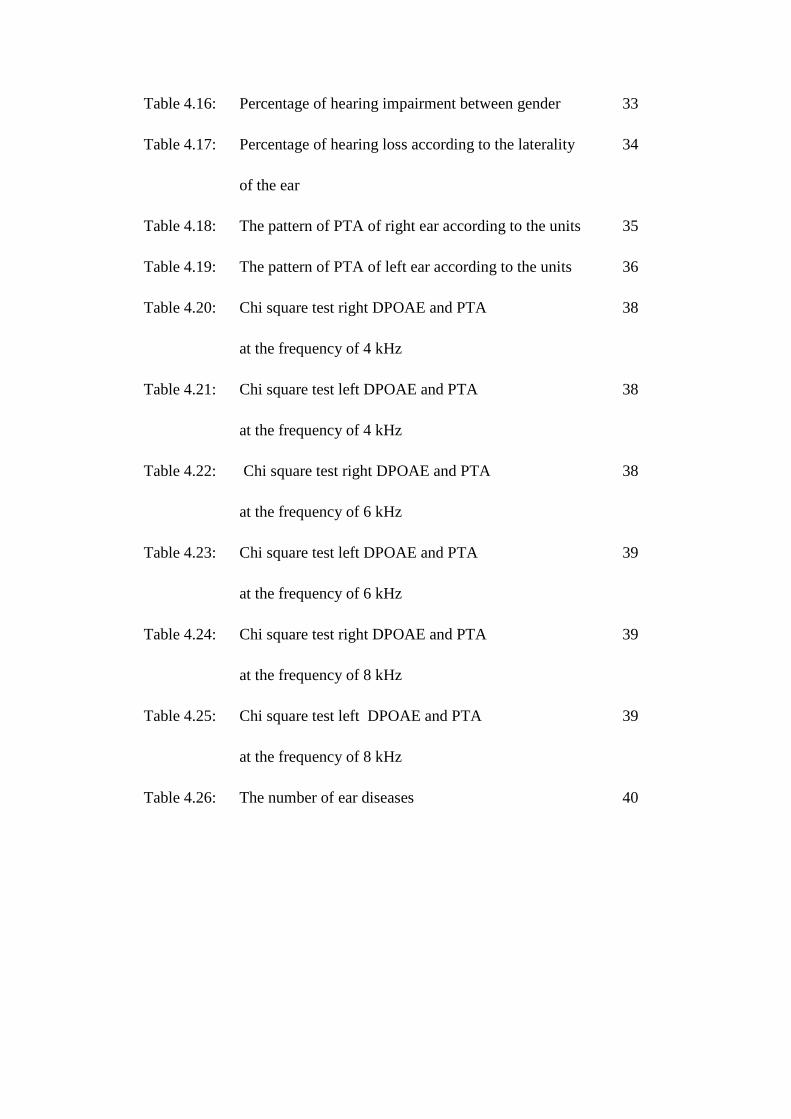
Table 4.16: Percentage of hearing impairment between gender 33
Table 4.17: Percentage of hearing loss according to the laterality 34
of the ear
Table 4.18: The pattern of PTA of right ear according to the units 35
Table 4.19: The pattern of PTA of left ear according to the units 36
Table 4.20: Chi square test right DPOAE and PTA 38
at the frequency of 4 kHz
Table 4.21: Chi square test left DPOAE and PTA 38
at the frequency of 4 kHz
Table 4.22: Chi square test right DPOAE and PTA 38
at the frequency of 6 kHz
Table 4.23: Chi square test left DPOAE and PTA 39
at the frequency of 6 kHz
Table 4.24: Chi square test right DPOAE and PTA 39
at the frequency of 8 kHz
Table 4.25: Chi square test left DPOAE and PTA 39
at the frequency of 8 kHz
Table 4.26: The number of ear diseases 40
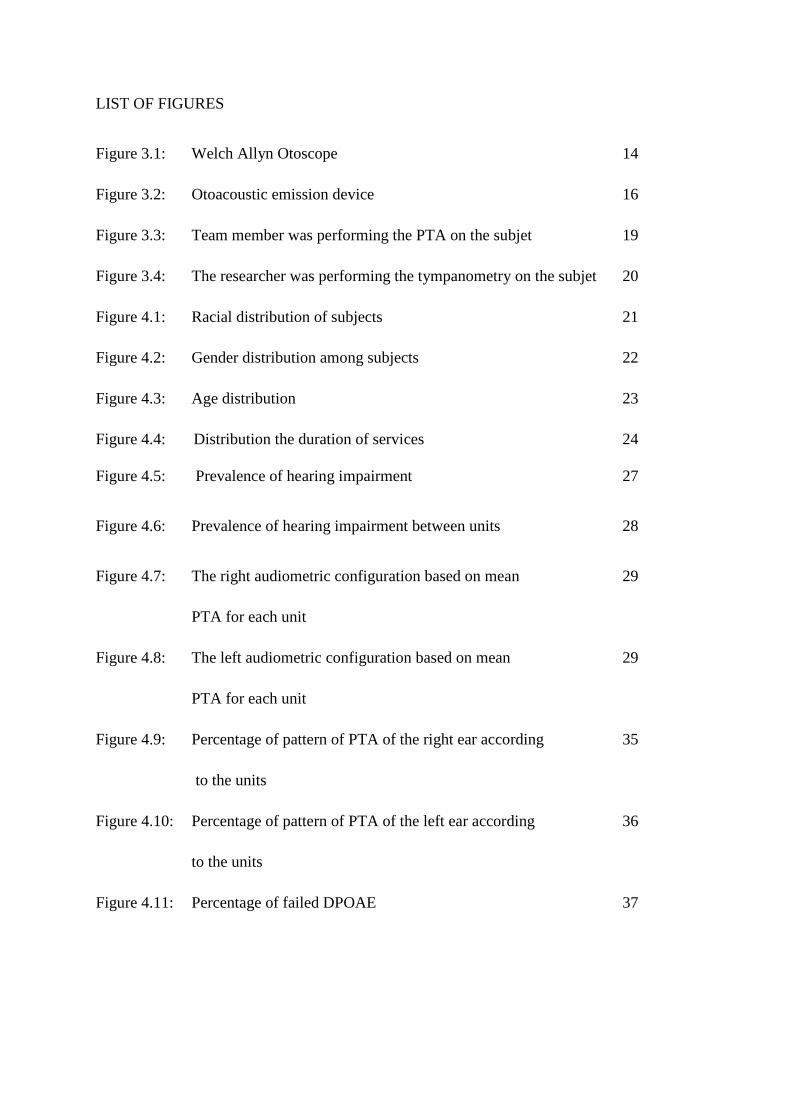
LIST OF FIGURES
Figure 3.1: Welch Allyn Otoscope 14
Figure 3.2: Otoacoustic emission device 16
Figure 3.3: Team member was performing the PTA on the subjet 19
Figure 3.4: The researcher was performing the tympanometry on the subjet 20
Figure 4.1: Racial distribution of subjects 21
Figure 4.2: Gender distribution among subjects 22
Figure 4.3: Age distribution 23
Figure 4.4: Distribution the duration of services 24
Figure 4.5: Prevalence of hearing impairment 27
Figure 4.6: Prevalence of hearing impairment between units 28
Figure 4.7: The right audiometric configuration based on mean 29
PTA for each unit
Figure 4.8: The left audiometric configuration based on mean 29
PTA for each unit
Figure 4.9: Percentage of pattern of PTA of the right ear according 35
to the units
Figure 4.10: Percentage of pattern of PTA of the left ear according 36
to the units
Figure 4.11: Percentage of failed DPOAE 37
LIST OF ABBREVIATIONS
CHL Conductive Hearing Loss
dB Decibel
Hz Hertz
kHz kiloHertz
TTS Transient thereshold shift
PTS Permanent thereshold shift
OAE Otoacoustic Emission
DPOAE Distortion product otoacoustic emission
PTA Pure Tone Audiometry
WHO World Health Organization
ABSTRACT OF DISSERTATION
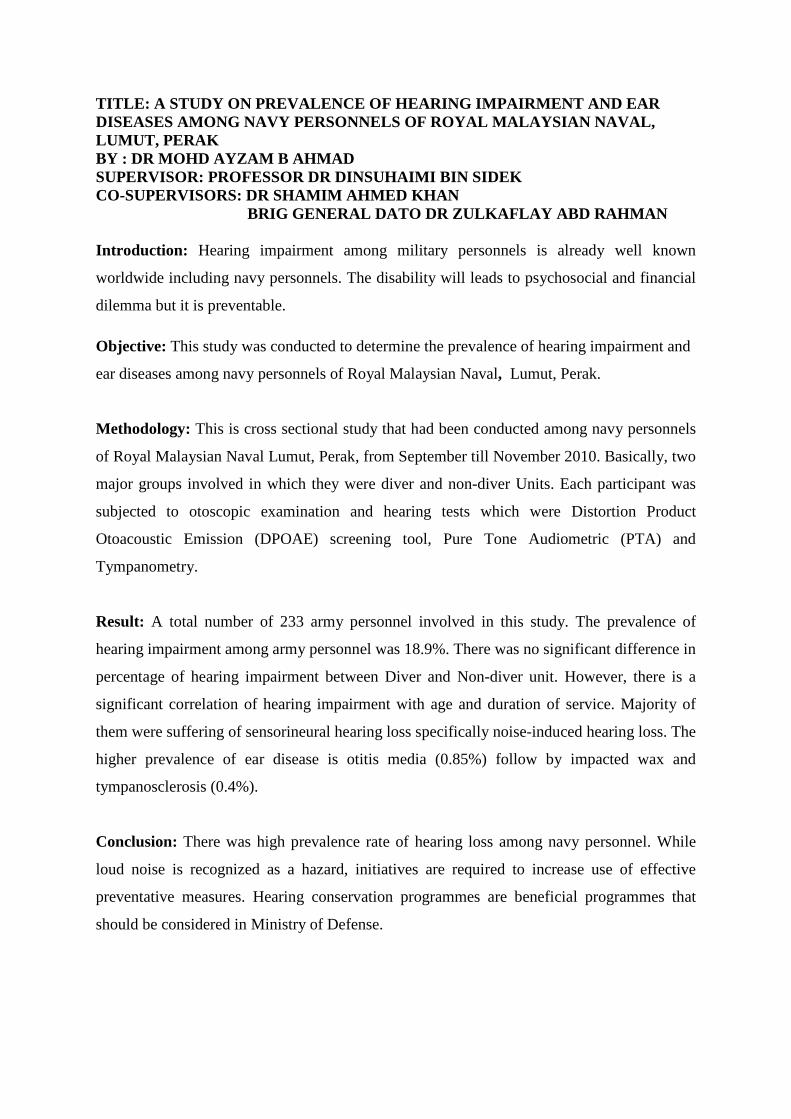
TITLE: A STUDY ON PREVALENCE OF HEARING IMPAIRMENT AND EAR DISEASES AMONG NAVY PERSONNELS OF ROYAL MALAYSIAN NAVAL, LUMUT, PERAK BY : DR MOHD AYZAM B AHMAD SUPERVISOR: PROFESSOR DR DINSUHAIMI BIN SIDEK CO-SUPERVISORS: DR SHAMIM AHMED KHAN BRIG GENERAL DATO DR ZULKAFLAY ABD RAHMAN Introduction: Hearing impairment among military personnels is already well known
worldwide including navy personnels. The disability will leads to psychosocial and financial
dilemma but it is preventable.
Objective: This study was conducted to determine the prevalence of hearing impairment and
ear diseases among navy personnels of Royal Malaysian Naval, Lumut, Perak.
Methodology: This is cross sectional study that had been conducted among navy personnels
of Royal Malaysian Naval Lumut, Perak, from September till November 2010. Basically, two
major groups involved in which they were diver and non-diver Units. Each participant was
subjected to otoscopic examination and hearing tests which were Distortion Product
Otoacoustic Emission (DPOAE) screening tool, Pure Tone Audiometric (PTA) and
Tympanometry.
Result: A total number of 233 army personnel involved in this study. The prevalence of
hearing impairment among army personnel was 18.9%. There was no significant difference in
percentage of hearing impairment between Diver and Non-diver unit. However, there is a
significant correlation of hearing impairment with age and duration of service. Majority of
them were suffering of sensorineural hearing loss specifically noise-induced hearing loss. The
higher prevalence of ear disease is otitis media (0.85%) follow by impacted wax and
tympanosclerosis (0.4%).
Conclusion: There was high prevalence rate of hearing loss among navy personnel. While
loud noise is recognized as a hazard, initiatives are required to increase use of effective
preventative measures. Hearing conservation programmes are beneficial programmes that
should be considered in Ministry of Defense.
ABSTRAK
Pengenalan: Masalah hilang pendengaran dikalangan anggota tentera diketahui umum
termasuklah tentera laut. Masalah ini memberi kesan kepada psikososial dan kewangan tetapi
ianya boleh dielakkan.
Objektif: Kajian ini dilakukan untuk mengenalpasti jumlah peratus kekurangan tahap
pendengaran dan penyakit-penyakit telinga di kalangan anggota Tentera Laut Diraja
Malaysia, Lumut, Perak.
Metodologi: Kajian ini merupakan kajian hirisan lintang di kalangan anggota Tentera Laut
Diraja Malaysia, Lumut, Perak dari September sehingga November 2010. Secara umumnya,
anggota tentera laut dibahagikan kepada dua unit utama iaitu unit penyelam dan bukan
penyelam yang terdiri dari bahagian kapal perang permukaan dan teknikal. Setiap anggota
menjalani pemeriksaan telinga dan ujian pendengaran iaitu ‘Tympanometry’, ‘Distortion
Otoacoustic Emission’ (DPOEA) dan ‘Pure Tone Audiometry’ (PTA).
Keputusan: Sejumlah 233 anggota terlibat dalam kajian ini. Hasil kajian menunjukkan
peratusan kurang pendengaran dikalangan anggota tentera laut ialah 18.9%. Namun kajian
menunjukkan tidak terdapat perbezaan yang signifikan antara unit penyelam dan bukan
penyelam. Akan tetapi terdapat hubungan yang signifikan antara tahap kekurangan
pendengaran dengan factor umur dan tempoh berkhidmat. Manakala bagi penyakit telinga,
peratus tertinggi bagi penyakit telinga adalah jangkitan telinga tengah iaitu 0.85%.
Kesimpulan: Kajian ini menunjukkan peratusan kurang pendengaran yang agak tinggi
dikalangan anggota tentera laut. Oleh kerana kita mengetahui bunyi yang kuat adalah satu
pencemaran dan boleh mengakibatkan kekurangan tahap pendengaran, maka usaha untuk
meningkatkan cara pemeliharaan pendengaran yang berkesan adalah amat penting. “Program
Pemeliharaan Pendengaran” adalah program yang sangat berfaedah untuk diambil kira dan
dilaksanakan oleh Kementerian Pertahanan.

CHAPTER 1
INTRODUCTION
1.0 INTRODUCTION
1.1 INTRODUCTION AND LITERATURE REVIEW
Hearing impairment among military personnels is already well known worldwide. People
serving in military at some point will be exposed to high-intensity noise of various types. A
wide range of weapons inflict damage on their operators as well as targeted enemy. The
consensus group agreed that a sound environment of below 75dB was not harmful (Alberti
P.W., 1992). Above this level, the transient threshold shift (TTS) occurs. However, the
severity is depending upon frequency of sound and individual susceptibility. TTS will
recover after periods of time. The greater the exposure, the longer recovery time till at one
point, it will become permanent damage and this is described as permanent threshold shift
(PTS).
Like an army personnels, permanent hearing loss is one of the most common disabilities
among navy personnel as well. Although noise-induced injury is preventable by limiting
exposure, it is generally irreversible once it occurs. The problem of reduced hearing function
in active navy personnel has been documented in several studies. For example, using data
from 1995 to 1999 Bonhker, et al. (2002), showed a significant threshold shift (STS) as high
25% in some Navy Personnel Ratings. Similar findings of hearing loss among military
personnel are discussed in Gwin and Lacroix (1985) for submariners, Wolgemuth, K.S. et al.
(1995) for Navy personnel, Ridgley and Wilkins (1991) for both Army and Navy personnel.
In 2004 the Veterans Administration (VA) spent $108 Million dollars in disability payments
to 15.8 thousand former Navy personnel for hearing loss. This represents an increase of $65
Million in spending by the VA on Navy hearing disability payments since 1999 (Geoffrey
and Robert, 2007).
Given the enormity of the increase in spending by the VA on hearing loss disability payments
to former Navy personnel, it is important to find the sources of this hearing loss and then
investigate ways to reverse this trend. Although there are poorly understood individual
susceptibilities to ear injury, and there may be individual predisposing factors such as
hypertension, reliable measures for hearing screening on groups has become standard
management in occupational health and safety. National standards of exposure are established
by Occupational Safety and Health Administration (OSHA) of the US Department of Labor
at 90 dB for 8 hours a day. The US Navy abides by the standards given in OPNAVINST
5100.19D, "Occupational Safety and Health Program Manual for Forces Afloat," which
specifies that the 8-hour time-weighted average (TWA) is 84 dB(A). This instruction defines
noise hazardous areas as areas where the routine noise is greater than 84 dB(A) or where peak
noise levels are greater than 140 dB. In these areas, hearing protection or administrative
controls are required. This study did not evaluate the degree of compliance with these
exposure limits.
The primary focus of this study is to find out if the length of service impacts hearing loss.
Over a career in the Malaysian navy, service members characteristically are posted to a
variety of stations, both afloat and ashore. Many of these posts have high noise levels, such as
certain ships; and particular ratings have high exposure, such as jobs near machines. If
assignments of higher risk both in location and tasking can be identified, then focused
prevention programs can be brought to bear, such as closer monitoring of all personnel,
preventive measures in key high risk locations and ratings, and perhaps better rotational
schedules.
All these preventative methods may reduce damage to the hearing of navy personnel. This
will preserve quality of life for personnel, and save millions of dollars for government.
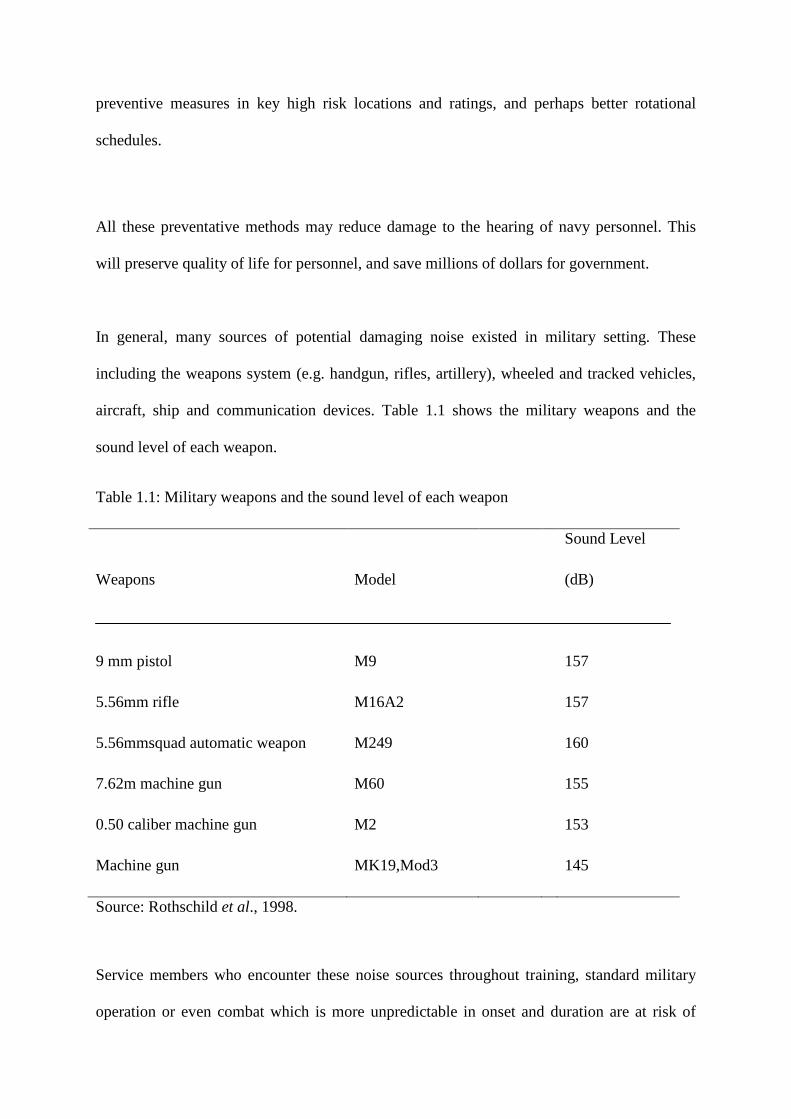
In general, many sources of potential damaging noise existed in military setting. These
including the weapons system (e.g. handgun, rifles, artillery), wheeled and tracked vehicles,
aircraft, ship and communication devices. Table 1.1 shows the military weapons and the
sound level of each weapon.
Table 1.1: Military weapons and the sound level of each weapon
Weapons
Model
Sound Level
(dB)
9 mm pistol M9 157
5.56mm rifle M16A2 157
5.56mmsquad automatic weapon M249 160
7.62m machine gun M60 155
0.50 caliber machine gun M2 153
Machine gun MK19,Mod3 145
Source: Rothschild et al., 1998.
Service members who encounter these noise sources throughout training, standard military
operation or even combat which is more unpredictable in onset and duration are at risk of
getting hearing impairment. Two possible risks are high frequency noise-induced hearing loss
and tinnitus, typically referred as ‘ringing of the ears’. This morbidity is well known to be
suffered and common among army personnel throughout the world but remains to be
‘hidden’ in most countries.
This study is to document the prevalence of hearing impairment and ear diseases among the
navy personnels in Hospital Angkatan Tentera Laut (HAT), Lumut, Perak. According to
Geoffrey and Robert (2007) statistical analysis of hearing impairment in navy found out that
13% of navy personnel have worsening hearing level meanwhile, Zulkaflay et al. (1996)
Hospital Angkatan tentera, Lumut, revealed insidious development of high frequency
sensorineural hearing loss may associated with diving.
1.2 DEFINITION OF HEARING LOSS AND HEARING IMPAIRMENT
Hearing threshold worse than 25dB at any frequency in either ear is defined as hearing loss.
Hearing loss can either be in the low frequency range (0.5 to 2 kHz), high frequency range (4
to 8 kHz) or both ranges. The magnitude of hearing loss is determined by taking the mean
threshold of 0.5, 1 and 2 kHz for low frequency hearing loss; the mean threshold of 4, 6 and
8 kHz if the hearing loss involved the high frequency and the mean of all frequencies if
occurring in both ranges. Thus, the definition of hearing loss is presence of the mean hearing
threshold level worse than 25dB in either ear (Toh et al., 2002).
The disabling hearing impairment of adult as defined by WHO is the permanent unaided
hearing threshold level for the better ear of 41dB or greater, the “hearing threshold level” is
to be taken as the average of hearing threshold level for the four frequencies 0.5, 1.2 and 4
kHz. Hearing impairment is classified into 3 major groups. The majority of hearing
impairment is sensorineural type. It is related to disease of deformity of cochlea or cochlea
nerve/retrocochlear. In this type of hearing impairment , there is no air-bone gap. Whereas if
the air bone gap is 15dB or greater with normal tone conduction threshold, the individual has
a significant conductive pathology contributing to the impairment. It is usually caused by
either disease of external or middle ear. Some individuals having both components of
conductive and sensorineural which is classified as mixed hearing loss.
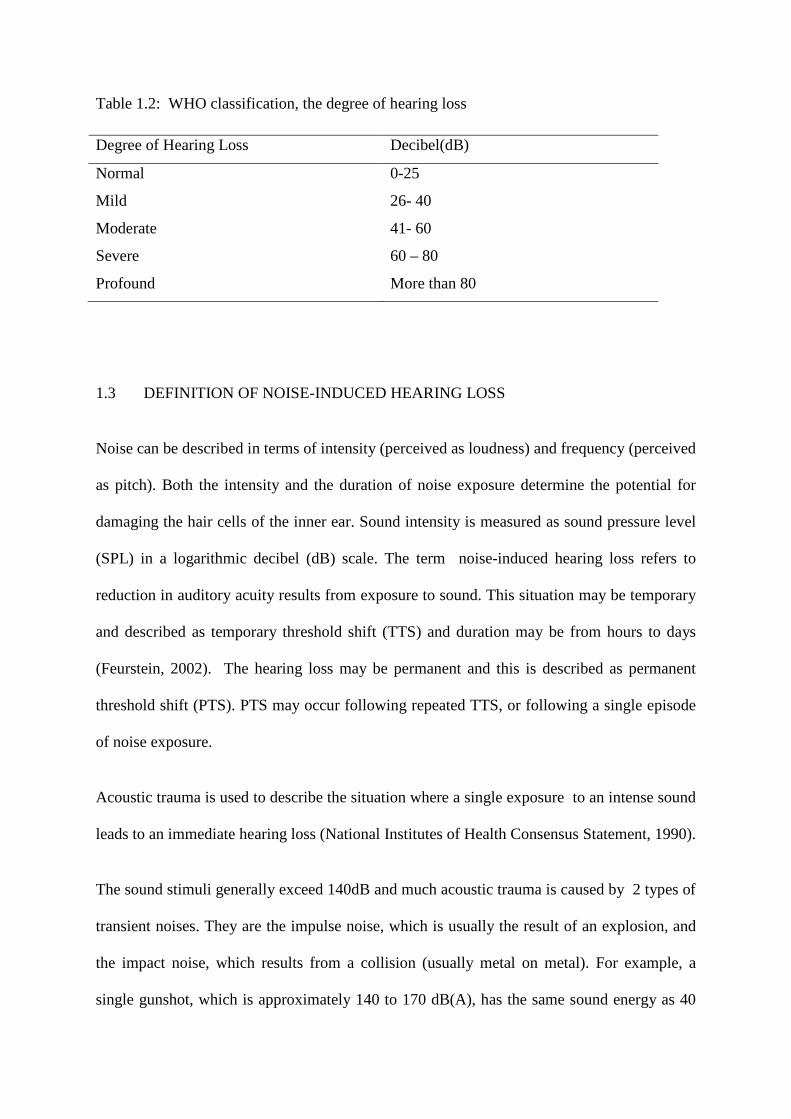
Table 1.2: WHO classification, the degree of hearing loss
Degree of Hearing Loss Decibel(dB)
Normal 0-25
Mild 26- 40
Moderate 41- 60
Severe 60 – 80
Profound More than 80
1.3 DEFINITION OF NOISE-INDUCED HEARING LOSS
Noise can be described in terms of intensity (perceived as loudness) and frequency (perceived
as pitch). Both the intensity and the duration of noise exposure determine the potential for
damaging the hair cells of the inner ear. Sound intensity is measured as sound pressure level
(SPL) in a logarithmic decibel (dB) scale. The term noise-induced hearing loss refers to
reduction in auditory acuity results from exposure to sound. This situation may be temporary
and described as temporary threshold shift (TTS) and duration may be from hours to days
(Feurstein, 2002). The hearing loss may be permanent and this is described as permanent
threshold shift (PTS). PTS may occur following repeated TTS, or following a single episode
of noise exposure.
Acoustic trauma is used to describe the situation where a single exposure to an intense sound
leads to an immediate hearing loss (National Institutes of Health Consensus Statement, 1990).
The sound stimuli generally exceed 140dB and much acoustic trauma is caused by 2 types of
transient noises. They are the impulse noise, which is usually the result of an explosion, and
the impact noise, which results from a collision (usually metal on metal). For example, a
single gunshot, which is approximately 140 to 170 dB(A), has the same sound energy as 40
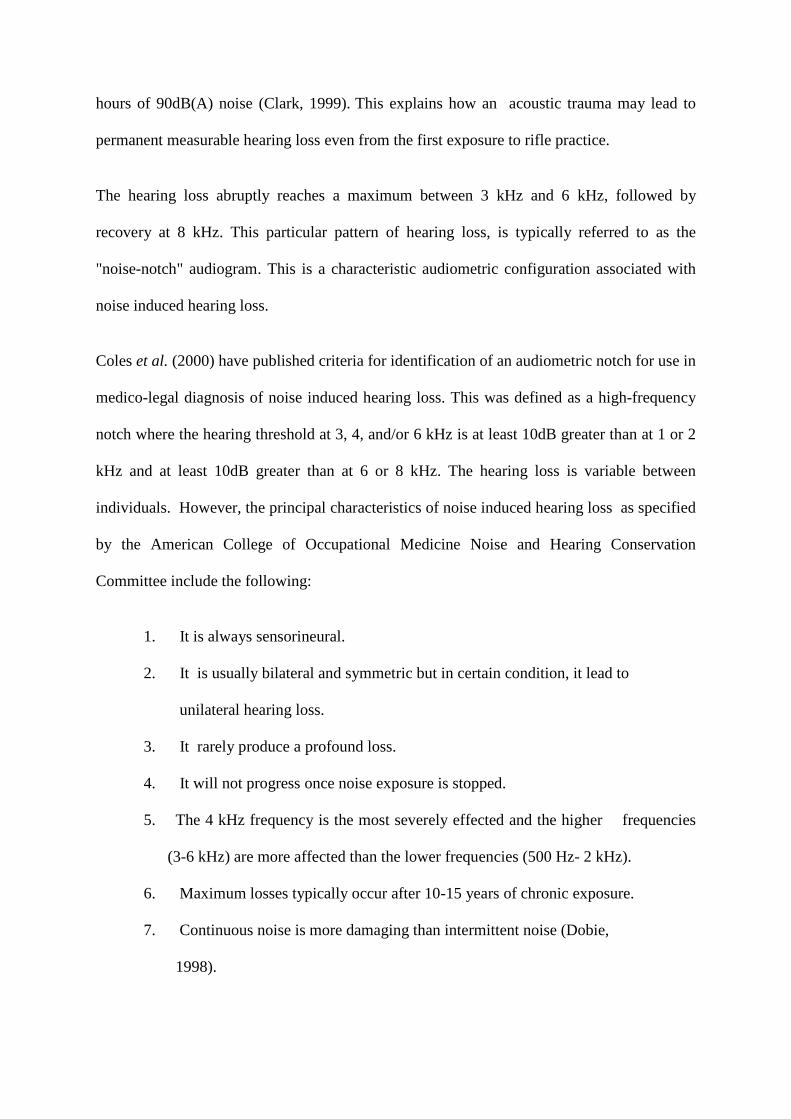
hours of 90dB(A) noise (Clark, 1999). This explains how an acoustic trauma may lead to
permanent measurable hearing loss even from the first exposure to rifle practice.
The hearing loss abruptly reaches a maximum between 3 kHz and 6 kHz, followed by
recovery at 8 kHz. This particular pattern of hearing loss, is typically referred to as the
"noise-notch" audiogram. This is a characteristic audiometric configuration associated with
noise induced hearing loss.
Coles et al. (2000) have published criteria for identification of an audiometric notch for use in
medico-legal diagnosis of noise induced hearing loss. This was defined as a high-frequency
notch where the hearing threshold at 3, 4, and/or 6 kHz is at least 10dB greater than at 1 or 2
kHz and at least 10dB greater than at 6 or 8 kHz. The hearing loss is variable between
individuals. However, the principal characteristics of noise induced hearing loss as specified
by the American College of Occupational Medicine Noise and Hearing Conservation
Committee include the following:
1. It is always sensorineural.
2. It is usually bilateral and symmetric but in certain condition, it lead to
unilateral hearing loss.
3. It rarely produce a profound loss.
4. It will not progress once noise exposure is stopped.
5. The 4 kHz frequency is the most severely effected and the higher frequencies
(3-6 kHz) are more affected than the lower frequencies (500 Hz- 2 kHz).
6. Maximum losses typically occur after 10-15 years of chronic exposure.
7. Continuous noise is more damaging than intermittent noise (Dobie,
1998).
1.4 PATHOPHYSIOLOGY
Pathological change associated with noise-induced hearing loss is still having some
controversy (Fridberger et al., 2002). The two general theories have been advanced to
account for the mechanism of injury.
The first theory is the metabolic mechanisms in which the sound with high intensity cause
sensory cell damage by decreases cochlea blood circulation (Miller et al., 1996). Acoustic
overstimulation could potentially lead to excessive release of neurotransmitters such as
glutamate associated with transduction function of the cochlea. Other metabolic cochlear
mechanisms include outer hair cell plasma membrane fluidity and oxidative stress (Chen
and Zhao, 2007). These leads to metabolic exhaustion.
The second theory is the structural mechanisms. Changes to micromechanical structures
within cochlea have been reported as possible mechanisms of noise-induced hearing loss.
Depolymerization of actin filaments in stereocilia maybe a substrate of TTS. Thus leads to
decrease stiffness of the stereocilia of outer hair cells. It is sometimes referred as auditory
fatigue. The stereocilia become disarrayed and floppy. Presumably, in such a state they
respond poorly. The primary site of injury appears to be the rootlets that connect the
stereocilia to the top of the hair cell. With loss of the stereocilia, the hair cells die. Death of
the sensory cell can lead to progressive Wallerian degeneration and loss of primary auditory
nerve fibers (Sohmer, 1997). There are also changes to nonsensory elements such as swelling
of supporting cells, stria vascularis afferent nerve endings (Lim, 1986).
Acoustic trauma appears to have its pathophysiologic basis in mechanical tearing of
membranes and physical disruption of cell walls with mixing of perilymph and endolymph.
At high energies, it can result in disruption of the tympanic membrane and ossicular injury
(Sohmer, 1997).
1.5 CONSEQUENCES OF HEARING IMPAIRMENT
Inappropriate healthcare, ‘denial’ of importance of hearing conservation, reduced awareness
and inadequate knowledge leading to increase risk of having hearing impairment. Hearing
disability would later on had impact on person from doing normal and usual role in daily life
including occupational and psychosocial need (Anonymous, 1997).
When hearing loss is limited to the high frequencies, individuals are unlikely to have
difficulty in quiet conversational situations. The first difficulty that the patients usually notice
is the trouble understanding speech when a high level of ambient background noise is
present. As noise-induced hearing loss progresses, individuals may have the difficulty
understanding high-pitched voices (e.g. women's, children's) even in quiet conversational
situations.
Good hearing in both ears facilitates to localize the pinpoint of sniper fire and other relevant
sounds. This impairment leads to difficulties in obtaining and performing effectively in their
military service.
1.6 THE IMPORTANCE OF HEARING CONSERVATION PROGRAMMES
Hearing loss caused by exposure to recreational and occupational noise results in devastating
disability that is virtually 100 percent preventable. Shearing forces that are caused by any
sound have an impact on the stereocilia of the hair cells of the basilar membrane of the
cochlea. When excessive, these forces can cause cell death. Avoiding the noise exposure
stops further progression of the damage. Noise-induced hearing loss can be prevented by
avoiding excessive noise and using hearing protection such as earplugs and earmuffs
(Rabinowitz, 2003). In United States of America from the Department of Veterans Affairs
(VA), the disabilities of auditory system including tinnitus and heavy loss, were the third
most common type, accounting for almost 10% of total number of disabilities among military
personnel. At the end of 2004, US military pay an annualized cost of some $660 million in
hearing loss pensions (William & George, 2007).
They have also developed the effective hearing conservation programmes. These
programmes sound maintaining situational awareness and affective communication. Service
members receive the "reference, periodic, and termination" audiograms at the beginning,
annually, and at the end of their enrollment in the programmes.
CHAPTER 2
OBJECTIVES OF STUDY
2.0 OBJECTIVES
2.1 GENERAL OBJECTIVE
To study the prevalence of hearing impairment and ear diseases among navy personnels of
Royal Malaysian Navy, Lumut, Perak.
2.2 SPECIFIC OBJECTIVES
1. To determine the prevalence of hearing impairment and ear diseases among navy
personnels.
2. To know the association of hearing impairment with age and duration of services.
3. To know the association of hearing impairment between divers and non divers.
2.3 RESEARCH HYPOTHESIS
Hypothesis for all objectives
2.3.1 There is an high percentage of hearing impairment and ear diseases among
navy personnel.
2.3.2 There is an association of hearing impairment with age and duration of
services.
2.3.3 There is an association of hearing impairment between divers and Non divers.

CHAPTER 3
METHODOLOGY
3.0 METHODOLOGY
3.1 STUDY DESIGN
This was a cross sectional study among the navy personnels which was conducted in the
Hospital Angkatan Tentera (HAT) Malaysia, Lumut, Perak. On the basis of published
military literature and our discussions with Navy Commanding General, we have divided the
navy into two general groups:
1. Non diver: navy personnel who is stationed in surface warship/ technical
units.
2. Diver.
Generally both groups have been exposed to same basic trainig and navy schooling an later
stationed in either groups.
3.2 SELECTION CRITERIA
3.2.1 INCLUSION CRITERIA
1. All personnel of Royal Malaysian Navy, Lumut, Perak.
3.2.2 EXCLUSION CRITERIA
1. Personnel with history of ear disease and other pathological prior to join navy.
2. Navy personnel with exposed to shooting training less than 48 hrs (temporary theresold
shift).
3.3 SAMPLE SIZE
1. Samples: individual who is serving as the navy personnels from The Royal
Malaysian Navy, Lumut, Perak.
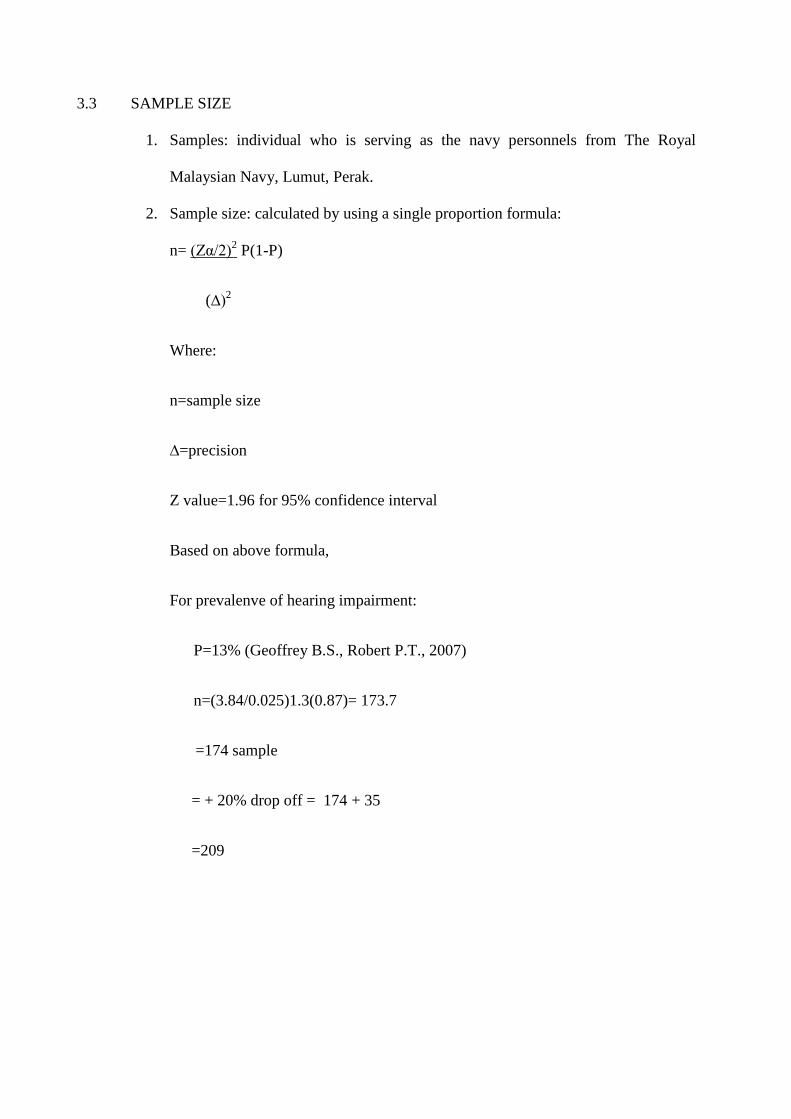
2. Sample size: calculated by using a single proportion formula:
n= (Zα/2)2
(∆)2
P(1-P)
Where:
n=sample size
∆=precision
Z value=1.96 for 95% confidence interval
Based on above formula,
For prevalenve of hearing impairment:
P=13% (Geoffrey B.S., Robert P.T., 2007)
n=(3.84/0.025)1.3(0.87)= 173.7
=174 sample
= + 20% drop off = 174 + 35
=209
3.4 EQUIPMENTS
3.4.1 QUESTIONNAIRE
The questionnaire was used in this study as in Appendix 3. The questions included gender,
age, duration of service in military and medical problem.
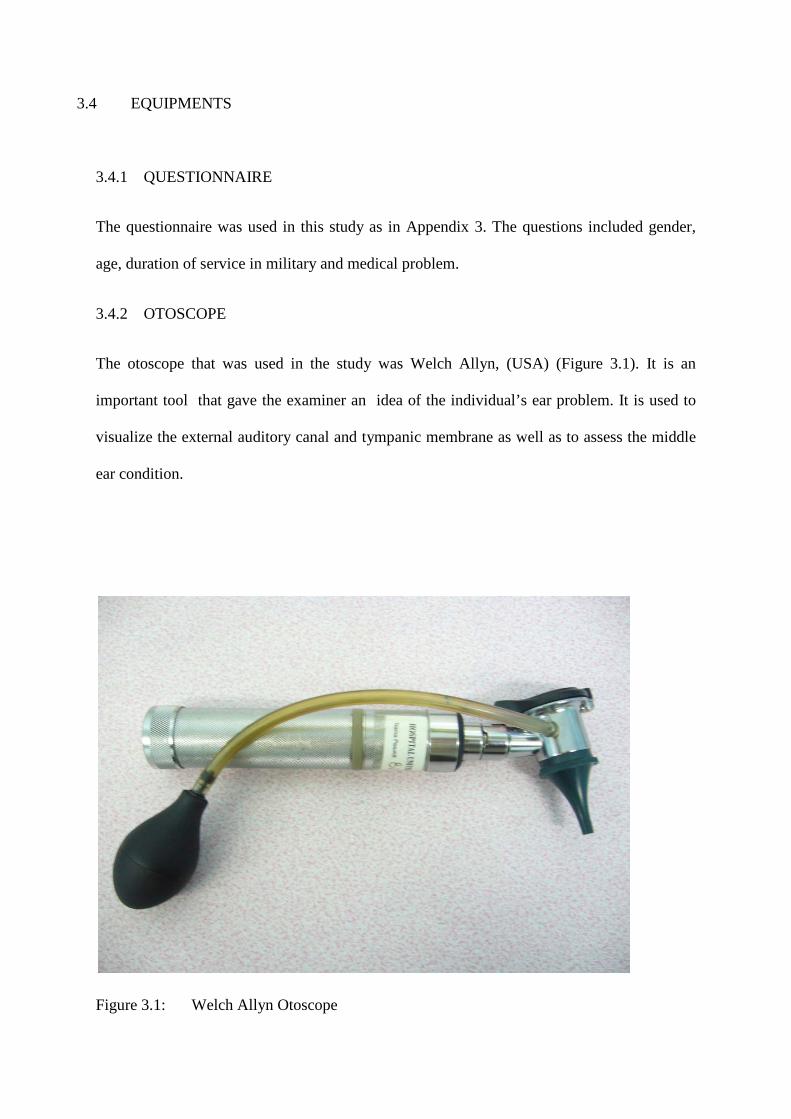
3.4.2 OTOSCOPE
The otoscope that was used in the study was Welch Allyn, (USA) (Figure 3.1). It is an
important tool that gave the examiner an idea of the individual’s ear problem. It is used to
visualize the external auditory canal and tympanic membrane as well as to assess the middle
ear condition.
Figure 3.1: Welch Allyn Otoscope
3.4.3 TYMPANOMETER
Tympanometry is an objective test of middle-ear function. Tympanometry is performed by
using Diagnostic Tympanometer GSI 38 (Welch Allyn). The test is non-invasive and does not
require any response from the patient. The typical test time for both ears was less than two
minutes. It is used to test the condition of the middle ear, mobility of the tympanic membrane
and the conducting ossicles by creating variations of air pressure in the ear canal. The results
of this test should always be viewed in conjunction with pure tone audiometry.
Tympanometry is a valuable component of the audiometric evaluation. In evaluating hearing
loss, tympanometry permits a distinction between sensorineural and conductive hearing loss,
when evaluation is not apparent via tuning fork test. Furthermore, in a primary care setting,
tympanometry can be helpful in making the diagnosis of otitis media by demonstrating the
effect of a middle ear effusion.
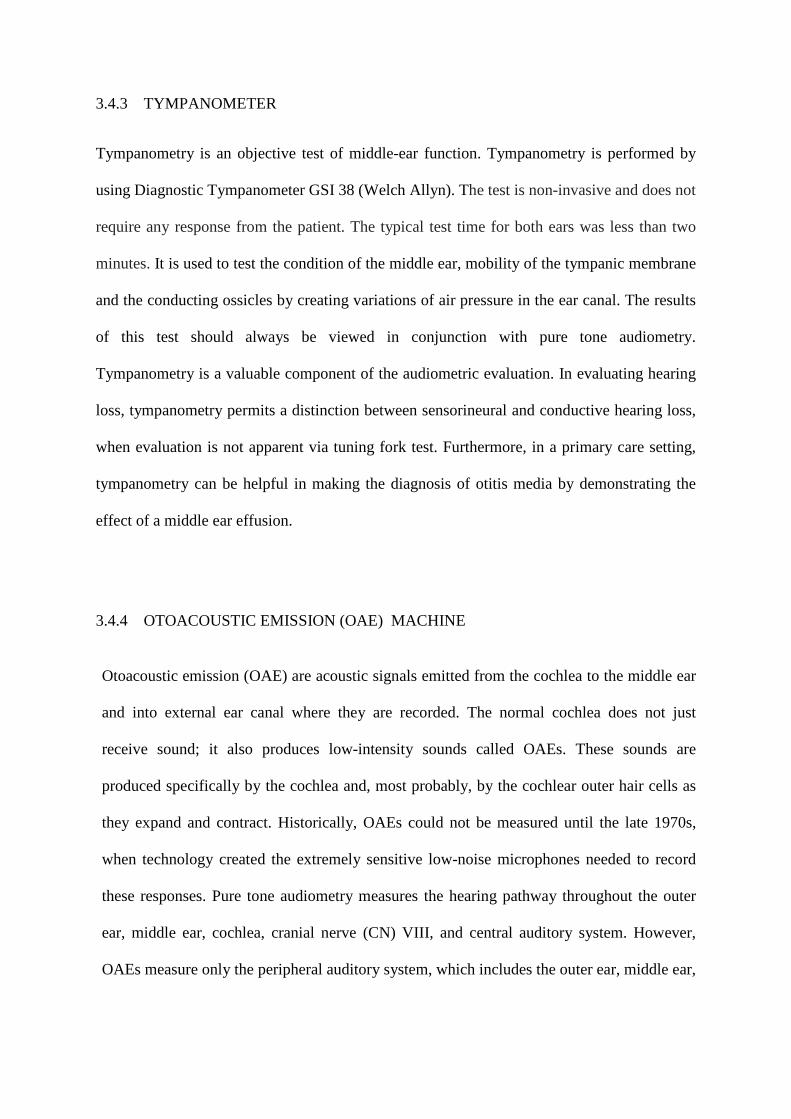
3.4.4 OTOACOUSTIC EMISSION (OAE) MACHINE
Otoacoustic emission (OAE) are acoustic signals emitted from the cochlea to the middle ear
and into external ear canal where they are recorded. The normal cochlea does not just
receive sound; it also produces low-intensity sounds called OAEs. These sounds are
produced specifically by the cochlea and, most probably, by the cochlear outer hair cells as
they expand and contract. Historically, OAEs could not be measured until the late 1970s,
when technology created the extremely sensitive low-noise microphones needed to record
these responses. Pure tone audiometry measures the hearing pathway throughout the outer
ear, middle ear, cochlea, cranial nerve (CN) VIII, and central auditory system. However,
OAEs measure only the peripheral auditory system, which includes the outer ear, middle ear,
and cochlea. OAE testing often is used as a screening tool to determine the presence or
absence of cochlear function (McPherson et al., 2006).
The 4 types of otoacoustic emissions are as follows: spontaneous otoacoustic emissions
(SOAEs), transient evoked otoacoustic emissions (TEOAEs), distortion product otoacoustic
emissions (DPOAEs) and stimulus frequency otoacoustic emissions (SFOAEs). The most
useful clinically otoacoustic emissions are transient evoked otoacoustic emissions
(TEOAEs) and Distortion product otoacoustic emissions (DPOAEs). In this study, we
measured DPOAE by using the Bio-logic AUDX II machine by biologic system corporation,
USA. (Figure 3.2)
Figure 3.2: Otoacoustic emission device
3.4.5 PURE TONE AUDIOMETER
The instrument used in the measurement of auditory threshold is known as the audiometer.
An audiometer has been described by the International Electrochemical Commission in 1976
as an instrument used for the measurement of acuity of hearing, and threshold of audibility.
There are two types of audiometry widely used. They are: 1. Those that require a subjective
response on the part of the patient and 2. Those that require no subjective response from the
patient. The example of the first type is pure tone audiometry (PTA) which is used to
measure the auditory threshold of an individual. Audiometric examination was performed by
using Diagnostic audiometer model GSI 61.
3.4.6 SOUND TREATED BOOTH
This booth was designed by Medi Aids Sdn. Bhd. for audiometric examination for medical
research. The booth was placed in a quiet room to improve the ambient noise.
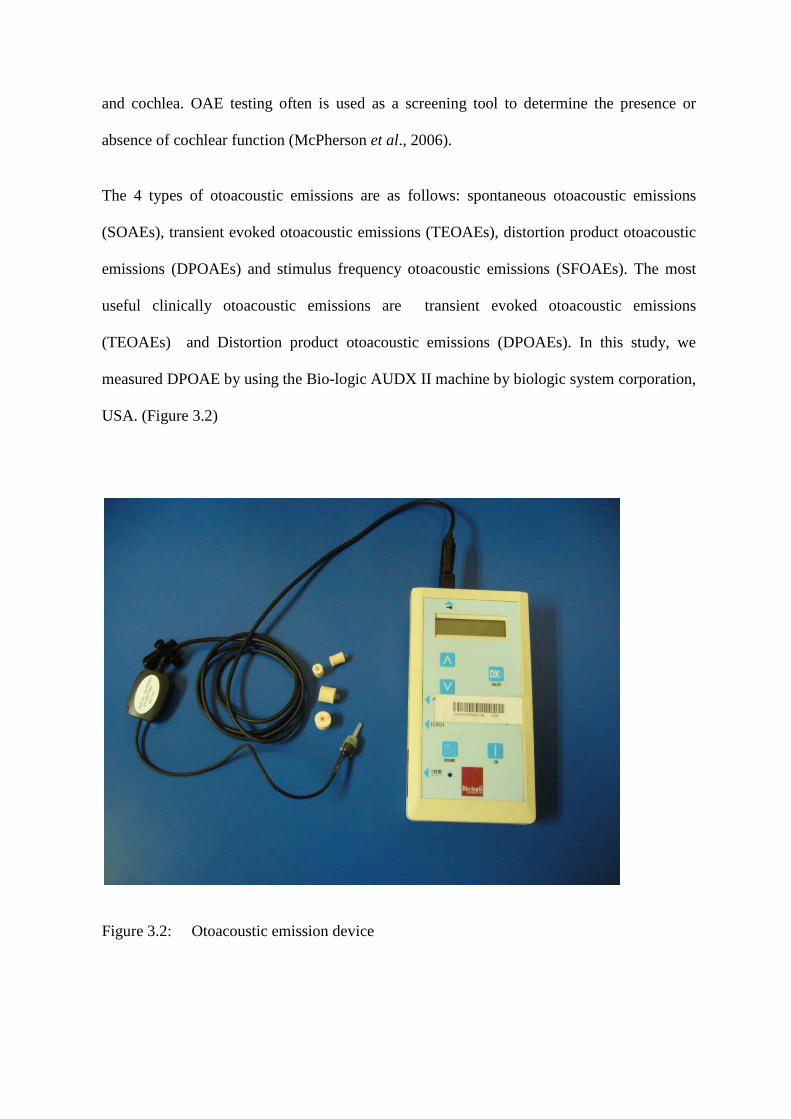
3.5 STUDY PROCEDURE
This survey had been started after getting an approval from the Markas Angkatan Tentera
Laut Di Raja Malaysia and Hospital Angkatan Tentera, Lumut, Perak. We met the Navy
Commanding General and discussed regarding the details of study including our objectives
and procedures.
All army personnel that fit the criteria were included in this study. The consent was taken and
the questionnaire was answered. Ear examination was then performed. The otoscopic
examination of external auditory canal and tympanic membrane was done. The Audiologist
then conducted hearing assessments. The hearing test that was first performed on the
subjects using Distortion Product Otoacoustic Emission (DPOAE) screening followed by
tympanometry test. Finally, the pure tone audiometry (PTA) was performed in a sound
treated booth. Pure tone stimulus was delivered at frequencies 500, 1000, 2000, 3000, 4000,
6000 and 8000 Hz. Both air and bone conduction thresholds were tested. Participants with
problem and/or diseased ear were advised and referred to ORL specialist clinic, Hospital
Angkatan Tentera, Lumut, Perak, for further evaluation and management.
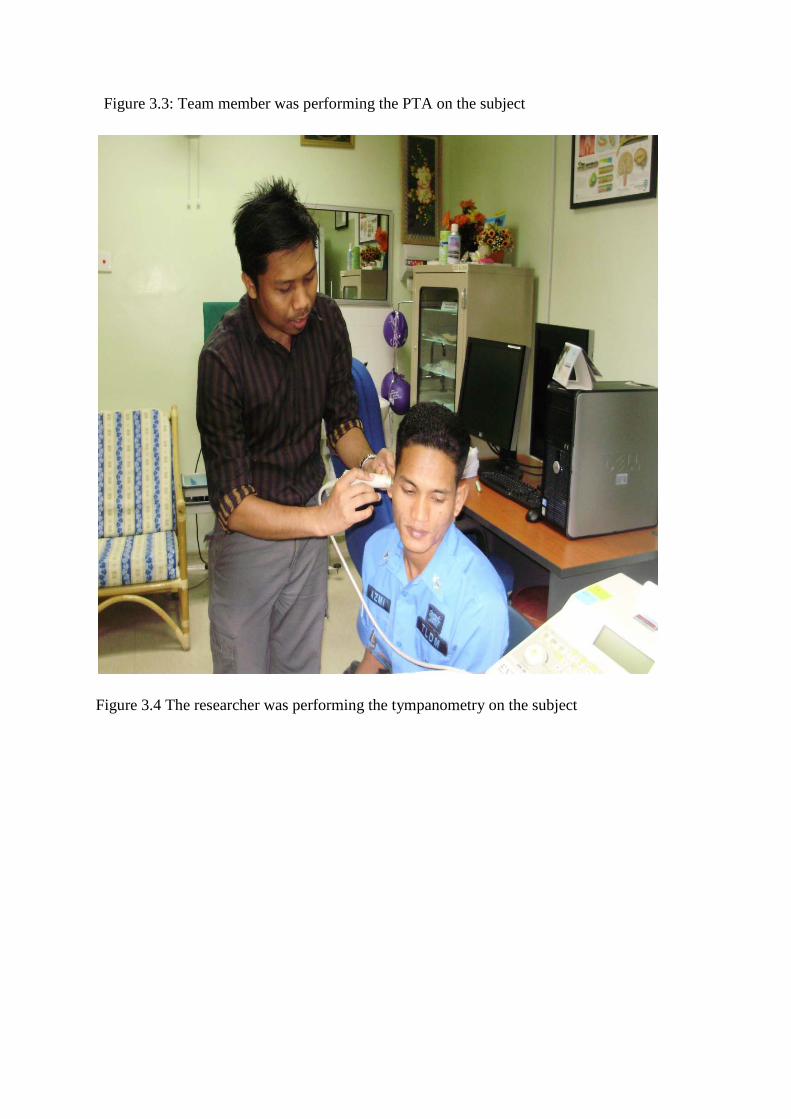
Figure 3.3: Team member was performing the PTA on the subject
Figure 3.4 The researcher was performing the tympanometry on the subject

CHAPTER 4
RESULTS
4.0 RESULT
4.1 TOTAL NUMBER OF PARTICIPANTS
The total number of navy personnel recruited in this study was 233 subjects. All
of them from Royal Malaysian Navy, Lumut, Perak. A total of 123 of them were
from the diver group and another 110 from the non diver group (surface warship
and technical units).
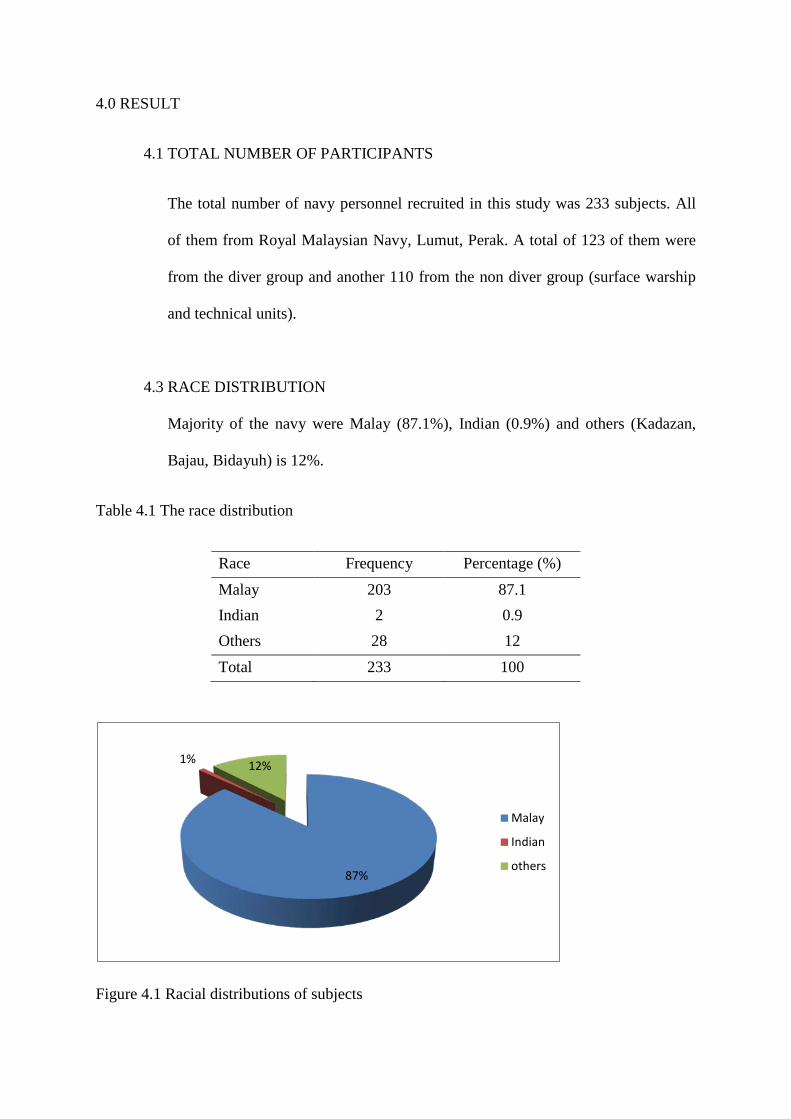
4.3 RACE DISTRIBUTION
Majority of the navy were Malay (87.1%), Indian (0.9%) and others (Kadazan,
Bajau, Bidayuh) is 12%.
Table 4.1 The race distribution
Race Frequency Percentage (%)
Malay 203 87.1 Indian 2 0.9 Others 28 12 Total 233 100
Figure 4.1 Racial distributions of subjects
87%
1% 12%
Malay
Indian
others
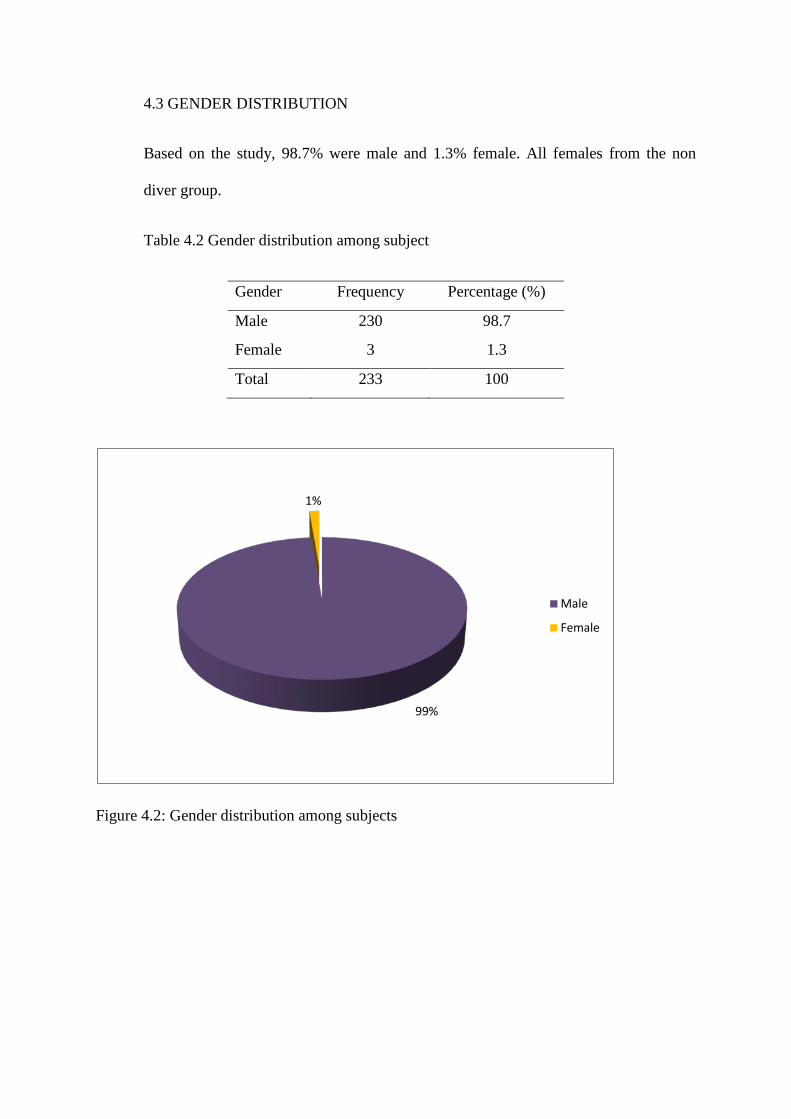
4.3 GENDER DISTRIBUTION
Based on the study, 98.7% were male and 1.3% female. All females from the non
diver group.
Table 4.2 Gender distribution among subject
Gender Frequency Percentage (%)
Male 230 98.7
Female 3 1.3
Total 233 100
Figure 4.2: Gender distribution among subjects
99%
1%
Male
Female
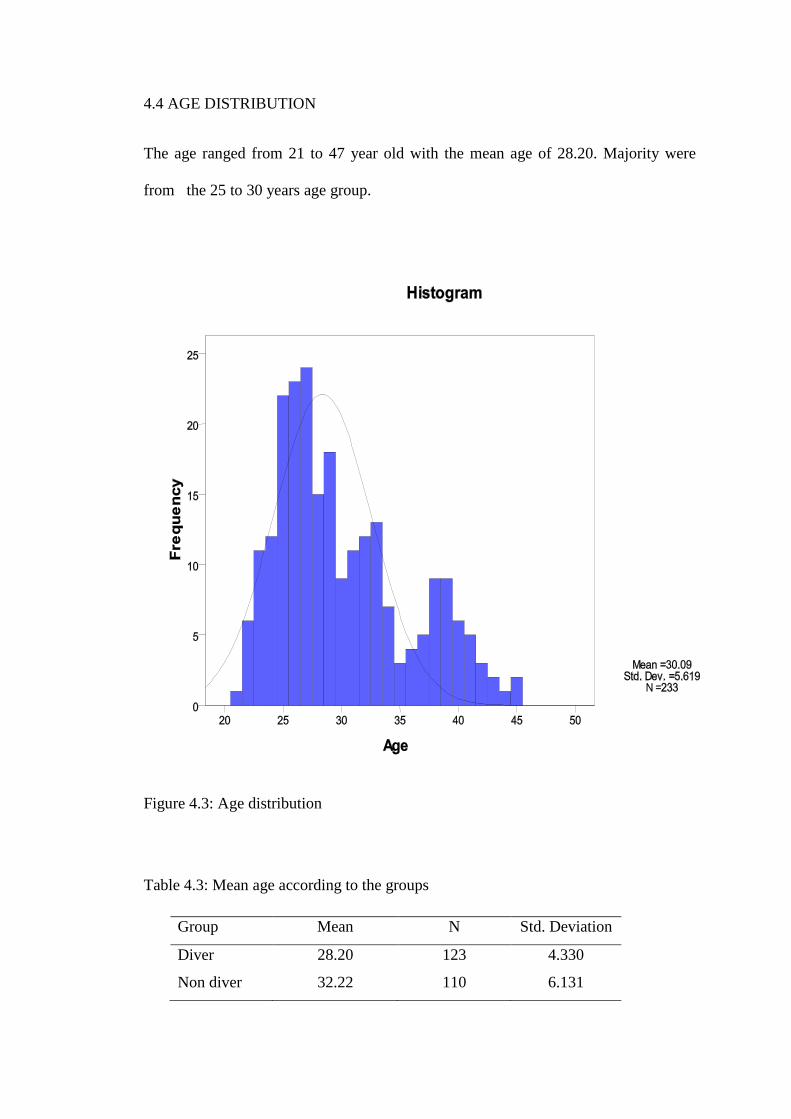
4.4 AGE DISTRIBUTION
The age ranged from 21 to 47 year old with the mean age of 28.20. Majority were
from the 25 to 30 years age group.
Figure 4.3: Age distribution
Table 4.3: Mean age according to the groups
Group Mean N Std. Deviation
Diver 28.20 123 4.330
Non diver 32.22 110 6.131