by farooq ahmad & qurat-ul-ain fatima · factors are location-dependent, more detailed analyses...
TRANSCRIPT
Global Journal of HUMAN SOCIAL SCIENCE Geography & Environmental GeoSciences Volume 12 Issue 13 Version 1.0 Year 2012 Type: Double Blind Peer Reviewed International Research Journal Publisher: Global Journals Inc. (USA) Online ISSN: 2249-460x & Print ISSN: 0975-587X
Phenologically-Tuned MODIS NDVI-Based Time Series (2000-2012) for Monitoring of Vegetation and Climate Change in North-Eastern Punjab, Pakistan
Abstract - One of the main factors determining the daily variation of the active surface temperature is the state of the vegetation cover. It can well be characterized by the Normalized Difference Vegetation Index (NDVI). The NDVI has the potential ability to signal the vegetation features of different eco-regions and provides valuable information as a remote sensing tool in studying vegetation phenology cycles. The vegetation phenology is the expression of the seasonal cycles of plant processes and contributes vital current information on vegetation conditions and their connections to climate change. The NDVI is computed using near-infrared and red reflectances, and thus has both an accuracy and precision. A gapless time series of MODIS NDVI (MOD13A1) composite raster data from 18th February, 2000 to 16th November, 2012 with a spatial resolution of 500 m was utilized. Time-series terrestrial parameters derived from NDVI have been extensively applied to global climate change, since it analyzes each pixel individually without the setting of thresholds to detect change within a time series.
Keywords : Climate, MODIS, NDVI, remote sensing, time series, vegetation phenology.
Phenologically-Tuned MODIS NDVI-Based Time Series 2000-2012 for Monitoring of Vegetation and Climate Change in North-Eastern Punjab, Pakistan
Strictly as per the compliance and regulations of:
GJHSS-C Classification : FOR Code : 630205p, 770101p
By Farooq Ahmad & Qurat-ul-ain Fatima
© 2012. Farooq Ahmad & Qurat-ul-ain Fatima. This is a research/review paper, distributed under the terms of the Creative Commons Attribution-Noncommercial 3.0 Unported License http://creativecommons. org/licenses/by-nc/3.0/), permitting all non-commercial use, distribution, and reproduction in any medium, provided the original work is properly cited.
University of the Punjab, New Campus, Lahore, Pakistan

I. Introduction
ong-term observations of remotely sensed vegetation dynamics have held an increasingly prominent role in the study of terrestrial ecology
(Budde et al., 2004; Prasad et al., 2007; Ouyang et al., 2012). A major limitation of such studies is the limited availability of sufficiently consistent data derived from long-term remote sensing (Ouyang et al., 2012). The benefit obtained from a remote sensing sensor thereby largely depends on its spectral resolution (Jensen,
2005), which determines the sensor’s capability to resolve spectral features of land surfaces (Fontana, 2009). One of the key factors in assessing vegetation dynamics and its response to climate change is the ability to make frequent and consistent observations (Thomas and Leason, 2005; Ouyang et al., 2012). Ability to assess how environmental changes affect dynamics of vegetation is increasingly important for better predictions of climate change effects (Aguilar et al., 2012). Popularity of the application of the NDVI (Rouse et al., 1973; Tucker, 1979) in ecological studies has enabled quantification and mapping of green vegetation
productivity and other landscape-level fluxes (Wang et al., 2003; Pettorelli et al., 2005; Aguilar et al., 2012). The evolution of vegetation index exhibits a strong correlation with the typical green vegetation growth stages. The results (temporal curves) can be analyzed to obtain useful information such as the start/end of vegetation growing season (Gao and Mas, 2008; Ahmad, 2012a). The NDVI is the most commonly used index (Ahmad, 2012b) and serves as a measure of photosynthetic activity within a certain area (Fontana, 2009).
The NDVI is based on differences in reflectance in the red region and maximum reflectance in the near infrared; it is the most widely used index in remote sensing (Aguilar et al., 2012).
The NDVI can be a useful tool to couple climate and vegetation distribution and performance at large spatial and temporal scales (Pettorelli et al., 2005; Aguilar et al., 2012) because vegetation vigor and productivity are related to temperature-precipitation and evapotranspiration. The NDVI serves as a surrogate measure of these factors at the landscape scale (Wang et al., 2003; Groeneveld and Baugh, 2007; Aguilar et al., 2012). The linear response of vegetation NDVI to rainfall for regions with low vegetation cover and rainfall is well documented (Malo and Nicholson, 1990; Yang et al., 1998; Kawabata et al., 2001; Ji and Peters, 2003; Wang et al., 2003; Groeneveld and Baugh, 2007; Aguilar et al.,
L Glob a
l Jo
urna
l o f H
uman
S ocial S
cie n
ceVolum
e XII
Issu
e XIII
Ver
sion
I
( DD DD
)b
© 2012 Global Journals Inc. (US)
2012
Year
37
Phenologically-Tuned MODIS NDVI-Based Time Series (2000-2012) for Monitoring of Vegetation and Climate Change in North-Eastern Punjab,
Pakistan
Abstract - One of the main factors determining the daily variation of the active surface temperature is the state of the vegetation cover. It can well be characterized by the Normalized Difference Vegetation Index (NDVI). The NDVI has the potential ability to signal the vegetation features of different eco-regions and provides valuable information as a remote sensing tool in studying vegetation phenology cycles. The vegetation phenology is the expression of the seasonal cycles of plant processes and contributes vital current information on vegetation conditions and their connections to climate change. The NDVI is computed using near-infrared and red reflectances, and thus has both an accuracy and precision. A gapless time series of MODIS NDVI (MOD13A1) composite raster data from 18th February, 2000 to 16th November, 2012 with a spatial resolution of 500 m was utilized. Time-series terrestrial parameters derived from NDVI have been extensively applied to global climate change, since it analyzes each pixel individually without the setting of thresholds to detect change within a time series. The required data preparation for the integration of MODIS NDVI data into GIS is described with focus on the projection from the MODIS/Sinusoidal projection to the national coordinate systems. Through the application and analyses of time-series data, this research will provide valuable understanding of the impact of environmental drivers on the spatial, annual and inter-annual variation of climate and vegetation cover dynamics across north-eastern Punjab province of Pakistan. The results have important implications for parameterization of land surface process models using biophysical variables estimated from remotely sensed data.Keywords : Climate, MODIS, NDVI, remote sensing, time series, vegetation phenology.
with the goal of estimating above ground net primary
2012). The relationship between NDVI and climatic
Farooq Ahmad α & Qurat-ul-ain Fatima σ
Author : GIS Centre, PUCIT, University of the Punjab, Lahore, Pakistan.
Department of Geography, University of the Punjab, New Campus, Lahore, Pakistan. E-mail : [email protected] α :
σ

factors are location-dependent, more detailed analyses are needed (Wang et al., 2003; Aguilar et al., 2012).
The Moderate Resolution Imaging Spectroradiometer (MODIS) is a key instrument onboard the Terra and Aqua satellite platforms (Huete et al., 2006; Carrão et al., 2008; Ahmad, 2012c). Terra's orbit around the Earth is timed so that it passes from north to south across the equator in the morning, while Aqua passes south to north over the equator in the afternoon (Salomonson and Toll, 1991; GSFC/NASA, 2003; Huete, 2005; Ahmad, 2012c). The MODIS has been applied in diverse applications for two reasons, the advantage of daily data and the possibility for high-quality data covering large land areas (Zhao et al., 2009; Ouyang et al., 2012) and offers a good opportunity to monitor and analyze regional land surface processes. This is especially true for NDVI vegetation analysis, for which MODIS provides a standard product (Piao et al., 2006a; Zhao et al., 2009; Ouyang et al., 2012). The MODIS design team gave substantial emphasis to instrument calibration and characterization recognizing these activities as critical for generation of accurate long-term time-series products needed for global change studies (Huete et al., 1999; Justice et al., 2002).
The MODIS, high temporal resolution sensor allow detailed monitoring of the temporal change in vegetation (Weissteiner et al., 2011; Ouyang et al., 2012). Higher resolution sensors provide spatial detail while low resolution satellites offer high temporal repetition at the expense of spatial resolution (Ouyang et al., 2012). Over the last two decades, studies of vegetation dynamics have explored several approaches to improve the spatial-temporal resolution of data from remote sensing sources. Integrating medium to high spatial resolution data with high temporal resolution data can provide a means to detect most of the variation in vegetation (Jin and Steven, 2005; Ouyang et al., 2012).
The MODIS NDVI datasets provides unique opportunities for monitoring terrestrial vegetation conditions at regional and global scales (Yang et al., 1997; Piao et al., 2006), and has widely been used in research areas of net primary production (Potter et al., 1993; Paruelo et al., 1997; Piao et al., 2006), vegetation coverage (Tucker et al., 1991; Myneni et al., 1997; Los et al., 2001; Zhou et al., 2001; Piao et al., 2003; Piao et al., 2006), biomass (Myneni et al., 2001; Dong et al., 2003; Piao et al., 2006), and phenology (Reed et al., 1994; Moulin et al., 1997; Piao et al., 2006).
Multi-year time series of NDVI can reliably measure yearly changes in the timing of the availability of high-quality vegetation. The biological significance of NDVI indices should be assessed in various habitat types before they can be widely used in ecological studies (Hamel et al., 2009). The premise is that the NDVI is an indicator of vegetation health, because degradation of ecosystem vegetation, or a decrease in green, would be reflected in a decrease in NDVI value
(Hamel et al., 2009; Meneses-Tovar, 2011). The NDVI has the potential ability to signal the vegetation features of different eco-regions and provides valuable information as a remote sensing tool in studying vegetation phenology cycles at a regional scale (Guo, 2003). Phenology has emerged recently as an important focus for ecological research (Menzel et al., 2001; Hashemi, 2010).
II. Study Area
The study area lies in the north-eastern Punjab province of Pakistan from 30° 11' 52" to 32° 27' 19" North latitude and 71° 53' 23" to 75° 56' 24" East longitude. The research area is consists of six districts (Figure 1); Lahore, Sheikhupura, Hafizabad, Nankana Sahib, Kasur and Okara of the province.
Figure 1 : Study Area - Landsat ETM+ May 31st 2003 mosaic image. http: //glovis.usgs.gov/
III. Research Desıgn and Methods
The MODIS is a key instrument onboard the Terra satellite and provides images over a given pixel of land specifically designed for measurements of land surface dynamics (Huete, 2005). The MODIS sensors, as a newer generation sensor specifically designed for,
2012
Year
Globa
l Jo
urna
l of H
uman
Soc
ial Sc
ienc
e
Volum
e XII
Issu
e XIII
Ver
sion
I
( DDDD)
b
© 2012 Global Journals Inc. (US)
238
Phenologically-Tuned MODIS NDVI-Based Time Series (2000-2012) for Monitoring of Vegetation and Climate Change in North-Eastern Punjab, Pakistan
Source :
inter alia, terrestrial applications (Fontana, 2009) and a validation with accurately georeferenced composite data from the MODIS sensor revealed the high accuracy of the orthorectified NDVI composites and emphasized the great importance of orthorectification for data quality in rugged terrain (Barnes et al., 1998; Fontana, 2009). The MODIS provides higher radiometric sensitivity (Barnes and Salomonson, 1993; Fontana, 2009). In each of the 36 spectral bands, the 12-bit resolution results in 4096 levels of discrimination in measured response (Guenther et al., 1998; Fontana, 2009). The bands are sensitive to different portions of the electromagnetic spectrum between 0.46 m and 14.39 m at spatial resolutions of 250 m, 500 m, and 1 km, depending on the spectral band (Fontana, 2009). The output delivered by the MODIS level 1B algorithm includes geolocated at aperture radiances in all 36 spectral bands (Isaacman et al., 2003; Xiong et al., 2003; 2003a; Xiong et al., 2005; Fontana, 2009).
Earth location data is available at sub-pixel accuracy. This extraordinary geolocation accuracy is achieved due to several reasons (Wolfe et al., 1995; 2002; Fontana, 2009): First, the spacecrafts carrying MODIS are very stable and provide highly precise external orientation knowledge. Second, the MODIS instrument was designed to give precise interior orientation knowledge (Khlopenkov and Trishchenko, 2008; Fontana, 2009). Third, an accurate global DEM (Logan, 1999; Fontana, 2009) is used to model and remove relief-induced distortions. Fourth, a global set of GCPs based on Landsat imagery served to determine biases in the sensor orientation, which were finally used to improve geolocation processing (Ackerman et al., 1998; 2006; Fontana, 2009).
The MODIS NDVI data products for research area were acquired, in this case MOD13A1 (MODIS TERRA_500 m) data were downloaded from the Land Processes Distributed Active Archive Center (LPDAAC). Tile number covering this area is h24v05, reprojected from the Integerized Sinusoidal projection to a Geographic Lat/Lon projection, and Datum WGS84 (GSFC/NASA, 2003; Ahmad, 2012a). A gapless time series of MODIS NDVI composite raster data from 18th
February, 2000 to 16th November, 2012 with a spatial resolution of 500 m was utilized (Figure 2) for phenologically-tuned MODIS NDVI-based time series development. The datasets provides frequent information at the spatial scale at which the majority of human-driven land cover changes occur (Townshend and Justice, 1988; Verbesselt et al., 2010).
The NDVI values range from -1 to +1; because of high reflectance in the NIR portion of the EMS, healthy vegetation is represented by high NDVI values between 0.1 and 1 (Liu and Huete, 1995; USGS, 2008; 2010). Conversely, non-vegetated surfaces such as water bodies yield negative values of NDVI because of the electromagnetic absorption property of water. Bare soil
areas represent NDVI values which are closest to 0 due to high reflectance in both the visible and NIR portions of the EMS (Townshend, 1992). The NDVI is related to the absorption of photosynthetically active radiation and basically measures the photosynthetic capability of leaves, which is related to vegetative canopy resistance and water vapour transfer (Wan, 2003; Rahman et al., 2004; Ahmad, 2012a).
The NDVI is successful as a vegetation measure is that it is sufficiently stable to permit meaningful comparisons of seasonal and inter-annual changes in vegetation growth and activity (Choudhury, 1987; Jakubauskas et al., 2002; Chen et al., 2006; Zoran and Stefan, 2006; Nicandrou, 2010; Ahmad, 2012a; 2012b). The strength of the NDVI is in its ratioing concept (Moran et al., 1992), which reduces many forms of multiplicative noise (illumination differences, cloud shadows, atmospheric attenuation, and certain topographic variations) present in multiple bands (Chen et al., 2002; Nicandrou, 2010; Ahmad, 2012a).
ERDAS imagine 2011 software was used for extraction of NDVI layer from MODIS data product and development of gapless composite image from 18th
February, 2000 to 16th November, 2012. In this study, eighteen villages out of six districts of north-eastern Punjab province were selected randomly. The data products were used to generate phenological time-series variation profile for Kot Jan Muhammad, Amarkot, Jodhwala, Sukka Chak, Adilgarh, Jagganwala, Qila Deva Singh, Ali Raza Abad, Shakranj Pur, Titranwali, Ajianwala, Makki Unchi, Bodal Khaneke, Asrur, Katlohi Kallan villages and phenological temporal comparison at 16-days interval for Thatha Khudayar and Haveli villages, year 2007 to 2011. Further, biomass versus NDVI and mean maximum; January 2011 to December 2011 was generated for Bahak Maqaiyaddin village of the research area.
Glob a
l Jo
urna
l o f H
uman
S ocial S
cie n
ceVolum
e XII
Issu
e XIII
Ver
sion
I
( DD DD
)b
© 2012 Global Journals Inc. (US)
2012
Year
39
Phenologically-Tuned MODIS NDVI-Based Time Series (2000-2012) for Monitoring of Vegetation and Climate Change in North-Eastern Punjab, Pakistan

Figure 2 : Scheme for research design and methods.
Remote sensing is often used for detecting seasonal vegetation changes (Sakamoto et al., 2005). Various methods using daily NDVI data have been developed for monitoring natural vegetation (Akiyama et al., 2002; Saito et al., 2002; Xiao et al., 2002; Sakamoto et al., 2005). Vegetation Indices are seamless data products that are computed from the same mathematic formulae across all pixels in time and space, without prior assumptions of biome type, land cover condition, or soil type and thus represent actual, long-term measurements of the land surface (Huete et al., 2002). The NDVI product works optimally with cloud filtering, radiometric calibration, precise geolocation, and a snow mask. In addition, the product performs best using top-of-canopy reflectance inputs, corrected for atmospheric ozone, molecular scattering, aerosol, and water vapour (Huete et al., 2006).
IV. Results
Figure 3 shows time-series phenology metricsfor Kot Jan Muhammad district Hafizabad. The profile showed that climate was more or less stable. The trend analysis showed slight positive tendency due to increase in precipitation in winter season or western disturbances especially during 2009 to 2012, but severe dryness was observed in January 2003 (NDVI value 0.85) and June 2010 (NDVI value -0.01). Fluctuations were observed at start/end pixel values. The NDVI value on 18th February, 2000 was 0.72 while the NDVI value on 16th November, 2012 was 0.28 (Figure 3).
The phenological studies can be used to evaluate the effects of climate change (Chandola et al., 2010). The vegetation phenology is important for predicting ecosystem carbon, nitrogen, and water fluxes (Baldocchi et al., 2005; Richardson et al., 2009; Chandola et al., 2010), as the seasonal and interannual variation of phenology have been linked to net primary production estimation, crop yields, and water supply (Aber et al., 1995; Jenkins et al., 2002; Chandola et al., 2010).
Figure 4 shows time-series phenology metrics for Amarkot district Lahore. The profile showed that climate was not stable and the trend analysis showed negative tendency. The fluctuations in the phenological profile were due to variation in the temperature-precipitation at Amarkot. Fluctuations were observed at start/end pixel values. The NDVI value on 18th February, 2000 was 0.60 while the NDVI value on 16th November, 2012 was 0.28 (Figure 4). The soil productivity in winter season was higher as compared to summer season. In summer season the temperature raises upto 51oC or more and in winter the temperature falls below 0oC. The monsoon occurs in summer season from June till September. Monsoon rains bring much awaited relief from scorching heat. These monsoon rains are quite heavy by nature. The western disturbances generally occur during the winter months and causes moderate rainfall (Khan, 1993; Ahmad, 2012).
Change information of the earth’s surface is becoming more and more important in monitoring the local, regional and global resources and environment. The large collection of past and present remote sensing imagery makes it possible to analyze spatio-temporal pattern of environmental elements and impact of human activities in past decades (Jianya et al., 2008; Ahmad, 2012).
Figure 5 shows time-series phenology metrics for Jodhwala district Kasur. The profile showed that climate was stable and the trend analysis showed slight positive tendency. The NDVI value on 18th February, 2000 was 0.52 while the NDVI value on 16th November, 2012 was 0.49 (Figure 5). The variation in the vegetation phenological temporal metrics was due to changes in the temperature-precipitation. The green cover fraction
2012
Year
Globa
l Jo
urna
l of H
uman
Soc
ial Sc
ienc
e
Volum
e XII
Issu
e XIII
Ver
sion
I
( DDDD)
b
© 2012 Global Journals Inc. (US)
240
Phenologically-Tuned MODIS NDVI-Based Time Series (2000-2012) for Monitoring of Vegetation and Climate Change in North-Eastern Punjab, Pakistan

and soil productivity in winter season was much higher as compared to summer season. The NDVI has been used for several decades, which is advantageous for studying historical changes (Trishchenko et al., 2002; Ahmad, 2012).
Figure 6 shows time-series phenology metrics for Sukka Chak district Okara. The profile showed that climate was stable and the trend analysis showed positive tendency. The NDVI value on 18th February, 2000 was 0.68 while the NDVI value on 16th November, 2012 was 0.23 (Figure 6). The fluctuations in the phenological profile were due to variation in the temperature-precipitation. The winter disturbances were stronger as compared to summer monsoon and land degradation or desertification can’t be seen at Sukka Chak. The soil productivity in winter season was much higher as compared to summer season. The phenology metrics showed a clear relationship with the seasonality of rainfall, winter and summer growing seasons (Wessels et al., 2011; Ahmad, 2012).
Figure 7 shows time-series phenology metrics for Adilgarh district Nankana Sahib. The profile showed that climate was stable and the trend analysis showed gradually positive tendency. The NDVI value on 18th
February, 2000 was 0.64 while the NDVI value on 16th
November, 2012 was 0.36 (Figure 7). The green cover fraction and soil productivity in winter season was much higher as compared to summer season.
Remote sensing provides a key means of measuring and monitoring phenology at continental to global scales and vegetation indices derived from satellite data are now commonly used for this purpose (Nightingale et al., 2008; Tan et al., 2008; Ahmad, 2012).
Figure 8 shows time-series phenological variation for Jagganwala district Hafizabad. The profile showed that climate was stable and the trend analysis showed no change during the entire period, but severe dryness was observed in December 2002 and January 2003. Fluctuations were observed at start/end pixel values. The NDVI value on 18th February, 2000 was 0.69 while the NDVI value on 16th November, 2012 was 0.35 (Figure 8). The fluctuations in the phenological profile were due to variation in the temperature-precipitation. The winter disturbances were much stronger as compared to summer monsoon and land degradation or desertification can’t be seen at Jagganwala. The green cover fraction and soil productivity in winter season was much higher as compared to summer season.
Variations in vegetation activity have been linked with changes in climates (Los et al., 2001; Tucker et al., 2001; Zhou et al., 2001; 2003; Lucht et al., 2002; Piao et al., 2003). Besides climate alterations leading to changes in the productivity and phenology of natural vegetation (Villalba et al., 1998; Villalba et al., 2003; Baldi et al., 2008), direct human drivers such as land use and land cover changes (Grau et al., 2005; Fearnside, 2005; Huang et al., 2007; Baldi and Paruelo,
2008; Baldi et al., 2008), infrastructure enterprises (Canziani et al., 2006; Baldi et al., 2008), and urban expansion (Romero and Ordenes, 2004; Pauchard et al., 2006; Baldi et al., 2008; Ahmad, 2012) took place.
Figure 9 shows time-series phenological variation for Qila Deva Singh district Nankana Sahib. The profile showed that climate was stable and the trend analysis showed gradual positive tendency during the entire period, but little dryness was observed in January 2003 (NDVI value 0.13) and July, 2010 (NDVI value 0.09). Fluctuations were observed at start/end pixel values. The NDVI value on 18th February, 2000 was 0.73 while the NDVI value on 16th November, 2012 was 0.25 (Figure 9). The NDVI exhibits a strong correlation with the typical green vegetation growth stages (Zhao et al., 2005; Gao and Mas, 2008; Ahmad, 2012; 2012a).
Figure 10 shows time-series phenological variation for Ali Raza Abad district Lahore. The profile showed that climate was more or less stable during the entire period. The fluctuations in the phenological profile were due to variation in the temperature-precipitation at Ali Raza Abad. The NDVI value on 18th February, 2000 was 0.61 while the NDVI value on 16th November, 2012 was 0.32 (Figure 10).
To enhance the vegetation signal in remotely sensed data and provide an approximate measure of live green vegetation, a number of spectral vegetation indices have been developed by combining data from multiple spectral bands into single values because they correlate the biophysical characteristics of the vegetation of the land-cover (Campbell, 1987) from the satellite spectral signals (Yang et al., 2008).
Figure 11 shows time-series phenological variation for Shakranj Pur district Okara. The profile showed that climate was not stable, severe interannual variation in temperature-precipitation was observed at Shakranj Pur and the trend analysis showed gradual positive tendency during the entire period. Severe dryness was observed in August 2008 (NDVI value 0.004). Fluctuations were observed at start/end pixel values. The NDVI value on 18th February, 2000 was 0.51 while the NDVI value on 16th November, 2012 was 0.25 (Figure 11).
Figure 12 shows time-series phenological variation for Titranwali district Nankana Sahib. The profile showed that climate was stable and the trend analysis showed no change. The fluctuations in the phenological profile were due to variation in the temperature-precipitation during the entire period. The winter disturbances were much stronger as compared to summer monsoon and land degradation or desertification can’t be seen at Titranwali. The green cover fraction and soil productivity in winter season was much higher as compared to summer season. Fluctuations were observed at start/end pixel values. The NDVI value on 18th February, 2000 was 0.67 while
Glob a
l Jo
urna
l o f H
uman
S ocial S
cie n
ceVolum
e XII
Issu
e XIII
Ver
sion
I
( DD DD
)b
© 2012 Global Journals Inc. (US)
2012
Year
41
Phenologically-Tuned MODIS NDVI-Based Time Series (2000-2012) for Monitoring of Vegetation and Climate Change in North-Eastern Punjab, Pakistan

the NDVI value on 16th November, 2012 was 0.27 (Figure 12).
Figure 13 shows time-series variation profile for Ajianwala district Sheikhupura. The profile showed that climate was stable and the trend analysis showed slight positive change, but little dryness was observed in January 2003 (NDVI value 0.05). The fluctuations in the phenological profile were due to variation in the temperature-precipitation during the entire period. The winter disturbances were much stronger as compared to summer monsoon at Ajianwala. Fluctuations were observed at start/end pixel values. The NDVI value on 18th February, 2000 was 0.72 while the NDVI value on 16th November, 2012 was 0.35 (Figure 13).
Time series of acquired multi-spectral image represent characteristics of a landscape and each element represented has a particular spectral response. The time series of such vegetation indices observed over a period can help in further classification of the vegetation as crop and other type of vegetation (Musande et al., 2012).
Figure 14 shows time-series variation profile for Makki Unchi district Sheikhupura. The profile showed that climate was stable and the trend analysis showed no change. The green cover fraction and soil productivity in winter season was much higher as compared to summer season. The NDVI value on 18th
February, 2000 was 0.78 while the NDVI value on 16th
November, 2012 was 0.26 (Figure 14). The NDVI provides useful information for detecting and interpreting vegetation land cover it has been widely used in remote sensing studies (Dorman and Sellers, 1989; Myneni and Asrar, 1994; Gao, 1996; Sesnie et al., 2008; Karaburun, 2010; Ahmad, 2012).
Figure 15 shows time-series variation profile for Bodal Khaneke district Kasur. The profile showed that climate was not stable; the trend analysis showed negative tendency and severe dryness was observed in August-September 2011 (NDVI value -0.02). The fluctuations in the phenological profile were due to variation in the temperature-precipitation at Bodal Khaneke. Fluctuations were observed at start/end pixel values. The NDVI value on 18th February, 2000 was 0.23 while the NDVI value on 16th November, 2012 was 0.17 (Figure 15).
The ecology of the north-eastern Punjab province is mainly arid to semi arid. Abundant evidence verifies that the natural resources were unwisely over-exploited to achieve higher growth rates in agriculture. The country is now suffering from problems like water scarcity for crop cultivation with salinity and sodicity problems, more erratic and low rainfalls for rain-fed agriculture and low carrying capacity of rangelands representing more three-fifth of total geographic area. Agriculture is the only sector which is entirely dependent on the quality of natural resources for sustaining higher productivity (Farooq et al., 2007; Ahmad, 2012).
Figure 16 shows time-series variation profile for Asrur district Sheikhupura. The profile showed that climate was not stable and the trend analysis showed gradual positive tendency during the entire period, but little dryness was observed in January 2003 (NDVI value 0.05). The profile also showed gradual increase in precipitation from December 2004 to November 2012. The winter disturbances were much stronger, and the duration also increased from December 2009 to present at Asrur. The NDVI value on 18th February, 2000 was 0.43 while the NDVI value on 16th November, 2012 was 0.23 (Figure 16). The healthy and dense vegetation show a large NDVI (Fuller, 1998; Ahmad, 2012).
Figure 17 shows time-series variation profile for Katlohi Kallan district Kasur. The profile showed that climate was more or less stable. The trend analysis showed no change, but little dryness was observed in January 2003 (NDVI value 0.12). The NDVI value on 18th
February, 2000 was 0.68 while the NDVI value on 16th
November, 2012 was 0.32 (Figure 17). The NDVI can be used not only for accurate
description of vegetation classification and vegetation phenology (Tucker et al., 1982; Tarpley et al., 1984; Justice et al., 1985; Lloyd, 1990; Singh et al., 2003; Los et al., 2005; Ahmad, 2012) but also effective for monitoring rainfall and drought, estimating net primary production of vegetation, crop growth conditions and crop yields, detecting weather impacts and other events important for agriculture and ecology (Kogan, 1987; Dabrowska-Zielinska et al., 2002; Singh et al., 2003; Chris and Molly, 2006; Baldi et al., 2008; Glenn et al., 2008; Ahmad, 2012).
Figure 18 shows phenological temporal comparison for Thatha Khudayar district Sheikhupura. In this profile MODIS NDVI 500 m data products for the period 2007 to 2011 at 16-days interval was evaluated. The findings showed that the impact of summer monsoon was stronger as compared to winter disturbances. The precipitation was received in both the summer and winter season. The climate was stable during the entire period at Thatha Khudayar.
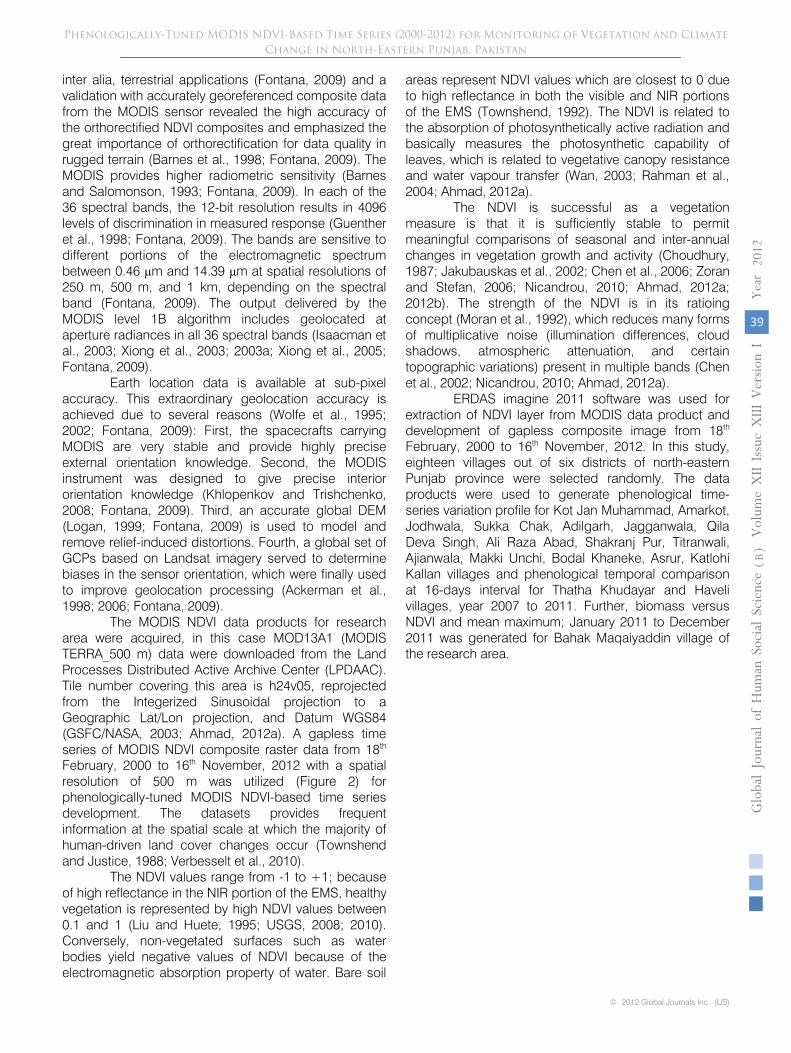
Figure 19 shows phenological temporal comparison for Haveli district Okara using MODIS NDVI 500 m data products at 16-days interval for the period 2007 to 2011. The temporal curves indicate that climate was stable, green cover fraction, and biomass productively increased due to precipitation in summer and winter season. The profile showed maximum soil and biomass productivity in 2009 and minimum in 2010 and land degradation can’t be seen at Haveli.
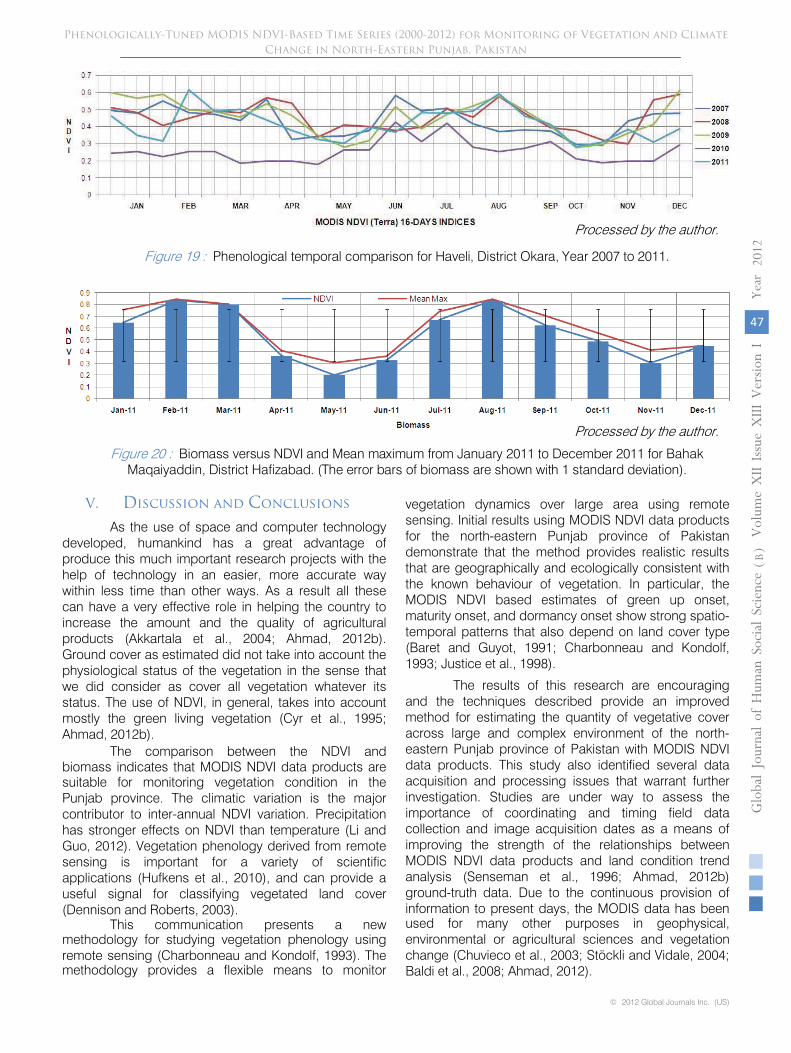
Figure 20 shows biomass versus NDVI and mean maximum from January 2011 to December 2011 for Bahak Maqaiyaddin district Hafizabad. The biomass and NDVI demonstrated clear inter-seasonal consistency indicated by the larger amount of biomass and the corresponding higher NDVI values in January, February, March, July, August, September and October
2012
Year
Globa
l Jo
urna
l of H
uman
Soc
ial Sc
ienc
e
Volum
e XII
Issu
e XIII
Ver
sion
I
( DDDD)
b
© 2012 Global Journals Inc. (US)
242
Phenologically-Tuned MODIS NDVI-Based Time Series (2000-2012) for Monitoring of Vegetation and Climate Change in North-Eastern Punjab, Pakistan

2011 and the smaller amount of biomass in April, May, June, November and December 2011 at Bahak Maqaiyaddin. The variations in biomass are fairly well represented by the changes of NDVI. The inter-seasonal
consistency of NDVI and biomass support the common use of NDVI to study vegetation response to climate variation (Anyamba and Eastman, 1996; Kogan, 1997; Li and Guo, 2012).
Glob a
l Jo
urna
l o f H
uman
S ocial S
cie n
ceVolum
e XII
Issu
e XIII
Ver
sion
I
( DD DD
)b
© 2012 Global Journals Inc. (US)
2012
Year
Processed by the author.
Figure 3 : Time-series phenology metrics for Kot Jan Muhammad, District Hafizabad.
Processed by the author.Figure 4 : Time-series phenology metrics for Amarkot, District Lahore.
Processed by the author.Figure 5 : Time-series phenology metrics for Jodhwala, District Kasur.
Processed by the author.Figure 6 : Time-series phenology metrics for Sukka Chak, District Okara.
43
Phenologically-Tuned MODIS NDVI-Based Time Series (2000-2012) for Monitoring of Vegetation and Climate Change in North-Eastern Punjab, Pakistan

2012
Year
Globa
l Jo
urna
l of H
uman
Soc
ial Sc
ienc
e
Volum
e XII
Issu
e XIII
Ver
sion
I
( DDDD)
b
© 2012 Global Journals Inc. (US)
Processed by the author.
Figure 7 : Time-series phenology metrics for Adilgarh, District Nankana Sahib.
Processed by the author.
Figure 8 : Time-series phenological variation for Jagganwala, District Hafizabad.
Processed by the author.
Figure 9 : Time-series phenological variation for Qila Deva Singh, District Nankana Sahib.
Processed by the author.
Figure 10 : Time-series phenological variation for Ali Raza Abad, District Lahore.
244
Phenologically-Tuned MODIS NDVI-Based Time Series (2000-2012) for Monitoring of Vegetation and Climate Change in North-Eastern Punjab, Pakistan

Glob a
l Jo
urna
l o f H
uman
S ocial S
cie n
ceVolum
e XII
Issu
e XIII
Ver
sion
I
( DD DD
)b
© 2012 Global Journals Inc. (US)
2012
Year
Processed by the author.Figure 11 : Time-series phenological variation for Shakranj Pur, District Okara.
Processed by the author.Figure 12 : Time-series phenological variation for Titranwali, District Nankana Sahib.
Processed by the author.Figure 13 : Time-series variation profile for Ajianwala, District Sheikhupura.
Processed by the author.
Figure 14 : Time-series variation profile for Makki Unchi, District Sheikhupura.
45
Phenologically-Tuned MODIS NDVI-Based Time Series (2000-2012) for Monitoring of Vegetation and Climate Change in North-Eastern Punjab, Pakistan

2012
Year
Globa
l Jo
urna
l of H
uman
Soc
ial Sc
ienc
e
Volum
e XII
Issu
e XIII
Ver
sion
I
( DDDD)
b
© 2012 Global Journals Inc. (US)
Processed by the author.
Figure 15 : Time-series variation profile for Bodal Khaneke, District Kasur.
Processed by the author.
Figure 16 : Time-series variation profile for Asrur, District Sheikhupura.
Processed by the author.
Figure 17 : Time-series variation profile for Katlohi Kallan, District Kasur.
Processed by the author.
Figure 18 : Phenological temporal comparison for Thatha Khudayar, District Sheikhupura, Year 2007 to 2011.
246
Phenologically-Tuned MODIS NDVI-Based Time Series (2000-2012) for Monitoring of Vegetation and Climate Change in North-Eastern Punjab, Pakistan
Glob a
l Jo
urna
l o f H
uman
S ocial S
cie n
ceVolum
e XII
Issu
e XIII
Ver
sion
I
( DD DD
)b
© 2012 Global Journals Inc. (US)
2012
Year
Processed by the author.
Figure 19 : Phenological temporal comparison for Haveli, District Okara, Year 2007 to 2011.
Processed by the author.
Figure 20 : Biomass versus NDVI and Mean maximum from January 2011 to December 2011 for Bahak Maqaiyaddin, District Hafizabad. (The error bars of biomass are shown with 1 standard deviation).
V. Discussion and Conclusions
As the use of space and computer technology developed, humankind has a great advantage of produce this much important research projects with the help of technology in an easier, more accurate way within less time than other ways. As a result all these can have a very effective role in helping the country to increase the amount and the quality of agricultural products (Akkartala et al., 2004; Ahmad, 2012b). Ground cover as estimated did not take into account the physiological status of the vegetation in the sense that we did consider as cover all vegetation whatever its status. The use of NDVI, in general, takes into account mostly the green living vegetation (Cyr et al., 1995; Ahmad, 2012b).
suitable for monitoring vegetation condition in the Punjab province. The climatic variation is the major contributor to inter-annual NDVI variation. Precipitation has stronger effects on NDVI than temperature (Li and Guo, 2012). Vegetation phenology derived from remote sensing is important for a variety of scientific applications (Hufkens et al., 2010), and can provide a useful signal for classifying vegetated land cover (Dennison and Roberts, 2003).
This communication presents a new methodology for studying vegetation phenology using remote sensing (Charbonneau and Kondolf, 1993). The methodology provides a flexible means to monitor
vegetation dynamics over large area using remote sensing. Initial results using MODIS NDVI data products for the north-eastern Punjab province of Pakistan demonstrate that the method provides realistic results that are geographically and ecologically consistent with the known behaviour of vegetation. In particular, the MODIS NDVI based estimates of green up onset, maturity onset, and dormancy onset show strong spatio-temporal patterns that also depend on land cover type (Baret and Guyot, 1991; Charbonneau and Kondolf, 1993; Justice et al., 1998).
The results of this research are encouraging and the techniques described provide an improved method for estimating the quantity of vegetative cover across large and complex environment of the north-eastern Punjab province of Pakistan with MODIS NDVI data products. This study also identified several data acquisition and processing issues that warrant further investigation. Studies are under way to assess the importance of coordinating and timing field data collection and image acquisition dates as a means of improving the strength of the relationships between MODIS NDVI data products and land condition trend analysis (Senseman et al., 1996; Ahmad, 2012b) ground-truth data. Due to the continuous provision of information to present days, the MODIS data has been used for many other purposes in geophysical, environmental or agricultural sciences and vegetation change (Chuvieco et al., 2003; Stöckli and Vidale, 2004; Baldi et al., 2008; Ahmad, 2012).
47
The comparison between the NDVI and biomass indicates that MODIS NDVI data products are
Phenologically-Tuned MODIS NDVI-Based Time Series (2000-2012) for Monitoring of Vegetation and Climate Change in North-Eastern Punjab, Pakistan

The study demonstrates the successful application of MODIS NDVI products on climatic variation. Through the application and analyses of time series data, this research provides valuable understanding of the impact of environmental drivers on the spatial, annual and interannual variation of vegetation dynamics in the north-eastern Punjab province of Pakistan (Ahmad, 2012). The approaches used in this study can be applied to other areas to investigate vegetation response to climate variation.
Acknowledgements
The author wishes to thank his respected mentor Dr. Robert Bryant, Sheffield Centre for International Drylands Research, Department of Geography, The University of Sheffield for review and providing valuable comments on draft-version of this paper.
1. Aber, J.D., Ollinger, S.V., Federer, C.A., Reich, P.B., Goulden, M.L., Kicklighter, D.W., Melillo, J.M. and Lathrop, R.G. (1995). Predicting the effects of climate change on water yield and forest production in the northeastern United States. Climate Research, Vol. 5, pp.207-222.
2. Ackerman, S.A., Strabala, K.I., Menzel, W.P., Frey, R.A., Moeller, C.C., Gumley, L.E., Baum, B., Seemann, S.W. and Hong, Z. (2006). Discriminating clear sky from clouds with MODIS, Algorithm theoretical basis document (MOD35). URL: http://modis.gsfc.nasa.gov/ (Accessed on December 14, 2012).
3. Ackerman, S.A., Strabala, K.I., Menzel, W.P., Frey, R.A., Moeller, C.C. and Gumley, L.E. (1998). Discriminating clear sky from clouds with MODIS. Journal of Geophysical Research, Vol. 103(D24), pp.32,141-32,157.
4. Aguilar, C., Zinnert, J.C., Polo, M.J. and Young, D.R. (2012). NDVI as an indicator for changes in water availability to woody vegetation. Ecological Indicators, Vol. 23, pp.290-300.
5. Ahmad, F. (2012). NOAA AVHRR satellite data for evaluation of climatic variation and vegetation change in the Punjab Province, Pakistan. Journal of Food, Agriculture & Environment, Vol. 10(2), pp.1298-1307.
6. Ahmad, F. (2012a). A review of remote sensing data change detection: Comparison of Faisalabad and Multan Districts, Punjab Province, Pakistan. Journal of Geography and Regional Planning, Vol. 5(9), pp.236-251.
2012
Year
Globa
l Jo
urna
l of H
uman
Soc
ial Sc
ienc
e
Volum
e XII
Issu
e XIII
Ver
sion
I
( DDDD)
b
© 2012 Global Journals Inc. (US)
7. Ahmad, F. (2012b). Spectral vegetation indices performance evaluated for Cholistan Desert. Journal of Geography and Regional Planning, Vol. 5(6), pp.165-172.
248
8. Ahmad, F. (2012c). Detection of change in vegetation cover using multi-spectral and multi-temporal information for District Sargodha. Revista Sociedade & Natureza, Vol. 24(3), pp.557-571.
9. Akiyama, T., Kawamura, K., Fukuo, A. and Chen, Z.Z. (2002). Sustainable grassland management using GIS, GPS and remote sensing data in Inner Mongolia. In: Uchida, S., Youqi, C. and Saito, G. (Eds.), Application on remote sensing technology for the management of agricultural resources, Beijing’ China Agricultural Scientech Press, pp.13-19.
10. Akkartala, A., Türüdüa, O. and Erbekb, F.S. (2004). Analysis of changes in vegetation biomass using multitemporal and multisensor satellite data. Proceedings of XXXV ISPRS Congress, 12-23 July 2004, Istanbul, Turkey. URL: http://www.isprs.org/proceedings/XXXV/congress/yf/papers/946.pdf. (Accessed on September 17, 2011).
11. Anyamba, A. and Eastman, J. (1996). Interannual variability of NDVI over Africa and its relationship to El Ninõ/Southern Oscillation. International Journal of Remote Sensing, Vol. 17(13), pp.2533-2548.
12. Baldi, G. and Paruelo, J.M. (2008). Land use and land cover dynamics in South American temperate Grasslands. Ecology and Society, Vol. 13(2), Art 6. URL:http://www.ecologyandsociety.org/vol13/iss2/art6/ (Accessed on January 11, 2012).
13. Baldi, G., Nosetto, M.D., Aragón, R., Aversa, F., Paruelo, J.M. and Jobbágy, E.G. (2008). Long-term satellite NDVI datasets: Evaluating their ability to detect ecosystem functional changes in South America. Sensors, Vol. 8, pp.5397-5425.
14. Baldocchi, D.D., Black, T.A., Curtis, P.S., Falge, E., Fuentes, J.D., Granier, A., Gu, L., Knohl, A., Pilegaard, K., Schmid, H.P., Valentini, R., Wilson, K., Wofsy, S., Xu, L. and Yamamoto, S. (2005). Predicting the onset of net carbon uptake by deciduous forests with soil temperature and climate data: a synthesis of FLUXNET data. International Journal of Biometeorology, Vol. 49, pp.377-387.
15. Baret, F. and Guyot, G. (1991). Potentials and limits of vegetation indices for LAI and APAR assessment. Remote Sensing of Environment, Vol. 35, pp.161-173.
16. Barnes, W.L. and Salomonson, V.V. (1993). MODIS: A global image spectroradiometer for the Earth Observing System. Critical Reviews of Optical Science and Technology, CR47, pp.285-307.
17. Barnes, W.L., Pagano, T.S. and Salomonson, V.V. (1998). Prelaunch characteristics of the Moderate Resolution Imaging Spectroradiometer (MODIS) on EOS-AM1. IEEE Transactions on Geoscience and Remote Sensing, Vol. 36, pp.1088-1100.
18. Budde, M.E., Tappan, G., Rowland, J., Lewis, J. and Tieszen, L.L. (2004). Assessing land cover
References Références Referencias
Phenologically-Tuned MODIS NDVI-Based Time Series (2000-2012) for Monitoring of Vegetation and Climate Change in North-Eastern Punjab, Pakistan

performance in Senegal, West Africa using 1-km integrated NDVI and local variance analysis. Journal of Arid Environments, Vol. 59(3), pp.481-498.
19. Canziani, G.A., Ferrati, R.M., Rossi, C. and Ruiz-Moreno, D. (2006). The influence of climate and dam construction on the Iberá wetlands, Argentina. Regional Environmental Change, Vol. 6, pp.181-191.
20. Campbell, J.B. (1987). Introduction to remote sensing. The Guilford Press, New York, p.281.
21. Carrão, H., Gonçalves, P. and Caetano, M. (2008). Contribution of multispectral and multitemporal information from MODIS images to land cover classification. Remote Sensing of Environment, Vol. 112(3), pp.986-997.
22. Chandola, V., Hui, D., Gu, L., Bhaduri, B. and Vatsavai, R.R. (2010). Using time series segmentation for deriving vegetation phenology indices from MODIS NDVI data. IEEE International Conference on Data Mining Workshops, 13th
December 2010, Sydney, Australia. pp.202-208. 23. Chen, P.Y., Fedosejevs, G., Tiscareño-LóPez, M.
and Arnold, J.G. (2006). Assessment of MODIS-EVI, MODIS-NDVI and VEGETATION-NDVI composite data using agricultural measurements: An example at corn fields in western Mexico. Springer, Netherlands, Environmental Monitoring and Assessment, Vol. 119(1-3), pp.69-82.
24. Chen, P.Y., Srinivasan, R., Fedosejevs, G., Báez-González, A.D. and Gong, P. (2002). Assessment of NDVI composite using merged NOAA-14 and NOAA-15 AVHRR data. Geographic Information Sciences, Vol. 8(1), pp.31-38.
25. Charbonneau, R. and Kondolf, G.M. (1993). Land use change in California, USA: Nonpoint source water quality impacts. Environmental Management, Vol. 17(4), pp.453-460.
26. Choudhury, B.J. (1987). Relationship betweenvegetation indices, radiation absorption, and net photosynthesis evaluated by sensitivity analysis. Remote Sensing of Environment, Vol. 22, pp.209-233.
27. Chris, C.F. and Molly, E.B. (2006). Intra-seasonal NDVI change projections in semi-arid Africa. Remote Sensing of Environment, Vol. 101, pp.249-256.
28. Chuvieco, E., Aguado, I., Cocero, D. and Riano, D. (2003). Design of an empirical index to estimate fuel moisture content from NOAA-AVHRR images in forest fire danger studies. International Journal of Remote Sensing, Vol. 24, pp.1621-1637.
29. Cyr, L., Bonn, F. and Pesant, A. (1995). Vegetation indices derived from remote sensing for an
Glob a
l Jo
urna
l o f H
uman
S ocial S
cie n
ceVolum
e XII
Issu
e XIII
Ver
sion
I
( DD DD
)b
© 2012 Global Journals Inc. (US)
2012
Year
estimation of soil protection against water erosion.Ecological Modelling, Vol. 79(1-3), pp.277-285.
30. Dabrowska-Zielinska, K., Kogan, F., Ciolkosz, A., Gruszczynska, M. and Kowalik, W. (2002).
Modelling of crop growth conditions and crop yield in Poland using AVHRR-based indices. International Journal of Remote Sensing, Vol. 23, pp.1109-1123.
31. Dennison, P.E. and Roberts, D.A. (2003). The effects of vegetation phenology on endmember selection and species mapping in southern California chaparral. Remote Sensing of Environment, Vol. 87(2-3), pp.123-135.
32. Dong, J., Kaufmann, R.K., Myneni, R.B., Tucker, C.J., Kauppi, P.E., Liski, J., Buermann, W., Alexeyev, V. and Hughes, M.K. (2003). Remote sensing estimates of boreal and temperate forest woody biomass, carbon pools, sources and sinks. Remote Sensing of Environment, Vol. 84, pp.393-410.
33. Dorman, J.L. and Sellers, P.J. (1989). A Global climatology of albedo, roughness length and stomatal resistance for atmospheric general circulation models as represented by the SimpleBiosphere Model (SiB). Journal of Applied Meteorology, Vol. 28(9), pp.833-855.
34. Farooq, U., Ahmad, M. and Jasra, A.W. (2007). Natural resource conservation, poverty alleviation, and farmer partnership. The Pakistan Development Review, Vol. 46(4), pp.1023-1049.
35. Fearnside, P.M. (2005). Deforestation in Brazilian Amazonia: History, rates, and consequences. Conservation Biology, Vol. 19, pp.680-688.
36. Fontana, F.M.A. (2009). From single pixel to continental scale: using AVHRR and MODIS to study land surface parameters in mountain regions. Ph.D. dissertation, Institute of Geography, University of Bern, Switzerland. URL: http://www. climatestudies.unibe.ch/students/theses/phd/31.pdf.(Accessed on October 15, 2012).
37. Fuller, D.O. (1998). Trends in NDVI time series and their relation to rangeland and crop production in Senegal. International Journal of Remote Sensing, Vol. 19, pp.2013-2018.
38. Gao, B.C. (1996). NDWI - A normalized difference water index for remote sensing of vegetation liquid water from space. Remote Sensing of Environment, Vol. 58, pp.257-266.
40. Glenn, E.P., Huete, A.R., Nagler, P.L. and Nelson, S.G. (2008). Relationship between remotely-sensed vegetation indices, canopy attributes and plant physiological processes: What vegetation indices can and cannot tell us about the landscape. Sensors, Vol. 8, pp.2136-2160.
49
41. Groeneveld, D.P. and Baugh, W.M. (2007). Correcting satellite data to detect vegetation signal
39. Gao, Y. and Mas, J.F. (2008). MODIS EVI as an ancillary data for an object-based image analysis with multi-spectral MODIS data. URL: http://www.isprs.org/proceedings/XXXVIII/4-C1/Sessions/Sessio n5/6590_YGao_Proc_poster.pdf. (Accessed on September 07, 2011).
Phenologically-Tuned MODIS NDVI-Based Time Series (2000-2012) for Monitoring of Vegetation and Climate Change in North-Eastern Punjab, Pakistan

for eco-hydrologic analyses. Journal of Hydrology, Vol. 344(1-2), pp.135-145.
42. Grau, H.R., Gasparri, N.I. and Aide, T.M. (2005). Agriculture expansion and deforestation in seasonally dry forests of north-west Argentina. Environmental Conservation. Vol. 32, pp.140-148.
44. Guenther, B., Godden, G., Xiong, X., Knight, E., Qiu,S., Montgomery, H., Hopkins, M., Khayat, M. and Hao, Z. (1998). Prelaunch algorithm and data format for the level 1 calibration products for the EOS-AM1 Moderate Resolution Imaging Spectroradiometer (MODIS). IEEE Transaction on Geoscience and Remote Sensing, Vol. 36(4), pp.1142-1151.
45. Guo, X. (2003). Relationships between NDVI and climatological variability in the Prairie ecozone of Canada. Prairie Perspectives, Vol.6, pp.32-46.
46. Hamel, S., Garel, M., Festa-Bianchet, M., Gaillard, J-M. and Côté, S.D. (2009). Spring Normalized Difference Vegetation Index (NDVI) predicts annual variation in timing of peak faecal crude protein in mountain ungulates. Journal of Applied Ecology, Vol. 46, pp.582-589.
47. Hashemi, S.A. (2010). Evaluating phenological events of shrubs land by AVHRR data. American Journal of Scientific Research, Issue 12, pp.23-31.
48. Huang, C., Kim, S., Altstatt, A., Townshend, J.R.G., Davis, P., Song, K., Tucker, C.J., Rodas, O., Yanosky, A., Clay, R. and Musinsky, J. (2007). Rapid loss of Paraguay's Atlantic forest and the status of protected areas: A Landsat assessment. Remote Sensing of Environment, Vol. 106, pp.460-466.
50. Huete, A.R., Didan, K., Miura, T., Rodriguez, E.P., Gao, X. and Ferreira, L.G. (2002). Overview of the radiometric and biophysical performance of the MODIS vegetation indices. Remote Sensing of Environment, Vol. 83(1-2), pp.195-213.
51. Huete, A.R., Didan, K., Shimabukuro, Y.E., Ratana, P., Saleska, S.R., Hutyra, L.R., Yang, W., Nemani, R.R. and Myneni, R. (2006). Amazon rainforests green-up with sunlight in dry season. Geophysical Research Letters, Vol. 33(L06405), 4 p.
52. Huete, A.R., Justice, C. and Leeuwen, van W.(1999). MODIS vegetation index (MOD 13) algorithm theoretical basis document version 3. URL: http://modis.gsfc.nasa.gov/data/atbd/atbd_mod13.pdf. (Accessed on September 17, 2011).
54. Isaacman, A., Toller, G., Guenther, B., Barnes, W.L. and Xiong, X. (2003). MODIS level 1B calibration and data products. In: Huang, H., Lu, D. and Sasano, Y. (Eds.), Earth Observing Systems VIII, Proceedings of SPIE, Vol. 5151, pp.552-562.
55. Jakubauskas, M.E., David, R. and Kastens, J.H. (2002). Crop identification using harmonic analysis of time-series AVHRR NDVI data. Computers and Electronics in Agriculture, Vol. 37(1-3), pp.127-139.
56. Jenkins, J.P., Braswell, B.H., Frolking, S.E. and Aber, J.D. (2002). Detecting and predicting spatial and interannual patterns of temperate forest springtime phenology in the eastern U.S. Geophysical Research Letters, Vol. 29(24), pp.54,1-54,4.
57. Jensen, J.R. (2005). Introductory digital image processing: A remote sensing perspective. 3rd
Edition, Englewood Cliffs, New Jersey, Prentice-Hall, pp.34-67.
58. Ji, L. and Peters, A.J. (2003). Assessing vegetation response to drought in the northern Great Plains using vegetation and drought indices. Remote Sensing of Environment, Vol. 87, pp.85-98.
60. Jin, S.Mg. and Steven, A.S. (2005). MODIS time-series imagery for forest disturbance detection and quantification of patch size effects. Remote Sensing of Environment, Vol. 99(4), pp.462-470.
49. Huete, A.R. (2005). Global variability of terrestrial surface properties derived from MODIS visible to thermal-infrared measurements. Proceedings of IGARSS 05 Geoscience and Remote Sensing Symposium, 25-29 July 2005. URL: http://ieeexplore .ieee.org/iel5/10226/32601/01526782.pdf. (Accessed on September 05, 2011).
43. GSFC/NASA (2003). MODIS technical specifications. URL: http://modis.gsfc.nasa.gov /about/specs.html. (Accessed on September 05, 2011).
53. Hufkens, K., Friedl, M.A., Richardson, A., Milliman, T. and Migliavacca, M. (2010). Vegetation phenology from MODIS/AVHRR/PhenoCam: Scaling and validation possibilities. URL: http://modis.gsfc. nasa.gov/sci_team/meetings/201001/presentations/posters/land/hufkens.pdf. (Accessed on November 10, 2011).
59. Jianya, G., Haigang, S., Guorui, Ma. and Qiming, Z. (2008). A review of multi-temporal remote sensing data change detection algorithms. The International Archives of the Photogrammetry, Remote Sensing and Spatial Information Sciences, Vol. XXXVII. Part B7, pp.757-762. URL: http://www.isprs.org/ proce-edings/XXXVII/congress/7_pdf/5_WG-VII-5/05.pdf. (Accessed on November 15, 2012).
62. Justice, C.O., Townshend, J.R.G., Holben, B.N. and Tucker, C.J. (1985). Analysis of the phenology of global vegetation using meteorological satellite
61. Justice, C., Vermote, E., Townshend, J.R.G., DeFries, R., Roy, D.P., Hall, D.K., Salomonson, V.V., Privette, J., Riggs, G., Strahler, A., Lucht, W., Myneni, R., Knjazihhin, Y., Running, S., Nemani, R., Wan, Z., Huete, A.R., Leeuwen, van W., Wolfe, R., Giglio, L., Muller, J.P., Lewis, P. and Barnsley, M. (1998). The Moderate Resolution Imaging Spectroradiometer (MODIS): Land remote sensing for global change research. IEEE Transactions on Geoscience and Remote Sensing, Vol. 36, pp.1228-1249.
data. International Journal of Remote Sensing, Vol.
Phenologically-Tuned MODIS NDVI-Based Time Series (2000-2012) for Monitoring of Vegetation and Climate Change in North-Eastern Punjab, Pakistan
2012
Year
Globa
l Jo
urna
l of H
uman
Soc
ial Sc
ienc
e
Volum
e XII
Issu
e XIII
Ver
sion
I
( DDDD)
b
© 2012 Global Journals Inc. (US)
250

63. Justice, C.O., Townshend, J.R.G., Vermote, E.F., Masuoka, E., Wolfe, R.E., Saleous, N., Roy, D.P. and Morisette, J.T. (2002). An overview of MODIS land data processing and product status. Remote Sensing of Environment, Vol. 83, pp.3-15.
64. Karaburun, A. (2010). Estimation of C factor for soil erosion modeling using NDVI in Büyükçekmece watershed. Ozean Journal of Applied Sciences, Vol. 3(1), pp.77-85.
65. Kawabata, A., Ichii, K. and Yamaguchi, Y. (2001). Global monitoring of the inter-annual changes in vegetation activities using NDVI and its relationships to temperature and precipitation. International Journal of Remote Sensing, Vol. 22(7), pp.1377-1382.
66. Khan, J.A. (1993). The Climate of Pakistan. Rehbar Publishers, Karachi, Pakistan, pp.9-13.
67. Khlopenkov, K.V. and Trishchenko, A.P. (2008). Implementation and evaluation of concurrent gradient search method for reprojection of MODIS level 1B imagery. IEEE Transaction on Geoscience and Remote Sensing, Vol. 46(7), pp.2016-2027.
68. Kogan, F.N. (1987). Vegetation index for areal analysis of crop conditions. Proceedings of 18th
Conference Agricultural and Forest Meteorologyand 8th Conference Biometeorology and Aerobiology, September 15-18, 1987, W. Lafayette, Indiana, AMS Publisher, pp.103-106.
69. Kogan, F.N. (1997). Global drought watch from space. Bulletin of the American Meteorological Society, Vol. 78(4), pp.621-636.
70. Li, Z. and Guo, X. (2012). Detecting climate effects on vegetation in northern mixed prairie using NOAA AVHRR 1-km time-series NDVI data. Remote Sensing, Vol. 4, pp.120-134.
71. Liu, H.Q. and Huete, A.R. (1995). A feedback based modification of the NDV I to minimize canopy background and atmospheric noise. IEEE Transactions on Geoscience and Remote Sensing, Vol. 33, pp.457-465.
72. Lloyd, D. (1990). A phenological classification of terrestrial vegetation cover using shortwavevegetation index imagery. International Journal ofRemote Sensing, Vol. 11(12), pp.2269-2279.
73. Logan, T.L. (1999). EOS/AM-1 Digital Elevation Model (DEM) Data Sets: DEM and DEM auxiliary datasets in support of the EOS/Terra platform. JPL D-013508. Jet Propulsion Laboratory, California Institute of Technology, Pasadena, CA.
Glob a
l Jo
urna
l o f H
uman
S ocial S
cie n
ceVolum
e XII
Issu
e XIII
Ver
sion
I
( DD DD
)b
© 2012 Global Journals Inc. (US)
2012
Year
74. Los, S.O., Collatz, G.J., Bounoua, L., Sellers, P.J. and Tucker, C.J. (2001). Global interannual variations in sea surface temperature and land surface vegetation, air temperature, and precipitation. Journal of Climate, Vol. 14, pp.1535-1549.
75. Los, S.O., North, P.R.J., Grey, W.M.F. and Barnsley, M.J. (2005). A method to convert AVHRR normalized difference vegetation index time series to a standard viewing and illumination geometry. Remote Sensing of Environment, Vol. 99(4), pp.400-411.
76. Lucht, W., Prentice, I.C., Myneni, R.B., Sitch, S.,Friedlingstein, P., Cramer, W., Bousquet, P., Buermann, W. and Smith, B. (2002). Climatic control of the high-latitude vegetation greening trend and Pinatubo effect. Science, Vol. 296(5573), pp.1687-1689.
77. Malo, A.R. and Nicholson, S.E. (1990). A study of rainfall and vegetation dynamics in the African Sahelusing normalized difference vegetation index. Journal of Arid Environments, Vol. 19(1), pp.1-24.
78. Meneses-Tovar, C.L. (2011). NDVI as indicator of degradation. Unasylva, Vol. 62(238), pp. 39-46.
79. Menzel, A., Estrella, N. and Fabian, P. (2001). Spatial and temporal variability of the phenological seasons in Germany from 1951 to 1996. Global Change Biology, Vol. 7, pp.657-666.
80. Moran, M.S., Jackson, R.D., Slater, P.N. and Teillet, P.M. (1992). Evaluation of simplified procedures for retrieval of land surface reflectance factors from satellite sensor output. Remote Sensing of Environment, Vol. 41, pp.169-184.
81. Moulin, S., Kergoat, L., Viovy, N. and Dedieu, G. (1997). Global scale assessment of vegetation phenology using NOAA/AVHRR satellite measurements. Journal of Climate, Vol. 10, pp.1154-1170.
82. Musande, V., Kumar, A., Kale, K. and Roy, P.S. (2012). Temporal indices data for specific crop discrimination using fuzzy based noise classifier. International Archives of the Photogrammetry, Remote Sensing and Spatial Information Sciences, XXII ISPRS Congress, 25 August - 01 September 2012, Melbourne, Australia. Vol. XXXIX-B8, pp.289-294.
84. Myneni, R.B. and Asrar, G. (1994). Atmospheric effects and spectral vegetation indices. Remote Sensing of Environment, Vol. 47, pp.390-402.
85. Myneni, R.B., Keeling, C.D., Tucker, C.J., Asrar, G. and Nemani, R.R. (1997). Increased plant growth in the northern high latitudes from 1981-1991. Nature, Vol. 386, pp.698-702.
51
86. Nicandrou, A. (2010). Hydrological assessment and modelling of the river Fani catchment, Albania. Faculty of Advanced Technology, University of
83. Myneni, R.B., Dong, J., Tucker, C.J., Kaufmann, R.K., Kauppi, P.E., Liski, J., Zhou, L., Alexeyev, V. and Hughes, M.K. (2001). A large carbon sink in the woody biomass of Northern forests. Proceedings of the National Academy of Sciences of the United States of America, Vol. 98, pp.14784-14789.
Phenologically-Tuned MODIS NDVI-Based Time Series (2000-2012) for Monitoring of Vegetation and Climate Change in North-Eastern Punjab, Pakistan

88. Ouyang, W., Hao, FH., Skidmore, A.K., Groen, T.A., Toxopeus, A.G. and Wang, T. (2012). Integration of multi-sensor data to assess grassland dynamics in a Yellow River sub-watershed. Ecological Indicators, Vol. 18, pp.163-170.
89. Paruelo, J.M., Epstein, H.E., Lauenroth, W.K. and Burke, I.C. (1997). ANPP estimates from NDVI for the Central Grassland Region of the United States. Ecology, Vol. 78(3), pp.953-958.
90. Pauchard, A., Aguayo, M., Peña, E. and Urrutia, R. (2006). Multiple effects of urbanization on the biodiversity of developing countries: The case of a fast-growing metropolitan area (Concepción, Chile). Biological Conservation, Vol. 127, pp.272-281.
91. Pettorelli, N., Vik, J.O., Mysterud, A., Gaillard, J.M., Tucker, C.J. and Stenseth, N.C. (2005). Using the satellite-derived NDVI to assess ecological responses to environmental change. Trends in Ecology & Evolution, Vol. 20(9), pp.503-510.
92. Piao, S.L, Mohammat, A., Fang, J.Y., Cai, Q. and Feng, J. (2006). NDVI-based increase in growth of temperate grasslands and its responses to climate changes in China. Global Environmental Change, Vol. 16(4), pp.340-348.
93. Piao, S.L., Fang, J.Y. and He, J.S. (2006a). Variations in vegetation net primary production in the Qinghai-Xizang Plateau, China, from 1982 to 1999. Climatic Change, Vol. 74(1-3), pp.253-267.
94. Piao, S.L., Fang, J.Y., Zhou, L.M., Guo, Q.H., Henderson, M., Ji, W., Li, Y. and Tao, S. (2003). Interannual variations of monthly and seasonal NDVI in China from 1982 to 1999. Journal of Geophysical Research, Vol. 108(D14), pp.4401-4413.
95. Potter, C.S., Randerson, J.T., Field, C.B., Matson, P.A., Vitousek, P.M., Mooney, H.A. and Klooster, S.A. (1993). Terrestrial ecosystem production, a process model based on global satellite and surface data. Global Biogeochemical Cycles, Vol. 7, pp.811-841.
96. Prasad, A.K., Sudipta, S., Singh, R.P. and Kafatos, M. (2007). Inter-annual variability of vegetation cover
2012
Year
Globa
l Jo
urna
l of H
uman
Soc
ial Sc
ienc
e
Volum
e XII
Issu
e XIII
Ver
sion
I
( DDDD)
b
© 2012 Global Journals Inc. (US)
and rainfall over India. Advances in Space Research, Vol. 39(1), pp.79-87.
252
Glamorgan. URL: http://dspace1.isd.glam.ac.uk/dspace/handle/10265/461 (Accessed on November 11, 2012).
87. Nightingale, J.M., Esaias, W.E., Wolfe, R.E., Nickeson, J.E. and Pedelty, J.A. (2008). Assessing the effect of climate change on honey bees using scale hive records and satellite derived vegetation phenology products. URL: http://www.igarss08.org/Abstracts/pdfs/2282.pdf. (Accessed on Nove-mber 10, 2011).
97. Rahman, Md.R., Islam, A.H.M.H. and Rahman, Md.A. (2004). NDVI derived sugarcane area identification and crop condition assessment. Planplus, Vol. 1(2), pp.1-12.
99. Richardson, A.D., Hollinger, D.Y., Dail, D.B., Lee,J.T., Munger, J.W. and O'keefe, J. (2009). Influence of spring phenology on seasonal and annual carbon balance in two contrasting New England forests. Tree Physiology, Vol. 29, pp.321-331.
100. Romero, H. and Ordenes, F. (2004). Emerging urbanization in the Southern Andes: Environmental impacts of urban sprawl in Santiago de Chile on the Andean piedmont. Mountain Research and Development, Vol. 24, pp.197-201.
101. Rouse, J.W., Haas, R.H., Schell, J.A. and Deering, D.W. (1973). Monitoring vegetation systems in the Great Plains with ERTS. 3rd ERTS Symposium, NASA SP-351 I, pp.309-317. URL: http://geol.hu/data/online_help/Vegetation_Indices.html. (Access-ed on January 10, 2012).
102. Singh, R.P., Roy, S. and Kogan, F. (2003). Vegetation and temperature condition indices from NOAA AVHRR data for drought monitoring over India. International Journal of Remote Sensing, Vol. 24(22), pp.4393-4402.
103. Saito, G., Mino, N., Li, Y.Q. and Yasuda, Y. (2002). Seasonal changes of vegetation index obtained from NOAA/AVHRR data in China and Japan. In: Uchida, S., Youqi, C. and Saito, G. (Eds.), Application on remote sensing technology for the management of agricultural resources, Beijing’ China Agricultural Scientech Press, pp.107-114.
104. Sakamoto, T., Yokozawa, M., Toritani, H., Shibayama, M., Ishitsuka, N. and Ohno, H. (2005). A crop phenology detection method using time-series MODIS data. Remote Sensing of Environment, Vol. 96, pp.366-374.
105. Salomonson, V.V. and Toll, D.L. (1991). Execution phase (C/D) spectral band characteristics of the EOS moderate resolution imaging spectrometer-Nadir (MODIS-N) facility instrument. Advances in Space Research, Vol. 11, pp.231-236.
106. Senseman, G.M., Bagley, C.F. and Tweddale, S.A. (1996). Correlation of rangeland cover measures to satellite-imagery-derived vegetation indices. Geocarto International, Vol. 11(3), pp.29-38.
107. Sesnie, S.E., Gessler, P.E., Finegan, B. and Thessler, S. (2008). Integrating Landsat TM and SRTM-DEM derived variables with decision trees for habitat classification and change detection in complex neotropical environments. Remote Sensing of Environment, Vol. 112, pp.2145-2159.
108. Stöckli, R. and Vidale, P.L. (2004). European plant phenology and climate as seen in a 20-year AVHRR land-surface parameter dataset. International Journal of Remote Sensing, Vol. 25, pp.3303-3330.
98. Reed, B.C., Brown, J.F., VanderZee, D., Loveland, T.R., Merchant, J.W. and Ohlen, D.O. (1994). Measuring phenological variability from satellite imagery. Journal of Vegetation Science, Vol. 5(5), pp.703-714.
Phenologically-Tuned MODIS NDVI-Based Time Series (2000-2012) for Monitoring of Vegetation and Climate Change in North-Eastern Punjab, Pakistan

Glob a
l Jo
urna
l o f H
uman
S ocial S
cie n
ceVolum
e XII
Issu
e XIII
Ver
sion
I
( DD DD
)b
© 2012 Global Journals Inc. (US)
2012
Year
53
109. Tan, B., Morisette, J.T., Wolfe, R.E., Gao, F., Ederer, G.A., Nightingale, J.M. and Pedelty, J.A. (2008). Vegetation phenology metrics derived from temporally smoothed and gap-filled MODIS data. URL: www.igarss08.org/Abstracts/pdfs/2347.pdf. (Accessed on November 10, 2011).
110. Thomas, D.S.G. and Leason, H.C. (2005). Dunefield activity response to climate variability in the southwest Kalahari. Geomorphology, Vol. 64(1-2), pp.117-132.
111. Townshend, J.R.G. (1992). Improved Global Data for Land Applications: A proposal for a new high resolution data Set, Report No. 20. International Geosphere–Biosphere Program, Stockholm, Sweden. URL: http://library.wur.nl/WebQuery/clc/916 308. (Accessed on June 04, 2012).
112. Townshend, J.R.G. and Justice, C.O. (1988). Selecting the spatial-resolution of satellite sensors required for global monitoring of land transformations. International Journal of Remote Sensing, Vol. 9(2), pp.187-236.
113. Tarpley, J.D., Schnieder, S.R. and Money, R.L. (1984). Global vegetation indices from NOAA-7 meteorological satellite. Journal of Climate and Applied Meteorology, Vol. 23, pp.4491-4503.
114. Trishchenko, A.P., Cihlar, J. and Li, Z. (2002). Effects of spectral response function on surface reflectance and NDVI measured with moderate resolution satellite sensors. Remote Sensing of Environment, Vol. 81, pp.1-18.
115. Tucker, C.J. (1979). Red and photographic infrared linear combinations for monitoring vegetation. Remote Sensing of Environment, Vol. 8, pp.127-150.
116. Tucker, C.J., Dregne, H.E. and Newcomb, W.W. (1991). Expansion and contraction of the Sahara Desert from 1980 to 1990. Science, Vol. 253, pp.299-301.
117. Tucker, C.J., Gatlin, J., Schnieder, S.R. and Kuchinos, M.A. (1982). Monitoring large scale vegetation dynamics in the Nile delta and river valley from NOAA AVHRR data. Proceedings of the Conference on Remote Sensing of Arid and Semi-Arid Lands, Cairo, Egypt, pp.973-977.
118. Tucker, C.J., Slayback, D.A., Pinzon, J.E., Los, S.O., Myneni, R.B. and Taylor, M.G. (2001). Higher northern latitude normalized difference vegetation index and growing season trends from 1982 to 1999. International Journal of Biometeorology, Vol. 45(4), pp.184-190.
119. USGS (2008). Earth Resources Observation and Science Center. URL: http://glovis.usgs.gov/
(Accessed on December 04, 2008).
121. Verbesselt, J., Hyndman, R., Zeileis, A. and Culvenor, D. (2010). Phenological change detection while accounting for abrupt and gradual trends in satellite image time series. Remote Sensing of Environment, Vol. 114(12), pp.2970-2980.
122. Villalba, R., Grau, H.R., Boninsegna, J.A., Jacoby, G.C. and Ripalta, A. (1998). Tree-ring evidence for long-term precipitation changes in subtropical South America. International Journal of Climatology, Vol. 18, pp.1463-1478.
123. Villalba, R., Lara, A., Boninsegna, J.A., Masiokas, M., Delgado, S., Aravena, J.C., Roig, F.A., Schmelter, A., Wolodarsky, A. and Ripalta, A. (2003). Large-scale temperature changes across the southern Andes: 20th century variations in the context of the past 400 years. Climatic Change, Vol.59, pp.177-232.
124. Wan, Z. (2003). MODIS Land-Surface Temperature products users’ guide. URL: http://www.icess.ucsb. edu/modis/LstUsrGuide/usrguide.html. (Accessed on September 07, 2011).
125. Wang, J., Rich, P.M. and Price, K.P. (2003). Temporal responses of NDVI to precipitation and temperature in the central Great Plains, USA. International Journal of Remote Sensing, Vol. 24, pp.2345-2364.
126. Weissteiner, C.J., Strobl, P. and Sommer, S. (2011). Assessment of status and trends of olive farming intensity in EU-Mediterranean countries using remote sensing time series and land cover data. Ecological Indicators, Vol. 11(2), pp.601-610.
127. Wessels, K., Steenkamp, K., Maltitz, von G. and Archibald, S. (2011). Remotely sensed vegetation phenology for describing and predicting the biomes of South Africa. Applied Vegetation Science, Vol. 14(1), pp.49-66.
128. Wolfe, R., Storey, J., Masuoka, E. and Fleig, A. (1995). MODIS Level 1A Earth location algorithm theoretical basis document. URL: http://modis. gsfc.nasa.gov/ (Accessed on December 14, 2012).
129. Wolfe, R.E., Nishihama, M., Fleig, A.J., Kuyper, J.A., Roy, D.P., Storey, J.C. and Patt, F.S. (2002). Achieving sub-pixel geolocation accuracy in support of MODIS land science. Remote Sensing of Environment, Vol. 83(1-2), pp.31-49.
130. Xiao, X., Boles, S., Frolking, S., Salas, W., Moore III, B., Li, C., He, L. and Zhao, R. (2002). Observation of flooding and rice transplanting of paddy rice field at the site to landscape scales in China using VEGETATION sensor data. International Journal of Remote Sensing, Vol. 23(15), pp.3009- 3022.
120. USGS (2010). What is NDVI? United States Geological Survey: Science for Changing World. URL: http://ivm.cr.usgs.gov/ (Accessed on September 10, 2011).
131. Xiong, J., Toller, G., Chiang, V., Sun, J., Esposito, J.A. and Barnes, W.L. (2005). MODIS level 1B algorithm theoretical basis document. URL: http://modis.gsfc.nasa.gov/ (Accessed on Nove-mber 12, 2012).
Phenologically-Tuned MODIS NDVI-Based Time Series (2000-2012) for Monitoring of Vegetation and Climate Change in North-Eastern Punjab, Pakistan

2012
Year
Globa
l Jo
urna
l of H
uman
Soc
ial Sc
ienc
e
Volum
e XII
Issu
e XIII
Ver
sion
I
( DDDD)
b
© 2012 Global Journals Inc. (US)
254
132. Xiong, X., Chiang, K., Guenther, B. and Barnes, W.L. (2003). MODIS thermal emissive bands calibration algorithm and on-orbit performance. In: Huang, H., Lu, D. and Sasano, Y. (Eds.), Optical Remote Sensing of the Atmosphere and Clouds III, Proceedings of the SPIE, Vol. 4891, pp.392-401.
133. Xiong, X., Sun, J., Esposito, J.A., Guenther, B. and Barnes, W.L. (2003a). MODIS reflective solar bands calibration algorithm and on-orbit performance. In: Huang, H., Lu, D. and Sasano, Y. (Eds.), Optical Remote Sensing of the Atmosphere and Clouds III, Proceedings of the SPIE, Vol. 4891, pp.95-104.
134. Yang, L., Wylie, B.K., Tieszen, L.L. and Reed, B.C. (1998). An analysis of relationships among climate forcing and time-integrated NDVI of grasslands over the US northern and central Great Plains. Remote Sensing of Environment, Vol. 65, pp.25-37.
135. Yang, Y., Yang, L. and Merchant, J.W. (1997). An assessment of AVHRR/NDVI-ecoclimatological relations in Nebraska, USA. International Journal of Remote Sensing, Vol. 18(10), pp.2161-2180.
136. Yang, Z., Willis, P. and Mueller, R. (2008). Impact of band-ratio enhanced AWIFS image to crop classification accuracy. The Future of Land Imaging…Going Operational, The 17th William T. Pecora Memorial Remote Sensing Symposium, 16-20 November, 2008, Denver, Colorado. URL: http://www.asprs.org/a/publications/proceedings/pecora17/0041.pdf. (Accessed on December 16, 2012).
137. Zhao, B., Yan, Y., Guo, H.Q., He, M.M., Gu, Y.J. and Li, B. (2009). Monitoring rapid vegetation succession in estuarine wetland using time series MODIS-based indicators: An application in the Yangtze River Delta area. Ecological Indicators, Vol. 9(2), pp.346-356.
138. Zhao, M., Heinsch, F.A., Nemani, R.R. and Running, S. (2005). Improvements of the MODIS terrestrial gross and net primary production global data set. Remote Sensing of Environment, Vol. 95, pp.164-176.
139. Zhou, L.M., Kaufmann, R.K., Tian, Y., Myneni, R.B. and Tucker, C.J. (2003). Relation between interannual variations in satellite measures of
140. Zhou, L.M., Tucker, C.J., Kaufmann, R.K., Slayback, D., Shabanov, N.V. and Myneni, R.B. (2001). Variations in northern vegetation activity inferred from satellite data of vegetation index during 1981 to 1999. Journal of Geophysical Research, Vol. 106(D17), pp.20, 069-20,083.
141. Zoran, M. and Stefan, S. (2006). Climatic changes effects on spectral vegetation indices for forested areas analysis from satellite data. Proceedings of
the 2nd Environmental Physics Conference, 18-22 February 2006, Alexandria, Egypt, pp.73-83.
Phenologically-Tuned MODIS NDVI-Based Time Series (2000-2012) for Monitoring of Vegetation and Climate Change in North-Eastern Punjab, Pakistan
northern forest greenness and climate between1982 and 1999. Journal of Geophysical Research,Vol. 108(D1), 16 p.