by george a. isaac -...
TRANSCRIPT

Winter Weather Nowcasting
by
George A. Isaac
Cloud Physics and Severe Weather Research Section, Environment Canada,
Toronto, Ontario, M3H 5T4, Canada
Seminar, Dorval, 23 September 2010

Canadian Airport Nowcasting(CAN-Now)
Acknowledgements
Funds from • Transport Canada • Search and Rescue New Initiatives Fund • NAV CANADA• Environment Canada
People• CAN-Now Team: Monika Bailey, Faisal Boudala, Bill Burrows,
Stewart Cober, Robert Crawford, Norman Donaldson, Marc Fournier, Ismail Gultepe, Laura Huang, Alister Ling, Janti Reid and Laurie Wilson as well as colleagues from CMAC-East, CMAC-West and CMC/RPN.

Science of Nowcasting Olympic Weather for Vancouver 2010 (SNOW-V10)
Acknowledgements
Paul Joe1, Jocelyn Mailhot2, Monika Bailey1, Stephane Bélair2, Faisal Boudala1, Mindy Brugman4, Edwin Campos1, Richard Carpenter3, Stewart Cober1, Bertrand Denis4, Chris Doyle4, D. Forsyth5, Ismail Gultepe1, Thomas Haiden6, Ivan Heckman1, Laura Huang1, Jason Milbrandt2, Ruping Mo4, Roy Rasmussen7, Janti Reid1, Trevor Smith4, Ron Stewart 8, and Donghai Wang9
1 Cloud Physics and Severe Weather Research Section, Environment Canada2 Recherche en prévision numérique, Environment Canada3Weather Decision Technologies, Oklahoma, USA4 Meteorological Service of Canada, Environment Canada5National Severe Storms Laboratory, Norman, Oklahoma, USA6Central Institute for Meteorology and Geodynamics (ZAMG), Austria7 National Center for Atmospheric Research, Colorado, USA8 Department of Environment and Geography, University of Manitoba9Chinese Academy of Meteorological Science, China

Theoretical Limit
NWP Models
Nowcasting
From Golding (1998) Meteorol. Appl., 5, 1-16
The main idea behind Nowcasting is that extrapolation of observations, by simple or sophisticated means, shows better skill than numerical forecast models in the short term. For precipitation, Nowcasting techniques are usually better for 6 hours or more.

ObjectivesCanadian Airport Nowcasting (CAN-Now)
• To improve short term forecasts (0-6 hour) or Nowcastsof airport severe weather.
• Develop a forecast system which will include routinely gathered information (radar, satellite, surface based data, pilot reports), numerical weather prediction model outputs, and a limited suite of specialized sensors placed at the airport.
• Forecast/Nowcast products will be issued with 1-15 min resolution for most variables.
• Test this system, and its associated information delivery system, within an operational airport environment (e.g. Toronto and Vancouver International Airports ).

Variables for Airport System
• Snow and rain events• Freezing precipitation and ice pellets• Frost• Blowing snow• Icing aloft• High winds/gusts• Wind shifts/shear• Turbulence• Lightning• Low ceilings• Low visibility and fog• Convective cells

Main equipment at Pearson at the old Test and Evaluation site near the existing Met compound

8
• 21 instrument bases with power and data feeds.• 10m apart; rows 15m apart
1
4
32
56
78
9
1011
1213
14
1516
1718
1920
21
GTAAanemometer
NAV Canada 78Danemometer
#
MeteorologicalObservation Building1. Present Weather Sensor (Vaisala FD12P)
2. Spare3. Camera# Power distribution box4. Present Weather Sensor (Parsivel)5. 3D Ultrasonic Wind Sensor (removed)6. Microwave Profiling Radiometer (Radiometrics)7. Precipitation Occurrence Sensor (POSS)8. Icing detector (Rosemount)9. Precipitation gauge (Belfort) with Nipher Shield
Ultrasonic snow depth 10. Hotplate (Yankee – removed)11. Tipping Bucket rain gauge TB312. Precipitation Switch13. Spinning arm, liquid/total water content probe --
proposed14. 10 m Tower, 2D ultrasonic wind sensor15. Ceilometer (Vaisala CT25K)16. Vertically Pointing 3 cm Radar (McGill)17. Hotplate Precipitation Meter (Yankee)18. Temp, humidity, pressure, solar radiation19. Precipitation gauge (Geonor) with Nipher Shield20. Spare21. 10m Tower Spare
(Proposed or removed equipment)
Pearson Instrument Site


Web Site
• A Web site has been created at: http://www.canadian-airport-nowcasting.org/
• The data on this site is accessible only with a user name and password. The site is currently active.


Prototype Display Contains
• Bar chart at 10 min resolution for first two hours, then one hour resolution for next 4 h.
• Bar changes colour to attention (yellow) to red (alert) status. Remains green if everything OK. Bars main contain some text (e.g. T, RH, Visibility, Ceiling, Precipitation Type, etc).
• If chart changes colour, you can click and obtain more information as to why. Either graphs or text from forecaster.
• A text message from the forecaster outlining significant features has been included (TAF Plus)
• Besides significant weather variables, the ability to include AAR, Runway Friction, etc, is included
• An area chart showing all the YYZ alternates has been prepared. The airports are colour coded to indicate all OK (green), up to red (below limits).
• Some graphical charts are available, including radar, satellite,lightning, etc.

Thanks to Bill Burrows

Crosswinds:Dry RWY (precipitation rate ≤ 0.2 mm/h and visibility ≥ 1 SM):
x-wind (knots) < 15 : GREEN15 ≤ x-wind (knots) < 20: YELLOW20 ≤ x-wind (knots) < 25: ORANGE
x-wind (knots) ≥ 25 : RED (NOT PERMITTED)Wet RWY (precipitation rate > 0.2 mm/h or visibility < 1 SM):
x-wind (knots) < 5 : GREEN5 ≤ x-wind (knots) < 10: YELLOW
10 ≤ x-wind (knots) < 15: ORANGEx-wind (knots) ≥ 15 : RED (NOT PERMITTED)
--------------------------------------------------------------------------------------Visibility:
vis (SM) ≥ 6 : GREEN (VFR)3 ≤ vis (SM) < 6 : BLUE (MVFR)½ ≤ vis (SM) < 3 : YELLOW (IFR)¼ ≤ vis (SM) < ½ : ORANGE (BLO ALTERNATE)
vis (SM) < ¼ : RED (BLO LANDING)--------------------------------------------------------------------------------------
Thresholds as applied on Situation Chart

Ceiling:ceiling (ft) ≥ 2500: GREEN (VFR)
1000 ≤ ceiling (ft) < 2500 : BLUE (MVFR)400 ≤ ceiling (ft) < 1000: YELLOW (IFR)150 ≤ ceiling (ft) < 400: ORANGE (BLO ALTERNATE)
ceiling (ft) < 150 : RED (BLO LANDING)--------------------------------------------------------------------------------------Shear & Turbulence:momentum flux FQ (Pa) < 0.75 : GREEN (LGT)
0.75 ≤ mom. flux FQ (Pa) < 1.5 : YELLOW (MOD)mom flux FQ (Pa) ≥ 1.5 : RED (SEV)
eddy dissipation rate (m2/3/s) < 0.3 : GREEN (LGT)0.3 ≤ EDR (m2/3/s) < 0.5 : YELLOW (MOD)
EDR (m2/3/s) ≥ 0.5 : RED (SEV)eddy dissipation rate (m2/3/s) < 0.3 : GREEN (LGT)
0.3 ≤ EDR (m2/3/s) < 0.5 : YELLOW (MOD)EDR (m2/3/s) ≥ 0.5 : RED (SEV)
If the windspeed (relative to surface wind direction) exceeds, any of the following:level[2] (~125m/410ft) - level[0] >= 25 ktslevel[4] (~325m/1060ft) - level[0] >= 40 kts : REDlevel[5] (~440m/1440ft) - level[0] >= 50 kts
--------------------------------------------------------------------------------------

Precipitation:rate (mm/h) > 7.5 : RED (HEAVY)
2.5 < rate (mm/h) ≤ 7.5 : ORANGE (MODERATE)0.2 < rate (mm/h) ≤ 2.5 : YELLOW (LIGHT)
0 < rate (mm/h) ≤ 0.2 : GREEN (TRACE)rate (mm/h) = 0 : GREEN (NO PRECIP)
--------------------------------------------------------------------------------------TSTM & LTNG:Lightning Distance ≤ 6 SM RED (TS)Lightning Distance ≤ 10 SM ORANGE (VCTS)Lightning Distance ≤ 30 SM YELLOW (LTNG DIST)Lightning within area (> 30 SM) YELLOWLightning forecast map received GREEN (NO LTNG FCST)--------------------------------------------------------------------------------------ICING:TWC < 0.1 g/m3 or TT ≥ 0°C GREENTWC ≥ 0.1 g/m3 where TT < 0°C YELLOW (POTENTIAL ICING)

CAT-level:RVR (ft) < 600 RED (NOT PERMITTED)
600 ≤ RVR (ft) < 1200 -or- ceiling (ft) < 100 : RED (CAT IIIa)1200 ≤ RVR (ft) < 2600 -or- 100 ≤ ceiling (ft) < 200 : ORANGE (CAT II)2600 ft ≤ RVR < 3 SM -or- 200 ≤ ceiling (ft) < 1000 : YELLOW (CAT I)
3 ≤ RVR (SM) < 6 -or- 1000 ≤ ceiling (ft) < 2500 : BLUE (MVFR)RVR (SM) ≥ 6 -and- ceiling (ft) ≥ 2500 : GREEN (VFR)
--------------------------------------------------------------------------------------RWY Condition:precipitation rate (mm/h) > 0.2 : ORANGE (Possible WET rwy)precipitation rate (mm/h) ≤ 0.2 : YELLOW (Possible DRY rwy)
--------------------------------------------------------------------------------------Wx Only AAR:Cell colour is based on meteorological conditions – same as CAT-levelMeteorologically-limited theoretical maximum AAR determined from look-up table of documented AAR values based on runway configuration and meteorological conditions (CAT-level).
Runway configuration determined solely from crosswind thresholds for maximum potential capacity.

Progress to Develop SmartNowcast Products
• Adaptive Blending Observations and Models (ABOM)
• Automated selection of best model (INTW)
• Graphical TAFs
• Kalman Filter and Nowcasting

Vk+p = Vk + sp∆trend + rp(mk+p – mk)^
Change predictedby obs trend
Change predictedby model
Currentobservation
• The coefficients s and r are obtained by calibrating over the past 8hours using a multivariate regression analysis to give the best fit and errors in the fit
• s and r are expected to be different for each forecast lead time, p
Prediction atlead time p
This method reduces to: • Observation persistence when r = s = 0• Error persistence when s = 0, r = 1• Pure obs trend when r = 0• Blended model-obs for all other r and s
ABOM: Adaptive Blending of Observation and Model Smooth transition between modes depending on recent history

Integrated Weighted Model INTW
• INTW generation
– Check NWP model performance - calculate statistics for past 6 hours
– Assign weight to each NWP model based on model performance
– Adjust weight
– Perform variational and dynamic bias correction
– Generate integrated forecasts by blending forecasts from NWP models with corresponding weights
• The system is reusable for:– different input models– different weather forecasting parameters
• During SNOW V10, 1 km LAM and 15 km REG were selected to generate INTW. For CAN-Now 2.5 km LAM, 15 km REG, and 13 km RUC were used.

Example of Nowcast Products

Error Analysis Done in Real Time

Main Goals of SNOW-V10Related to Nowcasting in Complex Terrain
(Developed at March 08 Workshop)
• To improve our understanding and ability to forecast/nowcast low cloud, and visibility;
• To improve our understanding and ability to forecast precipitation amount and type;
• To improve forecasts of wind speed, gusts and direction;
• To develop better forecast system production system(s).
• Assess and evaluate value to end users;
• To increase the capacity of WMO member states (Training component).

Participating GroupsObserving Systems and Associated Nowcast Systems
EC Region OAN Sites EC Research Sites UBC (McKendry) and U. Manitoba (Stewart) NCAR WSDDM System + (Rasmussen) BOM STEPS System (Seed) NSSL Radar (Forsyth) FMI (Koistinen)Modeling Systems EC Research Models WDT (Carpenter) China (Donghai Wang) Austria INCA (Haiden) Germany (Bott) Switzerland (Mueller)Verification EC Team NCAR (Brown)

The Winter Olympic Challenge
Steep topography, highly variable weather elements in space and time
5 km
Village Creekside

Cypress Mountain

Summary of Instruments• Callaghan scanning C-Band Radar located near Whistler.
• NOAA/OU X-Band Dual- Polarization Radar located at Canada/U.S. Border south of Vancouver.
• Vertically Pointing X-Band Radars were located at TFT, RND and WWA.
• A 915 MHz Boundary Layer Wind Profiler located at Squamish Airport (WSK).
• A profiling microwave radiometer located at Timing Flats (TFT)
• A rawindsonde system located at Nesters (VOC).
• Ceilometers located at YVR, WWA, TFT, WSK, WGP, and VOG,
• Recording visibility meters located at VOA, VOL, RND, VOT, VOG and YVR.
• Hot Plates located at YVR, VOG, RND, VOA, VOL and TFT
• Present weather sensors, either the Vaisala FD12P, Parsivel or POSS located at VOA, VOL, VOD, WWA, WSK, YVR, TFT, VOT, RND, and VOG,
• A 3D anemometer located at the ski jump (VOW).
• Temperature, relative humidity and GPS sensors were installed on the Whistler Village to Roundhouse Gondola, and the Whistler to Blackcomb gondola.
• The Roundhouse site, near the helipad, was instrumented with a significant list of equipment. as an extension of the Fog Remote Sensing and Modeling Project (FRAM) (Gultepe et al., 2009).
• Special surface sites measuring temperature and humidity were installed by UBC up Whistler Mountain
• Snow Density measurements were made at some selected sites, mainly VOA, VOL RND and VOC after significant snowstorms.
• Snow Photographs were made continuously at RND as a special project during some intensive periods and then irregularly outside those periods.
•

Summary Charts for 12 Feb to 21 March 2010Temp—Red; Visibility—Green; Precipitation Blue

Harvey’s Cloud
Equipment on Whistler mountain provided good data for forecasters and help in understanding weather processes
Most of SNOW-V10 data from instruments are now being displayed on Web site (http://www.snow-v10.ca). Model data is also being shown.
Remote Sensors


Model Name Organization Country Spatial Resolution
Temporal Resolution Available
Times of Day Run (UTC)
Length of Forecst(hours)
General Description
ABOMLAM1km Environment Canada Canada 1 Km 15 min Every 15 min Max 6 h
Adaptive Blending of Observation and Models
using GEM LAM1k
ABOMREG Environment Canada Canada 15 km 15 min Every 15 min Max 6 h
Adaptive Blending of Observation and Models
using GEM Regional
INTW Environment Canada Canada 1 and 15
km 15 min Every 15 min Max 6 hINTegrated Weighted
Model using LAM1k, GEM Regional and Observations
LAM1k Environment Canada Canada 1 km
30 s (Model), 15 min
(Tables)11 and 20 UTC 19 h Limited-Area version of
GEM model
LAM2.5k Environment Canada Canada 2.5 km
1 min (Model), 15 min (Tables)
06 and 15 UTC 33 h Limited-Area version of GEM model
REG Environment Canada Canada 15 km
7.5 min (Model), 15 min (Tables)
00, 06, 12, 18 UTC 48 h
Regional version of GEM (Global Environmental
Multiscale) model
Canadian Models Used in SNOW-V10
Model Name Organization Country Spatial Resolution
Temporal Resolution Available
Times of Day Run (UTC)
Length of Forecst (hours) General Description
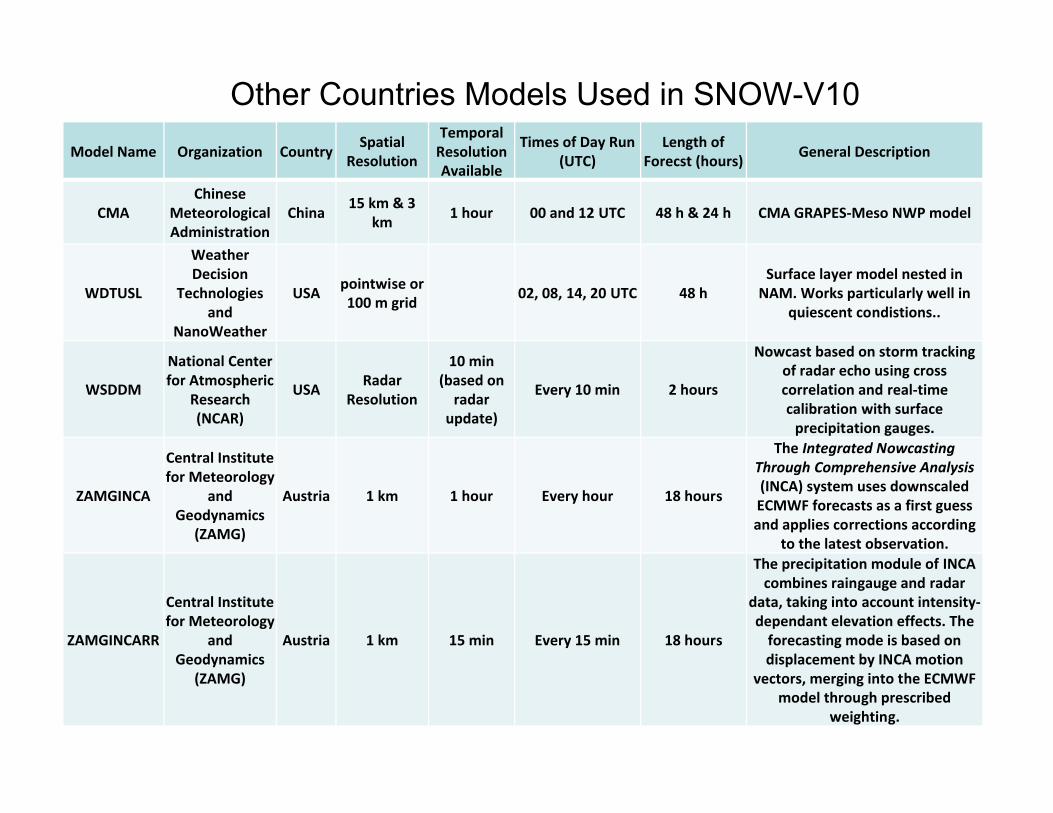
CMAChinese
Meteorological Administration
China 15 km & 3 km 1 hour 00 and 12 UTC 48 h & 24 h CMA GRAPES-Meso NWP model
WDTUSL
Weather Decision
Technologies and
NanoWeather
USA pointwise or 100 m grid 02, 08, 14, 20 UTC 48 h
Surface layer model nested in NAM. Works particularly well in
quiescent condistions..
WSDDM
National Center for Atmospheric
Research (NCAR)
USA Radar Resolution
10 min (based on
radar update)
Every 10 min 2 hours
Nowcast based on storm tracking of radar echo using cross correlation and real-time calibration with surface
precipitation gauges.
ZAMGINCA
Central Institute for Meteorology
and Geodynamics
(ZAMG)
Austria 1 km 1 hour Every hour 18 hours
The Integrated NowcastingThrough Comprehensive Analysis(INCA) system uses downscaled ECMWF forecasts as a first guess and applies corrections according
to the latest observation.
ZAMGINCARR
Central Institute for Meteorology
and Geodynamics
(ZAMG)
Austria 1 km 15 min Every 15 min 18 hours
The precipitation module of INCA combines raingauge and radar
data, taking into account intensity-dependant elevation effects. The
forecasting mode is based on displacement by INCA motion
vectors, merging into the ECMWF model through prescribed
weighting.
Other Countries Models Used in SNOW-V10

Weather Decision Technologies (WDT) Products for Vancouver 2010

INCA (Integrated Nowcasting through ComprehensiveAnalysis) developed at the Austrian national weather service
Products were available in real time for forecaster use and evaluation

Roy Rasmussen et al (NCAR)Weather Support to Deicing Decision Making (WSDDM)
2 km

GEM LAM for points along Sea to Sky Highway showing flow reversal with day time heating. Note 23 Z is 15 Local Time.


Freestyle Skiing Ladies Aerials FinalFebruary 24, 2010
Notes by Mindy Brugman as posted on SNOW-V10 Blog
The event….Last night at the Cypress aerial site it began with drizzle and was quite foggy… We walked to the bright lights of the venue. There was no precipitation at the venue the entire competition. The competition started at 1930 PST. The first pictures (not shown here) are taken at the start of the competition and you can see that the fog was much worse at the start. I stopped taking pictures since I could not see anything. Then it began to clear just near the end of the competiton – and I clicked a few pictures. You can detect a flying bug above the lights. Thatsreally the gold medal winner, Lydia Lassila, of Australia!Based on the event last night – I suspect ladies aerials may qualify as a new paralympic sport for the visually impaired.

Snowboard Men’s Parallel Giant Slalom FinalFebruary 27, 2010
Gold Medal to Jassey Jay Anderson of Canada
Snowboard spectators stand in the fog during the men's Parallel Giant Slalom snowboarding competition at the Vancouver 2010 Olympics in Vancouver, British Columbia, Saturday, Feb. 27, 2010. (AP Photo/BelaSzandelszky)

Products During Olympics• Each group produced a Table showing 24 hour
forecast of significant variables for main venue sites (hourly intervals and 10 to 15 min intervals in first two hours). Similar to what forecasters produce
• A Research Support Desk was run during Olympics and Paralympics (virtual and on-site) providing real time support to forecasters.
• A SNOW-V10 Web site was created with many of the products (time series for sites, remote sensing products, area displays, soundings (gondola and others), and a very successful Blog.

VerificationData Details: Model Points
• Closest model points to the airports are selected
• Verification data set uses data from the most current model run with the exception of GEM Regional where a 3 hour spin up time is removed
• Note that the selected CYVR RUC point falls under the model water mask
Model Run Times Model Resolution Location
Horizontal Temporal CYYZ CYVR
Actual Location
- - - 43.68, -79.63
49.19, -123.19
GEM Regional
0,6,12,18 Z 15 km 7.5 min 43.65,-79.68
49.22,-123.16
GEM LAM East
12 Z 2.5 km 5 min 43.67,-79.63
-
GEM LAM Olympic
9,21 Z up to Dec 9
6,15Z afterwards
2.5 km 1 min - 49.18,
-123.19
GEM LAM Olympic 1K
11,23 Z up to Dec 9
11,20 Z afterwards
1 km 30 sec - 49.18,-123.17
RUC Every hour 13 km 1 hour 43.66,-79.70
49.19, -123.21

Data Details: VariablesVariable Instrument Model Variable Name
CYYZ CYVR REG LAM EAST LAM OLY LAM 1K RUC
Temperature (2m) Campbell HMP45C21
2
Campbell HMP45C21
2
TJ TJ TJ TJ TMP @ 2m
Relative Humidity (2m)
Campbell HMP45C21
2
Campbell HMP45C21
2
HR HR HR HR RH @ 2m
Wind Speed (10m) Ultrasonic WS425
78D UU/VV UU/VV UU/VV UU/VV UGRD/VGRD @ 10m
Wind Direction (10m) Ultrasonic WS425
78D UU/VV UU/VV UU/VV UU/VV UGRD/VGRD @ 10m
Maximum Wind Speed (Gust) (10m)
Ultrasonic WS425
78D FB calc FB calc FB calc WGE GUST @ sfc
Cross-Wind (10m) Ultrasonic WS425 *
78D * Calc * Calc * Calc * Calc * Calc *
Visibility FD12P FD12P FB calc FB calc VIS VIS VIS @ sfc
Ceiling CT25K CL31 NU N/A H_CB H_CB DIST 0-CBL
Precipitation Rate FD12P FD12P RC+RR RC+RR RC+RR RT PRATE @ sfc
Precipitation Type FD12P FD12P Bourgouincalc
Bourgouincalc
Bourgouincalc
Bourgouincalc
-* Cross-winds specific to each runway configuration are calculated using wind information
(speed, direction, max wind) from the designated wind sensor or model output
* Cross-winds specific to each runway configuration are calculated using wind information (speed, direction, max wind) from the designated wind sensor or model output

Data Details: Data Reduction• Period covered is December 1, 2009 to March 31, 2010• Model and instrument data are reduced to 10 min time intervals by:
– Using the last instantaneous value for all REG variables– Linearly interpolating RUC data to 10 min (although hourly RUC data are
compared in this work)– For LAMs and instrument data:
• Using the average during last 10 min for temp, RH, wind speed, max wind, cross-winds
• Using the minimum value during last 10 min for visibility and ceiling • Using the maximum value during last 10 min for precip rate• Using the most frequently occurring precip type in the last 10 min
• Only the RUC 6h forecast is compared in this work • Observational persistence data are generated using 10 min reduced
instrument data• Climate data are generated using 30 years (1980-2009) of hourly
observations at CYYZ and CYVR. One “climate” value was produced per hour using 30 points by:
– Using the average value for temp, RH, wind speed– Using the median value for wind direction, ceiling, visibility

Continuous Variable Error Analysis• Basic mean absolute (MAE) and mean (ME) errors are tabulated for a
subset of variables• Errors include all forecast lead times and times of day• Provides a very average picture; model performance during significant
events are washed out with long periods of uninteresting weather
Variable
CYYZ MAE CYYZ ME
REG LAM RUC CLI REG LAM RUC CLI
Temperature 1.7 2.3 1.9 3.9 deg C -1.2 -1.4 -1.5 -1.2
Relative Humidity 10.5 9.0 12.3 11.0 % 8.6 4.9 11.8 4.5
Wind Speed 1.6 1.2 1.4 1.8 m/s -1.4 -0.2 -0.7 -0.4
Wind Direction 19.4 20.6 23.7 75.4 deg 5.6 5.1 3.1 -29.6
Max Wind Speed 2.3 2.4 1.7 N/A m/s 1.4 1.7 -0.2 N/A
Cross-Wind Rwy 1 2.8 2.9 2.4 N/A m/s 0.0 0.1 -0.6 N/A
Cross-Wind Rwy 2 2.8 2.9 2.4 N/A m/s 0.0 0.1 -0.6 N/A
Cross-Wind Rwy 3 2.6 2.7 2.3 N/A m/s 0.2 0.5 -1.0 N/A
Toronto Pearson Airport CYYZ

Continuous Variables - cont’d
Variable
CYVR MAE CYVR ME
REG LAM RUC CLI LAM1K REG LAM RUC CLI LAM1K
Temperature 1.4 1.1 1.7 2.7 1.4 deg C -1.2 -0.5 0.8 -1.0 -1.0
Relative Humidity 8.0 7.7 10.5 9.2 7.1 % 2.7 -1.9 -4.3 -1.4 1.1
Wind Speed 1.4 1.4 2.6 1.7 1.3 m/s -0.8 0.3 1.9 -0.2 -0.3
Wind Direction 40.8 42.4 48.4 55.5 42.6 deg -8.1 1.9 16.5 8.3 -0.5
Max Wind Speed 2.0 2.8 3.1 N/A 1.9 m/s 0.4 1.8 2.1 N/A -1.4
Cross-Wind Rwy 1 1.8 1.9 1.9 N/A 1.8 m/s 0.6 0.9 0.9 N/A 0.9
Cross-Wind Rwy 2 2.0 2.4 2.7 N/A 2.3 m/s 0.9 1.4 1.3 N/A 1.2
Vancouver International Airport CYVR
• RUC6h wind directions and cross-winds at CYVR have been corrected (Aug 26, 2010)
• Wind direction errors using the Climate data set are large and somewhat misleading (discussed later)

Jan Feb Mar Apr0
5
10
15
20
Month
Win
d S
peed
[m/s
]
CYYZ: Wind Speed December 1 2009 - April 1 2010
Wind Speed (WS425)LAMREG
Time history of wind speeds at CYYZ during the period of winter assessment
REG underestimates wind speed

Continuous Variables: Time of Day
• MAE and ME can also be calculated at different times of the day (TOD)
• It can expose diurnal trends and differences relating to model spin up
• Only ~120 values (1 per day for 4 months) go into the mean error calculations
• Errors can be compared with observational persistence curves at specific times of the day (3, 9, 15, 21 Z presented here)

Time of Day: TemperatureContinuous Variable Error Analysis for Temperature at CYYZ:
December 1, 2009 - March 31, 2010
0
0.5
1
1.5
2
2.5
3
3.5
4
4.5
5
00 03 06 09 12 15 18 21 00
Time of Day [UTC]
MA
E [
deg
C]
REG
LAM
RUC6h
PERSISTENCE
CLIMATE AVG
Continuous Variable Error Analysis for Temperature at CYVR:December 1, 2009 - March 31, 2010
0
0.5
1
1.5
2
2.5
3
3.5
4
00 03 06 09 12 15 18 21 00
Time of Day [UTC]
MA
E [
deg
C]
REG
LAM
LAM1K
RUC6h
PERSISTENCE
CLIMATE AVG

Time of Day: Relative HumidityContinuous Variable Error Analysis for Relative Humidity at CYYZ:
December 1, 2009 - March 31, 2010
0
2
4
6
8
10
12
14
16
18
20
00 03 06 09 12 15 18 21 00
Time of Day [UTC]
MA
E [
%]
REG
LAM
RUC6h
PERSISTENCE
CLIMATE AVG
Continuous Variable Error Analysis for Relative Humidity at CYVR:December 1, 2009 - March 31, 2010
0
2
4
6
8
10
12
14
16
00 03 06 09 12 15 18 21 00
Time of Day [UTC]
MA
E [
%]
REG
LAM
LAM1K
RUC6h
PERSISTENCE
CLIMATE AVG

Time of Day: Wind DirectionContinuous Variable Error Analysis for Wind Direction at CYYZ:
December 1, 2009 - March 31, 2010
0
10
20
30
40
50
60
70
80
90
00 03 06 09 12 15 18 21 00
Time of Day [UTC]
MA
E [
de
g]
REG
LAM
RUC6h
PERSISTENCE
CLIMATE MED
Continuous Variable Error Analysis for Wind Direction at CYVR:December 1, 2009 - March 31, 2010
0
10
20
30
40
50
60
70
80
90
00 03 06 09 12 15 18 21 00
Time of Day [UTC]
MA
E [
de
g]
REG
LAM
LAM1K
RUC6h
PERSISTENCE
CLIMATE MED

Time of Day: Wind GustContinuous Variable Error Analysis for MaxWind Speed (Gust) at CYYZ:
December 1, 2009 - March 31, 2010
0
0.5
1
1.5
2
2.5
3
3.5
4
00 03 06 09 12 15 18 21 00
Time of Day [UTC]
MA
E [
m/s
]
REG
LAM
RUC6h
PERSISTENCE
Continuous Variable Error Analysis for Max Wind Speed (Gust) at CYVR:December 1, 2009 - March 31, 2010
0
0.5
1
1.5
2
2.5
3
3.5
4
00 03 06 09 12 15 18 21 00
Time of Day [UTC]
MA
E [
m/s
]
REG
LAM
LAM1K WGE
RUC6h
PERSISTENCE

Categorical Error AnalysisVariable Category
1Category
2Category
3Category
4Category
5Category
6Category 7 Category
8
Winds < 5 kts 5 ≤ w < 10 kts
10 ≤ w < 15 kts
15 ≤ w < 20 kts
20 ≤ w < 25 kts
w ≥ 25 kts
- -
Wind Direction
d ≥ 339 & d <
24º (N)
24 ≤ d < 69º (NE)
69 ≤ d < 114º (E)
114 ≤ d < 159º (SE)
159 ≤ d < 204º
(S)
204 ≤ d < 249º(SW)
249 ≤ d < 294º (W)
294 ≤ d < 339º(NW)
Visibility v < 1/4 SM
1/4 ≤ v < 1/2 SM
1/2 ≤ v < 3 SM
3 ≤ v < 6 SM
v ≥ 6 SM
- - -
Ceiling c < 150 ft
150 ≤ c< 400 ft
400 ≤ c< 1000 ft
1000 ≤ c< 2500 ft
2500 ≤c<
10000 ft
c ≥ 10000 ft
- -
PrecipRate
r = 0 mm/hr (None)
0 < r ≤0.2
mm/hr (Trace)
0.2 < r ≤2.5
mm/hr (Light)
2.5 < r ≤7.5 mm/hr (Moderate)
r > 7.5 mm/hr (Heavy)
- - -
PrecipType
No Precip
Liquid Freezing
Frozen Mixed (w/Liqui
d)
Unknown - -

End User RequirementsThreshold Matrix for Downhill, Slalom and
Giant Slalom (from Chis Doyle)New Snow (24 hours)
Wind Visibility Rain
Critical Decision point
> 30 cm Constant above 17 m/sor gusts > 17 m/s
< 200 m on the entire course.Lower Thresholds for GS…course dependant but ~ 100m for GS
15mm in 6 hours or less
Significant decision point
15 cm and < 30 cm
>10 cm and < 30 cm Paralympics)
Constant 11 m/s to 17 m/s <
200 m on portions of the course
Mixed precipitation
Factor to consider
> 5 cm
> 2 cm within 6h of an event
Gusts above 14 m/s but < 17 m/s>
>200m but <500m on whole or part of the course

Heidke Skill Score: Multi-Categories
1 2 3 . . . . . K total
1 N(F1)
2 N(F2)
3 N(F3)
. . . .
K N(Fk)
total N(O1) N(O2) N(O3) N(Ok) N
Observed category
ForecastCategory
j
iUsing:
Calculate:

Multi-Categorical Error Analysis for Ceiling at CYYZDecember 1, 2009 - March 31, 2010
0.0
0.1
0.2
0.3
0.4
0.5
0.6
0.7
0.8
0.9
1.0
00 03 06 09 12 15 18 21 00
Time of day [UTC hour]
HS
S
REG
RUC6h
PERSISTENCE
CLIMATE Med
Categorical TOD: Ceiling & Visibility
Multi-Categorical Error Analysis for Ceiling at CYVRDecember 1, 2009 - March 31, 2010
-0.2
0.0
0.2
0.4
0.6
0.8
1.0
00 03 06 09 12 15 18 21 00
Time of day [UTC hour]
HS
S
REG NU
LAM
LAM1K
RUC6h
PERSISTENCE
CLIMATE MED
Multi-Categorical Error Analysis for Visibility at CYYZDecember 1, 2009 - March 31, 2010
0.0
0.1
0.2
0.3
0.4
0.5
0.6
0.7
0.8
0.9
1.0
00 03 06 09 12 15 18 21 00
Time of day [UTC hour]
HS
S
REG FB
LAM FB
RUC6h
PERSISTENCE
CLIMATE Med
Multi-Categorical Error Analysis for Visibility at CYVRDecember 1, 2009 - March 31, 2010
-0.2
0.0
0.2
0.4
0.6
0.8
1.0
00 03 06 09 12 15 18 21 00
Time of day [UTC hour]
HS
S
REG FB
LAM FB
LAM
LAM1K
RUC6h
PERSISTENCE
CLIMATE MED

Categorical TOD: Precip Rate & TypeMulti-Categorical Error Analysis for Precip Rate at CYVR
December 1, 2009 - March 31, 2010
0.0
0.1
0.2
0.3
0.4
0.5
0.6
0.7
0.8
0.9
1.0
00 03 06 09 12 15 18 21 00
Time of day [UTC hour]
HS
S
REG
LAM
LAM1K
RUC6h
PERSISTENCE
Multi-Categorical Error Analysis for Precip Type at CYVRDecember 1, 2009 - March 31, 2010
0.0
0.1
0.2
0.3
0.4
0.5
0.6
0.7
0.8
0.9
1.0
00 03 06 09 12 15 18 21 00
Time of day [UTC hour]
HS
S
REG
LAM
LAM1K
PERSISTENCE
Multi-Categorical Error Analysis for Precip Rate at CYYZDecember 1, 2009 - March 31, 2010
0.0
0.1
0.2
0.3
0.4
0.5
0.6
0.7
0.8
0.9
1.0
00 03 06 09 12 15 18 21 00
Time of day [UTC hour]
HS
S
REG
LAM
RUC6h
PERSISTENCE
Multi-Categorical Error Analysis for Precip Type at CYYZDecember 1, 2009 - March 31, 2010
0.0
0.1
0.2
0.3
0.4
0.5
0.6
0.7
0.8
0.9
1.0
00 03 06 09 12 15 18 21 00
Time of day [UTC hour]
HS
S
REG
LAM
PERSISTENCE

Cloud Base (ft)
< 150 150-<400
400-<1000
1000-<2500
2500-<10000
≥ 10000
< 150 0 15 1 0 4 15
150-<400
10 185 91 20 19 15
400-<1000
6 86 330 236 159 56
1000-<2500
0 35 256 1429 734 115
2500-<10000
12 4 128 727 5249 976
≥ 10000 7 15 56 160 938 4994
2 hour Persistence, Ceiling, YVRO
bse
rvat
ion

Cloud Base (ft)
< 150 150-<400
400-<1000
1000-<2500
2500-<10000
≥ 10000
< 150 0 0 9 1 3 22
150-<400
17 0 169 39 3 112
400-<1000
138 0 508 130 50 36
1000-<2500
102 0 769 935 602 164
2500-<10000
147 0 1314 917 4228 514
≥ 10000 28 0 652 152 1146 4209
Ob
serv
atio
nGEM REG Model All Times of Day Combined, YVR

Visibility (BI)< ¼SM
¼ ≤ v < ½ SM
½ ≤ v <3 SM
3≤ v < 6 SM
V ≥ 6 SM
< ¼ SM 3/5 6/19 25/34 20/17 45/24
¼ ≤ v < ½ SM 0/2 4/14 20/19 7/5 12/3
½ ≤ v <3 SM 20/66 50/94 370/492 326/357 631/388
3≤ v < 6 SM 7/42 29/61 266/393 270/363 1225/948
V ≥ 6 SM 0/11 12/12 335/680 849/1291 12880/12082
Ob
serv
atio
nGEM LAM Model All Times of Day Combined, YYZ
Analysis redone by looking for the minimum model value in +/- 60 minutes of the observed time. HSS score does not improve.

Comparison by Location – RH6 hour forcast for INTW and OBSP
MAE from all sites - Relative Humidity
Site Altitude LAM REG INTW OBSP
Vancouver (YVR) 2 6.81 8.14 5.30 5.73
Whistler Creekside (VOB) 933 8.63 11.70 5.15 5.33
Timing Flats (VOT) 805 36.24 33.96 8.02 5.95
Whistler Mt. Mid Lvl. (VOL) 1320 8.39 14.43 5.96 4.40
West Vancouver (WWA) 168 10.33 11.14 7.14 6.87
Squamish Airport (WSK) 52.1 11.34 9.88 6.16 6.98
Cypress Bowl North (VOE) 953 6.45 8.89 4.87 4.94
Callaghan (VOX) 860 11.53 8.37 6.17 6.96
Callaghan Ski Jump (VOW) 936 9.50 12.04 5.61 5.41
Callaghan Valley (VOD) 884 12.47 8.43 6.94 7.62
Nesters (VOC) 651.5 9.82 7.65 6.16 7.25
Blackcomb (VOI) 937 8.57 10.34 5.49 6.61
Cypress Bowl (VOG) 885.5 7.47 9.85 5.50 6.20
Whistler (VOA) 1640 15.98 10.63 6.72 7.81

MAE by Forecast Lead Time - RH

Comparison by Location – WINDSPD6 hour forcast for INTW and OBSP
MAE from all sites - Wind Speed
Site Altitude LAM REG INTW OBSP
Vancouver (YVR) 2 1.40 1.76 1.27 1.41
Whistler Creek Side (VOB) 933 0.81 0.56 0.34 0.33
Timing Flats (VOT) 805 0.95 0.54 0.40 0.40
Whistler Mt. Mid Lvl. (VOL) 1320 0.72 0.71 0.60 0.62
West Vancouver (WWA) 168 0.69 0.83 0.62 0.67
Squamish Airport (WSK) 52.1 0.83 0.76 0.61 0.68
Cypress Bowl North (VOE) 953 0.81 0.64 0.50 0.52
Callaghan SJ Bottom (VOX) 860 1.02 0.75 0.38 0.39
Callaghan Ski Jump (VOW) 936 0.80 0.59 0.44 0.46
Callaghan Valley (VOD) 884 0.77 0.54 0.43 0.47
Nesters (VOC) 651.5 0.91 0.63 0.45 0.48
Blackcomb (VOI) 937 0.61 0.47 0.44 0.45
Cypress Bowl (VOG) 885.5 0.85 0.77 0.69 0.72

MAE by Forecast Lead Time -WINDSPD

HSS Score for INTW, OBS, GEM REG, GEM LAM and RUC using Multi-Categories for Wind Gust and Precipitation at YYZ

Model Issues
• Model minimum temperatures for cloud free nights are too cold. (Impacts frost forecasts, Precip type)
• RH predictions are poor, barely beating climatology. (Impacts visibility forecasts)
• Visibility forecasts are poor from statistical point of view. (also require snow and rain rates)
• Cloud base forecasts, although showing some skill, could easily be improved with better model resolution in boundary layer.
• Model graupel not observed and not well defined.• Model has a bias against high wind speeds.• Extreme wind shear events missed.• Overall statistical scores do not show complete
story. Need emphasis on high impact events.

Summary
• CAN-Now and SNOW-V10 have made progress in forecasting “non traditional” variables like ceiling, visibility (RVR), wind gusts, etc.
• The CAN-Now system is beginning to gain acceptance.
• Nowcast schemes like INTW are showing skill.
• There is value in presenting real-time obs and several models to forecasters doing Nowcasting.
• High resolution measurements are necessary for developing improved nowcast schemes and for verification of mesoscale model output.
• The models are not yet good enough to issue standalone nowcasts. Significant errors exist of high impact events that require forecaster intervention.

Images at noon at Top of Men’s Downhill. Nov 1/09 -April 20/10