by joyce a. ober - usgs mineral resources program · pdf fileby joyce a. ober domestic survey...
TRANSCRIPT

SULFUR—2001 75.1
SULFURBy Joyce A. Ober
Domestic survey data and tables were prepared by Maria Arguelles, statistical assistant, and the world production tablewas prepared by Glenn J. Wallace, international data coordinator.
After nearly a century of world dominance in the productionof sulfur in all forms, the United States was edged out byCanada as the world’s largest sulfur producer in 2001. Bothcountries, however, had virtually the same production with onlyabout 1% separating the two. Worldwide, production of nativesulfur and pyrites continued to decline as environmentalregulations forced increased sulfur recovery to limitatmospheric emissions of sulfur dioxide. Growth in sulfurrecovery continued to outpace sulfur demand, which resulted inincreased stocks worldwide.
Through its major derivative, sulfuric acid, sulfur ranks asone of the most important elements used as an industrial rawmaterial and is of prime importance to every sector of theworld’s industrial and fertilizer complexes. Sulfuric acidproduction is the major end use for sulfur, and consumption ofsulfuric acid has been regarded as one of the best indices of anation’s industrial development. More sulfuric acid is producedin the United States every year than any other chemical; 40.1million metric tons (Mt), which is equivalent to about 13.1 Mtof elemental sulfur, was produced in 2001; this was slightlymore than that of 2000 (U.S. Census Bureau, 2002a).
In 2001, domestic production of sulfur in all forms was 10%lower than that of 2000; shipments, consumption, imports, andprices decreased (table 1; fig. 1, 2). The United Statesmaintained its position as the leading world consumer of sulfurand sulfuric acid. The quantity of sulfur recovered during therefining of petroleum continued the upward trend established in1939 by increasing slightly. Sulfur recovered during natural gasprocessing decreased by 11%. For the first time since thebeginning of the 20th century, no sulfur was produced in theUnited States by using the Frasch process because the lastdomestic mine closed in 2000. Shipments were slightly lowerthan production, thus causing stocks to increase by 12%.
Byproduct sulfuric acid from the Nation’s nonferroussmelters and roasters produced as a result of laws restrictingsulfur dioxide emissions supplied a significant quantity ofsulfuric acid to the domestic merchant (commercial) acidmarket. Production from this sector decreased by 4% becausethe three copper smelters that closed in 1999 did not reopen andproduction was down at lead and molybdenum operations.
Estimated world sulfur production was slightly lower in 2001than in 2000 (table 1). Frasch production was lower becausesulfur mines in Poland and the United States closed. Recoveredelemental sulfur is produced primarily during the processing ofnatural gas and crude petroleum. At least 95% of the world’selemental sulfur production came from recovered sources; thiswas slightly higher than that of 2000. Some sources ofbyproduct sulfur are unspecified, which means that the materialcould be elemental or byproduct sulfuric acid. The quantity ofsulfur supplied from recovered sources was dependent on the
world demand for fuels, nonferrous metals, and petroleumproducts, not for sulfur.
World sulfur consumption remained about the same; about50% was used in fertilizer production, and the remainder, in amyriad of other industrial uses. World trade of elemental sulfurincreased by 8% from the levels recorded in 2001. Worldwideinventories of elemental sulfur were higher.
Legislation and Government Programs
Early in 2000, the U.S. Environmental Protection Agency(EPA) issued the final rule for reduced sulfur content ofgasoline, as part of tier 2 of the 1990 Clean Air ActAmendments. The standards were nationwide standards withthe implementation time extended for some States and for somerefining facilities. By 2006, the sulfur content in gasoline mustaverage 30 parts per million (ppm) with an upper limit of 80ppm. States in the Rocky Mountain region and Alaska weregiven until 2007 to reach standards because those Statesgenerally had better air quality than other States. Smallrefineries with fewer than 1,500 employees or less than 155,000barrels per day (bbl/d) of processing capacity were not requiredto meet interim goals until 2008 when the national limits are tobe imposed. The 2008 deadline could be delayed until 2010 ifthe refiners could demonstrate a severe economic hardship. Small refineries received special consideration because theinstallation of new equipment in small facilities could beeconomically damaging (Oil & Gas Journal, 2000b).
Three small U.S. refineries have petitioned the EPA to delayimplementing sulfur gasoline limits. These small operations inKansas, Pennsylvania, and Wyoming say they cannot afford tomeet the stricter limitations. A refinery in Illinois closed inJanuary rather than incur the costs of upgrading to meet newspecifications, and the owner was trying to divest itself of threeother refineries. Another Kansas company was seeking a buyerfor its refinery rather than incur the costs of an upgrade(Sulphur, 2001w).
In December 2000, new sulfur standards for diesel fuelreduced the allowable content to 15 ppm from 500 ppm; thiswas a 97% decrease. The EPA reduced diesel sulfur levels in afirst step to clean up emissions from heavy-duty trucks andbuses. In addition to reducing sulfur dioxide emissions fromdiesel engines, changes were made because the new emissioncontrol apparatus needed to reduce particulate emissions fromthese vehicles could not operate effectively unless sulfur levelsin the fuel were significantly reduced. The agency estimated thecost of diesel regulations to be 4 to 5 cents per gallon (Oil &Gas Journal, 2001b).
The petroleum refining industry was concerned, however, thatthe cost of compliance might be significantly higher than the
U.S. GEOLOGICAL SURVEY MINERALS YEARBOOK—200175.2
EPA estimate—in the range of 15 to 50 cents per gallon. Coststhat high could make it economically unfeasible for somefacilities to install the necessary apparatus, thus forcing closureof refining capacity and perhaps causing shortages in supply(Chemical Market Reporter, 2001). Low-sulfur diesel presentedmore technological challenges than low-sulfur gasoline andrequired more substantial investments for high-pressurehydrotreating facilities; the sulfur compounds found in dieselare more difficult to remove than those found in gasoline(Moyse, 2000). Refineries had several options for reducingsulfur levels to meet new regulations. The least expensivechoice was using advanced catalysts in desulfurization units(Garritsen and others, 2000). Other treatment options includedselective absorption, ammonia conversion, biodesulfurization,catalytic distillation, and solvent extraction.
Concerns remained about how the regulations addressed theissues of timing and transportation. The required timeframe forimplementing the new diesel regulations was approximately thesame as that for gasoline. Questions were raised as to whetherthe refining industry would be able to make the requiredupgrades to diesel and gasoline facilities simultaneously withoutcompromising the availability of either product. In addition,most diesel fuel is transported via pipelines that also transporthome heating oil for which no new sulfur requirements wereenacted. Industry officials believed that preventing dieselproduct contamination from the pipelines that also carried thehigher sulfur heating oil would be difficult (Hess, 2000).
The EPA was working on new emission standards for largeocean-going vessels that were expected to go into effect by theend of 2002. Ships sailing close to shore in places like the Gulfof Mexico and the English Channel are contributing to onshorepollution. Traditionally, the Maritime Pollution Convention(Marpol) sets standards for shipping emissions and theallowable sulfur content of marine fuels, but the EPA intendedto impose standards for ships in U.S. waters if Marpol did notact (Sulphur, 2001h).
Production
Elemental Sulfur.—Production statistics were collected on amonthly basis and published in the U.S. Geological Survey(USGS) monthly sulfur Mineral Industry Surveys. Of the 115operations to which survey requests were sent, all responded;this represented 100% of the total production shown in table 1. In 2001, production was 11% lower than that of 2000. Shipments decreased by 13%, but the value of shipmentsdecreased by an astounding 65% owing to a tremendousdecrease in the average unit value of elemental sulfur and thedecreased tonnage. Trends in sulfur production are shown infigure 2.
Frasch.—Native sulfur associated with the caprock of saltdomes and in sedimentary deposits was mined by the Fraschhot-water method in which the native sulfur was meltedunderground with super-heated water and brought to the surfaceby compressed air. Freeport-McMoRan Sulphur Inc. (asubsidiary of McMoRan Exploration Co.) was the lastremaining Frasch producer in the United States. When it closedthe last Frasch mine, Main Pass, in 2000, it cited low sulfurprices and increased operating expenses for the early closure,
especially the high price of natural gas that was used to heat thewater to melt the sulfur (Fertilizer Markets, 2000b).
Main Pass was a mine operated on a salt dome sulfur depositin the Gulf of Mexico, about 51 kilometers (km) (32 miles)from the coast of Louisiana. The Main Pass offshore complex,which was more than 1.6 km (1 mile) long and was the largeststructure in the Gulf, had a production capacity of more than5,500 metric tons per day (t/d) (McMoRan Exploration Co.,2000, p. 11-12). Production began in 1991 at a developmentcost of $880 million (Chemical & Engineering News, 2000).
When Freeport announced plans to close its mine, it proposedto concentrate on its sulfur transportation and marketingbusiness and to continue meeting its supply contracts throughpurchases of recovered sulfur. To this end, Freeport sold its idlesulfur property in Pecos County, TX, which included the minesite, a powerplant, and surrounding real estate, for $3.2 millionlate in 2000 (Fertilizer Markets, 2001a). In 2001, the companysold its sulfur and salt lease at Main Pass to Trinity StorageServices, L.P., but retained the right to produce sulfur and oil atthat location. Both companies will be responsible forabandonment and reclamation costs (Fertilizer Markets, 2001b).
The company offered the sulfur logistics business for sale, forabout $80 million (Fertilizer Markets, 2001a). In addition to themine, Freeport’s operations included facilities for forming,loading, remelting, and transporting sulfur in Galveston, TX,Port Sulphur, LA, and Tampa, FL, and commercial contractsassociated with the sulfur-handling business. After extendednegotiations and considerations, the company sold these assetsto Gulf Sulphur Services Ltd., LLP (a joint venture betweenIMC Global Inc. and Savage Industries Inc.) in 2002. Theventure will be operated by Savage Industries (McMoRanExploration Co., 2002).
Recovered.—Recovered elemental sulfur, which is anondiscretionary byproduct from petroleum refining, natural gasprocessing, and coking plants, was produced primarily tocomply with environmental regulations that were applicabledirectly to emissions from the processing facility or indirectlyby restricting the sulfur content of the fuels sold or used by thefacility. Recovered sulfur was produced by 44 companies at114 plants in 26 States and 1 plant in the U.S. Virgin Islands. Most of these plants were small with only 30 reportingproduction that exceeded 100,000 metric tons per year (t/yr). By source, 78% of recovered elemental sulfur production camefrom petroleum refineries or satellite plants that treated refinerygases and coking plants, and the remainder was produced atnatural gas treatment plants. Mergers and acquisitionscontributed to the expanding dominance of large companies inthe industry. The largest recovered sulfur producers, all withmore than 500,000 metric tons (t) of sulfur production, indescending order of production, were Exxon Mobil Corp.,ChevronTexaco Corp., BP p.l.c., Valero Energy Corp., PhillipsPetroleum Co., and Motiva Enterprises LLC. The 49 plantsowned by these companies accounted for 65% of recoveredsulfur output during the year. Recovered sulfur production byState and region is listed in tables 2 and 3.
Of the 15 largest refineries in the world, 5 were in the UnitedStates. In descending order of refining capacity, they wereHovensa LLC’s St. Croix, U.S. Virgin Islands, refinery;ExxonMobil’s Baytown, TX, and Baton Rouge, LA, refineries;
SULFUR—2001 75.3
and BP’s Texas City, TX, and Whiting, IN, refineries, all weresignificant sulfur producing facilities (Chang, 2000). Refiningcapacity does not necessarily mean that these refineries were thelargest producers of refinery sulfur. Sulfur production dependson installed sulfur recovery capacity as well as the types ofcrude that are refined at the specific refineries. Large refineriesthat process low-sulfur crudes may have relatively low sulfurproduction.
In recent years, consolidation in the petroleum industry hasreduced the number of companies operating sulfur recoveryoperations, although the number of sulfur plants has remainedabout the same. In 1998, Amoco Co. and British PetroleumCo., p.l.c., merged to form BP Amoco p.l.c. (BP Amoco p.l.c.,1999). In 1999, the U.S. Federal Trade Commission (FTC)approved the merger of Exxon Corp. and Mobil Corp. to formExxon Mobil Corp. (Chang, 1999). In 2000, the merger of BPAmoco p.l.c. with Atlantic Richfield Co. (ARCO) to form BPAmoco ARCO p.l.c. was approved, and the company name wassimplified to BP p.l.c. (Oil & Gas Journal, 2000a).
More mergers were completed and proposed in 2001. TheFTC approved the merger of Chevron Corp. and Texaco Inc. tocreate ChevronTexaco Corp. provided the companies completedthe required divestitures of specified Texaco units. A Michiganfirm bought Texaco’s aviation fuels and services business. Texaco sold its interests in joint ventures with Shell Oil Co. andSaudi Oil Co. to those companies. This merger created the thirdlargest oil and gas company in the United States (Oil & GasJournal, 2001a). As with other recent mergers, the companiesmerged to be more competitive with other giant oil companies. They planned to improve their competitiveness for developingnew oilfields and sources of energy (Hoffman, 2000).
In another deal, Valero and Ultramar Diamond ShamrockCorp. merged following approval from the FTC. The combinedcompany retained the name Valero Energy Corp. A conditionfor approval of the merger was that the company was requiredto sell one refinery in California and a portion of the retailoutlets in the area. The new company became the third largestrefiner in the United States (Valero Energy Corp., 2001).
Phillips was busy with acquisitions and mergers during 2001. The company received approval to purchase Tosco Corp. in adeal that required no divestitures. With the purchase of Tosco,Phillips operated 10 U.S. refineries and 1 in Ireland (Oil & GasJournal, 2001a). After the completion of the Tosco purchase,Conoco Inc. and Phillips signed a merger agreement to createConocoPhillips. When the merger is completed, ConocoPhillipswill become the third largest integrated U.S. energy company. The merger was expected to be completed during the secondhalf of 2002 after the companies receive shareholder and FTCapproval (Phillips Petroleum Co., 2001).
In recent years, mergers also took place in the natural gasindustry. In 2000, Duke Energy Corp. merged with Phillips’gas gathering, processing, and marketing unit to form DukeEnergy Field Services, LLC [Duke Energy (70%) and Phillips(30%)] (Duke Energy Corp., 2001, p. 12). El Paso EnergyCorp. acquired The Coastal Corp. The El Paso Energy andCoastal merger was completed early in 2001, and the name waschanged to El Paso Corp. (El Paso Corp., 2001; El Paso EnergyCorp., 2001).
Several refining companies were in the process of upgrading
their facilities to produce low sulfur fuels from higher sulfurcrude oil, most of which were not completed in 2001. ExxonMobil was building a 40,000-bbl/d coker at its Baytownrefinery to handle 530,000 bbl/d of Mexican sour crude fromPetróleos Mexicano S.A. de C.V. (Pemex). The upgrades weredesigned to increase the quality of the fuels produced atBaytown. Sulfur production at the plant was likely to increaseto between 350,000 t/yr and 360,000 t/yr from about 300,000t/yr (North American Sulphur Service, 2000a). MarathonAshland Petroleum LLC was upgrading and adding sulfurrecovery capacity at its Garyville, LA, refinery to handleimports from Pemex (Cunningham, 1999b). The PremcorRefining Group Inc. was upgrading its Port Arthur, TX, refineryto handle more heavy crude. New sulfur recovery capacity wasbeing installed to increase production to more than 200,000 t/yrfrom 130,000 t/yr (North America Sulphur Service, 2000b). Other companies were involved in joint ventures in whichforeign sour crude producers contributed financing for theupgraded facilities. Shell and Pemex’s Deer Park, TX, refineryupgrade to enable the refinery to handle heavy sour Maya crudefrom Mexico was completed by midyear. The plant has thecapacity to produce 270 t/d of sulfur from 340,000 bbl/d ofcrude petroleum (Sulphur, 2001l). In 2000, Phillips andPetroleos de Venezuela S.A. (PdVSA) completed installation ofa new vacuum distillation unit and a coker at Phillips’ Sweeny,TX, refinery to enable the facility to handle heavy crudes likethose produced by PdVSA from the Venezuelan Orinoco Basin(Oil & Gas Journal, 2000c).
Byproduct Sulfuric Acid.—Sulfuric acid production atcopper, lead, molybdenum, and zinc roasters and smeltersaccounted for about 11% of the total domestic production ofsulfur in all forms, this was a slight increase compared with thatof 2000 (table 4). Four acid plants operated in conjunction withcopper smelters, and six were accessories to lead, molybdenum,and zinc smelting and roasting operations. Even with thecutbacks at copper smelters, the four largest acid plants wereassociated with copper mines and accounted for 83% of theoutput. The largest copper producers—ASARCO Incorporated,Kennecott Utah Copper Corp., and Phelps DodgeCorp.—operated a total of four sulfuric acid plants at primarycopper smelters.
Byproduct acid decreased by 4% from that of 2000 becausethree of the seven copper smelters in the United States remainedclosed during the year, which kept production from copper low. The 1999 closures resulted from a serious slump in the worldcopper industry, thus driving adjusted copper prices lower thanthey had been at any time in the 20th century (McCoy, 1999). Production at lead and molybdenum smelters was 36% lower in2001, but this decrease had limited impact on total byproductacid production because copper is so dominant.
Consumption
Apparent domestic consumption of sulfur in all forms was14% lower than that of 2000 (table 5). Of the sulfur consumed,80% was obtained from domestic sources, such as elementalsulfur (71%) and byproduct acid (9%), compared with 78% in2000 and 77% in 1999. The remaining 20% was supplied byimports of recovered elemental sulfur (16%) and sulfuric acid
U.S. GEOLOGICAL SURVEY MINERALS YEARBOOK—200175.4
(4%). The USGS collected end-use data on sulfur and sulfuricacid according to the standard industrial classification ofindustrial activities (table 6).
Sulfur differs from most other major mineral commodities inthat its primary use is as a chemical reagent rather than as acomponent of a finished product. This use generally requiresthat it be converted to an intermediate chemical product prior toits initial use by industry. The largest sulfur end use, sulfuricacid, represented 75% of reported consumption with anidentified end use. Some identified sulfur end uses weretabulated in the “Unidentified” category because these datawere proprietary. Data collected from companies that did notidentify shipment by end use also were tabulated as“Unidentified.” A significant portion of the sulfur in the“Unidentified” category may have been shipped to sulfuric acidproducers or exported, although data to support such anassumption were not available.
Because of its desirable properties, sulfuric acid retained itsposition as the most universally used mineral acid and the mostproduced and consumed inorganic chemical, by volume. Although apparent consumption decreased in 2001, data basedon USGS surveys of sulfur and sulfuric acid producers showedthat reported U.S. consumption of sulfur in sulfuric acid (100%basis) decreased slightly, but total sulfur consumption was 6%higher than that of 2000. These discrepancies may be attributedto inaccuracies in reporting that could have resulted in doublecounting.
Agriculture was the largest sulfur-consuming industry,although consumption in that end use decreased to 8.2 Mtcompared with 8.6 Mt in 2000. Reported consumption inphosphatic fertilizers was 4% lower than that of 2000; this wasa result of decreased production at phosphoric acid plants. According to export data from the U.S. Census Bureau, theestimated quantity of sulfur needed to manufacture exportedphosphatic fertilizers decreased by 7% to 4.5 Mt.
The second largest end use for sulfur was in petroleumrefining, and other petroleum and coal products. After a fewyears of relatively stable consumption in this sector, producersof sulfur and sulfuric acid reported an increase of 30% in theconsumption of sulfur in that end use.
Demand for sulfuric acid in copper ore leaching, which wasthe third largest end use, increased slightly as a result ofincreased copper production from leaching operations. Allcopper producers, even companies that closed smelteroperations, continued to operate their solvent extraction-electrowinning (SX-EW) operations in which weak sulfuric aciddissolves copper as it percolates through specially prepared bedsof copper minerals. The copper is then concentrated through asolvent extraction process, and the concentrated solutionundergoes an electrowinning process that produces 99.99%copper cathode (Phelps Dodge Corp., 1999).
Phelps Dodge Mining Co.’s project to convert its Morenci,AZ, operations to 100% SX-EW was completed in March 2001. Operations were expected to reach full capacity by the end ofthe year. The mine’s crushing and conveying system wasexpanded. A mobile conveying apparatus was installed to stackcrushed ore onto leach piles. New solvent extraction facilitiesand an electrowinning tankhouse were built. The expansionmakes Morenci the largest SX-EW facility in the world with the
capacity for producing 372,000 t/yr (820 million pounds peryear) of copper (Phelps Dodge Mining Co., 2001).
The U.S. Census Bureau reported 3.86 Mt of sulfuric acidwas produced as a result of recycling spent and contaminatedacid from petroleum alkylation and other processes (U.S.Census Bureau, 2001a, b, 2002a, b). This material was recycledby companies that produced acid for consumption in their ownoperations and also recycle acid used in their plants. Thepetroleum refining industry was believed to be the largestsource and consumer of recycled acid for use in its alkylationprocess.
Stocks
Yearend inventories held by Frasch and recovered elementalsulfur producers increased to 232,000 t or about 12% more thanthat of 2000 (table 1). Based on apparent consumption of allforms of sulfur, combined yearend stocks amounted to about an8-day supply, compared with a 6-day supply in 2000, a 12-daysupply in 1999, a 7-day supply in 1998, and a 20-day supply in1997. In 2000, yearend stocks were the lowest they had beensince Frasch production became profitable early in the 20thcentury (Haynes, 1959, p. 61). Final stocks in 2001 represented4% of the quantity held in inventories at the end of 1976 whensulfur stocks peaked at 5.65 Mt; this was a 7.4-month supply atthat time (Shelton, 1978, p. 1296). In most cases, recoveredsulfur producers found it difficult to accumulate any significantstockpiles. Many recovered operations did not have sufficientspace for storing excess sulfur, and in many locations,environmental regulations did not allow stockpiling to occur. Without Frasch production, domestic sulfur stocks wereexpected to remain relatively stable.
Solid sulfur storage capacity in the United States was not highenough to allow a significant accumulation of stocks inoversupply situations. The only area for storing large quantitiesof excess sulfur was in Galveston, TX. Domestic recoveredsulfur producers recognized the risks presented by the inabilityto find markets for their sulfur, and alternatives were beingexplored to avoid similar problems in the future. Installation ofpelletizers were under consideration in Texas and on theMississippi River. Permits for additional blocking capacitywere being sought in Galveston. Additional molten storagetanks were being built on both sides of the Gulf of Mexico. Landfill disposal of sulfur was approved in New Mexico andwestern Texas, although this was not seen as a viable long-termoption (d’Aquinn, 2001).
Prices
The contract prices for elemental sulfur at terminals inTampa, FL, that are reported weekly in Green Markets, beganthe year at $63 to $66 per metric ton. Within a month, pricesdecreased to between $56 and $59 per ton and remained thereuntil April when they dropped to between $41 and $44 per ton.
In an unprecedented move in mid-May, U.S. recovered sulfurproducers in the Gulf Coast area offered to cut their sulfur priceby $15 per ton retroactive to the first of May. Contract pricesreached a low of from $26 to $29 per ton although spot priceswere reported at more than $10 below that. U.S. producers
SULFUR—2001 75.5
were determined to maintain outlets for their products tomaintain production of their primary products, natural gas andpetroleum fuels. Lack of the ability to store unsold tonnage ofsulfur can cause oil and gas processors to halt operations tolimit sulfur accumulation. Significantly lower prices resulted indecreased Canadian imports caused by the less attractive pricing(Fertilizer Markets, 2001e). In October, prices started to inchback up and remained at $31 to $34 per ton through yearend.
Based on total shipments and value reported to the USGS, theaverage value of shipments for all elemental sulfur wasestimated to be $10.11 per ton, which was 59% lower than thatof 2000. Prices varied greatly on a regional basis, which causedthe price discrepancies between Green Markets and the USGS. Tampa prices were usually the highest reported because of thelarge sulfur demand in the central Florida area. U.S. west coastprices were listed at $0 per ton, although in reality, west coastproducers often faced negative values as a result of costsincurred at forming plants. These costs were necessary to makesolid sulfur in acceptable forms, often known as prills, to beshipped overseas. The majority of west coast sulfur was sent toprillers who may have been subsidized by the refineries, and theformed sulfur was shipped overseas (Green Markets, 1999).
Foreign Trade
Exports of elemental sulfur from the United States, whichincluded the U.S. Virgin Islands, as listed in table 7, were 11%lower in quantity than those of 2000 and 9% lower in valuebecause the average unit value of U.S. export material increasedslightly to $72.29. Exports from the west coast were 573,000 t,or 85% of total U.S. exports.
The United States continued to be a net importer of sulfur—imports of elemental sulfur exceeded exports by more than 1Mt. Recovered elemental sulfur from Canada and Mexicodelivered to U.S. terminals and consumers in the liquid phasefurnished about 91% of all U.S. sulfur import requirements. Total elemental sulfur imports decreased by about 26% inquantity and by 44% in value; imports from Canada, mostly byrail, were 29% lower, and waterborne shipments from Mexicowere 27% lower than those of 2000 (table 9). Imports fromVenezuela were estimated to account for about 9% of allimported sulfur.
Although sulfur supplies were sufficient to meet demand,several Florida fertilizer companies continued to pursuenecessary permits to build a terminal south of Tampa to handleformed sulfur to avoid future supply disruptions. After severalunexpected delays late in 2000, Big Bend Transfer Station Co.(BBTC) (a joint venture of Cargill, CF Industries, and IMCGlobal Inc.) received from the Hillsborough CountyCommission approval for its sulfur melting plant south ofTampa early in 2001. The joint venture was formed to build afacility for remelting formed sulfur as a means of diversifyingthe companies’ supply options. The project needed an air-quality permit from the county’s Environmental ProtectionCommission. Upon successful completion of the permittingprocess, BBTC planned to install facilities for handling 1.5million metric tons per year (Mt/yr) of sulfur with possibleexpansions to 2 Mt/yr (Green Markets, 2001a). This wouldenable BBTC to buy formed sulfur at the best prices available,
perhaps from foreign producers.BBTC experienced additional delays when a local
environmental group challenged the zoning requirements in theState circuit court. The court ruled that BBTC must obtain aplanned development zoning designation. The project will bepresented to the same zoning officials that previously approvedthe project, thereby delaying construction of the project untilsometime in 2002. During the years that legal requirements forconstruction had been pursued for the project, the supplysituation for the central Florida market changed, thus placingthe actual completion of the project in question (Green Markets,2001b). BBTC project received final approval in March 2002. Completion was projected for early 2004, although questionsremained as to whether the facility would actually be built(Green Markets, 2002).
In addition to elemental sulfur, the United States also hadsignificant trade in sulfuric acid. Sulfuric acid exports were10% higher than those of 2000 (table 8). Acid imports werealmost seven times greater than exports (tables 8, 10). Canadaand Mexico were the sources of 70% of U.S. acid imports, mostof which were probably byproduct acid from smelters. Canadian and some Mexican shipments to the United Statescame by rail, and the remainder of imports came primarily byship from Europe and Japan. The tonnage of sulfuric acidimports was virtually the same as that of 2000, but the value ofimported sulfuric acid increased by 24%.
World Review
The global sulfur industry remained divided into twosectors—discretionary and nondiscretionary. In thediscretionary sector, the mining of sulfur or pyrites is the soleobjective; this voluntary production of native sulfur or pyrites isbased on the orderly mining of discrete deposits with theobjective of obtaining as nearly a complete recovery of theresource as economic conditions permit. In thenondiscretionary sector, sulfur or sulfuric acid is recovered asan involuntary byproduct, the quantity of output subject todemand for the primary product irrespective of sulfur demand. Nondiscretionary sources represented 89% of the sulfur in allforms produced worldwide as listed in table 11.
Poland was the only country that produced more than 1 Mt ofnative sulfur by using either the Frasch or conventional miningmethods (table 11). Small quantities of native sulfur wereproduced in Asia, Europe, and South America. The importanceof pyrites to the world sulfur supply has significantly decreased;China was the only country in the top producers with more than500,000 t of sulfur produced whose primary sulfur source wasfrom pyrites. About 73% of world pyrites production was inChina.
Of the 22 countries listed in table 11 that produced 500,000 tor more of sulfur, 15 obtained the majority of their productionas recovered elemental sulfur. These 22 countries produced91% of the total sulfur produced worldwide. The internationalsulfur trade was dominated by a limited number of exportingcountries, which were, in descending order of importance,Canada, Saudi Arabia, Russia, the United Arab Emirates, Japan,and Germany; these countries exported more than 1 Mt ofelemental sulfur each and accounted for 74% of total sulfur
U.S. GEOLOGICAL SURVEY MINERALS YEARBOOK—200175.6
trade. Major sulfur importers, in descending order, were China,Morocco, India, the United States, Tunisia, and Brazil, all withimports of more than 1 Mt.
World production of sulfur was also slightly lower in 2001than it was in 2000; consumption was believed to be alsoslightly lower. Statistics compiled by CRU International Ltd.showed 1998 to be the seventh consecutive year in which sulfursupplies exceeded demand (Kitto, 2000). Although completedata for 1999 through 2001 were not available, 2001 wasassumed to represent the tenth consecutive year of excess sulfursupplies.
Prices in most of the world were believed to have averagedlower throughout the year but with a slight increase at yearend. Production of Frasch was 54% lower than that of 2000 as aresult of termination of mining in the United States and theclosure of one mine in Poland. Recovered sulfur productionwas virtually the same, and byproduct sulfuric acid productionincreased slightly compared with those of 2000. Supplycontinued to exceed demand; worldwide sulfur inventoriesincreased, much of which was stockpiled in Canada. Globally,sulfur from pyrites decreased by 6%, much of which was aresult of the continued decline in China and the construction ofa sulfur-fired sulfuric acid plant in Spain to replace a pyrites-based plant.
Statistics compiled by the Oil & Gas Journal showed that theUnited States possessed 20% of the world’s total refiningcapacity and 41% of the world’s sulfur recovery capacityderived from oil refineries. The publication listed 732 oilrefineries in 120 countries; only 55 of these countries werereported to have sulfur recovery capacity (Stell, 2001, p. 76,78). Although the sulfur recovery data appeared to beincomplete, analysis of the data showed that most of thecountries reporting no sulfur recovery at refineries were smallwith developing economies and limited refining industries. Ingeneral, as refining economies improve and the refiningindustries mature, additional efforts are made to improve sulfurrecovery and atmospheric emissions.
Worldwide, sulfur levels in motor fuels were being cut. Forexample, near the end of 2001, the European Council voted on aproposal to require all diesel and gasoline sold in Europe tocontain less than 10 ppm by the beginning of 2009, thusaccelerating the previous deadline proposal by 2 years. European refiners have until 2005 to reduce sulfur levels to 50ppm. The European Parliament will act on the legislation in2002 (Sulphur, 2002a). Even before larger, more developedcountries took action in this area, South Korea reduced theallowable sulfur in marine bunker fuels from 0.5% to 0.3%. The new standards must be met by July 2003 (Sulphur, 2001r). Marine bunker fuels are used to power most ocean-goingvessels. The high-sulfur content of these fuels is believed to bea major contributor to high atmospheric sulfur dioxide levelsnear shipping lanes.
Canada.—For the first time, Canada surpassed the UnitedStates in sulfur production in all forms. It also led the world inthe production of byproduct sulfur, exports of elemental sulfur,and stockpiled material. The majority of the sulfur productioncame from natural gas plants in Alberta where yearend sulfurinventories were estimated to be 14.3 Mt (PentaSul NorthAmerica Sulphur Review, 2002).
Older natural gas operations in Alberta were facing theprospect of installing costly equipment to improve their sulfurrecovery or closing if emissions regulations could not be met. In 1988, the Energy and Utilities Board (EUB) of Albertaenacted environmental legislation that covers emissions atnatural gas operations in that Province. Facilities that did notmeet the standards were given 15 years (until 2003) to upgradetheir operations or shut down. In 2001, the deadline forcompliance was extended until 2016 with incentives for earlyachievement. This covered 61 plants that release a total of 221t/d of sulfur into the atmosphere. The cost of upgrading theseplants was estimated to be nearly $227 million and will add 90t/d to Canadian sulfur capacity. Voluntary reduction guidelinesof 7.5% per year were set—plants that exceed these guidelineswere eligible to bank the excess for future years (Sulphur,2001a).
In addition to the large reserves of high-sulfur natural gas,Alberta has huge deposits of oil sands with estimated reservesof 300 million barrels of recoverable crude oil that also contain4% to 5% sulfur (Stevens, 1998). As traditional petroleumproduction in Canada declined, oil sands became a moreimportant source of petroleum for the North American market(Cunningham, 2001). Mining rights for all identified oil sandsproperties available in Alberta have been sold. Early in theyear, about 1% of estimated oil sands had been extracted withplans for expansion at many of the operations being considered(Sulphur, 2001u).
Oil sands operations usually produce elemental sulfur, butone company was planning to produce another sulfur compoundto be used in agriculture. In its expansion plans for its MildredLake oil sands upgrader in Alberta, Syncrude Canada Ltd.included a plant to produce fertilizer grade ammonium sulfateand 1,000 t/d of elemental sulfur. Syncrude planned to produce100,000 t/yr of ammonium sulfate. The expansion should becomplete in early 2004 (Sulphur, 2001p).
The Canadian Government established similar sulfur limitsfor motor fuels as the United States. Irving Oil Ltd., which wasone of the first refiners to meet new Canadian fuel standards,spent Can$1 billion to upgrade its Saint Johns, New Brunswick,refinery to meet Canada’s gasoline sulfur specifications that gointo effect in 2005 (Goodwin, 2000). The new unit, whichstarted production late in 2000, produced gasoline that met theupcoming 30-ppm sulfur standard and minimized octane loss(Gardner and Schwarz, 2001). As well as reducing sulfur infuels, the upgrade was to reduce sulfur dioxide emissions at therefinery and to improve the reliability of environmentalcontrols. Reductions in atmospheric sulfur dioxide emissionswere self-imposed. The refinery already was in compliancewith New Brunswick and Canadian regulations (Goodwin,2000).
Chile.—The world’s largest copper producer, Chile recoverednearly all its sulfur as byproduct sulfuric acid from coppersmelting. As the country’s smelters were modernized and newsmelters installed, expectations were that sulfuric acidproduction would continue to increase as it has for the past fewyears. Consumption at copper leach operations was expandingalso. Corporación Nacional Del Cobre (Codelco) completed theexpansion to bring byproduct acid capacity to 700,000 t/yr at ElTeniente (Sulphur, 2001f). In another move aimed at improving

SULFUR—2001 75.7
the value of the company and making copper leach operationsmore profitable, Codelco was planning to merge part of itsChuquicamata and other undeveloped deposits to share theleach facilities built to process the oxide ores (Sulphur, 2001g).
Noranda Inc. of Canada was completing engineering workand progressing with construction for expanding its Altonortesmelter to increase copper production by about 80%. Sulfuricacid production capacity, however, will nearly triple to 700,000t/yr. The upgrade would make Altonorte more cost competitiveand enable the company to capture 90% of the sulfur dioxidereleased by the smelter. The complete modernization projectwas expected to be completed in 2003 (Sulphur, 2001b, 2001k).
China.—Second only to the United States in sulfuric acidproduction, China produced almost 24 Mt of sulfuric acid in2000, the most recent year for which data are available(Sulphur, 2002b). Although pyrites have been the mainstay ofacid production, efforts were being made to change that. One ofthe few countries whose primary domestic source of sulfur waspyrites, China continued converting much of its sulfuric acidcapacity from pyrites burning to elemental sulfur. Some newelemental sulfur-based acid plants were built, but much of theconversion was through adapting existing pyrites operations touse solid sulfur. The conversions were driven by economic andenvironmental concerns (Fertilizer Markets, 1999). In 2000,about one-third of the sulfuric acid produced in China was fromelemental sulfur burning (Sulphur, 2002b).
Environmental awareness is a relatively recent concern inofficial Government considerations. Pyrites-based sulfuric acidplants in China emitted sulfur dioxide and other pollutants to theatmosphere, discharged pollutants to rivers, contaminatedground water, and presented solid waste disposal problems. Aproperly operated sulfur burner has very limited atmosphericemissions, no water discharge, and no solid waste issues (Sears,2000). Canadian sulfur producers were instrumental indeveloping the elemental sulfur market in China but recentlybegan to lose market share in China. Middle Eastern materialwas beginning to make inroads into the Canadian dominance inthe Chinese market (Fertilizer Markets, 2001d).
The Chinese petroleum industry was working to modernize itsfacilities to reduce sulfur emissions as it increased imports ofsour crudes from the Middle East. Chinese crude petroleumwas relatively sweet, and imports have been sweet crudesbecause of the country’s inadequate sulfur recovery capabilities. Work was progressing to improve sulfur recovery units atseveral refineries. Additional improvements at smelters wereexpected to increase availability of byproduct acid (Sears,2000). Joint ventures with major oil producers willing to makeinvestments in the Chinese industry were a large part of thestrategy for reducing imports of oil products and improving therefining technology (Cunningham, 1999a).
Germany.—As one of the largest sulfur-producing countriesin Europe, discrepancies existed between official Governmentproduction statistics and other sources reporting Germanproduction. Other sources showed German productionsignificantly higher than Government sources with nearly 1 Mtmore production of sulfur in all forms than official data. MostGerman sulfur was sold in European Union markets.
Iraq.—Questions remain about Frasch and other sulfurproduction in Iraq. Before Iraq invaded Kuwait, thus
precipitating Operation Desert Shield in 1990 and OperationDesert Storm (the Gulf War) in 1991, Frasch production at theMishraq Mine was around 1 Mt/yr with plans to expandcapacity to 2 Mt/yr. Some recovered sulfur was also producedin Iraq. With the imposition of economic sanctions by theUnited Nations (UN) and very limited public information of anykind coming from Iraq, little is known of sulfur production inthat country. Mishraq was not believed to be damaged duringthe war and could be operating at or near capacity, although thatscenario is doubtful. The most likely situation is that Mishraqhas produced consistently since 1990 but at a greatly reducedrate. Recovered sulfur production probably continued. Withlittle outlet for any products as a result of the sanctions,significant stocks of sulfur are believed to have accumulated atMishraq since the imposition of sanctions. Sulfur also wasproduced at two sour gas processing plants at Kirkuk and Beiji(Fertilizer Markets, 2000a).
Iraq reached an agreement with Jordan to supply all Jordan’ssulfur requirements starting in late 2000 and through 2001. UNsanctions against Iraq have banned most trade with Iraq since itinvaded Kuwait in 1990. Jordan invoked an article of the UNcharter that allows a UN member state to refrain fromimplementing a sanction if it is against it’s domestic interests. The price of the Iraqi sulfur, probably from the Mishraq fraschmine, was estimated to be nearly one-third less than similarmaterial from elsewhere in the Middle East (Sulphur, 2000a). Jordan received 150,000 t of sulfur from Iraq in 2000; up to 1Mt was expected in 2001 (Fertilizer Markets, 2000a).
Kazakhstan.—The Tengiz oilfield and gasfield is the mainsource of current (2001) sulfur production in Kazakhstan. Located on the northeastern shore of the Caspian Sea in westernKazakhstan, Tengiz has been operated by Tengizchevroil (TCO)since 1993. In 2000, Chevron Corp. raised its stake in TCO to50%. Other owners in TCO were Kazakhoil (Kazakhstan’snational oil and gas company) (20%), ExxonMobil (25%), andLUKARCO (a joint venture between BP and Russian oilcompany LUKoil) (5%) (Chevron Corp., 2000). One of theworld’s largest oilfields, Tengiz contains high-quality oil with0.49% sulfur and associated natural gas that contains 12.5%hydrogen sulfide (Connell and others, 2000).
In August, the completion of a petroleum pipeline to carrycrude oil from Tengiz to the Russian port of Novorossiysk onthe Black Sea opened the first major route for carrying Tengizlight sweet oil to international markets. With this developmentand other transport routes for further exports, plans were laidfor increased output of all products, which included sulfur, byup to 80% (Sulphur, 2002b). Production at Tengiz wasestimated to be more than 1.2 Mt/yr with expectations for it torise to 2.0 Mt in 2005 and 3.75 Mt by 2010 (Sulfur, 2001s).
Because of its remote location, little of the sulfur that hasbeen produced at Tengiz since production began has been sold. TCO accumulated stocks of 4.6 Mt of elemental sulfur, whichwas 1.6 Mt more than the company had approval to store. TCOwas planning the installation of sulfur forming equipment toenable easier transportation of sulfur to market (Sulphur,2001v). The operators of Tengiz have considered reinjectingthe acid gas into the formation, but the high reservoir pressuresmake this difficult with current (2001) technology (Sulfur,2001s). The reinjection project would limit the growth of sulfur

U.S. GEOLOGICAL SURVEY MINERALS YEARBOOK—200175.8
production to a total of about 2 Mt/yr (Sulphur, 2002b).Sulfur also is recovered from the Karachaganak gas-
condensate field in Kazakhstan near the Russian border. Because it is close to the Russian gas processing operation inOrenburg, sour gas from Karachaganak is treated at Orenberg. No gas treatment facilities have been installed at that site inKazakhstan (Sulfur, 2001s).
Oil refineries are part of the plan for development for theKashagan field offshore of Kazakhstan in the Caspian Sea. Sulfur production was expected to be about 1 Mt from theassociated sour gas that will be separated from the crude oil. Commercial production is scheduled to begin in 2005 (Sulphur,2002d).
Mexico.—A former Frasch producer, Mexico was the secondlargest supplier of imported recovered sulfur to the UnitedStates; the country produced Frasch sulfur from 1954 whenmining began at San Cristobal until 1993 when the TexistepecMine closed (Larson and Marks, 1955, p. 1136-1137). Mexicorecovered most of its sulfur from its petroleum refineries andrecovered byproduct sulfuric acid at its smelters.
Although Mexico produced about 5% of global crude oil, itdid not have the refinery capacity to meet domestic demand forgasoline. The completion of the refinery upgrade at Pemex’sCadereyta refinery in 2000 brought capacity close to demand. Five additional upgrade projects were underway to transformthe country’s trade balance for gasoline. Mexican refinerieswere unable to process heavy maya crude into sufficientquantities of motor fuels. Pemex invested in U.S. refineries inTexas to ensure steady markets for their crude oil but wereunable to find the capital to modernize its own refineries. Revamping at Cadereyta expanded capacity for diesel, jet fuel,and gasoline. Sulfur production was expected to be about 480t/d with further expansion of 80 t/d and eventually reachingabout 450,000 t/yr. Other planned modernization projectsinclude those of Minatitlan, Salamanca, Salina Cruz, and Tula. No details on progress or expected sulfur recovery capacitieswere available. Additional sulfur supplies, perhaps more than500,000 t/yr from a single project, were expected from newnatural gas processing operations (Cunningham, 2000a).
Pemex had long-term supply contracts with U.S. refinersExxonMobil, Marathon Ashland Petroleum LLC, and PremcorInc. (Cunningham, 1999b). Pemex’s joint venture with Shell atDeer Park, TX, completed its upgrade in 2001 (Sulphur, 2001l).
Poland.—During the year, one of Poland’s two remainingsulfur mines closed. Operating since 1967, Poland’s JeziorkoMine at Tarnobrzeg was forced to close in response todecreasing demand for mined sulfur. At its peak of operation inthe 1980s, Jeziorko produced more than 3.3 Mt/yr and set arecord of 3.39 Mt in 1984 and 1988. In recent years, capacitywas closer to 1 Mt/yr, although large resources remain (Sulphur,2001q). The 800,000 t/yr capacity Osiek Mine continued tooperate.
Poland exported more than 700,000 t of sulfur in 2000, mostof which went to Morocco and some European countries. Osiekwas designed with the potential for future expansion to 1.3 Mt(Fertilizer Week, 2001a). Oil refineries in Poland wereupgrading their sulfur recovery units to meet air-qualityregulations that forbid the release of sulfur dioxide into theatmosphere (Sulphur, 1999b). Even with the closure of
Jeziorko, recovered sulfur remained a secondary source ofsulfur in Poland.
Russia.—The Astrakhan Gas Processing Plant was the largestsingle source of recovered sulfur in the world. Construction byAstrakhangazprom’s gas processing plant began in 1981 withthe first production in 1986; this gas was 26% hydrogen sulfideand more than 4,000 meters deep. Astrakhan producesgasoline, diesel, furnace fuel oil, kerosene, and liquified gas. Sulfur production has increased significantly since 1995 withthe completion of subsequent phases of development. In 1995,production at this operation was 1.7 Mt of sulfur. By 2000,production had more than doubled to 3.8 Mt. Further increasesare expected from the final phase of the operation that wascompleted at yearend. By 2004, production should reach 4.5 Mt(Sulfur, 2001s). By the middle of 2001, stocks at Astrakhanwere almost 1.4 Mt, 500,000 t of which had been stockpiledduring the first 6 months of the year (Fertilizer Week, 2001b).
Orenburg is another sour gas operation in Russia with sulfurrecovery of about 800,000 t/yr. This operation declined in the1980s, but the discovery of the large Karachaganak gas-condensate field nearby in Kazakhstan brought new supplies ofsour gas to be treated. No gas treatment facilities have beeninstalled at the Kazakhstan site. About 20% of the sulfurproduction at Orenburg is believed to have come fromKarachaganak gas (Sulfur, 2001s). Russian exports were about1.8 Mt in 2001. The 43% decrease from the previous yearreflected the worldwide decrease in trade caused by weakdemand and low prices. Morocco and Tunisia were Russia’slargest customers. Russian sulfur has displaced material fromCanada and the Middle East in important markets in NorthAfrica.
To stop Russian pollution from a nickel smelter on the KolaPeninsula from causing environmental damage in Norway, theNorwegian Government was paying $30 million toPechanganickel to finance improvements to emission controls tolimit sulfur dioxide emissions at the smelter. The NordicInvestment Bank and Norilsk Nickel (Pechanganickel’s parentcompany) will contribute an additional $70 million dollars forthe environmental upgrades. Total emissions, which includesulfur dioxide and heavy metals, should be reduced by 90%,and sulfur dioxide emissions should be reduced to 13,000 t/yrfrom 150,000 t/yr. About 200,000 t/yr of sulfuric acid shouldbe produced (Sulphur, 2001o).
Saudi Arabia.—All Saudi Arabia’s sulfur production isrecovered from oil refining and natural gas processing. As alarge exporter, Saudi industry was effected by low internationalprices, which caused producers to stockpile material for the firsttime in 3 years. In February, 50,000 t was poured to block(Fertilizer Markets, 2001c).
Spain.—Europe’s largest sulfuric acid plant, which had acapacity of 2,400 t/d, was completed early in 2001. The sulfur-burning plant, which is at Fertiberia’s Huelva phosphoric acidplant, nearly doubled the acid capacity of the three pyritesroasters that it replaced. Fertiberia has become one of thelargest purchasers of imported sulfur in Europe (Sulphur,2001d).
Turkey.—Contrary to trends in the rest of the world that arereducing and eliminating the use of pyrites in sulfuric acidproduction, Eti Holdings of Ankara was building a pyrites-

SULFUR—2001 75.9
based sulfuric acid plant at Bandirma. The plant will produce750 t/d of 100% acid and was expected to be in operation inMay 2003 (Sulphur, 2001t).
Venezuela.—Venezuela’s Orinoco Basin is one of theworld’s largest resources of crude oil. If recent developments inrefining technology had not provided the means for upgradingthe crude, then it could not have been developed (Sulphur,2000c). Upgraded crude production from the Orinoco Basincould eventually result in the production of 8 Mt/yr of sulfurwith about 5 Mt/yr of that being produced in Venezuela and therest at refineries in other countries, very possibly in the UnitedStates (Cunningham, 2000b).
Construction of heavy oil upgrading facilities at the port ofJosé progressed. Petrozuata’s heavy oil upgrader was the firstof four planned projects at the José complex to upgrade Orinococrudes and opened in February; Petrozuata was a joint venturebetween Conoco Inc. and PdVSA. The coking technology atthis 145-t/d-capacity operation did not produce huge quantitiesof sulfur. Most of the sulfur remains in the coke product. Otherprojects in Venezuela produce significantly more sulfur duringthe upgrading process (Sulphur, 2001n).
Sincor [an alliance of TotalFinaElf (47%), PdVSA (38%),and Statoil AS (15%)] was the second completed upgradeoperation. Its crude oil production facilities in the Orinoco Beltopened in February with expectations for upgraded oil to beavailable for sale from its José upgrader in 2002. In addition tothe light, sweet crude, the company will also produce coke andsulfur. Of the four projects under development based on extra-heavy sour crudes from Orinoco, the Sincor crude will be thelightest and have the lowest sulfur content. Sulfur productionwas designed to recover 900 t/d (Chang, 2001).
The Cerro Negro project (ExxonMobil, PdVSA, and VebaOel AG of Germany) was the third facility (Sulphur, 2001m). Upgraded crude oil was shipped for the first time from thisoperation to the United States in August. The fourth project, theHamaca joint venture (PdVSA, Phillips, and Texaco), receivedgo-ahead funding. It will pipe heavy oil to José for upgrading(Sulphur, 2001i). Once these heavy oil upgrading projects arecompleted at José, the terminal will provide an additional400,000 t/yr of sulfur to the world market (Sulphur, 2000b).
PdVSA also is involved in a joint venture for processingVenezuelan crude at the Phillips refinery in Sweeny, TX. PdVSA and Phillips spent $540 million to build a coker and avacuum distillation unit to be operated by Merey SweenyLimited Partnership (Sulphur, 2001j).
International financing for additional projects involvingOrinoco crudes may be more difficult to obtain in the future. Anew law was passed that could limit outside interest in furtherdevelopment of these projects. The law includes a 30% royaltyrate and requires that PdVSA hold at least 50% of the equity inany new enterprise (Sulphur, 2002c).
Zambia.—First Quantum Minerals was expanding its sulfur-burning sulfuric acid plant at its Bwana Mkubwa operation toconvert it to a copper SX-EW operation. Additional ore fromthe nearby Lonshi Mine in Congo (Kinshasa) will be processed(Sulphur, 2001e).
Current Research and Technology
Biodesulfurization.—The Shell-Paques/Thiopaq process was
developed to remove sulfur from hydrogen sulfide found inhigh-pressure natural gas, synthesis gas, and refinery gasstreams by using naturally occurring, harmless microorganismsas catalysts. Sulfur compounds are dissolved in an aqueoussolution and then treated in the bioreactor to produce eitherelemental sulfur or sulfate compounds. Hydrogen sulfideremoval is 99.99%. The bioreactor, which can be built inlimited space, operates at ambient conditions, thus allowing useof noncorroding construction materials. Use of polypropyleneand polyethylene pipes and valves results in long equipmentlife. These units require little attention from operators and noshutdowns for overhauls because all routine maintenance ispossible while the unit is operating. In addition to its use innatural gas treatment and oil refining, Thiopaq can be usedcommercially in such industries as chemical processing, foodprocessing, mining, pulp and paper, and wastewater. Current(2001) adaptations of the process can handle throughput of upto 45 t/d (Sulphur, 2001c).
Injection of Sulfur Dioxide.—Because sulfur stockpilescontinued to expand, Alberta Sulfur Research Ltd. (ASR) wasinvestigating the possibility of using a process for reinjectingsulfur into a sour gas reserve to dispose of unwanted sulfur andusing the heat produced to generate electrical power. Sulfurwould be burned to produce sulfur dioxide that would beinjected into the reservoir under moderate pressure, and thenreact with the hydrogen sulfide to form elemental sulfur thatwould fall to the bottom of the reservoir. The sulfur-formingreaction would reduce the pressure of the reservoir, thusdecreasing the concern that reinjected materials would escapeinto the atmosphere. Eighteen months of laboratory researchhas supported the theory. ASR planned a pilot study for furtherverification of the proposal (Clark, 2001a).
Reinjection of Hydrogen Sulfide.—Reinjection of the sulfuras hydrogen sulfide into an appropriate underground reservoirwas an attractive alternative in some instances at some naturalgas operations but was seldom feasible at oil refineries. In acidgas reinjection from sour gas processing, the hydrogen sulfideand carbon dioxide were separated from the gas by usingstandard separation techniques and recompressed into a suitableinjection zone. The suitability of the injection zone wasinfluenced by its distance from the processing facility and couldbe a large aquifer, a depleted reservoir, or a zone that producessour fluids. A depleted reservoir was especially attractivebecause its size and original pressure were already known,which made the determination of its holding capacity easier todetermine. The sour gases also could be reinjected into aproducing deposit.
Reinjection was being used at many small-scale operations,especially in Canada, but it had not been demonstrated to workon a large scale. Preventing the migration of reinjected gasesfrom the reservoir into adjacent reservoirs or aquifers or into theatmosphere through an outcrop was essential for successfulimplementation.
With large-scale reinjection schemes, the energy balancewould be an important factor in determining its feasibility. Without the sulfur recovery plant that produces energy, whichcan be used elsewhere in the operation, steam production byusing an external energy source, such as natural gas orelectricity, was required. Using natural gas presented theunusual situation of producing carbon dioxide emissions to
U.S. GEOLOGICAL SURVEY MINERALS YEARBOOK—200175.10
reinject carbon dioxide. A determination was needed ofwhether the environmental benefit of reinjecting carbon dioxidewas canceled out by the carbon dioxide emissions produced forthat reinjection.
A feasibility study conducted by Abu Dhabi National OilCompany showed that a large-scale reinjection project couldhave a favorable balance between energy consumption andgreenhouse gas emissions. The technical and operatingchallenges were yet to be resolved (Connock, 2001).
Underground Storage.—Alberta Sulphur Research Ltd. wasanalyzing preliminary data from its 5-year test for storingelemental sulfur underground. The expenses incurred tomitigate the cost of acid run-off treatment from sulfur stored inlarge blocks, such as found in Alberta, can be as much as $10million per year for a 3-Mt block. Storing the sulfurunderground in areas with low subsoil temperatures inhibits theaction of the bacteria that converts the elemental sulfur tosulfuric acid by maintaining temperatures lower than necessaryfor bacterial activity and restricting the available oxygenrequired for the activity. Data from the first 2 years of the testshowed no bacterial activity. The 5-year test was expected toprovide support for regulatory approval for this type of sulfurstorage (Clark, 2001b).
Outlook
The sulfur industry continued on its path of increasedproduction, slower growth in consumption, higher stocks, andexpanded world trade. U.S. production from petroleumrefineries is expected to increase substantially in the next fewyears as expansions, upgrades, and new facilities at existingrefineries are completed, thus enabling refiners to increasethroughput of crude oil and to process higher sulfur crudes. Projects at oil refineries with resultant expansions of sulfurrecovery facilities in Louisiana and Texas completed late in2000 and during 2001 resulted in an additional capacity of540,000 t/yr. An expected operating rate of about 80%represents an additional supply of 430,000 t/yr (Wilkinson,2001). Production from natural gas operations varies but isusually between 2.0 and 2.2 Mt/yr, although recent years haveseen a downward trend. Output is expected to average around 2 Mt/yr.
Worldwide recovered sulfur output should continue toincrease. The largest increases in recovered sulfur productionthrough 2005 should come from the Middle East’s and Russia’sgrowth in sulfur recovery from natural gas, Canada’s expandedoil sands operations, and Asia’s improved sulfur recovery at oilrefineries (Kennedy, 2001). Refineries in developing countriesshould begin to improve environmental protection measures andeventually approach the environmental standards of plants inJapan, North America, and Western Europe.
Experts from the natural gas industry estimate that the worlddemand for natural gas will grow by 2.5% per year during thenext 20 years for a total 50% increase in demand. Producing50% more gas means recovering at least an additional 50% insulfur from that source. Future gas production, however, islikely to come from deeper, hotter, and sourer deposits that willresult in even more excess sulfur production unless more effortsare made to develop new large-scale uses for sulfur. Other
alternative technologies for reinjection and long-term storage toeliminate some of the excess sulfur supply will require furtherinvestigation to handle the quantity of surplus materialanticipated (Hyne, 2000).
Byproduct sulfuric acid production will remain depressed inthe United States as long as the copper smelters remain idle. With the copper industry’s switch to lower cost productionprocesses and producing regions, the three idle smelters maynever reopen. Worldwide, the outlook is different. Becausecopper production costs in many countries are lower than in theUnited States, acid production from those countries has notdecreased as drastically, and increased production is morelikely. Environmental controls were less of a concern indeveloping countries in the past. Many copper producers inthese and even in developed countries, however, are installingmore-efficient sulfuric acid plants to limit sulfur dioxideemissions at new and existing smelters. Planned and in-progress improvement projects could increase byproduct acidproduction to 52 Mt by 2010 or the equivalent of about 17 Mtof sulfur from an estimated 11.6 Mt (3.8 Mt of sulfur) in 2001(Sulphur, 1999a).
Frasch and pyrites production, however, have little chance ofsignificant long-term increases, even after the completion of thepyrites burner in Turkey. Because of the continued growth ofelemental sulfur recovery for environmental reasons rather thandemand, discretionary sulfur has become increasingly lessimportant as demonstrated by the closure of the Polish sulfurmine. Frasch sulfur has become the high-cost process for sulfurproduction. Pyrites, with significant direct production costs, isan even higher cost raw material for sulfuric acid productionwhen the environmental aspects are considered. Discretionarysulfur output should show a steady decline. The decreases willbe pronounced when large operations are closed outright foreconomic reasons as was the case in 2000 and 2001.
Sulfur and sulfuric acid will continue to be important inagricultural and industrial applications, although consumptionwill be less than production. World sulfur demand for fertilizeris forecast to increase at about 1.9% per year for the next 10years; industrial demand is predicted to grow at 2.3% per yearas a result of increased demand for copper and nickel leaching.
The most important changes in sulfur consumption will be inlocation. Phosphate fertilizer production, where most sulfur isconsumed, is projected to increase about by 1.8% per yearthrough 2010. With new and expanding phosphate fertilizercapacity in Australia, China, and India, sulfur demand will growin these areas at the expense of some phosphate operationselsewhere, thus transferring sulfur demand rather than creatingnew. The effects were already being felt by the U.S. phosphateindustry as reflected in the permanent closure of some facilitiesand reduced production at others. U.S. phosphate productssupply domestic requirements, but a large portion of U.S.production is exported. China and India are primary marketsfor U.S. phosphatic fertilizers. As the phosphate fertilizerindustries develop in these countries, some of the markets forU.S. material could be lost. Sulfur will be required forphosphate production at new operations, and more producerswill be competing for those markets.
Use of sulfur directly or in compounds as fertilizer shouldincrease, but this use will be dependent on agricultural
SULFUR—2001 75.11
economies and increased acceptance of the need for sulfur inplant nutrition. If widespread use of plant nutrient sulfur isadopted, then sulfur consumption in that application could besignificant; thus far, however, growth has been slow.
Industrial sulfur consumption has more prospects for growththan in recent years, but still not enough to consume allprojected surplus production. Conversion to or increases incopper leaching by producers who require significantly moresulfuric acid for the leaching operations than was used in 2001bode well for the sulfur industry. Nickel pressure acid leachoperations were demanding increased quantities of sulfur. Changes in the preferred methods for producing oxygenatedgasoline, especially in Canada and the United States, mightresult in additional alkylation capacity that would requireadditional sulfuric acid. Other industrial uses show lesspotential for expansion. Estimates show sulfur productionexceeding consumption by 3 Mt/yr for the next 20 years andworldwide inventories reaching 80 Mt by 2020 (Hyne, 1999). The potential exists for involuntary sulfur production of 80 to100 Mt/yr by 2050; this represents a substantial increase in thetime period that could be required to develop viable energyalternatives to fossil fuels (Cunningham, 2000b)
Unless significant new uses for elemental sulfur areimplemented, the oversupply situation will result in tremendousstockpiles accumulating around the world. In the 1970s and1980s, research was conducted that showed the effectiveness ofsulfur in several construction uses that held the promise ofconsuming huge quantities of sulfur in sulfur-extended asphaltand sulfur concretes. In many instances, these materials werefound to be superior to the more-traditional products, but theiruse so far has been very limited. Interest in these materialsseemed to be increasing but only in additional research. Nolarge-scale projects were announced that would require sizablequantities of sulfur. These proposals may have to be revisited toavoid building mountains of sulfur in the not-too-distant future.
References Cited
BP Amoco p.l.c., 1999, BP Amoco merger completed: London, UnitedKingdom, BP Amoco p.l.c. press release, January 1, 1 p.
Chang, Joseph, 1999, BP Amoco to buy Atlantic Richfield in $26 bn stock deal: Chemical Market Reporter, v. 255, no. 15, April 12, p. 1, 18.
Chang, Thi, 2000, Worldwide refining capacity steady in the past year: Oil &Gas Journal, no. 98.51, December 18, p. 56-64.
Chang, Thi, 2001, Sincor to offer Zuata sweet crude in 2002: Oil & GasJournal, no. 99.29, July 16, p. 52-54.
Chemical & Engineering News, 2000, On-purpose sulfur to cease in the U.S.: Chemical & Engineering News, v. 78, no. 31, July 31, p. 15.
Chemical Market Reporter, 2001, Refiners attack new sulfur level rules: Chemical Market Reporter, v. 259, no. 1, p. 5.
Chevron Corp., 2000, Chevron finalizes additional stake in Tengiz joint venture: San Francisco, CA, Chevron Corp. press release, August 29, 1 p.
Clark, Peter, 2001a, Energy from sulphur with no emissions and no storage!: Sulphur, no. 276, September-October, p. 41-42.
Clark, Peter, 2001b, Underground storage of solid elemental sulfur: Sulphur,no. 276, September-October, p. 40-41
Connell, Dave, Ormiston, Bob, Amott, Nick, and Cullum, Irene, 2000, Gas-plantupdate moves Tengiz field toward 2004 producing target: Oil & Gas Journal,no. 98.24, June 12, p. 64-72.
Connock, Lisa, 2001, Acid gas re-injection reduces sulphur burden: Sulphur,no. 272, January-February, p. 35-41.
Cunningham, Chris, 1999a, Chinese demand more refined: Sulphur, no. 262,May-June, p. 16-22.
Cunningham, Chris, 1999b, Sour imports fill the gulf: Sulphur, no. 263, July-August, p. 31-37.
Cunningham, Chris, 2000a, Heavy going for Mexico’s refineries: Sulphur, no.271, November-December, p. 29-31.
Cunningham, Chris, 2000b, Sulphur matters on the bay: Sulphur, no. 271,November-December, p. 17-21.
Cunningham, Chris, 2001, Oil sands bonanza: Sulphur, no. 272, January-February, p. 27-33.
d’Aquinn, G.E., 2001, U.S. sulphur industry—Melt down: Sulphur 2001,Marrakech, Morocco, October 14, Presentation, 9 p.
Duke Energy Corp., 2001, Duke Energy Corp. 2000 annual report: Charlotte,NC, Duke Energy Corp., 24 p.
El Paso Corp., 2001, El Paso announces new corporate identity: Houston, TX,El Paso Corp. press release, February 5, 1 p.
El Paso Energy Corp., 2001, El Paso Energy completes merger with Coastal,creating the world’s leading natural gas company: Houston, TX, El PasoCorp. press release, January 29, 3 p.
Fertilizer Markets, 1999, Decline in Chinese pyrites aids Canadian S exports: Fertilizer Markets, v. 10, no. 9, September 13, p. 2-3.
Fertilizer Markets, 2000a, Jordan: Fertilizer Markets, v. 11, no. 11, October 16,p. 10.
Fertilizer Markets, 2000b, Main Pass closed: Fertilizer Markets, v. 11, no. 4,September 4, p. 9.
Fertilizer Markets, 2001a, Freeport sells Culberson asset, sees 80$ million MainPass deal: Fertilizer Markets, v. 11, no. 23, January 5, p. 2.
Fertilizer Markets, 2001b, Freeport sells lease, some assets at Main Pass: Fertilizer Markets, v. 12, no. 12, p. 2.
Fertilizer Markets, 2001c, Sulphur: Fertilizer Markets, v. 11, no. 3, p. 9.Fertilizer Markets, 2001d, Sulphur—China: Fertilizer Markets, v. 31, no. 41,
p. 9.Fertilizer Markets, 2001e, Sulphur contract price falls sharply in gulf: Fertilizer
Markets, v. 31, no. 41, p. 2.Fertilizer Week, 2001a, Poland’s Siarkopol closes Jeziroko S mine: Fertilizer
Week, v. 15, no. 23, p. 2.Fertilizer Week, 2001b, Russian sulphur block twice forecast size: Fertilizer
Week, v. 15, no. 21, October 1, p. 3.Gardner, Rob, and Schwarz, E.A., 2001, Canadian refinery starts up first-of-kind
gasoline desulfurization unit: Oil & Gas Journal, no. 99.25, June 18, p. 54-58.
Garritsen, L.A., Desai, P.H., Inoue, Yoshimasa, 2000, Catalysts play a large partin ultra-low sulfur fuel: Oil & Gas Journal, no. 98.41, October 9, p. 76-80.
Goodwin, Daniel, 2000, $1-billion uprade prepares Canadian refinery for futurespecs: Oil & Gas Journal, v. 98, no. 13, March 27, p. 45-51.
Green Markets, 1999, Market watch—West coast: Green Markets, v. 23, no. 1,January 4, p. 9.
Green Markets, 2001a, Florida sulfur melting plant approved: Green Markets, v.25, no. 4, January 22, p. 9-10.
Green Markets, 2001b, Florida sulfur plant takes one step back: Green Markets,v. 25, no. 47, November 19, p. 7.
Green Markets, 2002, Florida sulfur plant gets final approval: Green Markets, v.26, n. 13, April 1, p. 9.
Haynes, Williams, 1959, Brimstone—The stone that burns: Princeton, NJ, D.Van Nostrand Co., Inc., 293 p.
Hess, Glenn, 2000, EPA’s diesel reduction plan draws opposition form industry: Chemical Market Reporter, v. 257, no. 26, June 26, p. 28.
Hoffman, John, 2000, Chevron and Texaco plan to unite: Chemical MarketReporter, v. 258, no. 17, October 23, p. 5.
Hyne, J.B., 1999, S8 after Y2K?: Sulphur, no. 260, January-February, p. 20-25.Hyne, J.B., 2000, An invisible hill to climb: Sulphur, no. 269, July-August, p. 3.Kennedy, Bill, 2001, World recovered sulphur supply and trade outlook, in
International Fertilizer Industry Association Production and InternationalTrade Conference, Quebec City, Quebec, Canada, September 13-14, 2001,Proceedings: Paris, France, International Fertilizer Industry Association, 16 p.
Kitto, Mike, 2000, The sulphur market—Developments and trends: Sulphur, no.269, July-August, p. 19-25.
Larson, L.P, and Marks, A.L., 1955, Sulfur and pyrites: U.S. Bureau of MinesMinerals Yearbook 1954, v. I, p. 1119-1143.
McCoy, Michael, 1999, Sulfuric acid market rocked by copper: Chemical &Engineering News, v. 77, no. 40, October 4, p. 13-16.
McMoRan Exploration Co., 2000, McMoRan Exploration Co. 1999 annualreport and form 10-K: New Orleans, LA, McMoRan Exploration Co., 55 p.
McMoRan Exploration Co., 2002, McMoRan Exploration Co. completes sale ofsulphur transportation & terminaling assets: New Orleans, LA, McMoRanExploration Co. news release, June 14, 1 p.
U.S. GEOLOGICAL SURVEY MINERALS YEARBOOK—200175.12
Moyse, B.M., 2000, Process, catalyst choices key to producing 30-ppm sulfurfuels: Oil & Gas Journal, no. 98.41, October 9, p. 72-74.
North American Sulphur Service, 2000a, News and developments: SulphurNewsletter, v. 11, no. 3, March, p. 2.
North American Sulphur Service, 2000b, News and developments: SulphurNewsletter, v. 11, no. 8, August, p. 2.
Oil & Gas Journal, 2000a, BP Amoco signs deal with FTC, acquires ARCO: Oil& Gas Journal, v. 98, no. 17, April 24, p. 26-27.
Oil & Gas Journal, 2000b, EPA issues rule limiting US gasoline sulfur: Oil &Gas Journal, v. 98, no. 1, January 3, p. 26-27.
Oil & Gas Journal, 2000c, Refinery completes revamp to accommodateVenezuelan crude: Oil & Gas Journal, no. 98.43, October 23, p. 50.
Oil & Gas Journal, 2001a, Dominion expands E&P portfolio with Louis Dreyfusdeal: Oil & Gas Journal, no. 99.39, September 24, p. 44-48.
Oil & Gas Journal, 2001b, Government developments: Oil & Gas Journal, no.99.1, January 1, p. 7.
PentaSul North America Sulphur Review, 2002, Canada: PentaSul NorthAmerica Sulphur Review, v. 13, no. 5, May, p. 5.
Phelps Dodge Corp., 1999, Phelps Dodge Morenci to convert all copperproduction into leaching—Will see unit cost reduction of 10 percent: Phoenix, AZ, Phelps Dodge Corp. news release, September 1, 2 p.
Phelps Dodge Mining Co., 2001, New Phelps Dodge Morenci mine-for-leachfacilities in production: Phoenix, AZ, Phelps Dodge Mining Co. pressrelease, May 14, 2 p.
Phillips Petroleum Co., 2001, Conoco and Phillips agree to a merger of equals:Tulsa, OK, Phillips Petroleum Co., press release, November 11, 5 p.
Sears, Gerry, 2000, According to plan: Sulphur, no. 268, May-June, p. 19-26.Shelton, J.E., 1978, Sulfur and pyrites: U.S. Bureau of Mines Minerals
Yearbook 1976, v. I, p. 1287-1307.Stell, Jeannie, 2001, 2001 worldwide refining survey: Oil & Gas Journal, no.
99.52, December 24, p. 74-124.Stevens, Jason, 1998, Oil sands projects gather pace: Sulphur, no. 254, January-
February, p. 27-30.Sulphur, 1999a, A bright spot on the horizon: Sulphur, no. 260, January-
February, p. 3.Sulphur, 1999b, Analyzers aid air quality program: Sulphur, no. 261, March-
April, p. 10.Sulphur, 2000a, JMPC cuts costs with Iraqi imports: Sulphur, no. 271,
November-December, p. 10, 11.Sulphur, 2000b, Koch in sulphur handling deal with Petrozuata: Sulphur, no.
270, September-October, p. 14.Sulphur, 2000c, Quote of the year?: Sulphur, no. 270, September-October, p. 3.Sulphur, 2001a, Alberta regulator eases emissions timetable for older sour gas
plants: Sulphur, no. 277, November-December, p. 12.Sulphur, 2001b, Altonorte almost set to treble acid output: Sulphur, no. 275,
July-August, p. 18.Sulphur, 2001c, Biodesulfurisation—A serious contender for H2S removal:
Sulphur, no. 276, September-October, p. 31-38.Sulphur, 2001d, Burning question at Europe’s biggest acid plant: Sulphur, no.
274, September-October, p. 45-47.Sulphur, 2001e, Bwana Mkubwa acid plant to expand for direct oxide feed:
Sulphur, no. 276, September-October, p. 15-16.Sulphur, 2001f, Codelco acid takes to the rails: Sulphur, no. 274, May-June,
p. 12.Sulphur, 2001g, Codelco aims to make acid leach more profitable: Sulphur, no.
276, September-October, p. 13.Sulphur, 2001h, EPA to set targets for marine pollution: Sulphur, no. 273,
March-April, p. 12.Sulphur, 2001i, Fourth Orinoco heavy crude project wins cash go-ahead:
Sulphur, no. 276, September-October, p. 15.Sulphur, 2001j, Jose upgrader due on stream: Sulphur, no. 272, January-
February, p. 18.Sulphur, 2001k, Lurgi takes contract for Altonorte acid plant: Sulphur, no 276,
September-October, p. 12.Sulphur, 2001l, News in brief: Sulphur, no. 275, July-August, p. 11.Sulphur, 2001m, News in brief: Sulphur, no. 276, September-October, p. 12.Sulphur, 2001n, New supplies: Sulphur, no. 273, March-April, p. 6.Sulphur, 2001o, Norwegians pay for Russian acid recovery: Sulphur, no. 14,
September-October, p. 14.Sulphur, 2001p, Oilsands leader takes direct route to sulphur fertilizer output:
Sulphur, v. 275, July-August, p. 11-12.
Sulphur, 2001q, Poland’s leading sulphur mine forced to close: Sulphur, no.277, November-December, p. 13-14.
Sulphur, 2001r, Refinery slashes sulphur level in bunkers: Sulphur, no. 273,March-April, p. 12.
Sulphur, 2001s, Rising profile: Sulphur, no. 273, March-April, p. 17-19.Sulphur, 2001t, SNC to build pyrites roaster: Sulphur, no. 275, July-August,
p. 18.Sulphur, 2001u, Syncrude poised to double output: Sulphur, no. 273, March-
April, p. 9-10.Sulphur, 2001v, TCO makes plans for sulphur forming market: Sulphur, no.
275, July-August, p. 14.Sulphur, 2001w, Three refiners ask for time out: Sulphur, no. 274, May-June,
p. 30-31.Sulphur, 2002a, EC plans deadline for no-sulphur fuels: Sulphur, no. 278,
January-February, p. 10.Sulphur, 2002b, Market summit in Marrakesh: Sulphur, no. 278, January-
February, p. 15-21.Sulphur, 2002c, New law to affect sour oil projects: Sulphur, no. 278, January-
February, p. 12. Sulphur, 2002d, Processing slated for giant field’s output: Sulphur, no. 278,
January-February, p. 11-12.U.S. Census Bureau, 2001a, Inorganic fertilizer materials and related products—
First quarter 2001 [MQ325B(01)-1]: U.S. Census Bureau, June, 6 p.
U.S. Census Bureau, 2001b, Inorganic fertilizer materials and related products—Second quarter 2001 [MQ325B(01)-2]: U.S. Census Bureau, September, 6 p.
U.S. Census Bureau, 2002a, Inorganic fertilizer materials and related products—Fourth quarter 2001 [MQ325B(01)-4]: U.S. Census Bureau, March, 6 p.
U.S. Census Bureau, 2002b, Inorganic fertilizer materials and related products—Third quarter 2001 [MQ325B(01)-3]: U.S. Census Bureau, January, 6 p.
Valero Energy Corp., 2001, Valero signs consent decree with Federal TradeCommission staff: San Antonio, TX, Valero Energy Corp. news release,December 3, 3 p.
Wilkinson, Dick, 2001, Logistics for U.S. sulphur supply, in InternationalFertilizer Industry Association Production and International TradeConference, Quebec City, Quebec, Canada, September 13-14, 2001,Proceedings: Paris, France, International Fertilizer Industry Association, 18 p.
SOURCES OF INFORMATION
U.S. Geological Survey Publications
Sulfur. Ch. in Mineral Commodity Summaries, annual.Sulfur. Ch. in United States Mineral Resources, Professional
Paper 820, 1973.Sulfur. Mineral Industry Surveys, monthly.
Other
Chemical and Engineering News, weekly.Chemical Engineering, weekly.Chemical Market Reporter, weekly.Chemical Week, weekly.European Chemical News, weekly.Fertilizer International, monthly.Fertilizer Markets, weekly.Green Markets, weekly.Industrial Minerals, monthly.Oil & Gas Journal, weekly.PentaSul North America Sulphur Review, monthly.Phosphorus & Potassium, bimonthly.Sulfur. Ch. in Mineral Facts and Problems, U.S. Bureau of
Mines Bulletin 675, 1985.Sulphur, bimonthly.

TABLE 1SALIENT SULFUR STATISTICS 1/
(Thousand metric tons, sulfur content, and thousand dollars unless otherwise specified)
1997 1998 1999 2000 2001 United States: Production: Frasch 2,820 e/ 1,800 e/ 1,780 e/ 900 e/ -- Recovered 2/ 7,650 8,220 8,220 8,380 8,270 Other 1,550 1,610 1,320 1,030 982 Total e/ 12,000 11,600 11,300 10,300 9,250 Shipments: Frasch W W W W -- Recovered 2/ 10,400 3/ 10,500 3/ 9,800 3/ 9,500 3/ 8,250 Other 1,550 1,610 1,320 1,030 982 Total e/ 11,900 12,100 11,100 10,500 9,240 Exports: Elemental 4/ 703 889 685 762 675 Sulfuric acid 39 51 51 62 69 Imports: Elemental 2,060 2,270 2,580 2,330 1,730 Sulfuric acid 659 668 447 463 462 Consumption, all forms 13,900 14,100 13,400 12,500 10,700 Stocks, December 31, producer, Frash and recovered 761 283 451 208 232 Value: Shipments, free on board (f.o.b.) mine or plant: Frasch W W W W -- Recovered 2/ 3/ $375,000 $306,000 $371,000 $239,000 $82,900 e/ Other $98,100 $77,100 $66,400 $55,100 $49,500 Total $473,000 $383,000 $437,000 $295,000 $132,000 Exports, elemental 5/ $36,000 $35,400 $35,800 $53,700 $48,800 Imports, elemental $64,900 $58,400 $51,600 $39,400 $22,100 Price, elemental, f.o.b. dollars per metric ton mine or plant $36.06 $29.14 $37.81 $24.73 $10.11 e/World, production, all forms (including pyrites) 56,900 r/ 57,200 r/ 57,800 r/ 58,100 e/ 57,300 e/e/ Estimated. r/ Revised. W Withheld to avoid disclosing company proprietary data; included with "Recovered." -- Zero.1/ Data are rounded to no more than three significant digits, except prices; may not add to totals shown.2/ Includes U.S. Virgin Islands.3/ Includes corresponding Frasch sulfur data.4/ Includes exports from the U.S. Virgin Islands to foreign countries.5/ Includes value of exports from the U.S. Virgin Islands to foreign countries.
TABLE 2RECOVERED SULFUR PRODUCED AND SHIPPED IN THE UNITED STATES, BY STATE 1/
(Thousand metric tons and thousand dollars)
2000 2001Shipments Shipments
State Production Quantity Value Production Quantity Value e/Alabama 320 321 7,970 304 301 2,240California 1,150 1,140 5,660 963 951 2,280Illinois 444 444 5,900 436 437 837Louisiana 1,070 2,180 2/ W 1,100 1,100 12,800Michigan and Minnesota 34 34 483 35 36 176Mississippi 525 533 20,100 559 551 22,200New Mexico 48 48 (3/) 49 49 (3/) North Dakota 50 50 (3/) 56 56 (3/) Ohio 112 111 2,210 112 113 554Texas 2,760 2,770 80,300 2/ 2,740 2,740 36,700Washington 113 110 27 102 102 (3/) Wyoming 1,030 1,030 16,900 1,110 1,120 6,590Other 4/ 717 730 99,800 699 694 (1,480) Total 8,380 9,500 239,000 8,270 8,250 82,900See footnotes at end of table.
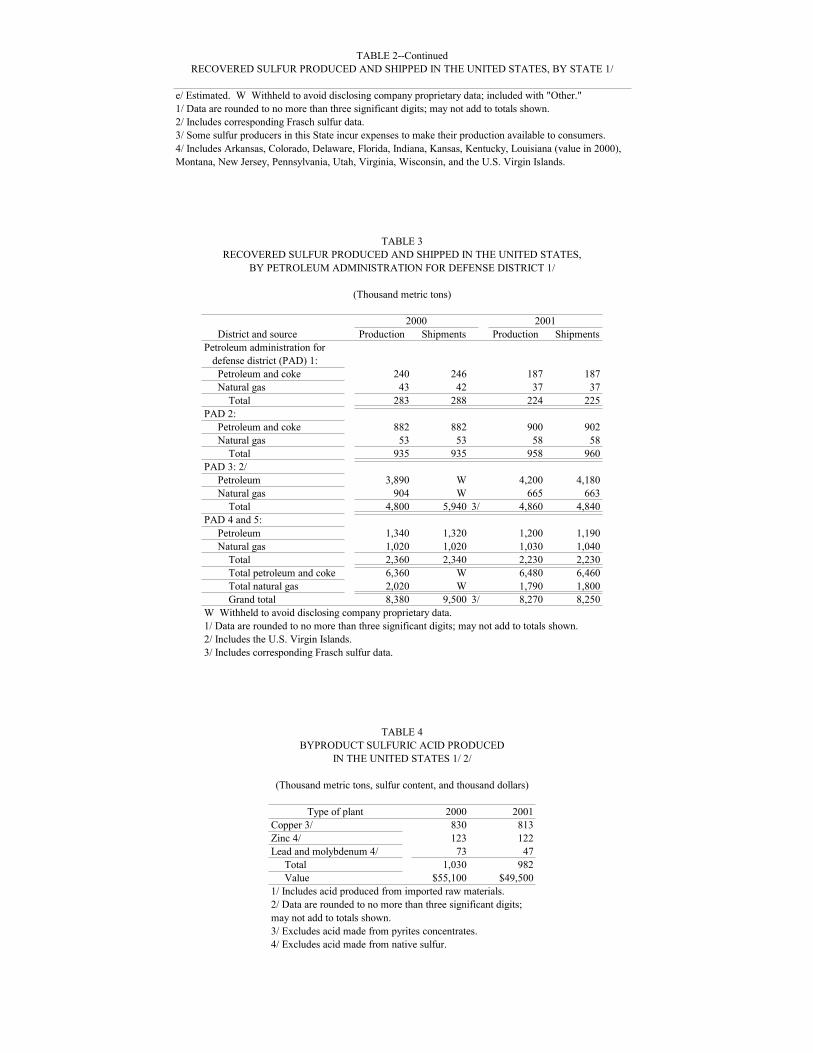
TABLE 2--ContinuedRECOVERED SULFUR PRODUCED AND SHIPPED IN THE UNITED STATES, BY STATE 1/
e/ Estimated. W Withheld to avoid disclosing company proprietary data; included with "Other."1/ Data are rounded to no more than three significant digits; may not add to totals shown. 2/ Includes corresponding Frasch sulfur data.3/ Some sulfur producers in this State incur expenses to make their production available to consumers.4/ Includes Arkansas, Colorado, Delaware, Florida, Indiana, Kansas, Kentucky, Louisiana (value in 2000),Montana, New Jersey, Pennsylvania, Utah, Virginia, Wisconsin, and the U.S. Virgin Islands.
TABLE 3RECOVERED SULFUR PRODUCED AND SHIPPED IN THE UNITED STATES,
BY PETROLEUM ADMINISTRATION FOR DEFENSE DISTRICT 1/
(Thousand metric tons)
2000 2001 District and source Production Shipments Production Shipments Petroleum administration for defense district (PAD) 1: Petroleum and coke 240 246 187 187 Natural gas 43 42 37 37 Total 283 288 224 225PAD 2: Petroleum and coke 882 882 900 902 Natural gas 53 53 58 58 Total 935 935 958 960PAD 3: 2/ Petroleum 3,890 W 4,200 4,180 Natural gas 904 W 665 663 Total 4,800 5,940 3/ 4,860 4,840PAD 4 and 5: Petroleum 1,340 1,320 1,200 1,190 Natural gas 1,020 1,020 1,030 1,040 Total 2,360 2,340 2,230 2,230 Total petroleum and coke 6,360 W 6,480 6,460 Total natural gas 2,020 W 1,790 1,800 Grand total 8,380 9,500 3/ 8,270 8,250W Withheld to avoid disclosing company proprietary data.1/ Data are rounded to no more than three significant digits; may not add to totals shown. 2/ Includes the U.S. Virgin Islands.3/ Includes corresponding Frasch sulfur data.
TABLE 4BYPRODUCT SULFURIC ACID PRODUCED
IN THE UNITED STATES 1/ 2/
(Thousand metric tons, sulfur content, and thousand dollars)
Type of plant 2000 2001Copper 3/ 830 813Zinc 4/ 123 122Lead and molybdenum 4/ 73 47 Total 1,030 982 Value $55,100 $49,5001/ Includes acid produced from imported raw materials.2/ Data are rounded to no more than three significant digits;may not add to totals shown.3/ Excludes acid made from pyrites concentrates.4/ Excludes acid made from native sulfur.
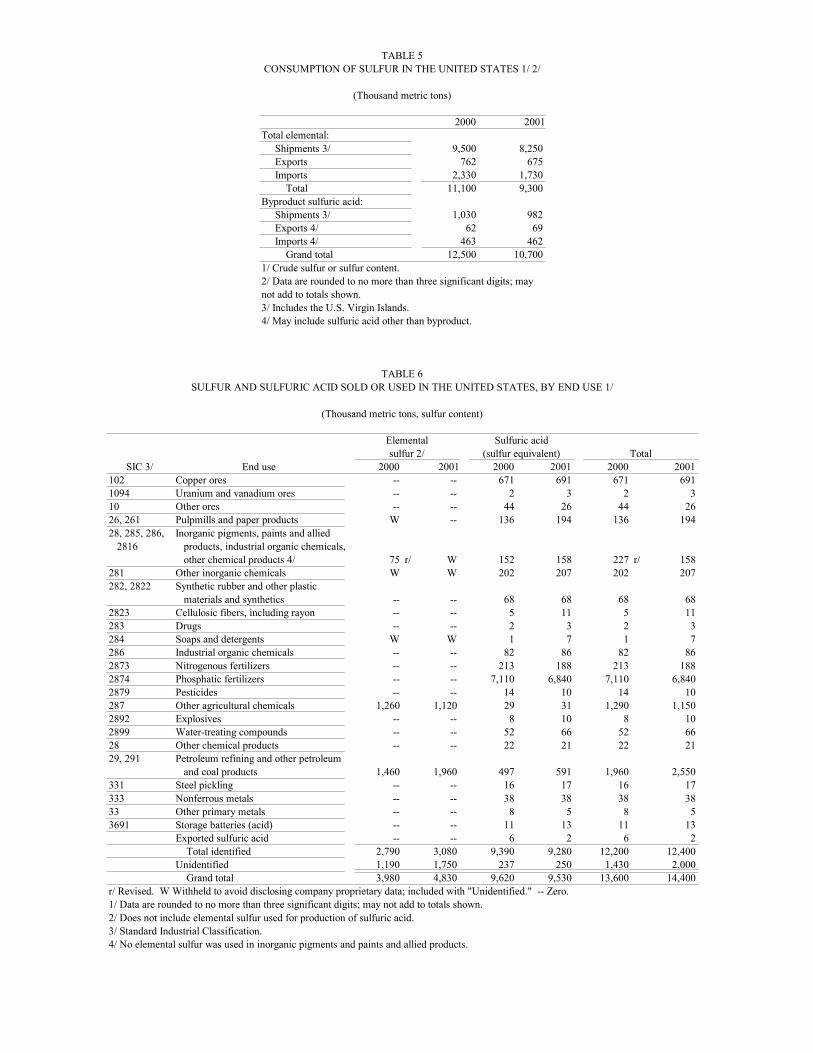
TABLE 5CONSUMPTION OF SULFUR IN THE UNITED STATES 1/ 2/
(Thousand metric tons)
2000 2001Total elemental: Shipments 3/ 9,500 8,250 Exports 762 675 Imports 2,330 1,730 Total 11,100 9,300Byproduct sulfuric acid: Shipments 3/ 1,030 982 Exports 4/ 62 69 Imports 4/ 463 462 Grand total 12,500 10,7001/ Crude sulfur or sulfur content.2/ Data are rounded to no more than three significant digits; maynot add to totals shown. 3/ Includes the U.S. Virgin Islands.4/ May include sulfuric acid other than byproduct.
TABLE 6SULFUR AND SULFURIC ACID SOLD OR USED IN THE UNITED STATES, BY END USE 1/
(Thousand metric tons, sulfur content)
Elemental Sulfuric acidsulfur 2/ (sulfur equivalent) Total
SIC 3/ End use 2000 2001 2000 2001 2000 2001 102 Copper ores -- -- 671 691 671 6911094 Uranium and vanadium ores -- -- 2 3 2 310 Other ores -- -- 44 26 44 2626, 261 Pulpmills and paper products W -- 136 194 136 19428, 285, 286, Inorganic pigments, paints and allied 2816 products, industrial organic chemicals,
other chemical products 4/ 75 r/ W 152 158 227 r/ 158281 Other inorganic chemicals W W 202 207 202 207282, 2822 Synthetic rubber and other plastic
materials and synthetics -- -- 68 68 68 682823 Cellulosic fibers, including rayon -- -- 5 11 5 11283 Drugs -- -- 2 3 2 3284 Soaps and detergents W W 1 7 1 7286 Industrial organic chemicals -- -- 82 86 82 862873 Nitrogenous fertilizers -- -- 213 188 213 1882874 Phosphatic fertilizers -- -- 7,110 6,840 7,110 6,8402879 Pesticides -- -- 14 10 14 10287 Other agricultural chemicals 1,260 1,120 29 31 1,290 1,1502892 Explosives -- -- 8 10 8 102899 Water-treating compounds -- -- 52 66 52 6628 Other chemical products -- -- 22 21 22 2129, 291 Petroleum refining and other petroleum
and coal products 1,460 1,960 497 591 1,960 2,550331 Steel pickling -- -- 16 17 16 17333 Nonferrous metals -- -- 38 38 38 3833 Other primary metals -- -- 8 5 8 53691 Storage batteries (acid) -- -- 11 13 11 13
Exported sulfuric acid -- -- 6 2 6 2 Total identified 2,790 3,080 9,390 9,280 12,200 12,400Unidentified 1,190 1,750 237 250 1,430 2,000 Grand total 3,980 4,830 9,620 9,530 13,600 14,400
r/ Revised. W Withheld to avoid disclosing company proprietary data; included with "Unidentified." -- Zero.1/ Data are rounded to no more than three significant digits; may not add to totals shown. 2/ Does not include elemental sulfur used for production of sulfuric acid.3/ Standard Industrial Classification.4/ No elemental sulfur was used in inorganic pigments and paints and allied products.

TABLE 7U.S. EXPORTS OF ELEMENTAL SULFUR, BY COUNTRY 1/ 2/
(Thousand metric tons and thousand dollars)
2000 2001Country Quantity Value Quantity Value
Australia (3/) 6 (3/) 152Brazil 115 3,780 179 4,570Canada 46 5,300 52 5,740Korea, Republic of 5 6,860 9 6,920Mexico 178 13,100 155 7,120Morocco 210 6,040 75 3,390Senegal 126 5,910 66 2,320Other 82 12,700 r/ 139 18,600 Total 762 53,700 675 48,800r/ Revised.1/ Includes exports from the U.S. Virgin Islands.2/ Data are rounded to no more than three significant digits; may notadd to totals shown.3/ Less than 1/2 unit.
Source: U.S. Census Bureau.
TABLE 8U.S. EXPORTS OF SULFURIC ACID (100% H2SO4), BY COUNTRY 1/
2000 2001Quantity Value Quantity Value
Country (metric tons) (thousands) (metric tons) (thousands)Canada 154,000 $7,890 159,000 $8,380China 5,080 1,240 788 837Dominican Republic 2,760 318 531 95Israel 349 469 2,630 818Japan 2,130 324 115 159Korea, Republic of 45 44 59 153Mexico 3,850 589 3,240 490Netherlands 658 104 2 9Netherlands Antilles -- -- 67 63Panama 22 13 -- -- Saudi Arabia 430 774 2,210 778Singapore 777 594 241 207Taiwan 950 422 485 297Trinidad and Tobago 4,120 347 6,280 565United Kingdom 880 99 1,860 115Venezuela 787 90 3 9Other 13,300 2,470 31,900 2,960 Total 191,000 15,800 210,000 15,900-- Zero.1/ Data are rounded to no more than three significant digits; may not add to totals shown.
Source: U.S. Census Bureau.
TABLE 9U.S. IMPORTS OF ELEMENTAL SULFUR, BY COUNTRY 1/
(Thousand metric tons and thousand dollars)
2000 2001Country Quantity Value 2/ Quantity Value 2/
Canada 1,690 10,900 1,210 7,060Mexico 489 19,200 359 8,400Other 151 9,300 161 6,600 Total 2,330 39,400 1,730 22,1001/ Data are rounded to no more than three significant digits; may not add to totals shown.2/ Declared customs valuation.
Source: U.S. Census Bureau, as adjusted by the U.S. Geological Survey.
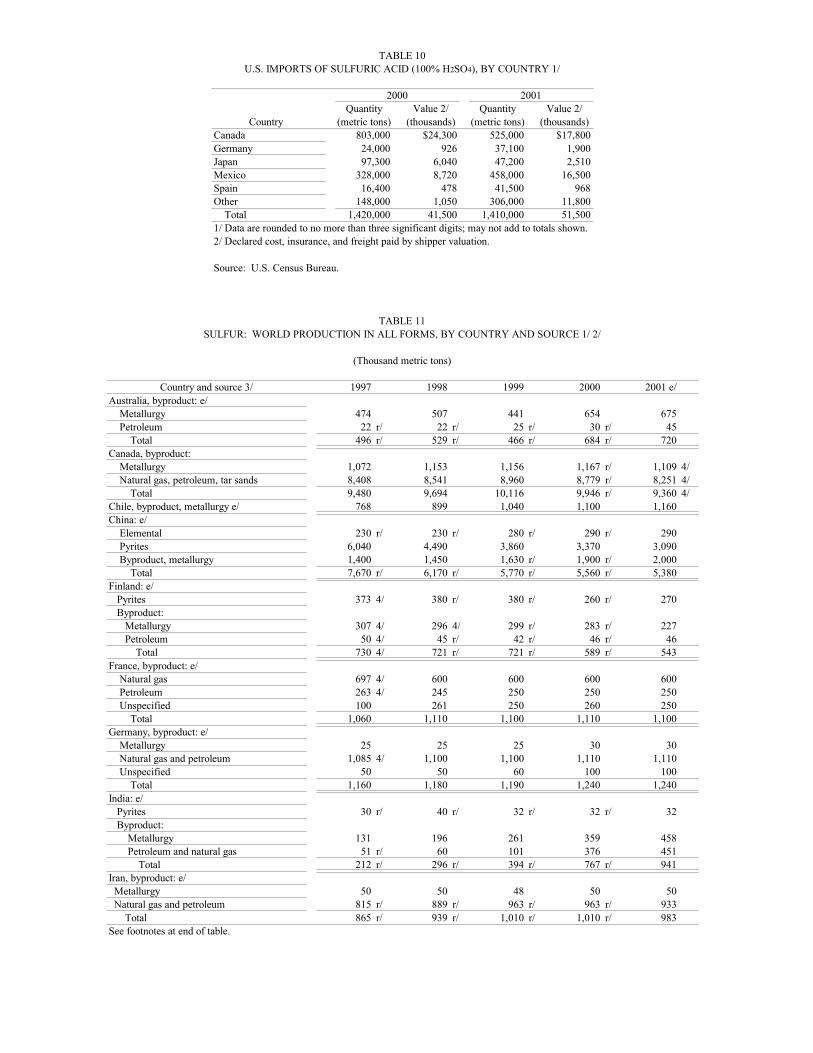
TABLE 10U.S. IMPORTS OF SULFURIC ACID (100% H2SO4), BY COUNTRY 1/
2000 2001Quantity Value 2/ Quantity Value 2/
Country (metric tons) (thousands) (metric tons) (thousands)Canada 803,000 $24,300 525,000 $17,800Germany 24,000 926 37,100 1,900Japan 97,300 6,040 47,200 2,510Mexico 328,000 8,720 458,000 16,500Spain 16,400 478 41,500 968Other 148,000 1,050 306,000 11,800 Total 1,420,000 41,500 1,410,000 51,5001/ Data are rounded to no more than three significant digits; may not add to totals shown. 2/ Declared cost, insurance, and freight paid by shipper valuation.
Source: U.S. Census Bureau.
TABLE 11SULFUR: WORLD PRODUCTION IN ALL FORMS, BY COUNTRY AND SOURCE 1/ 2/
(Thousand metric tons)
Country and source 3/ 1997 1998 1999 2000 2001 e/Australia, byproduct: e/ Metallurgy 474 507 441 654 675 Petroleum 22 r/ 22 r/ 25 r/ 30 r/ 45 Total 496 r/ 529 r/ 466 r/ 684 r/ 720Canada, byproduct: Metallurgy 1,072 1,153 1,156 1,167 r/ 1,109 4/ Natural gas, petroleum, tar sands 8,408 8,541 8,960 8,779 r/ 8,251 4/ Total 9,480 9,694 10,116 9,946 r/ 9,360 4/Chile, byproduct, metallurgy e/ 768 899 1,040 1,100 1,160China: e/ Elemental 230 r/ 230 r/ 280 r/ 290 r/ 290 Pyrites 6,040 4,490 3,860 3,370 3,090 Byproduct, metallurgy 1,400 1,450 1,630 r/ 1,900 r/ 2,000 Total 7,670 r/ 6,170 r/ 5,770 r/ 5,560 r/ 5,380Finland: e/ Pyrites 373 4/ 380 r/ 380 r/ 260 r/ 270 Byproduct: Metallurgy 307 4/ 296 4/ 299 r/ 283 r/ 227 Petroleum 50 4/ 45 r/ 42 r/ 46 r/ 46 Total 730 4/ 721 r/ 721 r/ 589 r/ 543France, byproduct: e/ Natural gas 697 4/ 600 600 600 600 Petroleum 263 4/ 245 250 250 250 Unspecified 100 261 250 260 250 Total 1,060 1,110 1,100 1,110 1,100Germany, byproduct: e/ Metallurgy 25 25 25 30 30 Natural gas and petroleum 1,085 4/ 1,100 1,100 1,110 1,110 Unspecified 50 50 60 100 100 Total 1,160 1,180 1,190 1,240 1,240India: e/ Pyrites 30 r/ 40 r/ 32 r/ 32 r/ 32 Byproduct: Metallurgy 131 196 261 359 458 Petroleum and natural gas 51 r/ 60 101 376 451 Total 212 r/ 296 r/ 394 r/ 767 r/ 941Iran, byproduct: e/ Metallurgy 50 50 48 50 50 Natural gas and petroleum 815 r/ 889 r/ 963 r/ 963 r/ 933 Total 865 r/ 939 r/ 1,010 r/ 1,010 r/ 983See footnotes at end of table.
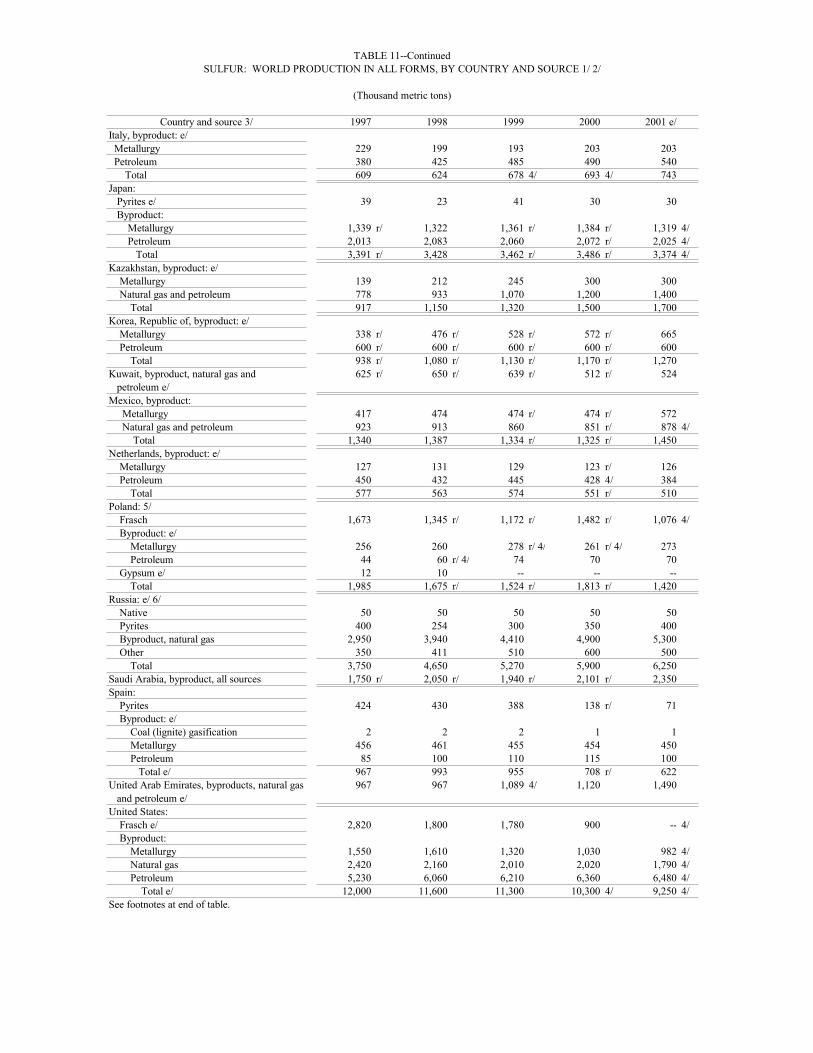
TABLE 11--ContinuedSULFUR: WORLD PRODUCTION IN ALL FORMS, BY COUNTRY AND SOURCE 1/ 2/
(Thousand metric tons)
Country and source 3/ 1997 1998 1999 2000 2001 e/Italy, byproduct: e/ Metallurgy 229 199 193 203 203 Petroleum 380 425 485 490 540 Total 609 624 678 4/ 693 4/ 743Japan: Pyrites e/ 39 23 41 30 30 Byproduct: Metallurgy 1,339 r/ 1,322 1,361 r/ 1,384 r/ 1,319 4/ Petroleum 2,013 2,083 2,060 2,072 r/ 2,025 4/ Total 3,391 r/ 3,428 3,462 r/ 3,486 r/ 3,374 4/Kazakhstan, byproduct: e/ Metallurgy 139 212 245 300 300 Natural gas and petroleum 778 933 1,070 1,200 1,400 Total 917 1,150 1,320 1,500 1,700Korea, Republic of, byproduct: e/ Metallurgy 338 r/ 476 r/ 528 r/ 572 r/ 665 Petroleum 600 r/ 600 r/ 600 r/ 600 r/ 600 Total 938 r/ 1,080 r/ 1,130 r/ 1,170 r/ 1,270Kuwait, byproduct, natural gas and 625 r/ 650 r/ 639 r/ 512 r/ 524 petroleum e/Mexico, byproduct: Metallurgy 417 474 474 r/ 474 r/ 572 Natural gas and petroleum 923 913 860 851 r/ 878 4/ Total 1,340 1,387 1,334 r/ 1,325 r/ 1,450Netherlands, byproduct: e/ Metallurgy 127 131 129 123 r/ 126 Petroleum 450 432 445 428 4/ 384 Total 577 563 574 551 r/ 510Poland: 5/ Frasch 1,673 1,345 r/ 1,172 r/ 1,482 r/ 1,076 4/ Byproduct: e/ Metallurgy 256 260 278 r/ 4/ 261 r/ 4/ 273 Petroleum 44 60 r/ 4/ 74 70 70 Gypsum e/ 12 10 -- -- -- Total 1,985 1,675 r/ 1,524 r/ 1,813 r/ 1,420Russia: e/ 6/ Native 50 50 50 50 50 Pyrites 400 254 300 350 400 Byproduct, natural gas 2,950 3,940 4,410 4,900 5,300 Other 350 411 510 600 500 Total 3,750 4,650 5,270 5,900 6,250Saudi Arabia, byproduct, all sources 1,750 r/ 2,050 r/ 1,940 r/ 2,101 r/ 2,350Spain: Pyrites 424 430 388 138 r/ 71 Byproduct: e/ Coal (lignite) gasification 2 2 2 1 1 Metallurgy 456 461 455 454 450 Petroleum 85 100 110 115 100 Total e/ 967 993 955 708 r/ 622United Arab Emirates, byproducts, natural gas 967 967 1,089 4/ 1,120 1,490 and petroleum e/United States: Frasch e/ 2,820 1,800 1,780 900 -- 4/ Byproduct: Metallurgy 1,550 1,610 1,320 1,030 982 4/ Natural gas 2,420 2,160 2,010 2,020 1,790 4/ Petroleum 5,230 6,060 6,210 6,360 6,480 4/ Total e/ 12,000 11,600 11,300 10,300 4/ 9,250 4/See footnotes at end of table.

TABLE 11--ContinuedSULFUR: WORLD PRODUCTION IN ALL FORMS, BY COUNTRY AND SOURCE 1/ 2/
(Thousand metric tons)
Country and source 3/ 1997 1998 1999 2000 2001 e/Other: e/ 7/ Frasch 270 r/ 275 r/ 273 r/ 249 r/ 249 Native 171 r/ 163 r/ 146 r/ 148 r/ 148 Pyrites 460 r/ 345 r/ 349 r/ 295 r/ 315 Byproduct: Metallurgy 833 r/ 937 r/ 907 r/ 950 r/ 1,050 Natural gas 130 206 215 215 r/ 210 Natural gas, petroleum, tar sands, 747 r/ 886 r/ 875 r/ 869 r/ 886 undifferentiated Petroleum 981 r/ 878 r/ 825 r/ 889 r/ 833 Unspecified 1,230 r/ 1,290 r/ 1,270 r/ 1,370 r/ 1,390 Total 4,820 r/ 4,980 r/ 4,860 r/ 4,990 r/ 5,070Grand total 56,900 r/ 57,200 r/ 57,800 r/ 58,100 r/ 57,300 Of which: Frasch 4,510 3,170 r/ 2,980 r/ 2,410 r/ 1,100 Native 8/ 701 r/ 693 r/ 726 r/ 713 r/ 713 Pyrites 7,770 r/ 5,960 r/ 5,350 r/ 4,480 r/ 4,210 Byproduct: Coal (lignite) gasification e/ 2 2 2 1 1 Metallurgy 9,910 r/ 10,700 r/ 10,800 r/ 11,300 r/ 11,600 Natural gas 6,200 6,900 7,230 7,740 r/ 7,900 Natural gas, petroleum, tar sands, 14,400 r/ 14,900 r/ 15,700 r/ 15,800 r/ 15,900 undifferentiated Petroleum 9,960 r/ 10,800 r/ 11,000 r/ 11,200 r/ 11,200 Unspecified 3,480 r/ 4,060 r/ 4,029 r/ 4,430 r/ 4,590 Gypsum e/ 12 10 -- -- --e/ Estimated. r/ Revised. -- Zero.1/ World totals, U.S. data, and estimated data are rounded to no more than three significant digits; may not add to totals shown.2/ Table includes data available through July 22, 2002.3/ The term "Source" reflects the means of collecting sulfur and the type of raw material. Sources listed include the following: Fraschrecovery; native, comprising all production of elemental sulfur by traditional mining methods (thereby excluding Frasch); pyrites (whetheror not the sulfur is recovered in the elemental form or as acid); byproduct recovery, either as elemental sulfur or as sulfur compoundsfrom coal gasification, metallurgical operations including associated coal processing, crude oil and natural gas extraction, petroleumrefining, tar sand cleaning, and processing of spent oxide from stack-gas scrubbers; and recovery from the processing mined gypsum.Recovery of sulfur in the form of sulfuric acid from artificial gypsum produced as a byproduct of phosphatic fertilizer production isexcluded because to include it would result in double counting. Production of Frasch sulfur, other native sulfur, pyrite-derived sulfur,mined gypsum-derived sulfur, byproduct sulfur from extraction of crude oil and natural gas, and recovery from tar sands are all creditedto the country of origin of the extracted raw materials. In contrast, byproduct recovery from metallurgical operations, petroleumrefineries, and spent oxides are credited to the nation where the recovery takes place, which is not the original source country of the crudeproduct from which the sulfur is extracted.4/ Reported figure.5/ Official Polish sources report total Frasch and native mined elemental sulfur output annually, undifferentiated; this figure has beendivided between Frasch and other native sulfur on the basis of information obtained from supplementary sources.6/ Sulfur is believed to be produced from Frasch and as a petroleum byproduct; however, information is inadequate to formulate estimates.7/ Includes all countries, except the above mentioned, as follows: Australia, Canada, Chile, China, Finland, France, Germany, India, Iran,Italy, Japan, Kazakhstan, Republic of Korea, Kuwait, Mexico, Netherlands, Poland, Russia, Saudi Arabia, Spain, United Arab Emirates, andUnited States.8/ Includes "China, elemental."

FIGURE 1TRENDS IN THE SULFURE INDUSTRY IN THE UNITED STATES
0
2
4
6
8
10
12
14
16
1981 1982 1983 1984 1985 1986 1987 1988 1989 1990 1991 1992 1993 1994 1995 1996 1997 1998 1999 2000 2001
MIL
LIO
N M
ETR
IC T
ON
S
ProductionStocksExportsImportsConsumption
0
50
100
150
200
250
1981 1982 1983 1984 1985 1986 1987 1988 1989 1990 1991 1992 1993 1994 1995 1996 1997 1998 1999 2000 2001
PRIC
E, D
OLL
AR
S PE
R M
ETR
IC T
ON
Actual pricesBased on constant 2001 dollars
Based on the average reported values for elemental sulfur (Frasch and recovered), free on board mine and/or plant, these prices reflect about 90% of the shipments of sulfur in all forms from 1981 through 2001.
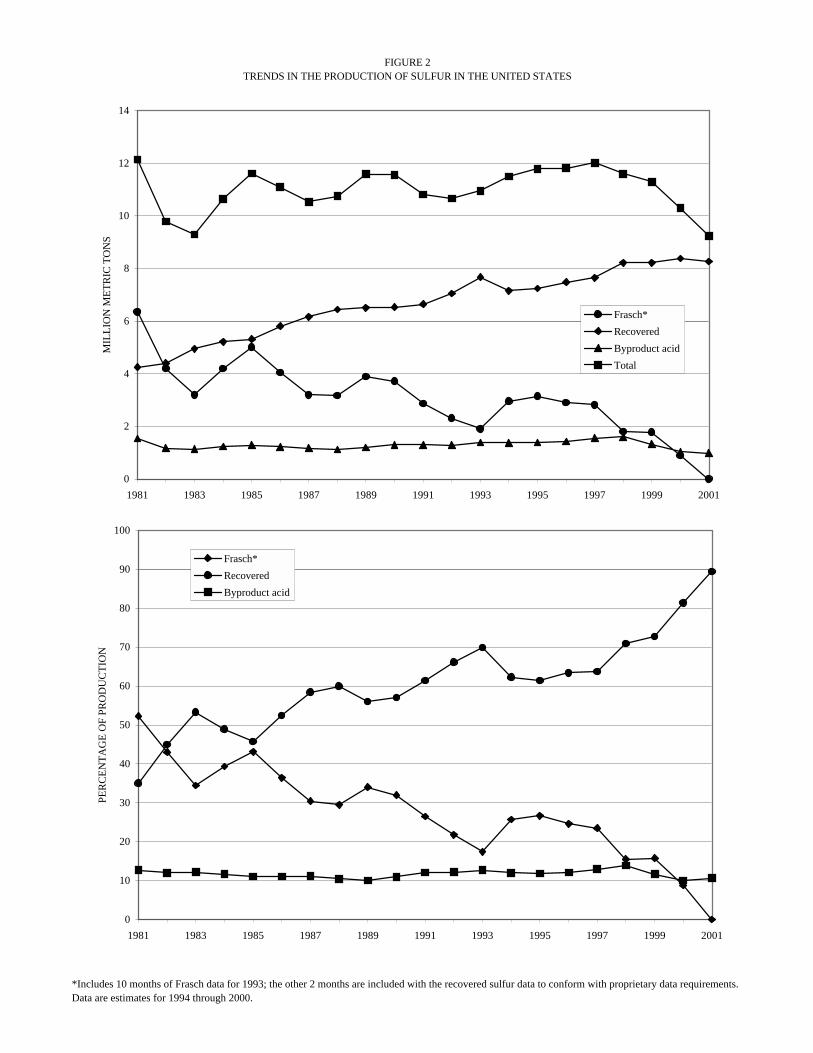
FIGURE 2TRENDS IN THE PRODUCTION OF SULFUR IN THE UNITED STATES
0
2
4
6
8
10
12
14
1981 1983 1985 1987 1989 1991 1993 1995 1997 1999 2001
MIL
LIO
N M
ETR
IC T
ON
S
Frasch*RecoveredByproduct acidTotal
0
10
20
30
40
50
60
70
80
90
100
1981 1983 1985 1987 1989 1991 1993 1995 1997 1999 2001
PER
CEN
TAG
E O
F PR
OD
UC
TIO
N
Frasch*RecoveredByproduct acid
*Includes 10 months of Frasch data for 1993; the other 2 months are included with the recovered sulfur data to conform with proprietary data requirements. Data are estimates for 1994 through 2000.