by order of the air force manual 65-506...
TRANSCRIPT

BY ORDER OF THE
SECRETARY OF THE AIR FORCE
AIR FORCE MANUAL 65-506
29 AUGUST 2011
Financial Management
ECONOMIC ANALYSIS
COMPLIANCE WITH THIS PUBLICATION IS MANDATORY
ACCESSIBILITY: Publications and forms are available for downloading or ordering on the e-
Publishing website at www.e-Publishing.af.mil
RELEASABILITY: There are no releasability restrictions on this publication.
OPR: SAF/FMCEE
Supersedes: AFMAN65-506,
10 November 2004.
Certified by: SAF/FMC
(Mr. Richard K. Hartley)
Pages: 91
This Instruction implements AFI 65-501, Economic Analysis, by providing information on
conducting economic analysis (EA) to support Air Force management decisions. Ensure that all
records created as a result of processes prescribed in this publication are maintained in
accordance with AFMAN 33-363, Management of Records, and disposed of in accordance with
the Air Force Records Disposition Schedule (RDS) located at
https://www.my.af.mil/afrims/afrims/afrims/rims.cfm. Refer recommended changes and
questions about this publication to the Office of Primary Responsibility (OPR) using AF Form
847, Recommendation for Change of Publication; route AF Form 847s from the field through the
appropriate functional’s chain of command. This publication may be supplemented at any level,
but all direct Supplements must be routed to the OPR of this publication for coordination prior to
certification and approval. The use of the name or mark of any specific manufacturer,
commercial product, commodity, or service in this publication does not imply endorsement by
the Air Force.
This publication applies to Air Force Reserve Command and Air National Guard units.
SUMMARY OF CHANGES
This document is substantially changed and must be reviewed in its entirety. This manual is
entirely restructured. Chapters 2 through 6 essentially follow the format of an Economic
Analysis, and give more in-depth guidance in performing an EA. Many chapters and
attachments are re-numbered, as many new ones are added, and a few either deleted entirely or
removed and combined with the main body of the AFMAN. Includes a mandatory Summary of

2 AFMAN65-506 29 AUGUST 2011
Analysis Results table that must be included in an EA’s Executive Summary. Includes a
requirement that every EA must have a Certificate of Satisfactory Economic Analysis. Repeats
guidance in AFI 65-501 regarding what the FM and functional offices each certify to when they
certify an EA. States that FM is now solely responsible for determining the recommendation in
an EA. Requires the FM office to provide its rationale in writing in the EA when they do not
recommend the lowest-cost alternative. Includes a new paragraph outlining the required parts of
an EA, to include documentation. Renames the Recommendation section to Comparison of
Alternatives and Recommendation, explicitly requiring the results of the cost, benefit and
sensitivity analyses to be compared and analyzed. Includes a new Chapter titled Objective,
Assumptions, Alternatives, which covers these items in more detail. States that no costs or
benefits should be excluded or included in an EA solely on the basis of an unjustified
assumption. Requires that if non-monetary costs or opportunity costs are included in the Cost
Analysis section of the EA, each must be explicitly identified as such in the Assumptions
section. Includes a new and separate chapter on Cost Analysis. Explains several different types
of costs. Clarifies that a Common Cost is one that is identical, in terms of both amount and
timing, in all alternatives. To be more consistent with OSD guidance (DoDI 7041.3), changes
previous guidance to state that such costs may be excluded from an EA unless there is a
requirement to show such costs, and that when this is done, it must be so stated as an
Assumption. For costs incurred in foreign currency, it states that costs must be converted at the
known or estimated exchange rate of the base year of the analysis, NOT the Foreign Currency
Fluctuation Account (FCFA) or “budget” rate. Explains why and, at a simple level, how the
FCFA works. Expands on the explanation of Discount Rates and two of the different discount
factors that are derived from them. Includes three new tables showing examples of how interest
rates work, how discount rates work, and how to apply discount factors to calculate net present
value (NPV). Includes a restructured paragraph discussing Salvage Value, Residual Value, and
Terminal Value, and how they’re handled in an EA. Includes a new and separate chapter on
Benefit Analysis, greatly expanding the guidance on this part of an EA, including discussion of
types of benefits and how they can be analyzed. Includes a new table which shows a Sample
Benefit Matrix. Includes a new and separate chapter on Sensitivity Analysis, providing
expanded guidance and explanation of this part of an EA. Explains the differences between
uncertainty, risk, and sensitivity. Explains when a recommendation is sensitive to particular
uncertainties and when it is not. Explains the limitations of Sensitivity Analysis, and the reasons
we perform it. No longer specifically requires a Sensitivity Analysis on the discount rate used.
Requires a Sensitivity Analysis be performed any time non-monetary costs are included in the
Cost Analysis section of an EA. This Sensitivity Analysis is performed by eliminating the non-
monetary costs from the cost analysis. No longer requires a Sensitivity Analysis to be performed
on costs incurred in foreign currency. Includes a new and separate chapter titled Comparison of
Alternatives and Recommendation, introducing an explicit requirement to compare and analyze
the results of the cost, benefit and sensitivity analyses. Includes a new requirement that every
EA must include a recommendation. Lists and defines a number of financial indicators that can
be used to rank alternatives. A new Attachment 8 gives the formulas to calculate factors and
financial indicators. Specifically requires that if the recommendation is not the lowest-cost
alternative, the reasons for its selection must be clearly stated and justified. No longer contains
the restriction against considering special tax benefits when analyzing lease-purchase decisions
for energy projects. Describes AFI 65-504, Commercial Activity Cost Comparisons and
AFMAN 65-507, Comptroller Support of Commercial Activity Cost Comparisons, two

AFMAN65-506 29 AUGUST 2011 3
publications which did not exist at the last publication of this AFMAN. Updates potential EIA
data sources. Introduces a methodology for estimating the amount spent locally of total
expenditures on Materials, Equipment, and Supplies Procurement, rather than counting the entire
amount as having been spent locally. Introduces a methodology for calculating local spending
by TDY travelers to the installation. In Attachment 2, the format of the Request for Waiver
From an Economic Analysis is changed slightly, to include the Date of Request, Project Title,
and Requesting (functional) Organization, as well as a signature block for the required
SAF/FMCE approval. In Attachment 3, the Executive Summary Format now includes a
required Summary of Analysis Results table. In Attachment 4, the format of the Certificate of
Satisfactory Economic Analysis is changed to include the relevant Installation/MAJCOM, the
Project Title, and two new statements showing explicitly what the FM office and the functional
office are each attesting to in the certification. Attachment 5 is a new Economic Analysis
Review Guide for reviewers of EAs. This complements the existing Attachment 6 (EA
Certification Checklist) and Attachment 7 (Economic Analysis Preparer’s Guide), in helping
EA preparers, certifiers and reviewers perform their duties. Attachment 8 is a new attachment
which shows how to calculate many different factors and financial indicators used in EAs. Of
the optional formats, only the former Formats A and A-1 are retained, at Attachment 18, and re-
titled “Sample Formats For Summary Of Costs”. All references to any specific EA software
have been eliminated. Attachment 11, Cost-Benefit Analysis for Government Furnished
Property in Support of Commercial Activity Cost Comparisons, updates references and
highlights the major changes in guidance found in the revised AFI 38-203, Performance of
Commercial Activities, as well as AFI 65-504, Commercial Activity Cost Comparison and
AFMAN 65-507, Comptroller Support of Commercial Activity Cost Comparisons. Attachment
13, Foreign Currency Conversion, no longer includes a requirement for a Sensitivity Analysis
varying the exchange rate used plus and minus 25 percent. Attachment 15 significantly
changes the Annual Economic Analysis Report, in which MAJCOM FMA offices report to
SAF/FMCE the economic analysis activity in their commands. The report is much shorter,
requiring much less information, and changes the character of much of the information
requested. Clarifies for which year each question is seeking data for. The EA Report now
includes BCAs and EA Waiver Requests as separate categories. The EA Report now includes a
question asking the number of Economic Impact Analyses conducted in each MAJCOM, and
which bases have done them. Attachment 16 includes a new Sample Benefit Analysis.
Chapter 1—ECONOMIC ANALYSIS PRINCIPLES 7
1.1. Economic Analysis: ............................................................................................... 7
1.2. Elements of an Economic Analysis: ...................................................................... 8
Figure 1.1. Summary of Analysis Results. ............................................................................... 8
Chapter 2—OBJECTIVES, ASSUMPTIONS, ALTERNATIVES 10
2.1. Objective. ............................................................................................................... 10
2.2. Assumptions. .......................................................................................................... 10
2.3. Alternatives. ........................................................................................................... 11
Chapter 3—COST ANALYSIS 12

4 AFMAN65-506 29 AUGUST 2011
3.1. This section of the EA consists of an estimate of the life-cycle costs associated with each
alternative. .............................................................................................................. 12
3.2. Types of costs. ....................................................................................................... 12
Figure 3.1. Example of daily exchange rate MORE favorable than FCFA budget rate. .......... 14
Figure 3.2. Example of daily exchange rate LESS favorable than FCFA budget rate. ............ 14
3.3. Economic considerations in the Cost Analysis: ..................................................... 15
Figure 3.3. Example of the common denominator method. ..................................................... 16
Figure 3.4. Interest rate example. ............................................................................................. 19
Figure 3.5. Discount rate example. .......................................................................................... 19
Figure 3. 6 shows how the discount rate is applied and how the NPV is calculated. ............ 19
Figure 3.6. Application of the discount rate and calculation of net present value (using a 10%
discount rate and midyear discount factors). ......................................................... 19
Chapter 4—BENEFIT ANALYSIS 21
4.1. This section of the EA consists of an estimate of the life-cycle benefits associated with
each alternative. ..................................................................................................... 21
4.2. Types of benefits. ................................................................................................... 21
Figure 4.1. Sample Benefit Matrix. .......................................................................................... 22
Chapter 5—SENSITIVITY ANALYSIS 23
5.1. Estimates of costs and benefits contain uncertainties because of imprecision in both
underlying data and assumptions. .......................................................................... 23
5.2. Sensitivity analysis identifies key assumptions and variables within an EA and
determines how changes affect the ranking of alternatives. .................................. 23
5.3. Consider conducting a sensitivity analysis: ........................................................... 23
5.4. To perform a sensitivity analysis, vary any uncertain costs and benefits within what you
consider to be a reasonable and relevant range (e. ................................................. 24
5.5. A sensitivity analysis must be performed on any EA in which non-monetary costs are
included in the cost analysis section. ..................................................................... 24
Chapter 6—COMPARISON OF ALTERNATIVES AND RECOMMENDATION 25
6.1. Once all the costs and benefits are estimated for each alternative, the results must be
analyzed, and the alternatives compared and ranked to arrive at a recommendation. 25
6.2. In order to produce the best recommendation for the decision-maker, you must compare
and rank the costs and benefits of each alternative. ............................................... 25
6.3. Every EA must recommend one of the alternatives considered. ........................... 25
6.4. Documentation Requirements. ............................................................................... 26
Chapter 7—SPECIAL ANALYSIS 27

AFMAN65-506 29 AUGUST 2011 5
7.1. Program Evaluation (PE): ...................................................................................... 27
7.2. Lease-Purchase Decisions. ..................................................................................... 28
7.3. Commercial Activities (A-76) Cost Comparisons. ................................................ 28
7.4. Preliminary EAs. .................................................................................................... 28
7.5. Military Construction (MILCON) Design Phase EAs. .......................................... 29
Chapter 8—ECONOMIC IMPACT ANALYSIS 30
8.1. Introduction. ........................................................................................................... 30
8.2. Background. ........................................................................................................... 30
8.3. Methodology. ......................................................................................................... 30
Table 8.1. Other Indirect Jobs Multipliers. ............................................................................. 35
8.4. Average Annual Salary Data. ................................................................................ 35
8.5. Alternative Methodologies. .................................................................................... 36
Chapter 9—ANNUAL ECONOMIC ANALYSIS REPORT 37
9.1. Annual Economic Analysis Report (RCS: ............................................................. 37
Attachment 1—GLOSSARY OF REFERENCES AND SUPPORTING INFORMATION 38
Attachment 2—REQUEST FOR WAIVER FROM THE ECONOMIC ANALYSIS
REQUIREMENT 43
Attachment 3—EXECUTIVE SUMMARY FORMAT REQUIREMENT 45
Attachment 4—CERTIFICATE OF SATISFACTORY ECONOMIC ANALYSIS FORMAT
REQUIREMENT 46
Attachment 5—ECONOMIC ANALYSIS REVIEW GUIDE 48
Attachment 6—ECONOMIC ANALYSIS CERTIFICATION CHECKLIST 55
Attachment 7—ECONOMIC ANALYSIS PREPARER'S GUIDE 58
Attachment 8—FORMULAS FOR FACTORS AND FINANCIAL INDICATORS 66
Attachment 9—LEASE-PURCHASE PROCEDURES 69
Attachment 10—SPECIAL TAX ADVANTAGES IN LEASE-PURCHASE ANALYSIS 72
Attachment 11—COST-BENEFIT ANALYSIS (CBA) FOR GOVERNMENT FURNISHED
PROPERTY (GFP) IN SUPPORT OF COMMERCIAL ACTIVITY COST
COMPARISONS (OMBC A-76) 74
Attachment 12—CONGRESSIONAL REPORTING REQUIREMENTS: CONVERSION OF A
COMMERCIAL ACTIVITY FROM IN-HOUSE TO CONTRACT
PERFORMANCE 76

6 AFMAN65-506 29 AUGUST 2011
Attachment 13—FOREIGN CURRENCY CONVERSION 78
Attachment 14—PRELIMINARY ECONOMIC ANALYSIS FORMAT 79
Attachment 15—ANNUAL ECONOMIC ANALYSIS REPORT (RCS: HAF-FMC[A] 9501)
FORMAT 81
Attachment 16—SAMPLE BENEFIT ANALYSIS 84
Attachment 17—CRITERIA/STANDARDS FOR ECONOMIC ANALYSES/LIFE CYCLE
COSTING FOR MILCON DESIGN 86
Attachment 18—SAMPLE FORMATS FOR SUMMARY OF COSTS 88

AFMAN65-506 29 AUGUST 2011 7
Chapter 1
ECONOMIC ANALYSIS PRINCIPLES
1.1. Economic Analysis:
1.1.1. Economic analysis (EA) is a method of making rational decisions among competing
alternatives. Similar to a Cost-Benefit Analysis, it can assist a commander or manager in
making an informed choice between two or more alternative ways of meeting a stated
objective. Following is a sample (not all-inclusive) list of programs and situations in which
EA can assist in decision making:
1.1.1.1. Military construction (MILCON) and military family housing (MFH).
1.1.1.2. Tradeoffs between force structures, force size, modernization, fuel/energy
consumption, and readiness.
1.1.1.3. Projects to mechanize, automate, prevent obsolescence, improve workflow and
layout, or increase capacity.
1.1.1.4. Repairing, modifying or replacing weapon systems.
1.1.1.5. Acquiring or upgrading equipment to reduce operating and support costs.
1.1.1.6. Lease or purchase of general purpose real property, such as office buildings,
warehouses, and associated land.
1.1.1.7. Consolidating facilities, such as warehouses, maintenance and storage depots,
and repair activities to decrease cost for any reason or to add to mission effectiveness.
1.1.1.8. Use of contract consultants or in-house civilian resources.
1.1.1.9. Business process improvement (business reengineering).
1.1.2. Analysts performing EAs ensure that they probe the scope of the project so that all
relevant questions are considered. Asking questions is the best way to ensure that all
perspectives are covered. The analyst ensures that the objective and all alternatives are
clearly defined, that costs and benefits are completely presented, and that important
assumptions, factors, and judgments are explicitly stated. An EA requires a cooperative
partnership between both comptroller personnel and personnel in the functional area
requiring the EA. Advance planning by functional and comptroller offices is necessary to
complete a timely EA. This requires early clarification of the tasking and a thorough
exchange of information.
1.1.3. Initiate an EA as early as possible and update any information as significant
developments occur. As you prepare EAs, update them to include developments such as:
1.1.3.1. Actual performance data at variance with predicted performance data.
1.1.3.2. Changes in initial study assumptions.
1.1.3.3. New alternatives that satisfy the stated requirements more effectively or
efficiently.

8 AFMAN65-506 29 AUGUST 2011
1.1.4. The depth and formality of EAs should be commensurate with both the magnitude of
the resources involved and the organizational level at which the EA will eventually be seen.
The analyst must exercise judgment here.
1.1.5. The EA should be written as if the reader was completely unfamiliar with the project
or program under analysis. The reader should be able to get all the information they need
from the analysis itself. It should be a stand-alone document.
1.1.6. More current information on Economic Analysis can be found on the SAF/FMC page
on the Air Force Portal.
1.2. Elements of an Economic Analysis:
1.2.1. Executive Summary: Every EA must be accompanied by an Executive Summary,
which must contain the information in the format at Attachment 3. Every Executive
Summary must include a completed version of the table at Figure 1.1. Additional financial
indicators may be added to this table (see paragraph 6.2).
1.2.1.1. In Figure 1.1, the column titled “New Funding Required” must identify the
amount of net-additive funding required to implement the alternative. The column titled
“Total Life Cycle Cost” will reflect the net present value (NPV) for each alternative.
Figure 1.1. Summary of Analysis Results.
1.2.2. Certification of Satisfactory Economic Analysis: Every completed EA must have a
Certificate of Satisfactory Economic Analysis. Certifying officials include the
Comptroller/Financial Management official and the program office equivalent at base level
and the financial analysis and program office equivalent at MAJCOM level. Other base level
or MAJCOM offices that have provided significant inputs should also coordinate on the
Certificate of Satisfactory Economic Analysis.
1.2.2.1. Every Certification should follow the format in this AFMAN, Attachment 4,
and at a minimum include all statements and information included in that attachment.
1.2.2.2. Certification by comptroller personnel means that an EA has been prepared in
accordance with this AFMAN and AFI 65-501. Certification by comptroller personnel
attests to the accuracy of the data in the EA, the proper use of economic principles in the
analysis and the adequacy of documentation such that the EA is a stand-alone document.
All factors and data in the EA must be current as of the signing of the certification.
Financial management officials are solely responsible for determining the
recommendation in the EA. If these officials do not recommend the lowest-cost
alternative, they must provide the rationale for their recommendation in the Comparison
of Alternatives section of the EA (see Chapter 6).

AFMAN65-506 29 AUGUST 2011 9
1.2.2.3. Certification by functional personnel attests that the assumptions, reasoning
and functional technical assessments in the EA are sound and are in accordance with all
Air Force Instructions and Manuals applicable to their area of technical expertise.
Certification does not mean that the functional organization endorses the
recommendation contained in the EA.
1.2.2.4. Functional managers and reviewers at each stage of the review process must sign
the Certificate of Satisfactory Economic Analysis. EAs forwarded to Air Staff or
Secretariat must give evidence of MAJCOM certification.
1.2.3. The EA itself must include at least the following parts:
1.2.3.1. Objective
1.2.3.2. Assumptions
1.2.3.3. Alternatives
1.2.3.4. Cost Analysis
1.2.3.5. Benefit Analysis
1.2.3.6. Sensitivity Analysis
1.2.3.7. Comparison of Alternatives and Recommendation
1.2.4. Documentation. A key element of credible analysis is sufficient documentation of
method and information sources so that with the same material, a reader not familiar with the
study could arrive at essentially the same result without having to look elsewhere for any
information used to perform the analysis. The documentation in an EA must meet this
standard. If supporting documents are too voluminous for inclusion in the EA, they must be
cited in sufficient detail so that the exact document(s) may be found by an independent
reviewer or reader if they choose to read them. In addition to providing documents that
substantiate information used in the EA, documentation also includes any calculations or
adjustments used to turn raw source data into data used in the analysis.

10 AFMAN65-506 29 AUGUST 2011
Chapter 2
OBJECTIVES, ASSUMPTIONS, ALTERNATIVES
2.1. Objective. The statement of the objective should clearly define and quantify (to the extent
possible) what the project or program under study seeks to attain. It should state the goal or
objective (i.e., mission or mission support requirement) to be met by the alternatives under study.
2.1.1. It is not a statement of the objective of the analysis, as in, “The objective is to
analyze…”.
2.1.2. The objective should address the true problem to be solved, rather than a symptom of
the problem.
2.1.3. The objective should be stated broadly enough that it can be met by multiple
alternatives, and not in a way that favors or pre-supposes one particular alternative. This is
sometimes called “pre-selection”.
2.2. Assumptions. Assumptions are constraints, ground rules, criteria and variables which
influence costs and benefits. We make assumptions when we lack reliable knowledge to assign
values or probabilities to factors influencing decisions. The reasonableness and validity of
assumptions, as well as the need for new assumptions, should be periodically re-assessed
throughout the course of the analysis. Only assumptions that are necessary and reasonable should
be included in an EA.
2.2.1. There are times when assumptions can appropriately narrow the scope of an EA to
manageable proportions, but they should not unduly restrict the analysis by eliminating
potential significant alternatives.
2.2.2. All assumptions must be explicitly stated.
2.2.3. No costs or benefits should be excluded or included in an EA merely on the basis of
an assumption that’s not justified. If any assumption excludes or includes one or more major
categories of cost or benefit, the assumption needs to be explicitly stated and justified. For
instance, if an analyst wishes to include the opportunity costs of some capital asset or other
resource, such inclusion must be justified in the Cost Analysis section of the EA, and the
alternative uses fully explained and calculations shown. Assumptions should not be made for
the convenience of the analyst, or to unfairly favor one alternative over another.
2.2.4. The analyst should be alert to major assumptions, either stated or unstated, that assign
fixed values to variables subject to uncertainty, then treating those assumptions as facts in the
EA without any further analysis or scrutiny (i.e., projecting past workload or reliability rates
into the future). Any such assumptions should be explicitly stated in the Assumptions section
of the EA.
2.2.5. If any alternative will include either non-monetary costs or opportunity costs in the
Cost Analysis section of the EA, each must be explicitly identified as such in the
Assumptions section of the EA.
2.2.6. Assumptions are one way we handle uncertainty in an EA. A Sensitivity Analysis
should be performed to test the effect that major assumptions have on the recommendation of
the EA.

AFMAN65-506 29 AUGUST 2011 11
2.3. Alternatives. These are the various methods of attaining the stated objective, with a full
description of each. Fully explain what each alternative involves, especially those things that
drive costs and benefits. Explain how each process or procedure would work, what personnel,
equipment, or facilities would be required, and what other changes would be involved. Each
alternative should be fully described, so that someone completely unfamiliar with it can fully
understand it and what would be involved in its implementation. At a minimum, the description
should include any and all things which will result in costs to the government.
2.3.1. Every EA should include a Status Quo alternative. This is the “change nothing” or “as
is” alternative that describes how the function or process under study currently meets the
objective. Having a Status Quo alternative provides, if nothing else, a baseline alternative
against which all other alternatives can be compared.
2.3.2. Each alternative should be evaluated for feasibility. If any alternative is deemed
infeasible, the reasons should be fully explained in this section, and the alternative should not
be considered any further in the EA. It is important to keep infeasible alternatives in the list
of possible alternatives, along with the reasons they’re infeasible, so that later readers and
reviewers know that all reasonable alternatives were considered and the reasons that the
infeasible ones were considered infeasible.

12 AFMAN65-506 29 AUGUST 2011
Chapter 3
COST ANALYSIS
3.1. This the EA consists of an estimate of the life-cycle costs associated with each
alternative. An EA normally includes all costs to the US government, not simply those incurred
by the function under study. The estimate will show all interim calculations so that the values in
the cost analysis can be tracked from the source data to the total cost for each alternative.
3.2. Types of costs.
3.2.1. Monetary cost: A financial, monetary outlay or expenditure. This is the most
common type of cost found in the Cost Analysis section of an EA.
3.2.2. Opportunity cost: The cost of an existing asset measured in terms of its value in the
best alternative use. It is the asset’s value if used in the next-best choice available to someone
who has picked between several mutually exclusive choices.
3.2.2.1. If an opportunity cost is included in the Cost Analysis section of an EA, the
calculations of the value of that asset in the best alternative use must be clearly shown,
and the alternative use must be clearly described. The value of an existing asset may be
included in the Cost Analysis section of an EA only when there is a measurable and
documented opportunity cost associated with that asset’s use.
3.2.2.2. Inherited assets, a form of opportunity cost, are those resources such as
installations, equipment, and trained personnel inherited from efforts that are being
phased out.
3.2.3. Non-monetary cost: Any cost that is neither a monetary cost nor an opportunity cost.
Such non-monetary costs, even when quantified and expressed in dollar terms, are best dealt
with in the Benefit Analysis section of the EA.
3.2.4. Life-cycle cost: The total cost to the government for a system over its full life,
including the cost of development, procurement, operation, support and disposal.
3.2.5. Non-recurring cost: One-time costs, which usually take the form of initial capital or
other unique expenditures. Types of non-recurring costs are:
3.2.5.1. Research and development costs.
3.2.5.2. Investment costs. These are costs associated with the acquisition of equipment,
real property, nonrecurring services, nonrecurring operations and maintenance (start- up)
costs, and other one-time outlays.
3.2.5.3. Costs of acquisition, rehabilitation, or modification of land, buildings,
machinery, equipment, and one-time computer software costs.
3.2.5.4. Costs of acquisition, rehabilitation, or modification of other assets such as
furnishings and fittings required for the project.
3.2.5.5. Costs of plant rearrangement and tooling associated with the project.
3.2.5.6. Costs of freight and insurance required by the project.

AFMAN65-506 29 AUGUST 2011 13
3.2.5.7. The value of nonrecurring services received from others, both internal and
external to the Air Force.
3.2.5.8. The costs of leaseholds required for the project.
3.2.5.9. Working capital and current assets on hand or on order, including inventories of
consumable items and resources required for the project.
3.2.5.10. The cost to cancel or terminate any existing arrangement that would result if a
different alternative were implemented.
3.2.6. Recurring cost: A cost incurred repeatedly, either annually or periodically.
3.2.6.1. Annual recurring cost: A cost incurred every year, like personnel or utilities.
3.2.6.2. Periodic recurring cost: A cost incurred in a period that is other than one year
long, like replacement of heating, ventilation and air conditioning (HVAC) equipment
that may be replaced every 20 years.
3.2.7. Common cost (also known as Wash Cost): Any cost that is “common” to all
alternatives in the analysis. For costs to be considered common, they must be identical in
terms of both amount and timing. Common costs add no additional information to the
decision making process, and may be excluded from the analysis, unless there is a
requirement to show the total program costs. Whenever such costs are excluded from an EA,
such exclusion must be clearly and explicitly stated in the Assumptions section of the EA.
However, if a decision-maker wants to see the total cost of the alternatives in an EA, the
analyst should include common costs, to show the full costs of each alternative. While a
category of cost may be common, the amount may differ, even differ significantly, among
alternatives. Exercise caution before deciding to exclude common costs, and be able to
defend doing so.
3.2.8. Differential cost: The difference in cost between two or more alternatives. Example:
In alternative A, the annual cost for 10 laborers is $1M. Alternative B, however, requires 12
laborers, at an annual cost of $1.2M. The recurring differential cost of manpower in
alternative B is $0.2M.
3.2.9. Sunk cost: Any cost incurred in the past, to include future costs that have been
irrevocably committed in the past. Such costs have no bearing on any decision to be made,
and so should NOT be included in an EA. They may, however, be shown separately as
supplementary information.
3.2.10. Costs incurred in foreign currency: EAs produced by Air Force activities overseas
should always perform the cost analysis portion of the EA in US Dollars. These costs must
always be converted at the known or estimated exchange rate of the base year of the analysis,
NOT the Foreign Currency Fluctuation Account (FCFA) exchange rate, also known as the
“budget rate”. The FCFA budget rate is structured and designed to protect budgets and
introduce predictability in budgeting for units overseas. Using the FCFA rate will help you
calculate the dollar costs to your individual unit, but NOT costs to the US government (which
is what the EA should include). The FCFA keeps exchange rates constant for military units
overseas, from budget planning through budget execution, while absorbing daily gains and
losses due to day-to-day fluctuations in actual (market-based) exchange rates as units pay
their daily bills in foreign currency. Thus, overseas units appear to have a fixed exchange rate

14 AFMAN65-506 29 AUGUST 2011
during budget execution year, but in fact the government pays a varying rate every day,
which is masked by the FCFA. Upon request, SAF/FMCE will provide estimates of foreign
exchange rates for individual countries. Attachment 13 has more information on conversions
for convertible currencies (currencies whose exchange rate varies with market conditions).
For non-convertible currencies, use official exchange rates.
3.2.10.1. Figure 3.1 demonstrates the difference between the cost, in dollars, to an
individual overseas unit and the cost to the government when using the FCFA rate. The
example uses the Euro and a FCFA budget rate of $1 = € 1.2403. If the unit incurs a cost
of € 1,000, it’ll cost the unit $806 (at the FCFA budget rate). When finance pays the
vendor, they’ll convert the cost at the daily exchange rate on the day they make the
payment, which will be different than the FCFA budget rate the unit originally used to
build their budget.
3.2.10.2. In Figure 3.1, the daily rate at which the bill was paid is more favorable to the
government than the FCFA rate originally used to build the unit’s budget, so the FCFA
experiences a net inflow of money in this transaction. In Figure 3.2, the daily rate is less
favorable, so the FCFA experiences a net outflow of money in this transaction.
3.2.10.3. The FCFA gains and loses money every day, in many different currencies
around the world, and it designs its rate structure (considering all currencies) to ensure it
stays solvent. This example demonstrates that the cost to an overseas unit, using the
FCFA budget rate, is not the same as the cost to the government for any given cost
incurred in foreign currency.
Figure 3.1. Example of daily exchange rate MORE favorable than FCFA budget rate.
Figure 3.2. Example of daily exchange rate LESS favorable than FCFA budget rate.
3.2.11. Depreciation expense: Depreciation accounts for the gradual consumption of
capital goods and resources over time. A common use is to allow business to "recover"
investment in capital goods through tax benefits. Normally, depreciation will not be included
as a cost in an Air Force economic analysis since it would double-count expenses (i.e., the
acquisition cost of assets are entered when the asset is acquired). However, depreciation
procedures can be used to estimate terminal or residual values. Also, it may be a

AFMAN65-506 29 AUGUST 2011 15
consideration in commercial lease versus buy alternatives if it provides extraordinary tax
benefits to the lessor that are a cost to the Treasury (see Attachment 10).
3.2.12. Fuel/Energy Costs: The fully burdened cost of delivered energy shall be used in
analyses conducted for all DoD tactical systems with end items that create a demand for
energy, IAW DoDI 5000.02, Operation of the Defense Acquisition System.
3.3. Economic considerations in the Cost Analysis:
3.3.1. Base year: The first year of the analysis in which there is a difference in costs between
alternatives. This will normally be the Start Year of the analysis. All costs will normally be in
constant dollars of the Base Year of the analysis.
3.3.2. Economic life: The economic life of a project or asset is the time during which
benefits from the project or asset may reasonably be expected to accrue to the Air Force. The
economic life of a project or asset is set by the shortest of its physical life, technological life,
or mission life. Economic lives of assets can often be found in functional area directives for
planning, programming, and budgeting for resources. Appendix 3 of OMB Circular A-76
also has a Useful Life and Disposal Value table. AFMAN 32-1089, Air Force Military
Construction and Family Housing Economic Analysis Guide, Figure 2-12 has the economic
lives for some facility types.
3.3.2.1. Physical life: The number of years a facility or piece of equipment can
physically be used before it wears out.
3.3.2.2. Mission life: The estimated number of years that the need for the asset is
anticipated, before the mission either changes or is no longer required.
3.3.2.3. Technological life: The period before improved technology makes an asset
obsolete.
3.3.2.4. For more information on the value of assets at the end of either their useful lives
or the period of analysis, see paragraph 3.3.6.
3.3.3. Period of analysis: Economic life plus project lead-time determine the period of
analysis for an EA. If the alternatives do not have equal lives, there are two methods of
selecting a period of analysis:
3.3.3.1. The terminal value method sets the period of the analysis to the duration of the
alternative with the shortest economic life. To calculate the present value of each
alternative under this approach, the analyst needs to know the terminal or "salvage"
values of the assets for the alternative with the shortest life and the residual values of the
asset(s) for the alternative(s) with longer economic life (lives). The terminal/residual
values of assets are included as inflows, or negative dollar amounts, in the final period
cash flows for each alternative. This adjusts the present value of the net cash flow for the
disparity between the lives of the alternatives. The terminal value method is the most
commonly used method in Air Force EAs.
3.3.3.2. The common denominator method assumes the assets associated with each
alternative are replaced in the last year of their lives with identical equipment, and
replacement continues until all alternatives have assets reaching the last year of their lives
during the same year. Choose that year as the last year of your analysis.

16 AFMAN65-506 29 AUGUST 2011
3.3.3.2.1. To illustrate this approach, suppose an analyst must choose between two
machines, A and B. The two machines are designed differently, but have identical
capacity and do exactly the same job. Machine A has an economic life of three years,
while Machine B has an economic life of two years. The first Machine A reaches the end
of its life in year three, and the second Machine A reaches the end of its life in year six.
The B Machines reach the end of their lives in years two, four and six, with year six
being the first ending year common to both machine alternatives.
Figure 3.3. Example of the common denominator method.
3.3.3.2.2. It’s important to keep in mind the major assumption being made: that
“chaining” the assets in this manner represents a realistic investment strategy. This
approach is not recommended for use with an asset having a short technological life
(e.g., computer hardware and software).
3.3.4. Inflation. Inflation is a rise in the general level of prices. Costs of resources change
from year to year. Consult AFI 65-502 for guidance on inflation. The AF-published inflation
indexes originate at the Office of Management and Budget (OMB), and reflect the economic
assumptions of the current administration. EAs will ordinarily be in constant dollars of the
base year of the analysis. There are two ways in which dollar values can be expressed, as
either constant dollars or current dollars. There are also two types of inflation indexes, raw
and weighted.
3.3.4.1. Constant dollars reflect the value or purchasing power of a dollar in a single,
specific year (as in "constant FY09 dollars"), and as such do not include the effects of
inflation. Its value is "constant" throughout the years of the analysis period. Expressed
this way, the cost of a certain cost element (assuming no other changes to that element) is
the same in the first year of the analysis as it is in the last. Also called “real” dollars.
3.3.4.2. Current dollars have a value that is different from year to year, and reflect the
value of that dollar in the current year in which it is spent. A current dollar implicitly
includes the effects of inflation. Also called “nominal” or “then-year” dollars.
3.3.4.3. Raw inflation indexes show the estimated change in price level from one base
year to another. Use a raw index to convert a dollar amount from constant dollars in one
year to constant dollars in another year.
3.3.4.4. Weighted inflation indexes combine raw inflation indexes with outlay profiles
to account for the additional effects of inflation caused by spending money over a
multiyear period. An outlay profile shows that percentage of an obligated amount that is
expensed (spent) in each year for which the applicable appropriation is valid. It takes
into account that not all money obligated in a given year will be spent that year, but will
be spent over several years over the course of the legal life of the applicable
appropriation, and that inflation will have an effect on costs in those years.

AFMAN65-506 29 AUGUST 2011 17
3.3.4.5. Adjustment to the Base Year. Since EAs propose a future course of action, the
base year is usually one or more years in the future. Since cost source data is often in a
year other than the base year of the analysis, costs must be adjusted from the source year
to the base year of the analysis. Use USAF raw inflation indexes to adjust costs to the
base year of the analysis. After adjustment to the base year, the costs would be the same
for every year of the analysis (provided there are no changes in requirements or scope,
like if a building requires more maintenance as it ages). No further inflation adjustment is
necessary unless the analysis contains resources that are subject to differential price
changes.
3.3.4.6. Differential Price Changes. Even in a constant dollar analysis, you may need to
adjust the costs of some elements if economists project price changes significantly above
or below general inflation. The "core" rate of inflation, for example, excludes food and
energy costs, which are two of the most volatile sectors of the economy. Also, for many
years the cost of computer systems has been decreasing relative to increasing processing
capability. If an EA contains food, energy, or computer system costs, adjustments to costs
in the out years may be advisable. For EAs with food or computer system costs,
MAJCOM headquarters may consult SAF/FMCE for a sector-specific inflation index.
Any other costs in an EA which are a significant cost and which represent a volatile
sector of the economy in terms of sector-specific inflation may require application of a
sector-specific index. MAJCOM headquarters may consult SAF/FMCE for information
on such indexes. Any use of an inflation index other than one issued by SAF/FMCE must
be fully explained and justified in the analysis.
3.3.4.7. Current Dollar Analysis. While EAs will ordinarily be in constant dollars of the
base year of the analysis, there are certain situations where a current dollar analysis is
appropriate. A current (or then-year) dollar contains implicit adjustment for variation in
the purchasing power of a dollar over time. Current dollars represent amounts that will be
paid for resources in the years in which payments will be made (therefore sometimes
referred to as budget dollars). Do EAs in current dollars when:
3.3.4.7.1. Cost information is obtained in inflated dollars.
3.3.4.7.2. Doing a non-appropriated fund (NAF) construction project analysis -
Internal Needs Validation Study (INVS).
3.3.4.7.3. In current dollar analyses all outlays are escalated for inflation using the
most appropriate indexes. In principle the USAF weighted inflation indexes are used
to establish current dollar amounts. Weighted inflation indexes are derived by
applying raw inflation indexes to each appropriation’s outlay pattern, which is based
on historical average expenditure profiles. However, if more specific information is
known about when amounts will be spent for a particular project, then the amounts
should be placed in the appropriate year and inflated with raw inflation rates. Also, no
weighted indexes exist for pay and fuel categories because the assumption in the Air
Force inflation indexes is that these categories are expended within one fiscal year. If
specific data is known about prices of a given acquisition or contract provision, these
specific price increases should be used rather than the inflation indexes.
3.3.4.8. Do not mix constant and current dollars in the same analysis.

18 AFMAN65-506 29 AUGUST 2011
3.3.4.9. More specific guidance on inflationary adjustments is contained in AFI 65-502,
Inflation. In addition, the Air Force Inflation Calculator is a tool available on the
SAF/FMC web page. This model helps an analyst to quickly accomplish conversions into
different types of dollars or into different base years.
3.3.5. Discounting and Present Value. Discounting is a method of calculating the value
today (present value) of a future cost or stream of future costs. We discount because we
recognize that the timing of expenditures makes a difference, that because of interest and
other business opportunities, time has value. One dollar invested today will earn interest and
be worth more one year from now. For example, if you had a debt of $1000 due one year in
the future, and you could get an interest rate of ten percent (very high compared to most
historical periods, but used for simplicity of the example), then you would need only $909.09
today to meet that obligation. This is because $909.09 can be loaned for one year to produce
principal plus interest of $1000. Discounting favors alternatives that push costs further into
the future, where they are discounted more heavily, resulting in a lower value in the present.
It also has the effect, intended or not, of minimizing estimating errors in the future, because
the further into the future you go, the more discounting reduces the present value (and any
estimating error) of a given cost element. NOTE: Do not confuse discounting with inflation.
Discounting involves the concept of the time value of money in view of the interest that can
be earned on financial instruments such as treasury securities or commercial time deposits.
Inflation involves changes in prices. While expectations of inflation may influence interest
rates, the concepts of inflation and the time value of money are separate ideas.
3.3.5.1. Net Present Value (NPV). The sum of all discounted costs for all years of the
analysis period. All costs in Air Force EAs will be discounted to present value, and
alternatives will be ranked according to NPV.
3.3.5.2. Discount Rate. EAs are performed using discount rates that represent the
government's cost of borrowing, as provided annually in the President's Budget and
Appendix C to OMB Circular A-94. Rates used for analysis are interest rates on Treasury
notes and bonds with maturities of 3, 5, 7, 10 and 30 years. The rate to be used should
correspond to the period of analysis. Interest rates on Treasury securities are cited on both
a real and nominal basis. Ordinarily EAs use a real rate, consistent with a constant dollar
analysis. When inflated dollars are used in an EA, the nominal rate is used. Air Force
EAs will use the discount rates updated annually on the SAF/ FMC website.
3.3.5.3. Discount Factors. Discount factors for use in EAs are derived from the discount
rate used, using the formulas found in Attachment 8. There are two kinds of discount
factors we normally see in Air Force EAs.
3.3.5.3.1. End-of-Year Factors: These factors implicitly assume that costs and
benefits occur as lump sums at year-end. They assume interest accrued or paid during
entire year (the interest period we normally use).
3.3.5.3.2. Midyear Factors: When costs and benefits occur in a steady stream,
applying midyear discount factors is more appropriate. Midyear factors approximate
actual disbursement patterns--i.e., funds are typically disbursed throughout a given
fiscal year rather than at its beginning or end. When the precise timing of outlays is
critical to program evaluation, monthly (or quarterly) rather than annual flows of
funds may be considered for early program years. Midyear factors should be used in

AFMAN65-506 29 AUGUST 2011 19
Air Force EAs unless there is good reason to use other factors, in which case the
reason(s) should be explained in the analysis.
3.3.5.4. Figures 3.4 and 3.5 show the difference between an interest rate and a discount
rate. Figure 3.4 shows how an interest rate is applied to a present dollar amount to arrive
at a desired future amount. Figure 3.5 turns this example around to show how the same
interest rate, converted into a discount rate, can be applied to the desired future amount to
arrive at the present amount that would be needed to invest to reach that future desired
amount. (Investment amounts are rounded.)
Figure 3.4. Interest rate example.
Figure 3.5. Discount rate example.
3.3.5.5.
Figure 3. 6 shows how the discount rate is applied and how the NPV is calculated.
Figure 3.6. Application of the discount rate and calculation of net present value (using a
10% discount rate and midyear discount factors).
3.3.6. Remaining value at the end of an asset’s useful life. There are three terms used to
describe the value of an existing asset that remains at the end of its useful life: terminal value,
residual value and salvage value.

20 AFMAN65-506 29 AUGUST 2011
3.3.6.1. Salvage value is the value of an asset at the end of its physical life (scrap value).
Salvage value is often offset by the cost to dispose of the asset.
3.3.6.2. Residual value is the value of an asset at any point in time before the end of its
economic life.
3.3.6.3. Terminal value is the value of an asset remaining at the end of its economic life.
If its economic life is deemed to be the same as its physical life, then terminal value will
equal salvage value. If, however, an asset’s physical life is longer than its mission or
technological life, there may be some value left in the asset beyond salvage value.
3.3.6.4. The remaining values of assets are included as inflows, or negative dollar
amounts, in the final period of the cost analysis for each alternative. This step adjusts the
present value of the net cash flow for the differences between the lives of the alternatives.
A straight-line depreciation method is acceptable for estimating terminal, residual or
salvage value. This is done only to estimate the remaining value of existing assets, and
for no other purpose. Air Force EAs do not include depreciation expense as an element of
cost, since doing so would be double-counting the investment cost of the asset. The only
time Air Force EAs will take depreciation expense into account is when there are special
tax advantages to lessors taking accelerated depreciation (see Attachment 10).

AFMAN65-506 29 AUGUST 2011 21
Chapter 4
BENEFIT ANALYSIS
4.1. This the EA consists of an estimate of the life-cycle benefits associated with each
alternative. An EA normally includes all benefits to the US government, not simply those
incurred by the function under study. While costs can be thought of as “inputs” to a project or
program, benefits can be thought of as the “output” or what the government gets for its resource
inputs. In developing the list of costs and benefits, care must be taken to avoid double-counting.
Costs and benefits must be mutually exclusive and may not overlap. For instance, a cost saved or
avoided by one alternative should be reflected in that alternative’s reduced cost in the cost
analysis and should not also be included in the benefit analysis. To do so would be to double-
count this item.
4.1.1. The selection of any particular alternative should be based on a full economic
evaluation, in which both costs and benefits have equal weight. An alternative with the
lowest cost may not be the most economical; other alternatives may, after incorporation of
non-dollar costs and benefits into the analysis, provide more benefits for the resources
expended.
4.1.2. Any and all categories of benefits analyzed should be fully explained so that someone
unfamiliar with them can fully understand them and their measurement.
4.2. Types of benefits. The sources and derivation of quantifiable benefits must be documented
in the same level of detail as costs, and should include all interim calculations as appropriate.
There are three types of benefits.
4.2.1. Monetary benefits. These quantifiable benefits include financial, monetary income
to the government, like cash receipts, proceeds from the sale of assets, lease fees, and other
revenue. Monetary benefits are incorporated into the analysis as offsets to expenditures.
Revenues, government earnings, and the like are subtracted from cost totals to yield net costs
or net dollar outflows for each alternative. This is best and most easily done in the cost
analysis section of the EA.
4.2.2. Non-monetary quantifiable benefits. Any non-monetary benefit that can be
measured quantifiably, like a reduction in military overtime man-hours. Characteristics such
as product or service performance (miles/hour, orders/hour) or work environment (average
noise level, mishaps/week) can sometimes be quantified in nonmonetary terms. In such
cases, non-monetary costs and benefits should be quantified to the greatest extent possible,
and direct comparisons among these measures across alternatives should be made. If
quantifying such benefits in dollar terms, make sure it’s clear that you are merely using
dollars as a unit of measurement for comparison purposes. Make sure you don’t mislead the
decision-maker into thinking that such quantifications represent actual dollar cash flows.
4.2.3. Non-quantifiable benefits. These cannot be readily stated in dollar terms, or
otherwise quantifiably measured, like mission effectiveness, security and organizational
morale. These are usually subjective in nature and generally don’t lend themselves to
quantifiable analysis. We can still, however, attempt to determine the comparative
desirability of each alternative relative to each benefit. We can also attempt to measure the
magnitude of the differences in desirability between alternatives. Thus, while not measuring

22 AFMAN65-506 29 AUGUST 2011
these benefits in an objective, quantifiable way, we can still establish a basis of comparison.
One such way is by assigning subjective weights and values to various benefits. Attachment
16 is a sample benefit analysis for non-quantifiable benefits.
4.2.3.1. Individual benefits to be analyzed are best selected, weighted and scored by
knowledgeable personnel from relevant functional areas, like civil engineering, safety,
security forces, or services.
4.2.3.2. Each benefit should have a brief separate paragraph describing what the benefit
is, what is being measured, and the rationale used in determining the score for each.
4.2.3.3. The weight of each benefit should show how important each benefit is relative
to the others, while the score should measure how well the alternative provides that
benefit. The weight multiplied by the score equals the weighted score. These are then
summed to show the various alternatives’ overall weighted benefit score. Figure 4.1
shows a sample benefit matrix which identifies the benefits analyzed, their assigned
weights and their scores.
Figure 4.1. Sample Benefit Matrix.

AFMAN65-506 29 AUGUST 2011 23
Chapter 5
SENSITIVITY ANALYSIS
5.1. Estimates of costs and benefits contain uncertainties because of imprecision in both
underlying data and assumptions. Since estimating errors can be introduced into the analysis
in these ways, we must analyze the effect these potential errors have on our analysis and its
recommendation. Information that would be useful in an analysis of uncertainty includes the key
sources of uncertainty and the sensitivity of analysis results to important sources of uncertainty.
5.1.1. Uncertainty is having less than 100% assurance of knowing something is true or
correct (like assumptions, cost variables or benefit estimates).
5.1.2. Risk is the probability an unfavorable outcome or event will occur, or the probability
that something is untrue or incorrect. Risk analysis evaluates the probability that the analyst’s
assumptions or estimates are wrong.
5.1.3. Sensitivity is the magnitude of impact that particular inputs have on an analysis and its
results. Sensitivity analysis is an evaluation of the effect that uncertain elements of an
analysis have on the outcome. Every EA must have a sensitivity analysis. If you are also able
to state the probability that the uncertainties will have their negative impacts on the analysis,
then so much the better.
5.2. Sensitivity analysis identifies key assumptions and variables within an EA and
determines how changes affect the ranking of alternatives. Its value lies in the additional
information and understanding it brings to bear on the decision. For decision makers facing an
investment decision, sensitivity analysis is a tool for determining how changes in costs or
benefits (e.g., due to estimating errors that stem from uncertainty) affect the EA's
recommendation.
5.2.1. A decision is insensitive to uncertainties regarding a variable if you can change that
variable over a wide range without affecting the ranking of alternatives. A sensitivity analysis
demonstrates the stability (or instability) of the recommendation.
5.2.2. A major limitation of sensitivity analysis is that it only analyzes the assumptions,
alternatives, or variables you have considered. This limitation emphasizes that critical
thinking and dialog with experts is crucial to preparing a quality EA.
5.3. Consider conducting a sensitivity analysis:
5.3.1. On assumptions that contain uncertainty that can impact the estimates of costs or
benefits.
5.3.2. On major cost drivers. Determine major cost drivers by calculating the percentage of
total cost accounted for by each cost element, using discounted costs. After determining the
percentage that each cost element (for example, research and development, investment, and
recurring cost categories) is of the total cost for each alternative, examine those cost elements
which constitute the largest percentage of life cycle cost.

24 AFMAN65-506 29 AUGUST 2011
5.3.3. On the discount rate, if there are significant differences in the outlay patterns of your
alternatives. Should the sensitivity analysis result in a change in the cost ranking alternatives,
report the rate at which the change occurs.
5.3.4. When the results of the analysis do not clearly favor any one alternative.
5.4. To perform a sensitivity analysis, vary any uncertain costs and benefits within what
you consider to be a reasonable and relevant range (e. g., plus or minus 10% of initial
investment costs, plus or minus $3.50 per operating hour, or whatever is appropriate), recalculate
the costs and benefits of all affected alternatives, and compare them again. If the ranking of
alternatives changes as a result of these variations, then you can say that the recommendation of
the analysis is sensitive to uncertainties in a certain assumption, over a given relevant range of
variation. You can do several iterations, varying costs and benefits at whatever interval (e.g.,
every 2%) you believe is appropriate. Make sure you document all your reasoning and
assumptions, and show all your calculations and intermediate steps.
5.5. A sensitivity analysis must be performed on any EA in which non-monetary costs are
included in the cost analysis section. Perform the sensitivity analysis by eliminating the non-
monetary costs from the cost analysis.

AFMAN65-506 29 AUGUST 2011 25
Chapter 6
COMPARISON OF ALTERNATIVES AND RECOMMENDATION
6.1. Once all the costs and benefits are estimated for each alternative, the results must be
analyzed, and the alternatives compared and ranked to arrive at a recommendation. This
section of the EA must include an analysis of the data, a comparison and ranking of alternatives,
discussion of the sensitivity analysis, and a recommendation.
6.2. In order to produce the best recommendation for the decision-maker, you must
compare and rank the costs and benefits of each alternative. Provide a brief narrative
explanation of the summarized cost and benefit data, as well as any measurements and
indicators. Compare the relative strengths and weaknesses of each alternative and identify the
most effective alternative accomplishing the mission objective. In order to produce the best
recommendation for the decision-maker, you must compare and rank the costs and benefits, as
well as any other measures or indicators as appropriate. There are financial indicators you can
use to compare alternatives; some apply to costs, some to benefits and some to a combination of
the two (formulas can be found in Attachment 8).
6.2.1. Net Present Value (NPV): NPV reflects the value today of a future amount or stream
of future amounts, expressed as a single sum of dollars. It’s calculated by multiplying the net
amount for each year by the corresponding discount factor, and summing the results.
6.2.2. Uniform Annual Cost (UAC): A method to compare alternatives with unequal lives,
UAC is calculated by dividing the net present value of the costs of an alternative by the sum
of the discount factors for the periods covering the life of each alternative in which costs
were incurred.
6.2.3. Savings/Investment Ratio (SIR): The present value of the total return generated by an
investment (minus the original investment amount) divided by the present value of the initial
investment amount.
6.2.4. Internal Rate of Return (IRR): The annual return on an investment, expressed as a
percentage of the amount invested. It can also be defined as the annualized effective
compounded return rate that can be earned on invested capital.
6.2.5. Return On Investment (ROI): The total return generated by an investment.
6.2.6. Weighted Benefit Score: The result of the scoring of benefits of a given alternative,
weighted by the relative importance of each individual benefit.
6.2.7. Cost/Benefit Ratio (CBR): The ratio of the life cycle cost of an alternative to its
weighted benefit score.
6.2.8. Payback Period: The length of time it takes for the revenue or savings generated by a
project to equal its investment costs.
6.3. Every EA must recommend one of the alternatives considered. If the recommended
course of action is not the lowest cost alternative, it is very important that the reasons for its
selection be clearly stated and justified. Those reasons should generally be found in the Benefits
Analysis.
26 AFMAN65-506 29 AUGUST 2011
6.4. Documentation Requirements. EAs must be thoroughly documented. Consult AFI 65-
501, paragraph 1.6
6.4.1. An EA should be a stand-alone document, and any reviewer or auditor should be able
to review/audit the EA without having to look at anything else. They should be able to
replicate the EA using your source data and your documentation. Good documentation
provides a good audit trail.
6.4.2. A guide for preparing EAs is at Attachment 7. This guide is helpful when planning an
EA. Attachment 5 is a guide for REVIEWING an EA, for use in reviewing an EA before
forwarding, or for reviewers at later stages of the project proposal process.

AFMAN65-506 29 AUGUST 2011 27
Chapter 7
SPECIAL ANALYSIS
7.1. Program Evaluation (PE): A PE compares actual performance with stated program
objectives. AFI 65-501, paragraph 2.9, defines program evaluation, as well as requirements and
responsibilities for PE EA.
7.1.1. General Program Evaluation Procedures. When preparing a PE EA:
7.1.1.1. Set reference points (baselines, milestones, and goals) for the analysis as soon as
possible.
7.1.1.2. Determine if an EA supporting previous decisions is available. Previous EAs
may help start the process of analyzing the program or operation's goals, assumptions,
alternatives, costs and benefits, outputs, or effectiveness. However, avoid excessive
reliance on a previous EA when the situation or contributing variables have changed.
7.1.1.3. Identify performance measures from the program or operation. It may be helpful
to compare performance measures with related on-going programs.
7.1.1.4. Performance measures are inherently quantitative. If adequate data does not exist
for measuring performance, work with experts to determine adequate measures and begin
accumulating such data. The data must be auditable and reflect significant organizational
missions and functions, satisfaction of customer needs, timely accomplishment of
processes, relevant environmental impacts, or resources consumed or required.
7.1.1.5. Identify and discuss important non-quantifiable benefits, e.g., improvements in
process quality, mission fulfillment, health, safety, morale or security factors.
7.1.1.6. Whenever trends are significantly different from previous estimates, examine
specific reasons for the variance.
7.1.2. Methodology. The following step-by-step procedure can be used to facilitate output
measurement.
7.1.2.1. Step I - Identify All Relevant Outputs. Government programs/projects have at
least one and often two or more objectives. These objectives may be prescribed by law,
established by policy or may be based on historical practice. There should be a causative
relationship between activities, as measured by the output indicator and the resources
consumed (costs). A restatement of resources consumed is not a good way to measure
output. For example, a statement of the man-hours required to do a job is simply another
way of accounting for resources consumed and tells little about what is accomplished.
The difference between costs of competing alternatives, i.e., differential costs or costs
savings, is not an "output" for purposes of program evaluation.
7.1.2.2. Step II - Establish Data Sources. Avoid generating unnecessary work by
determining if adequate information is already available in some form. Consider sources
such as: established reports, opinions and judgments of experts, observations and
tabulations of steps in work process, outside organizations and information centers.

28 AFMAN65-506 29 AUGUST 2011
7.1.2.3. Step III - Collect, Summarize, Evaluate, Validate and Display or Present
Output Data. Select a technique for summarizing the data in a tabular, graphic or other
format as appropriate. Use your own discretion in deciding the method employed and
techniques.
7.1.2.4. Step IV - Compare Output Data With Resources Consumed. In the analysis,
identify the output and costs associated with a particular alternative or activity. If
practicable, construct graphic relationships of output to cost to observe trends developing
or to detect evidence of possible substandard performance. When output data are not
quantifiable, the analysis is more difficult. In such cases, identify project outputs in
precise terms and compare the outputs to the required resources so that the decision
maker can determine the most reasonable course of action.
7.2. Lease-Purchase Decisions. The cost to the Treasury of special tax benefits, if any,
associated with a lease should be added to the cost of the lease. Examples of such tax benefits
might include: highly accelerated depreciation allowances and tax-free financing. Consider
current tax laws applicable to a lessor to determine whether or not an adjustment is appropriate in
a particular EA. Since tax laws change, consult legal and contracting staff. If it is determined that
a particular leased asset enables a lessor to take advantage of accelerated depreciation tax
benefits, increase the contract bid to offset these losses to the Treasury. In most accelerated
depreciation schedules, the amount of the special tax advantage is only the portion of the total
allowance for depreciation which is in excess of "normal" economic depreciation, with the latter
estimated as an annual amount equaling acquisition price divided by economic life, for each year
of an asset's economic life. Attachment 9 contains additional information on lease-purchase
procedures. Attachment 10 discusses analysis of special tax advantages in lease-purchase
analysis.
7.3. Commercial Activities (A-76) Cost Comparisons. These cost comparisons are conducted
in accordance with OMB Circular (OMBC) A-76, Performance of Commercial Activities. Air
Force implementing guidance is contained in AFI 38-203, Commercial Activities Program. Two
other Air Force documents outline Comptroller responsibilities in support of this program:
7.3.1. AFI 65-504, Commercial Activity Cost Comparisons, outlines the objectives of
comptroller cost analysis support, as well as related responsibilities and requirements.
7.3.2. AFMAN 65-507, Comptroller Support of Commercial Activity Cost Comparisons,
provides guidance for A-76 agency cost estimates (ACEs). Specifically, it provides
instructions for comptroller assistance in the development of the ACE.
7.3.3. Public law (10 USC 2461) requires an analysis of the impact on the local economy of
public-private competitions impacting more than 50 DoD civilians. This analysis will be
performed by the financial analysis office servicing the unit or function being competed.
Attachment 12 provides guidance on this analysis.
7.3.4. Attachment 11 provides guidance on performing an analysis to determine whether
providing government property to a contractor is in the best interest of the government.
7.4. Preliminary EAs. AFI 65-501, paragraph 2.2, gives instructions on preliminary EAs. A
format for preliminary EAs is at Attachment 14.

AFMAN65-506 29 AUGUST 2011 29
7.5. Military Construction (MILCON) Design Phase EAs. By a tri-service agreement, EAs
for the design phase of MILCON follow special procedures. See Attachment 17.

30 AFMAN65-506 29 AUGUST 2011
Chapter 8
ECONOMIC IMPACT ANALYSIS
8.1. Introduction. By its very presence in local communities, both in the continental US
(CONUS) and around the world, each Air Force base puts money into the economy of its host
community by spending on locally purchased goods and services. In addition, individuals who
work on base spend their own money in the local community on things like rent, food and
entertainment. The community on an Air Force base is a diverse one, consisting of military units,
official and unofficial supporting activities, exchanges, commissaries, banks, credit unions and
local on-base vendors in a mutually supporting relationship.
8.2. Background. An Economic Impact Analysis (EIA) is an estimate of an installation’s
“economic impact”, or the amount of money it puts into the local economy. For purposes of this
manual, the local economy is also referred to as the "economic area” or “economic impact
region”. An economic area is generally defined as a Metropolitan Statistical Area (MSA),
Primary MSA (PMSA), New England County Metropolitan Area (NECMA), or a non-MSA
county(s). This chapter provides a methodology, guidance, and instructions for estimating an
installation’s economic impact.
8.2.1. While the completion of an EIA by Air Force installations and units is optional, many
installation and unit commanders require one to be performed for their location. Installations
that do produce an EIA must do them using the methodology presented in this chapter, to
ensure the validity of the methodology used as well as for purposes of consistency and
comparability.
8.2.2. SAF/FMCEE has developed an Excel-based spreadsheet named EIA.XLS to assist
producers of EIAs and to facilitate consistency of EIAs across the Air Force. This
spreadsheet is available on the SAF/FMC website, but its use is not required. At a minimum,
results must be broken out in the categories shown. The Center of Expertise (CoE) has
several useful output templates which can be used.
8.3. Methodology. The SAF/FMCEE EIA model requires the input of approximately 50 data
elements in four tables, which are described below. Each table has several categories, each with
several lines. Categories and lines are self-explanatory with a few exceptions. Annualize all
expenditures for payroll, contracts, construction, and other procurements that are spent over
more than one fiscal year. If actual expenditures are not available, distribute the contract amount
for a project or service evenly over the number of years of the contract. Input the annualized
number, not the full contract value. Ensure all tenant organizations are included in the EIA.
8.3.1. Table 1 – Number of Personnel by Classification and Housing Location. This
table will show the number of personnel employed by the base/installation/activity,
regardless of where the servicing personnel or payroll offices are located.
8.3.1.1. The community on an Air Force base consists of many different kinds of people:
military personnel and US government civilian employees, including host nation civilian
employees for OCONUS locations. They work in military units and supporting activities
like dining halls, recreation centers, the exchange and the commissary. Non-military
activities like banks, credit unions, and local vendors round out the Air Force base
community. The intention is to count all these personnel in the EIA.

AFMAN65-506 29 AUGUST 2011 31
8.3.1.2. Personnel categories to include:
8.3.1.2.1. Military personnel. Show the number of military personnel residing on-
base and off-base separately. (Suggested source of data: Servicing
Personnel/Manpower office)
8.3.1.2.1.1. Active duty
8.3.1.2.1.2. Air Force Reserve (AFR)/Air National Guard (ANG)
8.3.1.2.1.3. Non-extended active duty AFR/ANG. This includes all those
personnel who serve one weekend per month and a two-week active duty tour per
year.
8.3.1.2.1.4. Trainees/cadets
8.3.1.2.2. Dependents of active duty military personnel. This may be estimated by
applying the factors from AFI 65-503, Cost and Planning Factors, Table 29-1,
Dependents per Military Sponsor, to the appropriate numbers of military personnel.
8.3.1.2.3. Appropriated fund civilian employees (Suggested source of data: Servicing
Personnel/Manpower office)
8.3.1.2.3.1. General Schedule (GS), Federal Wage System (FWS), and National
Security Personnel System (NSPS) employees
8.3.1.2.3.2. Foreign National Direct Hire (FNDH), Foreign National Indirect Hire
(FNIH), other foreign national employees
8.3.1.2.3.3. Defense Commissary Agency (DeCA) employees. Information may
also be obtained directly from the local commissary manager.
8.3.1.2.3.4. Department of Defense Education Activity (DoDEA) employees.
Information may also be obtained directly from the local DoDEA activity.
8.3.1.2.4. Non-appropriated fund (NAF) civilian employees
8.3.1.2.4.1. Air Force NAF employees. (Suggested source of data: Servicing
NAF Human Resource Office (HRO))
8.3.1.2.4.2. Army & Air Force Exchange Service (AAFES) employees.
Information may be obtained directly from the local AAFES manager.
8.3.1.2.5. Contract Civilians (not elsewhere included). Calculate the number of Full-
Time Equivalent (FTE) contract civilians assigned. The number of FTEs should be
available from the contracting office. Numbers may also be obtained from the
functional organization requiring the contract. If this data is not readily available,
however, an approximation can be made by dividing the total labor cost by cost per
man-year or total labor hours divided by hours per man-year.
8.3.1.2.6. Employees of private businesses on base (e.g., banks, credit unions,
vendors), and other civilians not elsewhere included. Obtain this information directly
from the business or activity.
8.3.2. Table 2 – Annual Payroll by Classification and Housing Location. The many people
who work on Air Force installations, US military personnel and civilians, as well as host

32 AFMAN65-506 29 AUGUST 2011
nation civilian employees, put money into the local economy by spending a part of their pay
off-base on things like rent, restaurants and entertainment, and all the necessities of daily life.
8.3.2.1. Payroll is defined as gross income including basic pay, benefits, and allowances.
Do not include retirement funds accrued or employer contributions that are not
immediately available to the employee.
8.3.2.2. Include annual payroll data for all categories of personnel described in paragraph
8.3.1, for Table 1.
8.3.2.3. Suggested data sources:
8.3.2.3.1. Active Duty Military: Base Financial Services Office (FSO). An alternate
method is to apply the Standard Composite Rates in Tables A19-1 or A19-2 from AFI
65-503 (available on the SAF/FMC page of the AF Portal) to the numbers of assigned
military personnel. Include only the following data elements of the Standard
Composite Factors: Basic Pay, BAH, Incentive Special Pay, and Miscellaneous. Do
not include any accruals, PCS or acceleration factors.
8.3.2.3.2. ANG/Reserve: Budget Officer of the local ANG/Reserve unit. An alternate
method is to apply the composite rates in AFI 65-503, Tables A22-1 and A23-1. For
those civilian factors that include benefits and retirement accruals, remove those
portions of the factor by applying the methodology in paragraph 8.3.2.3.4 below.
8.3.2.3.3. Trainees and Cadets: Training Institution or AFI 65-503, Tables A19-1 or
A19-2. Bases can use an average daily student load if practical for this calculation.
The head count and composite rate method is an alternative source for trainee payroll
data.
8.3.2.3.4. Appropriated Fund Civilians: Base Financial Services Office. An
alternative method is to multiply the total number of civilians by the appropriate
civilian standard composite rate published in AFI 65-503, Table A28-1 or A27-1 as
appropriate. To get the payroll net of retirement accrual and other employer-
sponsored contributions, multiply the composite rate by 1/(1 + the Retirement &
Benefits factor in AFI 65-503, Table A30-1, Application of Civilian Base Pay
Acceleration Factors). Thus, if the AF funded retirement and benefit factor is 38.3%,
take the result of 1/1.383 (1/1.383 =.7231) and multiply that result by the composite
rate to get the payroll net of retirement accrual and other employer-sponsored
contributions. For commissary personnel payroll, contact the local base commissary
manager.
8.3.2.3.5. Air Force NAF employees: Base NAF Human Resource Office (HRO).
8.3.2.3.6. Army & Air Force Exchange Service (AAFES) employees. Payroll
information may be obtained directly from the local AAFES manager.
8.3.2.3.7. Employees of private businesses on base (e.g., banks, credit unions,
vendors), and other civilians not elsewhere included. Obtain payroll information
directly from the business or activity.
8.3.2.3.8. Tenants: If the base FSO is unable to provide payroll data, the individual
tenant units may be able to do so. An alternate method would be to use the cost
factors in AFI 65-503.

AFMAN65-506 29 AUGUST 2011 33
8.3.2.4. Be careful to not double-count payroll in the "Contract Civilians" line in Table 3.
If the payroll of contract civilians is part of a contract amount reported in Table 3,
Expenditures for Construction, Services, and Procurement of Materials, Equipment, and
Supplies, do not enter the payroll amount on this line.
8.3.3. Table 3 - Expenditures for Construction, Services, and Procurement of
Materials, Equipment, and Supplies. This is off-base spending by on-base units,
organizations and activities. Each Air Force base puts money into the economy of its host
community by spending on locally purchased materials, supplies, equipment and contracts.
The base also spends locally for services and construction contracts as well as utilities and
countless other items, large and small. In addition to spending by official Air Force units,
recreational and other supporting organizations also make purchases off-base, as do on-base
vendors, banks, and many other unofficial on-base activities.
8.3.3.1. Construction. Include the following construction-related expenditures as
appropriate (suggested source: Base Civil Engineer):
8.3.3.1.1. Military Construction (MILCON) Program.
8.3.3.1.2. Military Family Housing (MFH) Construction.
8.3.3.1.3. Military Family Housing Operations and Maintenance (O&M).
8.3.3.1.4. Construction related O&M. Include only those costs associated with
contract construction (i.e., minor construction, architectural and design fees, and real
property maintenance contracts).
8.3.3.1.5. Non-Appropriated Fund (NAF) Construction.
8.3.3.2. Services. Include the following service-related contract expenditures as
appropriate (suggested source: contracting office):
8.3.3.2.1. O&M service contracts: When services cannot be distinguished from other
procurements, the analyst may rely on contracting office estimates.
8.3.3.2.2. Medical service contracts.
8.3.3.2.3. NAF service Contracts.
8.3.3.3. Materials, Equipment and Supplies Procurement. To the extent possible,
include only that portion of procurement spending that was done on the local economy.
One suggested method (for Air Force appropriated-fund activities on base) is to perform
a Commanders' Resource Integration System (CRIS) retrieval of all expenses (AEP)
incurred in the fiscal year under study, by element of expense and investment code
(EEIC) (and by Resource Center/Cost Center (RC/CC), if you find it helpful). Go through
the list and exclude those items you know were not spent locally, like purchases from the
Air Force Stock Fund, and include the rest as local spending. If appropriate in the
analyst’s judgment, the analyst may assume expenditures were made locally and include
them in your estimate. Based on location and circumstances, better information may be
available in contracting and civil engineering databases. This is a difficult category of
local spending to estimate, and the analyst must exercise their best judgment. Include the
following procurement expenditures as appropriate:
8.3.3.3.1. O&M procurement. Suggested source: Base FSO or budget office.
34 AFMAN65-506 29 AUGUST 2011
8.3.3.3.2. DeCA. Information on local procurements may be obtained directly from
the local commissary manager. If unable to determine how much of commissary
spending is local, the analyst may make a reasoned estimate.
8.3.3.3.3. AAFES. Information may be obtained directly from the local AAFES
manager. If unable to determine how much of AAFES spending is local, the analyst
may make a reasoned estimate.
8.3.3.3.4. DoDEA. Information may be obtained directly from the local DoDEA
activity. If unable to determine how much of DoDEA spending is local, the analyst
may make a reasoned estimate.
8.3.3.3.5. Medical. Ensure that any local procurement spending of Air Force funds
in the medical appropriation are included. The local medical facility may also help
you determine the amount of local Civilian Health and Medical Program of the
Uniformed Services (CHAMPUS) spending was done on the local economy.
8.3.3.3.6. NAF. Information on local procurements may be obtained directly from
the local NAF resource management office. If unable to determine how much of NAF
spending is local, the analyst may make a reasoned estimate.
8.3.3.3.7. Other Spending
8.3.3.3.7.1. Banks. Information on local procurements may be obtained directly
from the local bank manager. If unable to determine how much of bank spending
is local, the analyst may make a reasoned estimate.
8.3.3.3.7.2. Credit Unions. Information on local procurements may be obtained
directly from the local credit union manager. If unable to determine how much of
credit union spending is local, the analyst may make a reasoned estimate.
8.3.3.3.7.3. TDY/Travel. This item is intended to capture the amount of
spending done locally by individuals TDY to the base under study. One suggested
method is to obtain the number of on-base and off-base TDY bed nights from the
base Services office and perform the following calculations (sum together to get
the estimated total):
8.3.3.3.7.3.1. For TDY visitors staying in lodging on-base (assumes the
traveler spends 50% of their meals and incidental expenses (M&IE) allowance
off-base):
# On-base TDY bed-nights x local M&IE rate x 0.5
8.3.3.3.7.3.2. For TDY visitors staying in lodging off-base (assumes the
traveler spends 75%
of their M&IE allowance off-base):
# Off-base TDY bed-nights x (max. lodging rate + (0.75 x M&IE rate))
8.3.3.3.7.4. Education
8.3.3.3.7.4.1. Impact Aid. The Federal Government provides financial
assistance to local school districts in the form of education impact aid funds
(IAW the Impact Aid law, now Title VIII of the Elementary and Secondary

AFMAN65-506 29 AUGUST 2011 35
Education Act of 1965 (20 U.S.C. § 7701 et. seq.)) to assist with the provision
of educational services to children of Federal employees. An allocation should
be used if there is more than one military installation in the economic area
(e.g., based on military and civilian personnel assigned to the installation).
Suggested sources of information: local school district, or US Dept of
Education, Impact Aid Programs (ESA), 400 Maryland Avenue, SW,
Washington, D.C. 20202. Contact telephone numbers are: 202-260-3858, 202-
260-2304, or 202-205-8724.
8.3.3.3.7.4.2. Tuition Assistance. The base Education Office may also be able
to provide information.
8.3.4. Table 4 - Estimate of Number and Dollar Value of Indirect Jobs Created. Also
known as Secondary Effects, this reflects how money spent by base organizations and
individuals ripple through the local economy, increasing the income of local businesses,
which in turn allow them to hire new employees and do more spending of their own at their
suppliers and other businesses. We measure this additional economic impact by estimating
the number of indirect jobs created as a result of local base spending, and multiplying that by
the estimated average salary in the local area.
8.3.4.1. Use the Excel file "eiamult.xls", Title: "Indirect Job Multipliers for Air Force
Installations", available on the SAF/FMC Economic Analysis Home Page. Multipliers
were developed based on the size of the employment base for each region surrounding an
installation and the general mission of the base/installation/activity.
8.3.4.2. If the metropolitan statistical area (MSA) for your base or installation is not
listed in this table, use Table 8.1, Other Indirect Jobs Multipliers, to determine the
appropriate multiplier to use, based on the level of employment in the local region.
Analysts may use a different multiplier if they can get a better one.
Table 8.1. Other Indirect Jobs Multipliers.
TOTAL
EMPLOYMENT
IN THE REGION MILITARY CIVILIAN ANG/RESERVE
<70,000 0.29 0.43 0.13
70,000 - 150,000 0.35 0.44 0.15
150,001 - 450,000 0.41 0.55 0.16
>450,000 0.50 0.63 0.21
8.4. Average Annual Salary Data. The Bureau of Labor Statistics has discontinued
publication of the following three annual press releases: State and Industry Annual Average Pay,
Metropolitan Statistical Area Annual Average Pay, and Employment and Wages in Large
Counties. Average wage data by county, however, can be found at:
http://www.bls.gov/news.release/cewqtr.toc.htm. Analysts may choose to obtain better
average annual pay for the local area from state economic development agencies or a local
chamber of commerce.

36 AFMAN65-506 29 AUGUST 2011
8.5. Alternative Methodologies. If bases desire to use a different methodology for their EIA, a
waiver should be requested through the MAJCOM to SAF/FMCE. Requests should include a
detailed, documented explanation of the proposed method.

AFMAN65-506 29 AUGUST 2011 37
Chapter 9
ANNUAL ECONOMIC ANALYSIS REPORT
9.1. Annual Economic Analysis Report (RCS: HAF-FMC [A] 9501): Each MAJCOM, direct
reporting unit (DRU), field operating agency (FOA), and similar Air Force organization will
prepare and forward a copy of an annual report concerning their economic analysis program to
SAF/FMCE by 1 December annually. This report will provide information on economic analysis
activity in the previous fiscal year. See Attachment 15 for format.
JAMIE MORIN
The Assistant Secretary of the Air Force for
Financial Management and Comptroller

38 AFMAN65-506 29 AUGUST 2011
Attachment 1
GLOSSARY OF REFERENCES AND SUPPORTING INFORMATION
References
10 USC 2461, (Public-Private Competition)
AFMAN 32-1089, Air Force Military Construction and Family Housing Economic Analysis
Guide, 1 Aug 96
AFI 38-203, Commercial Activities Program, 20 Jun 08
AFI 65-501, Economic Analysis
AFI 65-502, Inflation, 21 Jan 94
AFI 65-504, Commercial Activity Cost Comparisons, 6 Nov 08
AFI 65-503, US Air Force Cost and Planning Factors, 4 Feb 94
AFMAN 65-507, Comptroller Support of Commercial Activity Cost Comparisons, 6 Nov 08
AFI 65-509, Business Case Analysis, 19 Sep 08
AFMAN 65-510, Business Case Analysis Procedures, 22 Sep 08
DoDI 7041.3, Economic Analysis for Decisionmaking, 7 Nov 95
DoDI 5000.02, Operation of the Defense Acquisition System, 8 Dec 08
Elementary and Secondary Education Act of 1965 (20 U.S.C. § 7701 et. seq.)
FAR Part 45, Government Property, 14 Jun 07
IRS Pub 534, Depreciating Property Placed in Service Before 1987, Nov 1995
NIST Handbook 135, Life-Cycle Costing Manual for the Federal Energy Management.
Program, 1995 (supplemented annually)
OMB Circular A-76, Performance of Commercial Activities, 29 May 03
OMB Circular A-94, Guidelines and Discount Rates for Benefit-Cost Analysis of Federal
Programs, 29 Oct 92
Adopted Form
AF Form 847, Recommendation for Change of Publication
Abbreviations and Acronyms
ACRS—Accelerated Cost Recovery System
AFWCF—Air Force Working Capital Fund
AIS—Automated Information System
ANG—Air National Guard
BCA—Business Case Analysis
BRAC—Base Realignment and Closure

AFMAN65-506 29 AUGUST 2011 39
BX—Base Exchange
CA—Commercial Activity
CBA—Cost Benefit Analysis
CE—Civil Engineer
DECA—Defense Commissary Agency
EA—Economic Analysis
EIA—Economic Impact Analysis
FSO—Financial Services Office
FY—Fiscal Year
GFE—Government Furnished Equipment
GS—General Schedule
HRO—Human Resources Office
IAW—In Accordance With
INVS—Internal Needs Validation Study
IRR—Internal Rate of Return
LCC—Life Cycle Cost
LCCID—Life Cycle Cost in Design
MAJCOM—Major Command
MFH—Military Family Housing
MPF—Military Personnel Flight
MILCON—Military Construction
MSA—Metropolitan Statistical Area
NAF—Non-Appropriated Funds
OCR—Office of Collateral Responsibility
OMB—Office of Management and Budget
OPR—Office of Primary Responsibility
OSD—Office of Secretary of Defense
PE—Program Evaluation
PIF—Productivity Investment Funds
PMSA—Primary Metropolitan Statistical Area
PSM—Personnel Systems Management
UAC—Uniform Annual Cost

40 AFMAN65-506 29 AUGUST 2011
WB—Wage Board
Terms
Alternative—One possible method of obtaining the stated project/program objective. The status
quo, or an upgrade to the status quo, should generally be the first alternative considered in the
analysis.
Benefits—Objective or subjective measures of an alternative's value to the United States. When
a dollar value cannot be placed on program or project benefits, other objective measures may be
available and useful for comparing alternatives.
Benefits Analysis—Analysis to identify, measure and evaluate the benefits for each proposed
alternative.
Commercial Activities—Activities that provide products or services obtainable (or obtained)
from a commercial source. Commercial activities may be operated by Air Force military or
civilian personnel, or by contractor personnel.
Constant Dollar Value or Costs or Benefits—Value, cost, or benefits measured based on
constant purchasing power of the dollar, and does not include the effects of inflation.
Constraints—Limitations of any kind to be considered in planning, programming, scheduling,
implementing or evaluating programs.
Cost-Benefit Analysis or Cost-Effectiveness Analysis—See Economic Analysis.
Current Dollar Value or Costs or Benefits—Value, cost, or benefit measures which include
estimates of all expected future price changes (inflation).
Discount Rate—The interest rate used to translate future costs or benefits into Present Value. It
is a measure of the time value of money.
Discounting—The process of using the discount rate to determine the present value of costs.
(Elements of cost streams are multiplied by their corresponding discount factors to yield
discounted costs.)
Economic Analysis—A systematic approach to the problem of choosing how to use scarce
resources. It reveals the present value of the monetary costs and benefits associated with all
alternatives under consideration, and provides as accurate and complete a picture as possible of
nonmonetary costs and benefits.
Economic Life—The period of time over which the benefits to be gained from a project may
reasonably be expected to accrue to the DOD. It is the shortest of physical, technological or
mission life.
Effectiveness—Ability of a project to meet objectives.
Efficiency—The amount of output per unit of input. Alternatively, it is the quality whereby one
alternative uses less input per unit of output than other alternatives.
Feasibility Study—A study of the applicability or practicability of a proposed action or plan.
Historical Cost—The cost of any item, based on actual dollar (or equivalent) outlay, ascertained
after the fact.

AFMAN65-506 29 AUGUST 2011 41
Imputed Value—The value assigned to assets or transactions that are not explicitly priced (e.g.,
transfers of assets between government programs). Estimates of the dollar value of imputed costs
can be obtained from estimating the undepreciated (i.e., remaining) value of assets, if those
assets have an alternate use.
Induced Costs—Those costs that execution of a given project or program alternative impose on
another Air Force or government program. For example, if a proposal to move an activity into
facilities currently occupied by a second activity causes expenditures by the second activity for
real property acquisition or improvement, then those expenditures are induced costs that should
be taken into account in the decision to move the first activity.
Investment Costs—Those program costs required beyond the development phase to introduce a
new capability into operational use; to procure initial, additional, or replacement equipment for
operational forces; or to provide for major modifications of an existing capability. They exclude
research, development, test and evaluation, military personnel, and operation and maintenance
appropriation costs.
Life-Cycle Cost—The total cost to the government for a system over its full life, including the
cost of development, procurement, operation, support, and disposal.
Mission Life— The estimated number of years that the need for an asset is anticipated, before
the mission either changes or is no longer required.
Objective Statement—A statement of what a project or program seeks to accomplish. In
economic analysis, objectives are to be stated such that there is no bias toward a particular
alternative.
Opportunity Cost—The cost of a resource, measured in terms of its value in the highest
alternate use.
Output—Goods and services produced or mission accomplished.
Physical Life— The number of years an asset can physically be used before it wears out.
Present Value— The value today of a future amount or series of future amounts (also called Net
Present Value), discounted to reflect the time value of money. Present value comparisons are
used in economics to meaningfully compare different cash flows. Calculated by multiplying the
net cost figure for each year by the corresponding discount factor, and summing the results.
Program Evaluation—Analysis of ongoing actions to determine how well the stated objectives
are being accomplished. Program evaluation studies entail a comparison of actual with intended
performance.
Real Property—Land, buildings, structures, utility systems, improvements. Includes equipment
attached to and made part of buildings and structures (such as heating systems) but not movable
equipment (such as plant equipment).
Recurring Costs—Expenses incurred repeatedly, either annually, or periodically. An annual
recurring cost is one incurred every year, like personnel or utilities. A periodic recurring cost is
one incurred in a period that is other than one year long, like replacement of heating, ventilation
and air conditioning (HVAC) equipment that may be replaced every 8 years, or a roof that needs
replacing every 15 years.

42 AFMAN65-506 29 AUGUST 2011
Residual Value—The expected value of an asset at any point in time before the end of its
economic life.
Risk—The likelihood of incurring loss or misfortune.
Sensitivity Analysis—Examination of the effects obtained by changing the direction and
magnitude of assumptions, key variables or other factors in an analysis.
Sunk Cost—The sum of past expenditures or irrevocably committed funds related to a project.
Such costs are generally not relevant to decision making as they reflect previous rather than
present choices.
Technological Life—The estimated number of years before improved technology will make an
existing or proposed asset obsolete.
Terminal Value—The expected value of assets at the end of their economic life.
Uncertainty— Having less than 100% assurance of knowing something is true or correct.
Uniform Annual Cost—The average cost per year for a given alternative. It is calculated by
dividing the total net present cost (for the full-time life cycle) by the sum of the discount factors
of the years in which benefits accrue (economic life).

AFMAN65-506 29 AUGUST 2011 43
Attachment 2
REQUEST FOR WAIVER FROM THE ECONOMIC ANALYSIS REQUIREMENT
A2.1. Use the format below to request a waiver from the economic analysis requirement as
stated in AFI 65-501, paragraph 1.2.1. More details about EA waiver requests can be found in
AFI 65-501, paragraph 1.2.3.
REQUEST FOR WAIVER FROM AN ECONOMIC ANALYSIS
Date of Request: _____________
Project Title:
___________________________________________________________________________
Requesting Organization: _(Functional
Organization)____________________________________________
We request a waiver from the economic analysis requirement on this project for the following
reason(s):
____ a. Project cost or benefits to be derived do not warrant the level of effort required to
prepare a full and complete analysis. Supporting justification is attached.
____ b. There is only one method possible to accomplish the objective. Supporting justification
and documentation is attached.
____ c. The project and the method to accomplish it was directed by ___________ as shown in
the attached documentation.
____ d. The project results from legislation which also directs the method of accomplishment, as
documented
in the attachment.
____ e. The project corrects problems or violations involving health, safety, fire protection,
pollution, or security which are serious, urgent and hazardous, and performing an economic
analysis would unreasonably delay the implementation of this project. Supporting justification
and documentation is attached.
____ f. Other (List specific reasons why analysis was not prepared).
Base/Installation-Level Coordination:
Base Functional Office Requestor: (Signature)
(Name/Office Symbol/DSN/Date)
Base-Level Financial Analysis: (Signature)
(Name/Office Symbol/DSN/Date)
Base-Level FM: (Signature)

44 AFMAN65-506 29 AUGUST 2011
(Name/Office Symbol/DSN/Date)
Other Base-Level Office: (Signature)
(As Applicable) (Name/Office Symbol/DSN/Date)
MAJCOM-Level Concurrence:
MAJCOM Financial Analysis Office: (Signature)
(Name/Office Symbol/DSN/Date)
MAJCOM Functional Office (Signature)
(Name/Office Symbol/DSN/Date)
Other MAJCOM Office (Signature)
(As Applicable) (Name/Office Symbol/DSN/Date)
SAF/FMCE Concurrence: (Signature)
(Name/Office Symbol/DSN/Date)

AFMAN65-506 29 AUGUST 2011 45
Attachment 3
EXECUTIVE SUMMARY FORMAT REQUIREMENT
A3.1. Use the format below to request when creating an executive summary for an economic
analysis, as required by paragraph 1.2.1 of this manual.
EXECUTIVE SUMMARY
Installation: e.g., Blue AFB, State (For Overseas: Country)
Project Title (if applicable, include project number)
Scope of Project: (quantify to extent possible)
Alternatives Considered: (briefly describe; for any dismissed as infeasible, briefly explain)
Alternative
New
Funding
Required
Total Life
Cycle
Cost
Weighted
Benefit
Score
Cost/
Benefit
Ratio
1
2
3
Discounted Life Cycle Costs of the Alternatives: (state discount rate used and whether constant
or inflated
dollars were used, for constant dollars, show year, e.g., constant FY12$)
Discussion of Benefits, Comparison of Alternatives and Recommendation: (discuss benefits and
costs of each alternative and reasons for the recommended alternative)

46 AFMAN65-506 29 AUGUST 2011
Attachment 4
CERTIFICATE OF SATISFACTORY ECONOMIC ANALYSIS FORMAT
REQUIREMENT
A4.1. Use the format below to request when creating an executive summary for an economic
analysis, as required by paragraph 1.2.1 of this manual.
CERTIFICATE OF SATISFACTORY ECONOMIC ANALYSIS
Installation/MAJCOM:___________________________________________________________
___
Project
Title:_______________________________________________________________________
Project
Number:____________________________________________________________________
Project
Cost:_______________________________________________________________________
An economic analysis has been prepared for this project. The following alternatives have been
considered:
1.
2.
3.
Summary of analysis results: (Briefly explain the results of the analysis.)
Financial Management Certification: This economic analysis follows the instructions in AFI
65-501, Economic Analysis, and the procedures in AFMAN 65-506. Significant changes to
project scope, major assumptions, or estimated costs will invalidate this certificate and require
revision of this analysis. The recommended alternative is the best course of action, based on our
overall assessment of costs and benefits.
Functional Office Certification: The assumptions, reasoning and functional technical
assessments in this EA are sound and are in accordance with all applicable Air Force Instructions
and Manuals.
Certification at Base/Installation-Level:
Base Level Financial Analysis: (Signature)
(Name/Office Symbol/DSN/Date)
Base-Level FM: (Signature)
(Name/Office Symbol/DSN/Date)
Base Functional Office: (Signature)
(Name/Office Symbol/DSN/Date)

AFMAN65-506 29 AUGUST 2011 47
Other Base Level Office: (Signature)
(As Applicable) (Name/Office Symbol/DSN/Date)
Coordination at MAJCOM Level:
MAJCOM Financial Analysis Office: (Signature)
(Name/Office Symbol/DSN/Date)
MAJCOM Functional Office: (Signature)
(Name/Office Symbol/DSN/Date)
Other MAJCOM Office: (Signature)
(As Applicable) (Name/Office Symbol/DSN/Date)

48 AFMAN65-506 29 AUGUST 2011
Attachment 5
ECONOMIC ANALYSIS REVIEW GUIDE
A5.1. This is a guide for reviewers and certifiers of EAs. It’s like a checklist, but the intention is
for it to go beyond the mere listing of items to check. It’s intended to provide a narrative
description, in a user-friendly tone, of the thought processes behind an EA review, and is
organized consistent with the organization of an EA, such that a reviewer can go through the
guide as he/she goes through the EA.
A5.2. It will help to begin by describing what Economic Analysis is:
A5.2.1. An EA is a resource allocation decision-making tool which analyzes competing
ways of reaching an objective by examining the costs, benefits and risks of each alternative.
It is sometimes also called a Cost-Benefit Analysis.
The Elements of an Economic Analysis:
i. Certificate of Satisfactory Economic Analysis
ii. Executive Summary
1. The Objective
2. Alternatives
3. Assumptions
4. Cost Analysis
5. Benefit Analysis
6. Sensitivity Analysis
7. Comparison of Alternatives and Recommendation
Attachment: Supporting Documentation
A5.2.2. Items 1 thru 7 are the traditional elements of an EA. The other items are things you
can (should) expect to see in an EA package that comes to you for coordination/approval.
A5.3. Certificate of Satisfactory Economic Analysis: Normally this is the first page of a
typical EA package. In the Certificate:
A5.3.1. The FM certifier certifies that the EA complies with the guiding regulations (AFI
65-501 and AFMAN 65-506) and that it reasonably reflects the costs and benefits of the
alternatives presented. It is the responsibility of financial management officials to determine
the recommendation in an EA, and are solely responsible for the appropriateness of that
recommendation.
A5.3.2. The functional OPR certifier certifies that the assumptions, reasoning and functional
technical assessments in the EA are sound and are in accordance with all Air Force
Instructions and Manuals applicable to their area of technical expertise.
A5.3.2.1. What to look for: The certificate should follow the format shown in AFMAN
65-506, Attachment 4.
A5.3.2.1.1. It should state the Installation name, MAJCOM, and Project Title.
A5.3.2.1.2. It should state all alternatives that were considered in the analysis, even if
any of them were deemed infeasible.

AFMAN65-506 29 AUGUST 2011 49
A5.3.2.1.3. It should state which alternative is recommended.
A5.3.2.1.4. It should include this statement, which describes what the FM certifier is
certifying about the analysis: “This economic analysis follows the instructions in AFI
65-501, Economic Analysis, and the procedures in AFMAN 65-506. Significant
changes to project scope, major assumptions, or estimated costs will invalidate this
certificate and require revision of this analysis.”
A5.3.2.1.5. It should also include this statement, which describes what the functional
certifier is certifying about the analysis: “The assumptions, reasoning and functional
technical assessments in this EA are sound and are in accordance with all applicable
Air Force Instructions and Manuals. The recommended alternative is the best course
of action, based on our overall assessment of costs and benefits.”
A5.3.2.1.6. There should be signature blocks for the installation FMA, FM, and
functional office. For simple administrative reasons, it may be simpler to do
MAJCOM certification on a separate certificate, but if not, the certificate should have
signature blocks for MAJCOM FMA and functional offices.
A5.4. Executive Summary: This is the part which briefly summarizes the EA and its results.
A5.4.1. What to look for:
A5.4.1.1. It should follow the format in AFMAN 65-506, Attachment 3, and must
include the Summary of Analysis Results table as found there and in AFMAN 65-506,
Figure 1.1.
A5.4.1.2. Make sure the project title and number is shown.
A5.4.1.3. Make sure the discount rate is correct. Using an incorrect discount rate is a
common (and usually minor) error. The SAF/FMC page on the AF Portal has the most
recent discount rates.
A5.4.1.4. A good Executive Summary will generally show the start year of the analysis,
what year dollars the analysis was done in, and the length of the period of analysis.
A5.4.1.5. Check whether the EA is done in Constant Dollars or Current Dollars. EAs are
normally done in Constant Dollars (no annual inflation) of the first year of the analysis. If
your analysis is done in Current Dollars (which DO reflect annual inflation), there should
be a good reason, and it should be stated early in the analysis.
A5.5. The Objective: should state the requirement that is to be fulfilled by any of the
competing alternatives.
A5.5.1. What to look for:
A5.5.1.1. The objective stated should be the objective of the program or project, not of
the analysis. It should NOT begin with, “The objective is to analyze…” It should state the
requirement that each alternative is designed to fulfill, like “The objective is to provide
family housing that meets Air Force standards to 350 military families at Yodel AFB.”
A5.5.1.2. It should not be so narrow as to eliminate any reasonable alternatives.

50 AFMAN65-506 29 AUGUST 2011
A5.5.1.3. It should not be slanted such that the EA that follows will naturally lean
towards preferring any particular alternative (AKA “pre-selection”), nor should it
unreasonably rule out others.
A5.6. Alternatives: This section of the EA should list and describe all realistic methods of
accomplishing the objective.
A5.6.1. What to look for:
A5.6.1.1. If any of the alternatives are infeasible, this is the place to say so, with a
convincing explanation. You subsequently will not consider or analyze these alternatives
any further.
A5.6.1.2. It’s important to include ALL alternatives so later readers/reviewers will know
that all reasonable alternatives were considered, and if any are infeasible, they’ll know
why.
A5.6.1.3. There should be an explanation of each alternative that describes exactly what
would have to be done to implement the alternative if it were to be selected, and it should
be written as if the reader were unfamiliar with the project. At a minimum, you want to
include facts about things that will drive costs in your EA.
A5.6.1.3.1. For instance, don’t make subsequent readers/reviewers wonder why the
analyst included costs for some new material handling equipment in alternative 2 of
your Supply Warehouse EA, and not in any other alternatives. The description of this
alternative should explain, for example, that this equipment would be required only if
the warehouse function were to relocate to a different facility, due to the different
configuration of that facility.
A5.6.1.3.2. Likewise, don’t make the reviewer wonder why the analyst included
resident relocation costs in just 2 of 4 alternatives in your Military Family Housing
EA. If you explain in each alternative, for instance, that the New Construction
alternative would require everyone to move out at once, but the Renovation
alternative would allow the building to empty out by attrition as different parts are
worked on, the reviewer wouldn’t have to go back to ask the question.
A5.7. Assumptions: These are constraints, ground rules, criteria, and variables which influence
costs and benefits. This will include things like operational readiness dates, base year of the
analysis, discount rate used, energy-saving efficiencies, future energy prices, frequencies of
needed repairs, workload, useful economic life of equipment, etc. Each EA will have unique
assumptions.
A5.7.1. What to look for:
A5.7.1.1. Reviewing/evaluating this section takes some judgment and attention to detail.
Make sure that anything assumed in this section is actually reflected in the cost or benefit
analysis later on.
A5.7.1.1.1. For instance, if an assumption states that, under the Renovation
alternative of a MFH EA, renovation would occur over a period of three years, flip
back to the cost spreadsheets and make sure the costs are laid in over a three year
period.

AFMAN65-506 29 AUGUST 2011 51
A5.7.1.2. An assumption which states that your data is accurate and complete is
unnecessary, and actually casts doubt on the reliability of your data, since it gives the
reader the feeling that you are so unsure of your data that you have to make an
assumption that it is good enough to use.
A5.7.1.3. Never allow the analyst to assume away costs, especially significant ones, and
certainly not without a good explanation. One cannot simply assume away costs that may
be inconvenient or difficult to estimate. A red flag should go up any time you see
something like this. Depending on the reasons given, it may be justified. Just make sure it
passes the sanity check. By the same token, make sure all assumptions are reasonable and
don’t unfairly penalize one or more alternatives.
A5.7.1.4. Some uncertainty is implicit in many assumptions. Later on, the Sensitivity
Analysis will examine the affect that major uncertainties have on the analysis and its
recommendation.
A5.8. Cost Analysis: This is an estimate of the costs associated with each alternative. In the
minds of many, this is what they think of when they think of an EA. When you read this section,
double-check the accuracy of the calculations and make sure that the calculated numbers are the
same ones that go into the totals and the discounting calculations. It is not uncommon that these
numbers will not be the same due to repeated changes and updates. That’s one reason an analyst
should always read through the EA one last time from beginning to end before forwarding it for
review and certification. That’s what the reviewer does, and that’s how they catch errors. Since
the analyst is so close to the EA it’s easier for them to make such mistakes.
A5.8.1. What to look for:
A5.8.1.1. All EAs should be in constant dollars of the first year of the analysis. If there is
some extraordinary reason for it being in current dollars, the reason should be stated early
in the EA, probably under Assumptions. Exceptions to this rule can be found in AFMAN
65-506, paragraphs 3.3.4.4 and 3.3.4.5.
A5.8.1.1.1. A CONSTANT DOLLAR is a non-inflated dollar whose value is the
same every year of the analysis. In a constant dollar analysis, you’ll see that the cost
of a certain cost element (assuming no other changes to that element) is the same in
the first year of the analysis as it is in the last year.
A5.8.1.1.2. A CURRENT DOLLAR reflects annual inflation; and its value is
different for every year of the analysis.
A5.8.1.2. The costs for each alternative should be estimated as if that alternative was
actually going to be implemented, and ALL relevant costs should be included (with
exceptions noted below).
A5.8.1.3. If the analyst prepared the EA using an EA software application, then it’s safe
to assume all the discounting calculations were done correctly. If not, spot-check the
calculations, including calculations of the discount factors from the discount rates (or
double-check ALL calculations, based on your gut feeling as to whether you think this is
necessary).
A5.8.1.3.1. Ensure that midyear discount factors were used (vice End-of-Year
factors). AFMAN 65-506, para 3.3.5.3.2, states midyear factors should be used unless
52 AFMAN65-506 29 AUGUST 2011
there is a good reason to use End-of-Year factors. Any use of End-of-Year or other
factors should be explained in the Assumptions section.
A5.8.1.4. Common Cost vs. Differential Cost: If there is a certain cost element (for
instance, personnel cost or some small sub-contracted task) that is identical (in both
amount and timing) for all alternatives, then this cost need not be included in the EA.
Since this cost is Common to all alternatives, there is no value added to comparing that
cost across alternatives, although there’s no problem with including it, and it often is.
Some analysts like to include it because Commanders and others may wonder where a
certain (obvious) cost element is when they read the EA.
A5.8.1.4.1. A Differential Cost represents the difference in the cost of a certain cost
element between two or more alternatives. For instance, say that in Alternative 1, the
cost for 10 laborers is $100K. Alternative 2, however, requires 12 laborers at an
annual cost of $120K. The annual differential cost of labor in this instance is $20K. It
is acceptable to include only differential costs in an EA, but to avoid confusion for
those readers who may be unfamiliar with this concept, its use should be explained in
the Assumptions section.
A5.8.1.5. A Sunk Cost is any cost incurred in the past, to include future costs that have
been irrevocably committed in the past. These costs should never be included in an EA.
These costs will be incurred regardless of any decision the decision-maker makes. We
perform EAs to help decision-makers make choices about resource allocation, and any
costs beyond the control of the decision-maker should not play a part in his/her decisions.
A5.8.1.6. Costs incurred in foreign currency: These costs must always be converted
at the known or estimated exchange rate of the base year of the analysis (NOT the FCFA
budget rate). Using the FCFA budget (exchange) rate will help you calculate the dollar
costs to your individual unit, but NOT costs to the US government (which is what the EA
should include). SAF/FMC can provide you with foreign currency exchange rate
projections. The Assumptions section is the best place to explain what exchange rate is
being used and where it came from.
A5.8.1.7. The sum of the discounted annual costs of each alternative is known as the Net
Present Value (NPV). At a minimum, the EA should show a comparison of the NPV of
each alternative.
A5.9. Benefit Analysis: Benefits are what you get for the costs that go into an alternative.
These are usually subjective in nature and generally don’t lend themselves to quantifiable
analysis. Lacking a common numeric basis of comparison, the best we can do is to attempt to
determine the comparative desirability of each alternative relative to each benefit. We can also
attempt to measure the magnitude of the differences in desirability between alternatives. Thus,
while not measuring these benefits in an objective, quantifiable way, we can still establish a basis
of comparison.
A5.9.1. This is also a good time to point out that an EA does not always have to recommend
the lowest cost alternative (and often they don’t), but if they don’t, the reason has to be in the
Benefit Analysis. It should be compelling and should withstand scrutiny at all levels. Never
forget that an EA consists of both a Cost Analysis and a Benefit Analysis; in theory they are
co-equal.

AFMAN65-506 29 AUGUST 2011 53
A5.9.2. What to look for:
A5.9.2.1. A Benefit Analysis should have at its core a Benefit Matrix similar to the
example below:
Figure A5.1. Sample Benefit Matrix.
A5.9.2.1.1. Each benefit should have a brief separate paragraph describing what the
benefit is and what is being measured.
A5.9.2.1.2. The Weight shows how important each benefit is relative to the others.
A5.9.2.1.3. The Weight multiplied by the Score equals the Weighted Score shown in
parentheses. These are summed at the bottom to show which alternative has the
overall highest weighted benefit score
A5.9.2.2. The benefits are best scored by a group of qualified stakeholders and POCs
from the relevant functional areas. Scoring and weighting the benefits using the results of
a survey of some sample of the base population is an approach fraught with hidden
pitfalls and it’s best to avoid it. Besides, it’s a lot more work.
A5.9.2.3. Benefits may be (and usually are) different from one EA to the next.
A5.10. Sensitivity Analysis: A Sensitivity Analysis tests the effect that any uncertain
assumptions have on the cost-ranking of alternatives. We test this by varying uncertain costs plus
or minus a certain percentage in applicable alternatives and comparing the resulting Net Present
Values. If there is no change in the rankings, you can safely say that the EA is not sensitive to the
uncertain assumptions over the range of variation analyzed.
A5.10.1. What to look for:
A5.10.1.1. Any assumption that has a great deal of uncertainty associated with it should
be the subject of a Sensitivity Analysis. Cost elements that constitute a high percentage of
total life cycle costs should also be considered for a Sensitivity Analysis.
A5.10.1.2. The EA should describe what was done in the Sensitivity Analysis and, at
least briefly, state its results. It’s best to do this in the Comparison of Alternatives &
Recommendation section. Analysts often rely solely on printed charts and don’t take the
time to explain what they mean.

54 AFMAN65-506 29 AUGUST 2011
A5.10.1.3. If the NPVs of the two lowest-cost alternatives are very close, a Sensitivity
Analysis should be done on the most uncertain cost element(s) of the alternatives, and if
it shows a change in the cost-ranking of alternatives, this should be pointed out in the
Comparison of Alternatives & Recommendation section.
A5.11. Comparison of Alternatives & Recommendation: This is where the analyst
summarizes and ties together the results of the Cost Analysis, Benefit Analysis, and Sensitivity
Analysis, and puts forth a recommendation. Often, a Cost/Benefit Ratio is calculated.
A5.11.1. What to look for:
A5.11.1.1. Make sure that this section actually has a recommendation, as well as an
explanation of why it is the best choice.
A5.11.1.2. Make sure that the recommendation in this section is the same as the
recommendation in the Executive Summary and the Certification. Sometimes, changes
made in one of these don’t catch up to the other sections before it goes out.
A5.11.1.3. If the recommendation is not the lowest-cost alternative, make sure the
Benefit Analysis supports it, and make sure there is a clear explanation why the
recommendation is what it is.
A5.12. Attachments - Supporting Documentation: This is everything that serves as the basis
for the numbers, etc. that go into the EA. Each EA should be a stand-alone document, which
would include copies of source data and all calculations used to turn source data into EA inputs.
A reviewer (or auditor) should be able to review/audit the EA without having to look at anything
else. They should be able to replicate the EA using your source data and your documentation.
A5.12.1. It’s important to be able to see how the analyst got from source data to cost inputs
used in EA. It’s the reviewer’s job to verify the reasonableness and accuracy of the data and
methodology of the EA.
A5.12.2. What to look for:
A5.12.2.1. Make sure the sources of all data are identified.
A5.12.2.2. Make sure that it’s clear what year dollars the source data is in.
A5.12.2.3. For MILCON or MFH EAs, make sure the cost estimate for each alternative
is of the same quality and is estimated using the same or similar estimating model or
method. It will sometimes happen that the cost estimate for the alternative that is
originally put forward for analysis is of a better quality than the cost estimate, usually
done later, for any alternative that it is compared to in the analysis.
A5.12.2.4. Look the source numbers over. Are they believable? Reasonable? Do a sanity
check.
A5.13. This is the end of the review guide. If you need more assistance in reviewing an EA,
there is also an Economic Analysis Certification Checklist in Attachment 6 of this manual.

AFMAN65-506 29 AUGUST 2011 55
Attachment 6
ECONOMIC ANALYSIS CERTIFICATION CHECKLIST
A6.1. This attachment is a checklist for those responsible for review and certification of
economic analyses. This certification checklist is designed to achieve consistency in evaluation
and certification of Air Force EAs, and can be used together with the EA Review Guide in
Attachment 5 of this manual.
A6.2. There is a Y (for yes) or N (for no) after each item on the checklist. If the reviewer’s
answer is other than the correct one identified, the reviewer should seek additional information to
determine if a change is necessary or why the answer to the checklist is different than is
prescribed.
A6.3. Objective or Problem Statement:
A6.3.1. Is the objective clear and specific? Y
A6.3.2. Is the objective realistic? Y
A6.3.3. Are any feasible alternative solutions excluded due to a bias in the objective
statement? N
A6.4. Assumption for Constraint Development:
A6.4.1. Are all assumptions recognized and identified? Y
A6.4.2. Are the assumptions realistic and properly supported? Y
A6.4.3. Are assumptions used when obtainable facts are available? N
A6.4.4. Are assumptions unnecessarily restrictive thereby preventing consideration of
feasible alternatives? N
A6.4.5. Do assumptions include economic life and future changes in operations
requirements? Y
A6.5. Alternative Identification:
A6.5.1. Are all feasible alternatives considered? Y
A6.5.2. Were alternatives rejected before a full analysis was adequately documented? N
A6.5.3. Are the alternatives significantly different as opposed to superficial restructuring of
a single course of action? Y
A6.5.4. If adequate, was the status quo used as the baseline for alternative evaluation? Y
A6.5.5. Were other gov’t agencies' capability to provide a product or service included as an
alternative? Y
A6.5.6. Were contracting alternatives considered? Y
A6.6. Cost Analysis:
A6.6.1. Are all government direct and indirect costs included for each alternative? Y
A6.6.2. Do investment costs include transportation, installation, support, and training costs
incurred before operational and building occupancy dates, etc.? Y

56 AFMAN65-506 29 AUGUST 2011
A6.6.3. Are personnel costs all inclusive; that is, specific skill levels, fringe benefits,
overtime and shift differentials, etc.? Are personnel costs broken out by rank/grade, number
of employees in each category, etc? Y
A6.6.4. Are future equipment replacement costs included as investments as opposed to
operations costs? Y
A6.6.5. Are available asset values considered and are such values adequately documented?
Y
A6.6.6. Are cost collection and aggregation methods correct? Y
A6.6.7. Are estimating relationships and procedures identified and properly supported? Y
A6.6.8. Are program or project costs expressed in constant dollars? Y
A6.6.9. Where inflation or cost escalation is used, have the factors been identified and
validated? Y
A6.6.10. Are cash flows discounted at the proper discount rate? Y
A6.6.11. Are cost and savings schedules realistic? Y
A6.7. Benefit Analysis:
A6.7.1. Have all project results, outputs, benefits, or yields been included? Y
A6.7.2. Are the benefits identified in measurable terms where possible? Y
A6.7.3. Are benefit measuring techniques properly defined and supported? Y
A6.7.4. Is benefit priority or ranking criteria clearly stated and used in the evaluation? Is any
weighting scale consistently and reasonably applied? Y
A6.7.5. Are negative results or outputs identified and adequately evaluated? Y
A6.7.6. Are secondary benefits (not related to the objective) identified? Y
A6.7.7. Do the benefits relate to the program and project objective? Y
A6.7.8. Are all cost savings represented as a negative cost rather than as a benefit? Y
A6.7.9. Are the benefits suitably tabulated, graphed, etc.? Y
A6.8. Sensitivity Analysis:
A6.8.1. Were the effects of possible changes to the objective requirements evaluated? Y
A6.8.2. Would the recommended alternative remain the same if key assumptions or criteria
were varied within a feasible range? Y
A6.8.3. Was the program project schedule evaluated for both operational and cost impacts
(slippages, advancements)? Y
A6.9. Comparison Selection Evaluation:
A6.9.1. Were alternative selection criteria applied consistently? Y
A6.9.2. Are cost and benefit data suitably displayed to accurately depict relationships? Y

AFMAN65-506 29 AUGUST 2011 57
A6.9.3. Were benefits quantified in support of the recommendation, and, if so, was it
presented in the executive summary? (not always possible to quantify benefits) Y
A6.9.4. Are the alternatives compared to a common baseline (minimum requirements level)?
Y
A6.9.5. Were alternative comparison techniques suitable for the program project being
evaluated; that is, present value, payback period, uniform annual cost, etc.? Y
A6.9.6. Was a specific course of action recommended? Y
A6.9.7. Does analysis data clearly support the recommendation? Y
A6.9.8. Are significant differences between the recommended and other alternatives clearly
identified? Y
A6.10. Executive Summary:
A6.10.1. Does the executive summary adequately state the problem, study objective, and
significant criteria, assumptions and constraints? Y
A6.10.2. Are the feasible alternatives clearly identified and differences explained? Y
A6.10.3. Is the recommended alternative adequately supported without reference to detail
study content? Y
A6.11. Subordinate Command Certification:
A6.11.1. Are comptroller and functional OPR certifications attached? Y
A6.11.2. Are unresolved analysis issues properly documented by both the Comptroller and
project OPR? Y

58 AFMAN65-506 29 AUGUST 2011
Attachment 7
ECONOMIC ANALYSIS PREPARER'S GUIDE
A7.1. This attachment holds the third and last guide/checklist in this manual. This attachment
was written with the EA preparer in mind, to assist in the preparation of the EA. It takes the form
of questions, followed by a brief identification of the issue being highlighted.
A7.2. Objective/Problem Statement:
A7.2.1. Is the stated problem the real problem? Critical to the successful completion of the
economic analysis is the identification and clear statement of the right problem. Often
symptoms and not the disease are believed to be the problem. Seeking solutions to the wrong
problem, or a poorly stated problem, almost always leads to the wrong solution because of
missed alternatives, faulty assumptions, etc.
A7.2.2. Does the analysis fully address all significant pieces of the problem? The analyst
must fully identify and consider all facets of the problem. Watch for significant problem
components either not identified or not fully treated in the study. Impacts (both costs and
benefits) on tactical units, tenants, and satellite activities serviced by the installation should
be addressed.
A7.3. Assumptions:
A7.3.1. Are all assumptions identified? Watch for assumptions that are not identified since
assumptions imply a limitation or a judgment. Assessing the impact of limitations and the
validity of judgments contained in all assumptions is necessary. A common assumption,
seldom made explicit, is that a given organization or system operates by itself. Such an
assumption can contribute to inadequate consideration of support provided and
complementary outputs produced by related systems. This can lead to improper measurement
of total costs and benefits and erroneous conclusions and recommendations.
A7.3.2. Are the assumptions unduly restrictive? Assumptions, when properly used, narrow
the scope of an economic analysis to manageable proportions. However, the assumptions
should not unduly restrict the study by eliminating possible significant alternatives or by
narrowing the scope of consideration. This examination should be made throughout the
review of the analysis and not only during the initial review of the stated assumptions.
A7.3.3. Do any of the major assumptions incorrectly treat measurable uncertainties as facts?
A7.3.3.1. Uncertainty can be defined as the lack of reliable knowledge for assigning
values or probabilities to factors influencing decisions. Uncertainties can be quantified or
qualified. Examples of measurable uncertainties are projected workloads, personnel
retention rates, equipment usage, and availability and reliability rates.
A7.3.3.2. The analyst should be alert to major assumptions, either stated or implied,
assigning fixed values to variables subject to uncertainty--the assigned values then being
treated in the analysis as facts. An example of this type of shortcoming is the assumption
that a proposed supply or maintenance system will encounter a constant annual workload.
This workload would often be based on the experience of the prior year, with adjustments
made for certain variations.

AFMAN65-506 29 AUGUST 2011 59
A7.3.3.3. Assessment of uncertainty in workloads and other crucial variables should be
examined. The number of sensitivity analyses required and feasible is a matter of
judgment. There are limits to the time and manpower available for a given study.
A7.3.3.4. In effect, the preparer must judge when the study includes adequate sensitivity
analyses in light of the time and resources allotted to the study, the magnitude of the
proposed investment, and the likelihood additional analyses would significantly affect the
study results.
A7.3.4. Do any of the major assumptions treat qualitative uncertainties as facts?
A7.3.4.1. Major qualitative uncertainties treated as assumptions also tend to dictate
results. The availability of community services, military standardization policies, and
advances in the state-of-the-art that lead to new equipment capabilities are examples of
qualitative uncertainties. Other qualitative uncertainties that may be present in analysis,
whether presented as such or not, are ones related to political considerations. Examples
are availability of base rights, assurance of oversight permission, and the character of
future environmental standards.
A7.3.4.2. Treatment of these kinds of uncertainties is not easy. A good analysis will
address the major types of uncertainty directly and try to show how different assumptions
have an impact on the study result. A study of alternative waste disposal systems thus
might investigate the effects of increasingly severe environmental standards and the
possible use of improved filtration processes.
A7.3.5. Are the major assumptions reasonable? Major assumptions must be examined to
determine if they are reasonable. This is easier if the analysis documentation explains why
each assumption was made. A useful technique is to try to make other plausible major
assumptions. If these invalidate the study results, then the analysis is questionable.
A7.4. Are all feasible alternatives included?
A7.4.1. Are current capabilities or the "base case" adequately considered?
A7.4.1.1. Current capabilities must not be omitted from consideration in constructing
alternatives except for clearly stated valid reasons. Valid reasons may include inability of
the current system to accomplish the current or proposed objective. Current capabilities,
where proper, also must be considered as part of a proposed alternative.
A7.4.1.2. If the current system is to be used in an analysis, it should be used as a base
case and should concentrate on the differences in benefits and costs expected to result
from the adoption of one or more of the proposed alternatives. This is proper provided the
base case is a feasible alternative; that is, capable of attaining the proposed objectives.
A7.4.2. Are all possible significant interfaces with existing systems or projects adequately
considered in designing the alternatives? Proper treatment of alternatives requires careful
examination of how the proposed alternatives affect and are affected by related system or
projects. The need for this examination is crucial in areas such as transportation and
management information systems.
A7.4.3. Consider viable alternatives based on mixtures of two or more efforts that combine
the best features of each. For example, in a management information analysis, one alternative

60 AFMAN65-506 29 AUGUST 2011
might be a manual system. Another might be a combination of a manual and an automated
system.
A7.4.4. Are there feasible alternatives that have been omitted? If any of the answers to the
previous questions on "Alternatives" are negative, it is possible some feasible alternatives
were not included. However, there are practical limits on the time and manpower available
for a given analysis. The relative importance of the subject under study will also influence
the number of alternatives examined.
A7.5. Cost Analysis:
A7.5.1. Are cost models identified? A cost model is the basis for cost estimates by applying
cost estimating relationships and cost factors to specified physical characteristics. These
models may be complex and computer assisted or may consist of a few relatively simple
equations readily computed by hand. The study should identify and describe all cost models
used so that the reviewer or decision maker can determine the validity of the model used and
how the total system cost estimates were derived from the material in the study. If this
material does not permit the reviewer to do this, then more information is required.
A7.5.2. Are the cost estimates relevant? Deciding which costs are relevant requires analysis
and judgment. Preparing a universal list of always-relevant costs is not possible. Ideally, a
study should indicate why certain costs were considered relevant and why others were
omitted.
A7.5.3. Are sunk costs and inherited assets properly treated?
A7.5.3.1. Inherited assets are those resources such as installations, equipment, and
trained personnel inherited from efforts that are being phased out. The costs pertinent to
planning are those yet to be incurred. Sunk costs are costs already expended. These
previously incurred costs are usually excluded from costs presented in cost-benefit
analysis.
A7.5.3.2. Including the costs of inherited assets and other sunk costs leads to distorted
cost estimates with consequent effect on the conclusions and recommendations. On the
other hand, if inherited assets have alternative uses, any relevant benefits and costs
should be included in the analysis.
A7.5.4. Are directly related support costs included? Cost estimating of systems or
organizations should include the proportionate cost of those other units or elements required
in direct support. For example, the cost estimate of a new hospital must include the costs of
the related direct and general support.
A7.5.5. Are replacement, consumption, and maintenance costs included? Cost estimates for
major equipment items should include not only the operational equipment, but costs for those
additional items required for initial stockage and replacement for the life of the system.
A7.5.6. Are all training costs included? The resource implications of training personnel can
be significant. Initial training costs represent the resources for training personnel necessary
for introduction of the alternative. The availability of fully trained personnel and the number
of personnel requiring complete or transitional training is the resource required. Annual
training costs represent the resource implications for training replacements. These
replacements are required because of usual attrition.

AFMAN65-506 29 AUGUST 2011 61
A7.5.7. Are construction costs included? The costs for additional installations or facilities
are sometimes overlooked, yet these costs can be significant. Costs of facility rehabilitation
should also not be overlooked.
A7.5.8. Are the cost data accurate?
A7.5.8.1. Cost data can be from many different sources and the analyst cannot check all
cost data for accuracy. However, the analyst should spot check and examine the sources
of the data. Cost data furnished by manufacturers should be viewed critically. These data
may be understated particularly for new or advanced projects. Advanced system costs
stated as an exact figure rather than at estimated lower and upper values are particularly
suspect.
A7.5.8.2. Great accuracy in cost estimates is often not feasible. In fact, in dealing with
costs of future acquisition, having a range of possible costs upper and lower values is
usually more realistic than a single point cost estimate that implies no uncertainties. Use
the most likely cost in the estimate but vary costs with uncertainty in a sensitivity
analysis.
A7.5.9. Are cost aspects of all alternatives treated equally? Inconsistency in handling the
costs of competing alternatives prevents an objective evaluation and usually leads to wrong
conclusions. However, using the same cost estimating technique for calculating a cost
element is not always possible. The analyst should make sure the final dollar estimate
accurately reflects the actual resource requirements for the alternative and that differences in
estimating do not distort the cost results.
A7.5.10. Are the cost estimating relationships valid?
A7.5.10.1. Cost estimating relationships may be unsophisticated cost factors, simple
extrapolation of recent experience, or complex equations with many variables. In all
cases, the purpose of a cost estimating relationship is to translate a specification of a
physical resource into a cost.
A7.5.10.2. Cost estimating relationships should be based on current data, or distorted
estimates may result. For example, the purchase price per pound for engines has
increased over the years due to changes in metal alloy technology; the maintenance cost
per flying hour for aircraft has increased significantly over the past years as more
sophisticated aircraft have been introduced into the force structure. In other words, taking
old cost data and inflating that data to the project year does not always account for
changes due to technology or efficiency.
A7.5.11. Are costs in terms of present value? The costs or benefits of proposed alternatives
will differ both in total dollars and in the percentage distribution of the total over the years
included in the method of analysis. The present value or discounting technique is the means
for equating dollars in any year to dollars of the present. Using this technique permits greater
disclosure of and consistency in, identifying the resource implications of proposed
investments. Present value calculations involve a discount rate or tables based on such rates.
A7.5.12. Are constant dollars used? An estimate is in constant dollars if costs are adjusted so
that they show the level of prices in relation to the base year. When the historical cost data
collected represent expenditures in different years, all costs must be converted to the base
62 AFMAN65-506 29 AUGUST 2011
year. If cost sources are stated in nominal dollars, then the analysis may be done in nominal
dollars.
A7.5.13. Is the sensitivity of cost assumptions adequately examined? In comparing costs of
alternatives, deciding to what degree the results are sensitive to the cost assumptions is
important. For example, would 10 years of operations as opposed to 5 make a significant
difference in the relative costs of the alternatives? The study must make clear the sensitivity
of the cost estimates to the major cost assumptions.
A7.6. Benefits:
A7.6.1. Are the measures of benefits identified? The study should clearly identify the
standards or measures used for evaluating the benefits of the system or organization under
study. The conclusions and recommendations cannot be properly evaluated, particularly
when the study is based on equal cost alternatives, without prior evaluation of the measures
of benefits.
A7.6.2. Do the benefit measures focus attention on one benefit or alternative and ignore
others? In measuring benefits, one should be careful not to concentrate on only one or two of
them.
A7.6.3. Is the evaluation of benefits based on straight extrapolation? Occasionally a study
may evaluate benefits by straight (linear) extrapolation from the measurement of benefits of a
small unit. For example, a hypothetical study may show that six men can produce ten
widgets. An extrapolation stating that 100 widgets can be produced by sixty men may not be
justified without supporting evidence. The error in straight or inferior extrapolation
disregards the element of diminishing returns or marginal use.
A7.6.4. Is the impact of other operations ignored? In measuring the benefits of a system or
organization, consider the effects of other operations. For example, peak use of power, or
vehicles, or people may have detrimental effects on related projects or activities. The "ripple
effect" should be considered.
A7.6.5. Do the benefits of future systems take into account the timing of benefits? The
benefits of a proposed future system often depend on when it will be available for operational
use and the total operational life span (economic life) of the system. In examining the effect
of the time dimension on benefits, pay particular attention to the time between the present
and the initial operational availability of the complete system.
A7.6.6. Has the sensitivity of benefits to changes in assumptions been recognized? The
benefits derived in analysis depend on the assumptions. The analyst should isolate the degree
of dependence and determine if it is acceptable. Generally a good study will show the degree
of dependence by various kinds of sensitivity analysis.
A7.6.7. Are some aspects of output measurable? The treatment of immeasurable aspects of
performance in the total measurement of benefit should be treated carefully. Measures of
benefit obtained by quantifying study aspects such as morale or leadership can be misleading.
At times, the only practical solution may be a qualitative discussion of these factors.
A7.6.8. If quantity measures of output are unattainable, is comparison of quality feasible? In
an economic analysis, where projecting output or computing quantifying measures is
difficult, comparing on the basis of a quality assessment should be investigated. Various

AFMAN65-506 29 AUGUST 2011 63
pertinent factors can be described and characterized by "yes-no" or "good-fair-poor." Saying
alternative A is more effective than B for a certain characteristic may be justified, even if we
cannot quantify the difference. If A is more effective than B, and A is more effective than C,
we have a partial ordering; that is, we cannot distinguish between B and C, but both are
inferior to A.
A7.6.9. Are the benefit measures proper and inclusive? The measures used to evaluate
benefits should be both proper and inclusive. Failure to use meaningful measures of benefits
is a contributing factor to poor studies. Examining the benefits measures requires analysis
and sound judgment.
A7.7. Comparison and Selection.
A7.7.1. Are the criteria identified? The criteria, or tests of performance, are the base for the
conclusions and recommendations. The criteria should be stated specifically and clearly.
A7.7.2. Are the criteria consistent with higher echelon objectives? No matter what the
concern of a study, the subject falls into a larger framework. Are the criteria used in a study
consistent with higher-level objectives? This requires management judgment and the
necessity to examine the larger context of the problem. If the study criteria are not consistent
with objectives at the higher level, then the wrong problem may be addressed
(suboptimization). An example of incorrectly chosen criteria is illustrated in using mobility
as the sole criterion in the selection among different organizations. A study could
conceivably show that organization A can be more mobile than organization B and C by
spending fewer resources. Yet A may not be the preferred organization because the mobility
was achieved by degrading other factors contributing to the higher objective of efficient
control and management.
A7.7.3. Are the criteria too general? Very general criteria should be suspect. For example, a
study may state the criterion as being "the system with maximum military worth" or the "best
system." These generalizations cannot be related to the analysis as can a good criterion such
as the minimum cost of maintaining a specified level of transport capability over a specified
time span."
A7.8. Documentation and Data Evaluation:
A7.8.1. Is the analysis adequately documented? A key element of orderly analysis is
sufficient documentation of method and sources so that with the same material, a reader not
familiar with the study could arrive at essentially the same result. Without documentation, an
analysis appeals for acceptance solely on faith in the authority of the issuing agency.
A7.8.2. Are the facts correct? It is usually not possible to verify all the facts from a variety
of sources used as a study. Facts on which conclusions and recommendations depend should
be specifically evaluated. Source references should be examined critically and documented in
the study.
A7.8.3. Are the facts stated with proper qualifications? In addition to checking the validity
of the facts, completeness should also be evaluated. Some material may be correct in
isolation but may take on a different meaning when other facts are added. For example, a
bulldozer may generally be able to move "x" cubic yards of earth per day. However, this rate
may not be valid for earth removal in rocky terrain.

64 AFMAN65-506 29 AUGUST 2011
A7.8.4. Are the data from supporting simulation models valid?
A7.8.4.1. Studies sometimes use the results of simulation models as facts. In evaluating
these facts, one should bear in mind the nature of simulation. Basically, a simulation
involves an abstraction from the real world. Models are structured according to
mechanistic rules or judgments or both and these are made by persons. These rules and
judgments are based on assumed situations and known or assumed facts and system
characteristics.
A7.8.4.2. In determining the validity of simulation results, the analyst should judge how
well the model portrays the essential relationships and should satisfy himself or herself
on the validity of the judgments and assumptions used in conducting the analysis. Major
judgments and assumptions used in the model should be fully identified.
64
A7.8.5. Are the performance characteristics valid?
A7.8.5.1. Performance characteristics are often the key element in determining the
benefits of a system or piece of equipment. In evaluating the validity of performance
characteristics, the source of the data should be examined. Performance characteristics
based on manufacturer’s claims are often optimistic. Performance characteristics derived
from tests at research installations also require examination.
A7.8.5.2. Test performance characteristics are usually derived under controlled
conditions. Performance characteristics derived from the field tests must be examined.
Such tests can, at times, produce misleading results due to artificialities caused by
abnormally stringent operating and safety regulations and choice of test areas.
A7.8.6. Are any of the data derived from questionnaires? The data obtained from
questionnaires should be examined to determine the validity of the questions, the adequacy of
the qualifications of the survey population, and the size of the population.
A7.8.7. Are intuitive judgments identified? At times, filling in data gaps with judgments is
necessary but should be identified in the study. The impact of these judgments on the
conclusions and recommendations should be evaluated.
A7.9. Conclusions and Recommendations:
A7.9.1. Are the conclusions and recommendations logically derived from the material in the
study? The conclusions and recommendations should be derived logically from the material
contained in the study. Some studies, unfortunately, draw conclusions based on previous
studies and materials that are not fully documented within the study (mention in a
bibliography is not enough). If input from another study is essential, you should document
and explain it in detail. This requires at least a statement of the validity, scope of application,
and uncertainty related to the particular input.
A7.9.2. Have all the significant consequences been considered in arriving at the conclusions
and recommendations?
A7.9.2.1. Sometimes a study fails to consider all the pertinent consequences in arriving
at the conclusions and recommendations of the study or the decisions to be made because
of the study. These consequences are often referred to as "spillovers". For example, if a

AFMAN65-506 29 AUGUST 2011 65
study recommended adoption of an engine requiring a new type of fuel, the supply
system to include supply, storage, and transportation operations would be affected.
A7.9.2.2. Spillover effects are not always negative. For example, adopting dehydrated
rations to achieve greater shelf life may also reduce construction and transportation costs
because of the smaller unit volume of dehydrated food.
A7.9.3. Are the conclusions and recommendations really feasible in the light of political,
cultural, policy, or other considerations? At times some recommendations of a study may
appear to be eminently feasible from a strictly economic or military view but are really not so
in the light of other considerations. For example, a particular waste disposal system may be
shown to be superior, considering cost and effectiveness, to a high technology system for
doing the same function. However, because of national policies on pollution and the
environment, adopting the high technology system may be the only acceptable solution.
A7.9.4. Do the conclusions and recommendations show bias? Studies sometimes unwittingly
show bias because of parochial or institutional interests. One test for bias is to judge whether
largely the same conclusions and recommendations would be reached, based on the material
in the study, by another study agency.
A7.9.5. Are the conclusions and recommendations based on outside considerations?
A7.9.5.1. Occasionally, recommended selections among alternatives must be made in the
face of great uncertainty. A study may find several alternatives exhibiting similar costs
and benefits, but the results are very sensitive to the values assigned to the inputs.
A7.9.5.2. In this situation, some studies arrive at conclusions and recommendations
based on considerations other than those studied. In other words, the study agency is
stating, after the analysis was made, that applying the criteria did not lead to preference,
but indifference among the alternatives, and therefore, the issue was decided based on
other unstudied criteria. In situations of this kind, when recommendation of an alternative
is necessary, sensitivity to new criteria must be fully studied.
A7.9.6. Are the conclusions and recommendations intuitively satisfying? When the
conclusions and recommendations of the study are not intuitively satisfying, one should try to
isolate the cause. If the study fails to show by data, models and other means that your
intuition was wrong, further examination is required to determine if some subtle
considerations have been neglected because of oversimplification or other reasons.
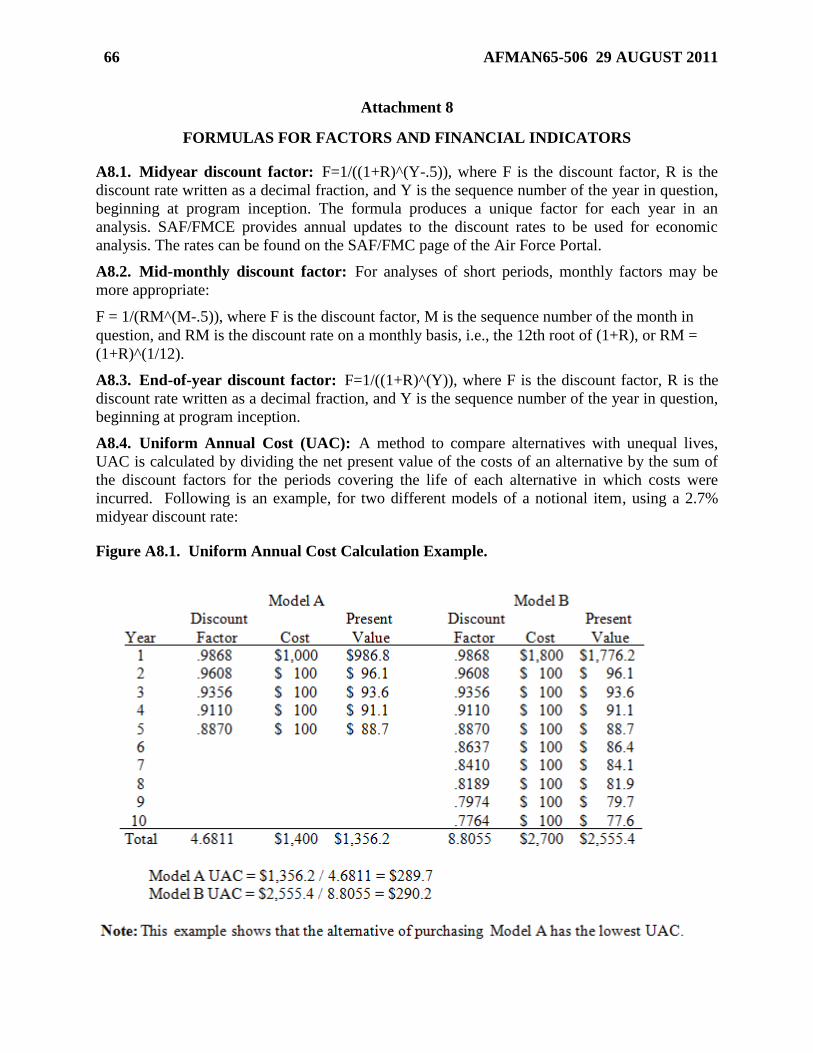
66 AFMAN65-506 29 AUGUST 2011
Attachment 8
FORMULAS FOR FACTORS AND FINANCIAL INDICATORS
A8.1. Midyear discount factor: F=1/((1+R)^(Y-.5)), where F is the discount factor, R is the
discount rate written as a decimal fraction, and Y is the sequence number of the year in question,
beginning at program inception. The formula produces a unique factor for each year in an
analysis. SAF/FMCE provides annual updates to the discount rates to be used for economic
analysis. The rates can be found on the SAF/FMC page of the Air Force Portal.
A8.2. Mid-monthly discount factor: For analyses of short periods, monthly factors may be
more appropriate:
F = 1/(RM^(M-.5)), where F is the discount factor, M is the sequence number of the month in
question, and RM is the discount rate on a monthly basis, i.e., the 12th root of (1+R), or RM =
(1+R)^(1/12).
A8.3. End-of-year discount factor: F=1/((1+R)^(Y)), where F is the discount factor, R is the
discount rate written as a decimal fraction, and Y is the sequence number of the year in question,
beginning at program inception.
A8.4. Uniform Annual Cost (UAC): A method to compare alternatives with unequal lives,
UAC is calculated by dividing the net present value of the costs of an alternative by the sum of
the discount factors for the periods covering the life of each alternative in which costs were
incurred. Following is an example, for two different models of a notional item, using a 2.7%
midyear discount rate:
Figure A8.1. Uniform Annual Cost Calculation Example.
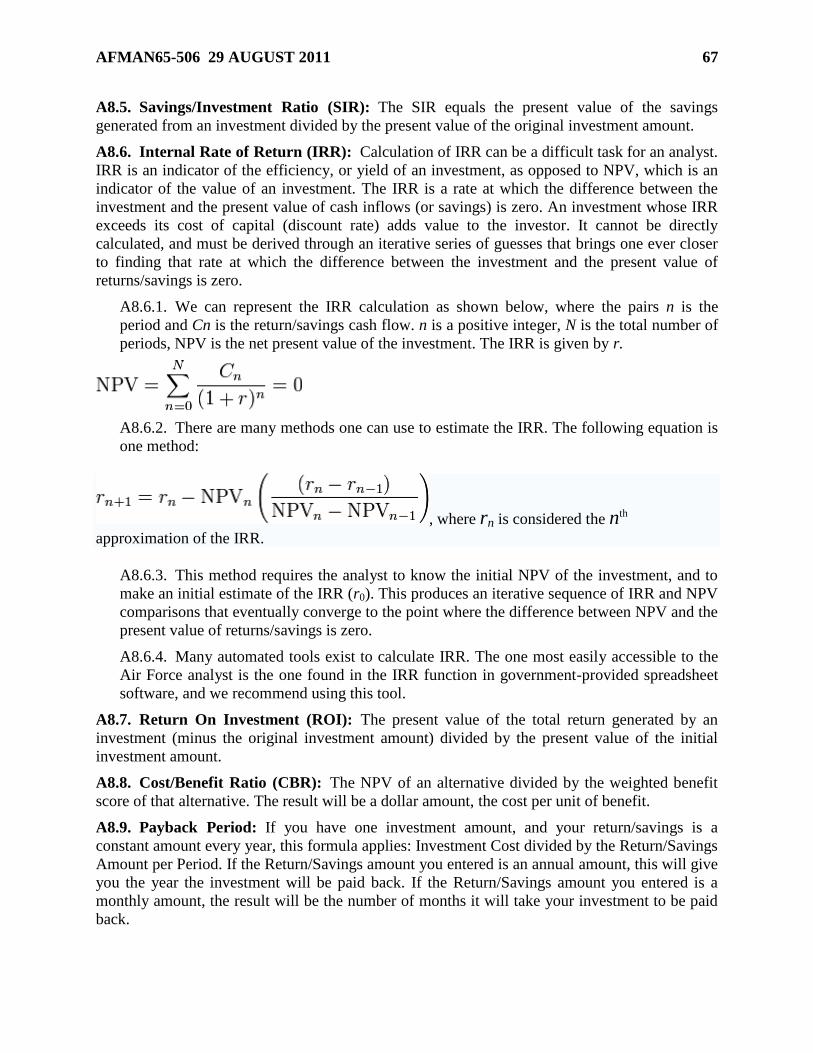
AFMAN65-506 29 AUGUST 2011 67
A8.5. Savings/Investment Ratio (SIR): The SIR equals the present value of the savings
generated from an investment divided by the present value of the original investment amount.
A8.6. Internal Rate of Return (IRR): Calculation of IRR can be a difficult task for an analyst.
IRR is an indicator of the efficiency, or yield of an investment, as opposed to NPV, which is an
indicator of the value of an investment. The IRR is a rate at which the difference between the
investment and the present value of cash inflows (or savings) is zero. An investment whose IRR
exceeds its cost of capital (discount rate) adds value to the investor. It cannot be directly
calculated, and must be derived through an iterative series of guesses that brings one ever closer
to finding that rate at which the difference between the investment and the present value of
returns/savings is zero.
A8.6.1. We can represent the IRR calculation as shown below, where the pairs n is the
period and Cn is the return/savings cash flow. n is a positive integer, N is the total number of
periods, NPV is the net present value of the investment. The IRR is given by r.
A8.6.2. There are many methods one can use to estimate the IRR. The following equation is
one method:
, where rn is considered the nth
approximation of the IRR.
A8.6.3. This method requires the analyst to know the initial NPV of the investment, and to
make an initial estimate of the IRR (r0). This produces an iterative sequence of IRR and NPV
comparisons that eventually converge to the point where the difference between NPV and the
present value of returns/savings is zero.
A8.6.4. Many automated tools exist to calculate IRR. The one most easily accessible to the
Air Force analyst is the one found in the IRR function in government-provided spreadsheet
software, and we recommend using this tool.
A8.7. Return On Investment (ROI): The present value of the total return generated by an
investment (minus the original investment amount) divided by the present value of the initial
investment amount.
A8.8. Cost/Benefit Ratio (CBR): The NPV of an alternative divided by the weighted benefit
score of that alternative. The result will be a dollar amount, the cost per unit of benefit.
A8.9. Payback Period: If you have one investment amount, and your return/savings is a
constant amount every year, this formula applies: Investment Cost divided by the Return/Savings
Amount per Period. If the Return/Savings amount you entered is an annual amount, this will give
you the year the investment will be paid back. If the Return/Savings amount you entered is a
monthly amount, the result will be the number of months it will take your investment to be paid
back.

68 AFMAN65-506 29 AUGUST 2011
A8.9.1. If your investment will span more than one period and/or if your return/savings will
be different in different periods, simply add up the expected returns/savings for each period,
until the total equals or exceeds the investment total, and that will be the period you achieved
payback. In the example below, investments are reflected as negative numbers.
A8.9.2. By convention, payback period analysis ordinarily uses un-discounted dollars.
Figure A8.2. Payback Period Example.

AFMAN65-506 29 AUGUST 2011 69
Attachment 9
LEASE-PURCHASE PROCEDURES
A9.1. Intent. Whenever a Federal agency needs to acquire the use of a capital asset, it should
do so in the way that is most economical to the government. Lease-purchase analysis conducted
under Circular A-94 is intended to determine whether it would be more economical to lease or to
buy a given asset. It is not intended to determine what kind of asset should be acquired, the
quantity, or acquisition schedule. When a decision involves both aspects (e.g., a choice between
leasing an asset this year and purchasing it next year) the economic analysis should first
determine when, in what quantity, or on what acquisition schedule to acquire the asset, and then
analyze the lease-purchase aspect of the overall decision using the principles outlined in this
attachment.
A9.2. Applicability. OMB Circular A-94 lease-purchase analysis procedures are required when
both of the following conditions are met:
A9.2.1. The analysis involves a capital asset or a group of related assets whose total fair
market value exceeds $1 million.
A9.2.2. The analysis involves a capital asset (including durable goods, equipment, buildings,
facilities, installations or land) which:
A9.2.2.1. Is leased to the government for a term of 3 or more years; or
A9.2.2.2. Is new, with an economic life of less than 3 years and is leased to the
government for a term of 75 percent or more of the economic life of the asset; or
A9.2.2.3. Is built for the express purpose of being leased to the Federal government; or
A9.2.2.4. Is leased to the Federal government and clearly has no alternative commercial
use (e.g., a special-purpose government installation). NOTE: Circular A-94 procedures
are not required for service contracts that involve the use of capital assets by the
contractor incidental to the provision of services to the government. Guidance for the
acquisition of commercial-type services by Government or contractor operation, and
applicable economic analyses of such service contracts, can be found in OMB Circular
A-76, Performance of Commercial Activities and AFI 38-203, Commercial Activities
Program. However, OMB may require any particular lease or service contract be subject
to Circular A-94 provisions.
A9.3. Methods of Justification. All leases of capital assets must be justified as preferable to
direct government purchase and ownership. In general, this can be done in one of three ways:
A9.3.1. Separate Analysis . This involves conducting a separate lease-purchase analysis on
each lease of one or more capital assets by a government agency.
A9.3.1.1. This is the only acceptable method for major acquisitions. A lease of one or
more capital assets is a major acquisition if:
A9.3.1.1.1. The acquisition represents a separate line-item in the federal agency's
annual budget,
A9.3.1.1.2. The agency or OMB determines that the significance of the acquisition
merits designating it as major, or

70 AFMAN65-506 29 AUGUST 2011
A9.3.1.1.3. The total value of the acquisition, as measured by the purchase price of
the assets leased, exceeds $500 million. Lease-purchase analyses of major
acquisitions must be reviewed by SAF/AQ.
A9.3.2. Generic Class Analysis. In the case of recurrent decisions to lease similar assets for
the same general purpose, periodically conduct a lease-purchase analysis for the entire class
of assets in question, using the same analytic methods used to evaluate individual leases.
OMB approval should be sought in determining the scope of any such generic analysis.
A9.3.3. Policy Approval from OMB. Federal agencies may request approval from OMB of
a formal policy that generally results in the same lease-purchase decisions as a requirement
for lease-purchase analysis. Agencies must demonstrate that:
A9.3.3.1. The leases in question would generally result in substantial savings to the
government that could not be realized in a purchase,
A9.3.3.2. The leases are so small or so short-term as to make separate lease-purchase
analysis impractical, and
A9.3.3.3. Leases of different types are scored consistently with the instructions in
Appendices B and C of OMB Circular A-11. Any such proposed policy must be
approved by SAF/FM and SAF/AQ, and forwarded by the Secretariat through OSD to
OMB for approval.
A9.4. Definitions and Analytic Methods. The definitions and methods below characterize the
principles to be used in lease-purchase analysis.
A9.4.1. Life Cycle Cost. Lease-purchase analysis should include a net present value
comparison of the life cycle cost of leasing to the full cost of buying or constructing an
identical asset. The full cost of buying includes the asset's purchase price plus any relevant
ancillary services connected with the purchase. Terms of leases vary, but the basic principle
is that any services included in the terms of a prospective lease are also included, for
purposes of analysis, in the purchase alternative, and vice versa.
A9.4.1.1. Ancillary Services. Are any services included either in the terms of the lease
or the terms of the purchase? If, for example, services will be provided by the lessor but
are not included in the purchase price, then the cost of obtaining these services separately
should be added to the purchase price. Such costs may be excluded if they are estimated
to be the same for both lease and purchase alternatives or too small to affect the
comparison. If costs are excluded for these reasons, they must be addressed in the
assumptions section of the analysis. Examples of ancillary services include:
A9.4.1.1.1. All costs associated with acquiring the property and preparing it for use,
including construction, installation, site, design, and management costs.
A9.4.1.1.2. Repair and improvement costs.
A9.4.1.1.3. Operation and maintenance costs.
A9.4.1.1.4. Imputed property taxes (excluding foreign taxes on overseas acquisitions
except where actually paid); imputed taxes approximate the costs of providing
municipal services such as water, sewage and police and fire protection.

AFMAN65-506 29 AUGUST 2011 71
A9.4.1.1.5. Imputed insurance premiums. Imputed costs do not involve a direct
monetary payment but are included in an analysis to provide a consistent basis of
comparison.
A9.4.1.2. Economic Life. For purposes of lease-purchase analysis, the economic life of
an asset is its remaining physical or productive lifetime. It begins when the asset is
acquired and ends when the asset is retired from service. The economic life is frequently
not the same as the useful life for tax purposes.
A9.4.1.3. Purchase Price. The purchase price of the asset for purposes of lease-
purchase analysis is its fair market value, defined as the price a willing buyer could
reasonably expect to pay a willing seller in a competitive market to acquire the asset.
Estimates of fair market value may be obtained from catalogs, e.g., GSA catalogs, from
vendor quotations or from data on recent purchases. NOTE: Seeking vendor quotes
should be done in consultation with acquisition or contracting personnel so that it is made
clear that the government is conducting analysis and not making a commitment.
A9.4.1.3.1. In the case of property that is already owned by the Federal government
or that has been donated or acquired by condemnation, an imputed purchase price
should be estimated.
A9.4.1.3.2. If public land is used for the site of the asset, the imputed market value of
the land should be added to the purchase price.
A9.4.1.3.3. The asset's estimated residual value, as of the end of the period of
analysis, should be subtracted from its purchase price. A property's residual value is
an estimate of the price that the property could be sold for at the end of the period of
the lease-purchase analysis. The recommended way to estimate residual value is to
determine what similar, comparably aged property is currently selling for in
commercial markets. Alternatively, book estimates of the resale value of used
property may be available from industry or government sources. Assessed values of
similar, comparably aged properties determined for property tax purposes may also be
used.
A9.4.1.4. Property Taxes. Imputed property taxes may be estimated in two ways:
A9.4.1.4.1. Determine the local property tax rate and assessed (taxable) value for
comparable property; if there is no basis by which to estimate future changes in tax
rates or assessed value, the first-year rate and assessed value (inflation-adjusted for
each subsequent year) can be applied to all years; multiply the assessed value by the
tax rate to determine the annual imputation for property taxes.
A9.4.1.4.2. Obtain an estimate of the current local effective property tax rate from
the Building Owners and Managers Association's Regional Exchange Reports.
Multiply the fair market value of the government-owned property (inflation-adjusted
for each year) by the effective tax rate.
A9.4.1.5. Insurance Premiums. Imputed insurance premiums may be estimated by
determining local estimates of standard commercial coverage for similar property from
the Building Owners and Managers Association's Regional Exchange Reports.

72 AFMAN65-506 29 AUGUST 2011
Attachment 10
SPECIAL TAX ADVANTAGES IN LEASE-PURCHASE ANALYSIS
A10.1. OMB Circular A-94, paragraph 13(c)(4) specifies that in lease-purchase analysis the cost
of leasing should include the cost to the Treasury of any special tax benefits associated with the
lease, such as highly accelerated depreciation allowances or tax-free financing. Although the
Tax Reform Act of 1986 repealed the investment tax credit and the Deficit Reduction Act of
1984, together with the Tax Reform Act of 1986, effectively eliminated most accelerated cost
recovery system (ACRS) depreciation for assets leased by the US government, analysts should
seek legal and contracting opinion to ascertain whether or not a given lease provides a favorable
tax advantage to lessors or service providers (hereafter referred to simply as lessors). This may
require obtaining an opinion from the Office of the Staff Judge Advocate servicing their
organization. The procedures below show how to incorporate ACRS or modified accelerated cost
recovery system (MACRS) depreciation tax losses to the Treasury into an economic analysis,
should it apply due to future changes in the law. Neither normal taxes on income and profit nor
ordinary depreciation of assets should be included as a cost or benefit to the government. For
purposes of analysis, it will be assumed that ACRS or MACRS is not available to the lessor
unless information to the contrary is available. If it is known that the lessor will take advantage
of favorable tax provisions contained in ACRS or MACRS, then it will be assumed in the
analysis that the lessor's marginal tax rate is the maximum corporate rate.
A10.2. ACRS and MACRS depreciation allowances are amounts that are subtracted from the
lessor's taxable income. Therefore, only the portion of the total allowance in excess of normal
"economic depreciation" contributes to special tax advantage. Accelerated depreciation
schedules allow deductions greater than economic depreciation in the first few years of asset
ownership. Since no more than 100 percent of asset value may be deducted during its life (by any
one owner), this means that accelerated depreciation schedules provide smaller deductions in
later years of ownership, compared to economic depreciation, and therefore tax disadvantages for
these years. Altogether, ACRS or MACRS provides a tax advantage through deferral and the
time value of money. The amount of taxes deferred in any year t is equal to T(At-Dt) where At is
the amount the lessor is able to deduct under ACRS or MACRS. Dt is the amount deductible
under economic depreciation, and T is the marginal tax rate.
A10.3. An economic analysis compares the outlays associated with different alternatives;
therefore, the tax deferral due to ACRS or MACRS, a revenue loss, must be made equivalent to
an outlay by the Treasury. The cost to the Treasury of ACRS or MACRS, equivalent to a normal
outlay, is
T(At-Dt)
(1 - T)
Where:
T is the marginal tax rate
At is the amount the lessor is able to deduct under ACRS or MACRS
Dt is the amount deductible under economic depreciation
A10.4. For the later years of asset life, this sum is negative (i.e., for those years when economic
depreciation exceeds ACRS or MACRS allowable deductions). The outlay-equivalent measure

AFMAN65-506 29 AUGUST 2011 73
of tax losses should be added (effectively, subtracted for later years) to annual costs for the lease
alternative in the economic analysis.
A10.5. Schedules of annual deductions allowed under ACRS or MACRS are available from
Internal Revenue Service Publication 534. Computation of the annual amounts will differ under
ACRS and MACRS. The simplest way to estimate economic depreciation of an asset is by
straight-line depreciation over its economic life. Therefore, annual economic depreciation of an
asset is approximately equal to its acquisition price divided by its economic life, for each year of
its economic life.

74 AFMAN65-506 29 AUGUST 2011
Attachment 11
COST-BENEFIT ANALYSIS (CBA) FOR GOVERNMENT FURNISHED PROPERTY
(GFP) IN SUPPORT OF COMMERCIAL ACTIVITY COST COMPARISONS (OMBC
A-76)
A11.1. Per AFI 38-203, the decision whether or not to furnish government property to
prospective contractors in a commercial activity (CA) cost comparison must be based on what is
in the best interest of the government. It states the servicing Financial Management Flight, as
part of the Performance Work Statement (PWS) team, will use Table 6.1 of AFI 38-203 or a
cost-benefit analysis as a basis for determining if providing government property to a prospective
offeror is in the best interest of the government.
A11.2. Decisions to include government furnished property will be IAW FAR, Part 45. Any
decisions to provide government furnished property should take into account the costs over the
life of the contract, including disposal. Government furnished property includes facilities,
equipment, material, supplies, or other services provided by the government for use by all
prospective providers in the solicitation. Costs for GFP included in a solicitation are considered
common costs. Replacement costs, insurance, maintenance and repair costs for GFP may or may
not be government furnished, depending on the provisions in the solicitation.
A11.3. The PWS Team, in consultation with the Contracting Officer and Financial Management
Flight, will be responsible for determining whether government property should be made
available to all prospective providers, subject to approval by the commander/vice commander (or
equivalent).
A11.4. Because the question at issue in such a cost comparison is essentially how to fund
accession of specified services, rather than any material question involving the allocation of
national resources, the analytic methods of OMB Circular A-94 apply to this type of CBA.
Establishing the costs and benefits to the government under each option (providing or not
providing the property to potential contractors) requires estimating both of the implied
incremental changes in the service contract price and of the collateral effects on other
government activities as a result of the decision. In a competitive environment, one would expect
that the availability of government property would tend to lower vendors' bids on the associated
service contract. In the absence of other information, an estimate of the fair market rental value
of a property or equipment item or government procured supplies would provide an
approximation of the maximum extent to which a contractor's bid for the service contract could
be expected to vary, based on whether or not the government-procured item was provided. An
improvement to this estimate could be made if a history were available to demonstrate more
closely the relationship between rental prices or other prices and the contract price adjustment
contractors make, based on having use of the equipment. For example, a potential contractor may
generally accomplish the activity in question by methods quite different than the methods used
by the government. In such a case, providing equipment and supplies used by the government
would tend to lower the contractor bid by less than the cost of those items. Opposite outcomes
are also possible. Of course, rental prices would have to be adjusted based on who is responsible
for equipment maintenance and what such maintenance entails.
A11.5. The cost to the government of furnishing an equipment item depends on its best
alternative use. The value of an asset that can be applied directly to another government use

AFMAN65-506 29 AUGUST 2011 75
should be set equal to the cost of acquiring an additional asset to accomplish the other activity,
adjusted for depreciation. For example, an asset being considered for government furnished
equipment (GFE) may have a 5-year economic life when new, and be 2 years old. Therefore, the
cost to the government of furnishing that equipment is equal to 60 percent of the cost of
acquiring a new item. If similar but not identical assets are involved, adjustments can be made.
An asset considered for GFP seldom has no alternative value. Ultimately, an estimate of the price
for which an item could be sold in disposal puts a floor under the opportunity cost of providing
that item to a contractor.
A11.6. Finally, CBA for government property in the context of a CA action is a contingent
analysis--i.e., the analysis should illuminate the question of whether or not it is to the
government's advantage to provide government property in the event the activity is performed by
the contractor. Other arrangements would prevail if the activity in question is performed in-
house.

76 AFMAN65-506 29 AUGUST 2011
Attachment 12
CONGRESSIONAL REPORTING REQUIREMENTS: CONVERSION OF A
COMMERCIAL ACTIVITY FROM IN-HOUSE TO CONTRACT PERFORMANCE
A12.1. This report is designated emergency code C-2. Continue reporting during emergency
conditions, normal precedence. Submit data requirements in this category as prescribed or as
soon as possible after submission of priority reports. Discontinue reporting during MINIMIZE.
A12.1.1. If more than 50 DoD civilian employees perform the function, then a statement
showing the potential economic effect on employees affected, and the potential economic
effect on the local community and the Federal Government is required.
A12.2. Procedure:
A12.2.1. The report is developed by using data from the cost comparison in conjunction with
an Economic Impact analysis of the installation (see Chapter 8 of this instruction).
A12.2.2. The specific procedure to follow is included below (after paragraph A12.4).
A12.2.3. For cost comparisons of 250 or more workyears, the methods outlined below may
be supplemented by analysis developed in cooperation with civil engineering and comptroller
staff. This supplementary analysis must be sufficiently thorough to provide an adequate
analysis of economic and intergovernmental impact. NOTE: ANG units which are tenants
on regular Air Force or Reserve installations, or ANG installations which are in close
proximity to such regular Air Force or Reserve installations may use economic impact
analyses for these installations.
A12.3. Reporting:
A12.3.1. The summary statement is included in the procedure below (Step 6).
A12.3.2. If paragraph A12.2C (above) is applicable, a statement summarizing the results of
the analysis must be prepared for inclusion in the RCS: HAF-A1M(AR) 8001. This summary
statement should be similar to the summary statement contained in Step 6 of the procedure
below, summarizing potential economic or intergovernmental impact on the AFB
surrounding community.
A12.4. Documentation Requirements: Documentation for the report should be maintained on
file using a Memorandum for Record or copy of the letter transmitting the report to the
manpower office.
A12.5. PROCEDURE FOR COMPUTATION OF ECONOMIC IMPACT FOR A-76
COMMERCIAL ACTIVITY COST COMPARISONS.
A12.5.1. STEP 1: Use Data from the A-76 Cost Comparison Study. Obtain the figure for
the "cost advantage” (in favor of contracting) from the RCS: HAF-A1M (AR) 8001 which is
prepared by the MAJCOM Manpower and Organization office. Annualize this data by
dividing the figure by the number of years in the contract. In this example, the cost advantage
in favor of contracting is $14,000,000 and the number of years is 5:
$-14,000,000 divided by 5 = $-2,800,000 (Annual Cost Advantage in Favor of Contracting)

AFMAN65-506 29 AUGUST 2011 77
A12.5.2. STEP 2: Use Data from the latest Economic Impact Analysis (EIA). Obtain the
figure for Total Expenditures by adding the total figures from Table 2 (Annual Payroll) and
Table 3( Expenditures for Construction, Services and Procurement of Materials, Equipment
and Supplies) of the Economic Impact Analysis together. In this example, total expenditures
will equal $250,000,000.
A12.5.3. STEP 3: Calculation of Estimated Economic Impact (Percentage Change).
Divide Step 1 by Step 2:
Annual Cost Advantage in Favor of Contracting = $ -2,800,000 = -.011 X 100 = -1.1%
Total Expenditures $250,000,000 (round to the nearest tenth of a percent)
A12.5.4. STEP 4: Statement for RCS: HAF-A1M (AR) 8001. Provide the following
statement:
The potential effect of this change on the surrounding community is that direct expenditures of
_______ AFB within the local community will be reduced by an estimated 1.1%.
A12.5.5. STEP 5: Compute the reduction in local indirect jobs using the Economic Impact
Analysis and SAF/ FMCE’s Indirect Job Multipliers for Air Force installations. The
numerator for this calculation is the number of indirect jobs created by the affected A-76
positions (analyst must calculate using the same multipliers as were used in Table 4 of the
Economic Impact Analysis) and the denominator of this calculation is the total number of
indirect jobs the base creates in the local area (This figure has already been calculated in
Table 4 of the Economic Impact Analysis). The quotient should then be multiplied by 100 to
obtain the percent reduction in indirect local jobs.
A12.5.6. STEP 6: Coordination with MAJCOM/FMA. Before finally releasing the
statement for inclusion in the RCS: HAF-A1M (AR) 8001, coordinate with MAJCOM/FMA.
MAJCOM/FMAs will provide SAF/FMCE (by message) with the information in Figure
A12-1:
Figure A12.1. Format of Information to Provide to SAF/FMCE.

78 AFMAN65-506 29 AUGUST 2011
Attachment 13
FOREIGN CURRENCY CONVERSION
A13.1. This attachment provides additional guidance on and examples of foreign currency
conversions. (Per paragraph 3.3.4, ordinarily do EAs in constant dollars; however, if your cost
sources cite nominal dollars, you may do EAs in inflated dollars.) The guidance in this
attachment addresses, in turn, constant and nominal dollar analysis. The guidance assumes you
have collected some costs expressed in foreign currency.
A13.2. Constant Dollar Analysis. Obtain a forecast of the exchange rate for the fiscal year
which will be the base year of the analysis (i.e., the first year in which there will be differences in
expenditures for different alternatives). (If you cannot obtain local estimates, ask your command
counterpart to contact SAF/FMCE.) Use the exchange rate for that base year of the analysis to
convert expenditures in every year. The resulting dollars are constant dollars of that base year,
resulting in a constant dollar analysis. NOTE: Exchange rates are ordinarily cited on the basis
of national currency unit per US dollar (e.g., Yen per dollar). An exception is often the British
Pound Sterling, which frequently is cited as dollars per pound. Check your source for the basis of
the rate.
A13.3. Nominal Dollar Analysis. Obtain a forecast of the exchange rate for each year of the
analysis. Convert each year's foreign currency expenditures into dollars using the forecast
exchange rate for each year. The resulting dollars are nominal dollars. If the forecast does not
cover all the years in the analysis, use the exchange rate for the last year forecast for all
remaining years. An alternate approach: use the exchange rate for the first year of the analysis to
convert foreign currency into US dollars; then use a US inflation rate forecast to convert these
constant dollars into nominal dollars.

AFMAN65-506 29 AUGUST 2011 79
Attachment 14
PRELIMINARY ECONOMIC ANALYSIS FORMAT
A14.1. A preliminary economic analysis is a concise tool for making a recommendation to a
decision maker without going through the effort of a full EA. Preliminary EAs are internal
planning tools for installations and commands. The goal is to bring the benefits of economic
analysis to decision making early on in the process without being unnecessarily burdened by the
more demanding requirements of a full EA. In no case may a preliminary EA be substituted for a
full EA when a full EA is required by the provisions of AFI 65-501. The format suggested below
is optional and intended to provide an idea of the contents appropriate for a preliminary EA,
which is generally a document of no more than a few pages.
A14.1.1. Problem/Requirement. Provide a brief, clear and accurate background statement
about what needs to be addressed, e.g., 300 unaccompanied enlisted personnel are currently
housed in substandard facilities (condition code 3 dormitories).
A14.1.2. Objective. State the generic need in an unbiased, non-limiting manner, quantified
to the extent possible, e.g., provide adequate housing for 300 unaccompanied enlisted
personnel. If "adequate" can be translated into square footage or other parameters, this
quantification should be done.
A14.1.3. Assumptions/Ground Rules. Identify only the most significant limitations,
constraints, assumptions, legal or regulatory considerations, e.g., all condition code 1 and 2
dormitories are currently averaging 95 percent occupancy, no present base organizations will
be inactivated or relocated.
A14.1.4. Alternatives. Identify, as a minimum, the most obvious alternatives. Categorize
the alternatives in two groups: feasible alternatives to be analyzed (e.g., status quo,
renovation, new construction, basic assistance - housing (BAH)), or infeasible alternatives to
be eliminated (e.g., leasing). Include reasons for eliminating infeasible alternatives.
A14.1.5. Costs. Identify the major categories of costs and include preliminary estimates by
major category. "Wash" or common costs may be excluded. Ignore minor categories of cost
or incidental costs. Round total costs to the nearest $1000 in keeping with the "rough" nature
of the estimate, and summarize the differences in costs among alternatives as a rough order
of magnitude. Discounting would only be necessary if cash flows vary significantly in
timing. Work to develop cost estimates with the appropriate base level functional expert, e.g.,
facility maintenance and new facility construction costs from civil engineering, number of
dorm occupants by pay grade from base billeting office. Documentation of costs is not
necessary, but check calculations for accuracy.
A14.1.6. Benefits. Identify the more important benefits associated with each of the
alternatives being analyzed, e.g., renovation corrects all deficiencies, or opting for off-base
housing (BAH) results in demolishing old dorms, reducing facility maintenance and repair
workload.
A14.1.7. Sensitivity/Risk Assessment. Identify the key variables which, if varied within a
reasonable range of analysis, could possibly change the recommendation.

80 AFMAN65-506 29 AUGUST 2011
A14.1.8. Conclusions and Recommendation. Briefly explain which alternative appears
best and why. Emphasize that the choice is based on preliminary analysis only and could
possibly change based on results of a complete, formal EA.

AFMAN65-506 29 AUGUST 2011 81
Attachment 15
ANNUAL ECONOMIC ANALYSIS REPORT (RCS: HAF-FMC[A] 9501) FORMAT
A15.1. Command/field operating agency financial analysis offices forward this report to
SAF/FMCE by 1 December annually, reporting on economic analysis activity of the recently
completed fiscal year. Report the number of EAs/waiver requests signed/certified at
MAJCOM/FOA/DRU level during this period, regardless whether SAF/FMCE has seen
them. This report is designated emergency code C-2. Continue reporting during emergency
conditions, normal precedence. Submit data requirements in this category as prescribed or as
soon as possible after submission of priority reports. Discontinue reporting during MINIMIZE. A
blank spreadsheet version of this report can be obtained from SAF/FMCE.
Figure A15.1. Annual Economic Analysis Report (RCS: HAF-FMC[A] 9501) Format
Fiscal Year of Data Being Reported: ______
Command/Field Operating Agency financial analysis offices will forward this report to
SAF/FMCE annually, reporting on economic analysis activity of the recently completed
fiscal year.
This report is designated emergency code C-2. Continue reporting during emergency
conditions, normal precedence. Submit data requirements in this category as prescribed or as
soon as possible after submission of priority reports. Discontinue reporting during
MINIMIZE.
1. Reporting MAJCOM/FOA/DRU: __________
2. Number of analyses SIGNED/CERTIFIED at MAJCOM/FOA/DRU level during this
period:
Economic Analyses (EAs): ______
Business Case Analyses (BCAs): ______
EA Waiver Requests: ______
3. Identify the Subject/Type of analyses identified in Question 2.
EA
Waiver
SUBJECT/TYPE EA BCA
Requests_
Military Construction (MILCON) ______ ______ ________
Military Family Housing (MFH) ______ ______ ________
Information Technology ______ ______ ________
AF Working Capital Fund (AFWCF) ______ ______ ________
Lease vs Purchase ______ ______ ________
Privatization (MFH) ______ ______ ________
Privatization (Utilities) ______ ______ ________

82 AFMAN65-506 29 AUGUST 2011
Preliminary EAs (See AFI 65-501, para 2.2) ______ ______ ________
Other * ______ ______ ________
* Show itemized list by type (if not listed above) and project title in Comments section.
NOTE: Explain any differences between the totals in Questions 2 and 3 in the Comments
section.
4. Of the analyses identified in Question 3, identify problem areas you’ve encountered in the
past fiscal year.
Score problem areas on a scale of 0 to 10
For Extent, 0 means no problem; 10 means the problem areas you’ve encountered in the past
fiscal year.
For Frequency, 0 means the problem has not come up once this past FY; 10 means it is a
pervasive problem that has occurred in most or all analyses this FY.
EA
Waiver
EA BCA
Request
PROBLEM AREA Extent Frequency Extent Frequency Extent
Frequency
Revising the objective of the analysis _____ _____ _____ _____ _____
_____
Revising or clarifying assumptions _____ _____ _____ _____ _____
_____
Adding another alternative _____ _____ _____ _____ _____
_____
Substantially revising an alternative _____ _____ _____ _____ _____
_____
Explaining why any alternatives are infeasible _____ _____ _____ _____ _____
_____
Adding an investment cost _____ _____ _____ _____ _____
_____
Revising investment cost estimate _____ _____ _____ _____ _____
_____
Adding a recurring cost element _____ _____ _____ _____ _____
_____
Revising a recurring cost element _____ _____ _____ _____ _____
_____
Updating discount rate or inflation factors _____ _____ _____ _____ _____
_____
Adding or revising sensitivity analysis _____ _____ _____ _____ _____
_____
Adding or revising benefits analysis _____ _____ _____ _____ _____
_____
Adding a recommendation/decision criteria _____ _____ _____ _____ _____
_____

AFMAN65-506 29 AUGUST 2011 83
Providing or improving documentation _____ _____ _____ _____ _____
_____
Adding missing coordination signatures _____ _____ _____ _____ _____
_____
Note: Total may not match totals in Question 2 due to revisions of an EA for more than one
reason.
5. Of the total number of analyses in Question 1 above, list the number of analyses/waivers
completed by
EA Waiver
EA BCA Requests
In-house personnel _____ _______ _______
CoE Assisted _____ _______ _______
Contractor _____ _______ _______
Note: Total may not match totals in Question 2 due to revisions of an EA for more than one
reason.
6. For the analyses completed by contractors in Question 5, indicate (in $K):
EA
Waiver
EA BCA
Requests
Average cost to complete on analysis/waiver _______ _______
_______
Total costs spent on analyses/waivers performed by contractors _______ _______
_______
7. Total number of Economic Impact Analyses (EIAs) competed in your MAJCOM:
_______
In the Comments section (Item 8), list the installations that have a completed EIA for this
FY, and
indicate whether a MAJCOM-wide EIA was completed.
8. Comments

84 AFMAN65-506 29 AUGUST 2011
Attachment 16
SAMPLE BENEFIT ANALYSIS
A16.1. Figure A16.1 is an example of a Benefit Analysis.
Figure A16.1. Sample Benefit Analysis.
This Benefit Analysis was accomplished using inputs of a team consisting of members drawn
from a variety of functional areas on the base: Civil Engineering, Security Forces, Safety,
Services, Personnel, and Financial Analysis. The team determined the benefit categories and
the weights for each. Each member scored each individual benefit, and the scores for each
benefit were then averaged and weighted.
Each benefit category was assigned a weighted value from 1 to 10, with 10 being the most
important, and scored using a percent scale from 0% to 100%, with 100% representing the
most benefit.
Scores were based on how well each alternative met each benefit criterion discussed above.
Alternatives that did not meet the criteria were given a score of zero.
The following are the benefits measured and the criterion used:
(1) Mission Readiness: Refers to how commute times will be reduced depending on the
option chosen and the location of the quarters.
(2) Security/Safety: Refers to how well the option provides for the security and safety
needs of our service members.
(3) Meeting AF Standards: Refers to the degree to which the quarters meet AF standards.
(4) Morale: This benefit is a measure of the morale and retention factors.
Computations:
Status Quo Renovation
New
Construction
Benefit Weight Score
Wtd
Score Score
Wtd
Score Score
Wtd
Score
Mission Readiness 10 50% 5.0 90% 9.0 100% 10.0
Safety/Security 9 30% 2.7 80% 7.2 100% 9.0
Meeting AF Standards 5 50% 2.5 50% 2.5 100% 5.0
Morale 4 25% 1.0 75% 3.0 100% 4.0
Total Benefits Score 11.2 21.7 28.0
Scoring was based on the following:
Mission Readiness: Status quo, renovation, and construct new options all provide adequate

AFMAN65-506 29 AUGUST 2011 85
housing in on-base locations. This ensures military personnel do not have to commute to the
base, thus allowing quicker mobilizing capability and higher mission readiness.
Security/Safety: Status quo, renovation, and construct new options are located on base,
therefore, affording the benefits of base security procedures and entry control. Security is
improved with both options as service members would adequately reside within the confines
of the base boundaries with subsequent Security Force response time being minimal. This
measure also reflects the physical condition of the housing with respect to being a safe living
environment for its occupants, with a minimum of design and maintenance-related hazards.
Meeting AF Standards: Improved living conditions would be provided with renovation,
construct new and move off base options. Internal finishings and facilities are improved to
high modern standards for the benefit of family enjoyment. The level of finishing standards
in the refurbished quarters or the newly built housing units and their impact on the living
patterns of occupants would greatly enhance morale. New construction materials and modern
construction techniques will provide superior energy efficiency and hence a more
comfortable environment at less cost. The status quo option, for the most part, has occupants
residing in older-type dwellings, which contain inferior materials, and in some instances
unsanitary looking utilities.
Morale: Renovation and construct new options would enhance the community spirit with
extended accommodation, improved parking facilities and playgrounds. Morale would be
enhanced by providing our service members new facilities, thus forming a cohesive
environment. The renovation option upgrades existing facilities on base which also improves
the overall appearance of the housing areas and is more inviting for newcomers. The status
quo option has substandard housing, poor parking and few playgrounds which cannot be
addressed via the maintenance program and would continue to frustrate residents. In the
move off base option, military personnel would benefit from living in modern housing on the
local economy, but at the same time they would be living in a less cohesive environment, in
scattered communities.

86 AFMAN65-506 29 AUGUST 2011
Attachment 17
CRITERIA/STANDARDS FOR ECONOMIC ANALYSES/LIFE CYCLE COSTING FOR
MILCON DESIGN
A17.1. Purpose. This guidance establishes criteria and standards for performing EAs and life
cycle cost studies used in support of design decisions for MILCON program projects, i.e., to
support the selection from various alternatives of components/systems being considered as
elements in facilities design. These criteria and standards apply to all design decisions regardless
of when they are made in the planning, programming, design or procurement process. This
guidance does not apply to economic analyses and life cycle studies used to make project
justification decisions during the planning and programming process.
A17.2. General. EAs shall be conducted as part of the design process to ensure the
selection/rejection of design alternatives is not based solely on construction costs, but also on the
lowest life cycle costs (LCC), that is, lowest total cost of ownership. The depth and degree of
formality of these analyses shall be determined on a case- by-case basis to ensure that the cost of
performing an analysis is clearly outweighed by the potential benefits derived. Results of generic
studies or results of previous analyses of alternatives similar to those currently under
consideration may be used in lieu of performing a new study provided the previous study was
based on similar design conditions, criteria, and methods. Previous studies should be updated
only as required to reflect changes of conditions significant enough to impact the design
decision. All EAs and other justification for the selection of a design alternative, whether a
previous study or a new one, shall be clearly documented in the appropriate section of the project
design analysis.
A17.3. Methods. All analyses shall consider the total LCC for design alternatives, where the
LCC includes all costs and benefits associated with an alternative over its expected life,
including but not limited to construction/acquisition, energy, maintenance, operation, repair,
replacement, alteration, disposal costs, and retention values. The present value discounting
approach shall be used to adjust for the differences in timing of cost and benefits unless
otherwise specified by other directives or by public law. Discounting should be applied to all
cost and benefits over the appropriate analysis period. Specific criteria are as follows:
A17.3.1. Discount Rates. The discount rates are expressed in "real" terms.
A17.3.1.1. Energy Related Studies. All energy related economic studies (in which
energy costs are relevant, regardless of their magnitude relative to other costs) shall use
the current discount rate published by the National Institute of Standards and Technology
(NIST) in their annual supplement to NIST Handbook 135, and disseminated by the
appropriate Service Headquarters Office.
A17.3.1.2. Non-energy Related Studies. All economic studies other than energy
related economic studies shall use the current discount rates published annually by the
Office of Management and Budget (OMB) as Appendix C to OMB Circular A-94, and
disseminated by the appropriate Service Headquarters office.
A17.3.2. Analysis Period. The analysis period shall be the date of the study (DOS) through
the economic life of the facility as a whole. The economic life shall not be taken beyond 25
years from the scheduled beneficial occupancy date (BOD) for the project unless specifically

AFMAN65-506 29 AUGUST 2011 87
approved by the appropriate Service Headquarters Office. Such approval cannot be granted
for energy related studies as it is precluded by statute.
A17.3.3. Cash Flow. In general, cash flow used in the analysis will be based on the
estimated calendar dates on which the events and cost/benefits are projected/scheduled to
occur. Construction/acquisition costs may be assumed to be incurred as a single lump sum,
preferably at the time corresponding to the midpoint of the construction/acquisition process.
Other cash flows that occur periodically throughout the year (e.g., cost of fuel, electricity,
water, maintenance, etc.) may be assumed to be incurred as a single lump sum, preferably at
midyear. In circumstances where the above assumptions add unnecessarily to the complexity
of the calculations, all cash flows may be assumed to occur at the end of the year in which
they are actually scheduled/projected to occur.
A17.3.4. Benefits and Costs. All benefits and costs will be expressed in terms of constant
dollars that reflect the purchasing power of the dollar on the DOS (i.e., constant DOS
dollars). The rate of inflation of the economy as a whole will be excluded from all LCC
calculations. (The rate of inflation is irrelevant to the LCC analysis results since all benefits
and costs are expressed in terms of constant DOS dollars and discounted using a "real"
discount rate.)
A17.3.5. Future Benefits and Costs. In projecting future benefits and costs, an allowance
for future price-level changes will be made only for particular benefits and costs expected to
change at rates higher or lower than the general rate of inflation. In such cases, the rates of
change used in the analysis will be the "differential" rates, i.e., the anticipated differences
between the actual projected rates of change and the general inflation rate.
A17.3.5.1. Energy Studies: Fuel/energy costs shall have differential escalation rates as
published by NIST in Handbook 135. All non-energy costs shall have a zero differential
escalation rate.
A17.3.5.2. Non-energy Studies: For non-energy studies, the differential rate of future
price level change shall generally be assumed to be zero, except in those cases where
there is reliable information to the contrary.

88 AFMAN65-506 29 AUGUST 2011
Attachment 18
SAMPLE FORMATS FOR SUMMARY OF COSTS
A18.1. Figures A18.1 and A18.2 are two sample formats for displaying summarized cost data.
Their use is not mandatory, and can be changed to fit the needs of the analysis.
Figure A18.1. Format A - Summary Of Costs For Economic Analysis.
1. Submitting Organization:
2. Type of Submission:
3. Project Title:
4. Description of Project Objective:
5. List of Alternatives:
6. Economic Life:
7. Program/Project Costs:
A B C D E F
Project Nonrecurring Recurring Annual Discount Discounted
Year Investment Operations Cost Factor Annual Cost
1
2
3 ____________ _________ _______ _______ ___________
8. Total
9. Total Discounted Project Cost (from Line 8, Column 7.f.). $ XXX
10. Uniform Annual Cost (UAC) (without terminal value) (Line 9/Line 8 entry for Column
7.e.)….$ XXX
11. Discounted terminal
value………………………………………………………………….....…..$ XXX
12. Net Total Project Cost (discounted) (Line 9 minus Line
11)…………………………….………$ XXX
13. Uniform Annual Cost (with terminal value) (Line 12 divided by Line 8, Column
7.e.)….….…...$ XXX
14. Source/Derivation of Cost Estimates (Use as much space as required.) Sources should be
included for all
costs, including the following (if applicable):
a. Nonrecurring Costs:
(1) Research & Development.
(2) Investment.
b. Recurring Costs.
c. Net Terminal Value.
d. Other Considerations.
NOTE: If sources were cited in the body of the EA, they need not be repeated here. Calculations
must be traceable down to their most basic inputs.

AFMAN65-506 29 AUGUST 2011 89
15. Name, Title, and Phone Number of Principal Action Officer: Date:
Figure A18.2. Format A-1--Summary Of Differential Costs For Economic Analysis.
1. Submitting Organization:
2. Type of Submission:
3. Project Title:
4. Description of Project Objective:
5. a. Present alternative: 6. a. Economic life:
b. Proposed alternative: b. Economic life:
7. 8a. 8b. 9. 10. 11.
Fiscal Year Recurring cost Recurring cost Differential cost Discount
Discounted
Alt A Alt B Factor
Differential Cost
(N
PV)
FY1
FY2
FY3
12. Totals
13. Present Value of New Investment:
a. Land and buildings___________
b. Equipment___________
c. Other (identify)__________
14. Present value of new investment__________
15. Plus: Present value of existing assets employed on project__________
16. Less: Present value of existing assets replaced__________
17. Less: Present value of the terminal value of new investment_________
18. Total present value of investment___________
19. Present value of savings from operations______________
20. Plus: Present value of the cost of refurbishment or modifications avoided__________
21. Total present value of savings (line 19 plus line 20)______________
22. Savings/investment ratio (line 21 divided by line 18)______________
23. Source/Derivation of Cost Estimates (use as much space as required):
a. Investment costs (itemize project costs)
(1) New investment; value of assets employed; value of existing assets replaced
(2) Net terminal value
b. Recurring cost (operations):

90 AFMAN65-506 29 AUGUST 2011
(1) Personnel
(2) Operating
(3) Overhead
c. Other Considerations:
24. Name, Title, and Phone Number of Principal Action Officer: Date:
Notes on Format A-1:
Lines 6a & 6b: Economic lives must be equal, or placed on an equal basis for the purposes of
analysis, to use Format A-1.
Column 7: Years in which any costs will be incurred.
Column 8a: Operating costs of present system, corresponding to years in which incurred (may
not occur during every project year).
Column 8b: Operating costs of proposed system, corresponding to years in which incurred.
Column 9: Year-by-year savings attributable to differential operating costs (Column 8a minus
column 8b).
Column 10: Discount factors corresponding to the years in Column 7.
Column 11: Year-by-year present value of operating savings (Column 9 times Column 10).
Line 12, Totals: Totals for Columns 8 through 11.
Lines 13a through 13c: Present values of new investments (i.e., investments in assets not on
hand, new assets for which funding must be obtained).
Line 14: Total of Lines 13a through 13c.
Line 15: Present value of assets on hand that will be used on the proposed alternative and are not
currently used on the present alternative (i.e., equipment removed from storage or taken from
another organizational element); assets to be used, but for which outside funding is not required.
Subtracted from this present value will be the present value of any future income received from
salvage of these assets.
Line 16: Present value of assets that are used on the present alternative but will not be used if the
proposed alternative is adopted; the assets will be sold, made available for use by other
organizations, or used on another project. Subtracted from this present value will be the present
value of the salvage income that would be received from these assets if the present system was
continued (i.e., the proposed system is not adopted).
Line 17: Present value of eventual salvage income from assets listed in Lines 13a through 13c.
Line 18: Line 14 plus Line 15 minus Line 16 minus Line 17.
Line 19: Present value of operations savings; sum of Column 11.
Line 20: Present value of a current asset overhaul or modification that will not be required if the
proposed alternative is adopted; savings due to elimination of need of overhaul of current assets.
Line 21: Line 19 plus Line 20.
Line 22: Line 21 divided by Line 18.

AFMAN65-506 29 AUGUST 2011 91