by phone through the serviceontario contact centre … · perspectives économiques et revue...
TRANSCRIPT


For general inquiries regarding the 2008 Ontario Economic Outlook and Fiscal Review, Background Papers please call: Toll-free English & French inquiries: 1-800-337-7222 Teletypewriter (TTY): 1-800-263-7776 For electronic copies of this document, visit our website at www.fin.gov.on.ca A printed copy of this publication can be ordered: Online at: www.serviceontario.ca/publications By phone through the ServiceOntario Contact Centre Monday to Friday, 8:30 AM to 5:00 PM 416 326-5300 416 325-3408 (TTY) 1 800 668-9938 Toll-free across Canada 1 800 268-7095 TTY Toll-free across Ontario © Queen’s Printer for Ontario, 2008 ISSN 1483-5967 (Print) ISSN 1496-2829 (PDF/HTML) Ce document est disponible en français sous le titre : Perspectives économiques et revue financière de l’Ontario de 2008, Documents d’information

TABLE OF CONTENTS
FOREWORD............................................................................................................................... ix
ANNEX I: FISCAL OUTLOOK
SECTION A: ONTARIO’S 2008–09 FISCAL OUTLOOK
2008–09 Fiscal Performance ......................................................................................... 3
2008–09 Revenue Changes Since 2008 Budget................................................................... 4
Details of 2008–09 In-Year Revenue Changes............................................................... 5
2008–09 Expense Changes Since 2008 Budget ................................................................... 6
Details of 2008–09 In-Year Expense Changes ............................................................... 6
Maintaining a Prudent Accumulated Deficit-to-GDP Ratio .................................................... 7
Risks to the Fiscal Outlook ........................................................................................... 8
SECTION B: EXPENDITURE MANAGEMENT
EXPENDITURE MANAGEMENT......................................................................................................11
SECTION C: DETAILS OF ONTARIO’S FINANCES
DETAILS OF ONTARIO’S FINANCES................................................................................................13
ANNEX II: ECONOMIC OUTLOOK
OVERVIEW................................................................................................................................23 Financial Market Turmoil........................................................................................... 23
Ongoing External Economic Challenges ......................................................................... 24
Ontario’s Economic Progress over the Past Five Years ....................................................... 25
The Ontario Economy in 2008 .................................................................................... 26
Heightened Global Economic Uncertainty ...................................................................... 27
Private-Sector Economic Forecasts ............................................................................... 29
Comparison to the 2008 Ontario Budget ........................................................................ 30
Table of Contents i

ANNEX III: ROLE FOR THE FEDERAL GOVERNMENT
Canada’s System of Transfers Is Outdated....................................................................... 35
Ontario’s Fiscal Gap ............................................................................................ 35
Equalization ...................................................................................................... 35
Employment Insurance......................................................................................... 36
Health Care ...................................................................................................... 36
Regional Economic Development............................................................................ 37
Infrastructure .................................................................................................... 37
Time-Limited Transfers........................................................................................ 37
Need for a Federal Partner ......................................................................................... 38
ANNEX IV: BORROWING AND DEBT MANAGEMENT
LONG-TERM PUBLIC BORROWING...............................................................................................41 Deficit ............................................................................................................. 42
Other Changes in the Financing Table ...................................................................... 43
Debt ............................................................................................................... 43
Debt-to-GDP Ratios............................................................................................ 44
Total Debt Composition ....................................................................................... 45
Debt Management .............................................................................................. 45
Debt Maturities.................................................................................................. 46
Cost of Debt ..................................................................................................... 46
ANNEX V: TRANSPARENCY IN TAXATION, 2008
TRANSPARENCY IN TAXATION .....................................................................................................49 Structure of the Report ............................................................................................. 49
Scope ................................................................................................................... 49
Method ................................................................................................................. 50
Personal Income Tax ................................................................................................ 51
Personal Income Tax — Description of Tax Provisions ...................................................... 55
Ontario Non-refundable Tax Credits........................................................................ 55
Employee Ownership and Ontario Labour Sponsored Investment Fund Tax Credits.............. 56
Ontario Refundable Tax Credits ............................................................................. 56
Exemptions, Deductions, Deferrals and Other Measures Shared with the Federal Government ................................................................................ 57
Corporate Tax ........................................................................................................ 59
ii 2008 Ontario Economic Outlook and Fiscal Review

Corporate Tax — Description of Tax Provisions .............................................................. 62
Corporate Income Tax ......................................................................................... 62
Sales and Commodity Tax .......................................................................................... 64
Sales and Commodity Tax — Description of Tax Provisions ................................................ 67
Land Transfer Tax .............................................................................................. 67
Retail Sales Tax.................................................................................................. 67
Education Property Tax............................................................................................. 69
Employer Health Tax................................................................................................ 70
Estate Administration Tax .......................................................................................... 70
Gross Revenue Charge .............................................................................................. 70
ANNEX VI: HOW TO PARTICIPATE IN THE 2009 PRE-BUDGET CONSULTATIONS
HOW TO PARTICIPATE IN THE 2009 PRE-BUDGET CONSULTATIONS .................................................73 Submissions............................................................................................................ 73
Table of Contents iii

LIST OF TABLES
ANNEX I: FISCAL OUTLOOK
SECTION A: ONTARIO’S 2008–09 FISCAL OUTLOOK
Table 1: 2008–09 In-Year Fiscal Performance.................................................................... 4 Table 2: Summary of Revenue Changes Since 2008 Budget.................................................... 5 Table 3: Summary of Expense Changes Since 2008 Budget .................................................... 6
SECTION C: DETAILS OF ONTARIO’S FINANCES
Table 4: 2008–09 Fiscal Outlook ................................................................................. 13 Table 5: Revenue..................................................................................................... 14 Table 6: Total Expense.............................................................................................. 15 Table 7: Other Expense............................................................................................. 16 Table 8: 2008–09 Infrastructure Expenditures ................................................................. 17 Table 9: Ten-Year Review of Selected Financial and Economic Statistics.................................. 18
ANNEX II: ECONOMIC OUTLOOK
Table 1: Ontario Economic Outlook ............................................................................. 23 Table 2: Key External Variables ................................................................................... 24 Table 3: External Variables......................................................................................... 28 Table 4: Impacts of Changes in Key Assumptions on Ontario Real GDP Growth ....................... 29 Table 5: Private-Sector Forecasts for Ontario Real GDP Growth .......................................... 30 Table 6: Changes in Key Economic Forecast Assumptions,
2008 Fall Economic Statement Compared to 2008 Budget ....................................... 31
ANNEX IV: BORROWING AND DEBT MANAGEMENT
Table 1: 2008–09 Borrowing Program: Province and OEFC................................................ 42
iv 2008 Ontario Economic Outlook and Fiscal Review

ANNEX V: TRANSPARENCY IN TAXATION, 2008
Table 1: Personal Income Tax ..................................................................................... 51 Table 2: Amounts on Which Indexed Non-refundable Tax Credits Are Based for 2008................ 55 Table 3: Corporate Tax ............................................................................................. 59 Table 4: Sales and Commodity Tax ............................................................................... 64 Table 5: Education Property Tax.................................................................................. 69 Table 6: Employer Health Tax (EHT)............................................................................ 70 Table 7: Estate Administration Tax ............................................................................... 70 Table 8: Gross Revenue Charge (GRC).......................................................................... 70
Table of Contents v

LIST OF CHARTS
ANNEX I: FISCAL OUTLOOK
SECTION A: ONTARIO’S 2008–09 FISCAL OUTLOOK
Chart 1: Ontario’s Fiscal Performance ............................................................................. 3
Chart 2: Accumulated Deficit-to-GDP............................................................................. 7
SECTION C: DETAILS OF ONTARIO’S FINANCES
Chart 3: Composition of Revenue, 2008–09 ................................................................... 20
Chart 4: Composition of Total Expense, 2008–09 ............................................................ 20
Chart 5: Composition of Program Expense, 2008–09 ........................................................ 20
ANNEX II: ECONOMIC OUTLOOK
Chart 1: Ontario’s International Merchandise Exports Are Diversifying .................................. 25
Chart 2: Jobs Created Since October 2003...................................................................... 26
Chart 3: Employment Growth Relatively Strong .............................................................. 26
Chart 4: Crude Oil Prices .......................................................................................... 28
Chart 5: Canadian Dollar ........................................................................................... 28
Chart 6: Private-Sector Forecasts ................................................................................. 30
ANNEX III: ROLE FOR THE FEDERAL GOVERNMENT
Chart 1: Ontarians Pay into Equalization ........................................................................ 35
Chart 2: Ontarians Do Not Receive Fair Treatment .......................................................... 36
Chart 3: Time-Limited Federal Transfers........................................................................ 37
vi 2008 Ontario Economic Outlook and Fiscal Review
ANNEX IV: BORROWING AND DEBT MANAGEMENT
Chart 1: Borrowing — All Markets .............................................................................. 41
Chart 2: Borrowing — Domestic Market ....................................................................... 41
Chart 3: Debt ......................................................................................................... 43
Chart 4: Net Debt-to-GDP......................................................................................... 44
Chart 5: Accumulated Deficit-to-GDP........................................................................... 44
Chart 6: Total Debt Composition................................................................................. 45
Chart 7: Net Interest Rate Resetting Exposure................................................................. 45
Chart 8: Foreign Exchange Exposure............................................................................. 45
Chart 9: Debt Maturities............................................................................................ 46
Chart 10: Effective Interest Rate (Weighted Average) of Debt.............................................. 46
Table of Contents vii

viii 2008 Ontario Economic Outlook and Fiscal Review

FOREWORD
The global economy is threatened in ways not imagined even a few short weeks ago. The liquidity crisis in financial markets has undermined business and consumer confidence around the world. The resulting impacts on investment and jobs are real, present, and directly affect individuals, families, businesses and governments. Ontario is no exception.
Using the best information available at October 16, 2008, the 2008 Ontario Economic Outlook and Fiscal Review adjusts the economic assumptions contained in the 2008 Ontario Budget. The impact of these changes is applied to the government’s revenue and expenditure projections, which revises the anticipated financial results for the current fiscal year.
This document establishes the principles that will guide the government’s response to the range of challenges occasioned by the global economic situation. It also details steps to be undertaken in the coming days that will help manage the Province’s finances through the balance of the fiscal year and it responds to the new global reality. These steps begin a process that will culminate in the 2009 Budget.
TODAY’S ENVIRONMENT
At the time of the 2008 Budget, the consensus private-sector forecast for growth in the Ontario economy in 2008 was 1.2 per cent. Since then, the private-sector average estimate for 2008 has declined to 0.1 per cent.
As a result, the Province’s revenue is projected to decline in 2008–09 while expenditures will increase in certain areas. Due primarily to lower revenues, the government is now projecting a deficit of $500 million in 2008–09.
The new economic reality is forcing governments around the world to re-examine their expenditures, adjust their assumptions and respond in an environment where the only constant is uncertainty.
GUIDING PRINCIPLES
As a first principle, the McGuinty government’s five-point economic plan will continue to be the foundation of its approach to today’s economy. Investing in skills, infrastructure and innovation while lowering business costs and building partnerships remains the right response in turbulent times.
The Reaching Higher Plan for postsecondary education and investments in skills training means that 100,000 more Ontarians are being trained in colleges and universities today and 50,000 more are learning a trade.
Three years ago, the government launched ReNew Ontario, a five-year, $30 billion infrastructure investment that is building new roads, new schools, new hospitals, new bridges and transit right across Ontario. Today there are over 100 major construction projects that have been initiated. The government’s projects will create over 100,000 jobs this year.
Foreword ix
Innovation creates jobs. In addition to historic investments to attract new high technology jobs to Ontario, the government has proposed a tax incentive to commercialize Canadian ideas so that home-grown ideas turn into hometown jobs.
Strategic tax cuts announced since 2004 have already saved businesses more than $1.5 billion and will save businesses nearly $3 billion annually when they are fully implemented. These targeted measures promote new investment and create jobs.
The McGuinty government understands that Ontario is at its best when partners work together. Ontario is partnering with key sectors of the economy, with First Nations, with municipalities and others to foster growth. The government will also continue to press the federal government to respond to Ontario’s needs fairly.
These undertakings, coupled with Ontario’s multi-billion-dollar investment in the renewal of Ontario’s public health care system, are coming to fruition at the precise time they are most needed.
The five-point economic plan is creating jobs and enhancing Ontario’s competitive strength for tomorrow.
The second principle guiding the government’s approach is that the Province must continue to be prudent while maintaining the ability to respond quickly to changing economic circumstances.
Since taking office, the McGuinty government has eliminated its inherited and hidden $5.5 billion deficit, produced three consecutive balanced budgets, decreased Ontario’s debt-to-GDP ratio and kept the rate of growth in Provincial expenditures below the rate of growth in revenue, all while making strategic investments.
The government’s Second Career Strategy, for example, which will be enhanced this fall, helps retrain laid-off workers for new jobs. It is a key part of the $2 billion Skills to Jobs Action Plan, which further enhances skills and builds places to learn.
Most importantly, in spite of the downturn in North America’s manufacturing and forestry sectors, Ontario has seen an increase of more than half a million net new jobs since assuming office. Real income has grown and unemployment is below what it was in 2003.
Prudence dictates that the government take into account how global circumstances will affect capital markets, labour markets and the Province’s finances.
The government will never lose sight of the fact that underneath all the statistics, all the uncertainty and all the turmoil, there are real people with real fears, real concerns and very real needs.
The third principle that will guide the government’s decisions recognizes that the Province must protect the gains it has made while taking a balanced, comprehensive approach to future growth.
x 2008 Ontario Economic Outlook and Fiscal Review

Ontario cannot spend its way out of today’s difficulties.
Initiatives taken as part of the five-point plan constitute an economic stimulus package that is helping families, businesses and communities today.
The McGuinty government will continue to bring a laser-like focus to its priorities and, as part of that focus, has begun a comprehensive review of government expenditures. As a measured and balanced approach to slowing revenues, the government will delay or slow down the implementation of some new spending commitments.
Tax cuts alone are no substitute for a plan. Targeted business tax cuts coupled with a strategy for smart regulation will encourage investment and job growth over time.
The dramatic, unanticipated changes in the global economy mean Ontario will experience a deficit this year. A deficit, followed by a plan for its elimination, represents a balanced response to today’s global reality. The alternative would be deep cuts to the very programs and initiatives that are helping families, businesses and communities weather the current storm.
THE NEXT SIX MONTHS
The McGuinty government will continue to update the people of Ontario through quarterly economic updates. Uncertainty and anxiety about the global economy will no doubt continue. The McGuinty government will diligently monitor and respond to events as they unfold.
The government’s plan is the right plan for the times. It is flexible so that it can accommodate changing economic circumstances. As in other times of uncertainty, Ontario will rise to the current challenges and seize opportunities to strengthen economic growth, create new jobs and continue to be a great place to live and invest.
** N.B. The following Annexes are based on the most recent information available as of October 16, 2008.**
Foreword xi

xii 2008 Ontario Economic Outlook and Fiscal Review

ANNEX I Fiscal Outlook
Annex I: Fiscal Outlook 1

2 2008 Ontario Economic Outlook and Fiscal Review
SECTION A | ONTARIO’S 2008–09 FISCAL OUTLOOK
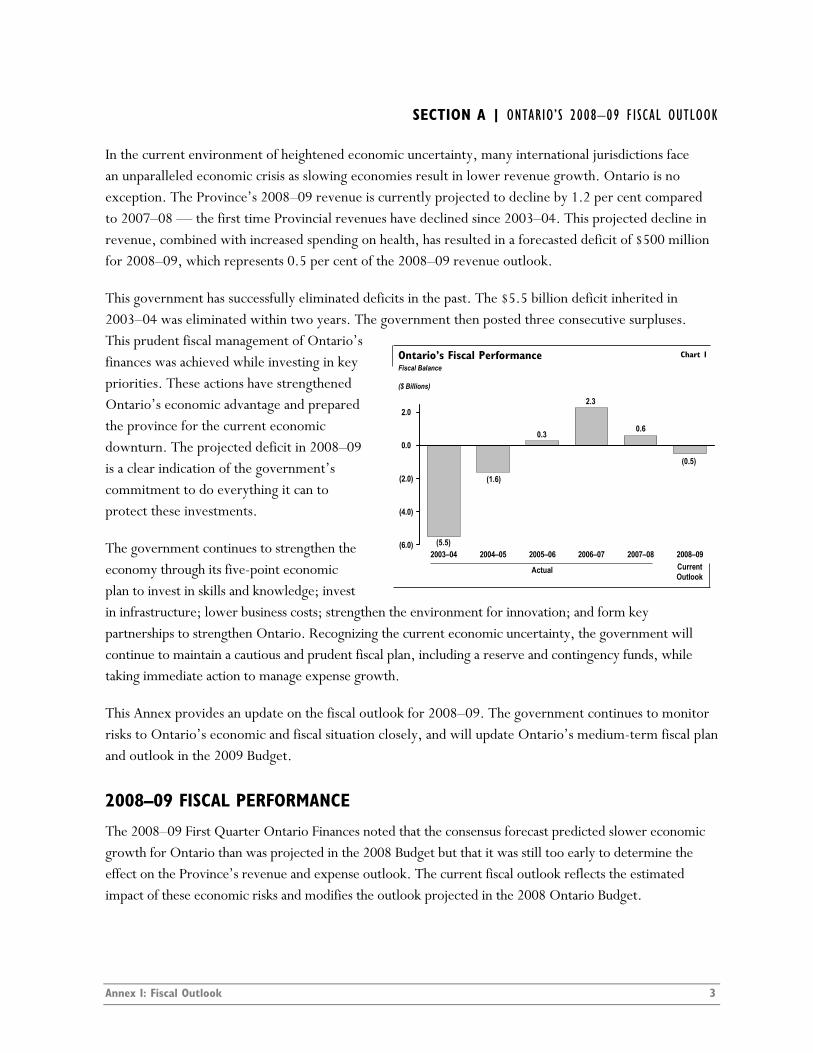
In the current environment of heightened economic uncertainty, many international jurisdictions face an unparalleled economic crisis as slowing economies result in lower revenue growth. Ontario is no exception. The Province’s 2008–09 revenue is currently projected to decline by 1.2 per cent compared to 2007–08 — the first time Provincial revenues have declined since 2003–04. This projected decline in revenue, combined with increased spending on health, has resulted in a forecasted deficit of $500 million for 2008–09, which represents 0.5 per cent of the 2008–09 revenue outlook.
This government has successfully eliminated deficits in the past. The $5.5 billion deficit inherited in 2003–04 was eliminated within two years. The government then posted three consecutive surpluses. This prudent fiscal management of Ofinances was achieved while investing inpriorities. These actions have strengtheneOntario’s economic advantage and prepthe province for the current economic downturn. The projected deficit in 2008–09 is a clear indication of the government’s commitment to do everything it can to protect these investments.
ntario’s key
d ared
The government continues to strengthen the economy through its five-point economic plan to invest in skills and knowledge; invest in infrastructure; lower business costs; strengthen the environment for innovation; and form key partnerships to strengthen Ontario. Recognizing the current economic uncertainty, the government will continue to maintain a cautious and prudent fiscal plan, including a reserve and contingency funds, while taking immediate action to manage expense growth.
(6.0)
(4.0)
(2.0)
0.0
2.0
2003–04 2004–05 2005–06 2006–07 2007–08 2008–09
Fiscal Balance
($ Billions)
Ontario’s Fiscal Performance
(5.5)
(1.6)
0.3 0.6
2.3
Actual Current Outlook
Chart 1
(0.5)
This Annex provides an update on the fiscal outlook for 2008–09. The government continues to monitor risks to Ontario’s economic and fiscal situation closely, and will update Ontario’s medium-term fiscal plan and outlook in the 2009 Budget.
2008–09 FISCAL PERFORMANCE
The 2008–09 First Quarter Ontario Finances noted that the consensus forecast predicted slower economic growth for Ontario than was projected in the 2008 Budget but that it was still too early to determine the effect on the Province’s revenue and expense outlook. The current fiscal outlook reflects the estimated impact of these economic risks and modifies the outlook projected in the 2008 Ontario Budget.
Annex I: Fiscal Outlook 3

2008–09 In-Year Fiscal Performance Table 1 ($ Millions) Budget
Plan Current Outlook
In-Year Change
Revenue 96,920 96,002 (918)
Expense
Programs 87,279 87,411 132
Interest on Debt 8,891 8,891 –
Total Expense 96,170 96,302 132
Reserve 750 200 (550)
Surplus/(Deficit) 0 (500) (500)
Total revenue in 2008–09 is currently projected to be $96,002 million, a decrease of 0.9 per cent from the 2008 Budget forecast, reflecting projections for slower economic growth. Total expense in 2008–09 is currently estimated to be $96,302 million, 0.1 per cent higher than the 2008 Budget forecast, primarily due to higher utilization-related expense in the Ontario Health Insurance Plan (OHIP) program.
The 2008 Budget plan included prudence in the form of a $750 million reserve in 2008–09 to protect against adverse changes in the Province’s revenue and expense, including those resulting from changes in Ontario’s economic performance. A portion of the reserve has been drawn down to partially offset the effects of slower economic growth on the Province’s fiscal outlook. The Province continues to maintain a $200 million reserve in recognition of the continued global economic uncertainty that could further impact the Province’s finances.
2008–09 REVENUE CHANGES SINCE 2008 BUDGET
The revenue outlook at $96,002 million has decreased by $918 million from the 2008 Budget forecast, largely reflecting slower economic growth projections for 2008, partially offset by higher Government of Canada transfers.
4 2008 Ontario Economic Outlook and Fiscal Review
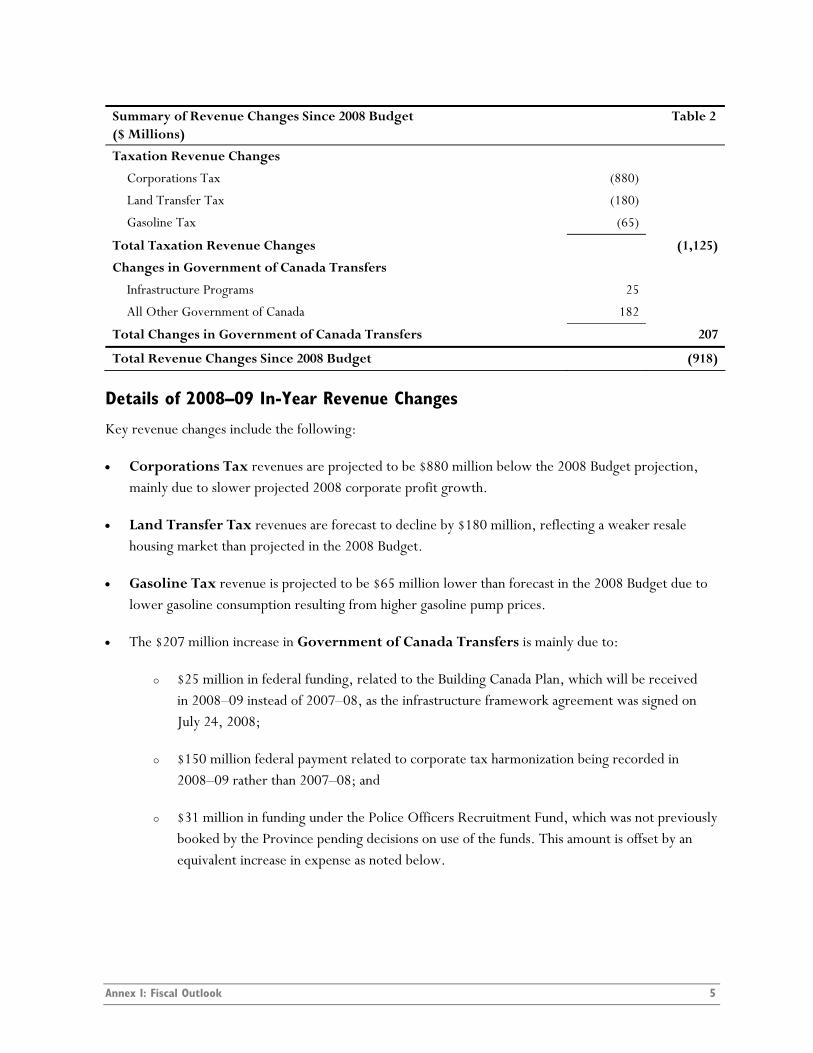
Summary of Revenue Changes Since 2008 Budget Table 2 ($ Millions)
Taxation Revenue Changes
Corporations Tax (880)
Land Transfer Tax (180)
Gasoline Tax (65)
Total Taxation Revenue Changes (1,125)
Changes in Government of Canada Transfers
Infrastructure Programs 25
All Other Government of Canada 182
Total Changes in Government of Canada Transfers 207
Total Revenue Changes Since 2008 Budget (918)
Details of 2008–09 In-Year Revenue Changes
Key revenue changes include the following:
• Corporations Tax revenues are projected to be $880 million below the 2008 Budget projection, mainly due to slower projected 2008 corporate profit growth.
• Land Transfer Tax revenues are forecast to decline by $180 million, reflecting a weaker resale housing market than projected in the 2008 Budget.
• Gasoline Tax revenue is projected to be $65 million lower than forecast in the 2008 Budget due to lower gasoline consumption resulting from higher gasoline pump prices.
• The $207 million increase in Government of Canada Transfers is mainly due to:
$25 million in federal funding, related to the Building Canada Plan, which will be received in 2008–09 instead of 2007–08, as the infrastructure framework agreement was signed on July 24, 2008;
$150 million federal payment related to corporate tax harmonization being recorded in 2008–09 rather than 2007–08; and
$31 million in funding under the Police Officers Recruitment Fund, which was not previously booked by the Province pending decisions on use of the funds. This amount is offset by an equivalent increase in expense as noted below.
Annex I: Fiscal Outlook 5

2008–09 EXPENSE CHANGES SINCE 2008 BUDGET
Total expense in 2008–09 is currently projected to be $96,302 million, an increase of $132 million from the 2008 Budget forecast. This change in total expense primarily reflects an increase in the Ministry of Health and Long-Term Care for utilization-related expense in the OHIP program.
Summary of Expense Changes Since 2008 Budget Table 3 ($ Millions)
Program Expense Changes with Contingency Fund Offsets This Quarter
Ministry of Education – School Boards’ Net Expense – Grants for Student Needs funding.
187.5
Other Changes in Program Expense with Contingency Fund Offsets – mainly funding for flood relief response and repairs, and for the OMERS Administration Corporation.
7.1
Ministry of Finance – Operating Contingency Fund offsets (191.5)
Ministry of Energy and Infrastructure – Capital Contingency Fund offsets (3.1)
Net Program Expense Changes with Contingency Fund Offsets This Quarter –
Additional Changes in Program Expense This Quarter
Ministry of Health and Long-Term Care – utilization-related expense in the OHIP program.
100.0
Ministry of Community Safety and Correctional Services – increase to support recruitment of police officers.
31.0
Other Changes in Program Expense – primarily reflects funding for college training equipment.
1.1
Total Additional Changes in Program Expense This Quarter 132.1
Net Changes in Program Expense Reported in First Quarter Ontario Finances –
Interest on Debt Changes –
Total Expense Changes Since 2008 Budget 132.1
Details of 2008–09 In-Year Expense Changes
The following expense changes have occurred since the 2008–09 First Quarter Ontario Finances:
Program Expense Changes with Contingency Fund Offsets: • An increase of $187.5 million in the Ministry of Education School Boards’ Net Expense
to enhance Grants for Student Needs funding to support salary benchmark increases for education sector staff.
• Other Changes in Program Expense with Contingency Fund Offsets reflect a net increase of $7.1 million, which includes funding for flood relief services and repairs, and a one-time payment for the OMERS Administration Corporation to administer supplemental benefit plans.
6 2008 Ontario Economic Outlook and Fiscal Review

The Operating Contingency Fund has decreased by $191.5 million, and the Capital Contingency Fund has decreased by $3.1 million, to fund ministries’ expense changes as outlined.
Additional Changes in Program Expense: • An increase of $100.0 million in the Ministry of Health and Long-Term Care due to higher
utilization-related expense in the OHIP program.
• An increase of $31.0 million in the Ministry of Community Safety and Correctional Services, fully offset by federal revenue from the Police Officers Recruitment Fund announced in the 2008 federal budget. This federal transfer provides partial support for the recruitment of police officers to make communities safer.
• An increase of $1.1 million in Other Changes in Program Expense, primarily due to funding for college training equipment, fully offset by federal revenue.
MAINTAINING A PRUDENT ACCUMULATED DEFICIT-TO-GDP RATIO
A key element of the government’s fiscal plan is the commitment to maintain a prudent level of accumulated deficit relative to the size of Ontario’s economy as measured by nominal gross domestic product (GDP). This contributes to responsible fiscal management that is long term in nature, so that future generations are not faced with the erosion of key programs and services.
Although a $500 million deficit is forecast for 2008–09, the Province’s accumulated deficit-to-GDP ratio is projected to improve to 17.8 per cent in 2008–09, down from 25.2 per cent in 2003–04.
Accumulated Deficit-to-GDP1 Chart 2
151617181920212223242526
2003–04 2004–05 2005–06 2006–07 2007–08 2008–09
1 The substantial decline in 2005–06 was primarily due to a one-time reduction of $16.3 billion to the Province’s accumulated deficit resulting from the inclusion of hospitals, school boards and colleges in the Province’s financial statements, reflecting the balance of the sectors’ assets less their liabilities as at April 1, 2005.
Per Cent
Actual Current Outlook
24.3
20.3
19.118.1
17.8
25.2
This year’s deficit is primarily the result of lower revenue growth due to heightened economic uncertainty, and is a clear indication of the government’s commitment to do everything it can to protect investments in key public services.
Consistent with this approach, the government continues to pursue strategies to contain spending while doing all it can to protect key investments.
Annex I: Fiscal Outlook 7

RISKS TO THE FISCAL OUTLOOK
Like many jurisdictions around the world, Ontario faces a much more challenging economic environment than both public and private forecasters expected at the time of the 2008 Budget. As a result, the Province’s fiscal outlook is increasingly vulnerable to variances in both the revenue and expense outlooks. In particular, revenue risks are greater due to heightened global economic and financial uncertainty. Key cost drivers within the Province’s expense outlook could also be affected, including pressures in demand-driven programs and services that arise from changes in the economic outlook, utilization or enrolment rates. Although the $750 million reserve included in the 2008 Budget has been adjusted to offset a lower revenue outlook, prudence remains in the fiscal plan in the form of a reserve and contingency funds to help mitigate further changes arising from global economic uncertainty that could have an adverse impact on the Province’s overall fiscal performance.
While the current outlook for Ontario’s revenues has declined by $918 million, risks that could have additional impacts on the revenue outlook for 2008–09 remain. In particular, ongoing developments in the world economy and financial markets could affect Ontario’s overall economic performance. As well, as in past years, the revenue outlook could change as past years’ tax return processing is finalized over the coming months. Corporations Tax revenues are subject to the greatest uncertainty, as these historically fluctuate considerably and information arriving late in the fiscal year can result in substantial changes to the outlook.
Risks to the expense outlook are especially evident in the health, education and social services sectors, which account for over two-thirds of total Provincial expense, and include assumptions about expected utilization, enrolment rates and caseloads, many of which are demand-driven and impacted by changes in Ontario’s economic performance. For example, a one per cent increase in both Ontario Works and Ontario Disability Support Program caseloads would cost the Province an additional $46 million a year.
Compensation costs and wage settlements, together with the investment performance of pension plans, are also key cost elements and could have a substantial impact on the finances of both broader public-sector (BPS) partners and the Province. With major contracts covering over 50 per cent of unionized workers in the BPS and approximately 85 per cent of employees in the Ontario Public Service (OPS) up for negotiation in 2008–09, the government will expect its bargaining agent partners in this new fiscal environment to achieve affordable agreements.
As the factors and assumptions comprising the revenue and expense forecasts interact and shift, fiscal and economic updates at various times of the fiscal cycle may include adjustments to the revenue and expense forecasts to reflect these changes. For example, a change of one per cent to total revenue or total expense in 2008–09 represents close to a $1.0 billion change in the Province’s overall fiscal outlook. While this change may be small relative to the government’s $96 billion budget, it can cause significant swings in the Province’s surplus/deficit.
8 2008 Ontario Economic Outlook and Fiscal Review
As part of its ongoing plan to prudently manage the Province’s finances in the face of risks arising from global economic uncertainty, the government continues to pursue strategies to contain spending while doing everything it can to protect investments in key public services. This expenditure management includes delaying the implementation of and slowing down some new initiatives, undertaking a number of discretionary restraint initiatives that will realize savings, and requiring ministries to focus on the highest-priority programs and services through the results-based planning process. The 2008–09 fiscal plan also continues to maintain a cautious and prudent approach to fiscal planning, including a reserve and contingency funds.
Given global economic uncertainty, the government’s immediate priority is to provide a fiscal update for 2008–09. The government continues to monitor Ontario’s economic and fiscal situation closely, and will provide details about Ontario’s medium-term fiscal plan and outlook in the 2009 Budget.
Detailed information on revenue and expense risks and sensitivities, including compensation costs, can be found in Chapter II of the 2008 Ontario Budget, Sections D and E respectively.
Annex I: Fiscal Outlook 9

10 2008 Ontario Economic Outlook and Fiscal Review

SECTION B | EXPENDITURE MANAGEMENT
The government has demonstrated its commitment to the prudent management of the Province’s finances. To improve delivery of public services while managing growth in spending, the government has achieved efficiencies across the Ontario Public Service (OPS). Reportable savings of $806 million were identified over the 2004–05 to 2007–08 period, exceeding the target of $750 million. Savings were made possible through streamlined purchasing processes; reduced administrative costs; reduced energy and accommodation costs; improved use of information technology; and better harmonization and coordination of government operations.
The Province’s commitment to finding efficiencies has reduced the overall cost of government administration from 15 per cent in 2003–04 to 12 per cent in 2007–08. In addition, Ontario’s spending on general government services was $124 per person in 2007–08 — the second-lowest rate among all provincial governments.
The government continues to pursue strategies to contain spending while doing everything it can to protect key public services that people depend on.
The government is taking action to manage its expenses in light of lower revenues and to provide fiscal flexibility. It is:
1. Delaying the implementation of and slowing down some new initiatives. Further information is available in materials released in conjunction with the 2008 Ontario Economic Outlook and Fiscal Review.
2. Undertaking a number of discretionary restraint initiatives that will realize savings, including restrictions on government travel, consulting services, information technology and accommodation spending.
3. Requiring ministries through the 2009–10 results-based planning process to focus on the highest-priority programs and services while ensuring lower-priority programs are reviewed and assessed to look for improvements.
The Minister of Finance will continue to consult with Ontarians and other key groups and individuals to discuss how the Province can continue to manage expenses and do everything it can to protect key public services.
As Ontario faces these global economic conditions, the government is asking its Broader Public Sector (BPS) partners to help it in meeting these challenges. Broader Public Sector employers, as well as the OPS, face a heavy bargaining calendar in 2008–09. Major contracts, covering over 50 per cent of unionized workers in the BPS and approximately 85 per cent of employees in the OPS, are up for negotiations sometime during 2008–09. The government will expect its bargaining agent partners in this new fiscal environment to achieve affordable agreements.
Annex I: Fiscal Outlook 11

While the Ontario Government continues to manage its expenses, $76.6 billion (80 per cent) of total government spending in 2008–09 will be provided to transfer payment recipients. Funding will not be increasing in fiscal 2009–10 according to what was projected in the 2008 Budget last March. The government is confident that its transfer partners will work together with the Province to rise to the challenge of the current fiscal situation.
The Province continues to encourage its BPS partners to look for opportunities to modernize. For example, the OntarioBuys program has been innovative in extending supply-chain leading practices to hospitals, school boards, colleges and universities to realize efficiencies. In Toronto, a one-time government investment of $2.6 million at four major Toronto hospitals is leading to $21.1 million in savings over 10 years. A similar one-time government investment of $2 million in London-area hospitals has achieved annual savings of $1.9 million — a payback period of about one year. These are but two examples of the work being accomplished through the OntarioBuys program to ensure that Ontario tax dollars are used efficiently, and that health services continue to improve to meet Ontarians’ needs. Once OntarioBuys is fully implemented across the hospital and education sectors, savings of up to $100 million are expected, which can be reinvested back into front-line services.
Ontario will also work with government agencies to look for efficiencies in their operations.
12 2008 Ontario Economic Outlook and Fiscal Review
SECTION C | DETAILS OF ONTARIO’S FINANCES
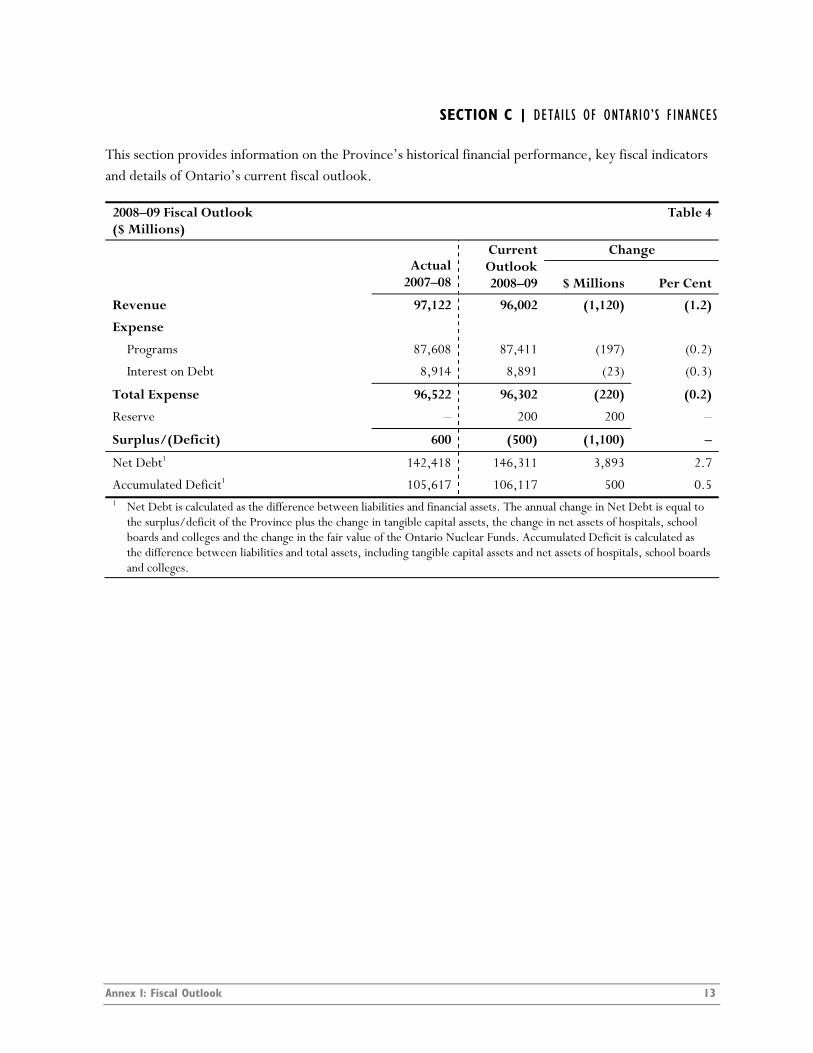
This section provides information on the Province’s historical financial performance, key fiscal indicators and details of Ontario’s current fiscal outlook.
2008–09 Fiscal Outlook Table 4 ($ Millions)
Change Actual
2007–08
Current Outlook 2008–09 $ Millions Per Cent
Revenue 97,122 96,002 (1,120) (1.2)
Expense
Programs 87,608 87,411 (197) (0.2)
Interest on Debt 8,914 8,891 (23) (0.3)
Total Expense 96,522 96,302 (220) (0.2)
Reserve – 200 200 –
Surplus/(Deficit) 600 (500) (1,100) –
Net Debt1 142,418 146,311 3,893 2.7
Accumulated Deficit1 105,617 106,117 500 0.5 1 Net Debt is calculated as the difference between liabilities and financial assets. The annual change in Net Debt is equal to
the surplus/deficit of the Province plus the change in tangible capital assets, the change in net assets of hospitals, school boards and colleges and the change in the fair value of the Ontario Nuclear Funds. Accumulated Deficit is calculated as the difference between liabilities and total assets, including tangible capital assets and net assets of hospitals, school boards and colleges.
Annex I: Fiscal Outlook 13

Revenue Table 5 ($ Millions)
2004–05 2005–06 2006–07 Actual
2007–08
Current Outlook 2008–09
Taxation Revenue Personal Income Tax 19,320 21,041 23,655 24,538 25,171 Retail Sales Tax 14,855 15,554 16,228 16,976 17,206 Corporations Tax 9,883 9,984 10,845 12,990 11,459 Employer Health Tax 3,886 4,197 4,371 4,605 4,821 Ontario Health Premium 1,737 2,350 2,589 2,713 2,809 Gasoline Tax 2,277 2,281 2,310 2,360 2,315 Land Transfer Tax 1,043 1,159 1,197 1,363 1,163 Tobacco Tax 1,453 1,379 1,236 1,127 1,092 Fuel Tax 727 729 723 733 742 Electricity Payments-In-Lieu of Taxes 511 951 757 546 600 Other Taxes 283 292 399 481 472 55,975 59,917 64,310 68,432 67,850 Government of Canada Canada Health Transfer (CHT) 5,640 7,148 7,702 8,487 8,826 Canada Social Transfer (CST) 2,912 3,324 3,478 3,778 4,089 CHST Supplements 775 584 – – – Social Housing 522 520 532 525 514 Wait Times Reduction Fund 242 243 467 468 235 Infrastructure Programs 209 285 191 207 259 Medical Equipment Funds 387 194 – – – Other Government of Canada 1,195 953 1,666 3,132 2,741 11,882 13,251 14,036 16,597 16,664 Income from Investment
in Government Business Enterprises Ontario Lottery and Gaming Corporation 1,992 2,027 1,945 1,857 1,772 Liquor Control Board of Ontario 1,147 1,197 1,307 1,374 1,420 Ontario Power Generation Inc. and Hydro One Inc. 444 1,107 947 1,214 930 Other Government Enterprises (5) (23) (3) (8) – 3,578 4,308 4,196 4,437 4,122 Other Non-Tax Revenue Reimbursements1 1,241 1,295 1,415 1,464 1,382 Vehicle and Driver Registration Fees 976 763 970 1,051 1,044 Electricity Debt Retirement Charge 997 1,021 991 982 1,004 Power Sales 610 779 863 929 856 Sales and Rentals 352 465 1,108 553 701 Other Fees and Licences1 506 550 624 668 672 Liquor Licence Revenue 489 516 467 475 454 Net Reduction of Power Purchase Contract Liability 236 396 412 398 373 Royalties1 278 191 215 193 215 Miscellaneous Other Non-Tax Revenue 721 773 790 943 665 6,406 6,749 7,855 7,656 7,366 Total Revenue 77,841 84,225 90,397 97,122 96,002 1 The change from 2008 Budget Plan reflects reclassification to be consistent with treatment in the 2007–2008 Public
Accounts of Ontario.
14 2008 Ontario Economic Outlook and Fiscal Review

Total Expense Table 6 ($ Millions)
Ministry Expense 2004–05 2005–061 2006–07 Actual
2007–08
Current Outlook 2008–09
Aboriginal Affairs2 21 50 25 33 55.6 Agriculture, Food and Rural Affairs2 795 861 796 731 945.6 Attorney General3 1,195 1,277 1,338 1,643 1,592.2 Board of Internal Economy 145 150 163 257 196.3 Children and Youth Services 2,793 3,271 3,264 3,721 4,086.1 Citizenship and Immigration3 62 89 112 90 88.1 Community and Social Services 6,360 6,717 7,181 7,547 7,726.5 Community Safety and Correctional Services 1,732 1,749 1,876 2,003 2,140.7 Culture2 346 478 414 350 379.8 Economic Development and Trade2,4 66 176 199 297 445.2 Education2 365 440 423 446 472.3 School Boards’ Net Expense 10,274 10,886 11,290 11,830 12,857.2 Energy and Infrastructure2,4 246 325 525 401 282.7 Environment 305 274 314 349 398.0 Executive Offices 34 31 37 36 36.3 Finance2 534 578 564 455 557.4 Francophone Affairs, Office of 3 4 4 5 5.3 Government Services2,4 1,077 742 974 944 1,105.9 Health and Long-Term Care 17,512 17,799 19,121 20,375 21,712.4 Hospitals’ Net Expense 13,877 14,816 16,145 17,381 18,436.3 Health Promotion 236 290 391 364 389.7 Labour 129 141 146 170 170.0 Municipal Affairs and Housing2 770 926 843 744 799.5 Natural Resources3 557 626 731 794 780.2 Northern Development and Mines 320 337 318 346 357.5 Research and Innovation2 236 332 316 301 382.8 Revenue 523 442 563 554 610.6 Small Business and Consumer Services3,4 20 26 25 31 29.8 Tourism3 167 210 204 234 177.4 Training, Colleges and Universities2 3,297 3,509 4,115 4,384 4,825.3 Colleges’ Net Expense 1,289 1,185 1,273 1,403 1,415.6 Transportation2 1,744 1,802 1,794 1,899 1,960.9 Interest on Debt 9,368 9,019 8,831 8,914 8,891.0 Other Expense2 2,998 4,369 3,813 7,490 3,091.7 Year-End Savings5 – – – – (1,100.0) Total Expense 79,396 83,927 88,128 96,522 96,301.9 1 Starting in 2005–06, the Province’s financial reporting was expanded to include hospitals, school boards and colleges using
one-line consolidation. Prior to 2005–06, historical figures reflect grants to these entities for comparison purposes. 2 Details on Other Ministry Expense can be found in Table 7, Other Expense. 3 Decline from 2007–08 to 2008–09 due to one-time initiatives in 2007–08. 4 Pending finalization of new ministry structure. Future updates will reflect adjusted ministry expense, including the newly
formed Ministry of International Trade and Investment. 5 As in past years, the Year-End Savings provision reflects anticipated underspending that has historically arisen at year-end
due to factors such as program efficiencies, and changes in project start-ups and implementation plans. Note: Numbers may not add due to rounding.
Annex I: Fiscal Outlook 15

Other Expense Table 7 ($ Millions)
Ministry Expense 2004–05 2005–06 2006–07 Actual
2007–08
Current Outlook 2008–09
Aboriginal Affairs One-Time Expense for the First Nations Gaming
Agreement – – – 201 –
Agriculture, Food and Rural Affairs One-Time Extraordinary Assistance 458 125 259 274 – Time Limited Assistance 143 157 19 76 166.5 Culture One-Time Investments – – – 57 – Economic Development and Trade1 One-Time Investments – – – 152 – Education Teachers’ Pension Plan2 240 295 345 342 54.0 Energy and Infrastructure Capital Contingency Fund – – – – 171.9 One-Time Investments in Municipal Infrastructure – – 140 450 – Finance Community Reinvestment Fund One-Time
Transition Funding 233 – – – –
Investing in Ontario – – – 1,149 – Ontario Municipal Partnership Fund3 626 714 758 907 934.8 Operating Contingency Fund – – – – 193.4 Power Purchases 840 803 863 929 856.0 Government Services Pension and Other Employee Future Benefits 458 729 557 531 715.0 Municipal Affairs and Housing One-Time Investment in Municipal Social
Housing Stock – – – 100 –
Research and Innovation One-Time Investments – – – 87 – Training, Colleges and Universities One-Time Investments – – – 699 – Transportation One-Time Transit and Infrastructure Investments – 1,546 872 1,536 – Total Other Expense 2,998 4,369 3,813 7,490 3,091.7 1 Pending finalization of new ministry structure. Future updates will reflect adjusted ministry expense. 2 Numbers reflect accrued pension expense, not Ontario’s contributions. Ontario’s matching contributions to the plan grow
from $708 million in 2004–05 to $808 million in 2007–08 and $1,061 million in 2008–09. 3 The 2004–05 figure includes transfers under predecessor Community Reinvestment Fund. Note: Numbers may not add due to rounding.
16 2008 Ontario Economic Outlook and Fiscal Review

2008–09 Infrastructure Expenditures Table 8 ($ Millions)
2008–09 Current Outlook
Sector
Total Infrastructure Expenditures
2007–08 Actual Investment in Capital Assets
Transfers and Other
Expenditures in Infrastructure1
Total Infrastructure Expenditures
Transportation
Transit 1,857.6 901.0 349.9 1,250.9
Highway Construction 1,452.2 1,484.3 – 1,484.3
Other Transportation2 710.3 520.5 70.7 591.3
Health
Hospitals 638.0 1,045.7 2.5 1,048.2
Other Health 285.9 60.8 187.4 248.1
Education
School Boards 950.4 – 1,018.6 1,018.6
Colleges 183.3 202.0 – 202.0
Universities 677.6 – 54.8 54.8
Water/Environment 387.7 16.3 286.9 303.2
Municipal and Local Infrastructure3 1,794.8 33.1 274.9 308.0
Justice 215.2 426.2 49.7 475.9
Other 717.1 244.9 294.1 539.0
Total4 9,870.1 4,934.7 2,589.5 7,524.2 1 Mainly consists of transfers for capital purposes to municipalities and universities, expenditures for servicing capital-related
debt of schools, and expenditures for the repair and rehabilitation of schools. These expenditures are included in the Province’s total expense in Tables 6 and 7.
2 Other Transportation includes planning activities, property acquisition, and other infrastructure programs (e.g., Municipal/Local Roads/Remote Airports).
3 Municipal and local water and wastewater infrastructure investments are included in the Water/Environment sector. 2007–08 actual expenditures include $1,149 million under the Investing in Ontario Act, 2008.
4 Total expenditures in 2008–09 include $48 million in flow-throughs in Investment in Capital Assets (for provincial highways) and $225 million in flow-throughs in Transfers and Other Expenditures in Infrastructure ($15 million in Transportation, $15 million in Health, $67 million in Water/Environment, $128 million in Municipal and Local Infrastructure).
Note: Numbers may not add due to rounding.
Annex I: Fiscal Outlook 17

Ten-Year Review of Selected Financial and Economic Statistics ($ Millions)
1999–00
2000–01
2001–02 Financial Transactions
Revenue 65,042 66,294 66,534
Expense
Programs 53,347 53,519 55,822
Interest on Debt 11,027 10,873 10,337
Total Expense 64,374 64,392 66,159
Reserve – – –
Surplus/(Deficit) 668 1,902 375
Net Debt3, 4 134,398 132,496 132,121
Accumulated Deficit5 134,398 132,496 132,121
Gross Domestic Product (GDP) at Market Prices 409,020 440,759 453,701
Personal Income 321,702 347,653 361,187
Population — July (000s) 11,505 11,683 11,897
Net Debt per Capita (dollars) 11,682 11,341 11,106
Personal Income per Capita (dollars) 27,963 29,756 30,360
Total Expense as a per cent of GDP 15.7 14.6 14.6
Interest on Debt as a per cent of Revenue 17.0 16.4 15.5
Net Debt as a per cent of GDP 32.9 30.1 29.1
Accumulated Deficit as a per cent of GDP 32.9 30.1 29.1 1 Starting in 2002–03, major tangible capital assets owned by Provincial ministries (land, buildings and transportation infrastructure)
are accounted for on a full accrual accounting basis. Other tangible capital assets owned by Provincial ministries are accounted for as expense in the year of acquisition or construction. All capital assets owned by consolidated organizations are accounted for on a full accrual basis.
2 Starting in 2005–06, the Province’s financial reporting was expanded to include hospitals, school boards and colleges using one-line consolidation. Total expense prior to 2005–06 has not been restated to reflect expanded reporting.
3 Net Debt is calculated as the difference between liabilities and financial assets. The annual change in Net Debt is equal to the surplus/deficit of the Province plus the change in tangible capital assets, the change in net assets of hospitals, school boards and colleges and, effective April 1, 2007, the change in the fair value of the Ontario Nuclear Funds.
4 Net Debt is restated in 2003–04, 2004–05 and 2005–06 to reflect the value of hydro corridor lands transferred to the Province from Hydro One Inc.
5 Accumulated Deficit is calculated as the difference between liabilities and total assets, including tangible capital assets and net assets of hospitals, school boards and colleges. The annual change in the Accumulated Deficit is equal to the surplus/deficit plus, effective April 1, 2007, the change in the fair value of the Ontario Nuclear Funds. For fiscal 2005–06, the change in the Accumulated Deficit includes the opening combined net assets of hospitals, school boards and colleges that were recognized upon consolidation of these Broader Public Sector entities. For fiscal 2006–07, the change in the Accumulated Deficit includes an adjustment to the unfunded liability of the Ontario Electricity Financial Corporation made at the beginning of the year. For fiscal 2007–08, a $1.2 billion decrease in the Accumulated Deficit is made up of $0.6 billion in the Province’s operating surplus, with the remainder resulting from a change in accounting policy. Under this change, Ontario Nuclear Funds Agreement (ONFA) funds are reported at fair value on Ontario Power Generation Inc. (OPG) books and, upon consolidation, on the Province’s consolidated financial statements.
Sources: Ontario Ministry of Finance and Statistics Canada.
18 2008 Ontario Economic Outlook and Fiscal Review

Table 9
2002–031
2003–04
2004–05
2005–062
2006–07
Actual 2007–08
Current Outlook 2008–09
68,891 68,400 77,841 84,225 90,397 97,122 96,002
59,080 64,279 70,028 74,908 79,297 87,608 87,411
9,694 9,604 9,368 9,019 8,831 8,914 8,891
68,774 73,883 79,396 83,927 88,128 96,522 96,302
– – – – – – 200
117 (5,483) (1,555) 298 2,269 600 (500)
132,647 138,816 140,921 141,928 141,100 142,418 146,311
118,705 124,188 125,743 109,155 106,776 105,617 106,117
477,763 493,081 517,068 536,431 559,840 584,053 596,245
369,420 381,127 401,066 419,253 441,371 463,520 483,104
12,091 12,242 12,391 12,528 12,665 12,794 12,929
10,971 11,339 11,373 11,328 11,141 11,132 11,317
30,553 31,132 32,369 33,464 34,849 36,231 37,366
14.4 15.0 15.4 15.6 15.7 16.5 16.2
14.1 14.0 12.0 10.7 9.8 9.2 9.3
27.8 28.2 27.3 26.5 25.2 24.4 24.5
24.8 25.2 24.3 20.3 19.1 18.1 17.8
Annex I: Fiscal Outlook 19
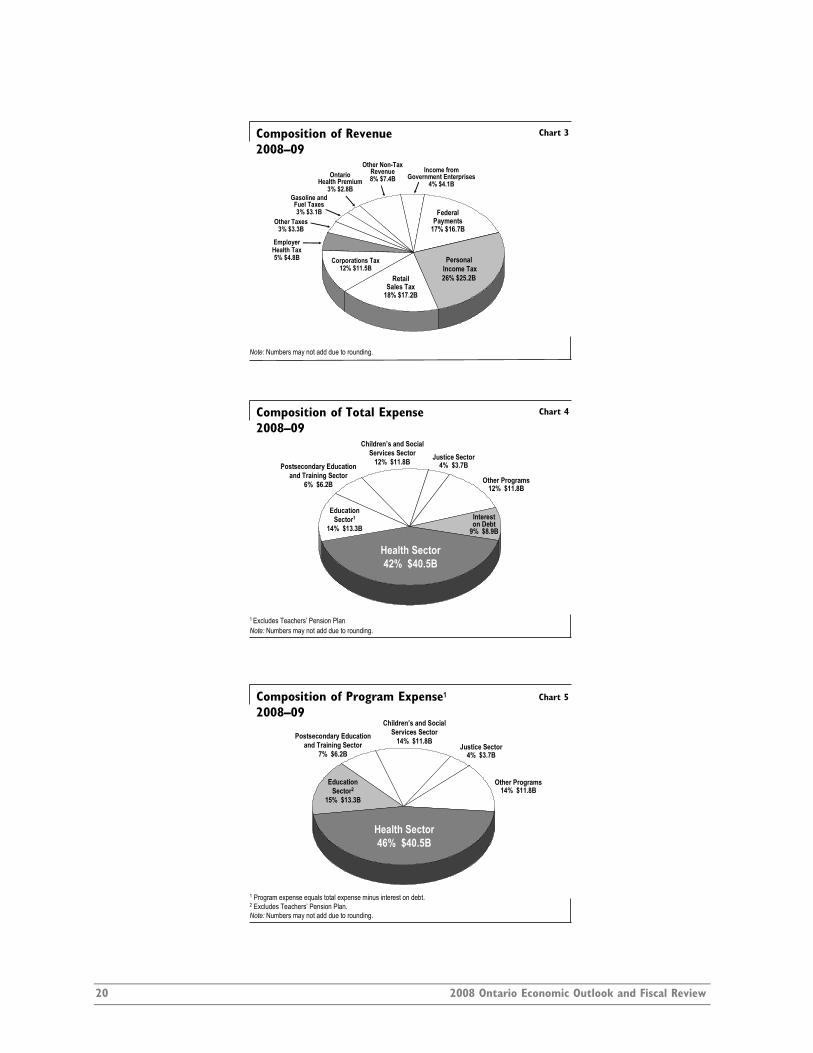
RetailSales Tax
18% $17.2B
PersonalIncome Tax26% $25.2B
Employer Health Tax5% $4.8B Corporations Tax
12% $11.5B
Gasoline and Fuel Taxes3% $3.1B
Other Taxes3% $3.3B
Other Non-Tax Revenue8% $7.4B
Income fromGovernment Enterprises
4% $4.1B
Note: Numbers may not add due to rounding.
OntarioHealth Premium
3% $2.8B
Federal Payments
17% $16.7B
Composition of Revenue 2008–09
Chart 3
Postsecondary Educationand Training Sector
6% $6.2B
Intereston Debt
9% $8.9B
Justice Sector4% $3.7B
Children’s and Social Services Sector
12% $11.8B
Health Sector42% $40.5B
Other Programs12% $11.8B
1 Excludes Teachers’ Pension PlanNote: Numbers may not add due to rounding.
Education Sector1
14% $13.3B
Composition of Total Expense 2008–09
Chart 4
Postsecondary Educationand Training Sector
7% $6.2BJustice Sector
4% $3.7B
Children’s and Social Services Sector
14% $11.8B
Health Sector46% $40.5B
Other Programs14% $11.8B
1 Program expense equals total expense minus interest on debt.2 Excludes Teachers’ Pension Plan.Note: Numbers may not add due to rounding.
Education Sector2
15% $13.3B
Composition of Program Expense1
2008–09Chart 5
20 2008 Ontario Economic Outlook and Fiscal Review
ANNEX II Economic Outlook
Annex II: Economic Outlook 21

22 2008 Ontario Economic Outlook and Fiscal Review

OVERVIEW
The province’s economic growth is expected to be soft in the near term due to heightened global economic uncertainty. The Ministry of Finance is projecting Ontario real gross domestic product (GDP) growth of 0.1 per cent for 2008. The average private-sector forecast for Ontario real GDP growth, as of October 16, 2008, is 0.7 per cent in 2009.
Ontario Economic Outlook Table 1 (Per Cent)
2003 2004 2005 2006 2007 2008e 2009p
Real GDP Growth 1.4 2.5 2.7 2.5 2.2 0.1 0.7
Employment Growth 3.0 1.7 1.3 1.5 1.6 1.5 0.4
CPI Inflation 2.7 1.9 2.2 1.8 1.8 2.3 2.0
e = estimate; p = private-sector average (October 16, 2008). Sources: Statistics Canada, Ontario Ministry of Finance and Ontario Ministry of Finance Survey of Forecasts.
This is a time of unusually heightened global economic uncertainty that is having an impact on many jurisdictions including Ontario. Private-sector forecasts for economic growth were changing rapidly during the writing of this document, reflecting the current environment. The Ministry of Finance will update its economic growth projections for planning purposes in the 2009 Budget.
FINANCIAL MARKET TURMOIL
Recent global financial market and economic turmoil poses a significant threat to economic growth. Virtually every economy has faced a decline in consumer and business confidence over the past year. There have been significant liquidity challenges in the investment and banking sectors. Equity markets worldwide have experienced sharp price declines. Central banks have acted to prevent credit markets from seizing up by injecting liquidity and lowering their policy interest rates. The fall in interest rates for central government debt, however, has not been fully matched by declines in interest rates for businesses, consumers and other levels of government. As well, financial market uncertainty has reduced credit availability and is dampening business and household spending, which is having an adverse impact on Ontario.
Annex II: Economic Outlook 23

SOURCES OF CREDIT MARKET TURMOIL AND RISKS TO GROWTH The global financial crisis began with a sharp rise in defaults in the subprime mortgage market in the United States. Many of these high-risk mortgages had been packaged as securities and sold to investors around the world. Rising default rates caused the value of these securities to plunge. Uncertainty regarding risk led to reduced lending and higher interest rates for businesses and consumers. Numerous well-known institutions have failed, been acquired by their governments or bought by stronger competitors at marked-down values.
The Canadian banking and financial systems are in much better shape than their counterparts south of the border. The subprime mortgage market in Canada is estimated to account for less than five per cent of the mortgages outstanding, compared to 22 per cent in the United States. Canadian banks, therefore, have faced much lower loan losses. Risk aversion in U.S. financial markets has spread to Canada, but to a lesser extent. The commercial paper market has frozen up, making it very difficult for businesses to raise money through the traditional capital-market channel. Canadian Treasury-bill yields have fallen as investors look for safer assets. Inter-bank lending rates have increased sharply in Canada, making it more costly and difficult for banks to do business.
The most serious risk going forward is the relationship between the financial system and the economy. Tighter liquidity conditions lead to restrictions in business and consumer lending, which contributes to weaker economic growth that in turn leads to further weakening in financial markets. Recently, central banks and governments worldwide have injected substantial additional liquidity and provided other important measures to safeguard the financial system.
ONGOING EXTERNAL ECONOMIC CHALLENGES
Ontario has been facing an increasingly challenging external economic environment. Until recently, oil prices have been increasing and the Canadian dollar has been strengthening. More recently, weakening U.S. demand and heightened global financial market turmoil have created additional challenges.
Key External Variables Table 2 2002 2003 2004 2005 2006 2007 2008y
Crude Oil ($ US per Barrel) 26.1 31.1 41.4 56.5 66.1 72.3 113.3
Canadian Dollar (Cents US) 63.7 71.4 76.8 82.5 88.2 93.1 98.2
U.S. Real GDP Growth (Per Cent) 1.6 2.5 3.6 2.9 2.8 2.0 2.3
Three-Month Treasury Bill Rate 2.6 2.9 2.2 2.7 4.0 4.2 2.6
10-Year Government Bond Rate 5.3 4.8 4.6 4.1 4.2 4.3 3.7
y = year-to-date average (October 16, 2008). Sources: Bank of Canada, New York Mercantile Exchange and U.S. Bureau of Economic Analysis.
The price of oil has soared from a low of $18 US per barrel in January 2002 to a record high of more than $147 US per barrel in mid-July 2008. Oil prices have averaged $113 US per barrel so far this year, up $87 US per barrel over the past six years — the largest increase on record. Higher oil prices are a challenge for Ontario because they increase costs for businesses, consumers and governments. In 2007, Ontario residents and industry spent an estimated $30 billion on crude oil and oil products, natural gas and coal, equivalent to about five per cent of the province’s GDP.
24 2008 Ontario Economic Outlook and Fiscal Review

The Canadian dollar increased from a low of 61.8 cents US in January 2002 to a peak of 110.3 cents US in November 2007, marking the largest five-year increase on record. So far this year, the Canadian dollar has averaged 98.2 cents US. The stronger Canadian dollar is a challenge as it makes Ontario’s exports more expensive and imports cheaper. As a result, Ontario businesses find it more difficult to compete with foreign producers, both in the Canadian market and abroad. On the other hand, the stronger Canadian dollar benefits Ontario consumers and businesses by lowering the cost of imported goods and materials, including productivity-enhancing machinery and equipment.
U.S. demand for Ontario-produced goods and services has been declining due to the stronger Canadian dollar, weakening U.S. economic growth and increasing competition from newly industrializing economies. The value of Ontario’s merchandise exports over the last five years to the United States, its largest trading partner, has fallen by 12.2 per cent.
While newly industrializing economies are a competitive challenge for Ontario businesses, they also present new opportunities. Ontario’s international merchandise exports to countries other than the United States have more than doubled over the past five years.
Ontario’s International Merchandise Exports Are Diversifying
93.383.5
16.56.7
0
20
40
60
80
100
United States Rest of World
2002 2007
Share of Ontario Exports
Source: Statistics Canada.
Chart 1
(Per Cent)
As a result, Ontario’s export base has significantly diversified. For instance, over the last five years, the value of merchandise exports to Russia has increased by 377 per cent; exports to India by 258 per cent; and exports to China by 95 per cent. Ontario has also increased its exports to other G7 countries. Over the last five years, exports to the United Kingdom have risen by 280 per cent; exports to Germany by 36 per cent; exports to Japan by 30 per cent; and exports to Italy by 77 per cent.
ONTARIO’S ECONOMIC PROGRESS OVER THE PAST FIVE YEARS
Ontario’s economic advantages include its proximity to large markets, a well-educated population, a highly skilled workforce, diversified industrial structure, competitive business costs, modern infrastructure and strong support for innovation. The Ontario Government’s five-point economic plan, outlined in the Foreword, continues to enhance the foundation for long-term growth.
There has been continued economic growth in Ontario over the past five years, despite an increasingly challenging global environment:
• Ontario real GDP growth averaged 2.3 per cent over the 2003 to 2007 period.
Annex II: Economic Outlook 25
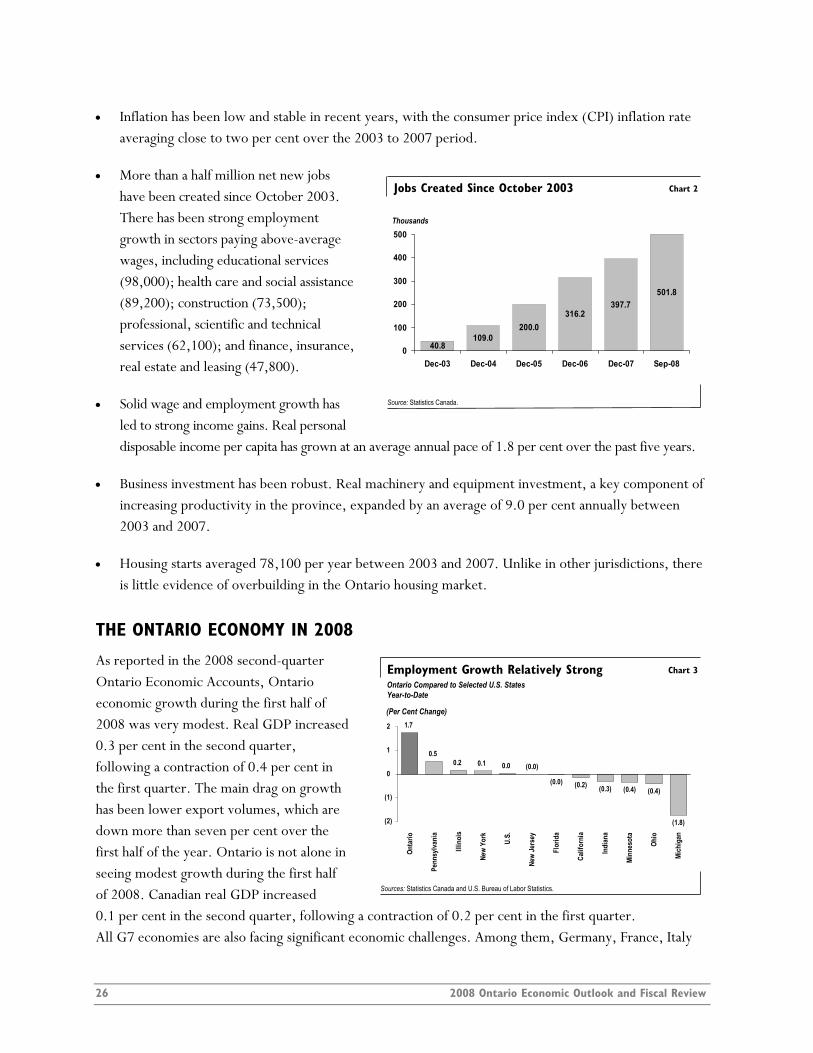
• Inflation has been low and stable in recent years, with the consumer price index (CPI) inflation rate averaging close to two per cent over the 2003 to 2007 period.
• More than a half million net new jobs have been created since October 2003. There has been strong employment growth in sectors paying above-average wages, including educational services (98,000); health care and social assistance (89,200); construction (73,500); professional, scientific and technical services (62,100); and finance, insurance, real estate and leasing (47,800).
• Solid wage and employment growth has led to strong income gains. Real personal disposable income per capita has grown at an average annual pace of 1.8 per cent over the past five years.
Jobs Created Since October 2003
40.8
200.0316.2
397.7501.8
109.00
100
200
300
400
500
Dec-03 Dec-04 Dec-05 Dec-06 Dec-07 Sep-08
Thousands
Source: Statistics Canada.
Chart 2
• Business investment has been robust. Real machinery and equipment investment, a key component of increasing productivity in the province, expanded by an average of 9.0 per cent annually between 2003 and 2007.
• Housing starts averaged 78,100 per year between 2003 and 2007. Unlike in other jurisdictions, there is little evidence of overbuilding in the Ontario housing market.
THE ONTARIO ECONOMY IN 2008
As reported in the 2008 second-quarter Ontario Economic Accounts, Ontario economic growth during the first half of 2008 was very modest. Real GDP increased 0.3 per cent in the second quarter, following a contraction of 0.4 per cent in the first quarter. The main drag on growth has been lower export volumes, which are down more than seven per cent over the first half of the year. Ontario is not alone in seeing modest growth during the first half of 2008. Canadian real GDP increased 0.1 per cent in the second quarter, fAll G7 economies are also facing significant economic challenges. Among them, Germany, France, Italy
Ontario Compared to Selected U.S. States Year-to-Date
1.7
0.50.2 0.1 0.0 (0.0)
(0.0) (0.2) (0.3) (0.4) (0.4)
(1.8)(2)
(1)
0
1
2
Onta
rio
Penn
sylva
nia
Illin
ois
New
York
U.S.
New
Jers
ey
Flor
ida
Calif
orni
a
Indi
ana
Minn
esot
a
Ohio
Mich
igan
Sources: Statistics Canada and U.S. Bureau of Labor Statistics.
Employment Growth Relatively Strong Chart 3
(Per Cent Change)
ollowing a contraction of 0.2 per cent in the first quarter.
26 2008 Ontario Economic Outlook and Fiscal Review

and Japan have seen at least one quarterly decline in output so far. Despite avoiding a quarterly decline,there has been weakness in U.S. and U.K. employment, housing construction and financial markets.
Ontario has created 104,100 jobs so far this year. About 83 per cent of these have been in the private r
d
The side of the Ontario economy based on domestic demand has remained strong in 2008. Household of
in .
Corporate profits are down 2.8 per cent over the first half of this year, reflecting the negative impact s
Ontario’s CPI inflation rate has averaged 2.2 per cent so far this year, up from 1.8 per cent in 2007. ion
d
Ontario’s trade balance has deteriorated significantly in 2008, largely because of a decline in automotive
HEIGHTENED GLOBAL ECONOMIC UNCERTAINTY
external factors such as oil prices,
ok
sector. Although Ontario has lost 16,200 manufacturing jobs, there have been strong job gains in otheindustries paying above-average wages including construction (37,500); health care and social assistance (26,800); and professional, scientific and technical services (19,400). This increase in employment has leto solid income gains. Labour income grew by 4.2 per cent over the first half of the year, supported by job gains and higher wages.
spending continues to be firm, with real consumer spending up by a robust 4.6 per cent in the first half the year. Residential construction spending has increased by 0.9 per cent in real terms. So far in 2008, housing starts averaged 77,600 units (on an annualized basis), up from 69,100 units for the same period2007. While housing starts have increased, home resales have weakened from a record-setting year in 2007
of record oil prices and the higher dollar. So far this year, Ontario real non-residential construction hagrown by 2.1 per cent, and real machinery and equipment spending has risen 1.2 per cent.
This was largely due to elevated gasoline prices and an increase in food inflation. Ontario’s core inflatrate, which excludes food and energy, has averaged 1.1 per cent on a year-over-year basis and has remainebelow 2.0 per cent for 11 straight months. The dramatic decline in oil prices since mid-July 2008 will exert downward pressure on CPI inflation over the near term. Over the first seven months of 2008, annual wage settlements have averaged 2.4 per cent.
exports to the United States. Imports have declined, but at a slower pace than exports, largely due to reduced demand for automotive production inputs.
The short-term Ontario economic outlook is heavily influenced bythe Canadian dollar exchange rate, interest rates, U.S. economic growth and global financial market turmoil. In the current economic environment there is an unusually wide range of views on the outlofor each of these key factors as shown in the following table. The recent dramatic movements in asset prices, foreign exchange and commodity markets mean that relatively little confidence can be attachedeven to these wide private-sector forecast ranges in 2009.
Annex II: Economic Outlook 27
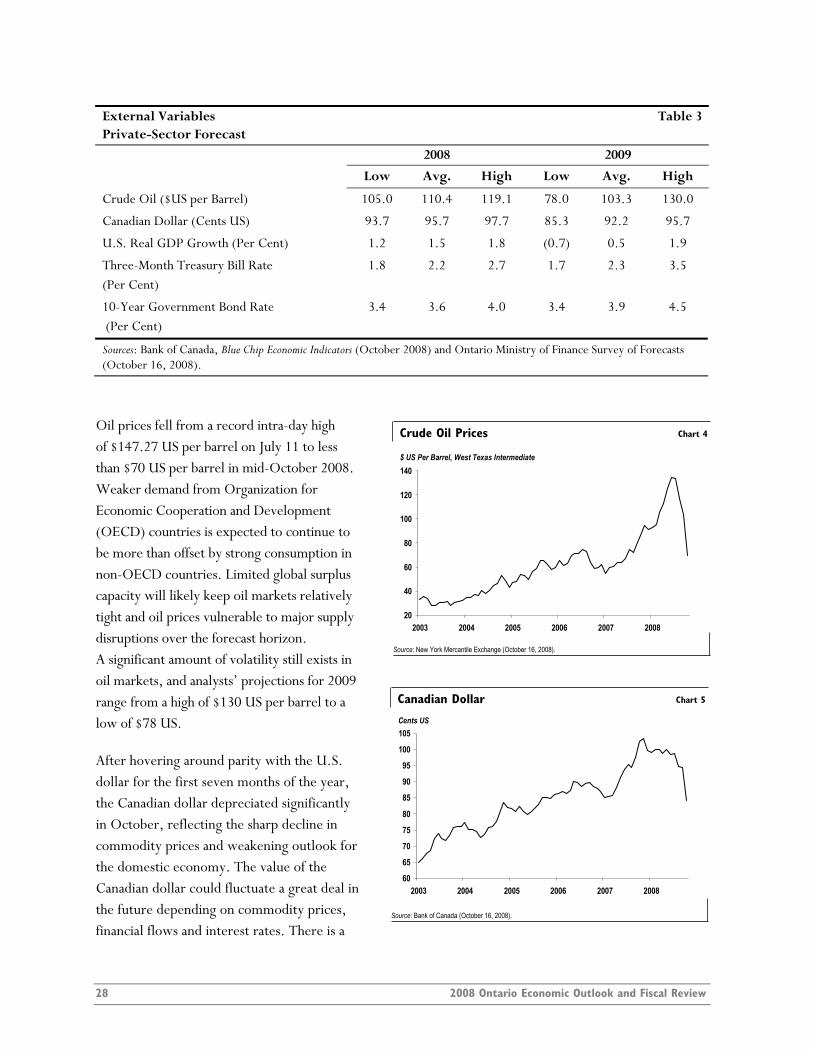
External Variables Table 3 Private-Sector Forecast 2008 2009
Low Avg. High Low Avg. High
Crude Oil ($US per Barrel) 105.0 110.4 119.1 78.0 103.3 130.0
Canadian Dollar (Cents US) 93.7 95.7 97.7 85.3 92.2 95.7
U.S. Real GDP Growth (Per Cent) 1.2 1.5 1.8 (0.7) 0.5 1.9
Three-Month Treasury Bill Rate (Per Cent)
1.8 2.2 2.7 1.7 2.3 3.5
10-Year Government Bond Rate (Per Cent)
3.4 3.6 4.0 3.4 3.9 4.5
Sources: Bank of Canada, Blue Chip Economic Indicators (October 2008) and Ontario Ministry of Finance Survey of Forecasts (October 16, 2008).
20
40
60
80
100
120
140
2003 2004 2005 2006 2007 2008
$ US Per Barrel, West Texas Intermediate
Crude Oil Prices Chart 4
Source: New York Mercantile Exchange (October 16, 2008).
Oil prices fell from a record intra-day high of $147.27 US per barrel on July 11 to less than $70 US per barrel in mid-October 2008. Weaker demand from Organization for Economic Cooperation and Development (OECD) countries is expected to continue to be more than offset by strong consumption in non-OECD countries. Limited global surplus capacity will likely keep oil markets relatively tight and oil prices vulnerable to major supply disruptions over the forecast horizon. A significant amount of volatility still exists in oil markets, and analysts’ projections for 2009 range from a high of $130 US per barrel to a low of $78 US.
60
65
70
75
80
85
90
95
100
105
2003 2004 2005 2006 2007 2008
Cents US
Canadian Dollar Chart 5
Source: Bank of Canada (October 16, 2008).
After hovering around parity with the U.S. dollar for the first seven months of the year, the Canadian dollar depreciated significantly in October, reflecting the sharp decline in commodity prices and weakening outlook for the domestic economy. The value of the Canadian dollar could fluctuate a great deal in the future depending on commodity prices, financial flows and interest rates. There is a
28 2008 Ontario Economic Outlook and Fiscal Review

significant divergence of views on the outlook for the Canadian dollar, with forecasts ranging from a low of 85.3 cents US to a high of 95.7 cents US in 2009.
Although overall U.S. economic growth has continued at a moderate pace, there has been a significant reduction in U.S. demand for Ontario-produced goods and services. For example, spending on autos has been particularly hard hit, with auto sales expected to slow to 13.8 million units in 2008 — the lowest level since 1992. There are considerable risks stemming from the U.S. economy, which continues to face imbalances and significant issues in its financial markets.
Interest rates affect consumer and business costs as well as the projected government expense for interest on the Province’s debt. The Bank of Canada has cut its benchmark target for the overnight interest rate by 200 basis points since December 2007, including the 50 basis point cut on October 8, 2008, and has taken additional measures to support liquidity in financial markets. However, the turmoil in global financial markets has led to tighter credit conditions for businesses, and some are facing higher borrowing costs. How global financial markets evolve and how this impacts economic growth have important implications for interest rate projections.
The wide range of views on each of these key assumptions represents a significant risk to the forecast because a change in any of them can have a major impact on Ontario’s economic growth outlook. The following table shows the typical range for the first- and second-year impacts of these external factors on Ontario real GDP growth. These estimates are based on historical relationships and illustrate the upper and lower limits for the average response. They show the implications of sustained changes in key assumptions in isolation from changes to other external factors. The combination of changing circumstances can also have a substantial bearing on the actual outcome.
Impacts of Changes in Key Assumptions on Ontario Real GDP Growth1 Table 4 (Percentage Point Increase)
First Year Second Year
Canadian Dollar Depreciates by Five Cents US 0.1 to 0.8 0.5 to 1.2
World Crude Oil Prices Decrease by $10 US per Barrel 0.1 to 0.5 0.1 to 0.5
U.S. Real GDP Growth Increases by One Percentage Point 0.3 to 0.7 0.4 to 0.8
Canadian Interest Rates Decrease by One Percentage Point 0.1 to 0.5 0.2 to 0.6 1 Impacts based on changes being sustained. Source: Ontario Ministry of Finance.
PRIVATE-SECTOR ECONOMIC FORECASTS
The Ontario Economic Forecast Council was established as part of the Fiscal Transparency and Accountability Act, 2004 to provide advice on macroeconomic forecasts and assumptions. The council members are Peter Dungan from the University of Toronto, Glen Hodgson from the Conference Board of Canada, Dale Orr from Global Insight and Ernie Stokes from the Centre for Spatial Economics. The Minister of Finance met
Annex II: Economic Outlook 29

with council members and other private-sector forecasters in the process of preparing the 2008 Ontario
Economic Outlook and Fiscal Review and received their views on Ontario’s economic outlook and other economic policy advice.
Private-Sector Forecasts for Ontario Real GDP Growth Table 5 (Per Cent) 2008 2009
Conference Board of Canada (October) 0.3 1.5
Global Insight (October) 0.3 0.5
Centre for Spatial Economics (June) 0.4 1.9
University of Toronto (October) (0.4) 0.6
RBC Financial Group (October) 0.0 0.4
Scotiabank Group (October) (0.1) (0.9)
TD Bank Financial Group (October) 0.3 0.8
Desjardins Group (September) (0.1) 0.9
BMO Capital Markets (October) (0.1) 0.4
CIBC World Markets (October) 0.1 0.9
Private-Sector Survey Average 0.1 0.7
Source: Ontario Ministry of Finance Survey of Forecasts (October 16, 2008).
Private-sector forecasters are, on average, calling for modest Ontario real GDP growth of 0.9 per cent in 2009. This modest pace of growth is due to the view that the economic environment will remain challenging well into 2009. Views regarding the outlook for 2009 have changed rapidly, making it especially difficult for the government to determine appropriate planning projections.
COMPARISON TO THE 2008 ONTARIO BUDGET
o
e udget
. is d
Private-Sector Forecasts
0.1
0.71.2
2.3
0
1
2
3
4
2008 2009
March October
Real GDP Growth
Source: Ontario Ministry of Finance Survey of Forecasts (February 29, 2008 and October 16, 2008).
Chart 6
(Per Cent)
The Ministry of Finance is lowering its projection for 2008 real GDP growth t0.1 per cent from the 1.1 per cent released in the 2008 Budget last March. The averagprivate-sector forecast at the time of the bwas 1.2 per cent. This adjustment largely reflects continued financial market turmoil and a more negative outlook for U.S. demandWeaker Ontario real GDP growth in 2008largely reflected through weaker exports anprofits. Exports are currently expected to decline by 6.0 per cent rather than remaining
30 2008 Ontario Economic Outlook and Fiscal Review

flat as expected at the time of the Budget. Corporate profits are now expected to be weaker than forecastin March, falling by 5.0 per cent in 2008 instead of growing by 4.0 per cent.
Employment and wages, along with retail sales and housing starts, have performed well so far this year,
e
The average private-sector forecast for Ontario real GDP growth is now 0.7 per cent in 2009, primarily
Changes in Key Economic Forecast Assumptions, Table 6
with growth forecasts now higher than at the time of the Budget. Employment was forecast to grow by 1.0 per cent for 2008, but that forecast has been revised up to 1.5 per cent. Solid employment gains havcontributed to stronger-than-expected income and spending growth. Personal income is forecast to rise by 4.2 per cent — 1.1 percentage points above the forecast at the time of the Budget. Retail sales for 2008 are now forecast to grow by 4.6 per cent, up from 3.4 per cent in the Budget, and there are expected to be 75,000 housing starts, up from a Budget forecast of 64,000.
significantly weaker than the Ministry of Finance’s 2008 Budget forecast of 2.1 per cent. This isdue to global financial market turbulence and a substantially weaker outlook for U.S. demand. The table below shows the changes in the projections for the key economic variables since the 2008 Budget.
2008 Fall Economic Statement Compared to 2008 Ontario Budget (Per Cent Change)
2008 2009
2008 2008e 2008Bu
2008p dget
Budget Fall Update Fall Update
Real GDP 1.1 0.1 2.1 0.7
Nominal GDP 2.8 2.1 3.9 2.2
Retail Sales 3.4 4.6 3.7 3.6
Housing Starts (000s) 64.0 75.0 6 63.0 4.9
Personal Income 3.1 4.2 4.0 3.8
Labour Income 3.4 4.3 3.9 3.9
Corporate Profits 4.0 (5.0) 4.9 1.7
Employment 1.0 1.5 1.1 0.4
Job Creation (000s) 68 101 76 25
Key External Variables
Crude Oil ($ US per Barrel) 85.0 108.0 80.0 103.3
U.S. Real GDP 1.7 1.5 2.6 0.5
Canadian Dollar (Cents US) 100.0 96.0 9 98.0 2.2
Three-Month Treasury Bill Rate 3.3 2.3 3.8 2.3
10-Year Government Bond Rate 3.9 3.6 4.5 3.9
e = estimate; p = private-sector average. r 2008), Ontario Ministry of Finance and Ontario Ministry of Finance Survey of Sources: Blue Chip Economic Indicators (Octobe
Forecasts (October 16, 2008).
Annex II: Economic Outlook 31

32 2008 Ontario Economic Outlook and Fiscal Review

ANNEX III Role for the Federal Government
Annex III: Role for the Federal Government 33

34 2008 Ontario Economic Outlook and Fiscal Review

All Canadians deserve to be treated fairly. Ontarians, however, are not being treated like Canadians living in other provinces. Unemployed Ontario workers deserve the same support that unemployed workers in other provinces receive. Ontarians ought to have the same level of per-person health care funding now provided to Canadians elsewhere in the country. And Ontario should receive its fair share of federal investment in Canada’s infrastructure.
Ontario has the wealth it needs, but needs to keep more of its own money during challenging economic times.
CANADA’S SYSTEM OF TRANSFERS IS OUTDATED
Ontario’s Fiscal Gap
Each year, under the current federal system of programs and transfers, the federal government collects more than $20 billion from Ontario taxpayers to deliver programs and services elsewhere in Canada. These funds — $1,815 per Ontarian — are redistributed from Ontario taxpayers to other regions of the country, despite the fact that some of these regions are as prosperous as Ontario, if not more so.
In September of this year, the TD Bank Financial Group released a report that estimated the portion of Ontario’s fiscal gap for 2005 that resulted from discriminatory federal programs to be $11.8 billion. The report noted that the total fiscal gap amounts to four per cent of Ontario’s gross domestic product (GDP).
If Ontario was able to keep more of its own money, it could further strengthen the economy and enhance programs and services for its citizens.
The financial burden that Ontario carries within Canada must be reduced. In recent years, under two different prime ministers, Ontario has made some progress. The Canada Social Transfer is now provided on an equal per-capita basis. And in 2005, Ontario negotiated a Canada–Ontario Immigration Agreement (COIA) for $920 million in new investments for settlement and language training services over five years.
$11.5$12.9
$13.6
$4.5 $4.8 $5.4 $5.7
$10.9$10.9
$4.6
0
3
6
9
12
15
2004–05 2005–06 2006–07 2007–08 2008–09
Note: Shaded bars represent Ontario’s contribution.Source: Ontario Ministry of Finance.
Ontarians Pay into Equalization Chart 1
$ Billions
Ontario welcomes these changes but, overall, Ontarians continue to be treated unfairly.
Equalization
Over the last 50 years, Ontarians have contributed over $100 billion in epayments to other Canadian provinces —almost half of all funds contributed toprogram in that time.
qualization
the
Annex III: Role for the Federal Government 35
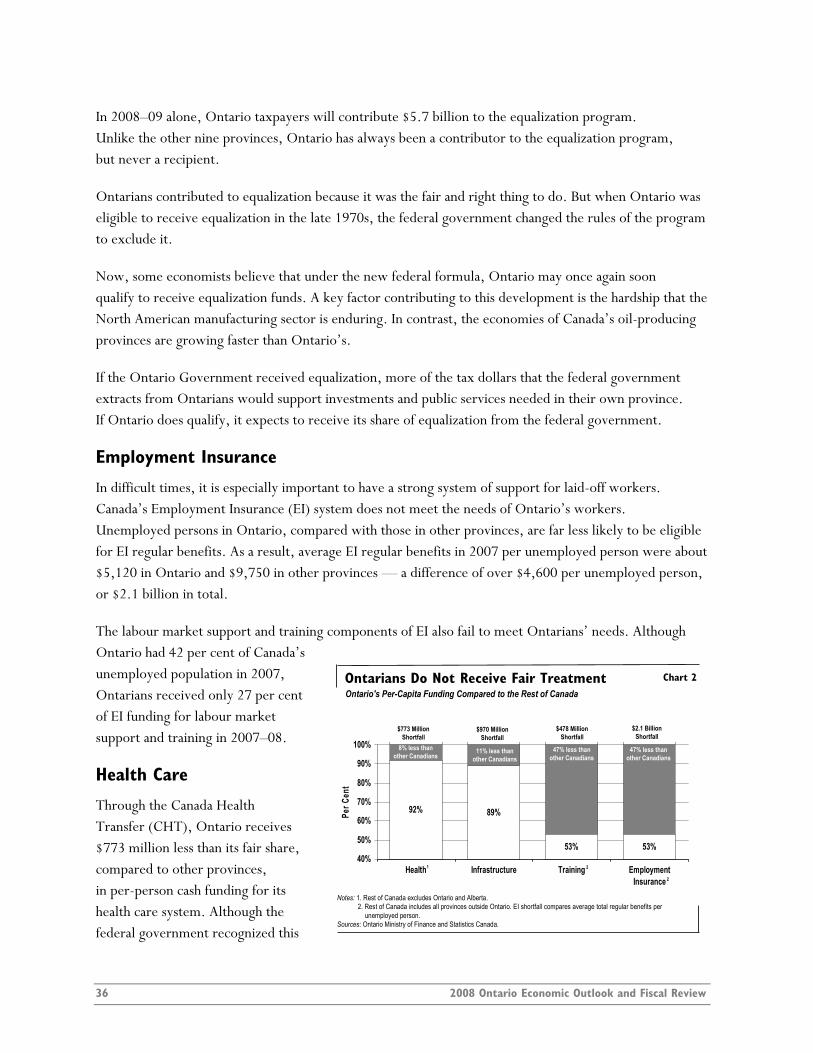
In 2008–09 alone, Ontario taxpayers will contribute $5.7 billion to the equalization program. Unlike the other nine provinces, Ontario has always been a contributor to the equalization program, but never a recipient.
Ontarians contributed to equalization because it was the fair and right thing to do. But when Ontario was eligible to receive equalization in the late 1970s, the federal government changed the rules of the program to exclude it.
Now, some economists believe that under the new federal formula, Ontario may once again soon qualify to receive equalization funds. A key factor contributing to this development is the hardship that the North American manufacturing sector is enduring. In contrast, the economies of Canada’s oil-producing provinces are growing faster than Ontario’s.
If the Ontario Government received equalization, more of the tax dollars that the federal government extracts from Ontarians would support investments and public services needed in their own province. If Ontario does qualify, it expects to receive its share of equalization from the federal government.
Employment Insurance
In difficult times, it is especially important to have a strong system of support for laid-off workers. Canada’s Employment Insurance (EI) system does not meet the needs of Ontario’s workers. Unemployed persons in Ontario, compared with those in other provinces, are far less likely to be eligible for EI regular benefits. As a result, average EI regular benefits in 2007 per unemployed person were about $5,120 in Ontario and $9,750 in other provinces — a difference of over $4,600 per unemployed person, or $2.1 billion in total.
The labour market support and training components of EI also fail to meet Ontarians’ needs. Although Ontario had 42 per cent of Canada’s unemployed population in 2007, Ontarians received only 27 per cent of EI funding for labour market support and training in 2007–08.
Ontarians Do Not Receive Fair Treatment
92% 89%
53% 53%40%
50%
60%
70%
80%
90%
100%
Health Infrastructure Training EmploymentInsurance
Per C
ent
Notes: 1. Rest of Canada excludes Ontario and Alberta.2. Rest of Canada includes all provinces outside Ontario. EI shortfall compares average total regular benefits per
unemployed person.Sources: Ontario Ministry of Finance and Statistics Canada.
Chart 2
$773 MillionShortfall
$970 MillionShortfall
$478 MillionShortfall
$2.1 BillionShortfall
8% less than other Canadians
11% less than other Canadians
47% less than other Canadians
47% less than other Canadians
1 2
2
Ontario's Per-Capita Funding Compared to the Rest of Canada
Health Care
Through the Canada Health Transfer (CHT), Ontario receives $773 million less than its fair share, compared to other provinces, in per-person cash funding for its health care system. Although the federal government recognized this
36 2008 Ontario Economic Outlook and Fiscal Review
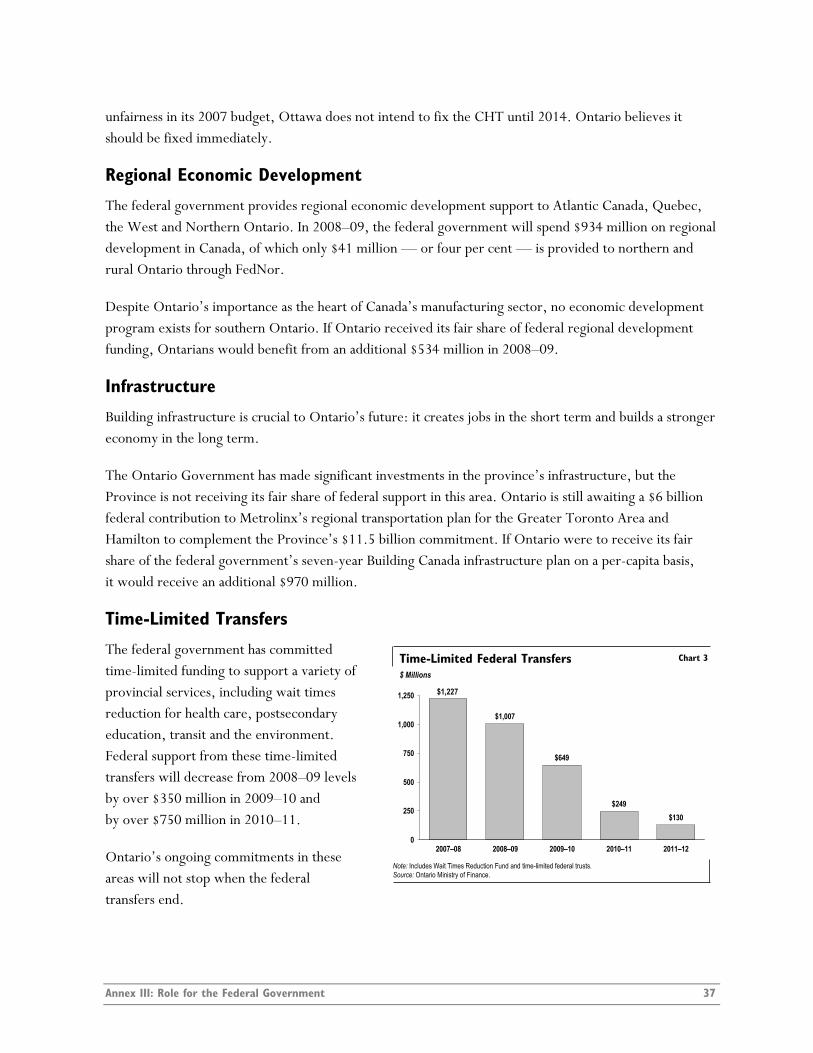
unfairness in its 2007 budget, Ottawa does not intend to fix the CHT until 2014. Ontario believes it should be fixed immediately.
Regional Economic Development
The federal government provides regional economic development support to Atlantic Canada, Quebec, the West and Northern Ontario. In 2008–09, the federal government will spend $934 million on regional development in Canada, of which only $41 million — or four per cent — is provided to northern and rural Ontario through FedNor.
Despite Ontario’s importance as the heart of Canada’s manufacturing sector, no economic development program exists for southern Ontario. If Ontario received its fair share of federal regional development funding, Ontarians would benefit from an additional $534 million in 2008–09.
Infrastructure
Building infrastructure is crucial to Ontario’s future: it creates jobs in the short term and builds a stronger economy in the long term.
The Ontario Government has made significant investments in the province’s infrastructure, but the Province is not receiving its fair share of federal support in this area. Ontario is still awaiting a $6 billion federal contribution to Metrolinx’s regional transportation plan for the Greater Toronto Area and Hamilton to complement the Province’s $11.5 billion commitment. If Ontario were to receive its fair share of the federal government’s seven-year Building Canada infrastructure plan on a per-capita basis, it would receive an additional $970 million.
Time-Limited Transfers
The federal government has committed time-limited funding to support a variety of provincial services, including wait times reduction for health care, postsecondary education, transit and the environment. Federal support from these time-limited transfers will decrease from 2008–09 levels by over $350 million in 2009–10 and by over $750 million in 2010–11.
$ Millions
$1,007
$649
$249$130
0
250
500
750
1,000
1,250
2007–08 2008–09 2009–10 2010–11 2011–12
Note: Includes Wait Times Reduction Fund and time-limited federal trusts.Source: Ontario Ministry of Finance.
Time-Limited Federal Transfers Chart 3
$1,227
Ontario’s ongoing commitments in these areas will not stop when the federal transfers end.
Annex III: Role for the Federal Government 37
NEED FOR A FEDERAL PARTNER
The Province is doing what it must to strengthen Ontario’s economy and create new jobs. But it could do much more, much faster, if it could keep more of Ontarians’ money in the province — and if it had a true partner in the federal government.
Ontario therefore calls on the federal government to:
• recommit to a principled allocation formula for all federal transfers to reduce the drain on Ontario
• provide Ontario with its fair share of federal funding, including:
its full share of funding payable under the equalization program, should Ontario qualify
equal per-capita health care funding immediately through the Canada Health Transfer
a fair share of federal infrastructure funding
the continuation of time-limited federal funding
• modernize the EI program to better meet the needs of Ontario workers by providing the same support and job training that workers receive in other regions of Canada
• invest in Ontario’s economic development, as it does everywhere else in the country.
Ontario needs a true partner in the federal government that will work with it to make the province stronger than ever. Building a stronger Ontario means a stronger Canada.
Ontario invites the federal government to engage in a substantive discussion of these fairness issues, with the mutual goals of strengthening the Ontario economy and building a more prosperous Canada.
38 2008 Ontario Economic Outlook and Fiscal Review

ANNEX IV Borrowing and Debt Management
Annex IV: Borrowing and Debt Management 39

40 2008 Ontario Economic Outlook and Fiscal Review
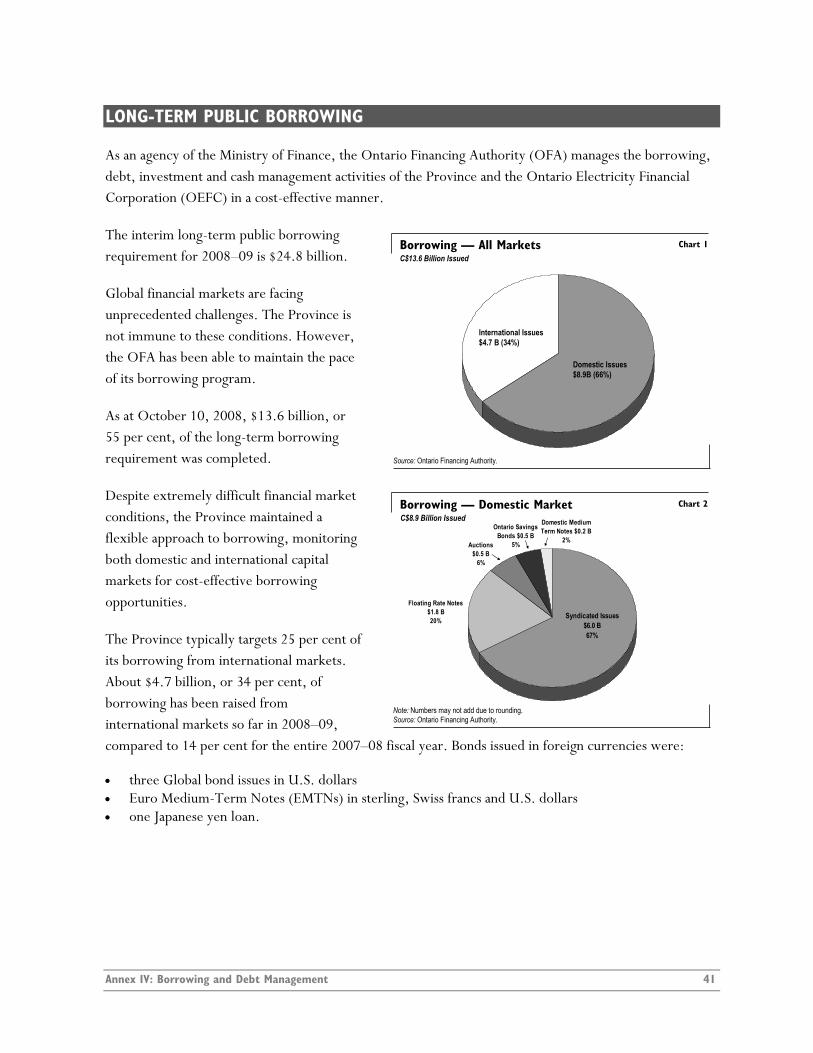
Borrowing — Domestic Market Chart 2
Domestic Medium Term Notes $0.2 B
2%
Ontario Savings Bonds $0.5 B
5%Auctions $0.5 B
6%
Floating Rate Notes $1.8 B 20% Syndicated Issues
$6.0 B67%
C$8.9 Billion Issued
Note: Numbers may not add due to rounding.Source: Ontario Financing Authority.
LONG-TERM PUBLIC BORROWING
As an agency of the Ministry of Finance, the Ontario Financing Authority (OFA) manages the borrowing, debt, investment and cash management activities of the Province and the Ontario Electricity Financial Corporation (OEFC) in a cost-effective manner.
The interim long-term public borrowing requirement for 2008–09 is $24.8 billion.
Borrowing — All Markets Chart 1
Source: Ontario Financing Authority.
C$13.6 Billion Issued
International Issues$4.7 B (34%)
Domestic Issues$8.9B (66%)
Global financial markets are facing unprecedented challenges. The Province is not immune to these conditions. However, the OFA has been able to maintain the pace of its borrowing program.
As at October 10, 2008, $13.6 billion, or 55 per cent, of the long-term borrowing requirement was completed.
Despite extremely difficult financial market conditions, the Province maintained a flexible approach to borrowing, monitoring both domestic and international capital markets for cost-effective borrowing opportunities.
The Province typically targets 25 per cent of its borrowing from international markets. About $4.7 billion, or 34 per cent, of borrowing has been raised from international markets so far in 2008–09, compared to 14 per cent for the entire 2007–08 fiscal year. Bonds issued in foreign currencies were:
• three Global bond issues in U.S. dollars • Euro Medium-Term Notes (EMTNs) in sterling, Swiss francs and U.S. dollars • one Japanese yen loan.
Annex IV: Borrowing and Debt Management 41

About $8.9 billion, or 66 per cent, of borrowing was completed in the domestic market through a number of instruments, including:
• syndicated issues • bond auctions • floating rate notes • Ontario Savings Bonds • domestic medium-term notes.
2008–09 Borrowing Program: Province and OEFC Table 1 ($ Billions) Budget
Plan Current Outlook
In-Year Change
Deficit/(Surplus) 0.0 0.5 0.5
Non-Cash Adjustments (0.9) 2.0 2.9
Investment in Capital Assets 4.9 4.9 0.0
Net Loans/Investments 1.3 1.1 (0.2)
Debt Maturities 20.5 20.5 0.0
Debt Redemptions 1.0 0.6 (0.4)
Total Funding Requirement 26.9 29.6 2.7
Canada Pension Plan Borrowing (0.6) (0.5) 0.1
Decrease/(Increase) in Short-Term Borrowing (2.0) (2.9) (0.9)
Increase/(Decrease) in Cash and Cash Equivalents 0.0 (1.4) (1.4)
Total Long-Term Public Borrowing Requirement 24.3 24.8 0.5
Note: Numbers may not add due to rounding.
Deficit
The total long-term public borrowing requirement of $24.8 billion is $0.5 billion higher than the Budget Plan and the First Quarter Ontario Finances, due to the projected deficit.
Accumulated deficit is the difference between total liabilities and total assets. It is projected to be $106.1 billion as at March 31, 2009, compared to $105.6 billion as at March 31, 2008. The accumulated deficit is forecast to increase by the amount of the deficit.
Total debt is also expected to increase due to the government’s capital investments in key priority areas, loans to school boards for capital projects and increased short-term borrowing to maintain cash levels. The increase in net debt is primarily a result of the government’s capital investments.
42 2008 Ontario Economic Outlook and Fiscal Review
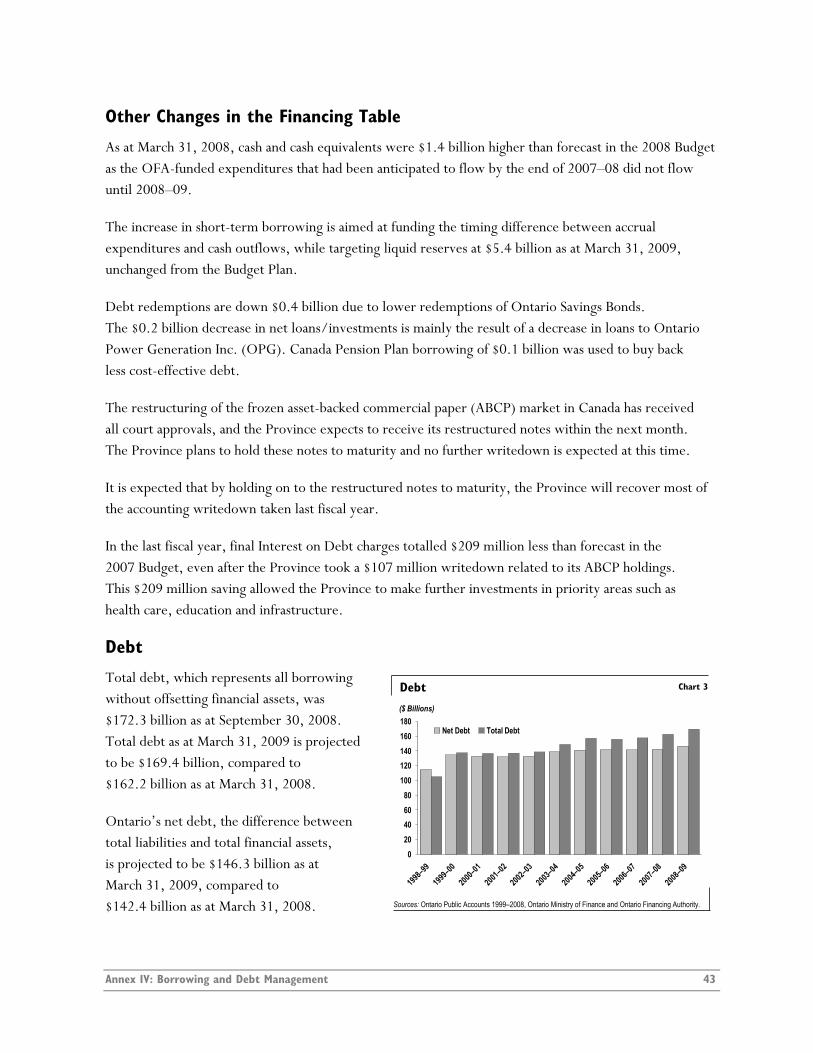
Other Changes in the Financing Table
As at March 31, 2008, cash and cash equivalents were $1.4 billion higher than forecast in the 2008 Budget as the OFA-funded expenditures that had been anticipated to flow by the end of 2007–08 did not flow until 2008–09.
The increase in short-term borrowing is aimed at funding the timing difference between accrual expenditures and cash outflows, while targeting liquid reserves at $5.4 billion as at March 31, 2009, unchanged from the Budget Plan.
Debt redemptions are down $0.4 billion due to lower redemptions of Ontario Savings Bonds. The $0.2 billion decrease in net loans/investments is mainly the result of a decrease in loans to Ontario Power Generation Inc. (OPG). Canada Pension Plan borrowing of $0.1 billion was used to buy back less cost-effective debt.
The restructuring of the frozen asset-backed commercial paper (ABCP) market in Canada has received all court approvals, and the Province expects to receive its restructured notes within the next month. The Province plans to hold these notes to maturity and no further writedown is expected at this time.
It is expected that by holding on to the restructured notes to maturity, the Province will recover most of the accounting writedown taken last fiscal year.
In the last fiscal year, final Interest on Debt charges totalled $209 million less than forecast in the 2007 Budget, even after the Province took a $107 million writedown related to its ABCP holdings. This $209 million saving allowed the Province to make further investments in priority areas such as health care, education and infrastructure.
Debt
Total debt, which represents all borrowing without offsetting financial assets, was $172.3 billion as at September 30, 2008. Total debt as at March 31, 2009 is projected to be $169.4 billion, compared to $162.2 billion as at March 31, 2008.
Debt Chart 3
($ Billions)
Sources: Ontario Public Accounts 1999–2008, Ontario Ministry of Finance and Ontario Financing Authority.
020406080
100120140160180
1998–9
9
1999–0
0
2000–0
1
2001–0
2
2002–0
3
2003–0
4
2004–0
5
2005–0
6
2006–0
7
2007–0
8
2008–0
9
Net Debt Total Debt
Ontario’s net debt, the difference between total liabilities and total financial assets, is projected to be $146.3 billion as at March 31, 2009, compared to $142.4 billion as at March 31, 2008.
Annex IV: Borrowing and Debt Management 43
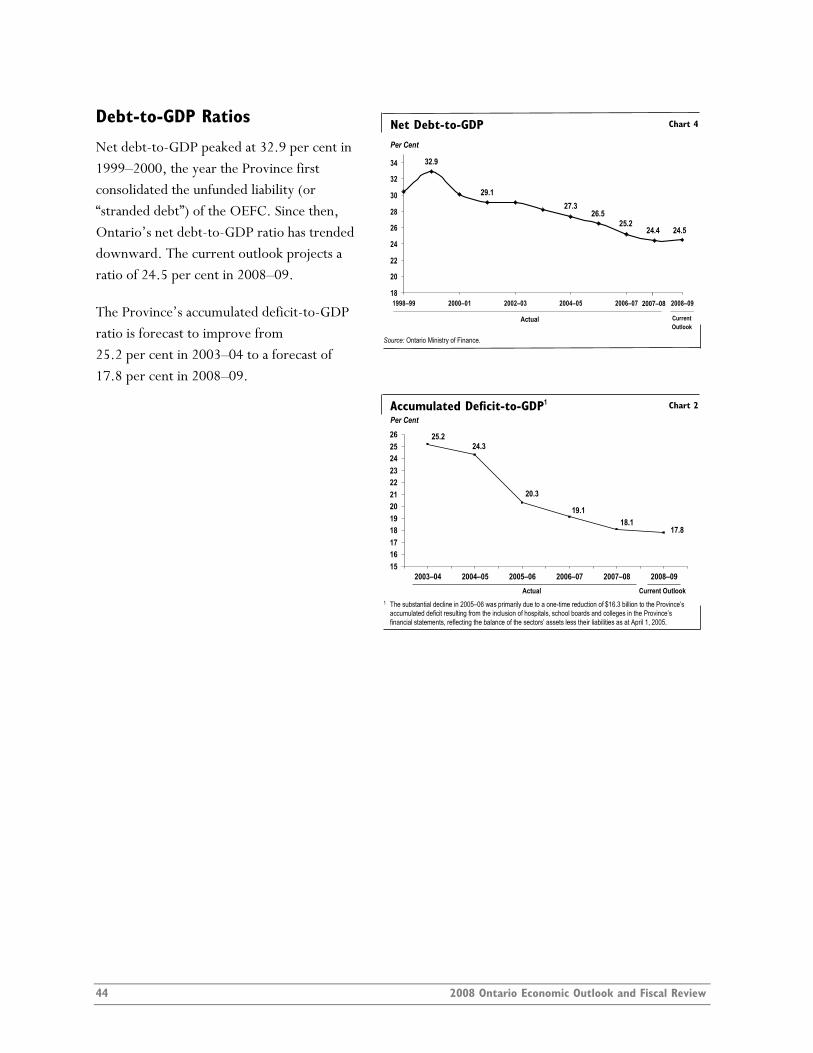
Debt-to-GDP Ratios Net Debt-to-GDP Chart 4
Source: Ontario Ministry of Finance.
Per Cent
18
20
22
24
26
28
30
32
34
1998–99 2000–01 2002–03 2004–05 2006–07 2008–09
32.9
29.127.3
24.4
Actual CurrentOutlook
25.226.5
24.5
2007–08
Net debt-to-GDP peaked at 32.9 per cent in 1999–2000, the year the Province first consolidated the unfunded liability (or “stranded debt”) of the OEFC. Since then, Ontario’s net debt-to-GDP ratio has tdownward. The current outlook projects aratio of 24.5 per cent in 2008–09.
rended
The Province’s accumulated deficit-to-GDP
ecast of ratio is forecast to improve from 25.2 per cent in 2003–04 to a for17.8 per cent in 2008–09.
Accumulated Deficit-to-GDP Chart 21
151617181920212223242526
2003–04 2004–05 2005–06 2006–07 2007–08 2008–09
1 The substantial decline in 2005–06 was primarily due to a one-time reduction of $16.3 billion to the Province’s accumulated deficit resulting from the inclusion of hospitals, school boards and colleges in the Province’s financial statements, reflecting the balance of the sectors’ assets less their liabilities as at April 1, 2005.
Per Cent
Actual Current Outlook
24.3
20.3
19.118.1
17.8
25.2
44 2008 Ontario Economic Outlook and Fiscal Review

Total Debt Composition
Total Debt Composition Chart 6
Treasury Bills & U.S. Commercial Paper
$11.1B (6%)
International Bonds$33.0B (19%)
Domestic Bonds$108.3B (63%)
Non-Public Debt$19.9B (12%)
Source: Ontario Financing Authority (September 30, 2008).
C$172.3 Billion
International Bonds:• Canadian dollar• U.S. dollar• Euro• New Zealand dollar• Swiss franc• Japanese yen• Australian dollar• U.K. sterling• South African rand• Hong Kong dollar• New Turkish lira
Domestic bonds:• Syndicated bonds• Medium-term notes• Floating rate notes• Ontario Savings Bonds
• Bond auctions• Real return bonds
Total debt is composed of bonds issued in both the short- and long-term public capital markets and non-public debt.
Public debt totals $152.4 billion, primarily consisting of bonds issued in the domestic and international long-term public markets in 11 currencies. Ontario also has $19.9 billion outstanding in non-public debt issued in Canadian dollars. Non-public debt consists of debt instruments issued to psector pension funds in Ontario and the Canada Pension Plan Investment Board (CPPIB). This debt is not marketable and cannot be traded.
ublic-
Net Interest Rate Resetting Exposure Chart 7Percentage of Debt Issued for Provincial Purposes
Source: Ontario Financing Authority. Excludes OEFC debt.
10.2
14.115.3 15.6
13.4
0
5
10
15
20
March 31, 2005 March 31, 2006 March 31, 2007 March 31, 2008 Sept. 30, 2008
Debt Management
The Province limits itself to a maximum net interest rate resetting exposure of 35 per cent of debt issued for Provincial purposes and a maximum foreign exchange exposure of five per cent of debt issued for Provincial purposes. As at September 30, 2008, the net interest rate resetting exposure was 13.4 per cent and foreign exchange exposure was 0.1 per cent. Foreign Exchange Exposure Chart 8
0.8 0.80.7
0.6
0.1
0
1
2
March 31, 2005 March 31, 2006 March 31, 2007 March 31, 2008 Sept. 30, 2008
Percentage of Debt Issued for Provincial Purposes
Source: Ontario Financing Authority. Excludes OEFC debt.
All exposures have remained well below policy limits in 2008–09.
Annex IV: Borrowing and Debt Management 45

Debt Maturities
Debt Maturities Chart 9
Excludes short-term debt and other liabilities and the incremental impact of future financing. Assumes issues with options will be retired at the earliest possible date. Source: Ontario Financing Authority.
02468
101214161820222426
2009 2010 2011 2012 2013 2014 2015–19 2020–24 2025–29 2030–34 2035–39 2040–48
Province OEFC
Fiscal year ending March 31
($ Billions)
The largest component of the borrowing program is the refinancing of maturing debt. The year-to-year variation in debt maturities largely reflects past borrowing activities. The Province will continue to aim for a balanced maturity profile and take aof opportunities to schedule maturities iyears that currently have lower levels of maturing debt.
dvantage nto
Cost of Debt
The effective interest rate (on a weighted-average basis) on total debt was 5.53 per cent as at September 30, 2008 (March 31, 2008, 5.76 per cent). For comparison, as at March 31, 1993, the effective interest rate on total debt was 10.14 per cent.
The effective interest rate on public debt was 5.16 per cent as at September 30, 2008, compared to 5.35 per cent as at March 31, 2008. The effective interest rate on non-public debt was 8.35 per cent as at September 30, 2008, compared to 8.59 per cent as at March 31, 2008.
4
5
6
7
8
9
10
11
12
1992
–93
1994
–95
1996
–97
1998
–99
2000
–01
2002
–03
2004
–05
2006
–07
2008
–09
Total Debt Public Debt Non-Public Debt
Effective Interest Rate (Weighted Average) of Debt Chart 10
Sources: Ontario Public Accounts 1993–2007 and Ontario Financing Authority (September 30, 2008).
Per Cent
2007
–08
46 2008 Ontario Economic Outlook and Fiscal Review

ANNEX V Transparency in Taxation, 2008
Annex V: Transparency in Taxation, 2008 47

48 2008 Ontario Economic Outlook and Fiscal Review

TRANSPARENCY IN TAXATION
Tax expenditure reporting is an important element of improved fiscal accountability. It increases fiscal transparency by providing a complete picture of revenue forgone in the tax system.
STRUCTURE OF THE REPORT
This report provides estimates of revenue forgone in 2008 with respect to provisions in the following taxes:
• Personal Income Tax • Corporate Tax • Sales and Commodity Tax • Education Property Tax • Employer Health Tax • Estate Administration Tax • Gross Revenue Charge.
This report includes descriptions only of tax provisions that are new or have been modified since the 2007 Transparency in Taxation report. The descriptions are intended to provide a basic understanding of the provisions and do not replace the relevant legislation or regulations.
Descriptions of the tax provisions presented in this report are available online at: www.fin.gov.on.ca/english/budget/fallstatement/2008/
SCOPE
Given the absence of a universally accepted definition of a “tax expenditure,” this report continues the broad approach adopted in previous reports of listing estimates of forgone revenue that could potentially be included under a broad-based tax system.
Personal and Corporate Income Tax expenditures identified in this report include tax expenditures shared with the federal government and Ontario-only tax expenditures.
Under a tax collection agreement between Ontario and Canada, the federal government determines the Personal Income Tax base. Ontario has limited policy control over the individual components of taxable income and the associated tax expenditures related to the federally defined tax base.
Ontario and the federal government are finalizing a corporate tax collection agreement. The agreement provides for the federal collection and administration of Ontario’s Corporate Income Tax, Minimum Tax, Capital Tax and Special Additional Tax on life insurers, effective for taxation years ending after 2008.
Annex V: Transparency in Taxation, 2008 49

Similar to the tax collection agreement for Personal Income Tax, the corporate tax collection agreement requires Ontario to harmonize with the federal corporate income tax base.
METHOD
The estimates in this report were developed using the latest available taxation or economic data, forecast to the 2008 calendar year. The data used to estimate the values of the tax provisions come from a variety of sources. The estimated value of a tax provision may differ from the amount reported in a prior year for a variety of reasons including amendments to the provision, changes in economic factors, revisions to the underlying data and improvements to the estimation method. Some tax provision estimates are particularly sensitive to economic conditions or other variables and, therefore, can fluctuate significantly from year to year.
It is important to note that the estimates in this report are not intended to represent the potential revenue gain for the Province if the tax provisions were not in place. Each estimate has been determined separately and in isolation of other factors, such as the economic impact of any change, behavioural responses, the interaction among various tax provisions, or any modifications in policy that might reasonably accompany the change. As a result, the estimates cannot be added together to determine the total cost of a particular group of tax expenditures.
Tax expenditure estimates of less than $1 million are denoted by the letter “s” (small). This report also includes tax provisions for which relevant data from the tax system are not currently available to the Ministry of Finance. Although estimates may not be available, these items are listed to ensure greater accountability and transparency.
Future annual reports will continue to refine Ontario’s tax expenditure estimates.
50 2008 Ontario Economic Outlook and Fiscal Review

PERSONAL INCOME TAX
Table 1 provides estimates of tax provisions relating to the Ontario Personal Income Tax system. Business provisions listed here are for unincorporated businesses.
Personal Income Tax1 Table 1
Tax Provisions 2008 Estimates2 ($ Millions)
Ontario Non-refundable Tax Credits Adoption Expense Credit s
Age Credit 265
Amounts Transferred from a Spouse or Common-law Partner 25
Basic Personal Credit 4,270
Canada Pension Plan (CPP)/Quebec Pension Plan (QPP) Contributions Credit 555
Caregiver Credit 15
Charitable Donations Credit 645
Disability Credit 85
Eligible Dependant Credit 85
Employment Insurance (EI) Premiums Credit 190
Infirm Dependant Credit 1
Medical Expense Credit 145
Ontario Overseas Employment Tax Credit 6
Pension Income Credit 120
Spouse or Common-law Partner Credit 175
Student Loan Interest Credit 9
Tuition and Education Credits 290
Ontario Tax Reduction (OTR)
OTR — Basic Reduction 185
OTR — Reduction for Dependent Children Under 19 200
OTR — Reduction for Disabled or Infirm Dependants 10
OTR — Total 330
Employee Ownership and Ontario Labour Sponsored Investment Fund Tax Credits
Employee Ownership (EO) Tax Credit s
Labour Sponsored Investment Fund (LSIF) Tax Credit 25
Research Oriented Investment Fund (ROIF) Tax Credit 1
Ontario Refundable Tax Credits
Ontario Focused Flow-through Share Tax Credit 3
Ontario Political Contribution Tax Credit 5
Annex V: Transparency in Taxation, 2008 51

Personal Income Tax1 Table 1
2008 Estimates2Tax Provisions ($ Millions)
Ontario Property and Sales Tax Credits (OTCs)
OTCs — Non-seniors 450
OTCs — Seniors3 515
OTCs — Total3 965
Exemptions, Deductions, Deferrals and Other Measures Shared with the Federal Government
Business
Items for Which an Estimate is not Available
Assistance for Artists and Deduction for Canadian Art Purchased by Unincorporated Businesses
Assistance for Prospectors and Grubstakers
Deduction of Accelerated Capital Cost Allowance
Deferral Through Use of Billed-basis Accounting by Professionals
Employment
Deduction for Clergy Residence 15
Deduction of Home Relocation Loans s
Deduction for Military and Police Deployed to High-risk International Missions 5
Deduction of Other Employment Expenses 270
Deduction of Union and Professional Dues 150
Employee Security Options 195
Moving Expense Deduction 20
Northern Residents Deductions 1
Items for Which an Estimate is not Available
Deduction for Artists and Musicians
Deduction for Tradespersons’ and Apprentice Vehicle Mechanics’ Tools
Deduction for Tuition Assistance for Adult Basic Education
Deferral of Salary Through Leave of Absence/Sabbatical Plans
Employee Benefit Plans
Non-taxation of Business-paid Health and Dental Benefits
Non-taxation of Certain Non-monetary Employment Benefits
Special Tax Computations for Certain Retroactive Lump-sum Payments
52 2008 Ontario Economic Outlook and Fiscal Review

Personal Income Tax1 Table 1
2008 Estimates2Tax Provisions ($ Millions)
Farming and Fishing
Items for Which an Estimate is not Available
Cash-basis and Flexibility in Inventory Accounting
Deduction of Farm Losses for Part-time Farmers
Deferral of Income for Farmers
Net Income Stabilization Account for Farmers
Investment
$750,000 Lifetime Capital Gains Exemption for Farm or Fishing Property and Small Business Shares
165
Deduction of Allowable Business Investment Losses 10
Deduction of Carrying Charges Incurred to Earn Income 295
Deduction of Resource-related Expenditures 185
Partial Inclusion of Capital Gains 1,130
Items for Which an Estimate is not Available
Capital Gains Exemptions — $1,000 on Personal-use Property and $200 on Foreign Exchange Transactions
Deduction of Limited Partnership Losses
Deferral of Capital Gains Through Five-year Reserves
Deferral of Capital Gains Through Rollovers
Deferral of Capital Gains Through 10-year Reserves for Farm or Fishing Property and Small Business Shares
Deferral of Capital Gains Through Transfers to a Spouse or Spousal Trust
Exemption for Capital Gains Arising from Certain Donations
Non-taxation of Capital Gains on Principal Residences
Taxation of Capital Gains Upon Realization
Non-taxable Income
Guaranteed Income Supplement and Allowance Benefits 35
Social Assistance Benefits and Provincial Supplements 25
Workers’ Compensation Benefits 170
Items for Which an Estimate is not Available
Certain Federal Government Pensions and Allowances
Damages With Respect to Personal Injury or Death
Death Benefits of Up to $10,000
Annex V: Transparency in Taxation, 2008 53
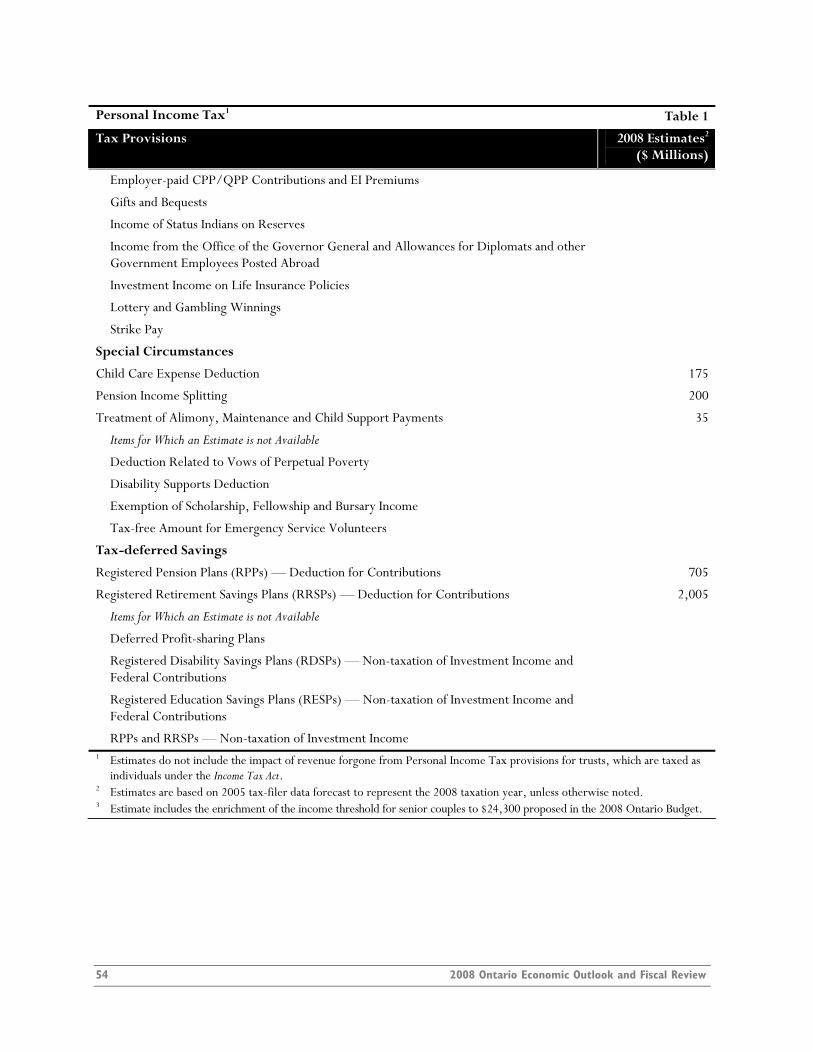
Personal Income Tax1 Table 1
2008 Estimates2Tax Provisions ($ Millions)
Employer-paid CPP/QPP Contributions and EI Premiums
Gifts and Bequests
Income of Status Indians on Reserves
Income from the Office of the Governor General and Allowances for Diplomats and other Government Employees Posted Abroad
Investment Income on Life Insurance Policies
Lottery and Gambling Winnings
Strike Pay
Special Circumstances
Child Care Expense Deduction 175
Pension Income Splitting 200
Treatment of Alimony, Maintenance and Child Support Payments 35
Items for Which an Estimate is not Available
Deduction Related to Vows of Perpetual Poverty
Disability Supports Deduction
Exemption of Scholarship, Fellowship and Bursary Income
Tax-free Amount for Emergency Service Volunteers
Tax-deferred Savings
Registered Pension Plans (RPPs) — Deduction for Contributions 705
Registered Retirement Savings Plans (RRSPs) — Deduction for Contributions 2,005
Items for Which an Estimate is not Available
Deferred Profit-sharing Plans
Registered Disability Savings Plans (RDSPs) — Non-taxation of Investment Income and Federal Contributions
Registered Education Savings Plans (RESPs) — Non-taxation of Investment Income and Federal Contributions
RPPs and RRSPs — Non-taxation of Investment Income 1 Estimates do not include the impact of revenue forgone from Personal Income Tax provisions for trusts, which are taxed as
individuals under the Income Tax Act. 2 Estimates are based on 2005 tax-filer data forecast to represent the 2008 taxation year, unless otherwise noted. 3 Estimate includes the enrichment of the income threshold for senior couples to $24,300 proposed in the 2008 Ontario Budget.
54 2008 Ontario Economic Outlook and Fiscal Review

PERSONAL INCOME TAX — DESCRIPTION OF TAX PROVISIONS
The following Personal Income Tax provisions have been introduced or changed since the 2007
Transparency in Taxation report.
Ontario Non-refundable Tax Credits
The non-refundable tax credits listed in the following table are based on amounts that are adjusted for inflation each year.
Amounts on Which Indexed Non-refundable Tax Credits Are Based for 2008 ($) Table 2
Non-Refundable Tax Credits
Adoption Expense Credit, maximum claim 10,591
Age Credit, maximum claim Reduced by 15 per cent of individual’s net income in excess of $31,554 Fully phased out when individual’s net income reaches $59,814
4,239
Basic Personal Credit 8,681
Caregiver Credit, maximum claim Reduced by dependant’s net income in excess of $13,999 Fully phased out when dependant’s net income reaches $18,091
4,092
Disability Credit Disability supplement for individuals under 18 years of age, maximum claim
7,014 4,091
Eligible Dependant Credit, maximum claim Reduced by dependant’s net income in excess of $737 Fully phased out when dependant’s net income reaches $8,108
7,371
Infirm Dependant Credit, maximum claim Reduced by dependant’s net income in excess of $5,817 Fully phased out when dependant’s net income reaches $9,908
4,091
Medical Expense Credit Qualifying medical expenses of self, spouse or common-law partner, and dependent
children in excess of the lesser of three per cent of net income and $1,965 Qualifying medical expenses of other dependants in excess of the lesser of three
per cent of the dependant’s net income and $1,965, maximum claim for each
no limit 10,591
Pension Income Credit, maximum claim 1,201
Spouse or Common-law Partner Credit, maximum claim Reduced by spouse’s or common-law partner’s net income in excess of $737 Fully phased out when spouse or common-law partner’s net income reaches $8,108
7,371
Tuition and Education Credits Education Credit, full time or eligible for Disability Credit (per month) Education Credit, part time (per month) Maximum transfer
468 140
6,003
Annex V: Transparency in Taxation, 2008 55

Medical Expense Credit — Tax filers may claim a credit for non-reimbursed medical expenses, including those incurred on behalf of a tax filer’s spouse or common-law partner or minor children. For 2008, the credit is calculated as 6.05 per cent of eligible expenses in excess of the lesser of $1,965 and three per cent of the individual’s net income for the year. In addition, up to $10,591 of qualifying medical expenses paid on behalf of other dependent relatives may be claimed to the extent that they exceed the lesser of $1,965 and three per cent of the dependant’s net income. Beginning with 2008, the list of expenses eligible for the credit will be expanded. This change parallels the 2008 federal budget initiative.
Employee Ownership and Ontario Labour Sponsored Investment Fund Tax Credits
Labour Sponsored Investment Fund (LSIF) Tax Credit — LSIFs are venture capital corporations designed to provide capital to small and medium-sized Ontario businesses. Investors qualify for a 15 per cent non-refundable tax credit on investment up to a certain maximum. As announced in the 2007 Ontario Economic Outlook and Fiscal Review, effective January 1, 2007, the maximum annual eligible investment that qualifies for the LSIF tax credit increased from $5,000 to $7,500. In addition, the phase-out of the LSIF tax credit was delayed by one year to the end of 2011.
Research Oriented Investment Fund (ROIF) Tax Credit — Where an LSIF qualifies as a ROIF, investors receive an additional five per cent non-refundable tax credit. Effective January 1, 2007, the maximum annual eligible investment that qualifies for the ROIF tax credit increased from $5,000 to $7,500. In addition, the phase-out of the ROIF tax credit was delayed by one year to the end of 2011.
Ontario Refundable Tax Credits
Ontario Property and Sales Tax Credits (OTCs) — The refundable OTCs may be claimed by low- and moderate-income tax filers to offset the cost of provincial property and retail sales taxes. The Property Tax Credit is calculated as the lesser of occupancy cost and a basic property tax credit amount ($250 for non-senior single individuals or couples, or $625 for senior single individuals or couples), plus 10 per cent of occupancy cost. Occupancy cost is equal to property tax paid or 20 per cent of rent paid on an individual’s principal residence plus $25 if residing in a student residence. The Sales Tax Credit is $100 for an individual plus $100 for a spouse or common-law partner and $50 for each dependent child aged 18 or under. For non-seniors, the OTCs are jointly reduced by two per cent of adjusted family net income in excess of $4,000; for single seniors the credits are jointly reduced by four per cent of family net income in excess of $22,000. For senior couples, the 2008 Ontario Budget proposed that the credits be jointly reduced by four per cent of family net income in excess of $24,300. The maximum OTCs are $1,000 for non-seniors and $1,125 for seniors.
56 2008 Ontario Economic Outlook and Fiscal Review

The estimate includes the increase to the income threshold for senior couples proposed in the 2008 Budget.
Exemptions, Deductions, Deferrals and Other Measures Shared with the Federal Government
Employment Northern Residents Deductions — To offset the relatively higher cost of living and travelling
in the North, individuals living in a qualifying remote location in Canada for a continuous period of at least six months may claim certain deductions from income. Beginning in 2008, the residency deduction will increase by 10 per cent. This change parallels the 2008 federal budget initiative.
Investment Item for Which an Estimate is not Available
Exemption for Capital Gains Arising from Certain Donations — Capital gains on gifts of publicly listed securities to a qualified donee are exempt from tax. In addition, capital gains on gifts of ecologically sensitive land to a qualified donee (other than a private foundation) are exempt from tax, as are capital gains on certain objects certified as being of cultural importance to Canada that are donated to a designated museum or art gallery. In certain circumstances, the capital gains exemption applies to gains from securities exchanged for publicly listed securities that are then donated to a qualified donee after February 25, 2008. Extending the exemption to exchanged securities parallels the 2008 federal budget initiative.
Tax-Deferred Savings Item for Which an Estimate is not Available
Registered Disability Savings Plans (RDSPs) – Non-taxation of Investment Income and Federal Contributions — In its 2007 budget, the federal government introduced RDSPs to help parents and others save for the future needs of persons with severe disabilities. Investment income on contributions to RDSPs and federal assistance will accumulate tax-free in the plans, and contributions will not be included in income for tax purposes when they are withdrawn. Only the portion of withdrawals from an RDSP that relates to federal assistance and investment income will be included in the income of the person with a disability. Individuals benefit from a deferral of tax on investment income and federal contributions until funds are withdrawn from these plans. This provision parallels the 2007 federal budget initiative.
Annex V: Transparency in Taxation, 2008 57

Registered Education Savings Plans (RESPs) – Non-taxation of Investment Income and Federal Contributions — Individuals may contribute to RESPs on behalf of designated children. Federal assistance and investment income accrued within the plans are not taxed until withdrawn for the postsecondary education of the named beneficiaries. Beginning in 2008, the maximum contribution period and the maximum lifespan of an RESP, as well as the contribution age limit for a beneficiary of a family plan, will be extended by 10 years. This extension parallels the 2008 federal budget initiative.
58 2008 Ontario Economic Outlook and Fiscal Review
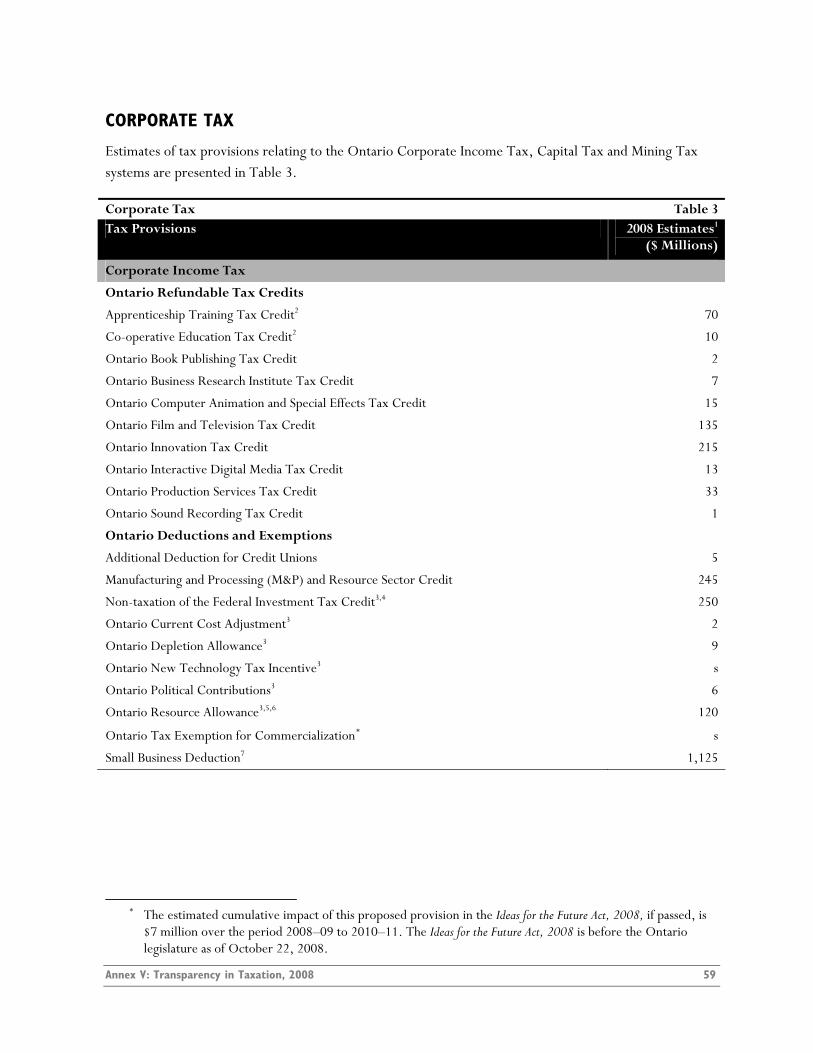
CORPORATE TAX
Estimates of tax provisions relating to the Ontario Corporate Income Tax, Capital Tax and Mining Tax systems are presented in Table 3.
Corporate Tax Table 3 Tax Provisions 2008 Estimates1
($ Millions)
Corporate Income Tax
Ontario Refundable Tax Credits
Apprenticeship Training Tax Credit2 70
Co-operative Education Tax Credit2 10
Ontario Book Publishing Tax Credit 2
Ontario Business Research Institute Tax Credit 7
Ontario Computer Animation and Special Effects Tax Credit 15
Ontario Film and Television Tax Credit 135
Ontario Innovation Tax Credit 215
Ontario Interactive Digital Media Tax Credit 13
Ontario Production Services Tax Credit 33
Ontario Sound Recording Tax Credit 1
Ontario Deductions and Exemptions
Additional Deduction for Credit Unions 5
Manufacturing and Processing (M&P) and Resource Sector Credit 245
Non-taxation of the Federal Investment Tax Credit3,4 250
Ontario Current Cost Adjustment3 2
Ontario Depletion Allowance3 9
Ontario New Technology Tax Incentive3 s
Ontario Political Contributions3 6
Ontario Resource Allowance3,5,6 120
Ontario Tax Exemption for Commercialization* s
Small Business Deduction7 1,125
* The estimated cumulative impact of this proposed provision in the Ideas for the Future Act, 2008, if passed, is
$7 million over the period 2008–09 to 2010–11. The Ideas for the Future Act, 2008 is before the Ontario legislature as of October 22, 2008.
Annex V: Transparency in Taxation, 2008 59

Corporate Tax Table 3 2008 Estimates1Tax Provisions
($ Millions)
Exemptions, Deductions, Deferrals and Other Measures Shared with the Federal Government
Allowable Business Investment Losses8,9 3
Deductibility of Charitable Donations8 95
Deductibility of Gifts to the Crown8 s
Deductibility of Gifts of Cultural Property and Ecologically Sensitive Land8 3
Deferral of Income for Farmers8 s
Holdback on Progress Payments to Contractors8 15
Non-taxation of Non-profit Organizations8 150
Partial Inclusion of Capital Gains8 1,360
Items for Which an Estimate is not Available
Accelerated Write-off of Capital Assets and Resource-related Expenditures
Temporary Incentive for Manufacturing and Processing (M&P) Machinery & Equipment10
Cash-basis and Flexibility in Inventory Accounting
Deductibility of Countervailing and Anti-dumping Duties
Deferral Through Capital Gains Rollovers
Deferral Through Use of Billed-basis Accounting by Professionals
Donations of Medicine for the Developing World
Exemption for Capital Gains Arising from Certain Donations
Expensing of Advertising Costs
Non-taxation of Provincial, Municipal and Federal Crown Corporations
Non-taxation of Registered Charities
Tax Exemption on Income of Foreign Affiliates of Canadian Corporations
Taxation of Capital Gains upon Realization
Capital Tax11
Capital Tax Deduction 460
Deferred Mining Exploration and Development Expenses12 s
Deferred Ontario New Technology Tax Incentive (ONTTI) and Scientific Research and Experimental Development (SR&ED) Costs12
s
Exemption for Family Farm Corporations, Family Fishing Corporations, Credit Unions and Other Specified Entities
s
Small Business Investment Tax Credit for Financial Institutions 20
Item for Which an Estimate is not Available
Renounced Mining Expenses
60 2008 Ontario Economic Outlook and Fiscal Review

Corporate Tax Table 3 2008 Estimates1Tax Provisions
($ Millions)
Mining Tax13
Mining Tax Exemption s
Mining Tax Holiday for Mines (other than remote mines) s
Mining Tax Holiday for New Remote Mines s
Mining Tax Rate for Remote Mines s
Processing Allowance 44
Item for Which an Estimate is not Available
Fast Write-off of Exploration Costs 1 Estimates are forecast to the 2008 calendar year based on preliminary 2006 and 2007 Ontario tax administration data, unless
otherwise noted. Estimates do not include the revenue forgone from Corporate Income Tax provisions for mutual fund corporations.
2 Estimates include the impact of both the Corporate and Personal Income Tax provisions. 3 These Ontario differences from the federal definition of taxable income do not apply for taxation years ending after 2008. 4 For taxation years ending after 2008, a 4.5 per cent non-refundable tax credit has been enacted to replace this provision. 5 The resource allowance applies to the mining and oil and gas sectors. The estimate is not net of mining taxes and
Crown royalties paid. 6 For taxation years ending after 2008, a tax credit/debit mechanism has been enacted to replace this provision. 7 Estimate includes the impact of the Small Business Deduction phase-out. 8 Estimates are based on assessed 2006 federal tax administration data and forecast to 2008. 9 Estimate could overstate the true value as it does not reflect the future reduction in tax revenues that would occur if those
losses were instead deducted from future capital gains. 10 The 2008 cash flow impact of this provision, based on the 2008 Ontario Budget estimate and adjusted to a calendar-year
basis, is $195 million. 11 Ontario has legislated a plan to eliminate the Capital Tax effective July 1, 2010. 12 These provisions do not apply for taxation years ending after 2008. 13 Estimates are forecast to the 2008 calendar year based on preliminary 2007 Ontario Mining Tax administration data.
Annex V: Transparency in Taxation, 2008 61
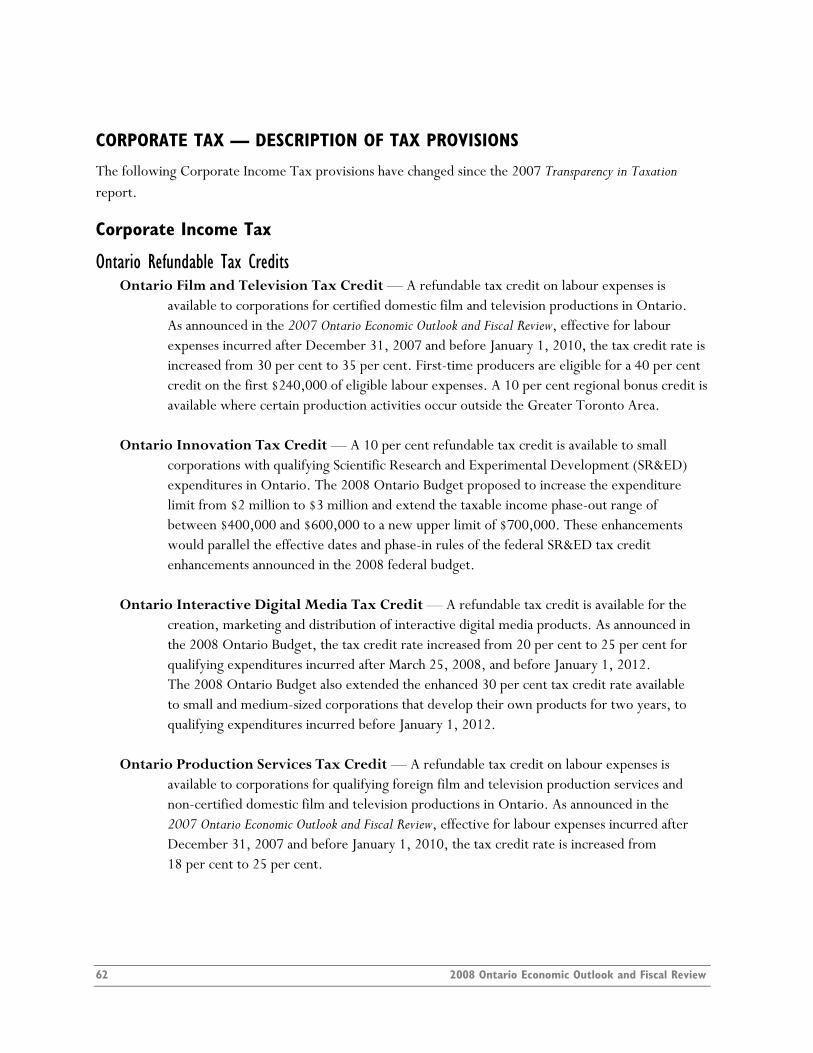
CORPORATE TAX — DESCRIPTION OF TAX PROVISIONS
The following Corporate Income Tax provisions have changed since the 2007 Transparency in Taxation
report.
Corporate Income Tax
Ontario Refundable Tax Credits Ontario Film and Television Tax Credit — A refundable tax credit on labour expenses is
available to corporations for certified domestic film and television productions in Ontario. As announced in the 2007 Ontario Economic Outlook and Fiscal Review, effective for labour expenses incurred after December 31, 2007 and before January 1, 2010, the tax credit rate is increased from 30 per cent to 35 per cent. First-time producers are eligible for a 40 per cent credit on the first $240,000 of eligible labour expenses. A 10 per cent regional bonus credit is available where certain production activities occur outside the Greater Toronto Area.
Ontario Innovation Tax Credit — A 10 per cent refundable tax credit is available to small corporations with qualifying Scientific Research and Experimental Development (SR&ED) expenditures in Ontario. The 2008 Ontario Budget proposed to increase the expenditure limit from $2 million to $3 million and extend the taxable income phase-out range of between $400,000 and $600,000 to a new upper limit of $700,000. These enhancements would parallel the effective dates and phase-in rules of the federal SR&ED tax credit enhancements announced in the 2008 federal budget.
Ontario Interactive Digital Media Tax Credit — A refundable tax credit is available for the creation, marketing and distribution of interactive digital media products. As announced in the 2008 Ontario Budget, the tax credit rate increased from 20 per cent to 25 per cent for qualifying expenditures incurred after March 25, 2008, and before January 1, 2012. The 2008 Ontario Budget also extended the enhanced 30 per cent tax credit rate available to small and medium-sized corporations that develop their own products for two years, to qualifying expenditures incurred before January 1, 2012.
Ontario Production Services Tax Credit — A refundable tax credit on labour expenses is available to corporations for qualifying foreign film and television production services and non-certified domestic film and television productions in Ontario. As announced in the 2007 Ontario Economic Outlook and Fiscal Review, effective for labour expenses incurred after December 31, 2007 and before January 1, 2010, the tax credit rate is increased from 18 per cent to 25 per cent.
62 2008 Ontario Economic Outlook and Fiscal Review

Ontario Deductions and Exemptions Ontario Tax Exemption for Commercialization — The Ideas for the Future Act, 2008, if passed,
would provide new corporations established after March 24, 2008 and before March 25, 2012, that commercialize intellectual property developed at qualifying Canadian universities, colleges or research institutes, with a refund of Corporate Income Tax paid in their first 10 taxation years. This measure was proposed in the 2008 Ontario Budget.
Small Business Deduction — Canadian-controlled private corporations are eligible for a reduced corporate income tax rate of 5.5 per cent on the first $500,000 of active business income. The benefit of the lower rate is phased out as taxable income rises to $1.5 million. As announced in the 2007 Ontario Economic Outlook and Fiscal Review, the active business income level was increased from $400,000 to $500,000 and the taxable income level was increased from $1,128,519 to $1.5 million, effective January 1, 2007.
Exemptions, Deductions, Deferrals and Other Measures Shared with the Federal Government Items for Which an Estimate is not Available
Temporary Incentive for Manufacturing and Processing (M&P) Machinery and Equipment — The 2008 Ontario Budget proposed to extend this incentive by allowing eligible assets acquired in 2009 to be depreciated on a 50 per cent straight-line basis and those assets acquired in 2010 and 2011 on a declining balance basis. This parallels the 2008 federal budget initiative.
Donations of Medicine for the Developing World — Corporations that make donations of medicine from their inventory may claim an additional charitable deduction equal to the lesser of 50 per cent of the difference between the value of the donated medicine and its cost, and the cost of the medicine. For donations after June 30, 2008, the definition of an eligible charity is changed to a registered charity that, in the opinion of the federal Minister of International Cooperation, meets conditions prescribed by regulation. The definition change parallels the 2008 federal budget measure.
Exemption for Capital Gains Arising from Certain Donations — Capital gains on gifts of publicly listed securities to a qualified donee are exempt from tax. In addition, capital gains on gifts of ecologically sensitive land to a qualified donee (other than a private foundation) are exempt from tax, as are capital gains on certain objects certified as being of cultural importance to Canada that are donated to a designated museum or art gallery. In certain circumstances, the capital gains exemption applies to gains from securities exchanged for publicly listed securities that are then donated to a qualified donee after February 25, 2008. Extending the exemption to exchanged securities parallels the 2008 federal budget initiative.
Annex V: Transparency in Taxation, 2008 63
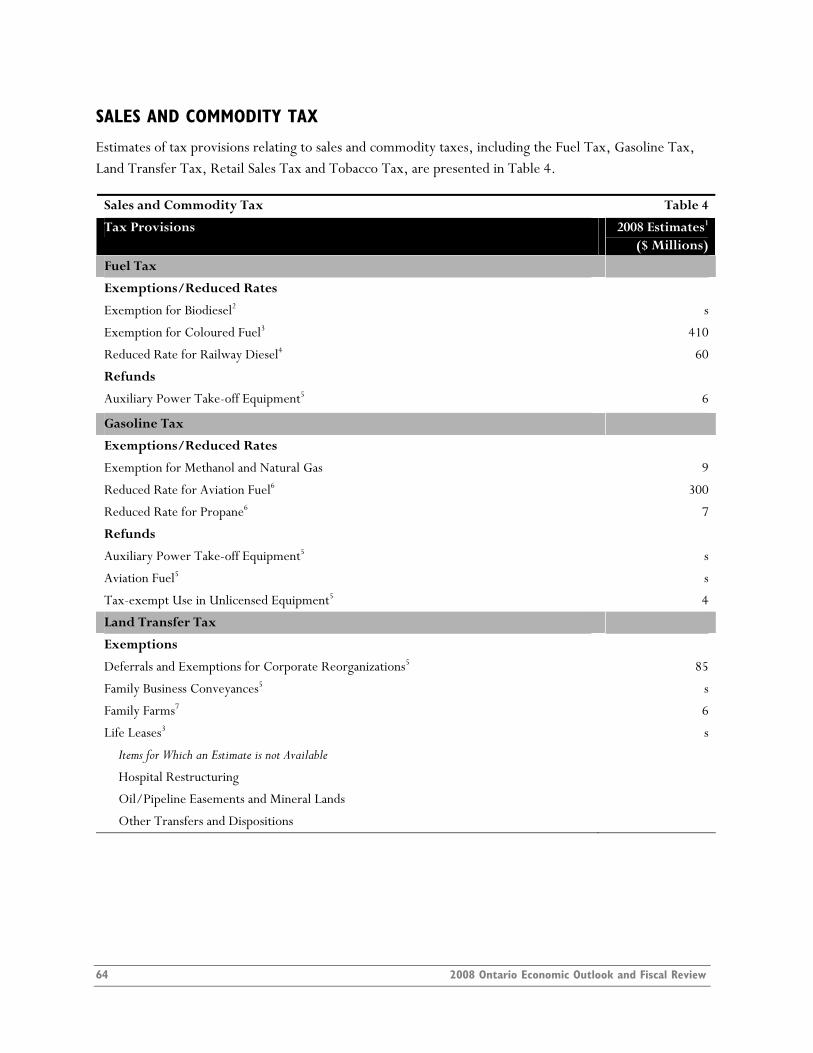
SALES AND COMMODITY TAX
Estimates of tax provisions relating to sales and commodity taxes, including the Fuel Tax, Gasoline Tax, Land Transfer Tax, Retail Sales Tax and Tobacco Tax, are presented in Table 4.
Sales and Commodity Tax Table 4
Tax Provisions 2008 Estimates1
($ Millions)
Fuel Tax
Exemptions/Reduced Rates
Exemption for Biodiesel2 s
Exemption for Coloured Fuel3 410
Reduced Rate for Railway Diesel4 60
Refunds
Auxiliary Power Take-off Equipment5 6
Gasoline Tax
Exemptions/Reduced Rates
Exemption for Methanol and Natural Gas 9
Reduced Rate for Aviation Fuel6 300
Reduced Rate for Propane6 7
Refunds
Auxiliary Power Take-off Equipment5 s
Aviation Fuel5 s
Tax-exempt Use in Unlicensed Equipment5 4
Land Transfer Tax
Exemptions
Deferrals and Exemptions for Corporate Reorganizations5 85
Family Business Conveyances5 s
Family Farms7 6
Life Leases3 s
Items for Which an Estimate is not Available
Hospital Restructuring
Oil/Pipeline Easements and Mineral Lands
Other Transfers and Dispositions
64 2008 Ontario Economic Outlook and Fiscal Review
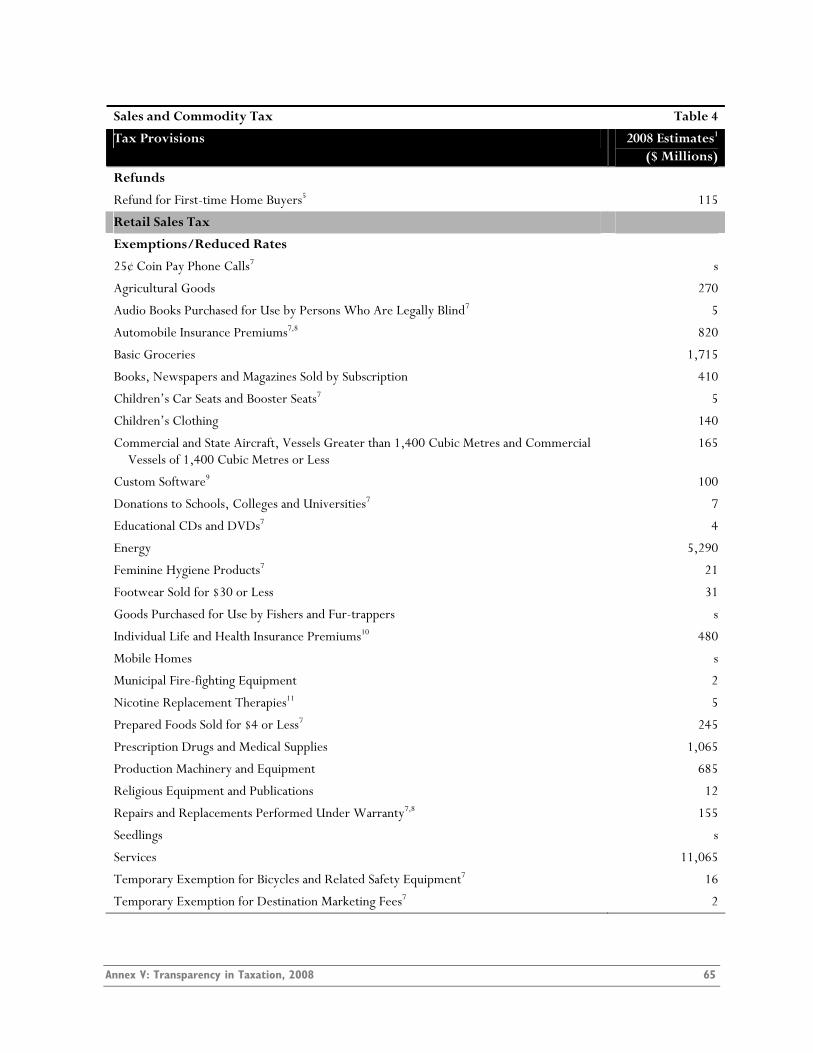
Sales and Commodity Tax Table 4
2008 Estimates1Tax Provisions ($ Millions)
Refunds
Refund for First-time Home Buyers5 115
Retail Sales Tax
Exemptions/Reduced Rates
25¢ Coin Pay Phone Calls7 s
Agricultural Goods 270
Audio Books Purchased for Use by Persons Who Are Legally Blind7 5
Automobile Insurance Premiums7,8 820
Basic Groceries 1,715
Books, Newspapers and Magazines Sold by Subscription 410
Children’s Car Seats and Booster Seats7 5
Children’s Clothing 140
Commercial and State Aircraft, Vessels Greater than 1,400 Cubic Metres and Commercial Vessels of 1,400 Cubic Metres or Less
165
Custom Software9 100
Donations to Schools, Colleges and Universities7 7
Educational CDs and DVDs7 4
Energy 5,290
Feminine Hygiene Products7 21
Footwear Sold for $30 or Less 31
Goods Purchased for Use by Fishers and Fur-trappers s
Individual Life and Health Insurance Premiums10 480
Mobile Homes s
Municipal Fire-fighting Equipment 2
Nicotine Replacement Therapies11 5
Prepared Foods Sold for $4 or Less7 245
Prescription Drugs and Medical Supplies 1,065
Production Machinery and Equipment 685
Religious Equipment and Publications 12
Repairs and Replacements Performed Under Warranty7,8 155
Seedlings s
Services 11,065
Temporary Exemption for Bicycles and Related Safety Equipment7 16
Temporary Exemption for Destination Marketing Fees7 2
Annex V: Transparency in Taxation, 2008 65

Sales and Commodity Tax Table 4
2008 Estimates1Tax Provisions ($ Millions)
Temporary Exemption for Energy Star® Household Products7 55
Toll-free Telephone Services7 50
Transient Accommodation12 120
University Research Equipment 7
Items for Which an Estimate is not Available
Admissions13
Modular Homes
Municipal, Hospital Restructuring
Used Adult Clothing or Footwear Sold for $50 or Less by Religious, Charitable, Benevolent and Non-profit Organizations
Works of Art Purchased by Museums and Art Galleries
Credits/Rebates
Rebate for Alternative Fuel Vehicles5 6
Rebate for Building Materials for Religious, Charitable and Benevolent Organizations5 20
Tax Credit for Fuel Conservation7 7
Temporary Rebate for Solar Energy, Wind Energy, Micro Hydro-electric and Geothermal Energy Systems5
1
Vendor Compensation14 110
Tobacco Tax
Compensation for Tax Collectors14 s 1 Estimates are forecast to the 2008 calendar year based on preliminary 2004 provincial Input–Output tables from
Statistics Canada, unless otherwise noted. 2 Based on estimated amount of biodiesel sold in Ontario. 3 Based on best tax administration data currently available. 4 Forgone revenue estimated as difference from the general fuel tax rate. 5 Based on refunds filed or rebates/deferrals claimed. 6 Forgone revenue estimated as difference from the general gasoline tax rate. 7 Based on the best information currently available from a variety of sources, such as industry data and Statistics Canada
surveys, projected to 2008. 8 Estimates assume items would be taxed at eight per cent general RST rate. 9 Based on Statistics Canada Computer Software and Related Services Industry Revenue Profile. 10 Based on insurance premiums data provided by the Canadian Life and Health Insurance Association Inc. 11 Based on Statistics Canada CANSIM Table 105-0055: Smoking Cessation Aids. 12 Transient accommodation is taxed at a reduced rate of five per cent. Forgone revenue estimated as difference from the
general RST rate of eight per cent. 13 Includes the exemption for admissions to live theatres with 3,200 seats or less, which is estimated to cost $18 million per
year. There are currently no data available to the Ministry of Finance for the cost of other admissions exemptions of general application.
14 Based on returns filed by registered tax collectors.
66 2008 Ontario Economic Outlook and Fiscal Review

SALES AND COMMODITY TAX — DESCRIPTION OF TAX PROVISIONS
The following Sales and Commodity Tax provisions have changed since the 2007 Transparency in Taxation report.
Land Transfer Tax (LTT)
Exemptions Family Farms — The 2008 Ontario Budget announced the expansion of the LTT exemption for
conveyances of farmed land to include conveyances from family farm corporations to individual family members after March 25, 2008.
Refunds Refund for First-time Home Buyers — The 2007 Ontario Economic Outlook and Fiscal Review
announced the expansion of the refund program to include the purchase of resale homes. The maximum amount of the refund is $2,000 and the expansion is effective for agreements of purchase and sale entered into after December 13, 2007.
Retail Sales Tax (RST)
Exemptions/Reduced Rates Books, Newspapers and Magazines Sold by Subscription — As announced in
December 2007 and noted in the 2008 Ontario Budget, the definition of “newspaper” is being expanded to enable publications with smaller circulation or less frequent publishing schedules, such as community and ethnic newspapers, to qualify for the RST exemption for newspapers. The expanded definition will be retroactive to January 1, 2000 once the regulation is finalized.
Nicotine Replacement Therapies — The 2008 Ontario Budget made permanent the RST exemption for nicotine replacement therapies registered with a Health Canada Drug Identification Number or Natural Product Number.
Temporary Exemption for Bicycles and Related Safety Equipment — The 2008 Ontario Budget extended the temporary RST exemption for bicycles costing $1,000 or less and related bicycle safety equipment to purchases made on or before December 31, 2010.
Temporary Exemption for Destination Marketing Fees — The 2008 Ontario Budget extended this exemption by two years. Destination marketing fees charged on transient accommodation are temporarily exempt from RST until June 30, 2010.
Annex V: Transparency in Taxation, 2008 67
Temporary Exemption for Energy Star® Household Products — The 2008 Ontario Budget extended the temporary RST exemption for eligible Energy Star® qualified household appliances and light bulbs to purchases made on or before August 31, 2009 (with delivery of appliances on or before September 30, 2009).
Items for Which an Estimate is not Available Admissions — A number of RST exemptions are available for admissions. The 2008 Ontario
Budget made permanent the RST exemption on admissions to live theatres with not more than 3,200 seats that present live dramatic, comedic, choreographic or musical performances, including a live theatrical play and a live ballet, orchestral or operatic performance.
68 2008 Ontario Economic Outlook and Fiscal Review

EDUCATION PROPERTY TAX
Table 5 provides estimates of tax provisions relating to the Education Property Tax system.
Education Property Tax1 Table 5 Tax Provisions 2008 Estimates2
($ Millions)
Brownfields Financial Tax Incentive Program3 s
Charity Rebate 7
Conservation Land Property Tax Exemption Program 2
Eligible Convention Centres Exemption s
Eligible Live Performance Theatres Exemption and Professional Sports Facility Tax Rate Reduction
13
Farm Property Class Tax Rate Reduction 65
Farmlands Awaiting Development Sub-class Tax Rate Reduction s
Heritage Property Tax Rebate s
Managed Forest Tax Incentive Program 3
Seniors and Persons with Disabilities Property Tax Relief 4 s
Tax Exemptions Under Private Statutes 6
Vacant Commercial and Industrial Unit Rebate 31
Vacant Land and Excess Land Sub-class Tax Rate Reduction 48
Items for Which an Estimate is not Available
Other Tax Exemptions Under Public Statutes
Discretionary exemptions granted by municipalities to special purpose properties (e.g., legions, navy leagues, public–private capital facilities)
Mandatory exemptions granted to special purpose/institutional properties (e.g., places of worship, cemeteries, Boy Scouts Association of Canada and Canadian Girl Guides Association, charitable institutions including Canadian Red Cross, St. John Ambulance and charitable, non-profit philanthropic corporations organized for the relief of the poor)
Relief from Property Taxes That are Unduly Burdensome for Residential, Farm or Managed Forest Properties
1 Expenditures related to provincial land taxes or payments made in lieu of taxes have not been included. 2 Estimates based on 2008 education tax rates, 2008 Assessment Roll, 2006 Municipal Financial Information Returns
and municipal tax policies. 3 Effective October 1, 2004, municipalities may pass bylaws cancelling municipal property taxes on eligible brownfields
properties. The Province may match the municipal reduction with an education property tax reduction. 4 Estimate does not include expenditures due to the exemption from taxation on 10 per cent of the assessment of
improvements to accommodate seniors and persons with disabilities in newly built homes or the expenditure on such improvements in existing homes.
Annex V: Transparency in Taxation, 2008 69
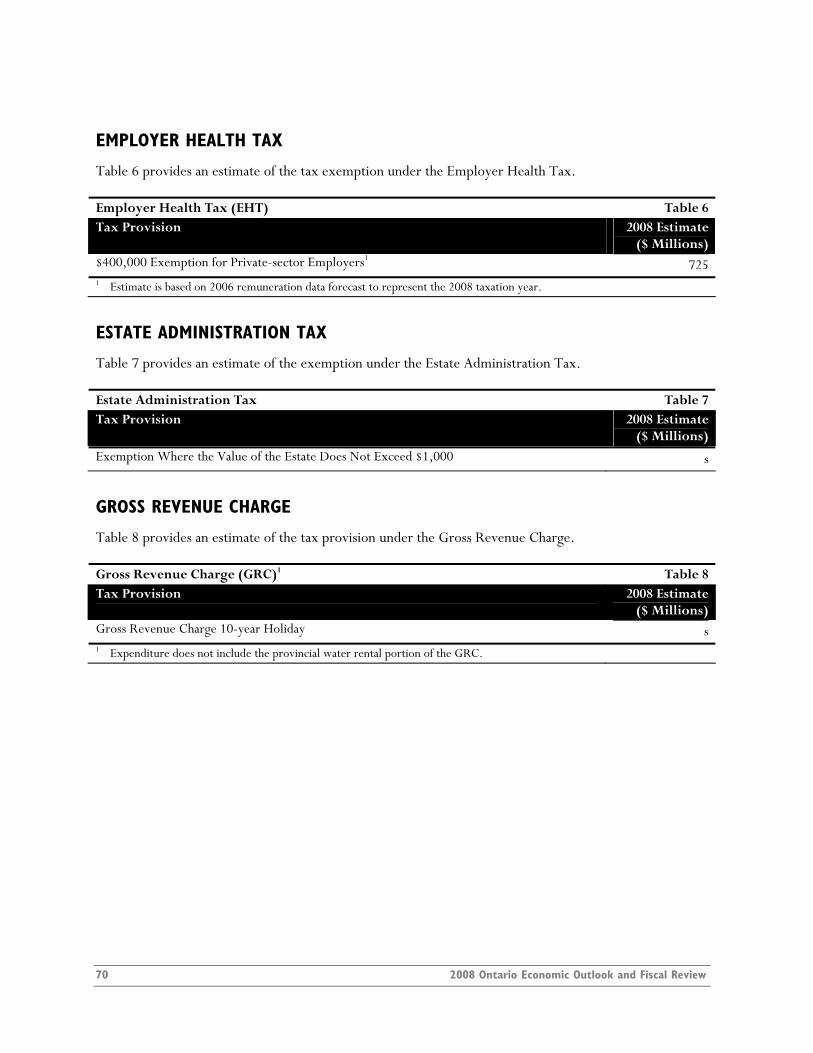
EMPLOYER HEALTH TAX
Table 6 provides an estimate of the tax exemption under the Employer Health Tax.
Employer Health Tax (EHT) Table 6 Tax Provision 2008 Estimate
($ Millions) $400,000 Exemption for Private-sector Employers1
725 1 Estimate is based on 2006 remuneration data forecast to represent the 2008 taxation year.
ESTATE ADMINISTRATION TAX
Table 7 provides an estimate of the exemption under the Estate Administration Tax.
Estate Administration Tax Table 7 Tax Provision 2008 Estimate
($ Millions) Exemption Where the Value of the Estate Does Not Exceed $1,000 s
GROSS REVENUE CHARGE
Table 8 provides an estimate of the tax provision under the Gross Revenue Charge.
Gross Revenue Charge (GRC)1 Table 8 Tax Provision 2008 Estimate
($ Millions) Gross Revenue Charge 10-year Holiday s 1 Expenditure does not include the provincial water rental portion of the GRC.
70 2008 Ontario Economic Outlook and Fiscal Review
ANNEX VI How to Participate in the
2009 Pre-Budget Consultations
Annex VI: How to Participate in the 2009 Pre-Budget Consultations 71

72 2008 Ontario Economic Outlook and Fiscal Review

HOW TO PARTICIPATE IN THE 2009 PRE-BUDGET CONSULTATIONS
The Minister of Finance will be hosting pre-budget consultations with individuals, organizations, associations and other stakeholders across the province as part of the government’s ongoing dialogue with the citizens of Ontario.
In particular, the Minister is interested in hearing Ontarians’ views on what more the government can do during uncertain economic times to prudently manage Ontario’s finances and protect important public services.
When preparing your comments, please consider the following questions:
1. During this period of global economic uncertainty and fiscal challenges, what should the Ontario Government’s top priorities be for the 2009 Budget?
2. During uncertain economic times, should the Ontario Government work towards achieving a balanced budget or run a deficit in order to do everything it can to protect priority programs and services?
3. Given the current fiscal challenges, what government programs could be delayed, phased in more slowly, or eliminated?
4. What further steps can the Ontario Government take to promote economic growth and job creation?
5. How can the Ontario Government work more effectively with other levels of government and other key partners during challenging economic times?
Information on which communities and locations the Minister plans to visit will be posted at www.fin.gov.on.ca in late October 2008. Individuals who wish to attend one of these consultations can call toll-free 1-800-263-7965 or 1-800-263-7776 TTY.
The information below describes how to participate in the 2009 pre-budget consultations.
SUBMISSIONS
Visit the Ministry of Finance website at www.fin.gov.on.ca to submit your ideas for the 2009 Budget. Click on the “Tell Us What You Think” item in the What’s New menu and complete the form provided.
Submissions may also be e-mailed to [email protected], sent by fax to 416-325-0969 or mailed to: The Honourable Dwight Duncan, Minister of Finance, c/o Budget Secretariat, Frost Building North, 3rd Floor, 95 Grosvenor Street, Toronto, ON M7A 1Z1.
Annex VI: How to Participate in the 2009 Pre-Budget Consultations 73