c. ai.ijourna1 of hydrology is8-is9 (1997) 179-202 j. journal
TRANSCRIPT

,. -. -4
202 C. Peugeot et aI.IJourna1 of Hydrology IS8-IS9 (1997) 179-202
Thiéry, J.M., D’Herbes, J.M. and Valentin, C., 1994. A model simulating the genesis of banding patterns in Niger. J. Ecol., accepted for publication.
Tromble, J.M., Renard, K.G. and Thatcher, AP., 1974. Infiltration for three rangeland soil-vegetation com- plexes. J. Range Management, 27(4): 318-321.
Valentin, C., 1981. Organisations pelliculaires superficielles de quelques sols de région subdésertique (Agadez- Niger). Dynamique de formation et conséquences sur I’économie en eau. Thèse, Université de Paris, pub- lished in 1985. ORSTOM, Paris, Collection Etudes et Thèses, 259 pp.
Valentin, C., 1993. Soil crusting and sealing in West Africa and possible approaches to improved management. In: Soil tillage in Africa: needs and challenges, FAO, Soils Bull., 69: 95-128.
Valentin, C. and Bresson, L.M., 1992. Morphology, genesis and classification of surface crusts in loamy and sandy soils, Geoderma, 55: 225-245.
Vandervaere, J.P., Peugeot, C., Angulo Jaramillo, R., Vauclin, M. and Lebel, T., 1997. Estimating hydraulic conductivity of crusted soils by using disc infiltrometers and micro-tensiometers, this issue.
Yair, A. and hvee , H., 1990. Runoff generation in arid and semi-arid zones. In: Anderson M.G. and Burt T.P. (Editors), Hydrological Forecasting. Wiley, Chichester, pp. 183-220.
Yair, A., Lavee, H., Bryan, R and Adar, A., 1980. Runoff and erosion processes and rates in the Zin valley badlands, Northern Negev, Israel. Earth Surface Processes, 5: 205-225.
‘
.,
I ’ j. !
i
i
I
! !
i I
I
f i I
1
I
I
Journal of Hydrology
Joorn:iI or llytlrolo~y 188- I89 (1997) 203-223 ELSEVI ER
. Estimating hydraulic conductivity of crusted soils using disc
infiltrometers and minitensiometers
Abstract
Although soil crusting has long been recognized ;is :i crucial runoff factor in the Sahel. very few field methods have hecn developed for the nieiisurenicnt of the crust hydríiulic conductivity, which is rlil‘licult to nchicve hcc:itise ol‘ the sni:ill thickncss of most surface crusts. A field method. based on the siniult;ineous use of disc intilrronicicrs niid niinitensionicters is proposed for determining the crust hydr:iulic contluctivity and sorptivity nciir s;itur;ition. On crusted soils, the classical analysis of the steady state water flow was found io be in:idequate. The proposed ineihod is based on sorptivity measurements performed at different water supply potentials and uses recent developments of irxnsient Ilow analysis. A niiniteiisiomcter, placed horizontally nt the crust-subsoil interface. Facili- tated the ;inalysis of the infiltr;ition regime for the crust solely.
Rcsults :ire shown for represent;itiw soil units of the East Ceritrd Super Site of the HAPEX-SahcI cxperiincnt: (‘ullov: gr Innds. riiillct liclds :ind tiger bush. Non-crusted soils were also considered ;nid v:ilitl:itcd the transiciif riiethod ;is dciiioiistr;itcd by conip:irisoti with Wooding’s steady stare solution. This wlidatitrn wis oht:iinctl in tlic c;ise of fallow gr;issl:inds soil but not for the millct fields. In this latter c;isc, the persistent effects of locnlizetl working of the soil to remove weeds catiscd Inrgc v;iriations in inliltr;ition Iluxcs between the sampling points, which tended to dominate over effects of differences in :ipplictl porential. For lhe tiger birsh crusfctl soils. the ratio of the s;iturutcd hyclr:iulic contluctivity cil‘ tlic crust to thnt of the underlying soil ranges from 113 to 116. depending on whether the crust is of:i structur:il (ST) o r sedimentation (SED) type. The method also allows the estimation of :i functional mean pore size. consistent with laboratory measurements. and 40% less for the crusts in comparison with the underlying soil.
Thc results obtainctl here will be used in hydrological models to predict the partition of rainfall between infiltration and runoff.

I I' c
20.1 J.-P. Vandenaerr el nl./Joiirnal of Hydrology 189-189 (1997) 203-223
1. Introduction
To model the interactions between the continental biosphere and the atmosphere, esti- mation of the water balance components requires knowledge of the hydraulic properties of the soil including the relationship between unsaturated hydraulic conductivity, K, and the soil water pressure, h, or the soil volumetric water content, O.
Tension disc infiltrometers have become an increasingly popular device for in-situ measurement of K close to natural saturation (Clothier and White, 1981; Perroux and White, 1988; Thony et al., 1991; Mohanty et al., 1994). and papers which compare results obtained from different data analysis methods recently appeared (Hussen and Warrick, 1993; Logsdon and Jaynes, 1993; Cook and Broeren, 1994). More convenient to perform than internal drainage experiments, the methodology is an ideal tool for spatial variability studies and, additionally, it provides estimates of physical variables such as capillary sorptivity, and different characteristic time and length scales.
Based on properties of three-directional axisymmetric infiltration, most existing analy- tical analysis methods for disc infiltrometer data require the attainment of steady state flow, for which a simple two-term expression was fbund (Wooding, 1968). Assuming an exponential relationship between K and 12 (Gardner, 1958):
K = K, exp(aH) (1)
where K, is the saturated hydraulic conductivity and (Y is a shape factor related to a functional pore size (Philip, 19871, Wooding showed that the unconfined steady state flux density averaged over a source area of radius I' can be approximated by:
(2)
where bris the water pressure head at the surface (h,.S O) and Q is thc matric flux potential defined by:
. (3)
where the subscripts "i" and "I" refer to initial and boundary supply pressure conditions. respectively.
The hydraulic conductivity can thus be calculated, cither by using different source radii (Scotter et al., 1982; Thony et al., 1991). or by using multiple supply potentials with the same disc (Reynolds and Elrick, 1991; Ankcny et al., 1991). However, the restrictive assumptions underlying Wooding's solution, i.e. homogeneous and isotropic soil with a uniform initial moisture content, may lead to unrealistic results including negative values of K (Hussen and Warrick, 1993; Logsdon and Jaynes, 1993).
During the HAPEX-Sahel experiment (Goutorbe et al., 1994), the main difficulty in using steady state infiltrometer methods was the presence of s u r r m crusts which play ;I major role in the hydrology of the Sahelian zone as shown by many authors (Hoogmoed and Stroosnijder, 1984; Casenave and Valentin, 1989; Casenave and Valentin. 1992). Indeed, the partition between infiltration and runoff at the surface of a crusted soil depends on the hydrodynamic properties of both the crust and the underlying soil. While many
I
J.-P. Vflndervnere el nl./Journnl of Hwlrology 188-189 (1997) 203-223 205
attempts at quantifying the effect of a surface crust on one-dimensional infiltration have been reported (Hillel and Gardner, 1969, 1970; Ahuja, 1974; Smiles et al., 1982; Parlange
not been performed on crusted soils. We found that classical methods of analysis applied to infiltration tests faCfor crusted soils, leading to unrealistic values of K and Q in almost all cases. Indeed, steady state infiltration into a crusted soil involves a complex combina- tion of the hydrodynamic properties of both layers. While it is only the crust properties which play a role at early stages. the hydraulic conductivity of the crust-soil system tends
developed a specific methodology using a minitensiometer placed at the crust-subsoil interface with transient flow analysis of infiltration into the crust only. The main motiva- tion for this study is in the fact that knowledge of the hydraulic properties of both the crust and the subsoil allows the infiltration of rainfall under any conditions of intensity and duration to be modelled.
i !
j l et al., 1984), to our knowledge field experiments under axisymmetric flow conditions have
I to that of the subsoil at long times. Therefore, to estimate the conductivity of the crust, we i
i !
2. Theory
The proposed method is based on sorptivity determinations obtained by analyzing transient flow from disc infiltrometer experiments performed at different water supply potentials, /iI. For each test, matric flux potential is calculated from the corresponding sorptivity value and hydraulic conductivity is obtained by differentiating the matric llu\ potcntial with respect to hr.
2. I. Trrriwierrt j I m * rind sorp/ii*ity
I While one-dimensional soil infiltration is well described analytically, there were. until
recently, few theoretical works on three-dimensional unconfined infiltration for a disc source. Turncr and Purlnngc ( 1974) colculnted an approsimate analytical solution for the latclnl movement ;it the pcriphcry of ;I onc-climcnsionnl water flow. Warrick :incl Lomcn (1976) proposed nn csprcssion for the matric flux potential ;IS a function of t i m valid for ;t disc source and ;i 'u-soil'. thal is, dcscribcd by Eq. ( I ) . Cumulative infiltration ;is ;I function of time in asisymmctric conditions con also be predicted by numcric;il moclcls (e.g. Warrick. 1902: Quadri et al., 1994) which rcquirc the complete soil hydro- dynamic description. Their use with the objective to determine the soil's hydraulic con- ductivity through invcrsc procedures is thus complicated by thc nuniber of parameters to bc cstitnatcd and subsequent problems dealing with possible non-uniqueness of the solution.
Howcvcr. rcstrictions i n the use of Wooding's equation, uncertainties about the time at which steady infiltration flux is attained, together with the fact that much nscful information is lost by ignoring the transient stage have strengthened the nccJ for a transient three-directional infiltration equation for disc infiltrometers. Two expressions were recently proposed for this purpose (Warrick, 1992; Haverknmp et al., 1994). having i n common that the supplementary term introduced by considering unconfined edge flow is linear with time. Then. the expression of Philip (1957) for
I

206 J.-P. Vandervaere el al./Jonmal of Hydrology 188-189 (1997) 203-223
one-dimensional infiltrated depth, Il,$
I l d =S f i + A t (4)
I,, =S'fi+ (A + B)t
where t is time, S is the capillary sorptivity, and A is a constant (LT-I), is modified into:
(5)
where I,, is the cumulative three-directional infiltrated depth and B is a constant expressed by (Haverkamp et al., 1994):
(6)
where y is a dimensionless constant and B i and Of are initial and final volumetric water content, respectively. Sorptivity can be determined from either non-linear fitting of Eq. (4) or Eq. (5) to field data (Bristow and Savage, 1987) or, as suggested by Smiles and Knight (1976). as the intercept of the regression of Z/J? against fi, using one of the following expressions:
YS' 4 0 , - 4)
B= ~
I l d - \/i - - S + A fi
for one- and three-dimensional cases, respectively. To ensure the hydraulic contact between the disc infiltrometer and the soil, it is often
necessary to place a fine layer of sand at the soil surface. Because of this layer, methods using cumulative data, including that of Smiles and Knight, are compromised. This is particularly the case for low permeability soils, due to the relatively large amount of water stored at early time in the sand. Indeed, taking this effect into account modifies'Eq. (5) into:
where Io and t g are, respectively, the depth of water and the time necessary to wet the sand layer in equilibrium with hr. Then, Eq. (7) becomes:
(9)
When Ill is large compared with S, A. and B, that is when the soil has low conductivity and sorptivity, the relationship between I ~ , J / J ? and fi is far from linear due to the effect of the first term in the right-hand side of Eq. (9).
The influence of the sand layer is usually neglected in steady state situations and it is generally assumed that it has no effect on the final flux value. Eq. (8) shows that this influence should be taken into account for transient flow analysis, especially when a large amount of sand is applied to overcome surface roughness. Rather than analyzing cumu- lative infiltration data, a way to circumvent the need for lo is to differentiate the cumulative infiltration with respect to the square root of time. Performing this differentiation on
I J.-P. Vandervaere el al./Journal of Hydrology 188-189 (1997) 203-223 207
i Eq. (5) yields: l
and for Eq. (8), the result is:
(11)
The difference between Eqs. (9) and (1 1) is that the latter one is not influenced by Io and the correction due to to quickly becomes small as time increases.
Sorptivity, initially introduced as the variable driving horizontal absorption, is com- monly considered to control the early stages of vertical infiltration as well, when the effect of gravity is minor. S depends on both initial and boundary conditions. Although its exact analytical expression is not known, many approximations have been proposed (Elrick and Robin, I98 1 present a review of these). White and Sully (1987) showed that S is related IO
the niatric flux potential through the expression:
!
where h is a parameter depending on the shape of diffusivity and having a value in the range 1/2 I b 5 d4. A reasonable intermediate value of 0.55 can be taken for most field (Smcttem and Clothier, 3989) and theoretical (Warrick and Broadbridge, 1992) situations. No dependence of the b parameter on hi was considered in our study.
2.2. Frotti sorptii~ity to contlirctii~it~
i Following Smiles and Harvey (1973). White and Perroux (1989) proposed to estimate conductivity values from sorptivity measurements performed at different supply water potentials. Indeed, Eq. (3) shows that K can be deduced by differentiation of 4, against /i$
(13)
I whcrc Ki is ncgligihlc as comparcd with K I in most ficlcl situations. Combination of Eqs. ( 12) and ( 13) enables deducing k' from two or more S values. To use, simultaneously. thc cntirc set of (+, /I,) dato oht:iinecl for each test by Eq. (12). an analytical forni of thc +(/i ,) function is required. It is convcnicnt to kecp the exponential form of Eq. (I) for its ease of integration, which gives:
(14)
Parlange (1972) claims that a should not be considered as a constant over the whole range of h. Thus, i t is simply assumed here that variations of a with /ilare small within the range of potentials covered by the suction disc infiltrometer (typically between O and 150 nim of water). Moreover, i t must be assumed that the decrease in a for h - /il, which is very
K, @(/I)= -exp(a/i) a

J.-P. Vtrirdenwere el ctl./Jiiemal of 1~ydroIo.rg 188-189 (1997) 203-223 209
replications to obtain reliable estimates. Indeed, the slope of the CP(hr) relationship must be estimated with enough accuracy for the differentiation operation to be performed (see Eq. ( 13)). The scatter in the @(hJ dataset may be important as a result of the use of squared sorptivity values.
These difficulties may explain why most of the authors have used classical steady state methods when they are applicable. It seems that only Cook and Broeren (1994) compared conductivities obtained in-situ from steady state methods with those obtained from the WP method. Thus, it appeared suitable to perform a comparison between WP and steady state approaches on non-crusted soils before applying the former one to crusted soils.
208 J.-P. Vairdenmere e l nl./Jaimml nf Hydrolop 188-IS9 (1997) 203-223
likely, has little effect on the total area covered by CP between hi and /if. This assumption is justified if the K(h) function is concave upwards.
Eq. (14). which can be fitted to the experimental values for an estimation of K, and (Y,
has the advantage to provide, through the (Y parameter, an effective pore size (A,) from simple capillarity theory (Philip, 1987):
f f a A,, = - Pg
where o is surface tension, p is water density, and g is acceleration due to gravity.
which gravitational forces dominate capillary effects (Philip, 1969): Knowledge of sorptivity and conductivity enables estimation of tgrdv. the time after
2.3. Error airalwis I ”\ z
Logarithmic differentiation of Eq. (12) yields:
(20) dCP db dS d8f d8i -=-+2-+-+- CP b S 8, Bi
The standard error due to the use of the approximate value of 0.55 for the parameter b is difficult to estimate. The theoretical range 1/2 5 b 5 d4 corresponds to a maximum error and not to a standard deviation. A value of 0.1 for the relative error of b was arbitrarily taken in this study. For each test. the error on S determination, as the intercept of the line corresponding to Eq. ( I I ) , is given by the regression analysis. The errors made on 0 estimations (wet and dry weighing of samples, bulk density estimation) were found to be negligible as compared with the previous errors.
The logCCP values ;ire plotted against h l to detcrrnine the parameters K, and a by fitting the linearized form of Eq. (13):
Fort << tgra,.. Eq. (4) can be reduced to its first term:
I l d =sJ7 (17)
This provides yet another sorptivity estimate, SI. by knowing the installation depth of the minitensiometer. 21. and the time, t l . at which it is reached by infiltrating water. Assuming a ‘Green and Ampt’ behavior, the integral defining S:
where : is depth and is the volumetric water content of the crust at I , . becomes:
log,.CP=log,. (2) +ah, As the infiltration is pursued long after il. 8, is not ne‘cessarily equal to Brmeasured at the end of the experiment. Indeed, the water content of the crust may still increase after t l and the gradient of O behind the welting front might be significant. Consequently, O1 has to be calculated from the cumulative infiltration I l at the instant tI, subtracting the amount of water stored into the contact layer (estimated by knowing the volumc and the porosity of the sand) and the amount of water corresponding to the edge effect (estimated by lateral wetting front measurements at I I and nssuniing a parabolic profile into the soil around chc disc).
Nevertheless, the uncertainty in II is the main source of poor accuracy on SI estimates and values calculated by Eq. (19) do not provide good estimates of CP by Eq. (13). However, their comparison with values obtained from Eq. ( I I ) allows any systematic bias to be checked, as well as revealing the potential for water blockage at the crus[- subsoil interface.
Due to the usual difficulties in field measurements of sorptivity, little use was made of the White and Perroux (WP) method. Here, an entire set o f S estimates is used to fit a single relationship between CP and h f , but because of the need for a same initial water content for all measurements, tests must be performed at different locations. Consequently, spatial variability of S (Talsma, 1969; Sharma et al.. 1980) may require a large number of
For the sake of simplicity. we put:
ß=log,. (2) (22)
Becxisc each point was ohtnined nt a single spot, the errors on K, and a due to scatter of [he dnta account for spatial variability of soil properties, causing a location error. Thc linear regression analysis gives standard deviation errors. ACY and AB, on the slope a and the interccpt ß, respectively.
Dcfinc thc following bounds:
at = a i - A a (23)
ß ‘ = ß + A ß
ß - = ß - A ß

210 J.-P. Vufidcrwrere el nl./Joenrol of Hjilrolop IS8-IS9 (1997) 203-223
According to Eq. (22), K , is simply calculated by:
K, = CY exp ß (27)
It should be noted that the errors made on the intercept ß and the slope CY cannot be considered as independent. Indeed, if the slope is overestiniated for example, the intercept is very likely to be overestimated also (since h l values are in the negative domain of the abscissa axis). Consequently, the location error made on K , estimates is maximized by the product operation between CY and ß. There is no analytical expression for the error of the product of variables affected by non-independent errors. Thus, only the following bounds can be obtained:
K: =CY+ expß' (1s)
Kh7 =CY- exp ß- (291
The location error on K , is log-normally distributed and characterized by a factorfdefincd by:
(30)
(31)
3. Materials and methods
Millet crops and fallow grasslands covers are found, on sandy soils, all over the East Central Super Site of the HAPEX-Sahel experiment, except on the plateaus. Thus. they represent the main soil feature to be considered in the study of the biosphere-atmosphere interactions and their hydrodynamic characterization is essential for modeling purposes (Braud et al., 1997). Millet and fallow soils are subject to crusting (Casenave and Valentin, 1989). In non-crusted areas, soil can be considered to be vertically homogeneous.
The tiger bush, covering lateritic plateaus is characterized by il sandy-loamy-clay soil with a small hydraulic conductivity, producing high vnlucs of runoff, increased by the existence of large crust-covered areas separating vegetative strips. During the rainy season (June-September 1993). two types of crust, structural (ST) and sedimentation (SED), were selected for their spatial representativity and their ease of identification. The former can be found downslope of the vegetative strips and are fornied by the sieving effect of raindrop impacts which concentrate fine particles at the basis of the structure with sand on top. Gravels are frequently included at the surface (type ST3. following the classification proposed by Valentin and Bresson, 1992). SED crusts, abundant in zones of accumulation of water, are found upslope of the vegetative strips and are formed by sedimentation of particles in small pools after rainfall events. Detailed description and analysis of Sahelian soil crusting is given in Casenave and Valentin (1989) and Valentin and Bresson (1 992). Infiltration tests were also performed on the underlying soil to estimate difference in

212 J.-P. Vairdenwcre er nlJJonniu1 of Hjdrolofi?. ISS-IS9 (1997) 203-223
estimation with the small disc infiltrometer (D?), is quite inaccurate as the first term at right-hand side in Eq. (5) becomes relatively small as the radius decreases (see Eq. (6)). Thus, the sorptivity estimations used for this study were all obtained with D1. Because of the fragility of the CIUS~S, the minitensiometer cannot be installed in dry conditions without the risk of significant soil disturbance (detachment, fracture, or cracking). Consequently, i t was necessary to drill a hole into the soil, while injecting by small increments a total of about 1 cm3 of water with a syringe. Installation of the tensiometer into this hole and infiltration test were performed 24 h later when the soil has dried. The porous cup was inserted at about I cm depth (its exact depth was mensurcd after the test), a i nhout niid- distance between the center and the edge of the disc (Fig. 2). Fig. 3 shows the mini- tensiometer under a SED crust after an infiltration test.
A ring of the same radius as the disc infiltrometcr was placed on the soil surface and sand was placed in i t and leveled. The quantity of sand was measured to estimate Irl in Eq. (8) and to in Eq. ( I 1). The disc infiltrometer was then placed on this bed ofsand and the cumulative infiltration was monitored. During infiltration, the tcnsiomctcr response IO the arrival of the vertical wetting front, defined by the masimuni of ahlat. faciliiatcs restricting the analysis to the stage corresponding to the crust only. At that nionient ( I [ ) the progression of the lateral wetting front at the surface was also rneasured to estilnate the ratio, I
In order to quantify the deficit of moisture in the'subsoil dire to the crust iinpcding effect, infiltration tests were continued al'ter I 1, until tlic tcnsiomctcr showed an approxi- mately constant soil water pressure. At the end of every test, disturbed soil saniples were taken at two depths and also around the disc for dctcrmina[ion of final gravimetric water content. Two sampling operations were systematically performed. with about 30 s intcr- val, so that the effect of the delay of sampling after lhe pmoval of tlic disc could be estimated (a decrease of about 0.0 I g g-' w x found).
Gravimetric water contents were converted into volumetric values through dry bulk density (pd) measured from undisturbed samples collected at the end of the season, fol- lowing the method proposed by Fies and Zimmer (1982). Due to the impossibility to take undisturbed samples of ST crusts, a iralue of 1.7 g cm" was calculated by assuming a
J.-P. V~i~r,,~lcri~ticre CI d / J i ~ i r i r c i l i$ H~~l,oli1.~3 188- IS9 (1997) 203-223 213
sliccilic clcnsiiy o f 2.05 l'or the wlicls atid assuiiiirig tlixt iiic;isuiwI saturated gliivimekic water ccintcnt represents 85% of porosiily (this pcrcciit:igc W;IS olitainctl l'rom other crusi types). I.lo\vcvcr, this is ;I iiiiiior unccrt;iinly conip;irccl with other sourccs o f error.
l n the tiger hush, 59 inli lwarion tcsts were pcrforniccl with the disc DI. including 20 on ST crlIsIs, 23 o11 SI'D crusts, ancl 16 o11 the undcrlying soil.
4. Iiesults ;1nd tliscussion
I:or [lie I'11low grasslariil. sorptivity and I I I : I ~ ~ ¡ C Ilus Iiotcntial cstirilatcs ohtai~ictl by EqS. ( I I ) ;lid ( II). rcsl9cctivcly. i\rc sliowii i n Fig. 4. together wi\h the + ( / I ) curve obtained by lirtiiig I.:q. ( 14) lo Ille c l i i i x lis clcrivativc (K(/r)) is plottecl iig;!inst results l'loin steady statc inciliotls iii Fig. 5. which shows thc good agrcciiicnt hct\vccn all the nictliods for the hillow. 13ot l i i i i t t l t i - r d i i m.1 iiitilri-liolciiti~il experiments cshihil :I sliil't in conductivity i icx saitiration. This cliaiigc ol' the general slopc, at hout -3) iiitii , is characteristic ol' a &hange i n l'unctionol porc size. Tlic N valucs. ahou[ I O Iii liir I r < - 20 inni and 40 ni-' for I r > - 20 111111. corrcsponcls i o iwrc r d i i of SO and 3.10 p i . rcspcctivcly. We attribute tlic shift to larger functional porc size to the inllucncc of grass roots. This shift does not ;ippc;ir with the transient iiicihw.1 result. ivliicli uses ;I single csponcnti;il function for the

214 J.-P. Vandenaere e! al./Journal of Hwlrology ISS-I89 (1997) 203-223
I 1
0.8 - 2 6 0.6
E 0.4
v) 0.2
,g
v
O -120 -100 -80 -60
potential (mm)
- b I c; E E e -
-120 -100 -80 -60 -40 -20 O I - ' - - I . . ....... - . - potential (mm)
Fig. 4. Fallow grasslands: (a) sorptivity iind tb) miric flus potr.nti:il ctilcu1atr.d (Eq. (12). triangles) and ,fitted (Eq. (14). continuous line). as a funclion of supply \vater polenlinl.
0.06
0.05
- 0.04
2 0.03 E
0.02
0.01
O
al
Y
J.-P. Vandervaere er al./Jownal of Hylrology 188-189 (1997) 203-223 215
-120 -100 -80 -60 -40 -20 potential (mm)
. -- _ _ .
-120 -100 -80 -60 -40 -20 O potential (mm)
. . . . . . ._ _ _ _ _ I ._... ...
whole domain. However, it is remarkable that the 'transient' (Y. 22 m-I corresponds to ;i
good mean value and that K, is almost unchanged (Fig. 5). For the millet cover. the trnnsicnt method was found to be inadequate due to the high
spatial variability of S. Indeed, the cffects of locnlizcd working of the soil act to increase the inliltration Ilux only for part of the tests. Peugcot et al. (1 907) found that these effects may persist up to SO nini ofrainfall. The slope of@ vcrsiis I r (Fig. 6(b)) cannot be estimatcd with rcasonablc accuracy, since the effects of spatial vnriability doniinate those of supply potentials. In such a case. the differentiation operation becomes hazardous and thus, i t is iinrcalistic to expect a correct estimation of conductivity. Consequently, the transient method should not be applied in the case of a high field hetcrogeneity, unless a very large nuiiibcr of tests is performed.
Fig. 5. Fallow grasslands: hydr;iulic conductivity as a function of w:iier pote1iti:il. by multi-radii analysis (XIRI. multi-poteniial analyses with the Iarzr. t DI I arid Ihr small I D 3 discs :inil mnsient analysis (Tr).
4.2. Crirsted soils: tiger O i r s I r
4.2.1. lnfi1trcition Fig. 7 shows, for a typical infiltration test carried out at II,.= - IO mm of water on a ST
cnist. measured ciiiiiulative infiltration and soil water pressure as a function of tinic
216 J.-P. Vnndmwere cf nlJJoiirnlt1 of Hwlro1og.v I8S-IS9 (1997) 203-223
10
8
Ê C E E 4
2
O
O -50 -100 -150 Ê -200 g -250 -300 -350
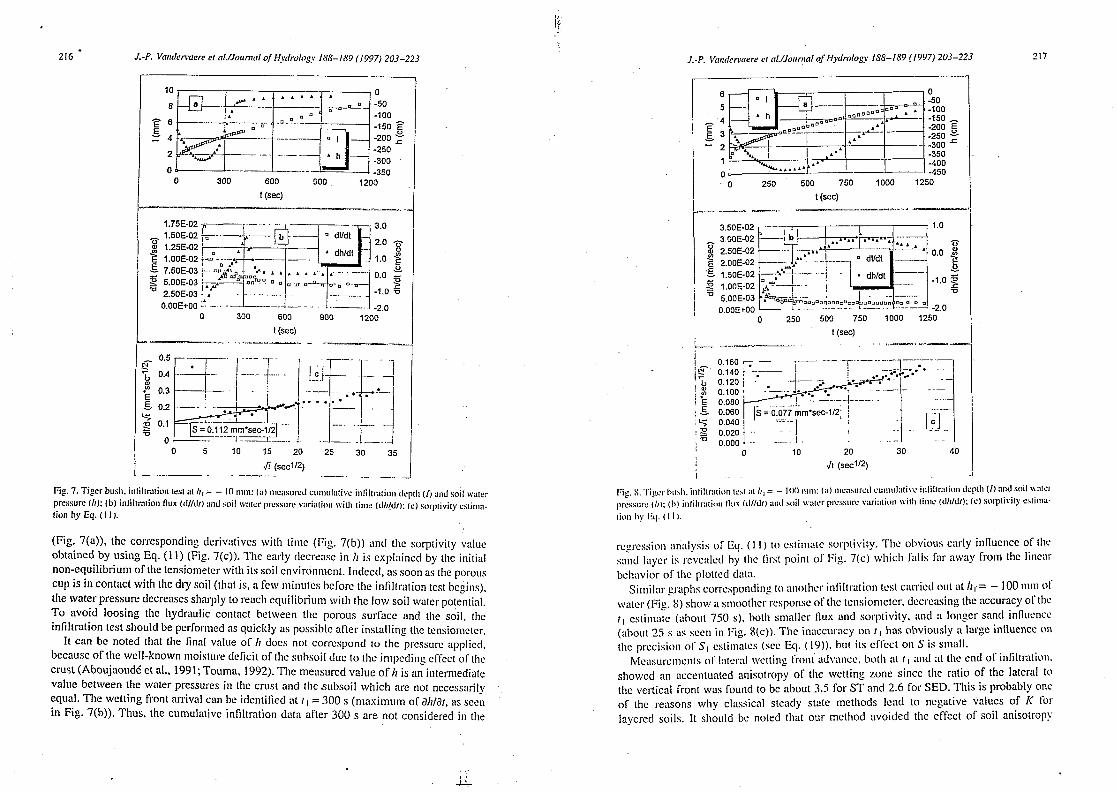
Fig. 7. Tiger hush, inliltnition test at hl = - 10 inni: (;i) 1i1e;isurcll ciiiiiiiliitivr. inli1rr:itioti tlr.prli (f) 2nd soil \v;iter pressure (11): ( h ) inliltcitioti flus (ii~/i~fJ ;ilid soil \wer pr~smre wr¡:it¡otl \villi tinw (clh/df): I C ) sorpiivity r.siitn;i- tioti by Eq. (I I J.
(Fig. 7(a)), the corresponding derivatives with time (Fig. 7(b)) and the sorptivity valuc obtained by using Eq. ( I I ) (Fig. 7(c)). The early decrease i n 11 is explained by the initial non-equilibrium of the tensiornetcr with its soil environnlcnt. Indeed, as sooli as the porous cup is in contact with lhe dry soil (that is, a few minutes before the infiltration test begins). the water pressure decreases sharply to reach equilibrium with the low soil water po!ential. To avoid loosing the hydraulic contact between the porous surface and the soil, the infiltration test should be performed as quickly as possible after installing the tensiometer.
It can be noted that the final value of /I docs not correspond to the prcssurc applied, because of the well-known moisture clcficit of Ihc suhsoil duc to the impeding effect ol'thc crust (Aboujaoudé et al., 1991; Touma, 1992). The measured value of k is an intermediate value between the water pressures in the crust and the subsoil which arc not necessarily equal. The wetting front arrival can be identified at I I = 300 s (maximum of dh ldr , as seen in Fig. 7(b)). Thus, the cumulative infiltration data after 300 s are not considered in the
J.-P. Vuitdcnnere PI nl./Jo~rrttnl of H.wlro1og.v ISS-IS9 (19971 203-223 7-17
rcgrcssion analysis 01' Eq. ( I I ) to es!iinatc sorptivity. Tlic obvious early influence of thc: santl Inycr is rcvcnlcd by the first point of Fig. 7(c) which kills kir away from thc lincnr bchnvior of the plotted dntn.
Siinilm. graphs corresponding to another infiltl-ation test carried out at I r r= - 100 nin1 of \v:ltcr (Fig. 8) show a smoother response of the tcnsiomctcr, decreasing the accuracy of t h ~ t I cstima!c (ohout 750 s), both sniullcr f lux and sorptivity. nnd :I longer sand influcncc: (nhout 3-5 s ;is secl1 in Fig. 8(c)). The inaccuracy 011 t 1x1s obviously a large influence on
MciIsurcmcnts ol' latcrnl wetting front ndvancc, both at f I tuid at the encl of infiltratioli. showcd an accentuated anisotropy of the wetting zone sincc the ratio of the lateral lo the vertical front w;is found to be about 3.5 for ST and 2.6 for SED. This is probably OW of the reasons why classical stcntly state methods lead to negative values of K l'or layered soils. It should he noted that our method avoided the effect of soil anisotrop!.
tI1c precision of SI cstin1atcs (sec Eq. (IO)). but its effect on s is smnll.

219 J.-P. Vanden'aere e! al./Jormrcrl of Hwlrology ISS-IS9 (1997) 203-223 J.-P. Vnlrdcrw" et nl./Jorrn~nl of hydro log.^ ISS-IS9 (1997) 203-223 219
I __ __ -120 -100 -80 -60 -40 -20 O 0.25 -
0.20 ..
0.15
0.10 -
0.05 -.
0.00 4 - ..-
- -- 0.01
potential. h (mm)
i -120 -100 -80 -60 -40 -20 O
Fig. 9. Tiger bush intiliraiion lest rejected for sorptivity dcierminiltion (Eq. (I I ) j ,
since only the intercept and not the slope of Eq. (1 I ) is being analyzed. However, the method is flexible enough to account for anisotropy through the parameter 6 in Eqs. (5) and ( I I).
When infiltration data are plotted according to Eq. ( I I ) , the linearity is essential for sorptivity determination. Correlation coefficients higher than to 0.95 were commonly obtained, but in 35% of the cases, a curved behavior led to rejection of the results for % calculations. We suspect that the reason for which some of the experiments do not exhibit good linearity is related to the excessively large amount d.f sand required for situations with high surface roughness. Indeed, when a thick layer of sand is present between the disc and the soil, it is difficult to determine the number of early readings which should be rejected for sorptivity determination. AS a matter of fact, the transition monient froin infiltration into the sand layer to infiltration into the soil, is then difficult to see because of overlap between the two phenomena. This is illustrated in Fig. 9 which corrcsponcls to :I
rejected test. No significnnt difference was found between results for soil underlying ST cnists and
soil underlying SED crusts. Fig. 10 presents the log,.+ versus II,. data for the three cate- gories, ST. SED, and subsoil (SUB). The correct linearity which appears, despite the important scatter due to the use of squared S values, validates the choice of the exponential form (Eqs. (I) and (14)). Values of the different hydraulic parameters ilre summarized in Table 1. As shown in Peugeot et al. (1997). the K , valucs obtained hcrc for the crusts are quite consistent with the results of Casenavc and Valentin (1992) who measured. in initially wet conditions and on the same crust types, critical values of rainfall intensity below which runoff does not occur.
potential. h (mm)
, -120 -100 -80 -60 -40 -20 O
J 0.001 I
potential. h (mm) I
42.2. Error ~l!l~~~y.Y;.s The ratio dS/S, given hy thc rcgrcssion unnlysis (Eq. ( I I)) performed for each inliltra-
tion tcst, vitries bctwccn 0.013 and 0.28 with ;I iiiean value of 0.056. This error is of lhc sime order of magnitude :IS the error clue lo thc use of thc npproxiimalc value of 0.55 for lhc paramcler b. Finnlly. Eq. (20) gives ;I nic;in rclativc error of about 208 for the niatric flits potenlial estimates. The corrcsponcling error bars are shown in
I'aranictcrs of thc location error milysis on K , cstimalcs (Bqs. (22)-(3 I)) are suniniiir- ¡zed in Table 2 for ST. SED. and SUB. The location error factor, ranging from I .6 lo I .s. shows that spiltial variability h;is tlie larger cfkct on the unccrtninty of K , estimates. This means that, to improve the global accuracy of tlie method. it is more important to increase the nuniber of replications. than to perform a more accurate S determination for each test. Taking into account location error and error of 4, estimates, the global error made in A', determination is 102-normally distributed with ;i standard deviation of a factor If: 2.
I O. Tiihlc I Tiger hush: Iiydruulic p:iriiinclen for s1nicrur:d tST) iind sedililcrli;liio~1 (SED) crusis nnd Ibr the subsoil (SUB)
pj (g ~111") 0 , ' l C m 3 em-') li. I I I I I ~ ~ s-') S ( I I I I I I s-"') (Y ( I I I I I I "1 A,,, (pm) iyKn (hj . .
8.51. - 4 0.1s 0.014 10s 13 ST 1.7 0.31 SED 1.47 0.35 s.1e -4 0.15 SUB 1.56 0.31 2.Yr-3 0.27
0.015 I IS 21 0.023 175 1.5
i . ... .
-

* 220
Table 2
J.-P. Vandcrvaere er alJJuurnal of Hydrolosy 188-189 (1997) 203-223
Tiger bush: parameters of the location error analysis (Eqs. (2343 I ) ) forstruclural (ST) nnd sedimentation (SED) crusts and for the subsoil (SUB)
ST SED SUB
ß' - 2.66 - 3.25 - 2.05 ß- -3.12 - 3.76 - 2.56
0.017 0.0 I9 0.023 0.010 0.010 0.015
a+ ("lnl-') a- (mm-')
K: (nim s-') 1.2e - 3 7.3 - J 2.9e - 3 K; (mn1 8) 4.6e - 4 7..k - 4 1.1~-3 f 1.61 I .75 1.61
Mohanty et al. (1994) carried out a spatial analysis of hydraulic conductivity measured using disc infiltrometers and obtained coefficients of variation for K , between 75% and 125%. Thus, the error that we obtain here for K , can be considered reasonable.
42.3. Cliaracteristic length mid time scales The characteristic mean pore size A,,, (see Table I), calculated by Eq. (15). with a
precision of 30% (see Table 2), shows a decrease of 40% between subsoil and crust. These values were compared with results obtainctl by ilic mercury porosimetry technique (Fies, 1992a) on samples collected at tlie s:inic place whcrc tlie inliltration tests were performed. Fies showed that the porosity is bi-modal: one domain. characteristic of the clay fraction. has a pore size ranging from IO-' to IO-' pni. The second domain, with values ranging from I pm to a maximum value of40 pin for ST and SED crusts and I O0 pm for the subsoil, characterizes the coarse fraction (Fies, 1992b). Our field values of A,,, (110 pm for ST and SED, 175 pni for SUB, Table I ) appear markedly superior to laboratory measured niaxinium porc radius, which is in agreement with general findings reported by White and Sully ( I 9S7). Not surprisingly, our results illustrate the predomi- nant hydraulic role of the coarse porosity on infiltration.
Estimation of tbr4,~ (Table I ) by Eq. (16) shows that gravity effects can bc neglected during at least I h of infiltration into a crust, which makes possible the use of Eq. (19) to obtain a second sorptivity estiniaic. SI. S values, obtained by Eq. ( I I ) , arc plotted against SI in Fig. 1 I , for tests providing the two estimates without any ambiguity. As no consistent underestimation appears in SI compared with S values, no water blockage effect is shown at the crust-soil interface. Indeed, such a phenomena would have entailed a delay in the tensiometer response to the wetting front arrival and thus decrease SI values. Therefore, it seems that ST and SED crusts can bc effectively seen, from a hydrodynamic point of view. simply as impeding layers, by having a lower hydraulic conductivity than the subsoil.
Crust conductivity values obtained by this method were used in a soil-vcgetation- atmosphere-transfer modcl (Braid et al.. 1997) m c l led to improve the prediction of the soil water content as compared with measurements performed during the HAPEX-Sahel experiment. Resulii presented here for the tiger bush will be used to compute cumulative infiltration to predict pointwise runoff amounts for natural rainfall conditions and compare them with measured values obtained by Peugeot et al. (1997).
.
I
J.-P. Varidenocre CI oI./Jinirnnl of Hydro1og.v 188-189 (1997) 203-223 22 I
n 2 0.15 - 3 B 0.10 E E
a,
W
y 0.05 v>
5. Conclusions
Faced with the innbility of c1;issicol tension disc infiltromctry mcthods. based on the aniiiysis of steady state regime of infiltration, to provide conductivity estimates of cnistctl soils, ;i new method has heen dcvclopcd. using transient flow malysis and minitensiometer implemented below the crust. Stitiirlited hyclraulic conductivity, ohtaincd with a precision of a factor 2, dccrcased in thc crust from three-fold to sis-fold coinparccl with the subsoil. The effective porc size was found to be significantly reduced hy the crust formation nnil consistent with porosimetry meusurements. The method would he pnriicularly suitable for sandy crusts, for which the decrcasc in conductivity must be more accentuated. It is not recommcndcd to use the method whcrc crusts either have ;i high surfacc roughness (bccnusc of the necd for a thick Inycr of sind) or :tre thinner than I cin (because of the tlifficulty of placing thc minitcnsionictcr ;it the crust-subsoil interface). More gcnerrtlly. thc method could be uscd for any cast of lnycred soils. the cxtrn cffort required for minitcnsiomctcrs instdlution hcing I;irgcly offsct by ;\voiding the stc:itly stiitc fio\\. rcquircmcnt.
Acltnoivledgeincnts
The cxpcrinicntal part of this work. funclcd by CNRS (PII< Environnement) and INSU/ CNRS (PAMOS), could not huvc heen possible without the tcchnicnl support of ORSTOLI Niamey, Niger. Density measurements were performed at the Soil Science Departrilent of INRA Avignon with the precious collaboration of Jean-Clnude Fies. The first author wishes to thank Rundel Haverkamp (LTME Grenoble) and Brcnt Clothier (HortResearch. CRI Palmerston, Ne\\ Zealand) for helpfill discussions.

. 222
References
J.-P. Vandenwere et al./Jovrnnl of Hydro1og.v ISS-IS9 (1997) 203-223
I i
i
ì
Aboujaoudé. A.. Belleudy. P. and Vauclin, M.. 1991. A numerical study of infiltration through crusted soils: flat and other surface conficurations. Soil Tech.. 4: 1-18. -
Abuja. L.R.. 1974. Applicability of the Creen-Ampl approach to water infiltr;ltion through surface crust. Soil Sci., 118: 283-288.
Ankeny, M.D.. Ahnied, M.. Kaspar, T.C. and Horton. R.. 1991. Simple field niethod for determining unsatunird hydraulic conductivity. Soil Sci. Soc. Am. J., 55: 467-470.
Braud. I., Bessemoulin. P.. Monteny, B.. Sicot. M.. Vandcrvaere. J.-P. and Vauclin. M.. 1997. Unidimensional modeling of a fallow savannah during the HAPEX-Sahel experinlent using the SiSPAT model. J. Hydrol., this issue.
I I
Brisrow, K.L. and Savage. M.J.. 1957. Estimation of parameters for the Philip two-ter1 infiltration equation
Casenave. A. and Valentin. C.. 1989. Les h s de Surface de la Zone Sahilienne. Ed. de I'ORSTOM,
Casenave. A. and Valentin. C.. 1992. A runoff capability classification systeln based on surfacc fesiltres criteria in
Clothier. B. iind White. I.. 1981. Me:isuremenl ofsorptivity ancl soil \vilter diffusivity in the field. Soil Sci. Soc.
Cook. F.J. and Broeren. A.. 1994. Sis methods for detr.mlining sorptivity nnd hydriiulic conductivity \\¡th disk
Elrick. D.E. and Rohin. M.J.. 1981. Estim;iting the sorptivity of soils. Soil Sci., 132: 117-133. Fies. J.-C.. 19921. blesures tle conduclivitL: hydrique dr. crofiles. R;pport Hapex S:ihel/Nigcr. INRA internal
report. I I pp. Fies. J.-C.. I992b. Analysis of soil textural porosity rehive to skeleto~i p:irticiile siir. usirig merct.ory porosimetry.
Soil Sci. Soc. Ani. J.. 56: 1062-1067. Fies, J.-C. and Zimmer, G.. I9S2. Effect of pressure on sonle chmeteristics of pttcking \,irid in :I s:lndy-ciily
in:iterial. Milieux poreux el tctnsferls hydriques. Bull. du Groupe Ikmpis d'I lulnidimr'trie Ncuirtiniquc. Eli. CEMAGREF. Aix-en-Provence. France. 11: 39-54 ( i n French).
C:irdnsr. W.R.. 1958. Some ste:idy-st:ite solutions of the uns:ituriltc'tl nioisture Ilou erpltiotl with applic:itioti to
evaporition from a wnter tahle. Soil Sci.. 85: 228-232. Goutorhe. J.-P.. Lebel. T.. Tingo. A.. Bessemoulin. P.. Brouwer. J..'DolnxIrl. A.J.. Hngm;lll. E.T.. Cash, J.tI.C..
Hoepffner. M.. Kabat. P.. hlonreny. B.A.. Prince. S.. Said. F.. Sellers. P. ;ind v,'iiIl;ice. J.S.. 1994. Hnpex- Sahel: a large scale study of land-atmosphere interactions in the setiii-;irid tropics. Ann. Geophysiclie. 12: 53-64.
11;1\*erkainp. R.. Rms. P.J.. Sinettem. K.R.J. ;inil Piirlange. J.Y.. 1994. '~l~rce-tli~iicnsior~i~~l :I!iitlxhis ol' illiil-
lr:ilioll from lhe disc illfi~trometer. 2. Physic:llly h:lsed inliltrtiiion cqu:tti~>n. W;ltcr Resour. Res.. 30: 793 1-2935.
Hillel. D. and Gnrdner. W.R.. 1960. Steady infiltcaion into crust-topputl profiles. Soil Sei.. 10s: 137- 142. Hillel. D. :ind G;irdiier. W.R.. 1970. Tr:uisient inliltration into crust-toppctl profile Hoirgmirud. W.13. ;ind S1niosnijdc.r. L.. I'JSJ. Crust l'orm:lt¡w o11 s;~ndy sc,ih ill tlic Silllei. I. I<:ii~llilll :III[I
Hussen. A.A. :Ind Warrick. A.W.. 1993. Altern:itive ;~n:ilyscs of Iiytlraulic tl:lt;l fronl the disc tctlsion itililironi-
Logsdon. S.D. aiid Jaynes. D.B.. 1993. hlethodoltrgy for dutcrmining Iiydr;lulic clrlidtlctivity with tension iniil-
Mohanty. B.P.. Ankeny. M.D.. Horton. R. and Kenwar, R.S.. 1994. Spatial :Imlysis of I1ydr;lulic conductivity
P;lrlange. J.Y.. 1972. Theory of wiiter inovenicnt i n soils: 4. Two and tliree dilnelisional src:idy infiltration. Soil
Parlange. J.Y.. Hogarth. W.L. and Parlange. b1.B.. 1984. Optimal analysis of ii surfilce crust. Soil Sci. Soc. Ani. J.,
Perroux. K.M. and White. I.. 1988. Design for disc penneuneters. Soil Sci. Soc. Am. J.. 52: 1205-1215.
applied to field soil experinients. Aust. J. Soil Res.. 25: 369-375.
pp. 65-74.
semi-arid :Ireas of West Africa. J. Hydrol.. 130 131-249.
AlIl. J.. 45: 141-2.15.
pernieanieters. Soil Sci.. 157: 2-1 I.
I
i
inliltr~~ticrn. Soil Tillxge Res.. 4: 5-23.
elers. Water Remur. Res.. 29: 4 103-4 I OS.
tronieters. Soil Sci. Soc. Am. J.. 57: 1426-1431.
measured using disc inlillmmcters. Water Resour. Res.. 30: 2489-7498.
Sci.. 113: 96-101.
48: 494-497.
J.-P. Vandemuere et nl/Joumnl of Hydrology 18s-189 (1997) 203-223 223
Peugeot, C.. Estèves. M.. Rajot, J.-L., Vandervaere, J.-P. and Colle, S.. 1997. Runoff generation processes: results and analysis of field data collected at the East Central Super Site of the HAPEX-Sahel experiment. J. Hydrol.. this issue.
Philip. J.R., 1957. The theory of infiltration: 4. Sorptivity and algebraic infiltration equations. Soil Sci.. 84: 257- 264.
Philip, J.R., 1969. Theory of i&filtration. Adv. Hydrosci.. 5: 215-396. Philip. J.R., 1987. The qu:isilinear analysis. the scattering analog and other aspects of infiltration and seepage. In:
Y .-S. Fok (Editor). Infiltration Development and Application. Water Resources Research Center. Honolulu. Hawaii. pp. 1-27.
Quadri. M.B.. Clothier. B.E.. Angulo Jaramillo, R., Vnuclin. M. and Green, S.R., 1994. Axisymmetric transpon of water anil solute tinderneath a disk permeameter: experiments and numeric;d model. Soil Sci. SOC. Am. J.. 58: 696-703.
Soil Sci. Soc. Am. J.. 55: h33-639. Reynolds, W.D. and Elrick, D.E.. 1991. Deterniin:ition of hydraulic conducti\,ity using a tension infiltromelsr.
Scotter. D.R.. Clothier. B.E. and Harper, E.R.. 1981. Measurhg sattirated hydraulic conductivity and sorptivit? wing twil l rings. Aust. J. Soil Res., 20: 295-304.
Shiirmn. M.L.. G:indcr. C.A. and Hunt. C.C.. 19x0. Spatial variahility of inliltratinn in ;I watershed. J. Hydrol..JS: 101 - 122.
multiple diac perme:unr.tr.rs. J . Soil Sci.. JO: 563-565. Slneuem. K.R.J. and Clothier, ß.E.. IOSO. Measuring unsaturated sorptivity i~nd hydr;iulic condr!ctivity using
S~ililcs. D.E. :itid I-l;~rvey. A.C.. 1973. blcasurement of moisture diffilsivity in wet s\!*ell¡ag systems. Soil sci.. I 16: 39 I-3W.
Slllilcs. D.E. :lid Kni$li. J.H. . 1976. A note o n tliu use of the Philip inliltration eqiiation. Aus!. J. Soil Res.. 14: 103-10s.
Srniles. I>.E.. Knicht. J.11. nnd Pcrrwx. K.M.. I'JSZ. Ahrorption of wilter by soil: the cfl'cct clfa surface crust. soil
i - .