c) c%4 n rfq lens for lebt applications final rpr · n rfq lens for lebt applications final rpr ......
TRANSCRIPT

SAIC Report No.90/i 322
C)
C%4
N RFQ Lens for LEBT Applications
Final Rpr
Principal Investigator: D. A. Swenson(619) 458-3854 ti V.
S-I 7 9h'
Submitted to:
USASDCUnder Contract DASG60-89-C-0084
Period of Performance: June 13, 1989 to June 30, 1990
Auut31, 1990 BSAugustAVAILABLE COPY

0
TABLE OF CONTENTS
SECTION PAGE
I SU M M A R Y ............................................................................... I
2 RFQ LENS BACKGROUND .......................................................... 4
3 PROPERTIES OF RFQ LENSES ........................................................ 5
4 PERFORMANCE OF RFQ LENSES ................................................... 12
5 ELECTRICAL ENGINEERING ANALYSIS OF RFQ LENSES .............. 22
6 DESIGN OF RFQ LENS FOR PROOF-OF-PRINCIPLE EXPERIMENT ........ 23
07 PRE-BEAM TESTS AND FINAL VANE DESIGN
FOR THE RFQ LENS SYSTEM ................................................... 41
8 BEAM TESTS AT FERMI NATIONAL ACCELERATOR LABORATORY ...... 46
9 POST BEAM TEST OBSERVATIONS ........................................... 56
STATM~ENT "A" per Brandt GarnerUS Army Strategic De'Lense Gommand/CSSD-DE-
N, PO Box 1500, Huntsville, AL 35807-3801
*TELECON 9/17/90 VTG
0~
1. SUMMARY
Through a Broad Agency Announcement (BAA DASG60-87-176), the U. S. Army StrategicDefense Command (USASDC) solicited proposals for new and innovative particle beam
technologies which are relevant to the Neutral Particle Beam (NPB) Program. Since high
brightness beams are required for NPB and beam emittance, in large part, is determined by the ion
source and low energy matching section, innovations to improve the quality or efficiency of the
low energy beam transport (LEBT) are important. Some preliminary studies on radio frequency
quadrupole (RFQ) lenses indicated that such lenses could be developed with improved capabilities
for preparing ion beams for injection into RFQ linacs. These improved capabilities derive from the
fact that the focusing effect is inversely proportional to the square of the frequency so stronger
focusing can be achieved if the frequency in the RFQ lens is less than that of the RFQ linac. The
goal of this project is to design, build, and test an RFQ lens that demonstrates the possibility of
decoupling the phase and frequency of the RFQ lens from that of the RFQ linac into which it isfocusing ions., SAIC was awarded Contract No. DASG60-89-0084 on June 13, 1989 with a
contract duration of 6 months for this purpose.
The design of the lens was based on two-dimensional beam dynamics and RF cavity geometry
analyses performed with the TRACE and SUPERFISH codes, respectively. The lens was then
fabricated by a combination of SAIC and subcontracted machine shops. After fabrication, the lens
was assembled for verification of resonant frequency, mode separation, tuning, and power
conditioning, prior to beam testsat Fermi National Accelerator Laboratory (FNAL). In the course
of these measurements, it was determined that the resonant frequency was much higher than
predicted by the two-dimensional analysis (the measured value was 588 MHz compared to the
predicted value of 300 MHz). Since the rf focusing effect is larger for lower frequencies - a key
feature of the RFQ lens - this discrepancy had to be understood. Therefore, although not planned
or budgeted for this project, three-dimensional ARGUS calculations were performed which
confirmed the measurements. These calculations indicated that three-dimensional end effects were
the cause of the elevated frequency. This conclusion was also confirmed by network analyzer
measurements on a mocked-up geometry.
*fwo possible responses to this observation were feasible: one was to fabricate a new, larger
diameter lens, and the other was to modiy the geometry of the vanes in the existing lens to load the
cavity and thereby reduce the resonant frequency. In the interests of budget and schedule, the latter
option was chosen. By changing the geometry of the vanes, the inductance and capacitance of the
lens were changeo ani a resonant trequency ot 3UO MHz was achieved. However, these
1

mcxlifications also caused the Q, a measure of power-coupling efficiency of the cavity, to decrease
hy a factor of approximately five. The modified lens is shown in Fig. 1.
0
Fig. 1. RFQ Lens with One Cover Plate Removed.
Following a successful full power (26 kW) test of the close-coupled rf kCCRF) power system at
SAIC, the lens and CCRF system were shipped to FNAL for experiments on a duoplasmatron ion
source test bench which generates a 20-keV proton beam. The objective of the test was to measure
wlicther beam focusing occurred and if the focusing effect varied with rf power as expected.
Whie fn,! ing and tuning were observed, the pertoiii.itcc waN not ds expL:tcd nor is it
compietely understood The inconclusive nature of the results can be related to two important
2

conditions which prevailed during the experiment. The first is that the rf used to power the lens
interfered strongly with the emittance scanner, making even rough emittance measurements
difficult at best. The second is that, due to the reduced Q of the lens and the limit of 26 kW of
available rf power, the lens was underpowered by a substantial factor. With these conditions, the
proton focusing effect would have been too small to be observed by the emittance scanner
operating with rf interference. This conclusion was born out by subsequent TRACE calculations.
However, on the last day of the five-day experiment, after working to minimize rf interference with
the emittance scanner and maximizing rf power, a round spot was seen on a viewing screen. The
radius of the spot varied with lens excitation as expected. Although TRACE calculations indicate
0 that the lens excitation was inadequate to focus the 20 keV proton beam, we speculate that these
observations indicate the focusing of some undefined component of the beam. Further TRACE
calculations to identify this component have failed to shed further light on the phenomenon.
Sections 2-5 describe some of the general results obtained in the course of defining the lens design.
The remaining sections describe the specifics of the design, fabrication, testing, and conclusions
drawn from the proof-of-principle device.
Whether this RFQ lens successfully demonstrated focusing is open to interpretation. However, no
results were obtained that would suggest any problem with the basic concept. Furthermore, much
was learned in this project to suggest substantial improvements that could be made to the lens
design. Considering its potential advantages for NPB, we believe the RFQ lens is worthy of
further study by the USASDC.
3

2. RFQ LENS BACKGROUND
The advent of the RFQ linac has produced the need for a means of focusing low energy (10-50
keV) particle beams in the low energy beam transport (LEBT) section of the accelerator. Achieving
the required strongly convergent beam with quadrupole magnets or solenoid lenses has become a
problem. The lower beam energies give added impetus to the use of electric, as opposed to
magnetic lenses, in these regions.
The RFQ lens is an electric quadrupole lens with the added advantages that no insulators are
required to support the resonant electric fields in the structure and the required "alternating
gradient" feature is provided by the temporal alternation in the polarity of the fields.
RFQ lenses are inherently simpler than RFQ linacs. They have been around longer than their linac
counterpart, finding application in atomic physics, plasma physics, and mass spectroscopy. Prior
to this initiative, however, they were thought to be too weak in focusing strength to serve the
demanding application of matching low-energy ion beams into modem RFQ linacs.
A key observation, which motivated this project, is that there are some configurations of RFQ
lenses whose effect on the beam is independent of the phase of the rf excitation at the time that the
particle enters the lens. This, in turn, suggests that these configurations do not have to be
synchronized with the linac phase or frequency to have a useful focusing effect on the beam. This
observation has been validated by TRACE particle dynamics calculations which will be described
later in this report. In particular, it suggests that RFQ lenses could be designed to operate at a
lower frequency than the linac where their strength would be substantially stronger.
4

3. PROPERTIES OF RFQ LENSES
The focusing strength for RFQ devices is proportional to B=EX2/(r(m/q)), where E is the surface
electric field on the tip of the electrode, X is the rf wavelength, r is the radial aperture of the
electrodes, and m/q is the mass-to-charge ratio of the beam particles. If E is expressed in units ofMV/m, X in meters, r in meters, m in MeV, and q in multiples of the proton charge, the quantity B,
which we will call the "B-value" or focusing strength of the RFQ, is unitless. For example, for thelens which was built for this project, E=1 1.2 MV/m, r=O.O1 m, X=i.0 m, q=l, and m=938 MeV,
leading to a B-value of 1.2.
The optimization of RFQ linacs for focusing and acceleration of small diameter particle beams
essentially precluded the use of RFQ lenses, operating at the linac frequency, on the larger diameter
beams in LEBTs, because of inadequate lens strength. The key observation, presented here, is that
there are some configurations of RFQ lenses that do not have to be at the linac frequency in order
to effect a useful transformation on the beam and, in particular, may operate at a lower frequency
where their strengths can be substantially higher.
The basic components and performance of an RFQ lens for LEBT applications are shown in
Fig. 2. The lens comprises three sections, namely, the input matching section, the center section,
and the output matching sectimn. It is the proper configuration of the two matching sections that
gives the all-important phase independence of the focusing action. The RFQ field strength in the
two matching sections must increase smoothly from zero to full strength over some minimum
distance, or vice versa, to allow the beam to adapt to the time-varying rf fields within the lens.
The beam profiles through the basic RFQ lens, as displayed by the TRACE program, are shown in
the lower part of Fig. 2. The horizontal profiles are shown above the center line and the vertical
profiles are shown below. The four different trajectories, seen in each profile near the center of the
lens, correspond to four different phasings of the beam relative to the lens excitation.
Figure 3 shows the transverse phase spaces (the six boxes at the top of the figure) and the beam
profiles (the large box at the bottom of the figure) for four beams, separated by 90* in phase, at the
beginning (left), middle, and end of an RFQ lens. The phase spaces display the transverse
dimensions of the beam versus the angular divergence of the beam. The beams are considered to
occupy the elliptical regions in the transverse phase spaces. The A and B values in each boxcorrespond to the ox and f0 twiss parameters respectively for the four beams.
5

020
0)0
*rruU
4i.
)
IE
C.-.2
EEU.U
C.
00
CLE)
CLL
*d 0co 0)cc E
O0 0a)

CCI0)
ISMIS si
M*Mm
II iiIF ~I II
0 r 0'
-u 0
I4cccc 4, ~Cc C
*E
* Ch
0 0U. ..y,
7I

The phase space and profiles of the four beams are chosen to be identical at the input side of the
figure. In the middle of the lens, the phase spaces occupied by the four I Cams are dramatically
different. The fact that these phase spaces and profiles coalesce at the end of the lens demonstr. -s
that the lens action is independent of phase.
Consider a beam in a LEBT that is ten times the diameter of the beam in a 425-MHz RFQ linac.
Because the radial aperture of the lens electrode must be ten times larger than that of the linac in
order to accommodate the beam, the achievable RFQ lens strength in the LEBT at the frequency of
the RFQ linac is down a factor of ten from that in the linac. Since the focusing strength is
proportional to the -quare of the rf wavelength, the possibility of using a 100-MHz lens, instead of
a 425-MHz lens, regains that order of magnitude in strength.
Figure 4 shows an example of an RFQ lens focusing a relatively large-diameter, high-current (65
mA) beam into a srongly convergent beam for injection into a modem RFQ livac (the beam moves
from left to right in the figure). Most alternative lens systems require that beams of this current be
neutralized to reduce the space charge defocusing of the beam. The possibility of matching high-
current beams into modem RFQ linacs, without the exra complication of beam neutralization,
suggests a unique capability for the RFQ lens.
Another unique feature of the RFQ lens is its ability to achieve short focal lengths for large
diameter beams, utilizing quadrupole focusing, while maintaining nearly circular cross-sections for
the beams. This requires focal periodicities that are short relative to the diameter of the beam.
Figure 5 illustrates why this is impractical for electrostatic or magnetostatic quadrupole lens
systems and practical for the RFQ lens. In the static cases, the field limitations are longitudinal and
the field pattern is highly three dimensional. In the rf case, the field limitations are transverse and
the field patterns are primarily two dimensional, which may in turn reduce beam aberrations. In
addition, the transverse field limitations are much higher than the longitudinal limits, which leads to
higher focusing strength and shorter focal lengths.
A wide variety of match conditions are possible with the RFQ !,ns. The output of the RFQ lens
has azimuthal symmetry as required by the input to RFQ linacs. Consequently, matching a beam
to an RFQ linac with an RFQ lens may require only two adjustable parameters compared to the
four adjustable parameters required by the static quadrupole system. The two adjustable
parameters could be lens excitation and lens position. Another approach would be to have two
RFQ lenses in tandem to provide the two adjustable parameters.
08

0N
CoY
00
U Cj
CC cl

0 000
cc
E g
+ +
+l + C~w -
+ + L
+ z~ + CI 0 ,I a
i 7E)
+ ,+ + +
+ + ~
L+ c+
+ + I-?0 . )
0u-W 0
0 0
100
00
+0 0+ ED -

In summary, the RFQ icis exhibits a net focusing in each transverse plane, maintains a near
circular beam throughout the lens, may be exceptionally low in aberrations, has no frequency orphase constraint to subsequent linac structures, has acceptable surface field strengths, and is
tunable, simultaneously in both transverse planes, by rf amplitude.
01

4. PERFORMANCE OF RFQ LENSES
In this section, we illustrate some of the performance features of RFQ lenses. The interactive beam
dynamics code, TRACE, was used to calculate beam profiles for different RFQ lens lengths,
strengths and frequencies, and different beam particle masses, charges, energies, emittances and
twiss parameters. These calculations were done in order to improve our understanding of the lens
performance, guide the design of the proof-of-principle device, and explore different regions of
operation without the expense of fabricating hardware.
A tapered (or non-tapered) RFQ section is described by five parameters in the TRACE code,
namely, 1) the upstream focusing strength (B), 2) the downstream focusing strength, 3) the length
of the element in units of the particle wavelength (0kX), 4) the number of computational steps
through the element, and 5) the rf phase at the entrance to the element (in degrees). A data file for a
typical RFQ lens calculation is shown in Fig. 6. The input and output matching sections areprescribed by controlling the upstream and downstream focusing strengths. An "S-shaped", as
opposed to linear, ramp is prescribed by setting the fourth parameter to be negative. This simpleTRACE model of the lens involves 5 elements where the first and last elements are drift spaces and
the middle three are the three sections of an RFQ lens. For this input, the particle rest mass (ER)
correspond to that of an H- ion and the particle energy (W) is .02 MeV (20 keV). The wavelength(WAVEL) of the rf excitation is 1500 mm corresponding to a frequency of 200 MHz. The beam
current (XI) in this case is 16 mA. The TRACE calculation that results from this file data file is
shown in Fig. 7.
Figures 8 to 12 describe some sets of TRACE calculations that illustrate the performance of RFQ
lenses for different particle types (Figs. 8 and 9), different input emittances (Fig. 10), different
beam currents (Fig. 11), and different lens excitations (Fig. 12). Figure 8 shows the beam
profiles, in a specific RFQ lens, for four different particle beams:
• Proton beam, m=l, q=l, V(inj) = 10 kV, V(rfq) = 30 kV,
• Deuteron beam, m=2, q=l, V(inj) = 20 kV, V(rfq) = 60 kV,
* Helium-3 beam, m=3, q=2, V(inj) = 15 kV, V(rfq) = 45 kV,
* Helium-4 beam, m=4, q=2, V(inj) = 20 kV, V(rfq) = 60 kV,
where m and q are in units of the proton mass and charge.
12

'REMEMBER UNITS ARE m AND mrad (QUAD=T/m)'ER W Q DP/P'
939.23000 0.02000 1.00000 0.00000'XI SMAX EXI EYI'16.00000 2.00000 153.00000 153.00000
'BEAMI:alphaX betaX alphaY betaY'-8.75610 0.20510 -9.26660 0.24170
'BEAM:alphaX betaX alphaY betaY'4.43000 0.04300 4.43000 0.04300'WAVEL XM XPM XYM'
1500.00000 10.00000 400.00000 25.00000'MRG 1-4 IXW IYW IYP'1000 4000 50 3050 900 900 1100
'NI N2 NV MT PQEXT'0 1 5 4 1 0.000
'ME MP CONV'1 1 1.00002 1 1.00006 1 1.00007 1 1.0000
'COMMENTS NE NT PARAMETERS'1 1 24.49572 0.00000 0.00000 0.00000 0.000002 8 0.00000 2.00000 3.00000 -48.00000 0.000003 8 2.00000 2.00000 4.00000 64.00000 0.000004 8 2.00000 0.00000 3.00000 -48.00000 0.000005 1 23.84074 0.00000 0.00000 0.00000 0.00000
'PE PP PCONV'0 1 1.00000 1 1.00000 1 1.00000 1 1.00000 1 1.00000 1 1.0000
Fig. 6. TRACE Data File for Typical RFQ Lens Calculation.
13

BEA.M (NI)BEAMO (N2)
A- -8.7561 B- 0.2051 1- 16.0 16.0 A- 4.8724 B- 0.0506W= 0.020 0.020EX- 153.00 153.00EY- 153.00 153.00
MATCHING VARIABLESME MP VALUE1 1 24.4962 1 0.0006 1 0.0007 1 0.000
MATCHING TYPE - 1DESIRED VALUES:ALPHA-X 4.430BETA-X 0.043
Hod z ALPNA-Y 4.430 rz
A- -9.2666 B= 0.2417 MISMATCH FACTORS: A= 4.8500 a-~ 0.0501X-plane 0.194Y-plane 0.176
CODE: TRACE v42FILE: RLXX DAT;1DATE: 20-AUG-90TIME: 21:40:08
VertVe rt
10.0mm X 400.Omrad
* Fig. 7. Typical TRACE Output for RFQ Lens Calculation.
14

00
0 )
o *n o_ __L
Uqc q 4C
mcc0.0a
H rA 4 cy
>rcoU
CD 0
NS )*L2
CL 0*n .Eo0oino
1-
Cat
9-t0-0
0 (a
40
0000
ca 0-M C
00 a"(
hma-m. o> 4.)
.2.
Co CC
0 U. 00 Cc000C
00 00 0~ m
166
00
0 0
0 0
00 0 0
C.) 0
eme emem 04Cl0
minimu sim17

0uM
Eu.. zzV.
00
.0C.)
0
c mm
~cc .-
00
co
C18

rr
em m0
*3u R0;L;
CO) cc
Cd
CC
cc cc00
ca. mm. 0 .)m
C4 C cl - o- 0 7Me 'Z30
x 0
* se lee.5.1
mm. mm * U19

Here, we see that the focal properties of a specific RFQ lens are independent of the mass and
charge of the ion, provided the injection voltage and the lens excitation are varied directly with the
nVq of the ion. This is the same constraint under which all RFQs operate, namely that the injection
velocity must agree with the value for which the RFQ was designed.
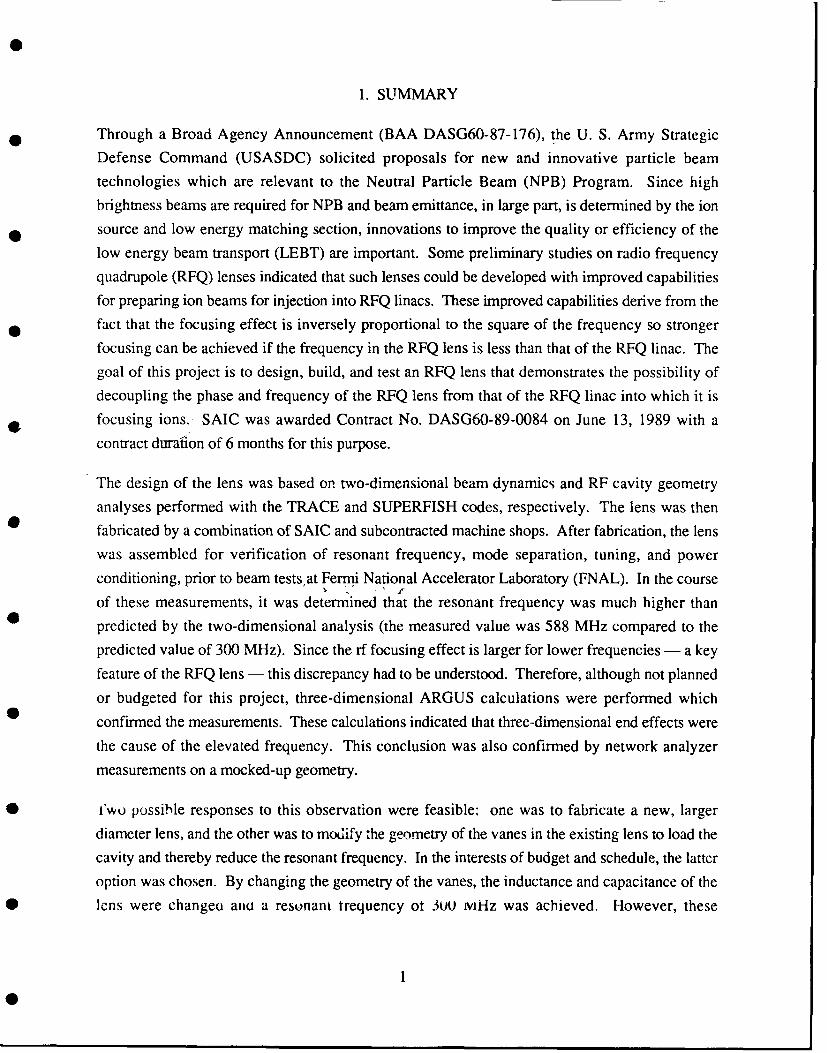
Figure 9 shows the beam profile of a 20 keV proton beam in an RFQ lens designed for 20 keV
deuterons. A decrease in V (RFQ) by a factor of 0.707 restores the profile close to the design
profile.
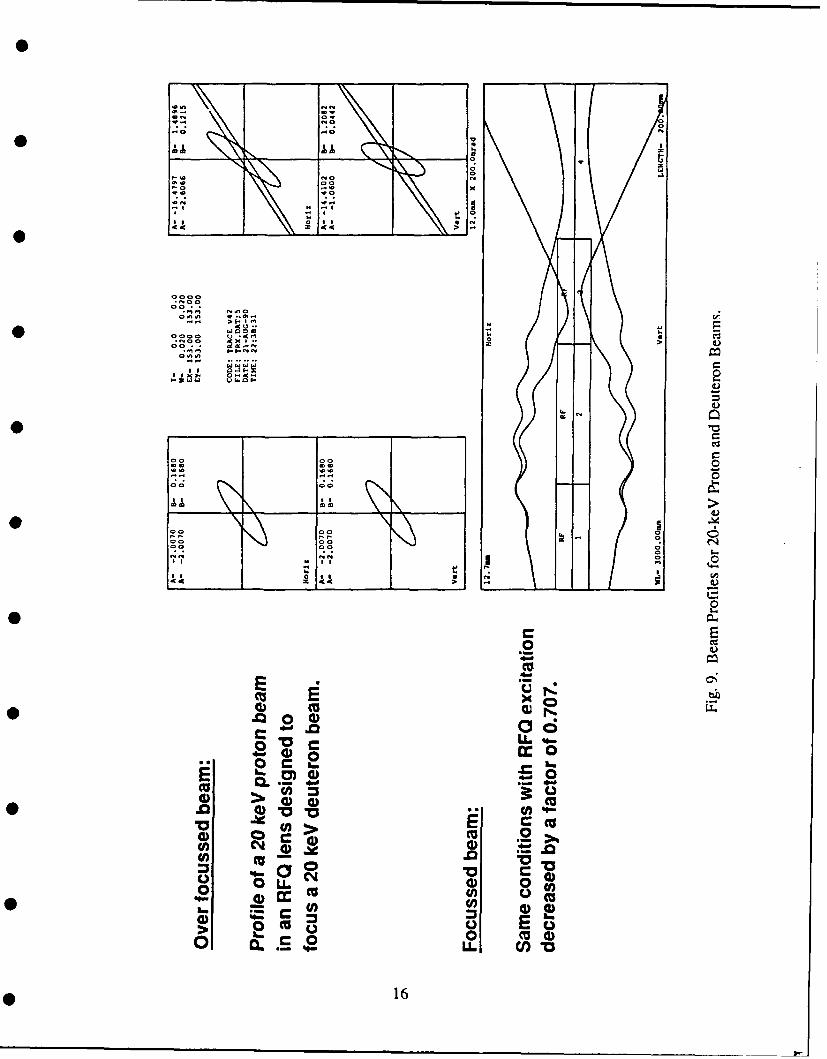
Figure 10 shows the beam profiles of six deuteron beams, with TRACE emittance values of 50,
100, 150, 200, 250, and 300 mm-mrad, in an RFQ lens with the excitation of 60 kV. Hence, we
see that the focal properties of a specific RFQ lens are independent of the emittance of the beam.
Figure 11 shows the beam profiles of four beams of current 0, 10, 20, and 30 mA in a channel
designed for zero current. Hence, we see the effect of beam current on beam profile. Space
charge effects can be countered by adjusting lens excitation, as shown in the figure.
Figure 12 shows the beam profiles of a 50 mA deuteron beam with RFQ B-values of 2.6, 2.8, and
3.0. Hence, we see that changes in lens excitation can accommodate for space charge repulsion.
The RFQ lens, like the more familiar magnetic quadrupole lens, can be applied to a very wide
range of particle beam types, currents, energies, and emittances. The RFQ lens, being electric in
nature, has important strength advantages over magnetic lenses at the low particle velocities found
in most present-day LEBTs.
The RFQ lens differs from an electrostatic quadrupole lens because of the time-dependent nature of
its electric fields. Unlike an electrostatic lens, it can discriminate between different ion species in a
particle beam. The RFQ lens is similar to a magnetic lens in that it focuses lighter particles more
strongly than heavier particles of the same charge and energy.
The choice of the optimum length and frequency for a specific application of the RFQ lens is
complicated by the interplay between two competing phenomenon. We have seen that the strength
of a lens can be increased by reducing the rf frequency. The strength can also be increased by
making the lens longer, giving the electric fields longer to act on the particles. Longer and lower
frequency lenses are thus stronger, allowing a reduction in the electric field gradient and a savings
in rf power.
20

However, for systems involving highly divergent or convergent beams, the longer and/or lower
frequency systems usually result in larger beam excursions. Longer lenses require less electric
field gradient, which implies lower surface electric fields and less rf power. Larger-aperture lenses
require the same electric field gradient as smaller-aperture lenses, which implies that the larger-
aperture lenses must use higher surface electric fields and more rf power. In some cases, longer
lenses, with their lower electric field gradients, will allow larger beam excursions, which, in turn,
will require larger lens apertures and more rf power. This puts an upper bound on the lens length
for some lens applications.
Lowering the lens frequency carries with it a concomitant lengthening of the lens due to the fact
0 that in the input and output radial matching sections, the electric field gradient must increase
smoothly from zero to full strength, or vice versa, to allow the beam to adapt to the time-varying rf
fields within the lens. Design experience suggests that these sections should each be about three
particle wavelengths in length; shorter sections result in significant beam emittance growth. In
some cases, lower frequencies, with longer matching sections, will result in lenses that allow
larger beam excursions, which, in turn, will require larger lens apertures and more rf power. This
puts a lower bound on the frequency for some lens applications.
21

5. ELECTRICAL ENGINEERING ANALYSIS OF RFQ LENSES
0 The particle dynamics analysis of the previous section guides the designer in the specification of
lens properties required to achieve the desired focusing effect on the particle beam. Further work
must then be done to transform these properties an engineering design. For example, TRACE
calculations may indicate that a B-value (focusing strength) of 1.2 is adequate for the applcation at
0 hand. This must be transformed into a design having a specific frequency and electrode aperture.
Other engineering data required for the design include the dimensions and shape of the cavity, rf
power losses on the cavity surfaces, the distribution of electric fields within the cavity, and the total
stored energy in the cavity fields. It is particularly important to complete such calculations when
designing an RFQ lens which involves new applications, new frequencies, new geometries, and/or
new fabrication techniques.
We have used the two-dimensional computer code SUPERFISH for these analyses. SUPERFISH
is a popular choice to provide the required engineering data for RFQ linacs, drift tube linacs,
coupled-cavity linacs, and rf power sources. SUPERFISH is restricted to the evaluation of
axisymmetric cavity modes in axisymmetric rf cavities. Nevertheless, SUPERFISH results are
very informative and generally provide most of the data required by designers.
For example, SUPERFISH is used to analyze RFQ linacs by taking the two-dimensional cross
section of the linear structure as the cross-section of a large torus, thus converting it into an
axisymmetric geometry. A special postprocessor for the output (SF05) translates the results for
the toroidal geometry back into a format that is more relevant to a linear geometry. This format
includes the resonant frequency. the maximum surface electric field, the maximum surface
magnetic field, the power dissipation/meter, the stored energy/meter, the quality factor (Q), the
average RFQ gradient, the RFQ aperture, the vane-to-vane voltage, and the shunt impedance of the
structure. In conventional RFQ linacs, which are long compared to their diameter, the geometry of
the cavity terminations (end effects) have little effect on the resonant frequency or electrical
properties of the structure. In these cases, the important properties of the cavity are determined
primarily by the transverse dimensions of the cavity, where the two-dimensional SUPERFISH
calculations suffice. SUPERFISH results for the RFQ lens which was constructed for this project
will be displayed and discussed in subsequent sections which deal with this specific design.
It should be noted here, however, that in some cases three-dimensional calculations, with tiLeir
attendant costs and complexities, are required to understand fully and engineer some aspects of
RFQ cavities. Vane tip modulations and end effects are examples of such features. Suitable
computer codes for these calculations are MAFIA (a German code) and ARGUS (an SAIC code).
22

6. DESIGN OF RFQ LENS FOR PROOF-OF-PRINCIPLE EXPERIMENT
The most immediate and demanding application for the RFQ lens is to focus low-energy ion ns
into RFQ linacs. The design goal for this project was to demonstrate an RFQ lens which cou'd
focus a slightly divergent, 20-mA beam of 20-keV protons into a modem 425-MHz RFQ linac
structure. For design purposes, the emittance and twiss parameters for the 20-keV proton beam at
the entrance of the lens were taken to be as follows:
n,rns = 0.020 cm-mrad
ox = 0.00653
Eu,trace = 122 mm-mrad
twiss = -2.43tWiss = 1.2 mm/mrad
where En,rms refers to the normalized, rms emittance; Eu,tlrace refers to the unnormalized, 90%
emittance envelope used in TRACE; Otwis s and I3twiss are the usual Twiss beam parameters; 3 isthe velocity of the particle divided by the speed of light; and ), is the Compton wavelength of the
particle. These parameters describe a slightly divergent 20-keV proton beam at the entrance to the
lens.
The first step with TRACE is to evaluate the properties of the matched beam at the entrance to the
RFQ. The standard approach for this, shown in Fig. 13, is to describe the initial portions of the
RFQ linac as a radial matching section of length 33?, and four half cells, each of length [3X/4. The
matched beam within the RFQ is determined by calculations through the four half cells (one period)
of the focusing structure. The twiss parameters for this beam are shown on Fig. 13 to becttwiss=l.7912 and Ptwiss = 0.0046 mm/mrad. This matched beam is then "backed out" of the
RFQ, as shown in Fig. 14, starting at the end of each half cell and extending to the entrance plane
0 of the RFQ. The average of these results are taken as the descriptions of the matched beam at the
entrance to the RFQ. The twiss parameters at this point are otwiss= 2.250 and Ptwiss= 0.026
mm/mrad. This corresponds to a highly convergent beam v'ith a diameter of 3.6 mm at the
entrance to the RFQ linac.
0A matrix of RFQ lens design calculations were made using the computer program TRACE. At a
frequency of 425 MHz (the RFQ linac frequency), the required field strength and rf power levels
are excessive. As noted earlier, there are distinct advantages in operating at a frequency that is
below that of the linac. At a frequency of 100 MHz, the length of the output matching sections
(3*3X=5.9 cm) is excessive, forcing an increase in the lens aperture to accommodate the beam.
There is a broad optimum in performance in the vicinity of 300 MHz.
230

A- -1.7912 B- 0.0046 I- 20.0 20.0 A- -1.7912 B- 0.0046- 0.020 0.020
EX- 122.00 122.00EY- 122.00 122.00
MATCHING VARIABLES0 ME MP VALUE
50 1 -1.79150 2 0.005
50 3 1.79150 4 0.005
MATCHING TYPE - 6DESIRED VALUES:
(INPUT BEAM VALUES)ALPHA-X -1.791BETA-X 0.005
Horiz ALPHA-Y 1.791 HorizBETA-Y 0.005
A- 1.7912 B- 0.0046 A- 1.7912 B- 0.0046
MISMATCH FACTORS:X-plane 0.000Y-plane 0.000
CODE: TRACE v42
FILE: RFL2.DAT;5DATE: 30-AUG-90TIME: 14:40:51
Ve rt Vert
2.0.nm X 400.Omrad
2.0 Horiz
RF RF RF RF RF
1 2 3 4 5
WL- 705.90rrn Vert LENGTH- 18.43mT
Fig. 13. TRACE Calculation to Determine Matched Beam within the RFQ Linac.
24

I-224 -004 - 20.0 20.0 A- -1.7912 B- C.C046A- 2.4760 B= 0.0277 W- 0.020 0.020 A- -1.7912 B= .0046A- 2.2706 B- 0,0270 EX- 122.00 122.00 A- -1.7912 B .0046A- 2.0283 B- 0.0236 EY- 122.00 122.00 A- -1.7912 - .0046
* MATCHING VARIABLESME MP VALUE50 1 -1.79150 2 0.00550 3 1.79150 4 0.005
MATCHING TYPE - 6DESIRED VALUES:
(INPUT BEAM VALUES)* ALPHA-X -1.791
BETA-X 0.005HorS z ALPHA-Y 1.791 oi
BETA-Y 0.005A- 2.2705 B- 0.0270 A- 1.7912 B- 0.0046A- 2.0283 B- 0.0236 CODE: TRACE v42 A 7J -004A- 2.2240 B- 0.0242 FILE: RFL2.DAT;5 A- 1. 12 B .0046A- 2 .460 B- 0.0277 DATE: 25-AUG-90A- 7 \ B 004
TIME: 14:56:01
RFO MATCHING
0Ve rt Vert
2.0mm XC 400.Omrad
2.Cm oi
RFR S F R
1
Fig. 14. TRACE Calculation to Determine Matched Beam at Entrance to RFQ Linac.
25

The required smooth variation in field strengths through the lens sets a minimum length for a 300MHz lens of 8*3X=5.2 cm. Lengths as great as 20 cm spread the focusing to such an extent that
the lens aperture must be increased to accommodate the beam. There is a broad optimum in thevicinity of 14*13PX=9.13 cm.
The performance of a 300 MHz, 14 3X RFQ lens in front of a 425 MHz RFQ linac is shown in
Fig. 15 as a composite of two TRACE calculations. The separation between the RFQ lens and the
RFQ linac is 1.27 cm (0.5 inches). The excitation of the lens for this calculation is B=1.2. This
figure shows the results of backing the beam out from the RFQ linac through the RFQ lens to the
entrance of the lens. The average twiss parameters at key locations in this composite TRACE
calculation are shown below:
Location 0 3wiss Otwiss (mmn/mrad)
Internal RFQ linac 1.7912 0.0046
Entrance to RFQ linac 2.2500 0.0260Entrance to RFQ lens -2.3160 1.1770
Note that the beam parameters at the entrance to the RFQ lens are very similar to those assumed atthe beginning of this section (Otwiss=-2.4000, otwiss=l.200 mm/mrad). Thus, this calculation
shows the prescribed beam focused and matched into the RFQ linac by the RFQ lens. If the beam
at the entrance to the RFQ lens differs from this prescription, modest changes in lens excitations
and position can reestablish the match to the RFQ for a wide range of input beam variations.
The calculated performance shown in Fig. 15 is close to the design goal for the project. The
decision was made to fabricate this lens as a four-vane RFQ structure with a length of 3.5 inches
(8.89 cm) and a bore radius of 2.0 cm. A first-order estimate of the transverse dimensions and
electrical properties of the structure was obtained from SUPERFISH. Fig. 16 shows the triangular
mesh and the resulting quadrupole electric field pattern from SUPERFISH for one quadrant of the
structure. A diameter of 10 inches results in a resonant frequency of approximately 300 MHz.
The very short length-to-diameter ratio of the RFQ lens means that the resonant properties of the
structure, and its rf power requirements, are heavily influenced by "end effects", which are not
properly treated in the two-dimensional SUPERFISH calculations. Nevertheless, the mechanical
design of the outer parts of the lens cavity and vacuum enclosure were based on these
26

0
422 1 42 0
0 I 1l
C; c C
0000 0 27

00
00
C14
0 LM
0u
0 CYVt)
CCJ
rc
*2

SUPERFISH calculations, leaving the detailed accommodation of the end effects to be sorted out
experimentally. This accommodation was to be accomplished by designing the vanes to take into
account the end effects and result in a lens with the desired performance and frequency. As
mentioned earlier, it was anticipated that the resonant frequency of the structure would be less than
300 MHz and simple steps could be taken to increase the resonant frequency to 300 MHz. The
final design of the vanes is described in Section 7. Fabrication of these long-lead items (cavity and
vacuum enclosure) was initiated to provide an enclosure for these "end effects" experiments and to
permit other related systems to be designed on schedule.
The outer part of the lens cavity was constructed as a heavy-walled cylinder, 10 inches in diameter
* and 3.5 inches long. Four vane assemblies mount inside this cylindrical enclosure, attached to the
heavy cylindrical wall by two concentric push/pull screw assemblies. The pushing screws have
micrometer threads to the cavity wall and form the basis of the vane alignment system. The pulling
screws serve to pull the vane bases against these alignment surfaces. Two additional push screws
per vane provide fine control of the longitudinal alignment of the vane tips. Locking plates load the
alignment screw threads to prevent accidental movement. The vane alignment is accomplished by
simple mechanical measurements. Electrical contact between the vane bases and the cavity wall is
based on flexed fins at the edges of the vane bases, which are designed to produce forces of 100
* pounds/inch against the cavity wall.
The vacuum requirement for the RFQ lens is simplified by surrounding the entire lens assembly
with a vacuum housing that bolts directly to the end of an RFQ linac. This arrangement allows the
0 lens to be mounted very close to the RFQ linac and provides a small range of longitudinal
adjustment to accommodate beam matching requirements.
The principal mechanical features of this design are shown in Fig. 17 (original vane geometry).
Detailed mechanical designs for the major RFQ lens components are shown in Figs. 18-23.
The electrical properties of the RFQ lens, evaluated by SUPERFISH, are summarized on the
SRO5 output shown in Fig. 24. The SUPERFISH normalization corresponds to a lens excitation
of B=1.34. When renormalized to B=1.2, the vane-to-vane voltage is 112 kV, the surface electric* field on the vane tip is 11.2 MV/m, the maximum surface electric field is 13.9 MV/m (0.81
Kilpatrick), the power dissipation is 79.3 kW/m or 7.05 kW, the stored energy is 0.616 J/m or
0.548 J, and the Q is 14,649. One must note, however, that these are first-order estimates of the
electrical parameters based on the two dimensional SUPERFISH calculation.
29

cc
Ch
00 ____ 0_
M Ca) 0
00
E 000. C
cn 0
.00
M) 0 . L
E >i 0Co C C
02 E
CU 0 a E
Cu MR w C,) a
0 0 0) 0
E30

-uC3
.rA
Fi.18. RFQ Lens and CCRF Assembly (Front View).
31

0
0I
Fig 19.~P RF esadCiAsml (ieVe)
324

WK OUT am:n
DETAIL D
SPRING RING GROOVE
<, 4- PLC$ COc Cn
(W A OL6 9CmU O*LL I. I
L0W 02
05

DEIAIL C
SPRING RING GROOVE
ETAEL C DEL&U
-0 -L42
SECTIOP4 AA LEFT VIEW
ENTIRE PIECE TO BE MACHINED CUT OF ONE ALUMINUM LOCK.
SDIMCNSION T0 PROVIDE A SLIDING FIT INTO VACUUM HOUSING (04-20270).
Fig. 21. RFQ Lens Body (Section AA).
34

0
SAMaS "
2.5-35 lil A ~ VACUMl TIGH4T VELD _PERNISSI.LE LEAK(L3-3 & RATE IS t X bN-.OML T LRt/SEC
A, WW OUT To TIS SINENSOP AFTERVCI.51P TgD "OLISR
R F FLANGE A O ujaaarr. ju
WELDS TO K PgS2TWPID SO AS WOT TOINTEEE V[Tm VLrE N.rTo.ES
___________________ _____________PARTS LISTLOL2 OTHERWISE SOIED COTRACT 00b -a-
IftmDG 4z IN DIC
zfl' A5 1* *PIWVALS DATE R FQ LENS_ __AL W%1SRS 0-" VACUUM HOUSING
NEXT ASSY _USED EIN 235(5 8 s12l"sj 4-,0270APPLICATION W NT SCALE ORAVIK
0 Fig. 22. RFQ Lens Vacuum Housing (RF Flange).
35

ONA IS
TWp.
KIAJL A - TAL A
ly. ,
* .157/J65 INITIAL VACUUM TANKDETAIL A
PARKER O-RING
@2-2S0
* Fig. 23. RFQ Lens Vacuum Housing (Vacuum Tank).
36

SUPERFISH OUTPUT FOR 1,FQs (SF05) 16:03 30-AUG-90 RUN 224RFQ Lens (300 MHz)
* * * INPUT DATA FOR RUN * * *
RUN **RFQL300.DAT**TITLERFQ Lens (300 MHz)
MESHX .3 3 .6 12.477MESHY .3 1003 .6 1012.477
NSEG 10XSEG 0 .8 .8 3.277 9.122 12.477 10 1.8 1 0YSEG 1001 1001.8 1010 1012.477 1009.122 1003.277 1000.8 1000.8 1000 1000CSEG 0 .8 0 0 -12.9 -12.9 0 0 .8 0FREQ 300
DRIVE 5BOUNDARY 1 0 1 0POWER 2 3 4 5 6 7 8 9MESHMAPBEGIN
END* * * SUPERFISH RESULTS FOR RFQ * * *
RADIUS OF TOROID 1 10.000 in
CIRCUMFERENCE OF TOROID = 62.832 m
FREQUENCY (STARTING VALUE = 300.000) = 300.202 MHz
ASCALE (NORMALIZATION FACTOR) = 21732.9
MAX ELECTRIC FIELD ON BOUNDARY = 15.567 MV/m
MAGNETIC FIELD ON OUTER WALL = 5730 A/m
POWER DISSIPATION/M = 0.0989 MW/m
STORED ENERGY/M = 0.00004859*V(kV)**2 = 0.7684 J/m
QUALITY FACTOR (Q) = 14649
AVERAGE GRADIENT = 1257.5 MV/m/m
RFQ APERTURE = 1.0000 cm
VANE-TO-VANE VOLTAGE = 125.751 kV
SHUNT IMPEDANCE = 8313699/F**1.5/A**2 = 1598.36 MOhm/m
EZ ON THE AXIS (MV/m) FROM K = 1 TO 5.0.000 2.442 6.172 10.101 14.085
AT Z VALUES OF (cm)0.000 0.197 0.500 0.803 1.060
Fig. 24. RFQ Len. Electma! Properties Evaluated by SUPERFISH (SF05).
37

The RFQ lens requires a source of rf power. SAIC is currently developing a family of close-
coupled rf (CCRF) power systems, which promise many advantages over the conventional rf
power systems. They are designed to mount directly on the side of the resonant load and operate
in an extension of the resident vacuum system, thus eliminating many components of conventional
rf power systems such as rf output resonators, transmission lines, and vacuum windows.
One of these CCRF units, based on the Eimac Y-690 Planar Triode and capable of peak rf power
in excess of 20 kW, was used to power the RFQ lens. This unit, shown in Fig. 25, mounts inside
the tubular extension to the vacuum housing, shown in Fig. 26, and couples directly to the RFQ
lens fields.
The CCRF power amplifier is configured as a grounded-grid amplifier. The cathode is biased 40
volts positive with respect to ground by a Zener diode. The anode and cavity coupling loop
operate at an anode potential of about 6 kV. The anode is cooled by water which flows to and
from the anode cap through the loop. The rf currents are shorted to ground through an rf bypass
capacitor that is an integral part of the design.
Three chassis of the rf drive chain are shown in Figs. 27 and 28. The top unit (in both figures) is a
collection of broad-band, solid-state amplifiers that amplify one-milliwatt input to an output power
of 25 W. The latter stages of this collection are pulsed at the lens duty factor of one percent. The
lower two amplifiers in these figures are strip-line amplifiers based on the Eimac 8940 Planar
Triode. The middle unit takes an input of 25 W and amplifies it to 350 W. The lower unit takes an
input power of 350 W and delivers 2 kW to the output. This power is transmitted through an
ordinary RG-58 coax cable and a hermetically sealed SMA connector to the CCRF power amplifier
inside the RFQ lens vacuum housing.
38

lt
Fig. 25. The CCRF Power Amplifier and Designer.
0
Fig. 26. Vacuum and Power Test Configuration for the RFQ Lens.
39

* Fig. 27.CCRF DrivePower Chain(Front View).
Fig. 28.CCRF DrivePower Chain
* (Bottom View).
04

7. PRE-BEAM TESTS AND FINAL VANE DESIGN FOR THE RFQ LENS SYSTEM
Tests were performed at SAIC before proceeding to the beam tests at Fermi National Accelerator
Laboratory (FNAL) in order to check out and tune the lens and thereby maximize the utility of
valuable time at FNAL. In addition, the vane design had to be finalized, taking into account the
three-dimensional end effects described earlier. In order to experimentally investigate differentvane geometries, wooden vanes covered with aluminum tape were used as a source of readily
changeable geometries together with the outer portions of the cavity that had already been
fabricated. The lens cavity, loaded with the vanes that we had expected to use, resonated at 5889 MHz; substantially higher than the desired operating frequency of 300 MHz.
Since the magnitude of the rf frequency has a big effect on the RFQ focusing, it was important to
understand this discrepancy and develop an approach to achieve the desired resonant frequency of300 MHz. Although not planned or budgeted for this project, three-dimensional ARGUS
0 calculations were performed for this geometry, which confirmed the experimentally observed
resonant frequency.
We had expected the end effects in the RFQ lens cavity to reduce the resonant frequency of the
0 actual structure relative to the SUPERFISH prediction. These expectations were based on our
opinions that:
1) the shortening of the vanes to allow room for the magnetic fields to loop around the ends of
the vanes should increase the inductance of the circuit, and
2) the presence of the end wall near the vane tips should increase the capacitance of the circuit.
Both of these end effects should lower the resonant frequency of the structure. Nevertheless, just
the opposite happened.
This experimental observation has made us consider another, possibly more powerful, three-
dimensional effect. The end effects may have wrapped the magnetic fields tightly around the vanetip supports, causing them to operate as quarter-wave resonators. A quarter wavelength at 588
MHz is 5 inches; just the effective length of the original vanes.
Had the end effects lowered the frequency, as we expected, it would have been relatively simple to
raise the resonant frequency by building bulkier RFQ vanes to put inside the outer envelope of the
cavity. The inverse is not true. It is considerably more difficult to lower the resonant frequency of
a cavity of fixed outer geometry than it is to raise it.
41

We were left with two options to achieve the desired operating frequency for the RFQ lens: one
was to fabricate new, larger-diameter lens and vacuum enclosures, and the other was to modify the
geometry of the vanes sufficiently to load the resonant frequency of the cavity down to 300 MHz.
In the interest of budget and schedule, the latter option was chosen.
The resonant frequency of the RFQ lens was lowered to 300 MHz by narrowing the vane bodies to
rods (higher inductance) and adding tabs to the vane tips (higher capacitance to the end wall). For
purpose of comparison, a section of the RFQ lens is shown in Fig. 29 with both the original (top)
and modified (bottom) vane geometries.
These changes, however, resulted in a significantly lower rf efficiency and a lower Q for this lens,
with a significant increase in the rf power required to achieve the desired focusing strength from
the lens. Since we anticipated having some excess rf power, we decided to proceed with a beam
test of this lens unit as scheduled.
The assembled RFQ lens, with one cover plate removed, is shown in Fig. 1. The "vane tips" are
circular arcs, supported from base plates by radial rods of approximately one-half inch in diameter.
Four such assemblies are mounted inside a heavy-walled cylindrical cavity, 10 inches in diameter
and 3.5 inches long. The cylindrical cavity and vane bases are made of aluminum and copper-
plated for electrical conductivity. Each base plate is attached to the heavy cylindrical wall by two
concentric push/pull screw assemblies. Electrical contact between the vane bases and the cavity
wall is based on flexed fins at the edge of the vane bases. The mode spectra, Q measurement, and
distribution of fields on the four vane tips are shown in Fig. 30. The unwanted dipole modes are
at approximately 325 MHz, well separated from the desired quadrupole mode at 300 MHz. This
well-spaced separation of the dipole and quadrupole modes means that the alignment of the vanes
is not critical and can be accomplished by simple mechanical measurements. The unloaded Q of
the cavity is 2600; a factor of 5 lower than the SUPERFISH prediction of 14,649.
The RFQ lens is powered by a close-coupled rf (CCRF) power system. Matching of a CCRF
power system to a resonant cavity presents a problem for which there is little experience. The
output impedance of the Eimac Y-690, at full power (20 kW), is about 800 ohms. Conventional rf
power systems, in this frequency range, deliver their power through coaxial transmission lines
with an impedance of about 50 ohms. The higher impedance of the CCRF system suggests the
need for a considerably larger coupling loop. Since loop impedance varies directly as the square of
the loop area, one would expect the CCRF loop to be about four times the linear dimensions of the
conventional, 50- loop. A considerable effort was expended to find a generic 800-fl loop for the
RFQ lens cavity, independent of the actual CCRF hardware, using a network analyzer. This
42

.0
10
.. .. ..
.. ......
.. ..............
.0...... ... ......
0......... ...... .% ......
0. .... ........... .. .. .
0. .. .. . ... ....... .... .
* ~ ~ ~~~~~~~~~~~~~.... Fi.2....eswihOiinl(o)an.oiie.Btom.aeGemtis
4 3..... .........0.. ..... .... .. .... ..

0 0 0 0. vv0 x.~' 1I. 0 1 ci
*0 -- - -0
Xg N
0494 -0
I .
* - - - - - - - -- - - - - - - - - -Cc
W eM__

proved to be futile, as the details of the CCRF hardware contribute the majority of the needed
impedance.
The magnetic fields surrounding the anode and anode cap have a large effect on the impedance seen
by the amplifier. Furthermore, the impedance of the planar triode varies with excitation. The goal,
of course, is to achieve high efficiency power transfer from the tube to the cavity at peak excitation.
Since the cavity can only accept peak excitation under vacuum conditions, the final adjustments of
the CCRF coupling geometry can be macte only under these awkward conditions. Fortunately, the
CCRF amplifier and coupling loop are designed so that they can be rotated to change the effective
coupling to the RFQ lens while under vacuum operating conditions.
The RFQ lens system was set up under vacuum conditions, and tuned up for optimum
performance. Several water-cooled coupling loops were fabricated and tested. The optimum
performance was achieved with an effective loop area of about 0.4 square inches (loop area of
about 1.2 square inches, rotated to 70 degrees from maximum coupling). Under these conditions,
26 kW of rf power were delivered to the RFQ lens cavity in response to a net rf drive power of
1300 W (forward power of 1320 W and reflected power of 20 W) and a DC input power of 39 kW
(6.5 kV times 6 A). These data suggest an excellent match on the input side of the CCRF amplifier
(VSWR = 1.29), excellent gain for a single stage of amplification (power ratio of 20, or 13 db),
and an overall power efficiency of 67%. Both the grounded-grid circuit and the close-coupled
arrangement contribute to this excellent performance.
The RFQ lens and associated systems were then packed in cartons and shipped to FNAL for a test
of their performance on a 20 keV proton beam.
0
450

8. BEAM TESTS AT FERMI NATIONAL ACCELERATOR LABORATORY
A work-for-others agreement was negotiated with Fermi National Accelerator Laboratory (FNAL)
on April 10, 1990 "for the purpose of assembling an RFQ lens on a Fermilab ion source test bench
to study its operations and focusing properties for a period of no more than two weeks". It was
agreed that SAIC would compensate the laboratory an estimated $5,000 for this access and other
9 personnel and equipment support.
The principal technical contact at Fermilab was Chuck Schmidt, head of the Linac Department at
Fermilab. The ion source test stand was in the Preaccelerator R&D Laboratory in the basement of
the linac building, attended by technicians Ray Hren and Jim Wendt. Assistance in installation and
operation of beam diagnostic equipment and display and interpretation of beam diagnostic data was
provided by John Palkovic, Elliott McCrory and Chuck Schmidt. The SAIC team consisted of
Don Swenson and Steve Schmidt.
40 The ion source test stand at Fermilab consists of a duoplasmatron ion source mounted on one side
of a large aluminum box with many large access ports. The box and one access port were large
enough to allow the RFQ lens and its CCRF power system to be installed inside the box close to
the output of the ion source. The beam emittance measuring probe, which mounts on one of the* side ports, was modified so that it could measure the emittance of the beam close to the output of
the RFQ lens. An assembly of two viewing screens, one Faraday cup, and a glass window,
through which the viewing screens could be observed, were installed downstream from the RFQ
lens and beam emittance probe. This experimental arrangement is illustrated in Figs. 31-35.
Three chassis of the rf drive chain and two Fermilab power supplies were mounted in a rack,
interconnected, and brought into operation to produce 2 kW of pulsed rf power to drive the final
CCRF power amplifier. Initially, one amplifier of the drive chain was weak, reducing the
maximum drive power to 1.6 kW. For the last day of the experiment, the weak tube was replaced,
and the maximum drive power returned to the design value of 2 kW.
On the third day of the experiment, all systems were ready for beam tests. The ion source was
turned on to produce a 50-mA, 20-keV proton beam with an 80-g.s pulse length and a 15-Hz
repetition rate. The RFQ lens was powered to a level of about 15 kW with a 100-.s pulse
encompassing the beam pulse at the same repetition rate. The divergent proton beam flooded the
RFQ lens aperture with a few milliamperes passing through the lens to the Faraday cup. Uniform
beam spots, approximately the diameter of the lens aperture, were seen on both viewing screens.The emittance probe showed a diverging beam in the horizontal phase space with the RFQ lens
turned off.
46

P I 1:1
00
.0
0
CD 0 0
00
00co U)
Cu LLL
0E CuCu0 C Cuc r c
0 0 -o 0
0) 0 0n E- C 00 0 n
Cu 0* h. 0d.C
0 cc
0 c. 3*
"a 0 . C-
0 Cu0 0D 0 jCn 2nC : &.c 0 t2
a w 0 L. co Cu - Cuc.-0 + 0 0 D c : L 0 0 9
0 47a
El MrU
C -
L-

* C
1.)
~ 0
~ E
~LL~
.0I...
(V
12
4.)
* 0C
C-4)~,, U- I.-U, (.14.) u~
~
* .~ ~
S12
0
* 49

Beam observations were made using all ,vailable diagnostic devices with the RFQ lens both off
and on. The emittance measurement, which would normally be the keenest indication of focusing,
was difficult to interpret because of a strong electrical interference between the rf power for the lens
and the emittance scanner; whenever the RFQ lens was on, the majority of beam data channels
were saturated. Nevertheless, on some occasions, some traces of beam were seen through the rf
induced noise. An emittance plot of the beam obtained with the lens Qff is shown in Fig. 36 and,
for completeness, a plot with the lens on, is shown in Fig. 37. No evidence of focusing was seen
in either the Faraday cup signal, the viewing screen spots, or the emittance measurement.
We knew that we were short on rf power and that the rf efficiency of the lens was less than it
should have been. Nevertheless, ,e had expected to see some evidence of focusing and had
expected to use these data to calibrate our rf power requirements. In lieu of these data, we set
about to calibrate our rf power requirements through other means.
The RFQ lens was removed from the test stand and taken to a microwave measurements laboratory
at Fermilab. An electric probe was fabricated whose calibration could be calculated. This probe
was installed so as to sample the electric field from the vane tip. A small magnetic probe was
fabricated and installed so as to sample the magnetic field on an end wall opposite one of the vane
tip supports. The RFQ lens cavity was excited and the signals from these two probes were
recorded. These data are sufficient to calibrate the the monitor loop so that we could accurately
measure the vane tip potential.
While the RFQ lens was in the microwave measurements laboratory, we verified that the rf cavity
mode that we had been using in the beam tests was indeed the rf quadrupole mode, supporting our
earlier finding that the dipole and quadrupole modes are well separated in frequency. The field
distribution in the region between the vane tips was very much as expected.
0 On the fourth day of the experiment, the RFQ lens was re-installed in the test stand and, upon
excitation to the 16 kW level, the newly calibrated monitor loop indicated that we had a vane-to-
vane voltage of 28 kV, corresponding to a B-value of 0.3, which is a factor of four below the
design value.
40Subsequent TRACE calculations verified that, at this level of excitation, little or no focusing would
be seen. The TRACE calculation, shown in Fig. 38, reveals the action of the RFQ lens on a
typical 20-keV proton beam for three different excitations, namely B=0, 0.3, and 1.2. The
difference in the action of the lens for B--O (.f) and B=0.3 (g.1) is very slight. With the if-induced
electrical noise in the emittance measurement, this small difference would be impossible to
50

Thu Jun 7 14:55:52 1990 B -percent volume
4 fS103 'it 3* ~ .488 m
Y~fb252
4 4.92 rn~c/
KE 0.0336 Mev a
0Toroid 4 9 IDA t .962i0 .513n
* I .161
-25.37 19'.34
<X> -5.061,./- 8.74 mmli
<X = 4.394 +- 38.-6 mrad___ __________
Fig. 36. Emnittance Scan of Beam with RFQ Lens Off.
51

Thu Jun 7 14:58:48 1990 B -. prcent olume
pJw15'.I8 e
Cf -0.002m
y 2.54 r~jfw
KE 0.0337 Meva
Toroid 51.3 mA t 1.
0 7.64n
-25.12 19.59 ,
-- 5' 557./- 13.5 MM
-71'
-101.3 101.3 ......
<X' 51.62 +- 34A mrad ____________
Figa. 37. Emittance Scan of Beam with RFQ Lens On.
52

BE.AMI (lA- -10.0000 8- 2.000o
BFAM (N2) A 8.20 - 086A - -1 0 .0 0 0 0 B - 2 0 0 0N
0 .0 0 0 0 0A 1 ~ o 2 B 8 8
A- -10.0000 8- 2.000o EX 00 0.0
-- 210 =978EY- 56000 50.0866
CODE: TRACE V42FILE: RFQLTEST1 DAT;10DATE: 30
-AUG-90*TIME: 16:53:01
A- -10.0000 B .00A
8.69 B 061
A- -10.0000 B- 2.000 0 A-r -1 .2 1
A - -l .0 00 0 a- 2 .0000A-
2 .1 0 B- . 08
A- 22.200 B- 6.9727
0 B 0.0 -.
B0.3
Veert
0.
0 .
2 33
observe. The remainder of the fourth day was spent upgrading the rf power system for maximum
power output (26 kW), trying to reduce the crosstalk between the rf power system and the
emittance scanner, and making additional TRACE calculations.
On the fifth day of the experiment a round spot was seen on both the fluorescent viewing screen
and the quartz viewing screen. While we do not completely understand this phenomenon, we
speculate that the spot is due to the focusing of an undefined component of the ion source beam.
This speculation is discussed more fully in Section 9. The round nature of the spot is a valuable
feature of the RFQ lens, indicating similar action of the lens on both transverse components of the
beam. The radius of the spot responded to changes in lens excitation as expected. A sequence of
these spots for different lens excitations, is shown in Fig. 39. The smallest spot (a) corresponds to
the case where the beam is focused on the screen with a vane-to-vane voltage of 14.9 kV
(B=0.16). When the lens excitation is increased (b, c, and d), the spot radius increases as the
beam comes to a focus before the screen and then diverges as it expands to the plane of the screen.
As indicated in Section 7, the power of this lens was inadequate to focus the principal component
of the beam (20 keV protons) to the observed spot on the viewing screen. Nevertheless, the
observation of this phenomenon, assuming it involves the focusing of some undefined component
of the beam to a well-defined circular spot on a viewing screen, constitutes a valuable proof-of-
principle test of the RFQ lens.
54

00 00
0
Ii II*> >)4
4) 4)
* 2ON
4) 4)
ca c0
u
55o

9. POST BEAM TEST OBSERVATIONS
An effort was made to find an explanation for the spots that were seen on the last day of the beam
experiments at Fermilab. Beam components involving heavier particles, lighter particles, higher
charge states, and lower energies were considered. There is some chance that there are some 20-keV molecular oxygen, nitrogen, or water vapor ions in the beam. TRACE indicates, however,
that these ions, being 14-to-18 times heavier than protons, would be focused less strongly thanprotons and do not provide an explanation for the observed spot. Electrons, on the other hand, areso light that the lens excitation was hundreds of times too strong to focus them into a spot.
TRACE indicates that the mass of the 20-keV particle that would form a spot, for a lens excitation
of B--0.16, is something like one-twentieth of a proton mass. It is highly unlikely that there are
any particles of this mass in the beam. TRACE also indicates that the energy of the proton beam
that would form a spot for this lens excitation is 0.28 keV. It is difficult to invent a scenario thatcould produce protons of this energy in the beam. Due to vacuum conditions, geometric
arrangement, and viewing screen response, we conclude that it is unlikely that the spots were
formed by x-rays or glow discharge. None of these avenues yield a plausible explanation for the
observed beam spot.
As a result of the 3-D ARGUS calculations and pre-beam vane tests, we have a deeper
understanding of the interplay of end effects and resonant frequency and vane design. This can beillustrated with a series of SUPERFISH runs. Figure 40 shows a radial section (the two-
dimensional SUPERFISH space) through a series of four loaded pillbox cavities. The smallgeometry on the left, labeled "Base Case", represents the RFQ lens cavity with the original vanes.
In this case, it resonates at the relatively high frequency of 559 MHz. In the "Intermediate Case",
the frequency has been lowered to 434 MI- ')y increasing the radius of the tab on the end of theloading post. In the "Loaded Case", corresponding to the RFQ lens cavity as modified, the
frequency has been lowered the rest of the way to 300 MHz by reducing the radius of the loading
post. Note that, in so doing, both the Q of the cavity has reduced and the power requirement for
the cavity has increased by a substantial factor. The large geometry on the right, labeled "Enlarged
Case", represents the other viable option for lowering the resonant frequency of the lens, namely to
enlarge the diameter of the outer cavity. Note that the Q of the enlarged case is 4.3 times that of theloaded case and that the power requirement of the enlarged case is approximately one-fifth (1/5)
that of the loaded case.
Armed with these computational and experimental results, an evolutionary family of RFQ lensgeometries emerges and is shown in Fig. 41. The geometry on the left, labeled "Loaded Radial
Support", corresponds to the lens that was built and tested during this project. The second
56

* 3E
0 CV) oN
0~0
4) C 4 L P
CVC
Ci C4
*0 M~ C V
CD
* 57

01
03
00
Cc4 0 c
0 20 0
.- vo. "0 -0 C
0 0
58

geometry from the left corresponds to a larger diameter structure with the original vane geometry,
which promises to have a higher Q. The third geometry from the left is not a lens, but suggests the
interesting lens geometry shown on the right, namely the high-Q, four-finger, TM-mode, RFQ
lens. The four fingers in this geometry present a light capacitive load in the center of a large
diameter high Q pillbox cavity. In that respect, it is similar to the enlarged SUPERFISH geometry
shown in Fig. 41. SUPERFISH can be used to approximate the electrical performance of this
four-finger geometry, which should have a higher rf efficiency than geometries using the radial
supports.
Although good design guidance can be obtained from two-dimensional SUPERFISH calculations,
the importance of a three-dimensional rf calculational capability is clearly evident from the results
reported here. In any future work involving unfamiliar, three-dimensional geometries, we would
employ three-dimensional calculations to obtain essential frequency and performance data.
As discussed above, an RFQ lens cavity with 5 times the rf efficiency than the lens constructed
here can be built. In combination with an rf power source with 4 times the power available from
the present unit an RFQ lens with the desired performance would be within range. As part of the
further development of the SAIC accelerator test stand, the Accelerator Technology Division is
currently developing a higher-powered CCRF system, based on two higher powered, Eimac YU-
176 Planar Triodes. The new unit should be capable of producing 60-80 kW of peak rf power.
The test stand produces a proton beam suitable for testing RFQ lenses. This factor of 20 in the
(efficiency x power) product offers fields and lens strengths that are larger, by the square root of
20, than those available in the present experiment. This would raise the B-value from the present
0.3 to something in excess of the design value of 1.2.
Another way to increase the B-value of the lens is to lower the rf frequency. By dropping the rf
frequency from 300 MHz to 150 MHz, the B-value, which goes inversely as the square of the
frequency, would increase from the present value of 0.3 to the design value of 1.2. Due to the
requirement for at least 3*3PX matching sections at the entrance and exit to the lens, lower
frequency will lengthen the lens and the aperture will have to be increased leading to increased rf
power requirements. However, this should be more than offset by the fact that the rf power
required (barring length and aperture changes) scales with the inverse of the frequency to the fourth
power.
Hence, there appear to be many combinations of higher efficiency, higher power, and lower
frequencies that will yield RFQ lenses with useful focal properties.
59