c copyright 2009 springer-verlag notice changes … issue for the reliability of electricity...
TRANSCRIPT

This is the author’s version of a work that was submitted/accepted for pub-lication in the following source:
Li, Zhengrong, Liu, Yuee, Walker, Rodney A., Hayward, Ross F., & Zhang,Jinglan(2009)Towards automatic power line detection for a UAV surveillance system us-ing pulse coupled neural filter and an improved Hough transform.Machine Vision and Applications, 21(5), pp. 677-686.
This file was downloaded from: https://eprints.qut.edu.au/29121/
c© Copyright 2009 Springer-Verlag
Notice: Changes introduced as a result of publishing processes such ascopy-editing and formatting may not be reflected in this document. For adefinitive version of this work, please refer to the published source:
https://doi.org/10.1007/s00138-009-0206-y

Towards Automatic Power Line Detection for UAV Surveillance System Using Pulse Coupled Neural Filter and Hough Transform
Zhengrong Li·Yuee Liu·Rodney Walker·Ross Hayward·Jinglan Zhang
Abstract Spatial information captured from optical remote
sensor on board unmanned aerial vehicles (UAVs) has great
potential in automatic surveillance of electrical
infrastructure. For an automatic vision based power line
inspection system, detecting power lines from cluttered
background is one of the most important and challenging
tasks. In this paper, a novel method is proposed specifically
for power line detection from aerial images. A pulse couple
neural filter is developed to remove the background noise
and generate edge map prior to Hough transform being
employed to detect straight lines. An improved Hough
transform is used by performing knowledge-based line
clustering in Hough space to refine the detection results. The
experiment on real image data captured from a UAV
platform demonstrates that the proposed approach is
effective for automatic power line detection.
Keywords Machine vision·Power line inspection
system·Unmanned Aerial Vehicles (UAVs) ·Hough
Transform·Pulse coupled neural filter·knowledge-based
system
1 Introduction
Surveillance and maintenance of electrical infrastructure is a
critical issue for the reliability of electricity transmission.
Inspection and management of vegetation around power
lines is a significant cost component of maintenance of the
electrical infrastructure. For example, Ergon Energy, one of
the top electricity companies in Australia, currently spends
$80 million a year inspecting and managing vegetation that
encroaches on power line assets. Ineffective surveillance
could lead to loss of reliability of electricity transmission and
produce serious hazards (e.g. the power outages happened in
Canada and USA in 2003) [1, 2]. Currently, most electricity
companies use calendar-based ground patrol [3]. However,
calendar-based inspection by linesman is labor-intensive,
time consuming and expensive. It also results in some zones
being inspected more frequently than needed and others not
often enough.
Satellites and aerial vehicles can pass over more
regularly and automatically than the ground patrol.
Therefore, remote sensing data captured from satellite and
airborne sensors has great potential in assisting power line
corridor monitoring. Two critical limitations for using
current satellite sensors are the unfavorable revisit time and
lack of choices in optimum spatial and spectral resolutions
[4]. Airborne platform is an alternative but the traditional
piloted airborne platforms are limited by their high
operational costs. Remote sensors mounted on Unmanned
Aerial Vehicles (UAVs) have the potential to fill this gap, by
providing a cheap and flexible way to gather spatial data
from power line corridors which can meet the requirements

of spatial, spectral, and temporal resolutions. Overhead
power line inspection in remote and rural areas is an ideal
application for UAVs because of less population density and
large distribution of power line network. UAVs can fly
relatively close to the power line, providing a cheap and
flexible way to gather spatial data in power line corridor. In
order to achieve automatic power line surveillance and
inspection using UAVs, power line extraction is required
because (1) it is useful for guiding the UAVs flying along the
line and automatically collecting data in power line corridor;
(2) risk assessment of power lines and the adjacent trees is
meaningful only when power lines can be recognized.
There has been very limited investigation involved in
developing algorithms for automatic extraction of power
lines from aerial images because power lines in traditional
aerial images are too small to be detected due to the flight
height and resolution of the camera. Although straight line
detection is a common and well studied research area in
machine vision, most of the existing algorithms take bottom-
up approaches which just use the intensity of single pixels.
However, the qualitative performance of these algorithms
varies widely across application domains as our notion of
what constitutes a line can vary from one application area to
another. Due to the wide variation of line types encountered
in the UAV images that are not of interest, we require a more
top-down approach that takes advantage of our
understanding of line in this application area.
In this research, we combine the bottom-up and top down
approaches and propose a knowledge-based technique
specifically for power line detection in aerial images. The
proposed method is tested on real image data captured from
a UAV platform in Queensland rural areas.
The remainder of the paper is structured as follows.
Section 2 briefly introduces related work in power line
extraction. In section 3, our proposed approaches are
described in detail. Section 4 present and discuss the
experimental results and section 5 concludes our work.
2 Related works
Most energy companies use Geographic Information
Systems (GIS) to record locations of their assets (e.g. power
poles), from which power line information can be inferred.
However, in general the accuracy of such information is only
suitable as a general guide. For an automatic power line
inspection system using machine vision, the major problem
focuses on how to effectively extract power lines from
complicated image backgrounds.
Automatic power line detection from aerial imagery is a
rather challenging task, especially when the background is
cluttered. There has been very limited investigation involved
in developing algorithms for the automatic power line
extraction due to the low resolution of traditional aerial
images. Some work on the visual control of an Unmanned
Aerial Vehicle (UAV) for power line inspection has been
simulated using a laboratory test rig [5]. They proposed an
automatic power line detection method based on Hough
transform, but the approach was just a simulation of straight
line detection and not evaluated in real image data. More
recently, the Radon transform was used to extract line
segments of the power lines, followed by a grouping method
to link each segment, and a Kalman filter was finally applied
to connect the segments into an entire line [6]. Although
some properties of power lines in the aerial image were
discussed, the algorithms in [6] just focus on straight line
detection, image edges and other mistakable linear features
which are similar to power lines were not considered.

3 The proposed method
The Hough transform is an effective tool for detecting
straight lines in images, thus it is a natural choice for the task
of automatic power line detection. In real applications of
straight line detection, an edge detector is often used to
remove irrelevant data and reduce the computational cost
prior to the Hough transform being employed. However, the
application of classic edge detectors to the aerial images has
demonstrated that they are sensitive to image noises, due to
complex and irregular ground coverage. In this paper, we
take advantage of the characteristics of power lines in aerial
image and propose a filter based on a simplified pulse
coupled neural network (PCNN) model. This filter can
simultaneously remove the background noise of power lines
as well as generate edge maps. After that, an improved
Hough transform is used by performing knowledge-based
line clustering in Hough space to refine the detection results.
3.1 Characteristics of power lines
Based on our observation, power lines in aerial image have
the following characteristics:
(1) A power line has uniform brightness and the color
looks different from upward and downward view. Viewing
from the ground power line is usually dark, whereas viewing
from the sky power line is brighter than the background
simply because it is made of specific metal and has larger
light reflection.
(2) A power line approximates a straight line although
power line sag often exists. Due to the limited coverage area
of a single image, the widths of power lines in the image
tend to be similar. In addition, the lengths of power lines in
one image are similar and power line is usually the longest
line as it crosses the entire image.
(3) Power lines are approximately parallel to each other.
Due to the forward angle of imaging sensor and deviation
from centre, power lines in the image are not completely
parallel. However, the intersection of two power lines
usually occurs far out of range of the image due to the
limited size of images, and the intersecting angle of two lines
is usually very small. A simplified illustration is shown in
Figure 1.
(a) (b)
Figure 1 Power lines from different perspectives: (a) from the above view
(b) from the forward view and offset centre
3.2 Design of pulse coupled neural filter
Given that power lines are made of special metal, they have
different solar reflectance compared to other background
materials (e.g. grass, soil, and bitumen). This knowledge can
be used for preliminary detection of power lines from aerial
images. Using a filter to remove the irrelevant information
will be helpful to reduce the false detection rate as well as
the computational cost of line detection algorithm. Threshold
filtering may be a practical solution. However, it is not
robust because filtering by a threshold is sensitive to image
noise and different thresholds may be required due to
changing light conditions of the captured images. In this
paper, a pulse coupled neural filter (PCNF) is developed for
preliminary detection of power lines as well as edge maps
generation.
Pulse-Coupled Neural Network (PCNN) is a relatively
new biologically inspired approach based on the
understanding of visual cortical models of small mammals
[7]. Unlike other neural works, the processing is automatic
and there is no training involved in PCNN. The time
signatures generated from PCNN has the ability to extract
edge information, texture information, and to segment the
image. This type is very useful for image recognition
engines.
3.1.1 Standard PCNN model
Most PCNNs are based on the Eckhorn model [8]. When
applied to image processing, PCNN is a single layered, two-
dimensional, laterally connected neural network of pulse
coupled neurons. Each neuron corresponds to one pixel in an
input image, receiving its corresponding pixel’s color
information (e.g. intensity) as an external stimulus. The
neuron also connects with its neighboring neurons, receiving
local stimuli from them. Thus, every neuron can be
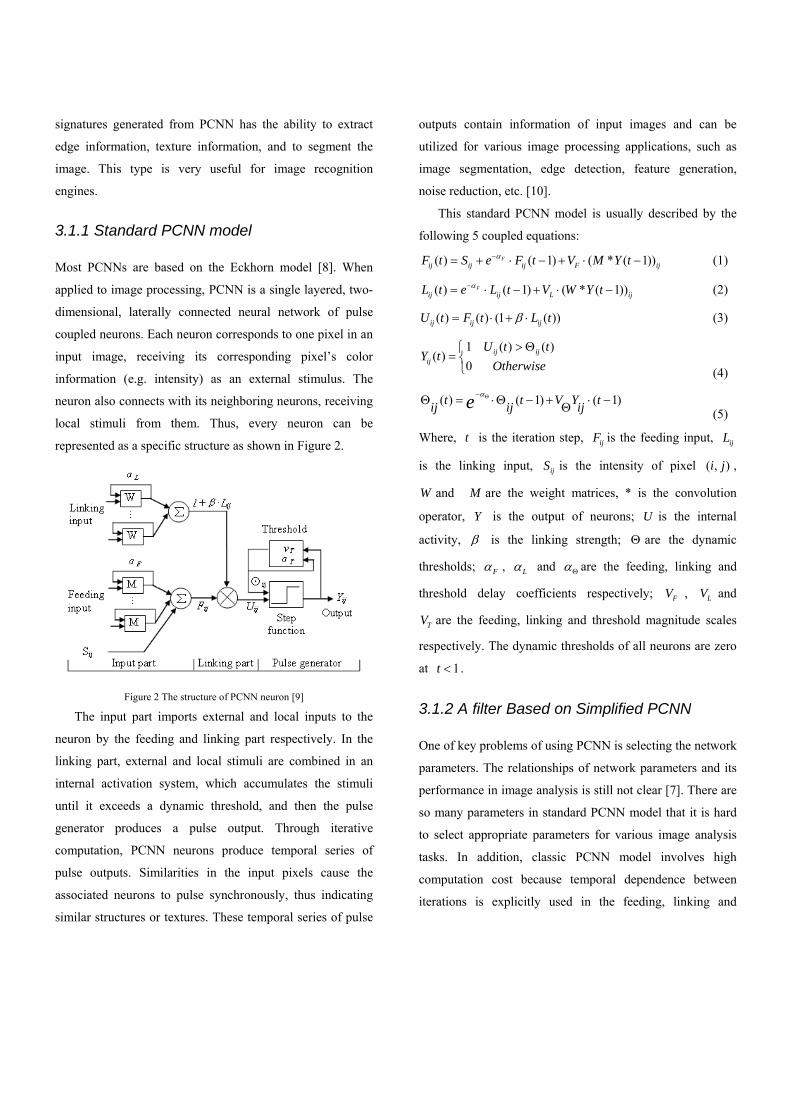
represented as a specific structure as shown in Figure 2.
Figure 2 The structure of PCNN neuron [9]
The input part imports external and local inputs to the
neuron by the feeding and linking part respectively. In the
linking part, external and local stimuli are combined in an
internal activation system, which accumulates the stimuli
until it exceeds a dynamic threshold, and then the pulse
generator produces a pulse output. Through iterative
computation, PCNN neurons produce temporal series of
pulse outputs. Similarities in the input pixels cause the
associated neurons to pulse synchronously, thus indicating
similar structures or textures. These temporal series of pulse
outputs contain information of input images and can be
utilized for various image processing applications, such as
image segmentation, edge detection, feature generation,
noise reduction, etc. [10].
This standard PCNN model is usually described by the
following 5 coupled equations:
( ) ( 1) ( * ( 1))Fij ij ij F ijF t S e F t V M Y tα−= + ⋅ − + ⋅ − (1)
( ) ( 1) ( * ( 1))Fij ij L ijL t e L t V W Y tα−= ⋅ − + ⋅ − (2)
( ) ( ) (1 ( ))ij ij ijU t F t L tβ= ⋅ + ⋅ (3)
1 ( ) ( )( )
0ij ij
ij
U t tY t
Otherwise> Θ⎧
= ⎨⎩ (4)
( ) ( 1) ( 1)t t V Y tij ij ije αΘ−Θ = ⋅Θ − + ⋅ −Θ (5)
Where, t is the iteration step, ijF is the feeding input, ijL
is the linking input, ijS is the intensity of pixel ( , )i j ,
W and M are the weight matrices, * is the convolution
operator, Y is the output of neurons; U is the internal
activity, β is the linking strength; Θ are the dynamic
thresholds; Fα , Lα and αΘ are the feeding, linking and
threshold delay coefficients respectively; FV , LV and
TV are the feeding, linking and threshold magnitude scales
respectively. The dynamic thresholds of all neurons are zero
at 1t < .
3.1.2 A filter Based on Simplified PCNN
One of key problems of using PCNN is selecting the network
parameters. The relationships of network parameters and its
performance in image analysis is still not clear [7]. There are
so many parameters in standard PCNN model that it is hard
to select appropriate parameters for various image analysis
tasks. In addition, classic PCNN model involves high
computation cost because temporal dependence between
iterations is explicitly used in the feeding, linking and

threshold updating components. In this paper, a simplified
model is developed inheriting the characteristics of classic
PCNN model and is described by equation 6-10:
( ) _ijF t quantized I= (6)
,
( ) ( 1)ij Lkl klk l K
L t W Y t∈
= × −∑ (7)
( ) ( ) ( )ij ij ijU t F t L tβ= + × (8)
1 ( ) ( )( )
0ij ij
ij
U t tY t
other> Θ⎧
= ⎨⎩
(9)
( 1)( )
( ) ( 1) 0
t stepijtij V t if Ya tT ij ij
Θ − −⎧⎪Θ = ⎨ ×Θ − ≠⎪⎩
(10)
The symbols in equations (6-10) represent the same
meanings as in the standard PCNN model by equations (1-5).
We simplified the feeding input to be just external
stimuli from image data and stimuli from neighboring
neurons are not considered. This simplified model still keeps
the characteristics of classic PCNN in that temporal
dependence is implicitly included as the neuron outputs in
the linking part come from the previous iteration. In this
paper, original RGB images are transformed to HIS color
space and the intensity component I is used as the feeding
input. Moreover, the intensity component is uniformly
quantized to 64 levels in order to reduce the intensity
variation in image regions. This is helpful for filtering
regions with similar intensities.
Figure 3 Linking weight matrix LW
The linking input has also been simplified in that only 8
(i.e. 33× window) neighbors are adopted in the linking
weight matrix LW . Each element in LW is the reciprocal of
Euclidean distance between this element and the centre of
the window (Figure 3). In this case, neighboring neurons
with the closer distance have greater impact on the central
neuron. For the calculation of neuron internal statusU , a
new linear modulation of feeding and linking input is used to
avoid zero-valued pixel’s influence to the internal status of
its neighboring pixels. The linking strength β in this research
is set to be 0.2. The pulsed output of neuron Y is binary,
and if the neuron pulsed 1=Y , otherwise 0=Y . Initially Y
is set to be a zero-valued matrix. Whether a neuron can pulse
or not depends on the comparison of its internal statusU with
the dynamic thresholdΘ . The thresholdΘ is initialized to
be larger than the maximum value of external stimulus and
gradually decays. The dynamic threshold Θ is changing
during the iteration operation to control neuron pulse. If the
neuron has been pulsed, a large threshold is given to this
neuron by implying a magnitude scale TV to make sure it
will not pulse in a while. Otherwise the threshold of this
neuron will be decayed by subtracting a step value step .
Given that power lines have higher light reflectance and
are usually brighter than the background, they can be
roughly detected from the temporal series of PCNN pulsed
outputs. In the early stage of the iteration, neurons
correspond to power lines pulsed because they have larger
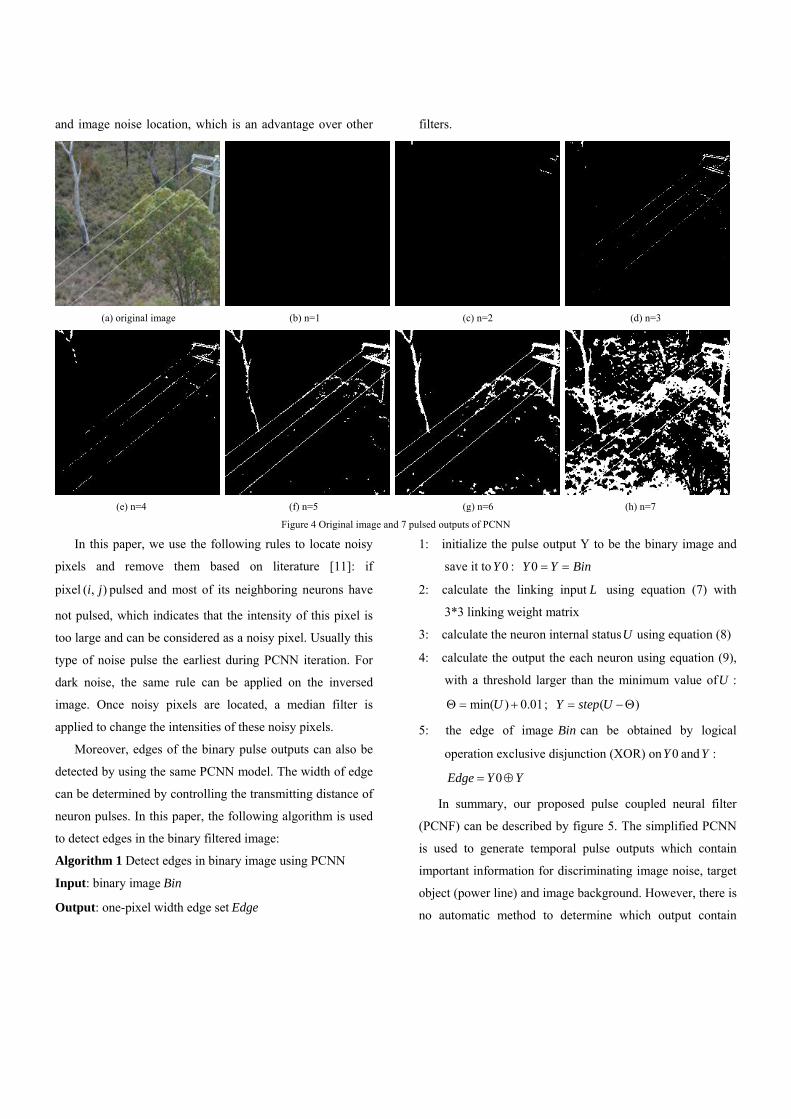
external stimulus than most of the background area. Figure 4
shows an aerial image contain power lines and 7 temporal
pulse outputs in different iterations of PCNN. As is shown in
Figure 4, in the first iteration of PCNN, no neuron pulses
because of the high initial threshold. With the progress of
PCNN iteration, neurons corresponding to power lines pulse
earlier than other objects in the image. From the temporal
outputs of PCNN, different objects of interest can be
extracted because PCNN tends to group pixels with similar
intensities and structures and also considers spatial
relationships among neurons. The temporal information
generated by PCNN is also useful for image segmentation
and image noise location, which is an advantage over other filters.
(a) original image (b) n=1 (c) n=2 (d) n=3
(e) n=4 (f) n=5 (g) n=6 (h) n=7
Figure 4 Original image and 7 pulsed outputs of PCNN
In this paper, we use the following rules to locate noisy
pixels and remove them based on literature [11]: if
pixel ( , )i j pulsed and most of its neighboring neurons have
not pulsed, which indicates that the intensity of this pixel is
too large and can be considered as a noisy pixel. Usually this
type of noise pulse the earliest during PCNN iteration. For
dark noise, the same rule can be applied on the inversed
image. Once noisy pixels are located, a median filter is
applied to change the intensities of these noisy pixels.
Moreover, edges of the binary pulse outputs can also be
detected by using the same PCNN model. The width of edge
can be determined by controlling the transmitting distance of
neuron pulses. In this paper, the following algorithm is used
to detect edges in the binary filtered image:
Algorithm 1 Detect edges in binary image using PCNN
Input: binary image Bin
Output: one-pixel width edge set Edge
1: initialize the pulse output Y to be the binary image and
save it to 0Y : 0Y Y Bin= =
2: calculate the linking input L using equation (7) with
3*3 linking weight matrix
3: calculate the neuron internal statusU using equation (8)
4: calculate the output the each neuron using equation (9),
with a threshold larger than the minimum value ofU :
min( ) 0.01UΘ = + ; ( )Y step U= −Θ
5: the edge of image Bin can be obtained by logical
operation exclusive disjunction (XOR) on 0Y and Y :
0Edge Y Y= ⊕
In summary, our proposed pulse coupled neural filter
(PCNF) can be described by figure 5. The simplified PCNN
is used to generate temporal pulse outputs which contain
important information for discriminating image noise, target
object (power line) and image background. However, there is
no automatic method to determine which output contain

power lines and which just contain image noise. According
to our experiments, in most cases the output of the third
PCNN iteration is a safe choice because pixels
corresponding to power lines pulsed and most of the
background pixels have not pulsed. After that,
morphological filter is applied to the binary pulse image for
post-processing purpose which will make the detected object
more continuous. Finally the same PCNN model is used to
generate the edge image according to algorithm 1.
Figure 5 The structure of pulse coupled neural filter
(a) original image (b) Canny filter on (a) (c) Sobel filter on (a) (d) PCNF on (a)
(e) noised image (f) Canny filter (e) (g) Sobel filter on (e) (h) PCNF on (e)
Figure 6 Comparison of Canny filter, Sobel filter and PCNF
Figure 6 compares the results using Canny filter, Sobel
filter and our proposed pulse couple neural filter (PCNF) on
synthetic images with and without noise. The aim of the
simulation is try to detect the three light lines in images and
generate the edge map. As is shown in the figure, Canny and
Sobel filter try to detect any edge in image and are very
sensitive to image noises. While the proposed pulse coupled
neural filter (PCNF) is more flexible because it can be used
to detect the interested edges rather than detect all edges in
the image. Moreover, PCNF is more robust when image is
contaminated with pepper and salt noise (see the second row
of Figure 6).
3.2 Knowledge-based line clustering in Hough space
Hough transform is used to detect parameterized shapes (e.g.
lines, circles) through mapping each point to a new

parameter space in which the location and orientation of
certain shapes could be identified [12]. When applied to
detect straight lines in an image, the Hough Transform
usually parameterizes a line in the Cartesian coordinate to a
point in the Polar coordinate (Figure 7) based on the point-
line duality using the equation:
ρθθ =+ )sin()cos( yx (11)
Alternatively, this parameterization maps collinear points
into a set of intersecting sinusoidal curves in the parameter
space. The lines in the Cartesian coordinate can be estimated
by detecting points of intersections of these curves (i.e.,
peaks) in the Polar coordinate [13]. These peaks in the
parameter space can be obtained using a voting mechanism.
Hough Transform has been proven to be effective method for
line detection. However, it does have some limitations such
as high computational cost and mistakable detection of
spurious lines. In order to solve these problems, Fernandes
and Oliveira proposed an improved Hough transform by
introducing a new voting scheme to avoid the brute-force
approach of one pixel voting for all potential lines [14].
Instead, the approach operates on clusters of approximately
collinear pixels by using an oriented elliptical-Gaussian
kernel that models the uncertainty associated with the best-
fitting line with respect to the corresponding cluster. Figure 7
(a) and (b) show their voting procedures and the 3D
visualization of voting maps respectively. The letters A-H
indicate the clustered segments that voted to each peaks. In
this paper, we extended this improved Hough transform for
power line detection purpose.
(a) (b)
(c) (d)
Figure 7 Voting procedures and the 3D visualization of voting maps
Hough transform is an effective tool to detect straight
lines, but does not intelligently identify power lines. Any
linear objects will be detected, such as edge of roads and
rivers, fences, etc. Although using PCNF can significantly
Votes
θ ρ
Votes
θ ρ

decrease the influence of other linear edges, problem still
exist especially when the linear object has similar color with
power lines. In order to discriminate power lines from other
linear objects, we use a k-means algorithm to cluster all
detected lines to identify the lines of interest.
The objective of data acquisition in our project is to
achieve a low flying altitude where a typical 12mm
transmission lines will be represented by at lease two pixels.
Therefore, each power line is detected as at least two Hough
lines in the edge image. Power lines are almost parallel with
very similar angles, and a power line is usually the longest
line as it crosses the entire image, while other detected lines
do not have this regular property. Based on this idea, a
cluster schema is employed in the Hough transform voting
procedure to group the parallel lines and output the cluster
with largest summation of votes as candidate powerlines (as
shown in Algorithm 2). Figure 7 (c) and (d) illustrate this
clustering schema and show the 3D visualization of voting
maps. Parallel lines are grouped together and the cluster with
largest summation of votes indicates that the dominate lines
of the image are in this cluster.
Algorithm 2 Knowledge-based line clustering in the Hough
space
Input: detected Hough line set ( , , ) ( 1, 2,..., )iLs votes i nρ θ = ,
where n is the number of detected lines, ρ and θ are the
coordinates of pixels in Hough parameter space, votes is the
accumulate number of votes of each detected Hough line.
Output: candidate power lines CPLs
1: calculate the line groups ( 1, 2,..., )jC j k= using K-
means on θ values of ( 1,2,... )iLs i n= , where k is the
number of line clusters (in this paper we choose 4k = ).
2: calculate the summation of votes in each cluster
1
( )k
j ij
SumVotes Ls votes=
= ∑
3: find the cluster mC with largest value of SumVotes ,
where max( )( 1,2,... )m jSumVotes SumVotes j k= =
4: output the lines in cluster mC as candidate power lines
mCPLs C=
4 Experiment and discussion
The experiment is performed on real image data captured
from two Unmanned Aerial Vehicle (UAV) platforms: V-
TOL Aerospace BAT-3, and ARCAA UAV platform Eleanor
(Figure 8).
(a) (b)
Figure 8 UAV platforms: (a) BAT-3; (b) Eleanor
In the experiment, we compare Hough line detection
results on edge maps generated from Canny and our
proposed pulse coupled neural filter (PCNF). The results
before and after using knowledge-based line clustering in
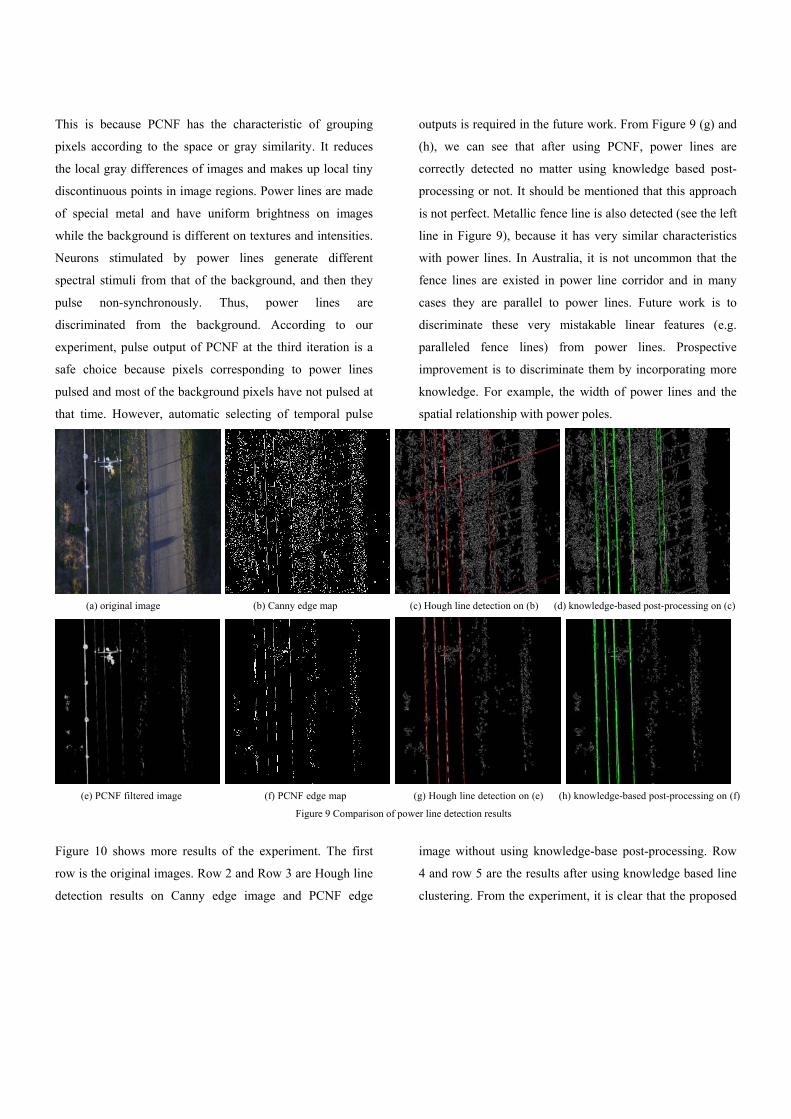
Hough space are also compared. As is shown in Figure 9 (a),
there are many linear features in the original image: power
lines, edges of road, shadows, etc. These linear features are
detected by Hough transform (see Figure 9 (c), shown in red
lines). Although some of these lines can be eliminated by
applying knowledge based post-processing, lines such as
road edges are not removed because they are parallel to
power lines (see Figure 9(d), shown in green lines). A better
choice is trying to avoid the misleading information before
detecting power lines. In this paper, we use the proposed
PCNF for preliminary detection of power lines and edge
maps generation. It can be seen from Figure 9 (e) that most
irrelevant points are filtered, though a few noises still exist.
This is because PCNF has the characteristic of grouping
pixels according to the space or gray similarity. It reduces
the local gray differences of images and makes up local tiny
discontinuous points in image regions. Power lines are made
of special metal and have uniform brightness on images
while the background is different on textures and intensities.
Neurons stimulated by power lines generate different
spectral stimuli from that of the background, and then they
pulse non-synchronously. Thus, power lines are
discriminated from the background. According to our
experiment, pulse output of PCNF at the third iteration is a
safe choice because pixels corresponding to power lines
pulsed and most of the background pixels have not pulsed at
that time. However, automatic selecting of temporal pulse
outputs is required in the future work. From Figure 9 (g) and
(h), we can see that after using PCNF, power lines are
correctly detected no matter using knowledge based post-
processing or not. It should be mentioned that this approach
is not perfect. Metallic fence line is also detected (see the left
line in Figure 9), because it has very similar characteristics
with power lines. In Australia, it is not uncommon that the
fence lines are existed in power line corridor and in many
cases they are parallel to power lines. Future work is to
discriminate these very mistakable linear features (e.g.
paralleled fence lines) from power lines. Prospective
improvement is to discriminate them by incorporating more
knowledge. For example, the width of power lines and the
spatial relationship with power poles.
(a) original image (b) Canny edge map (c) Hough line detection on (b) (d) knowledge-based post-processing on (c)
(e) PCNF filtered image (f) PCNF edge map (g) Hough line detection on (e) (h) knowledge-based post-processing on (f)
Figure 9 Comparison of power line detection results
Figure 10 shows more results of the experiment. The first
row is the original images. Row 2 and Row 3 are Hough line
detection results on Canny edge image and PCNF edge
image without using knowledge-base post-processing. Row
4 and row 5 are the results after using knowledge based line
clustering. From the experiment, it is clear that the proposed

pulse coupled neural filter (PCNF) is very useful as a pre-
processing tool. Most noises are filtered and power lines are
prominent in the images. After using PCNF, fewer irrelevant
lines exist. Applying knowledge-based post-processing by
clustering lines in the Hough space also increases the
accuracy of power line detection. Combination of these
techniques can significantly increase the accuracy of power
line detection in the complex environment.
5. Conclusion
In this paper, a novel method is proposed specifically for
power line detection from aerial images. First, a pulse couple
neural filter is developed to remove the background noise
and generating edge map prior to Hough transform being
employed to detect straight lines. After that a knowledge
based line clustering is performed in the Hough space to
refine the detection results. The experiment on real image
data captured from our UAV platforms demonstrates that the
proposed approach can significantly increase the accuracy of
power line detection in complex environment.
Acknowledgement: This research is sponsored by CRC-SI project 6.07:
spatial information business improvement at Ergon Energy.
REFERENCES
1. Appelt, P.J. and J.W. Goodfellow, Research on How Trees
Cause Interruptions- Applications to Vegetation Management,
in IEEE Rural Electric Power Conference. 2004: Scottsdale, Arizona.
2. Beck, K. and R. Mathieu, Can Power Companies use Space Patrols to Monitor Transmission Corridors?, in ESRI User Group Conference. 2004: San Diego.
3. Russell, B.D., et al., Reliability Based Vegetation Management Through Intelligent System Monitoring, in Power Systems Engineering Research Center. 2007, Texas A&M University: Texas.
4. Berni, J.A.J., et al., Thermal and Narrowband Multispectral Remote Sensing for Vegetation Monitoring From an Unmanned Aerial Vehicle. IEEE Transactions on Geoscience and Remote Sensing, 2009. 47(3): p. 722-738.
5. Golightly, I. and D. Jones, Visual Control of an Unmanned Aerial Vehicle for Power Line Inspection, in 12th International Conference on Advanced Robotics. 2005: Seattle, WA.
6. Yan, G., et al., Automatic extraction of power lines from aerial images. IEEE Geoscience and Remote Sensing Letters, 2007. 4(3): p. 387-391.
7. Ma, Y., et al., Principle and Applications of Pulse-Coupled Neural Networks. 2005, Beijing: Science Press.
8. Eckhorn, R., et al., A neural network for feature linking via synchronous activity: Results from cat visual cortex and from simulations, in Models of Brain Function, R.M.J. Cotterill, Editor. 1989, Cambridge University Press: Cambridge. p. 255-272.
9. Forgáč, R. and I. Mokriš. Formal Representation of Images by Pulse Coupled Neural Networks. in 3rd Slovakian-Hungarian Joint Symposium on Applied Machine Intelligence 2005. Slovakia.
10. Lindblad, T. and J.M. Kinser, Image Processing Using Pulse-Coupled Neural Networks. Second ed. 2005: Springer. 161.
11. Zhang, J., J. Dong, and M. Shi, An Adaptive Method for Image Filtering with Pulse-coupled Neural Networks, in IEEE Internation Conference on Image Processing (ICIP). 2005: Genova, Italy.
12. Aggarwal, N. and W.C. Karl, Line Detection in Images Through Regularized Hough Transform. IEEE Transactions on Image Processing, 2006. 15(3): p. 582-591.
13. Agganval, N. and W.C. Karl, Line Detection in Images Through Regularized Hough Transform, in International Conference on Image Processing 2000: Vancouver, BC
14. Fernandes, L.A.F. and M.M. Oliveira, Real-time line detection through an improved Hough transform voting scheme. Pattern Recognition, 2008. 41: p. 299-314.

a(1) b(1) c(1) d(1)
a(2) b(2) c(2) d(2)
a(3) b(3) c(3) d(3)
a(4) b(4) c(4) d(4)
a(5) b(5) c(5) d(5)
Figure 10 Experimental results on real image data captured from UAV Platforms
Row 1:
Original images
Row 2:
Hough line
detection on Canny
edge map
Row 3:
Hough line
detection on PCNF
edge map
Row 4:
Knowledge-based
post-processing on
row 2
Row 5:
Knowledge-based
post-processing on
row 3