c h a p t e r 5 operating budgets. learning objective 1 describe different types of budgeting and...
TRANSCRIPT

C H A P T E R 5
Operating BudgetsOperating Budgets

Learning Objective 1
Describe different types of budgeting and identify the purposes of budgeting.
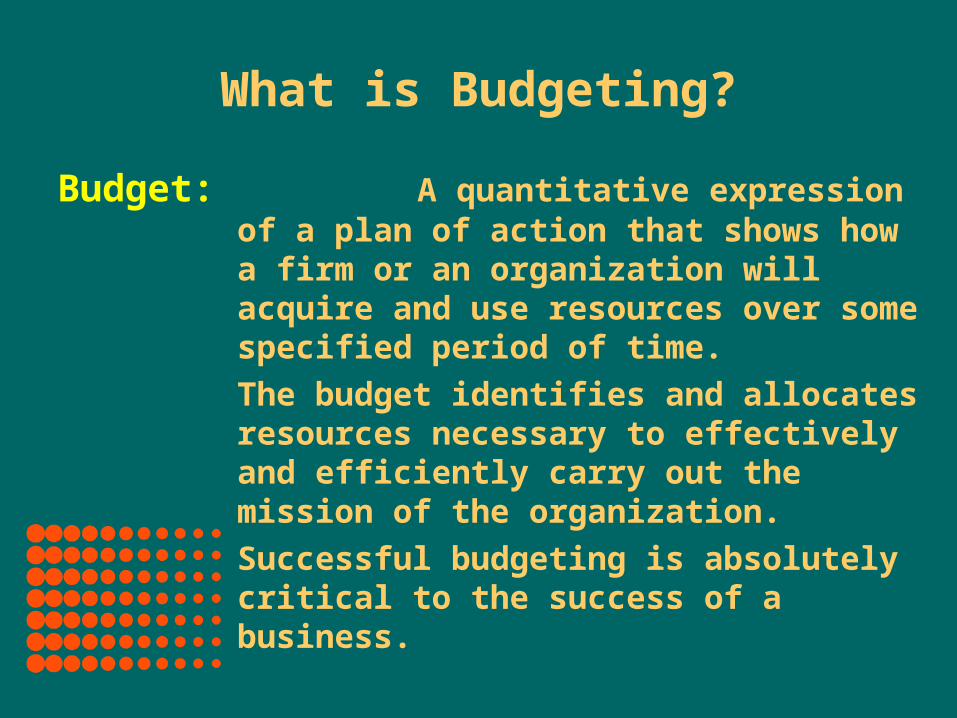
What is Budgeting?
Budget: A quantitative expression of a plan of action that shows how a firm or an organization will acquire and use resources over some specified period of time.
The budget identifies and allocates resources necessary to effectively and efficiently carry out the mission of the organization.
Successful budgeting is absolutely critical to the success of a business.

Describe Three Types of Budgets
Strategic Plan: Broad, long-run planning, usually prepared by top management.
Capital Budget: Systematic plan for long-term investments in operating assets.
Operations (Master) Budget: Details the immediate goals for revenues, production, expenses, and cash for the next period. This budget is the most detailed and the most heavily used budget an organization has.
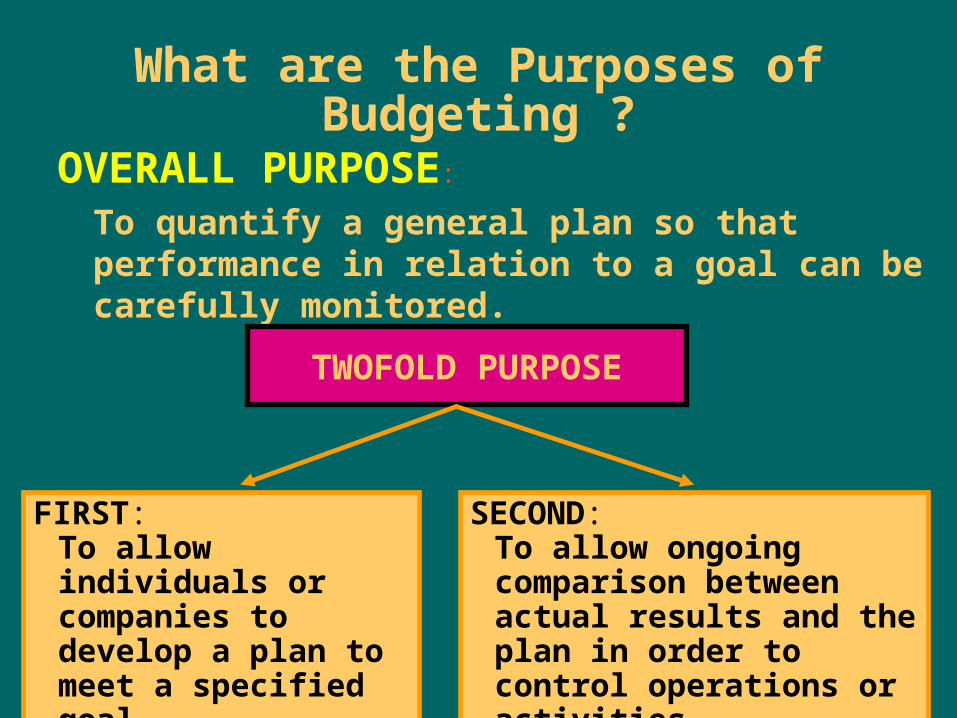
What are the Purposes of Budgeting ?
OVERALL PURPOSE:
To quantify a general plan so that performance in relation to a goal can be carefully monitored.
TWOFOLD PURPOSE
FIRST:To allow individuals or companies to develop a plan to meet a specified goal.
SECOND:To allow ongoing comparison between actual results and the plan in order to control operations or activities.
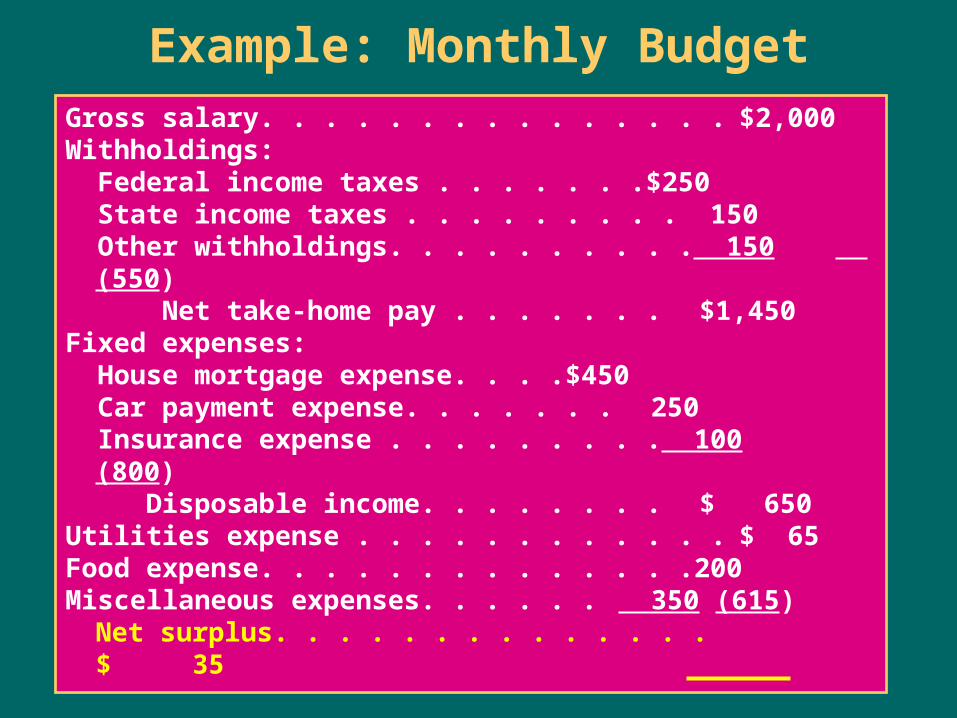
Example: Monthly Budget
Gross salary. . . . . . . . . . . . . . . $2,000 Withholdings: Federal income taxes . . . . . . . $250 State income taxes . . . . . . . . . 150 Other withholdings. . . . . . . . . . 150 (550) Net take-home pay . . . . . . . $1,450 Fixed expenses: House mortgage expense. . . . $450 Car payment expense. . . . . . . 250 Insurance expense . . . . . . . . . 100 (800) Disposable income. . . . . . . . $ 650 Utilities expense . . . . . . . . . . . . $ 65Food expense. . . . . . . . . . . . . . 200Miscellaneous expenses. . . . . . 350 (615)
Net surplus. . . . . . . . . . . . . . $ 35
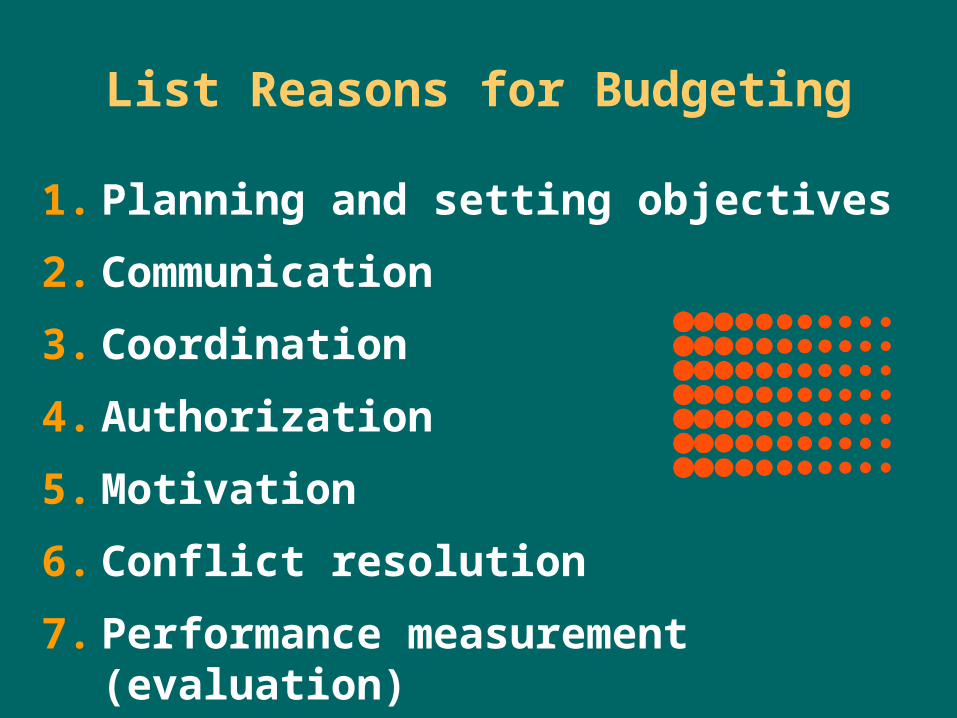
List Reasons for Budgeting
1. Planning and setting objectives
2. Communication
3. Coordination
4. Authorization
5. Motivation
6. Conflict resolution
7. Performance measurement (evaluation)

Learning Objective 2
Describe the budgeting process and its behavioral implications.
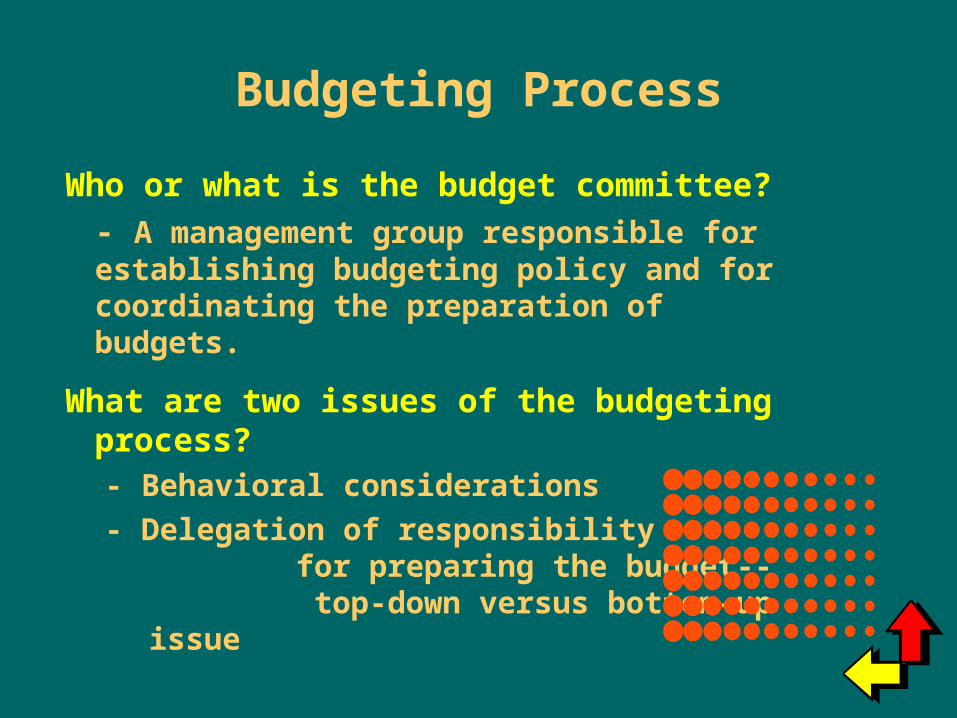
Budgeting Process
Who or what is the budget committee?
- A management group responsible for establishing budgeting policy and for coordinating the preparation of budgets.
What are two issues of the budgeting process?- Behavioral considerations
- Delegation of responsibility for preparing the budget-- top-down versus bottom-up issue

List Behavioral Considerations
1. Top management support
2. Employee participation
3. Addressing budget deviations
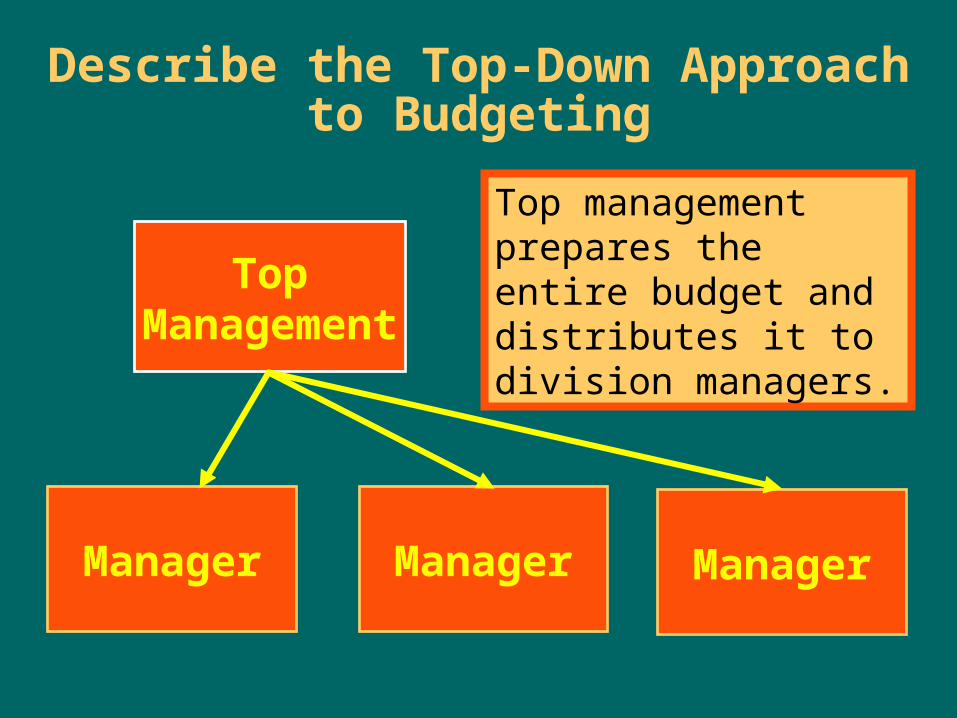
Describe the Top-Down Approach to Budgeting
TopManagement
Manager ManagerManager
Top management prepares the entire budget and distributes it to division managers.
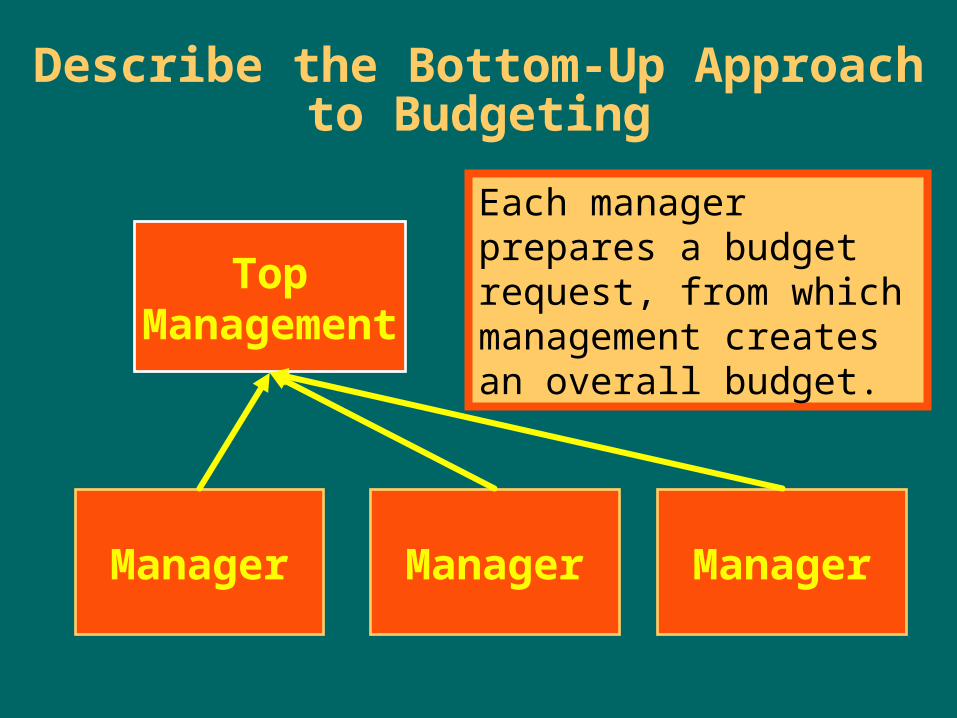
Describe the Bottom-Up Approach to Budgeting
TopManagement
Manager ManagerManager
Each manager prepares a budget request, from which management creates an overall budget.

Learning Objective 3
Explain the master budget and its components for manufacturing firms, merchandising firms, and service firms.
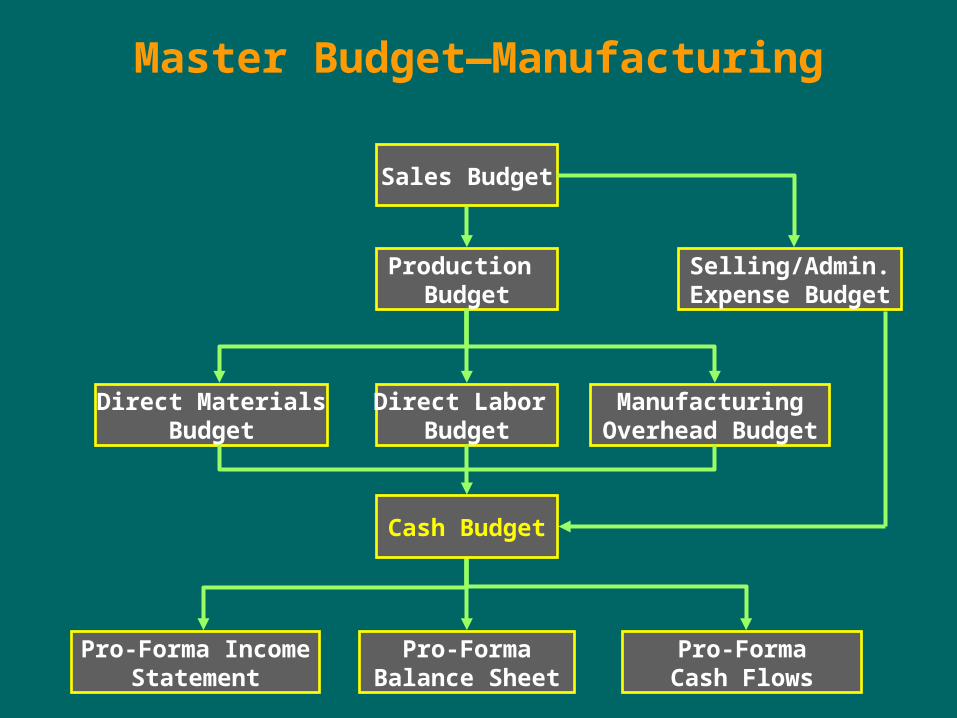
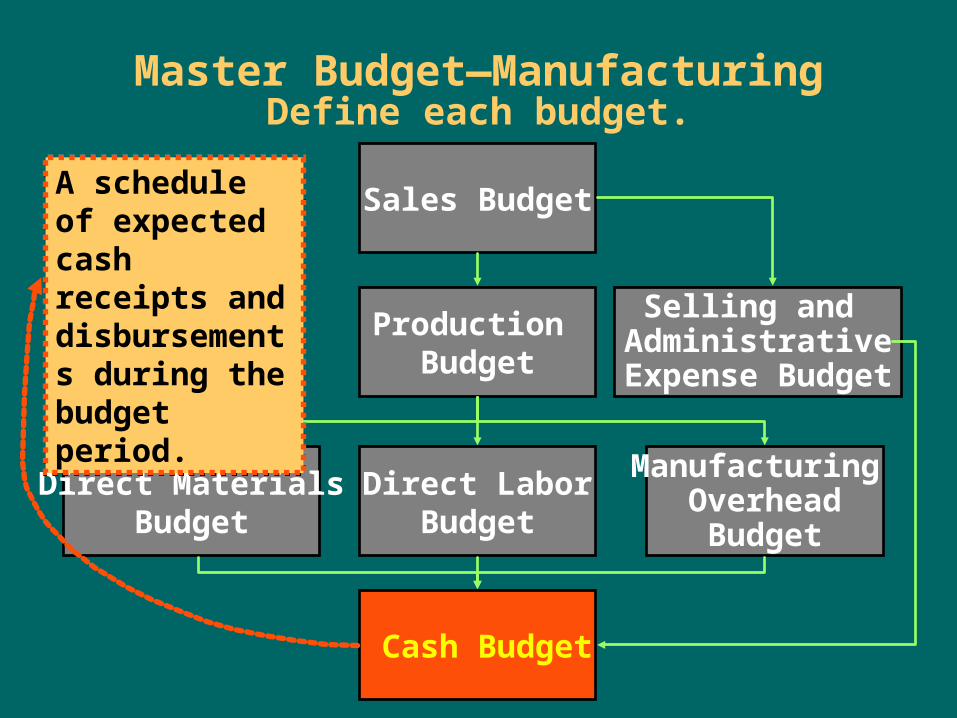
Master Budget—Manufacturing
Sales Budget
Selling/Admin.Expense Budget
Production Budget
Direct Labor Budget
ManufacturingOverhead Budget
Direct MaterialsBudget
Pro-Forma IncomeStatement
Pro-FormaBalance Sheet
Pro-FormaCash Flows
Cash Budget
Sales Budget
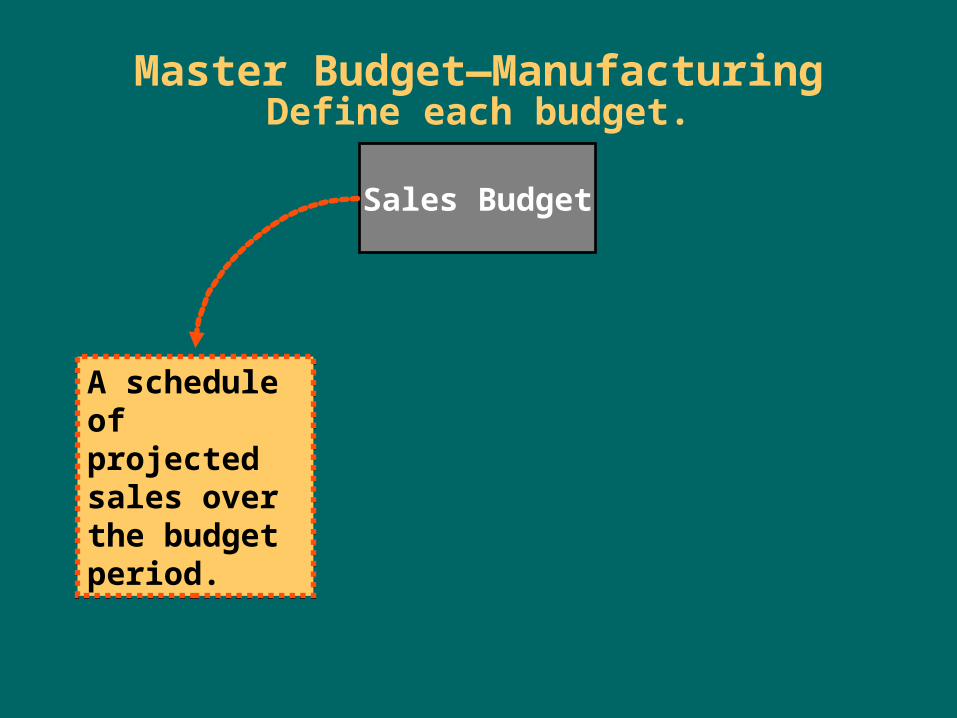
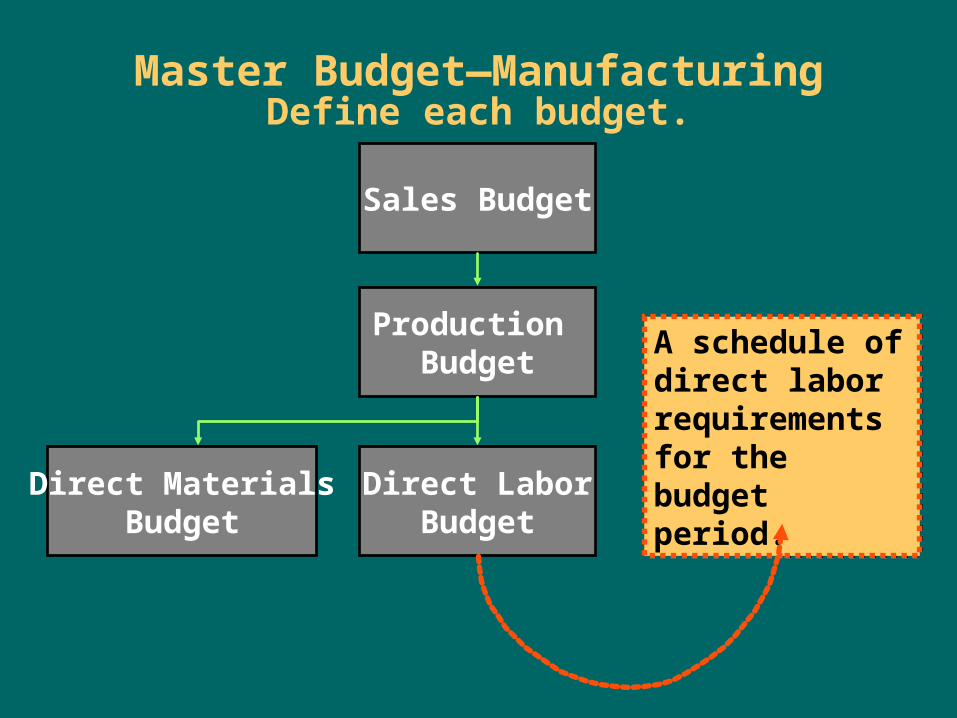
Master Budget—ManufacturingDefine each budget.
A schedule of projected sales over the budget period.
A schedule of projected sales over the budget period.

Example: Sales Budget
Selling price per bike . . . . . . $ 100
Expected sales (units). . . . . x 100
Expected revenues . . . . . . . $10,000
Selling price per bike . . . . . . $ 100
Expected sales (units). . . . . x 100
Expected revenues . . . . . . . $10,000

Sales Budget
Production Budget
Master Budget—ManufacturingDefine each budget.
A schedule of production requirements for the budget period.
A schedule of production requirements for the budget period.
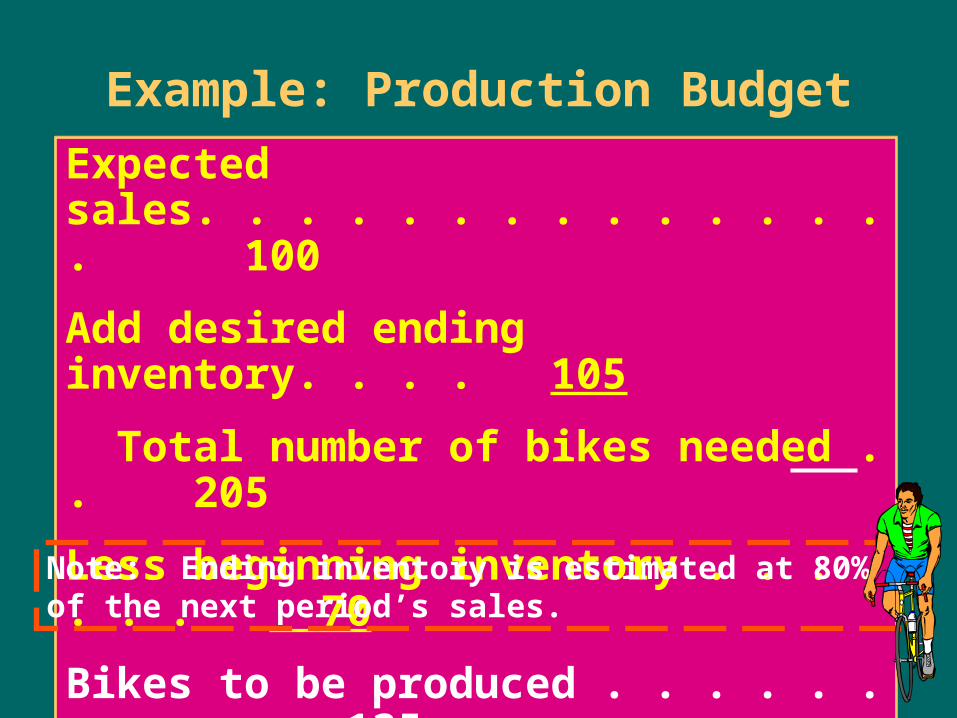
Example: Production Budget
Expected sales. . . . . . . . . . . . . . . 100
Add desired ending inventory. . . . 105
Total number of bikes needed . . 205
Less beginning inventory . . . . . . . 70
Bikes to be produced . . . . . . . . . . 135
Expected sales. . . . . . . . . . . . . . . 100
Add desired ending inventory. . . . 105
Total number of bikes needed . . 205
Less beginning inventory . . . . . . . 70
Bikes to be produced . . . . . . . . . . 135
Note: Ending inventory is estimated at 80% of the next period’s sales.
Sales Budget
Production Budget
Direct MaterialsBudget
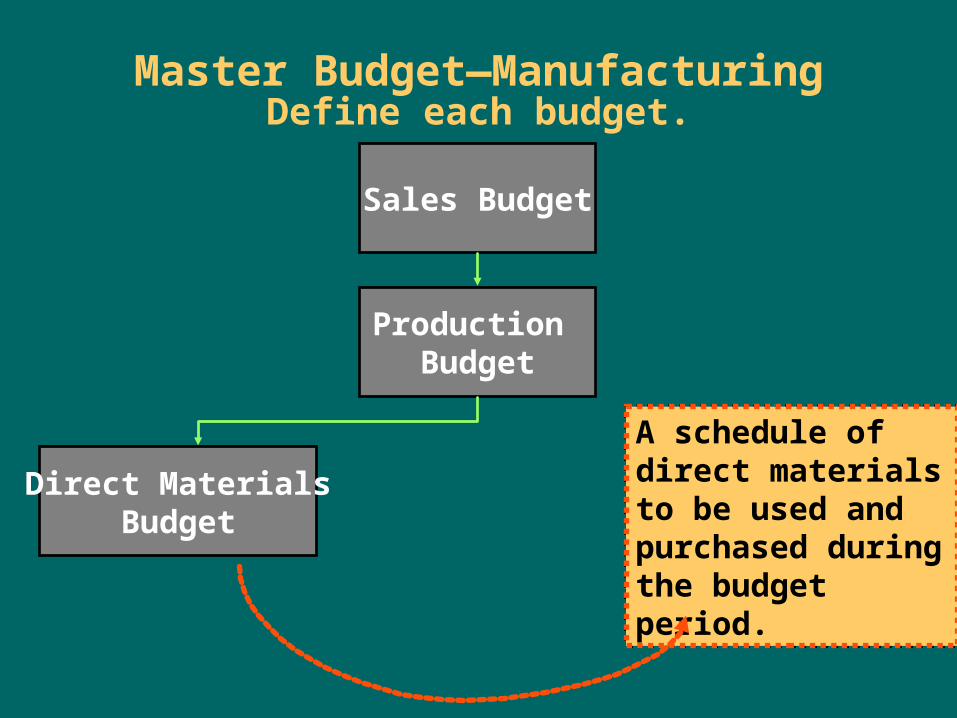
Master Budget—ManufacturingDefine each budget.
A schedule of direct materials to be used and purchased during the budget period.
A schedule of direct materials to be used and purchased during the budget period.

Example: Direct Materials Budget
Direct materials usage:
Direct Amount Unit TotalMaterials Required Cost Cost
Metal 2,700 lbs. $2.00/ft. $5,400
Plastic 405 lbs. $1.00/ft. $ 405
Direct materials usage:
Direct Amount Unit TotalMaterials Required Cost Cost
Metal 2,700 lbs. $2.00/ft. $5,400
Plastic 405 lbs. $1.00/ft. $ 405
Example: Direct Materials Budget
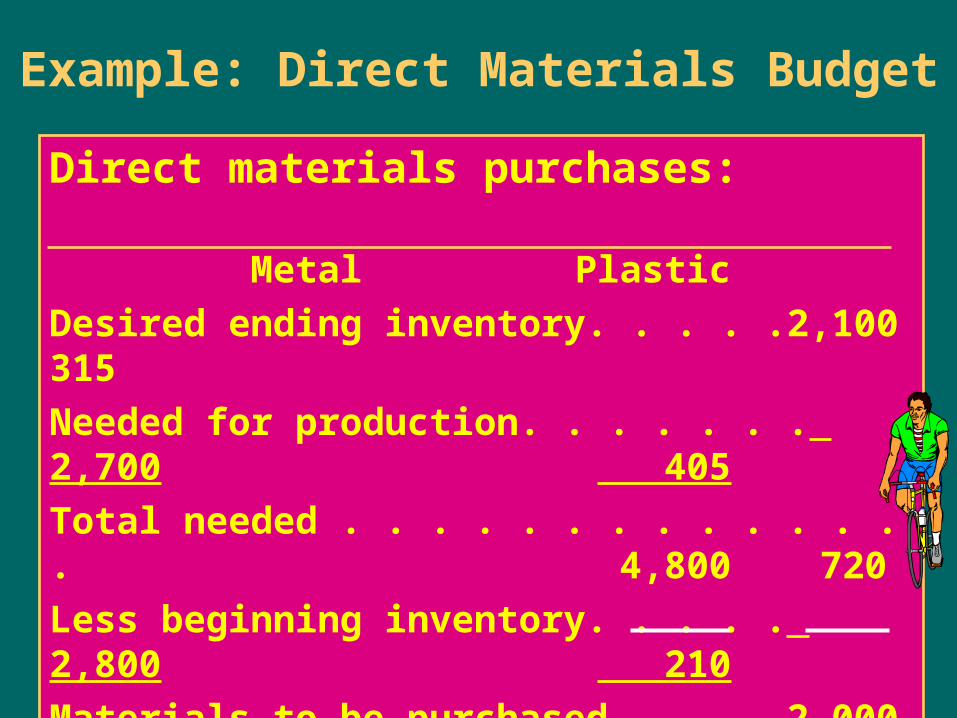
Direct materials purchases: Metal Plastic
Desired ending inventory. . . . . 2,100 315
Needed for production. . . . . . . 2,700 405
Total needed . . . . . . . . . . . . . . 4,800 720
Less beginning inventory. . . . . 2,800 210
Materials to be purchased . . . . 2,000 510
Unit cost. . . . . . . . . . . . . . . . . . x $2 x $1
Total cost . . . . . . . . . . . . . . . . $4,000 $ 510
Sales Budget
Production Budget
Direct MaterialsBudget
Direct LaborBudget
Master Budget—ManufacturingDefine each budget.
A schedule of direct labor requirements for the budget period.
A schedule of direct labor requirements for the budget period.

Example: Direct Labor Budget
Number of bikes to produce. . . . 135
Direct labor hours per bike. . . . .x 3
Total hours required. . . . . . . . . 405
Rate per hour. . . . . . . . . . . . . . . .x $5
Total direct labor cost. . . . . . . . $2,025
Number of bikes to produce. . . . 135
Direct labor hours per bike. . . . .x 3
Total hours required. . . . . . . . . 405
Rate per hour. . . . . . . . . . . . . . . .x $5
Total direct labor cost. . . . . . . . $2,025

Sales Budget
Production Budget
Direct MaterialsBudget
Direct LaborBudget
Manufacturing Overhead
Budget
Master Budget—ManufacturingDefine each budget.
A schedule of production costs other than those for direct labor and direct materials.
A schedule of production costs other than those for direct labor and direct materials.

Example: Manufacturing Overhead Budget
Variable costs:Indirect materials costs. . . . . . . . . $ 220Indirect labor costs . . . . . . . . . . . . 600 Total variable costs. . . . . . . . . . . $ 820
Fixed costs:Insurance expense. . . . . . . . . . . . 200Depreciation expense. . . . . . . . . . $ 600 Total fixed costs . . . . . . . . . . . . . $ 800
Total manufacturing overhead . . . $1,620
Sales Budget
Production Budget
Direct MaterialsBudget
Direct LaborBudget
Manufacturing Overhead
Budget
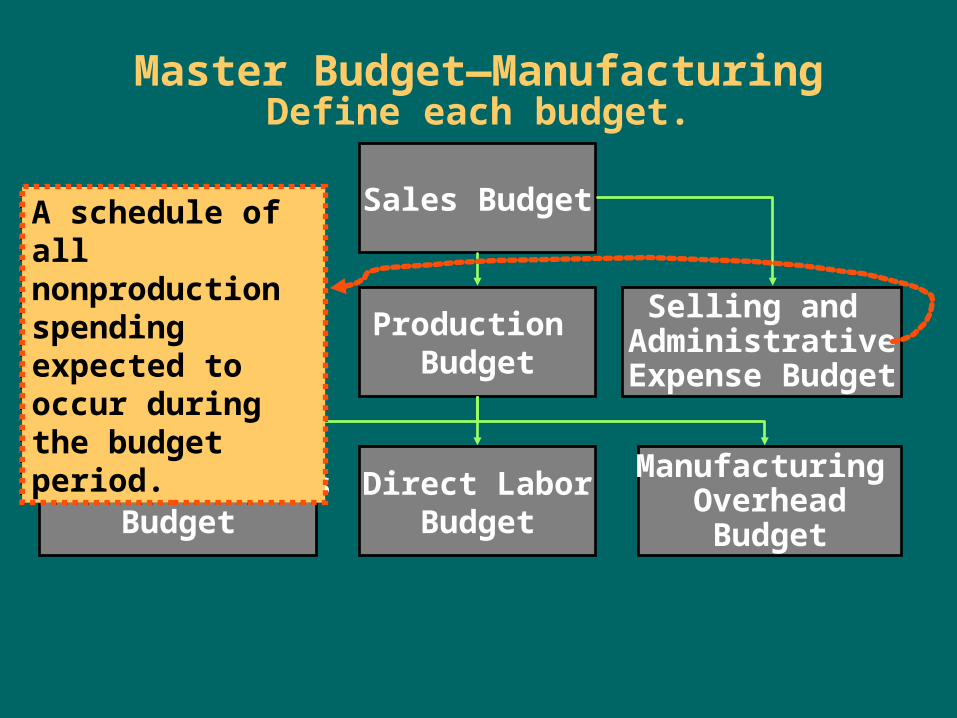
Master Budget—ManufacturingDefine each budget.
Selling and Administrative
Expense Budget
A schedule of all nonproduction spending expected to occur during the budget period.
A schedule of all nonproduction spending expected to occur during the budget period.
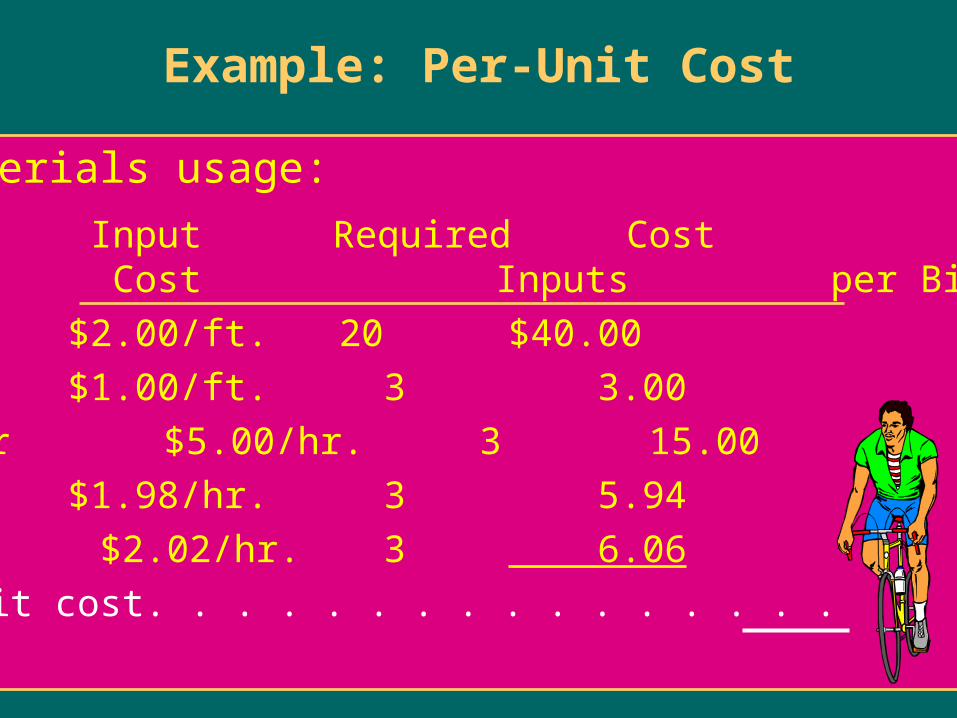
Example: Per-Unit Cost
Direct materials usage:
Input Required Cost Cost Inputs per Bike
Metal $2.00/ft. 20 $40.00
Plastic $1.00/ft. 3 3.00
Direct labor $5.00/hr. 3 15.00
Fixed OH $1.98/hr. 3 5.94
Variable OH $2.02/hr. 3 6.06
Total unit cost. . . . . . . . . . . . . . . . $70.00
Direct materials usage:
Input Required Cost Cost Inputs per Bike
Metal $2.00/ft. 20 $40.00
Plastic $1.00/ft. 3 3.00
Direct labor $5.00/hr. 3 15.00
Fixed OH $1.98/hr. 3 5.94
Variable OH $2.02/hr. 3 6.06
Total unit cost. . . . . . . . . . . . . . . . $70.00
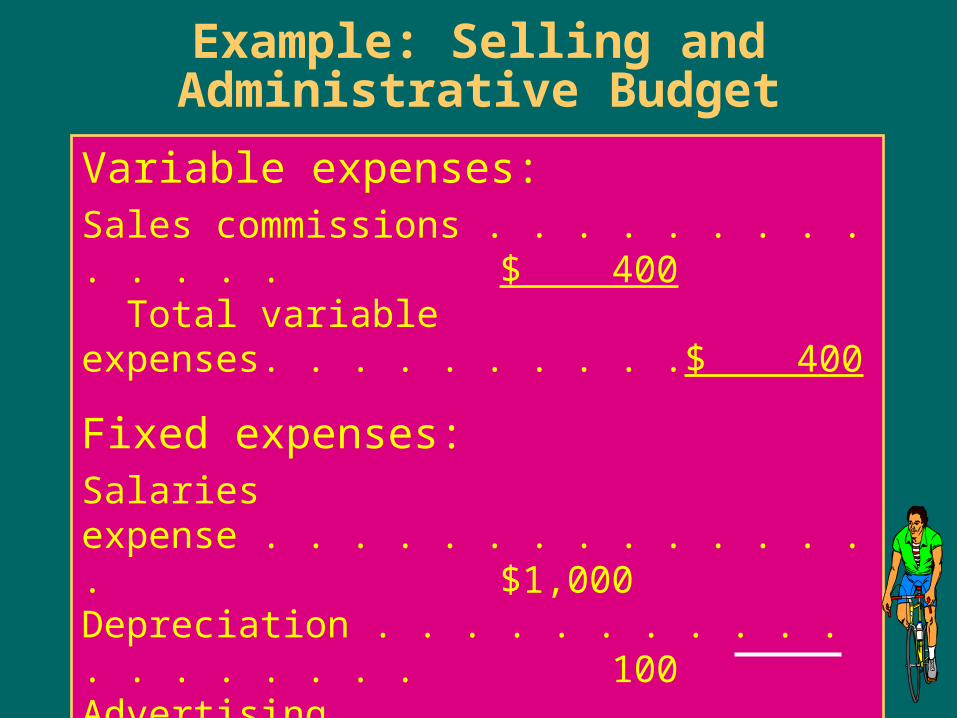
Example: Selling and Administrative Budget
Variable expenses:Sales commissions . . . . . . . . . . . . . . $ 400 Total variable expenses. . . . . . . . . . $ 400
Fixed expenses:Salaries expense . . . . . . . . . . . . . . . $1,000Depreciation . . . . . . . . . . . . . . . . . . . 100Advertising expense. . . . . . . . . . . . . 200 Total fixed expenses. . . . . . . . . . . . $1,300Total selling and administrative expenses. . . . . . . . . $1,700
Sales Budget
Production Budget
Direct MaterialsBudget
Direct LaborBudget
Manufacturing Overhead
Budget
Master Budget—ManufacturingDefine each budget.
Selling and Administrative
Expense Budget
Cash Budget
A schedule of expected cash receipts and disbursements during the budget period.
A schedule of expected cash receipts and disbursements during the budget period.

Example: Cash Budget
Cash balance, beginning . . . . . . . . . $ 4,900Add collections from customers . . . . 10,100(1)Total cash available. . . . . . . . . . $15,000Less disbursements for: Direct materials . . . . . . . . . . . . . $ 3,000 Direct labor. . . . . . . . . . . . . . . . . 2,000 Equipment purchase . . . . . . . . . 2,000(2)Total disbursements. . . . . . . . . . $ 7,000Minimum cash balance desired. . . . . 6,000Total cash needed. . . . . . . . . . . . . . . $13,000Excess (or deficiency) of cash available before financing. . . . . $ 2,000(3) Financing needed . . . . . . . . . . . 0
Ending cash balance [(1) – (2) + (3)] $ 2,000
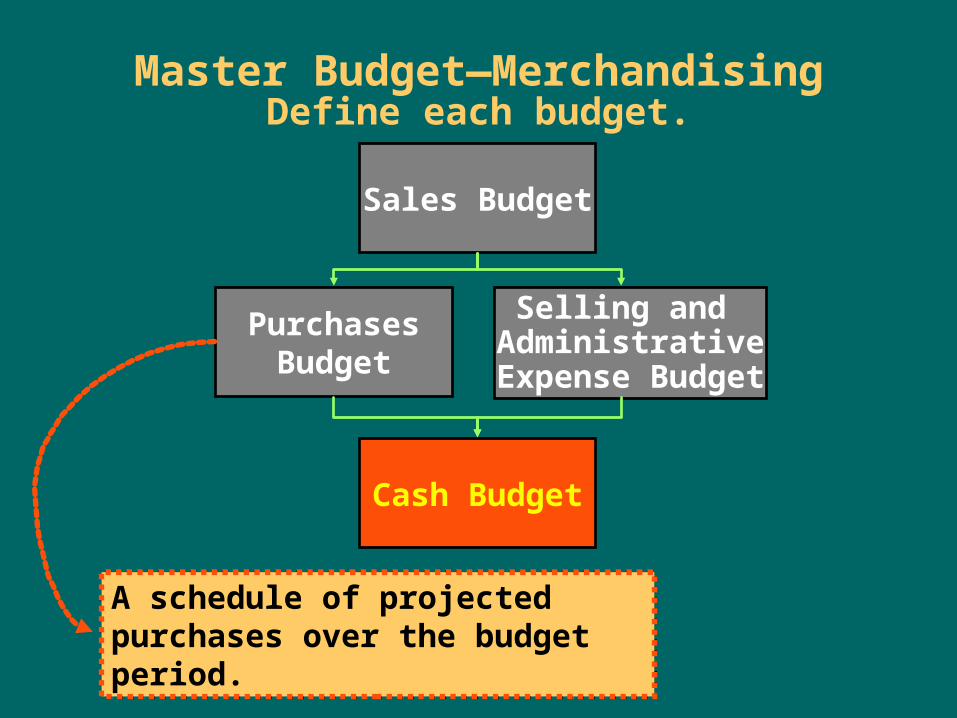
Sales Budget
PurchasesBudget
Cash Budget
Master Budget—MerchandisingDefine each budget.
Selling and Administrative
Expense Budget
A schedule of projected purchases over the budget period.A schedule of projected purchases over the budget period.

Master Budget—MerchandisingDefine each budget.
Sales Budget
PurchasesBudget
Cash Budget
Pro-FormaStatement ofCash Flows
Selling and Administrative
Expense Budget
Pro-FormaBalance
Sheet
Pro-FormaIncome
Statement
Pro-forma financial statements “budget” financial information for the coming period.
Pro-forma financial statements “budget” financial information for the coming period.

Master Budget—ServiceDefine each budget.
Pro-Forma IncomeStatement
Revenue Budget
Wages andSalaries Budget
Production Budget
Cash Budget
Pro-FormaBalance Sheet
Selling/Admin.Expense Budget
OverheadBudget
SuppliesBudget
Pro-Forma Statementof Cash Flows
A service entity’s budget that identifies how much revenue will be generated during a period.

Expanded MaterialLearning Objective 4
Prepare pro-forma financial statements.
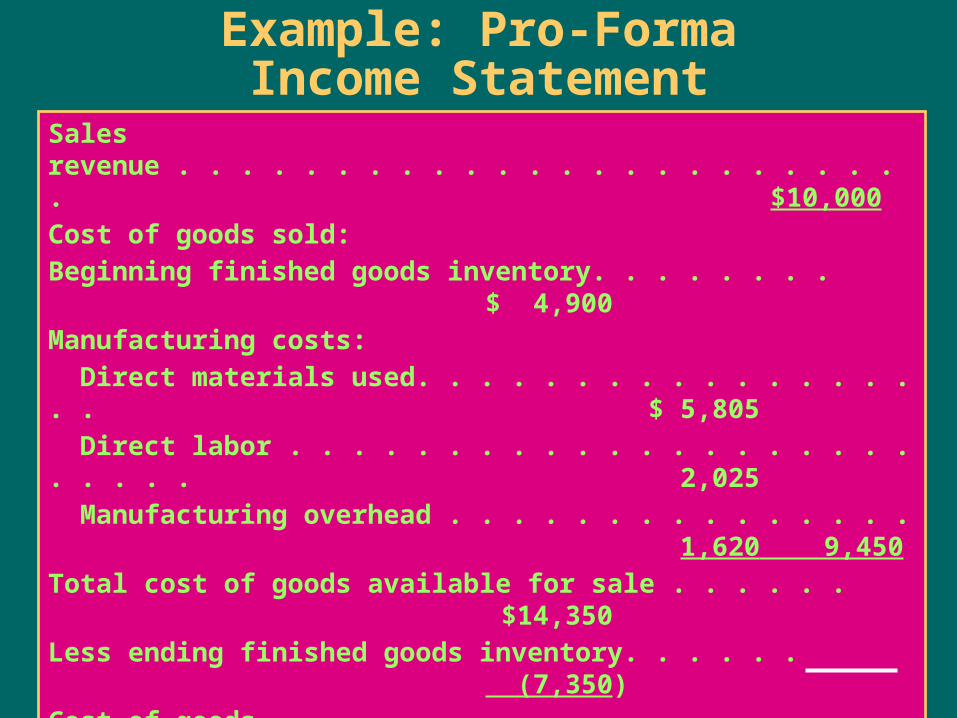
Example: Pro-FormaIncome Statement
Sales revenue . . . . . . . . . . . . . . . . . . . . . . . . $10,000 Cost of goods sold:Beginning finished goods inventory. . . . . . . . $ 4,900 Manufacturing costs: Direct materials used. . . . . . . . . . . . . . . . . . $ 5,805 Direct labor . . . . . . . . . . . . . . . . . . . . . . . . . 2,025 Manufacturing overhead . . . . . . . . . . . . . . . 1,620 9,450 Total cost of goods available for sale . . . . . . $14,350 Less ending finished goods inventory. . . . . . (7,350)Cost of goods sold. . . . . . . . . . . . . . . . . . . . . (7,000)Gross margin. . . . . . . . . . . . . . . . . . . . . . . . . $ 3,000 Selling and administrative expenses. . . . . . . 1,700 Operating income . . . . . . . . . . . . . . . . . . . . . $ 1,300 Interest expense . . . . . . . . . . . . . . . . . . . . . . 0 Income before taxes . . . . . . . . . . . . . . . . . . . $ 1,300

ASSETS
Current assets: Cash. . . . . . . . . . . . . . . . . . . . . . . . . . . . . . . . . . . $ 15,000 Accounts receivable . . . . . . . . . . . . . . . . . . . . . . 3,000 Finished goods . . . . . . . . . . . . . . . . . . . . . . . . . . 7,350 $ 25,350Long-term operating assets: Equipment. . . . . . . . . . . . . . . . . . . . . . . . . . . . . . .$ 12,000 Less accumulated depreciation. . . . . . . . . . . . . (3,300) 8,700
Total assets. . . . . . . . . . . . . . . . . . . . . . . . . . . . . . . $ 34,050
Example: Pro-Forma Balance Sheet
LIABILITIES AND STOCKHOLDERS’ EQUITY
Current liabilities: Accounts payable. . . . . . . . . . . . . . . . . . . . . . . . . $ 8,000 Notes payable . . . . . . . . . . . . . . . . . . . . . . . . . . . 7,000 $ 15,000
Stockholders’ equity: Common stock. . . . . . . . . . . . . . . . . . . . . . . . . . . $ 11,850 Retained earnings . . . . . . . . . . . . . . . . . . . . . . . . 7,200 19,050
Total liabilities and stockholders’ equity. . . . . . . . . $ 34,050

Example: Pro-Forma Statement of Cash Flows
Cash flows from operating activities:Net income . . . . . . . . . . . . . . . . . . . . . . . . . . $ 1,300 Add (subtract) adjustments:
Depreciation . . . . . . . . . . . . . . . . . . . . . . . $ 700 Increase in finished goods . . . . . . . . . . . . (2,450)Increase in accounts receivable. . . . . . . . 5,550 3,800
Net cash provided by operating activities . . $ 5,100
Cash flows from investing activities:Purchase of equipment . . . . . . . . . . . . . . $(2,000)
Net cash used in investing activities . . . . (2,000)
Cash flows from financing activities:Cash obtained from borrowing . . . . . . . . $ 7,000
Net cash used in financing activities. . . . 7,000
Net increase in cash. . . . . . . . . . . . . . . . . . $ 10,100
Expanded MaterialLearning Objective 5
Distinguish between static and flexible budgets.
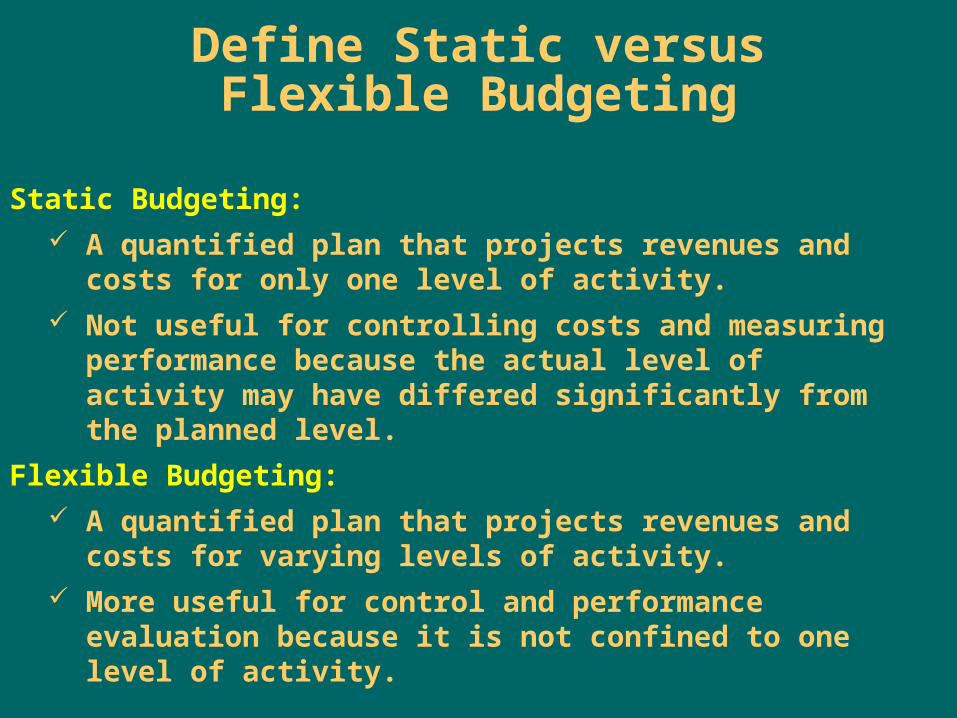
Define Static versusFlexible Budgeting
Static Budgeting: A quantified plan that projects revenues and costs for
only one level of activity. Not useful for controlling costs and measuring
performance because the actual level of activity may have differed significantly from the planned level.
Flexible Budgeting: A quantified plan that projects revenues and costs for
varying levels of activity. More useful for control and performance evaluation
because it is not confined to one level of activity.
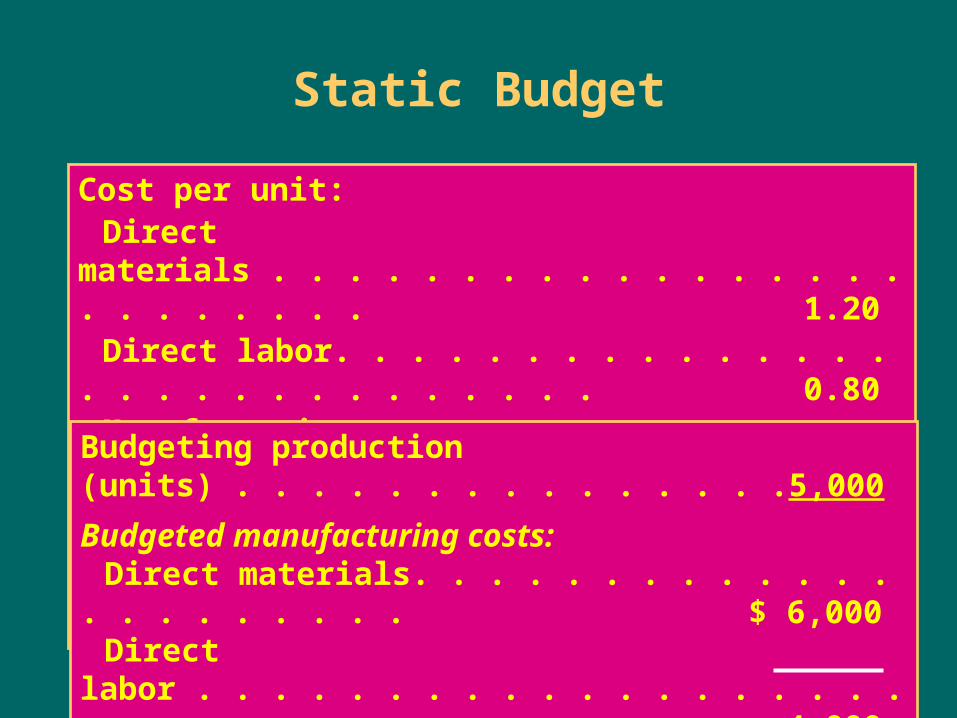
Static Budget
Cost per unit:Direct materials . . . . . . . . . . . . . . . . . . . . . . . . . 1.20Direct labor. . . . . . . . . . . . . . . . . . . . . . . . . . . . . 0.80Manufacturing overhead . . . . . . . . . . . . . . . . . . 0.50
Total unit cost . . . . . . . . . . . . . . . . . . . . . . . . $2.50
Budgeting production (units) . . . . . . . . . . . . . . . 5,000
Budgeted manufacturing costs:Direct materials. . . . . . . . . . . . . . . . . . . . . . $ 6,000Direct labor . . . . . . . . . . . . . . . . . . . . . . . . . 4,000Manufacturing overhead. . . . . . . . . . . . . . . 2,500
Total manufacturing costs. . . . . . . . . . . . $12,500

Static Budget—Performance Report
Actual Budgeted Difference
Production (units) 4,800 5,000 (200)
Manufacturing costs:Direct materials. . . . . . . . .$ 5,500 $ 6,000 $ (500) Direct labor . . . . . . . . . . . . 3,800 4,000 (200) Manufacturing overhead . 2,450 2,500 (50)
Total actual and budgetedmanufacturing costs . . . . $11,750 $12,500 $ (750)

Flexible Budget
What are the three steps to prepare a
flexible budget?
Using the per-unit costs for each element, prepare a budget showing what costs are expected to be incurred at several points within the relevant range.
Analyze the projected manufacturing costs for the coming period.
Determine a relevant range over which production is expected to vary during the coming period.
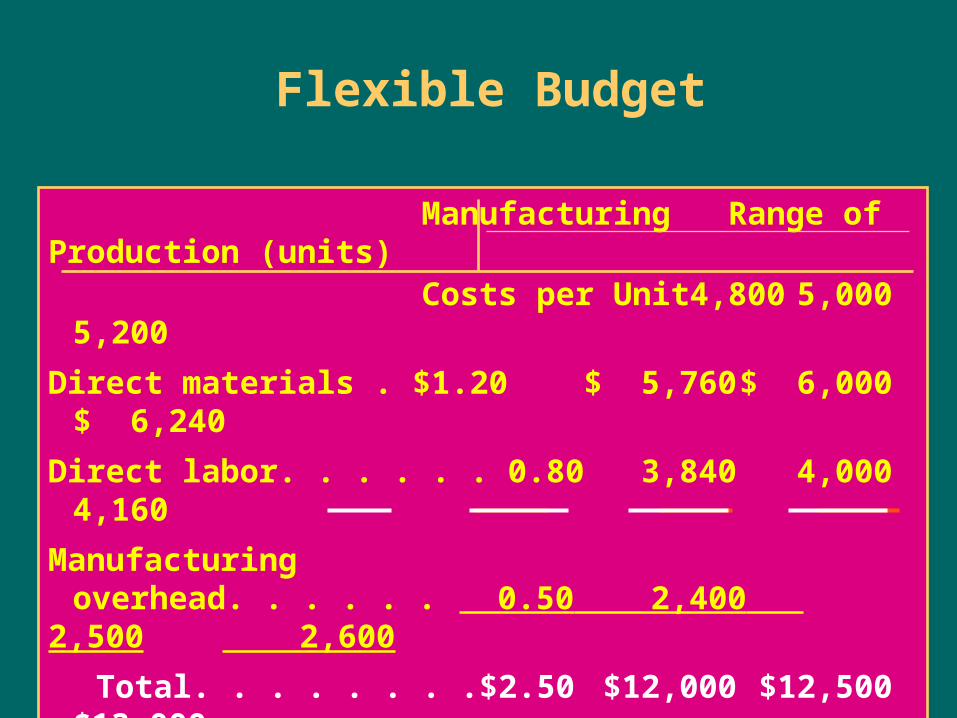
Flexible Budget
Manufacturing Range of Production (units) Costs per Unit 4,800 5,000 5,200
Direct materials . $1.20 $ 5,760 $ 6,000 $ 6,240
Direct labor. . . . . . 0.80 3,840 4,000 4,160
Manufacturingoverhead. . . . . . 0.50 2,400 2,500 2,600
Total. . . . . . . . $2.50 $12,000 $12,500 $13,000

Flexible Budget—Performance Report
Actual production (units) . . . . . . . . . . . . . . . . . . 4,800 Budgeted production (units) . . . . . . . . . . . . . . . 5,000 Difference. . . . . . . . . . . . . . . . . . . . . . . . . . . . . . . (200)
Actual Budgeted Difference
Direct materials. . . . . . . . . . $ 5,500 $ 5,760 $ (260) Direct labor . . . . . . . . . . . . . 3,800 3,840 (40) Manufacturing overhead . . 2,450 2,400 50
Total costs . . . . . . . . . . . . $11,750 $12,000 $ 250