c h co och oh faculty of agriculture ipb faculty of … htht t tf75% ti ldh lalthough the treatment...
TRANSCRIPT

C
CC
CSOFT WOOD
HARD WOOD
CC
OHH3CO
CC
CGRASS/PALM
supiandi sabihamdepartment of soil science & land resourcefaculty of agriculture ipb
OHH3CO OCH3
OH
C
Properties of Indonesian Peat
faculty of agriculture, ipb
Properties of Indonesian Peat in Relation to
the Chemistry of Carbon Emission

1 Introduction1. Introduction
Indonesian peats (called as gambut) are categorized as Histosol(s),consisting mostly of accumulated organic matter (≥65%) [Andriesse, 1988] that are partially derived from decayed vegetation1988] that are partially derived from decayed vegetation.
Materials of the peat are deposited in ACIDIC & ANAEROBIC conditions.conditions.
In the natural state, peat deposits covered by forest vegetation are called as PEAT SWAMP FORESTS.
Therefore, PEAT DEPOSITS are naturally composed of :(i) main components (trees: trunks, branches, leaf, & root),( ) p ( , , , ),(ii) components of under ground, such as shrubs, grasses, and ferns,(iii) dead macro & micro organisms.

1.1.S i h t ti f th I d i tSome inherent properties of the Indonesian peat
High porosity and very high water Peat properties Range High porosity and very high water content
One of the main peat-properties is
Peat properties RangeTotal porosity (%) 88 – 93Water content (%) 540 – 835
irreversible drying: meaning that the peat materials would not be able to reabsorb water.
( )Irr. drying (minute)* 90 – 135Tot cont. of nutrient
Peats are poor in nutrient content,but rich in wood dominated by high
t t f li i
(%)**(P2O5) 0.05 – 0.24CaO 0 14 2 90content of lignin.
The loss of C from peats that has been emitted to the atmosphere; the
CaO 0.14 – 2.90 MgO 0.03 – 0.15K2O 0.02 – 0.12p
current annual average emission was estimated to be 903 Mt CO2[BAPPENAS, 2009]
2O . .
Lignin (%) 65 - 93*) Peats were dried at 50 oC; [BAPPENAS, 2009]
**) In the peat layer of 0-40 cm
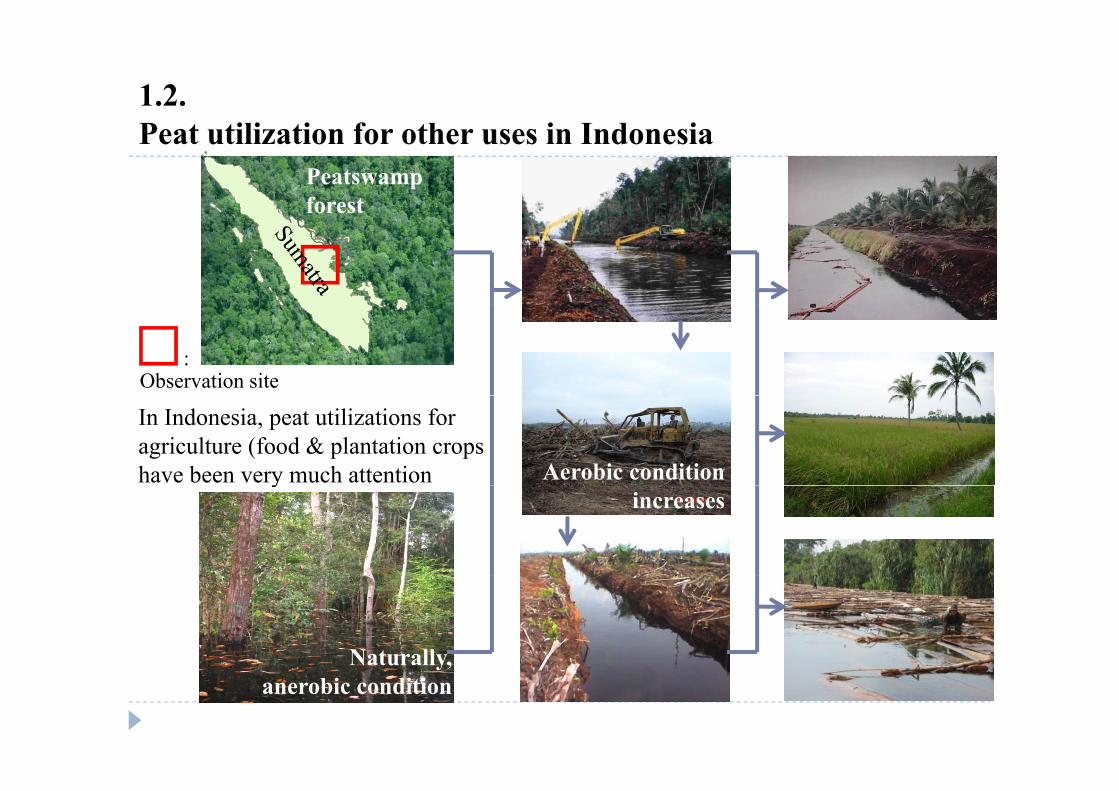
1.2.P t tili ti f th i I d iPeat utilization for other uses in Indonesia
Peatswamp forest
:Observation site
In Indonesia, peat utilizations for agriculture (food & plantation crops have been very much attention Aerobic condition y
Food cropsincreases
Naturally,Naturally, anerobic condition

2 Methodology Employed2. Methodology Employed The places of study were: (1) the estern part of Jambi Sumatra and (2) the The places of study were: (1) the estern part of Jambi, Sumatra, and (2) the
center and southern parts of Central Kalimantan
The studied sites were placed in the representative areas: marine env. (1.0 - >2.0); p p ( );brackish env. (0.5 – 1.0); and fresh water env. (<0.5 mmhos cm-1).
Research was divided into two steps:1. research that focused on the studies of peat properties, namely: chemical
composition of peat (partition separation method); critical water contentBisdom et al. [1993]; adsorption characteristic of Fe3+ based on the methodsBisdom et al. [1993]; adsorption characteristic of Fe based on the methodsof Syers et al. [1973] and Fox and Kamprath [1971]; and measurementof C releases through the reduction-oxidation processes.
2. field experiments: influence of the interaction of organic acids and mineralmaterials containing high Fe3+ on rice production and C-emission.

2.1.St di d it d t di t ib ti i I d iStudied sites and peat distribution in Indonesia
:Peat deposits
SUMATRAKALIMANTAN
SULAWESI PAPUA
JAVA
: Studied sites

2.2.P t tStratigraphy of peat deposits in Jambi as a model for the lower reach of the Indonesian peatland. Modified from Supiandi [1988]
Peat swamp ecosystems
Modified from Supiandi [1988]
BBrackish to marine ecosystems
Fresh water ecosystem C4ecosystems
Brackish peat
swamp
Marine peat
swamp
ecosystemFresh water
peat swamp
C4
C3A B
swamp swampswamp
C1
C2
GambutYellow soil Peat Tidal flat clay
A
Peat dome with a depression recent-sediment base
Peat dome with a concave old-soil base: peat
0
k
Pleistosen
Tanah fluviatil
Endapan pasir
Liat marinRed weathering crust
Pliocene deposits
Fluviatile deposits
Sand deposits
Marine clay
: peat
The oldest peat started to accumulate in 6850 year BP, and this is corresponding with h f i h h i [A d & M ll 1975 M l 1981]PodsolPodzol Brackish claythe age of peat in the other sites [Anderson & Muller, 1975; Morley, 1981]

3 Peat properties & C-emission
R i i th bl f t d t di f t
3. Peat properties & C-emission
Recognizing the problems of peat, understanding of peat properties in relation to chemistry of C-emission seems to be more important.more important.
The factors which strongly affect chemistry of C-emission are as follow:as follow:1. Chemical composition of peat,2. Critical water content,3. Surface charge and adsorption characteristics of cation.
Low contents of water and cation in peat is also a highest p gpotential of C-losses.

3.1.Ch i l iti f tChemical composition of peat
Peat composition consists of: lignin, cellulose, hemi-cellulose, and protein.
Lignin, as the dominant peat compositions, consists of 3-types f b i d i d f (i) l (ii) ftof basic monomers derived from: (i) grasses or palm, (ii) soft
wood, and (iii) hard woodSOFT WOOD HARD WOODGRASS/PALM
CC
CC
CC
C C C
OHH3CO OCH3
OHH3CO
OH4-hydroxy phenyl 3-methoxy 4-hydroxy phenyl 3-5-dimethoxy 4-hydroxy4-hydroxy phenyl
propane3-methoxy 4-hydroxy phenyl
propane3-5-dimethoxy 4-hydroxy
phenyl propane

3.1.1. Lignin disintegration [Orlov, 1995]SOFTWOOD HARDWOOD GRASS/PALM
OHOCH
OHOCHCH O
OH Demethylation HydroxylationOxidationReduction
CH
OCH3 OCH3CH3O
CH CH
OHOH
OHOHHO
CHCHCOOH
CHCHCOOH
CHCHCOOH COOH COOHCOOH COOH COOH
Ferulic acid Synapic acid p-coumaric acid
Oxidation
Protokatechuic acid Gallic acid
DecarboxylationReduction Oxidation
OHOCH3
OHOCH3CH3O
OH OOCH3
OOH
O
3
COOH
3
COOH
3
COOH
3
O O OCOOH COOH COOHVanilic acid Syringic acid p-hydroxybenzoic acid
O O OMethoxy-benzoquinone
Hydroxy-b.quinone
Benzo-quinone

3.1.2.C t ti f “th t i t t” h li idConcentration of “the most important” phenolic acids
Synapic acid ≈ Ferulic acid > p-coumaric acid > p-hydroxybenzoicSynapic acid Ferulic acid p coumaric acid p hydroxybenzoic acid > vanilic acid >syringic acid
JAMBI, SUMATRA
CENTRAL KALIMANTAN
3.1.3.COOH & th d CO & CH l
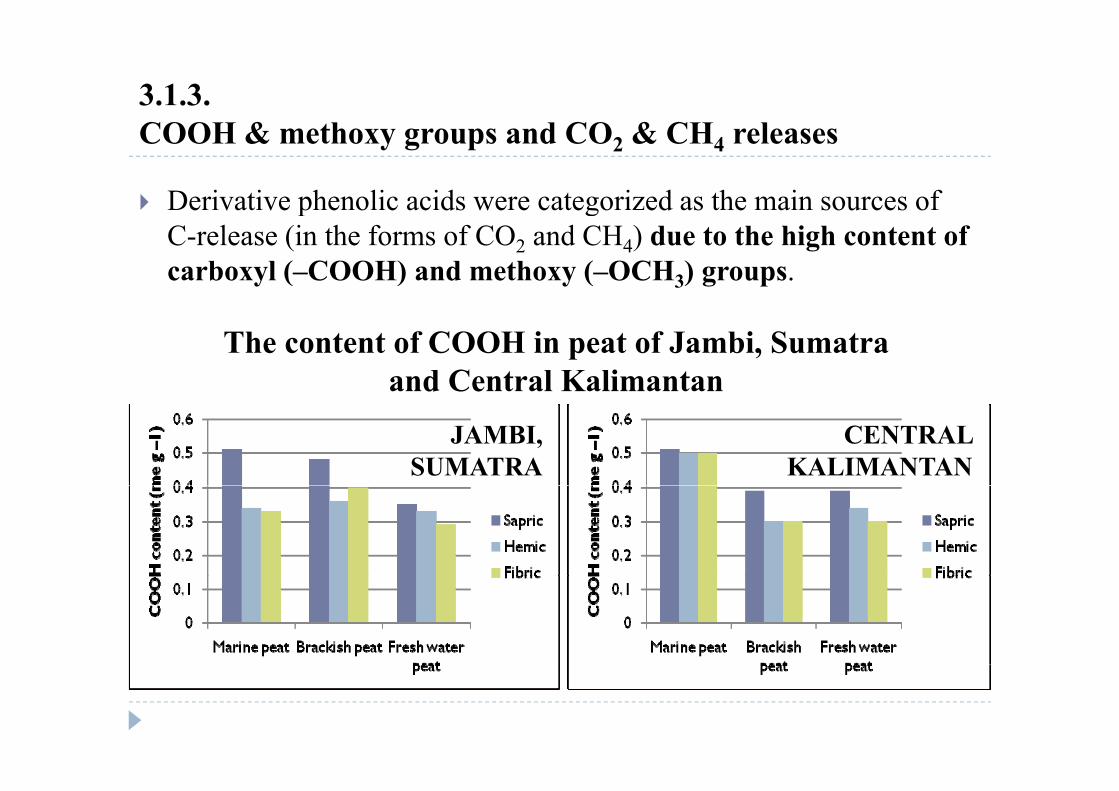
Derivative phenolic acids were categorized as the main sources of
COOH & methoxy groups and CO2 & CH4 releases
p gC-release (in the forms of CO2 and CH4) due to the high content of carboxyl (–COOH) and methoxy (–OCH3) groups.
The content of COOH in peat of Jambi, Sumatra and Central Kalimantan
JAMBI, SUMATRA
CENTRAL KALIMANTAN
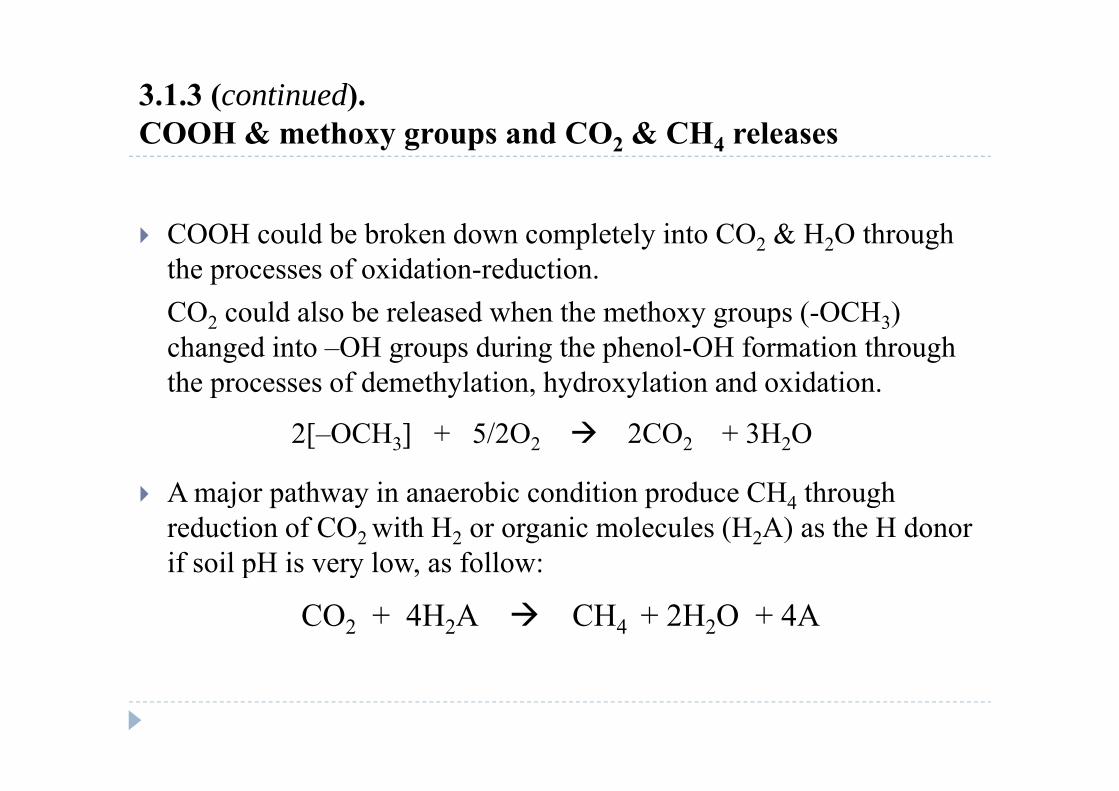
3.1.3 (continued).COOH & th d CO & CH lCOOH & methoxy groups and CO2 & CH4 releases
COOH could be broken down completely into CO2 & H2O through the processes of oxidation-reduction.CO ld l b l d h th th ( OCH )CO2 could also be released when the methoxy groups (-OCH3) changed into –OH groups during the phenol-OH formation through the processes of demethylation, hydroxylation and oxidation.p y , y y
2[–OCH3] + 5/2O2 2CO2 + 3H2O
A j th i bi diti d CH th h A major pathway in anaerobic condition produce CH4 through reduction of CO2 with H2 or organic molecules (H2A) as the H donor if soil pH is very low, as follow:p y ,
CO2 + 4H2A CH4 + 2H2O + 4A

3.2.C iti l t t t d i i ibl d iCritical water content and irriversible drying
The most important factor that influenced COOH contentin peat was of critical water content (CWC).
Peat Peat of Jambi Peat of Central KalimantanProperties Marine Brackish Fresh water Marine Brackish Fresh water
FIBRIC PEAT
ID period* 90 90 90 90 90 90
CWC (%)** 336.8–450.9 316.5–423.7 308.9–413.5 290.6–388.9 273.0–365.5 346.6–464.0HEMIC PEATHEMIC PEAT
ID period* 120 120 105 120 105 105
CWC (%)** 165.5–221.6 245.0–327.9 318.3–426.5 202.7–271.4 178.0–238.3 191.7–256.6
SAPRIC PEAT
ID period* 135 105 120 135 135 120
CWC (%)** 165.5–221.6 245.0–327.9 318.3–426.5 202.7–271.4 178.0–238.3 191.7–256.6

3.2 (continued) .C iti l t t t d i i ibl d i
Fibric peat needed a shorter period to reach the condition of i ibl d i d i h h i d i
Critical water content and irriversible drying
irreversible drying compared with hemic and sapric peats. This is because, derivative phenolic acids as colloidal organics
i fib i t l th th i i d h i tin fibric peat are lower than those in sapric and hamic peats, so the fibric peats could not much able to absorb more water.
Brackish env. Fresh water env.
Concentration of derivative phenolic acids in peat of Jambi

3.3.S f h d th d ti h t i ti f F 3+Surface charge and the adsorption characteristic of Fe3+
Based on pH actual and pHZPC, it can be mentioned that surface p p ZPC,of colloidal organic of peats mostly indicated as negative charge.
In acid condition, the charge is generally controlled by COOH groups; COOH started to dissociate its H+ at pH 3–5.5.
Marine env.
Brackish env.
Fresh water env.
pH actual and pHZPC of Central Kalimantan’s peats

3.3 (continued) .S f h d th d ti h t i ti f F 3+
The presence of H+ dissosiation was very important for colloidal i d b i hi h l d t l ti
Surface charge and the adsorption characteristic of Fe3+
organic to adsorb cations, which lead to complex reaction. The series of cation listed in decreasing order of preferential
interaction in the formation of comple es is as follo s:interaction in the formation of complexes is as follows:Fe3+ ≈ Fe2+ > Al3+ > Cu2+ > Ca2+ > Zn2+ > Mn2+
Jambi, Sumatra
Central Kalimantan
Fe adsorption by colloidal organic of peat

4 Measurement of CO & CH fluxes4. Measurement of CO2 & CH4 fluxes
T t t f Treatment of
LABORATORY EXPERIMENTSTreatment of Fe3+ (FeCl3)
Treatment of Fe3+ (FeCl3)
Max. sorptions of Fe3+ in sapric, hemic and fibric peats re:17346, 16509 and13564 µg g-1 , respectively

4.1.Th d f CO & CH flThe decrease of CO2 & CH4 fluxes
Treatment of 5.0% max. sorption of Fe3+ decreased CO2 & CH4fl f b d i lfluxes of about 37.5 to 48.4% and 26.9 to 33.0%, respectively, and it was chose for the treatment at field experiments.
Alth h th t t t f 7 5% ti ld h l Although the treatment of 7.5% max. sorption could sharply decrease CO2 & CH4 fluxes, but Fe-solution is more higher than the treatment of 5 0%the treatment of 5.0%.
The decrease is caused by the formation of stable complex binding as the illustration of the reaction as follow:g
Vanilic acid Complex reaction / chelation

5 Field Experiments Field experiments were focused on peats of Central Kalimantan:
(f h ) (b ki h ) d
5. Field Experiments
Berengbengkel (fresh water peat), Sampit (brackish peat) and Samuda (marine peat).
One of site experiments in BerengbengkelThe site from which mineral soil as an ameliorant was taken
High content of Fe-oxide
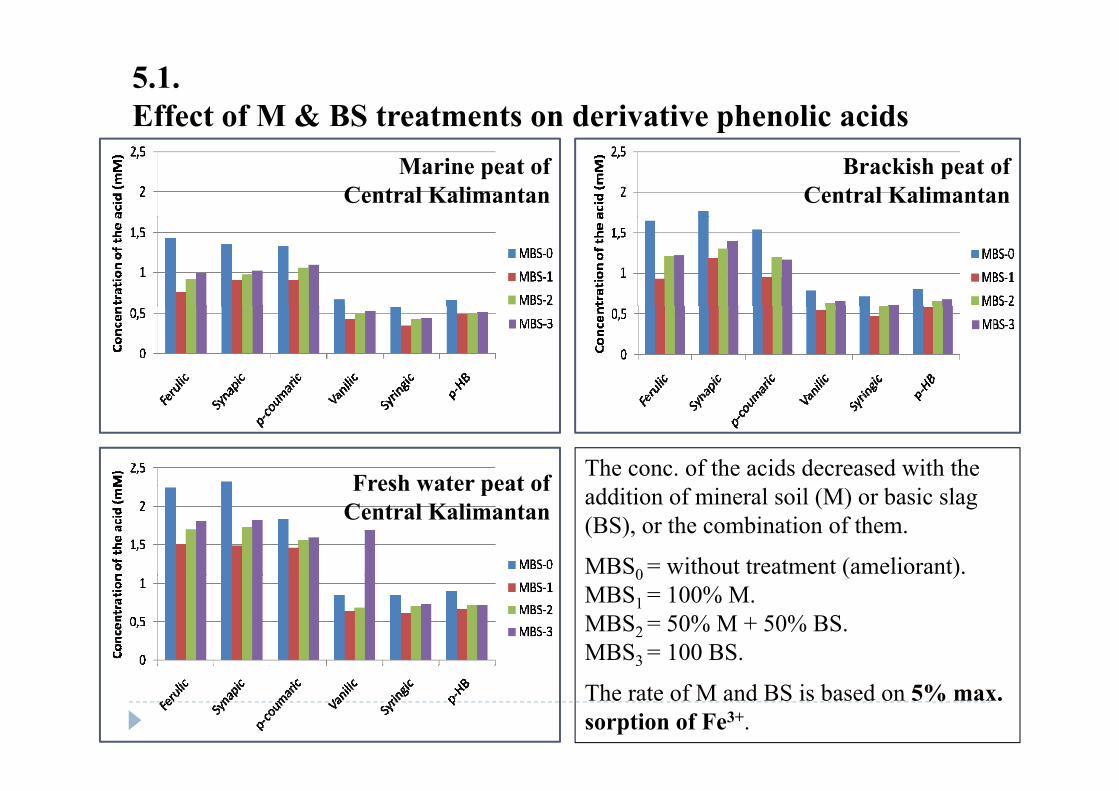
5.1.Effect of M & BS treatments on derivative phenolic acids
Marine peat of Central Kalimantan
Brackish peat of Central Kalimantan
ect o & S t eat e ts o de vat ve p e o c ac ds
Fresh water peat of The conc. of the acids decreased with the Fresh water peat of Central Kalimantan addition of mineral soil (M) or basic slag
(BS), or the combination of them.
MBS0 = without treatment (ameliorant).0 ( )MBS1 = 100% M.MBS2 = 50% M + 50% BS.MBS3 = 100 BS.3
The rate of M and BS is based on 5% max. sorption of Fe3+.

5.2.Eff t f t t t i d ti (IR 64)Effect of treatments on rice production (IR-64)
MBS0 = without treatment
5.17 5.
62
4.78 5.
08
MBS0 without treatment (ameliorant).
MBS1 = 100% M.MBS2 = 50% M + 50% BS.
4.09 4.18
4 2 MBS3 = 100 BS.
2.12 2.27
6
0 0
1.15 1.
5
0.00
0.00
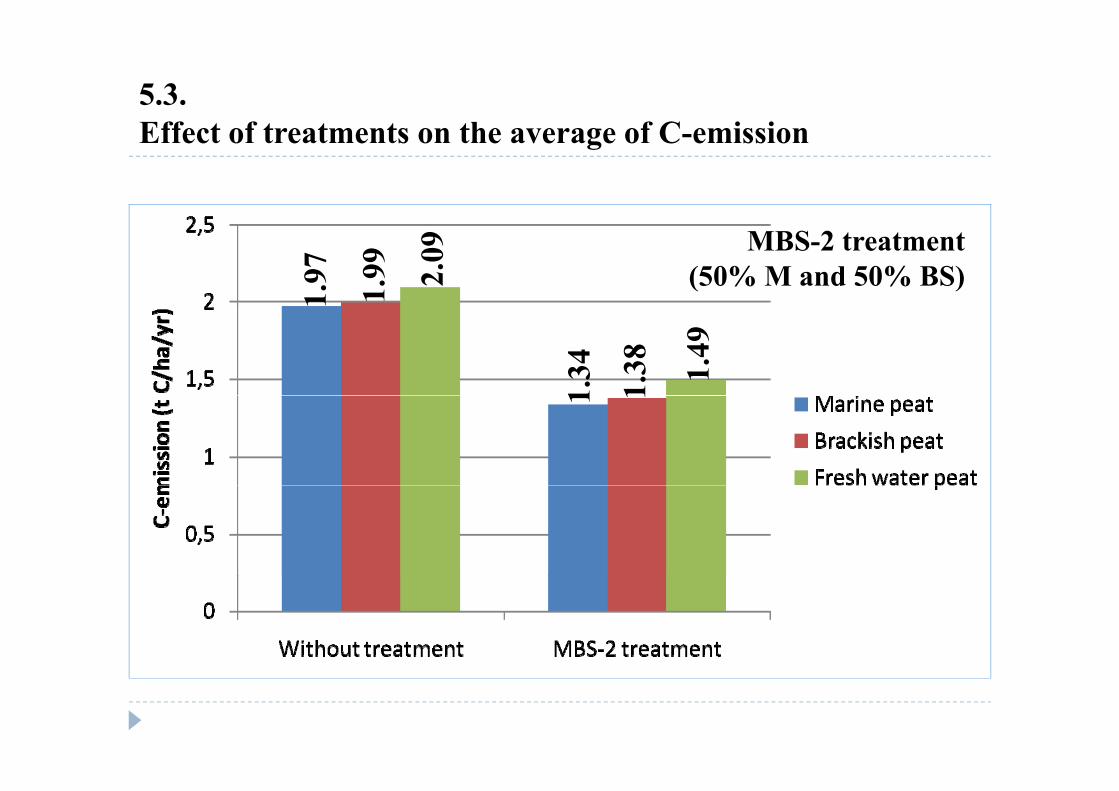
5.3.Eff t f t t t th f C i iEffect of treatments on the average of C-emission
MBS-2 treatment(50% M and 50% BS)2.
09
1.99
1.97
1.49
1.38
1.34 11
5 Conclusion Based on the properties of Indonesian peats, they were mostly
b d d d l bili
5. Conclusion
easy to be destroyed due to low stability. The low stability was characterized by C-release in the form of
CH d CO i i th lt f d itiCH4 and CO2 emissions as the results of decomposition process. To maintain the stability of peats, water content should always be
kept higher than critical water contentkept higher than critical water content. By using ameliorants containing high Fe3+, derivative phenolic
acids as the sources of C-emission were decreased and peatacids as the sources of C-emission were decreased and peat productivity was increased.
The decrease of C-emission was of 0.60 t C ha-1 yr-1 (28%) in The decrease of C emission was of 0.60 t C ha yr (28%) in fresh water peat, 0.61 t C ha-1 yr-1 (30%) in brackish peat, and 0.63 t C ha-1 yr-1 (31%) in marine peat.
6 Acknowledgment6. Acknowledgment
With the many problems I faced from the time I thought of implementing this research, I would not have been able to
hi l i h h l f idachieve any results without help from many side. For this reason I would like to sincerely thank Drs. Salampak,
M lj d D M i Siti Z h h d Ed i S S ih d MMuljady D. Mario, Siti Zahrah and Edwin S. Saragih, and Mr. Azri, Mr. Sulistyono and Mr. Nicolas for their assistance with field and laboratory works.field and laboratory works.
This research was supported by the Team Research Grant Program, (URGE Project) Batch IV, Directorate General of g , ( j ) ,Hgher Education, Ministry of National Education, Indonesia.

Field survey & research on peat swamp forest in Lagan – Jambi [1976]
Thank you