c i d a d e d e s à o p a u l o indicadores · bibliografia. 1. são paulo (sp) – anuário 2....
TRANSCRIPT
E PESQUISAS DO TURISMO
C I D A D E D E S Ã O P A U L O
INDICADORES2008
*TOURISM INDICATORS AND RESEARCH IN THE CITY OF SÃO PAULO
*
E PESQUISAS DO TURISMO
C I D A D E D E S Ã O P A U L O
INDICADORES2008*TOURISM INDICATORS AND RESEARCH IN THE CITY OF SÃO PAULO
*
INDICADORES E PESQUISAS DO TURISMO DA CIDADE DE SÃO PAULOTOURISM INDICATORS AND RESEARCH IN THE CITY OF SÃO PAULO
[tradução BTS Traduções]
São Paulo : São Paulo Turismo, 2008.
Vários colaboradores.
Bibliografia.
1. São Paulo (SP) – Anuário
2. São Paulo (SP) – Descrição
3. São Paulo (SP) – Indicadores
4. São Paulo (SP) – Pesquisas
5. Turismo – São Paulo (SP)
I. Título: Tourism Indicators and Research in the City of São Paulo.
08-09495
CDD-918.1611
Índices para catálogo sistemático:
1. Indicadores e pesquisas do turismo : São Paulo : Cidade : Anuário
918.1611
As cores (cinza, preto e azul) desta publicação, incluindo a capa, foram adotadas com base em pesquisa de “Imagem do Turismo na Cidade de São Paulo”, realizada em 2008 pela SPTuris,
conforme opinião de turistas e moradores.
The colors (gray, black and blue) of this book, including the cover art, were chosen based on the survey carried out in 2008 by SPTuris, “Image of Tourism in the City of São Paulo” using the
opinions of both visitors and residents.
w w w . c i d a d e d e s a o p a u l o . c o m 3
DEM
ANDA
TUR
ÍSTI
CA /
TOUR
ISM
DEM
AND
Introdução / Foreword _ _ _ _ _ _ _ _ _ _ _ _ _ _ _ _ _ _ _ _ _ _ _ _ _ _ _ _ _ _ _ _ _ _ _ _ _ _ _ _ _ _ _ _ _ _ _ _ _ _ _ _ _ _ _ _ _ _ _ _ _ _ _ _ _ _ _ _ _ _ _ _ _ _ _ _ 5O maior destino turístico do país / The greatest tourism destination in the country _ _ _ _ _ _ _ _ _ _ _ _ _ _ _ _ _ _ _ _ 6Oferta turística / Tourism attractions _ _ _ _ _ _ _ _ _ _ _ _ _ _ _ _ _ _ _ _ _ _ _ _ _ _ _ _ _ _ _ _ _ _ _ _ _ _ _ _ _ _ _ _ _ _ _ _ _ _ _ _ _ _ _ _ _ _ _ _ _ _ 8
DEMANDA TURÍSTICA NA CIDADE DE SÃO PAULOTOURISM DEMAND IN THE CITY OF SÃO PAULO _ _ _ _ _ _ _ _ _ _ _ _ _ _ _ _ _ _ _ _ _ _ _ 10 DEMANDA TURÍSTICA NA CIDADE DE SÃO PAULO / TOURISM DEMAND IN THE CITY OF SÃO PAULO _ _ _ _ _ _ _ _ _ _ _ 11 CARACTERIZAÇÃO DA DEMANDA TURÍSTICA DOMÉSTICA / CHARACTERIZATION OF DOMESTIC TOURISM DEMAND _ _ _ _ _ _ _ _ _ _ _ _ _ _ _ _ _ _ _ _ _ _ _ _ _ _ _ _ _ _ _ _ _ _ _ _ _ _ _ _ _ _ _ _ _ _ _ _ 12 CARACTERIZAÇÃO DA DEMANDA TURÍSTICA INTERNACIONAL / CHARACTERIZATION OF INTERNATIONAL TOURISM DEMAND _ _ _ _ _ _ _ _ _ _ _ _ _ _ _ _ _ _ _ _ _ _ _ _ _ _ _ _ _ _ _ _ _ _ _ _ _ _ _ _ _ _ _ 16
ASPECTOS CONJUNTURAIS DO TURISMO PAULISTANOCONJUNCTURAL ASPECTS OF TOURISM IN SÃO PAULO _ _ _ _ _ _ _ _ _ _ _ _ _ _ _ _ _ 20 HOTELARIA / HOTEL INDUSTRY _ _ _ _ _ _ _ _ _ _ _ _ _ _ _ _ _ _ _ _ _ _ _ _ _ _ _ _ _ _ _ _ _ _ _ _ _ _ _ _ _ _ _ _ _ _ _ _ _ _ _ _ _ _ _ _ _ _ _ _ _ _ _ _ _ _ _ 21 FLUXO AÉREO / AIR TRAFFIC _ _ _ _ _ _ _ _ _ _ _ _ _ _ _ _ _ _ _ _ _ _ _ _ _ _ _ _ _ _ _ _ _ _ _ _ _ _ _ _ _ _ _ _ _ _ _ _ _ _ _ _ _ _ _ _ _ _ _ _ _ _ _ _ _ _ _ _ _ _ 25 TERMINAIS RODOVIÁRIOS / BUS TERMINALS _ _ _ _ _ _ _ _ _ _ _ _ _ _ _ _ _ _ _ _ _ _ _ _ _ _ _ _ _ _ _ _ _ _ _ _ _ _ _ _ _ _ _ _ _ _ _ _ _ _ _ _ _ _ _ _ 27 VOLUME DO ISS / VOLUME OF ISS _ _ _ _ _ _ _ _ _ _ _ _ _ _ _ _ _ _ _ _ _ _ _ _ _ _ _ _ _ _ _ _ _ _ _ _ _ _ _ _ _ _ _ _ _ _ _ _ _ _ _ _ _ _ _ _ _ _ _ _ _ _ _ _ _ 28 EVENTOS / EVENTS _ _ _ _ _ _ _ _ _ _ _ _ _ _ _ _ _ _ _ _ _ _ _ _ _ _ _ _ _ _ _ _ _ _ _ _ _ _ _ _ _ _ _ _ _ _ _ _ _ _ _ _ _ _ _ _ _ _ _ _ _ _ _ _ _ _ _ _ _ _ _ _ _ _ _ _ _ 29
PESQUISAS EM EVENTOS DE GRANDE PORTESURVEYS IN HIGH PROFILE EVENTS _ _ _ _ _ _ _ _ _ _ _ _ _ _ _ _ _ _ _ _ _ _ _ _ _ _ _ _ _ _ _ _ 32 ADVENTURE SPORTS FAIR / ADVENTURE SPORTS FAIR _ _ _ _ _ _ _ _ _ _ _ _ _ _ _ _ _ _ _ _ _ _ _ _ _ _ _ _ _ _ _ _ _ _ _ _ _ _ _ _ _ _ _ _ _ _ _ 33 BIENAL DO LIVRO / BOOK BIENNIAL _ _ _ _ _ _ _ _ _ _ _ _ _ _ _ _ _ _ _ _ _ _ _ _ _ _ _ _ _ _ _ _ _ _ _ _ _ _ _ _ _ _ _ _ _ _ _ _ _ _ _ _ _ _ _ _ _ _ _ _ _ _ _ 38 CARNAVAL / CARNIVAL _ _ _ _ _ _ _ _ _ _ _ _ _ _ _ _ _ _ _ _ _ _ _ _ _ _ _ _ _ _ _ _ _ _ _ _ _ _ _ _ _ _ _ _ _ _ _ _ _ _ _ _ _ _ _ _ _ _ _ _ _ _ _ _ _ _ _ _ _ _ _ _ _ _ _ 43 FRANCAL / FRANCAL _ _ _ _ _ _ _ _ _ _ _ _ _ _ _ _ _ _ _ _ _ _ _ _ _ _ _ _ _ _ _ _ _ _ _ _ _ _ _ _ _ _ _ _ _ _ _ _ _ _ _ _ _ _ _ _ _ _ _ _ _ _ _ _ _ _ _ _ _ _ _ _ _ _ _ _ 48 GP BRASIL DE FÓRMULA 1 / BRAZILIAN FORMULA 1 GP _ _ _ _ _ _ _ _ _ _ _ _ _ _ _ _ _ _ _ _ _ _ _ _ _ _ _ _ _ _ _ _ _ _ _ _ _ _ _ _ _ _ _ _ _ _ 53 HOSPITALAR / HOSPITALAR _ _ _ _ _ _ _ _ _ _ _ _ _ _ _ _ _ _ _ _ _ _ _ _ _ _ _ _ _ _ _ _ _ _ _ _ _ _ _ _ _ _ _ _ _ _ _ _ _ _ _ _ _ _ _ _ _ _ _ _ _ _ _ _ _ _ _ _ _ _ 58 PARADA DO ORGULHO GLBT / GLBT PARADE _ _ _ _ _ _ _ _ _ _ _ _ _ _ _ _ _ _ _ _ _ _ _ _ _ _ _ _ _ _ _ _ _ _ _ _ _ _ _ _ _ _ _ _ _ _ _ _ _ _ _ _ _ _ _ _ 63 SALÃO DO AUTOMÓVEL / AUTOMOBILE TRADE SHOW _ _ _ _ _ _ _ _ _ _ _ _ _ _ _ _ _ _ _ _ _ _ _ _ _ _ _ _ _ _ _ _ _ _ _ _ _ _ _ _ _ _ _ _ _ _ _ _ _ 68 VIRADA CULTURAL / VIRADA CULTURAL _ _ _ _ _ _ _ _ _ _ _ _ _ _ _ _ _ _ _ _ _ _ _ _ _ _ _ _ _ _ _ _ _ _ _ _ _ _ _ _ _ _ _ _ _ _ _ _ _ _ _ _ _ _ _ _ _ _ _ _ 73
AÇÕES PARA O DESENVOLVIMENTO DO TURISMOPROJECTS FOR TOURISM DEVELOPMENT _ _ _ _ _ _ _ _ _ _ _ _ _ _ _ _ _ _ _ _ _ _ _ _ _ _ _ _ 79 CENTRAIS DE INFORMAÇÕES TURÍSTICAS - CITS / TOURIST INFORMATION CENTERS _ _ _ _ _ _ _ _ _ _ _ _ _ _ _ _ _ _ _ _ _ _ _ 80 TURISMO NO CENTRO / TOURISM IN THE DOWNTOWN AREA _ _ _ _ _ _ _ _ _ _ _ _ _ _ _ _ _ _ _ _ _ _ _ _ _ _ _ _ _ _ _ _ _ _ _ _ _ _ _ _ _ _ _ 84
PESQUISAS POR SEGMENTOSURVEYS BY SEGMENTS _ _ _ _ _ _ _ _ _ _ _ _ _ _ _ _ _ _ _ _ _ _ _ _ _ _ _ _ _ _ _ _ _ _ _ _ _ _ _ _ _ _ 88 GASTRONOMIA E CULTURA / GASTRONOMY AND CULTURE _ _ _ _ _ _ _ _ _ _ _ _ _ _ _ _ _ _ _ _ _ _ _ _ _ _ _ _ _ _ _ _ _ _ _ _ _ _ _ _ _ _ _ _ _ 89 NEGÓCIOS CORPORATIVOS / CORPORATE BUSINESS _ _ _ _ _ _ _ _ _ _ _ _ _ _ _ _ _ _ _ _ _ _ _ _ _ _ _ _ _ _ _ _ _ _ _ _ _ _ _ _ _ _ _ _ _ _ _ _ _ _ 91 MOTIVAÇÃO DAS VIAGENS NOS HOTÉIS / TRAVEL MOTIVATION OF HOTEL GUESTS _ _ _ _ _ _ _ _ _ _ _ _ _ _ _ _ _ _ _ _ _ _ _ _ _ 93
Diagnósticos e Conclusões / Diagnoses and Conclusions _ _ _ _ _ _ _ _ _ _ _ _ _ _ _ _ _ _ _ _ _ _ _ _ _ _ _ _ _ _ _ _ _ _ _ _ _ _ _ _ _ _ _ _ 96Observações sobre a Metodologia / Remarks on the Methodology _ _ _ _ _ _ _ _ _ _ _ _ _ _ _ _ _ _ _ _ _ _ _ _ _ _ _ _ _ _ _ _ _ _ _ _ 98
Índi
ce
PREFEITO/MAYOR:
GILBERTO KASSAB
PRESIDENTE DA SÃO PAULO TURISMO/ PRESIDENT OF SÃO PAULO TURISMO:
CAIO LUIZ DE CARVALHO
DIRETORA DE TURISMO E ENTRETENIMENTO DA SÃO PAULO TURISMO / TOURISM AND ENTERTAINMENT DIRECTOR OF SÃO PAULO TURISMO:
LUCIANE LEITE
COORDENAÇÃO TÉCNICA / TECHNICAL COORDINATION:
BEATRIZ LAGE
DESIGN GRÁFICO / GRAPHIC DESIGN:
RENE PEROL
expe
dien
te
ASSISTENTE GRÁFICO / GRAPHIC ASSISTANT:
FÁBIO MONTANHEIRO
EQUIPE TÉCNICA / TECHNICAL TEAM:
BERNARDO IGNARRA FÁBIO MONTANHEIRO FABÍOLA BEMFEITO JULIANA CARRASCO MARÍLIA UINT MÁRIO LA TORRE FILHO
ESTAGIÁRIOS / TRAINEES:
ADRIANA GAMA ALESSANDRA TAMASHIRO ANA CAROLINA TEIXEIRA DE FREITAS FLORA RIBEIRO DA LUZ GEROLA MARIA FERNANDA PASSARELLI MARIANA ARA PESSÔA SAYEG MORITZ DIENEMANN SOLANGE VIEIRA MARQUES VINÍCIUS BRUNELLI BARBOSA
COLABORAÇÃO / COLLABORATION:
ADRIANA OMURO ADRIANO GOMES ALINE DELMANTO ANDRÉIA PIASON ANDREZZA SERRA CAMILA OCHOA CAROLINA NEGRI CRISTINA ROLLO EDILSON FRANCISCO CAVICHIA FERNANDA ASCAR DE ALBUQUERQUE JANAÍNA TRENTIN LÚCIA REGINA LUCIANA CANTO LUIS PASCUZZI MARISA MARROCOS RAQUEL VETTORI RODRIGO SUTÃO LIMA ALVES SÉRGIO PORTO THELMA GHOBRIL VANESSA JAENICK
REVISÃO DE TEXTOS / PROOFREADING OF TEXTS:
JUROTRANS TRADUÇÕES
TRADUÇÃO / TRANSLATION
BTS TRADUÇÕES
ENTIDADES ENVOLVIDAS / INSTITUTIONS INVOLVED
CONSELHO MUNICIPAL DE TURISMO DA CIDADE DE SÃO PAULO – COMTUR EMPRESA BRASILEIRA DE INFRA-ESTRUTURA AEROPORTUÁRIA – INFRAERO FÓRUM DOS OPERADORES HOTELEIROS DO BRASIL - FOHB FUNDAÇÃO INSTITUTO DE PESQUISAS ECONÔMICAS – FIPE INSTITUTO BRASILEIRO DE GEOGRAFIA E ESTATÍSTICA – IBGE INTERNATIONAL CONGRESS AND CONVENTION ASSOCIATION – ICCA SÃO PAULO CONVENTION & VISITORS BUREAU – SPC&VB SÃO PAULO TURISMO S/A – SPTURIS SECRETARIA MUNICIPAL DE FINANÇAS – SMF SECRETARIA MUNICIPAL DO VERDE E MEIO AMBIENTE – SMVMA SOCICAM – TERMINAL DE PASSAGEIROS
UNIÃO BRASILEIRA DE PROMOTORES DE FEIRAS – UBRAFE
INSTITUIÇÕES DE ENSINO SUPERIOR/ INSTITUTIONS OF HIGHER EDUCATION
CENTRO FEDERAL DE EDUCAÇÃO TECNOLÓGICA DE SÃO PAULO – CEFET-SP CENTRO UNIVERSITÁRIO NOVE DE JULHO – UNINOVE CENTRO UNIVERSITÁRIO SENAC – SP UNIVERSIDADE ANHEMBI MORUMBI – UAM UNIVERSIDADE CRUZEIRO DO SUL – UNICSUL UNIVERSIDADE PAULISTA – UNIP
A publicação institucional “Indicadores e Pesquisas do Turismo na Cidade de São Paulo” é a primeira coletânea de resultados das pesquisas desenvolvidas pela São Paulo Turismo, de 2005 a 2008, abrangendo um conjunto de informações quantitativas e qualitativas sobre o desempenho do turismo na Cidade de São Paulo.
Permite uma visão espacializada da oferta turística em áreas selecionadas, como parques e áreas verdes, shoppings, museus, teatros e centros culturais.
Apresenta o dimensionamento e a caracterização da demanda turística da metrópole paulistana, e dos principais indicadores do desempenho do turismo no setor hoteleiro, no fluxo aéreo local, nos terminais rodoviários, no volume do ISS, nos eventos e feiras de negócios da capital.
Disponibiliza um conjunto de indicadores básicos sobre pesquisas realizadas nos megaeventos da Cidade de São Paulo. Também oferece informações sobre o desempenho de ações internas da empresa, destacando as Centrais de Informações Turísticas (CITs), o Plano de Desenvolvimento Turístico do Centro, concluindo com pesquisas de segmentos específicos.
Esta obra agrega um conjunto de variáveis comparativas sobre o turismo que mostra toda sua magnitude e relacionamento com os demais setores da Cidade de São Paulo.IN
TROD
UÇÃO
FORE
WOR
D
The institutional publication “Indicadores e Pesquisas do Turismo na Cidade de São Paulo” (Tourism Indicators and Research in the City of São Paulo) is the first collection of results of surveys carried out by São Paulo Turismo between 2005 and 2008, covering a range of quantitative and qualitative information about tourism performance in the City of São Paulo.
It gives a specialized view of thetourism related products in selected areas, such as parks and green areas, shopping centers, museums, theaters and cultural centers.
It presents the scale and nature of the tourism demand in the metropolitan area of the city, and the main tourism performance indicators for the hotel sector, use of the airports, the highway bus terminals, the volume of ISS (tax on services), and events and business fairs in the capital.
It provides a range of basic indicators derived from surveys carried out at mega-events in the City of São Paulo. It also offers information about the performance of internal actions of the company, highlighting the Tourist Information Centers (CITs) and the “Plano de Desenvolvimento Turistíco do Centro” (Plan for Downtown Area Tourism Development), and concludes with some surveys on specific sectors.
This work combines a set of comparative variables on tourism, which shows all its magnitude and interaction with the other economic sectors of the City of São Paulo.
w w w . c i d a d e d e s a o p a u l o . c o m6
DEM
ANDA
TUR
ÍSTI
CA /
TOUR
ISM
DEM
AND
O MAIOR DESTINO TURÍSTICO DO PAÍSA São Paulo Turismo (SPTuris) é a empresa de promoção turística e eventos da Cidade de São Paulo. Atua no plane-jamento turístico, em pesquisas, no incentivo à criação de novos produtos e roteiros, mapeamento de atrações, estímulo a novos eventos ou consolidação daqueles com potencial turístico, relacionamento com a cadeia produ-tiva do setor, promoção do destino no Brasil e no exterior, entre múltiplas ações integradas.
Com o posicionamento da cidade como grande pólo de lazer e entretenimento, a SPTuris contabiliza resultados favoráveis que revelam a grandeza de São Paulo como des-tino turístico. Chega ao final de 2008 com a perspectiva de receber 11 milhões de turistas anuais, e com indicado-res inéditos nas taxas de ocupação hoteleira, em média de 70%, e elevado crescimento na receita por quarto de hotel ocupado. Em termos de arrecadação anual de ISS, o setor turístico deste destino ultrapassou R$110 milhões, com um incremento de 97% desde o início da década.
São Paulo também ocupa, desde 2006, a liderança nas Américas entre as cidades que mais sediam eventos internacionais no mundo, oferecendo muitos produtos e programas na cidade como o “Turismetrô”, o “Fique Mais um Dia”, o “SP Tanque Cheio”, o “Plano de Desenvolvimento
Turístico do Centro”, o “Projeto de Capacidade a Taxistas e Guias de Turismo”, além do material de apoio para o trade como o “Manual de Capacitação Destino São Paulo”, o “São Paulo Saúde – Guia de Turismo Médico e Bem-Estar” e o “Manual Turismo de Negócios e de Incentivo”.
Como empresa de eventos, a São Paulo Turismo coor-dena a realização e, por vezes, também a infra-estrutura dos grandes eventos da maior cidade da América Latina. Entre eles o Carnaval, a Virada Cultural, o Natal Iluminado, o Réveillon na Paulista, além de dar suporte a outros acon-tecimentos tradicionais, como a Parada GLBT, o GP Brasil de Fórmula 1, a Virada Esportiva, a Maratona Internacional de SP e outros. É atuante em eventos importantes, como na organização da infra-estrutura na visita do Papa Bento 16 à Cidade de São Paulo em 2007, bem como na preparação do dossiê paulistano para a Copa Mundial de 2014.
É ainda a responsável pela administração do Anhembi Parque e de seus espaços, como o Pavilhão de Exposições, Palácio de Convenções, Sambódromo, Arena e Auditório Elis Regina, assim como do Autódromo de Interlagos.
Conheça mais sobre o turismo e os eventos em São Paulo nos sites: www.spturis.com, www.cidadedesaopaulo.com e www.anhembi.com.br.
São Paulo Turismo (SPTuris) is the tourism and events promotion company of the City of São Paulo. Its activities include tourism planning, surveys, providing incentives for the creation of new products and sightseeing, mapping the attractions, promoting new events or consolidating those with tourism potential, liaising with the production chain of the sector and promoting the destination in Brazil and abroad, among many other integrated actions. With the city’s position as the capital of leisure and entertainment, SPTuris has seen favorable results that demonstrate the greatness of São Paulo as a tourism destination. By the end of 2008, the city expects to have received 11 million tourists per year, with all-time high indicators with regard to hotel occupancy rates – around 70% - and a high growth rate in view of income per occupied hotel room. The amounts collected annually in ISS for the tourism sector in this destination was worth more than R$110 million, with an increase of 97% since the start of the decade.
São Paulo has also occupied, since 2006, the leading position in the Americas in the world-wide ranking of cities hosting the highest number of international events, offering more products and programs in the city, such as “Turismetrô”, “Fique Mais um Dia”, “SP Tanque Cheio”, the Downtown Area Tourism Development plan, and the Project to train Taxi Drivers and Tour Guides, and provi-ding support material for the trade, such as the “Manual
de Capacitação Destino São Paulo” (Destination São Paulo Training Manual), and “São Paulo Saúde – Guia de Turismo Médico e Bem-Estar” (São Paulo Health – Guide to Medical and Well-Being Tourism).
As an event company, São Paulo Turismo coordinates the organization and sometimes also the infrastructure for major events held in Latin America’s largest city. These include the Carnival, the “Virada Cultural”, the Christmas Lights, and the New Year celebrations in the capital, as well as providing support for other traditional events, such as the GLBT Parade, the Brazilian Formula 1 Grand Prix, the “Virada Esportiva” sporting event, the São Paulo Inter- national Marathon, and others. São Paulo Turismo was involved in major events, such as the organization of infrastructure for the visit of Pope Benedict XVI to the City of São Paulo in 2007, and the preparations of São Paulo’s bid dossier for the 2014 World Cup. It is also responsible for administrating the Anhembi Parque convention center and its different spaces, including the Pavilhão de Exposições, the Palácio de Convenções, Sambadrome, the Arena and the Elis Regina Auditorium, as well as the Inter-lagos Race Track.
Learn more about tourism and events in São Paulo, at the following websites: www.spturis.com, www.cidadedesaopaulo.com and www.anhembi.com.br.
THE GREATEST TOURISM DESTINATION IN THE COUNTRY
w w w . c i d a d e d e s a o p a u l o . c o m 7
DEM
ANDA
TUR
ÍSTI
CA /
TOUR
ISM
DEM
AND
1
1
2
3
4
1
7
6
5
23
10
45
6
10
7
9 814
13
12
11
19
20181716
15
23 2221
25 24
26
11
9
81
23
7 8
1
2
3
4
5
6
78
9
1011
1213
21
22
23
2420
25
26
27
28 31
1914
18 8
30
15
1716
9
105
46
2
3
4
6
7
8
9
10
12
13
14
15
16
17
18115
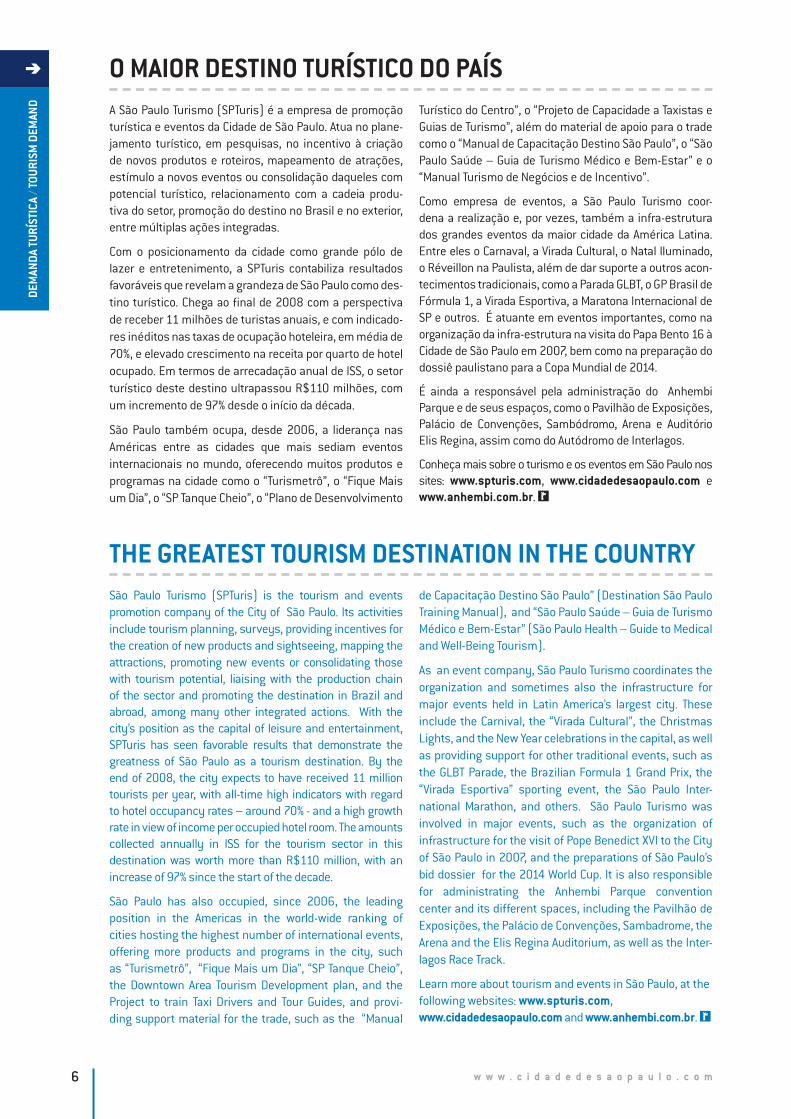
DADOS GERAIS DO MUNICÍPIO / GENERAL INFORMATION
1. Belém 2. Mooca 3. Vila Prudente 4. Água Rasa 5. Tatuapé 6. Penha 7. Vila Matilde 8. Carrão 9. Vila Formosa 10. São Lucas 11. Sapopemba 12. Aricanduva 13. Cidade Líder 14. Artur Alvim 15. Ponte Rosa 16. Cangaíba 17. Ermelino Matarazzo 18. Vila Jacuí 19. Itaquera 20. Parque do Carmo 21. São Mateus 22. São Rafael 23. Iguatemi 24. José Bonifácio 25. Parelheiros 26. Guaianazes 27. Lajeado 28. Vila Curuçá 29. São Miguel 30. Jardim Helena 31. Itaim Paulista
1. Raposo Tavares 2. Vila Sônia 3. Morumbi 4. Itaim Bibi 5. Moema 6. Vila Mariana 7. Ipiranga 8. Sacomã 9. Cursino 10. Saúde 11. Campo Belo 12. Santo Amaro 13. Vila Andrade 14. Campo Limpo 15. Capão Redondo 16. Jardim São Luiz 17. Socorro 18. Campo Grande 19. Jabaquara 20. Cidade Ademar 21. Pedreira 22. Cidade Dutra 23. Jardim Ângela 24. Grajaú 25. Cidade Tiradentes 26. Marsilac
1. Anhangüera 2. Perus 3. Jaraguá 4. Pirituba 5. São Domingos 6. Brasilândia 7. Freguesia do Ó 8. Cachoeirinha 9. Limão 10. Mandaqui 11. Casa Verde 12. Santana 13. Tremembé 14. Tucuruvi 15. Vila Guilherme 16. Jaçanã 17. Vila Medeiros 18. Vila Maria
1. Santa Cecília 2. Consolação 3. Bela Vista 4. República 5. Bom Retiro 6. Sé 7. Liberdade 8. Cambuci 9. Brás 10. Pari
1. Jaguara 2. Vila Leopoldina 3. Jaguaré 4. Rio Pequeno 5. Butantã 6. Alto de Pinheiros 7. Lapa 8. Barra Funda 9. Perdizes 10. Pinheiros 11. Jardim Paulista
Fundação da cidade/ Founding of the city
25 DE JANEIRO DE 1554Localização/ Location
REGIÃO SUDESTE DO BRASILExtensão/ Size
1530 KM2População (2007)/ Population
10.886.518 hab./inh.Produto Interno Bruto/ Gross Domestic Product
18% DO PIB BRASILEIRO
CENTRO / CENTER
OESTE / WEST
NORTE / NORTH
SUL / SOUTH
LESTE / EAST
Fonte: São Paulo Turismo, 2008
w w w . c i d a d e d e s a o p a u l o . c o m8
DEM
ANDA
TUR
ÍSTI
CA /
TOUR
ISM
DEM
AND
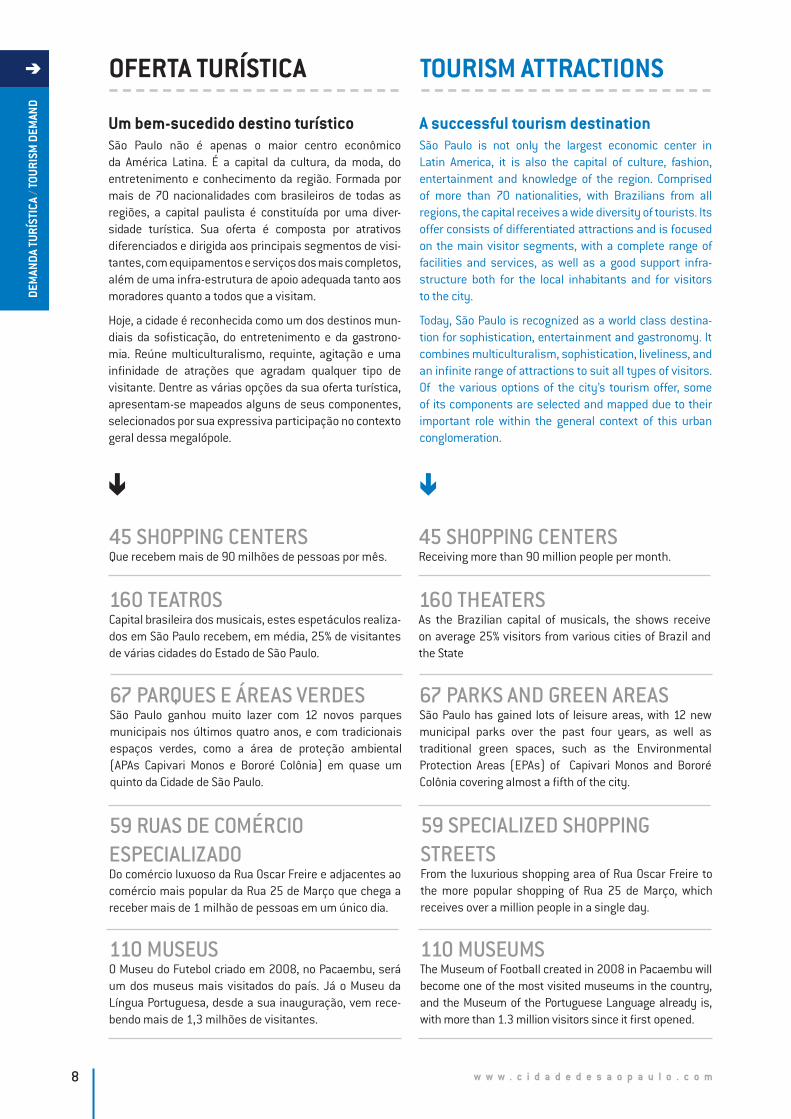
Um bem-sucedido destino turísticoSão Paulo não é apenas o maior centro econômico da América Latina. É a capital da cultura, da moda, do entretenimento e conhecimento da região. Formada por mais de 70 nacionalidades com brasileiros de todas as regiões, a capital paulista é constituída por uma diver-sidade turística. Sua oferta é composta por atrativos diferenciados e dirigida aos principais segmentos de visi-tantes, com equipamentos e serviços dos mais completos, além de uma infra-estrutura de apoio adequada tanto aos moradores quanto a todos que a visitam.
Hoje, a cidade é reconhecida como um dos destinos mun-diais da sofisticação, do entretenimento e da gastrono-mia. Reúne multiculturalismo, requinte, agitação e uma infinidade de atrações que agradam qualquer tipo de visitante. Dentre as várias opções da sua oferta turística, apresentam-se mapeados alguns de seus componentes, selecionados por sua expressiva participação no contexto geral dessa megalópole.
A successful tourism destinationSão Paulo is not only the largest economic center in Latin America, it is also the capital of culture, fashion, entertainment and knowledge of the region. Comprised of more than 70 nationalities, with Brazilians from all regions, the capital receives a wide diversity of tourists. Its offer consists of differentiated attractions and is focused on the main visitor segments, with a complete range of facilities and services, as well as a good support infra-structure both for the local inhabitants and for visitors to the city.
Today, São Paulo is recognized as a world class destina-tion for sophistication, entertainment and gastronomy. It combines multiculturalism, sophistication, liveliness, and an infinite range of attractions to suit all types of visitors. Of the various options of the city’s tourism offer, some of its components are selected and mapped due to their important role within the general context of this urban conglomeration.
45 SHOPPING CENTERSQue recebem mais de 90 milhões de pessoas por mês.
45 SHOPPING CENTERSReceiving more than 90 million people per month.
59 RUAS DE COMÉRCIO ESPECIALIZADO Do comércio luxuoso da Rua Oscar Freire e adjacentes ao comércio mais popular da Rua 25 de Março que chega a receber mais de 1 milhão de pessoas em um único dia.
59 SPECIALIZED SHOPPING STREETS From the luxurious shopping area of Rua Oscar Freire to the more popular shopping of Rua 25 de Março, which receives over a million people in a single day.
160 TEATROS Capital brasileira dos musicais, estes espetáculos realiza-dos em São Paulo recebem, em média, 25% de visitantes de várias cidades do Estado de São Paulo.
160 THEATERSAs the Brazilian capital of musicals, the shows receive on average 25% visitors from various cities of Brazil and the State
67 PARQUES E ÁREAS VERDESSão Paulo ganhou muito lazer com 12 novos parques municipais nos últimos quatro anos, e com tradicionais espaços verdes, como a área de proteção ambiental (APAs Capivari Monos e Bororé Colônia) em quase um quinto da Cidade de São Paulo.
67 PARKS AND GREEN AREAS São Paulo has gained lots of leisure areas, with 12 new municipal parks over the past four years, as well as traditional green spaces, such as the Environmental Protection Areas (EPAs) of Capivari Monos and Bororé Colônia covering almost a fifth of the city.
110 MUSEUS O Museu do Futebol criado em 2008, no Pacaembu, será um dos museus mais visitados do país. Já o Museu da Língua Portuguesa, desde a sua inauguração, vem rece-bendo mais de 1,3 milhões de visitantes.
110 MUSEUMS The Museum of Football created in 2008 in Pacaembu will become one of the most visited museums in the country, and the Museum of the Portuguese Language already is, with more than 1.3 million visitors since it first opened.
OFERTA TURÍSTICA TOURISM ATTRACTIONS
w w w . c i d a d e d e s a o p a u l o . c o m 9
DEM
ANDA
TUR
ÍSTI
CA /
TOUR
ISM
DEM
AND
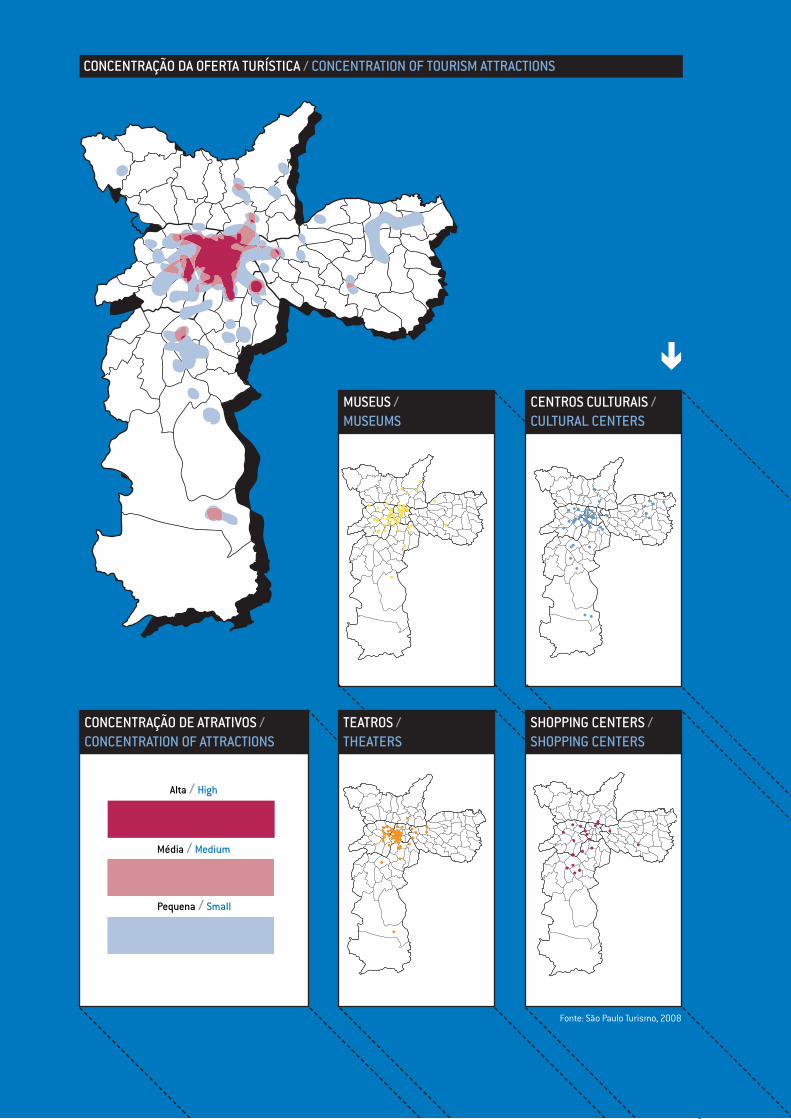
CONCENTRAÇÃO DE ATRATIVOS / CONCENTRATION OF ATTRACTIONS
TEATROS / THEATERS
SHOPPING CENTERS / SHOPPING CENTERS
MUSEUS / MUSEUMS
CENTROS CULTURAIS / CULTURAL CENTERS
Fonte: São Paulo Turismo, 2008
Alta / High
Média / Medium
Pequena / Small
CONCENTRAÇÃO DA OFERTA TURÍSTICA / CONCENTRATION OF TOURISM ATTRACTIONS
w w w . c i d a d e d e s a o p a u l o . c o m10
THE EXTENT AND CHARACTERIZATION OF THE LEISURE AND NON-LEISURE DEMAND IN THE CITY OF SÃO PAULO IS DIVIDED INTO TWO SEGMENTS: DOMESTIC TOURISM COMING FROM CITIES WITHIN THE STATE OF SÃO PAULO AND THE REST OF BRAZIL; AND INTERNATIONAL TOURISM. A TRUE PICTURE OF THE NUMBER AND PROFILE OF THE PEOPLE WHO ARRIVE AND STAY TEMPORARILY IN THE CITY OF SÃO PAULO, ATTRACTED BY ONE OR MORE INTERESTS, CAN CONTRIBUTE A LOT TO THE PLANNING PROCESS AIMED AT THE GROWTH AND DEVELOPMENT OF TOURISM IN THIS MAJOR METROPOLIS. THE PRESENTED INFORMATION ON CHAPTER I REFFERS TO THE RESEARCH PRODUCED BY “FUNDAÇÃO INSTITUTO DE PESQUISAS ECONÔMICAS – FIPE” FOR SÃO PAULO TURISMO – SPTURIS.
DEMANDA TURÍSTICA NA CIDADE DE SÃO PAULOTOURISM DEMAND IN THE CITY OF SÃO PAULO
REPRESENTADO PELO DIMENSIONAMENTO E PELA CARACTERIZAÇÃO DA DEMANDA POR LAZER E NÃO-LAZER NA CIDADE DE SÃO PAULO, DIFERENCIADA EM DOIS SEMENTOS: O TURISMO DOMÉSTICO ORIUNDO DE CIDADES EMISSORAS DO ESTADO DE SÃO PAULO E DO BRASIL; E O TURISMO INTERNACIONAL. O CONHECIMENTO REAL DO NÚMERO E DO PERFIL DAS PESSOAS QUE CHEGAM E PER-MANECEM TEMPORARIAMENTE NA CIDADE DE SÃO PAULO, ATRAÍDAS POR UM OU MAIS INTERESSES, EM MUITO CON-TRIBUIRÁ PARA O PROCESSO DE PLANEJAMENTO DIRECIO-NADO AO CRESCIMENTO E DESENVOLVIMENTO TURÍSTICO DESSA GRANDE METRÓPOLE. OS DADOS APRESENTADOS NO CAPÍTULO I REFEREM-SE À PESQUISA REALIZADA PELA FUNDAÇÃO INSTITUTO DE PESQUISAS ECONÔMICAS – FIPE PARA A SÃO PAULO TURISMO – SPTURIS.
I/CAPÍTULO / CHAPTER

w w w . c i d a d e d e s a o p a u l o . c o m 11
DEM
ANDA
TUR
ÍSTI
CA /
TOUR
ISM
DEM
AND
DEMANDA TURÍSTICA DA CIDADE DE SÃO PAULOTOURISM DEMAND IN THE CITY OF SÃO PAULO
DEMANDA TURÍSTICA DA CIDADE DE SÃO PAULO (em milhões) / TOURISM DEMAND IN THE CITY OF SÃO PAULO (in millions)
Fonte de dados brutos: FIPE / São Paulo Turismo, 2008
Fonte: São Paulo Turismo, 2008
* Estimativa / Forecast
* *Estimativa / Forecast
* Assumindo US$ 1.00 = R$ 1,9015 (cotação média de 2008) / Considering US$ 1.00 = R$ 1,9015 (2008 average rate)
1,27,0 8.0 1,4 1,58,7 9,1 9,3 1,7
11,010,710,2
9,48,2
1,6
2006 2008*20072004 2005
brasileiros / Brazilians estrangeiros / foreigners total / total
11,0 milhões de turistas em São PauloA demanda turística é representada pelo conjunto de pessoas que se deslocam e pernoitam na Cidade de São Paulo por várias motivações, procedentes de outras localidades, nacionais e internacionais.
Na pesquisa do dimensionamento da demanda turística paulistana, para o período de 2005 a 2008, a São Paulo Turismo adotou como critério de avaliação a média de UH disponíveis na cidade, o número de hóspedes por apar-tamento e as taxas de ocupação assinaladas no próximo capítulo . Com base nos indicadores médios de permanên-cia, de gastos diários per capita e dos meios de hospeda-gem fornecidos por pesquisa da Fundação Instituto de Pesquisas Econômicas - FIPE “Caracterização e Dimen-sionamento da Demanda Turística do Município de São Paulo” realizada em 2008, obtidos por dados secundários, estimou-se que a demanda total da cidade (doméstica e internacional), no presente ano, foi de 11,0 milhões de turistas, com a geração de uma receita estimada em R$ 6,2 bilhões.
11.0 million tourists in São PauloTourism demand is represented by the set of people coming from other national and international locations, who travel and spend the night in the City of São Paulo for different reasons.
In the research on the size of the tourism demand in São Paulo, for the period from 2004 to 2008, São Paulo Turismo adopted, as its evaluation criteria, the average number of available Accommodation Units in the city, the number of guests per apartment and the occupancy rates given in the next chapter. Based on the average indicators for length of stay, average daily spending per capita, and types of accommodation found in the “Fundação Institu-to de Pesquisas Econômicas - FIPE” survey entitled “Characterization and Size of Tourism Demand in the City of São Paulo”, carried out in 2008 and obtained from secon-dary data, it is estimated that the total demand of the city (both domestic and international) for the current year, is 11.0 million tourists, with generation of receipts estimated at R$ 6.2 billion.
RECEITA TURÍSTICA DA CIDADE DE SÃO PAULO (em bilhões de R$) / TOURISM RECEIPTS IN THE CITY OF SÃO PAULO (in billions of R$)
1,7*3,0 3,4 1,9* 2,0*3,7 3,8 3,9 2,3*
6,26,05,3
5,74,7
2,2*
2006 2008**20072004 2005
brasileiros / Brazilians estrangeiros / foreigners total / total
w w w . c i d a d e d e s a o p a u l o . c o m12
DEM
ANDA
TUR
ÍSTI
CA /
TOUR
ISM
DEM
AND
CARACTERIZAÇÃO DA DEMANDA TURÍSTICA DOMÉSTICACHARACTERIZATION OF DOMESTIC TOURISM DEMAND
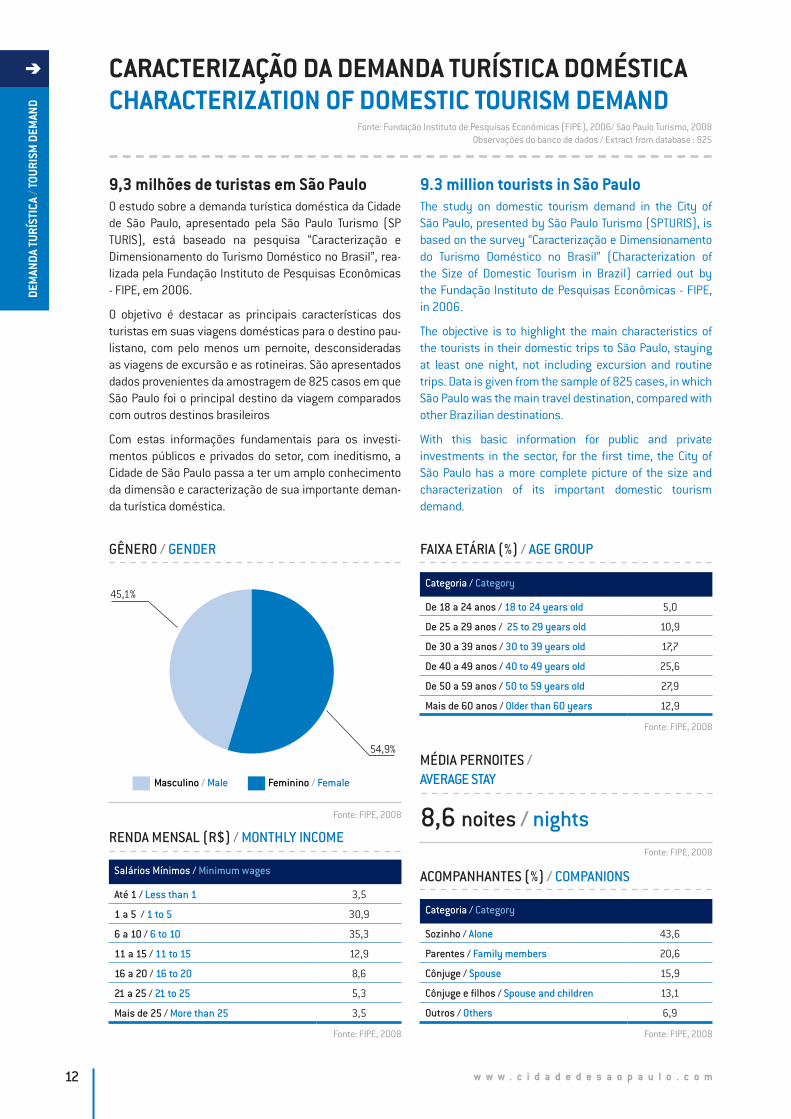
9,3 milhões de turistas em São PauloO estudo sobre a demanda turística doméstica da Cidade de São Paulo, apresentado pela São Paulo Turismo (SP TURIS), está baseado na pesquisa “Caracterização e Dimensionamento do Turismo Doméstico no Brasil”, rea-lizada pela Fundação Instituto de Pesquisas Econômicas - FIPE, em 2006.
O objetivo é destacar as principais características dos turistas em suas viagens domésticas para o destino pau-listano, com pelo menos um pernoite, desconsideradas as viagens de excursão e as rotineiras. São apresentados dados provenientes da amostragem de 825 casos em que São Paulo foi o principal destino da viagem comparados com outros destinos brasileiros
Com estas informações fundamentais para os investi-mentos públicos e privados do setor, com ineditismo, a Cidade de São Paulo passa a ter um amplo conhecimento da dimensão e caracterização de sua importante deman-da turística doméstica.
9.3 million tourists in São PauloThe study on domestic tourism demand in the City of São Paulo, presented by São Paulo Turismo (SPTURIS), is based on the survey “Caracterização e Dimensionamento do Turismo Doméstico no Brasil” (Characterization of the Size of Domestic Tourism in Brazil) carried out by the Fundação Instituto de Pesquisas Econômicas - FIPE, in 2006.
The objective is to highlight the main characteristics of the tourists in their domestic trips to São Paulo, staying at least one night, not including excursion and routine trips. Data is given from the sample of 825 cases, in which São Paulo was the main travel destination, compared with other Brazilian destinations.
With this basic information for public and private investments in the sector, for the first time, the City of São Paulo has a more complete picture of the size and characterization of its important domestic tourism demand.
RENDA MENSAL (R$) / MONTHLY INCOME
Salários Mínimos / Minimum wages
Até 1 / Less than 1 3,5
1 a 5 / 1 to 5 30,9
6 a 10 / 6 to 10 35,3
11 a 15 / 11 to 15 12,9
16 a 20 / 16 to 20 8,6
21 a 25 / 21 to 25 5,3
Mais de 25 / More than 25 3,5
FAIXA ETÁRIA (%) / AGE GROUP
ACOMPANHANTES (%) / COMPANIONS
Categoria / Category
De 18 a 24 anos / 18 to 24 years old 5,0
De 25 a 29 anos / 25 to 29 years old 10,9
De 30 a 39 anos / 30 to 39 years old 17,7
De 40 a 49 anos / 40 to 49 years old 25,6
De 50 a 59 anos / 50 to 59 years old 27,9
Mais de 60 anos / Older than 60 years 12,9
Categoria / Category
Sozinho / Alone 43,6
Parentes / Family members 20,6
Cônjuge / Spouse 15,9
Cônjuge e filhos / Spouse and children 13,1
Outros / Others 6,9
GÊNERO / GENDER
Fonte: Fundação Instituto de Pesquisas Econômicas (FIPE), 2006/ São Paulo Turismo, 2008Observações do banco de dados / Extract from database : 825
45,1%
54,9%
8,6 noites / nights
MÉDIA PERNOITES / AVERAGE STAY Masculino / Male Feminino / Female
Fonte: FIPE, 2008
Fonte: FIPE, 2008
Fonte: FIPE, 2008
Fonte: FIPE, 2008
Fonte: FIPE, 2008
w w w . c i d a d e d e s a o p a u l o . c o m 13
DEM
ANDA
TUR
ÍSTI
CA /
TOUR
ISM
DEM
AND
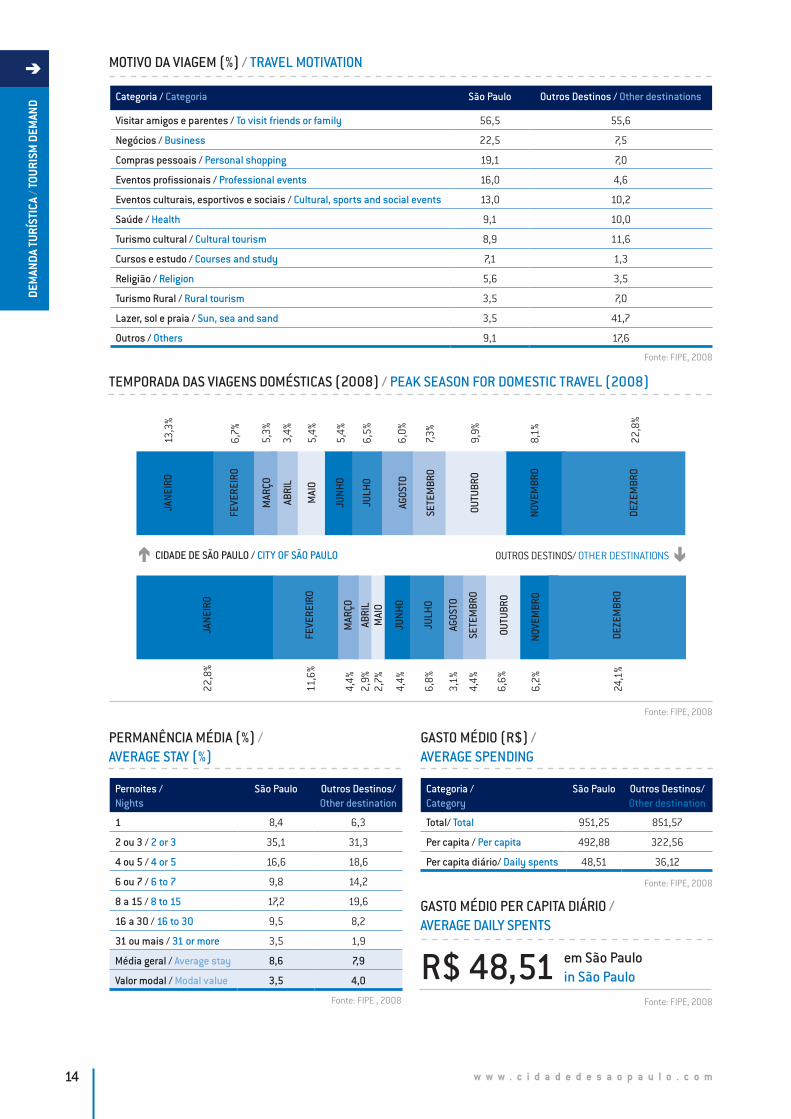
Outros meios de transporte/ Other means of transportation: 12,7%
MEIO DE TRANSPORTE / MEANS OF TRANSPORTATION
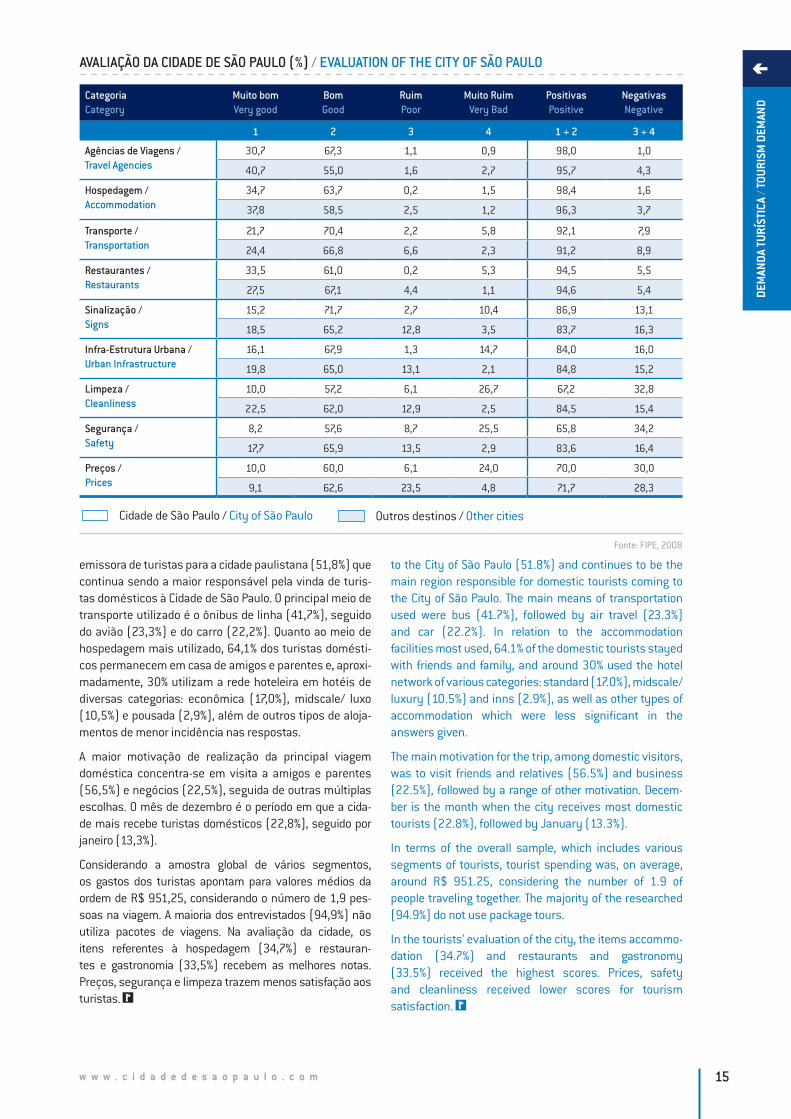
MEIOS DE HOSPEDAGEM (%) / ACCOMMODATION FACILITIES
Casa de amigos/ parentesHome of friends/ family
Hotel econômicoStandard hotel
Hotel midscale/ luxoMidscale/ luxury hotel
PousadaInn/ lodge
Imóvel próprio/ alugadoOwn/ rented home
OutroOther
64,1
1,1
60%
40%
20% 10,52,9
17,0
5,3
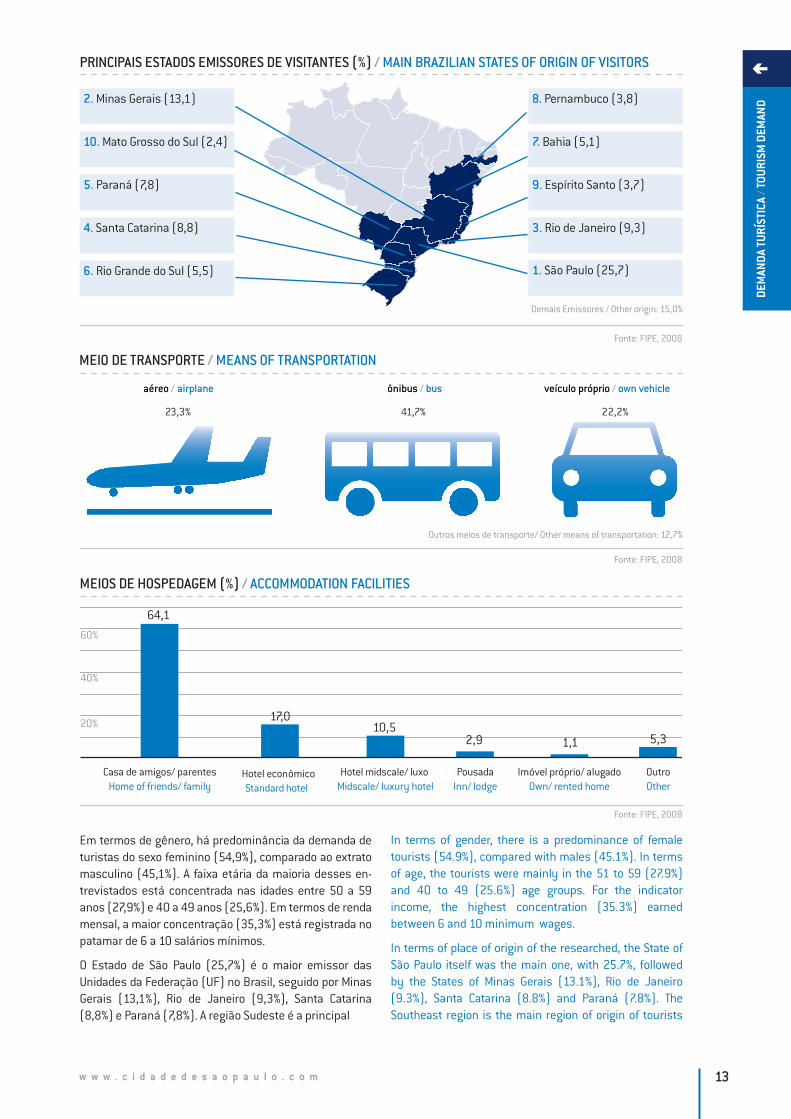
PRINCIPAIS ESTADOS EMISSORES DE VISITANTES (%) / MAIN BRAZILIAN STATES OF ORIGIN OF VISITORS
2. Minas Gerais (13,1)
10. Mato Grosso do Sul (2,4)
5. Paraná (7,8)
4. Santa Catarina (8,8)
6. Rio Grande do Sul (5,5)
8. Pernambuco (3,8)
7. Bahia (5,1)
9. Espírito Santo (3,7)
3. Rio de Janeiro (9,3)
1. São Paulo (25,7)
Demais Emissores / Other origin: 15,0%
Em termos de gênero, há predominância da demanda de turistas do sexo feminino (54,9%), comparado ao extrato masculino (45,1%). A faixa etária da maioria desses en- trevistados está concentrada nas idades entre 50 a 59 anos (27,9%) e 40 a 49 anos (25,6%). Em termos de renda mensal, a maior concentração (35,3%) está registrada no patamar de 6 a 10 salários mínimos.
O Estado de São Paulo (25,7%) é o maior emissor das Unidades da Federação (UF) no Brasil, seguido por Minas Gerais (13,1%), Rio de Janeiro (9,3%), Santa Catarina (8,8%) e Paraná (7,8%). A região Sudeste é a principal
In terms of gender, there is a predominance of female tourists (54.9%), compared with males (45.1%). In terms of age, the tourists were mainly in the 51 to 59 (27.9%) and 40 to 49 (25.6%) age groups. For the indicator income, the highest concentration (35.3%) earned between 6 and 10 minimum wages.
In terms of place of origin of the researched, the State of São Paulo itself was the main one, with 25.7%, followed by the States of Minas Gerais (13.1%), Rio de Janeiro (9.3%), Santa Catarina (8.8%) and Paraná (7.8%). The Southeast region is the main region of origin of tourists
aéreo / airplane ônibus / bus veículo próprio / own vehicle
22,2%41,7%23,3%
Fonte: FIPE, 2008
Fonte: FIPE, 2008
Fonte: FIPE, 2008
w w w . c i d a d e d e s a o p a u l o . c o m14
DEM
ANDA
TUR
ÍSTI
CA /
TOUR
ISM
DEM
AND
PERMANÊNCIA MÉDIA (%) / AVERAGE STAY (%)
GASTO MÉDIO (R$) / AVERAGE SPENDING
Pernoites / Nights
São Paulo Outros Destinos/Other destination
1 8,4 6,3
2 ou 3 / 2 or 3 35,1 31,3
4 ou 5 / 4 or 5 16,6 18,6
6 ou 7 / 6 to 7 9,8 14,2
8 a 15 / 8 to 15 17,2 19,6
16 a 30 / 16 to 30 9,5 8,2
31 ou mais / 31 or more 3,5 1,9
Média geral / Average stay 8,6 7,9
Valor modal / Modal value 3,5 4,0
Categoria / Category
São Paulo Outros Destinos/Other destination
Total/ Total 951,25 851,57
Per capita / Per capita 492,88 322,56
Per capita diário/ Daily spents 48,51 36,12
GASTO MÉDIO PER CAPITA DIÁRIO / AVERAGE DAILY SPENTS
R$ 48,51
MOTIVO DA VIAGEM (%) / TRAVEL MOTIVATION
Categoria / Categoria São Paulo Outros Destinos / Other destinations
Visitar amigos e parentes / To visit friends or family 56,5 55,6
Negócios / Business 22,5 7,5
Compras pessoais / Personal shopping 19,1 7,0
Eventos profissionais / Professional events 16,0 4,6
Eventos culturais, esportivos e sociais / Cultural, sports and social events 13,0 10,2
Saúde / Health 9,1 10,0
Turismo cultural / Cultural tourism 8,9 11,6
Cursos e estudo / Courses and study 7,1 1,3
Religião / Religion 5,6 3,5
Turismo Rural / Rural tourism 3,5 7,0
Lazer, sol e praia / Sun, sea and sand 3,5 41,7
Outros / Others 9,1 17,6
TEMPORADA DAS VIAGENS DOMÉSTICAS (2008) / PEAK SEASON FOR DOMESTIC TRAVEL (2008)
JANE
IRO
FEVE
REIR
O
MAR
ÇO
ABRI
LM
AIO
JUNH
O
JULH
O
AGOS
TO
SETE
MBR
O
OUTU
BRO
NOVE
MBR
O
DEZE
MBR
O
JANE
IRO
FEVE
REIR
O
MAR
ÇO
ABRI
L
MAI
O
JUNH
O
JULH
O
AGOS
TO
SETE
MBR
O
OUTU
BRO
NOVE
MBR
O
DEZE
MBR
O
OUTROS DESTINOS/ OTHER DESTINATIONSCIDADE DE SÃO PAULO / CITY OF SÃO PAULO
13,3
%
6,7%
5,3%
3,4%
5,4%
5,4%
6,0%
7,3%
6,5%
9,9%
22,8
%
8,1%
22,8
%
11,6
%
4,4%
2,9%
2,7%
4,4%
3,1%
4,4%
6,8%
6,6%
24,1
%
6,2%
Fonte: FIPE, 2008
Fonte: FIPE, 2008
Fonte: FIPE, 2008
Fonte: FIPE , 2008 Fonte: FIPE, 2008
em São Pauloin São Paulo
w w w . c i d a d e d e s a o p a u l o . c o m 15
DEM
ANDA
TUR
ÍSTI
CA /
TOUR
ISM
DEM
AND
CategoriaCategory
Muito bomVery good
BomGood
RuimPoor
Muito RuimVery Bad
PositivasPositive
NegativasNegative
1 2 3 4 1 + 2 3 + 4
Agências de Viagens / Travel Agencies
30,7 67,3 1,1 0,9 98,0 1,0
40,7 55,0 1,6 2,7 95,7 4,3
Hospedagem / Accommodation
34,7 63,7 0,2 1,5 98,4 1,6
37,8 58,5 2,5 1,2 96,3 3,7
Transporte / Transportation
21,7 70,4 2,2 5,8 92,1 7,9
24,4 66,8 6,6 2,3 91,2 8,9
Restaurantes / Restaurants
33,5 61,0 0,2 5,3 94,5 5,5
27,5 67,1 4,4 1,1 94,6 5,4
Sinalização / Signs
15,2 71,7 2,7 10,4 86,9 13,1
18,5 65,2 12,8 3,5 83,7 16,3
Infra-Estrutura Urbana / Urban Infrastructure
16,1 67,9 1,3 14,7 84,0 16,0
19,8 65,0 13,1 2,1 84,8 15,2
Limpeza / Cleanliness
10,0 57,2 6,1 26,7 67,2 32,8
22,5 62,0 12,9 2,5 84,5 15,4
Segurança / Safety
8,2 57,6 8,7 25,5 65,8 34,2
17,7 65,9 13,5 2,9 83,6 16,4
Preços / Prices
10,0 60,0 6,1 24,0 70,0 30,0
9,1 62,6 23,5 4,8 71,7 28,3
AVALIAÇÃO DA CIDADE DE SÃO PAULO (%) / EVALUATION OF THE CITY OF SÃO PAULO
emissora de turistas para a cidade paulistana (51,8%) que continua sendo a maior responsável pela vinda de turis-tas domésticos à Cidade de São Paulo. O principal meio de transporte utilizado é o ônibus de linha (41,7%), seguido do avião (23,3%) e do carro (22,2%). Quanto ao meio de hospedagem mais utilizado, 64,1% dos turistas domésti-cos permanecem em casa de amigos e parentes e, aproxi-madamente, 30% utilizam a rede hoteleira em hotéis de diversas categorias: econômica (17,0%), midscale/ luxo (10,5%) e pousada (2,9%), além de outros tipos de aloja-mentos de menor incidência nas respostas.
A maior motivação de realização da principal viagem doméstica concentra-se em visita a amigos e parentes (56,5%) e negócios (22,5%), seguida de outras múltiplas escolhas. O mês de dezembro é o período em que a cida-de mais recebe turistas domésticos (22,8%), seguido por janeiro (13,3%).
Considerando a amostra global de vários segmentos, os gastos dos turistas apontam para valores médios da ordem de R$ 951,25, considerando o número de 1,9 pes-soas na viagem. A maioria dos entrevistados (94,9%) não utiliza pacotes de viagens. Na avaliação da cidade, os itens referentes à hospedagem (34,7%) e restauran-tes e gastronomia (33,5%) recebem as melhores notas. Preços, segurança e limpeza trazem menos satisfação aos turistas.
Cidade de São Paulo / City of São Paulo Outros destinos / Other cities
to the City of São Paulo (51.8%) and continues to be the main region responsible for domestic tourists coming to the City of São Paulo. The main means of transportation used were bus (41.7%), followed by air travel (23.3%) and car (22.2%). In relation to the accommodation facilities most used, 64.1% of the domestic tourists stayed with friends and family, and around 30% used the hotel network of various categories: standard (17.0%), midscale/luxury (10.5%) and inns (2.9%), as well as other types of accommodation which were less significant in the answers given.
The main motivation for the trip, among domestic visitors, was to visit friends and relatives (56.5%) and business (22.5%), followed by a range of other motivation. Decem-ber is the month when the city receives most domestic tourists (22.8%), followed by January (13.3%).
In terms of the overall sample, which includes various segments of tourists, tourist spending was, on average, around R$ 951.25, considering the number of 1.9 of people traveling together. The majority of the researched (94.9%) do not use package tours.
In the tourists’ evaluation of the city, the items accommo- dation (34.7%) and restaurants and gastronomy (33.5%) received the highest scores. Prices, safety and cleanliness received lower scores for tourism satisfaction.
Fonte: FIPE, 2008

w w w . c i d a d e d e s a o p a u l o . c o m16
DEM
ANDA
TUR
ÍSTI
CA /
TOUR
ISM
DEM
AND
CARACTERIZAÇÃO DA DEMANDA TURÍSTICA INTERNACIONALCHARACTERIZATION OF INTERNATIONAL TOURISM DEMAND
Fonte: Fundação Instituto de Pesquisas Econômicas (FIPE), 2008/ São Paulo Turismo, 2008Observações do banco de dados / Extract from database: 2897
1,7 milhões de turistas internacionaisO detalhamento dos resultados específicos sobre a demanda turística internacional da Cidade de São Paulo está baseado na pesquisa “Caracterização e Dimensiona-mento do Turismo Internacional no Brasil” realizada pela Fundação Instituto de Pesquisas Econômicas - FIPE, em 2006, estimando 15% de estrangeiros, em média. Objeti-va destacar dados provenientes da amostragem de 2897 casos em que São Paulo foi o destino principal da viagem comparada a outros destinos brasileiros.
1.7 million international touristsThe specific results for international tourism demand in the City of São Paulo are based on the survey “Caracte-rização e Dimensionamento do Turismo Internacional no Brasil” (Characterization and Size of International Tourism in Brazil), carried out by the Fundação Instituto de Pesquisas Econômicas - FIPE, in 2006, estimating 15% of all foreigners. Its objective is to highlight data from a sample of 2,897 cases in which São Paulo was the main destination of the trip, compared with other Brazilian des-tinations.
RENDA MENSAL (US$) / MONTHLY INCOME
Categoria / Category São Paulo
Familiar / Family 5537.45
Individual / Individual 4583.24
Categoria / Category Outros destinos / Other destination
Familiar / Family 3950.10
Individual / Individual 3037.81
FAIXA ETÁRIA (%) / AGE GROUP
Categoria / Category
De 18 a 24 anos / 18 to 24 years old 5,9
De 25 a 29 anos / 25 to 29 years old 20,3
De 30 a 39 anos / 30 to 39 years old 29,6
De 40 a 49 anos / 40 to 49 years old 26,1
De 50 a 59 anos / 50 to 59 years old 11,9
Mais de 60 anos / Older than 60 years 6,2
GÊNERO / GENDER
PERMANÊNCIA MÉDIA / AVERAGE STAY
8,5 noites / noites
77,4%
22,6%
PERMANÊNCIA MÉDIA (%) / AVERAGE STAY (%)
Pernoites / Nights
São Paulo Outros destinos / Other destination
1 7,2 3,2
2 to 5 / 2 oto 5 46,1 27,1
6 to 10 / 6 to 10 22,7 30,3
11 a 30 / 11 to 30 18,4 30,8
31 ou mais / 31 or more 5,7 8,7
Brasil / Brazil 13,6 19,2
São Paulo principal destino / Main destination
11,1 15,7
São Paulo destino secundário / Secondary destination
8,5 10,1
GASTO MÉDIO (US$) / AVERAGE SPENDING
São Paulo principal destino / Main destination
São Paulo Outros destinos/Other destination
Per capita / Per capita 957.37 856.59
Per capita diário/ Daily spents 86.25 54.56
MEIO DE ACESSO À CIDADE DE SÃO PAULO / MEANS OF ACCESS TO THE CITY OF SÃO PAULO
96,1% aéreo / airplane
Masculino / Male Feminino / Female
Fonte: FIPE, 2008
Fonte: FIPE, 2008 Fonte: FIPE, 2008
Fonte: FIPE, 2008
Fonte: FIPE, 2008
Fonte: FIPE, 2008Fonte: FIPE, 2008
w w w . c i d a d e d e s a o p a u l o . c o m 17
DEM
ANDA
TUR
ÍSTI
CA /
TOUR
ISM
DEM
AND
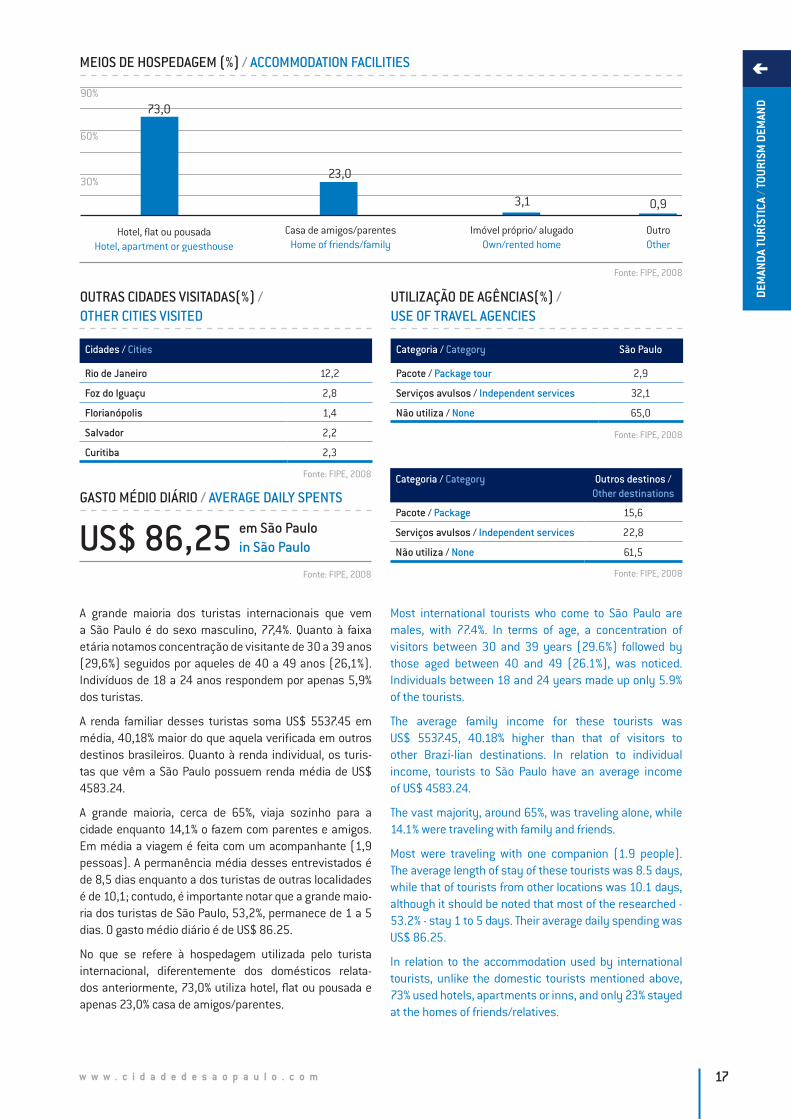
MEIOS DE HOSPEDAGEM (%) / ACCOMMODATION FACILITIES
Casa de amigos/parentesHome of friends/family
Hotel, flat ou pousadaHotel, apartment or guesthouse
Imóvel próprio/ alugadoOwn/rented home
OutroOther
73,0
3,1
90%
60%
30%23,0
0,9
A grande maioria dos turistas internacionais que vem a São Paulo é do sexo masculino, 77,4%. Quanto à faixa etária notamos concentração de visitante de 30 a 39 anos (29,6%) seguidos por aqueles de 40 a 49 anos (26,1%). Indivíduos de 18 a 24 anos respondem por apenas 5,9% dos turistas.
A renda familiar desses turistas soma US$ 5537.45 em média, 40,18% maior do que aquela verificada em outros destinos brasileiros. Quanto à renda individual, os turis-tas que vêm a São Paulo possuem renda média de US$ 4583.24.
A grande maioria, cerca de 65%, viaja sozinho para a cidade enquanto 14,1% o fazem com parentes e amigos. Em média a viagem é feita com um acompanhante (1,9 pessoas). A permanência média desses entrevistados é de 8,5 dias enquanto a dos turistas de outras localidades é de 10,1; contudo, é importante notar que a grande maio-ria dos turistas de São Paulo, 53,2%, permanece de 1 a 5 dias. O gasto médio diário é de US$ 86.25.
No que se refere à hospedagem utilizada pelo turista internacional, diferentemente dos domésticos relata-dos anteriormente, 73,0% utiliza hotel, flat ou pousada e apenas 23,0% casa de amigos/parentes.
Most international tourists who come to São Paulo are males, with 77.4%. In terms of age, a concentration of visitors between 30 and 39 years (29.6%) followed by those aged between 40 and 49 (26.1%), was noticed. Individuals between 18 and 24 years made up only 5.9% of the tourists.
The average family income for these tourists was US$ 5537.45, 40.18% higher than that of visitors to other Brazi-lian destinations. In relation to individual income, tourists to São Paulo have an average income of US$ 4583.24.
The vast majority, around 65%, was traveling alone, while 14.1% were traveling with family and friends.
Most were traveling with one companion (1.9 people). The average length of stay of these tourists was 8.5 days, while that of tourists from other locations was 10.1 days, although it should be noted that most of the researched - 53.2% - stay 1 to 5 days. Their average daily spending was US$ 86.25.
In relation to the accommodation used by international tourists, unlike the domestic tourists mentioned above, 73% used hotels, apartments or inns, and only 23% stayed at the homes of friends/relatives.
OUTRAS CIDADES VISITADAS(%) / OTHER CITIES VISITED
UTILIZAÇÃO DE AGÊNCIAS(%) / USE OF TRAVEL AGENCIES
Cidades / Cities
Rio de Janeiro 12,2
Foz do Iguaçu 2,8
Florianópolis 1,4
Salvador 2,2
Curitiba 2,3
Categoria / Category São Paulo
Pacote / Package tour 2,9
Serviços avulsos / Independent services 32,1
Não utiliza / None 65,0
Categoria / Category Outros destinos / Other destinations
Pacote / Package 15,6
Serviços avulsos / Independent services 22,8
Não utiliza / None 61,5
GASTO MÉDIO DIÁRIO / AVERAGE DAILY SPENTS
US$ 86,25 em São Pauloin São Paulo
Fonte: FIPE, 2008
Fonte: FIPE, 2008
Fonte: FIPE, 2008
Fonte: FIPE, 2008
Fonte: FIPE, 2008
w w w . c i d a d e d e s a o p a u l o . c o m18
DEM
ANDA
TUR
ÍSTI
CA /
TOUR
ISM
DEM
AND
CategoriaCategory
Muito bomVery good
BomGood
RuimPoor
Muito RuimVery Bad
PositivasPositive
NegativasNegative
1 2 3 4 1 + 2 3 + 4
Limpeza/ Cleanliness
7,6 58,9 27,7 5,8 66,5 33,5
22,4 58,5 16,1 3,0 80,9 19,1
Segurança pública / Public safety
5,1 56,6 27,8 10,5 61,7 38,3
18,8 61,0 15,8 4,4 83,6 16,4
Serviço de táxi / Taxi service
21,0 72,5 5,1 1,4 93,5 6,5
21,2 67,5 9,0 2,3 88,7 11,3
Transporte público / Public transportation
20,7 59,7 14,8 4,8 80,4 19,6
21,9 61,7 12,0 4,4 83,6 16,4
Telefonia e internet / Telephone and internet
15,9 64,9 15,6 3,7 80,8 19,2
15,6 62,6 16,6 5,2 78,2 21,8
Sinalização / Signs
7,9 58,8 27,2 6,2 66,7 33,4
14,7 61,2 18,8 5,2 75,9 24,1
Aeroporto / Airport
14,3 72,6 1,4 11,6 86,9 13,0
17,7 68,0 11,7 2,7 85,7 14,4
Rodovias / Highways
9,1 53,5 31,1 6,3 62,6 37,4
11,1 53,5 26,2 9,3 64,6 35,5
Restaurantes / Restaurants
47,2 50,9 1,7 0,3 98,1 1,9
31,4 62,9 5,2 0,6 94,3 5,7
Alojamento / Accommodation
42,4 55,2 2,1 0,3 97,6 2,4
37,7 57,0 4,8 0,5 94,7 5,3
Diversão Noturna / Nightlife
41,5 55,3 2,8 0,4 96,8 3,2
33,4 55,4 9,2 2,0 88,8 11,2
Guias de turismo / Tourism guides
22,1 64,3 9,9 3,6 86,4 13,5
32,5 58,1 7,7 1,7 90,6 9,4
Informações turísticas / Tourist information
16,2 66,9 14,2 2,7 83,1 16,9
22,5 63,2 11,9 2,4 85,7 14,3
Hospitalidade do povo / Hospitality of the people
62,7 36,0 1,1 0,2 98,7 1,3
62,0 35,9 1,8 0,3 97,9 2,1
Gastronomia / Gastronomy
54,3 43,8 1,6 0,4 98,1 1,9
43,6 50,7 5,2 0,5 94,3 5,7
Preços / Prices
15,3 57,3 23,0 4,4 72,6 27,4
13,9 53,5 26,3 6,4 67,4 32,7
AVALIAÇÃO DA CIDADE DE SÃO PAULO (%) / EVALUATION OF THE CITY OF SÃO PAULO
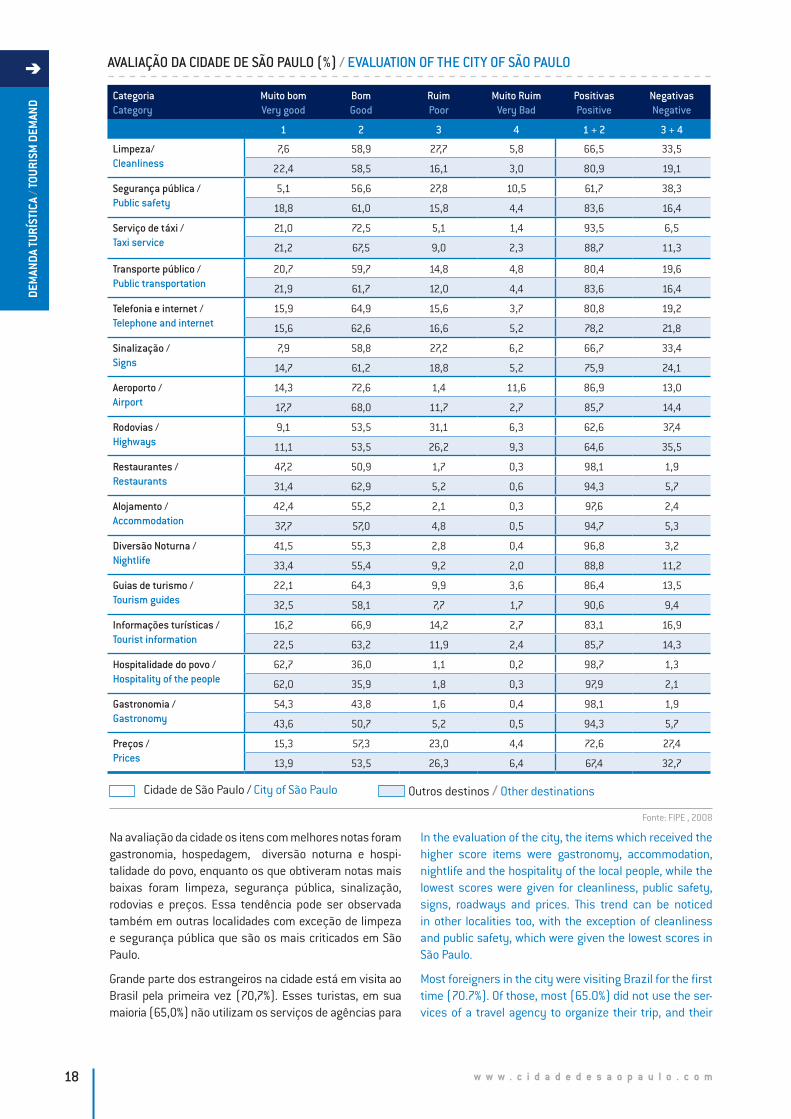
In the evaluation of the city, the items which received the higher score items were gastronomy, accommodation, nightlife and the hospitality of the local people, while the lowest scores were given for cleanliness, public safety, signs, roadways and prices. This trend can be noticed in other localities too, with the exception of cleanliness and public safety, which were given the lowest scores in São Paulo.
Most foreigners in the city were visiting Brazil for the first time (70.7%). Of those, most (65.0%) did not use the ser-vices of a travel agency to organize their trip, and their
Na avaliação da cidade os itens com melhores notas foram gastronomia, hospedagem, diversão noturna e hospi-talidade do povo, enquanto os que obtiveram notas mais baixas foram limpeza, segurança pública, sinalização, rodovias e preços. Essa tendência pode ser observada também em outras localidades com exceção de limpeza e segurança pública que são os mais criticados em São Paulo.
Grande parte dos estrangeiros na cidade está em visita ao Brasil pela primeira vez (70,7%). Esses turistas, em sua maioria (65,0%) não utilizam os serviços de agências para
Cidade de São Paulo / City of São Paulo Outros destinos / Other destinations
Fonte: FIPE , 2008
w w w . c i d a d e d e s a o p a u l o . c o m 19
DEM
ANDA
TUR
ÍSTI
CA /
TOUR
ISM
DEM
AND
MAIORES EMISSORES DE ESTRANGEIROS / MAIN COUNTRIES OF ORIGIN OF FOREIGN VISITORS
10. México
8. Inglaterra
5. Chile
2. Argentina
1. Estados Unidos
6. Itália
3. Alemanha
5. Portugal
7. Espanha
4. França
MOTIVO DA VIAGEM (%) / TRAVEL MOTIVATION
MOTIVAÇÕES LIGADAS AO LAZER (%) / MOTIVATIONS RELATED TO LEISURE
Categoria / Category
São Paulo Outros Destinos/Other destination
Negócios ou trabalho / Business or work 57,2 17,6
Visitar amigos ou parentes / To visit friends or family 20,7 25,6
Lazer / Leisure 13,6 50,3
Congressos,feiras e convenções / Congresses, fairs and conventions 4,4 3,2
Outros / Other 3,1 3,4
Categoria / Category
São Paulo Outros Destinos/Other destination
Cultura / Culture 36,3 14,8
Lazer, sol e praia / Sun, sea and sand 28,2 57,4
Natureza ou ecoturismo / Nature or ecotourism 18,4 19,6
Esportes / Sports 9,8 2,7
Diversão Noturna / Nightlife 3,6 1,3
Viagem de incentivo / Incentive trip 0,9 1,2
Outros / Other 2,8 2,9
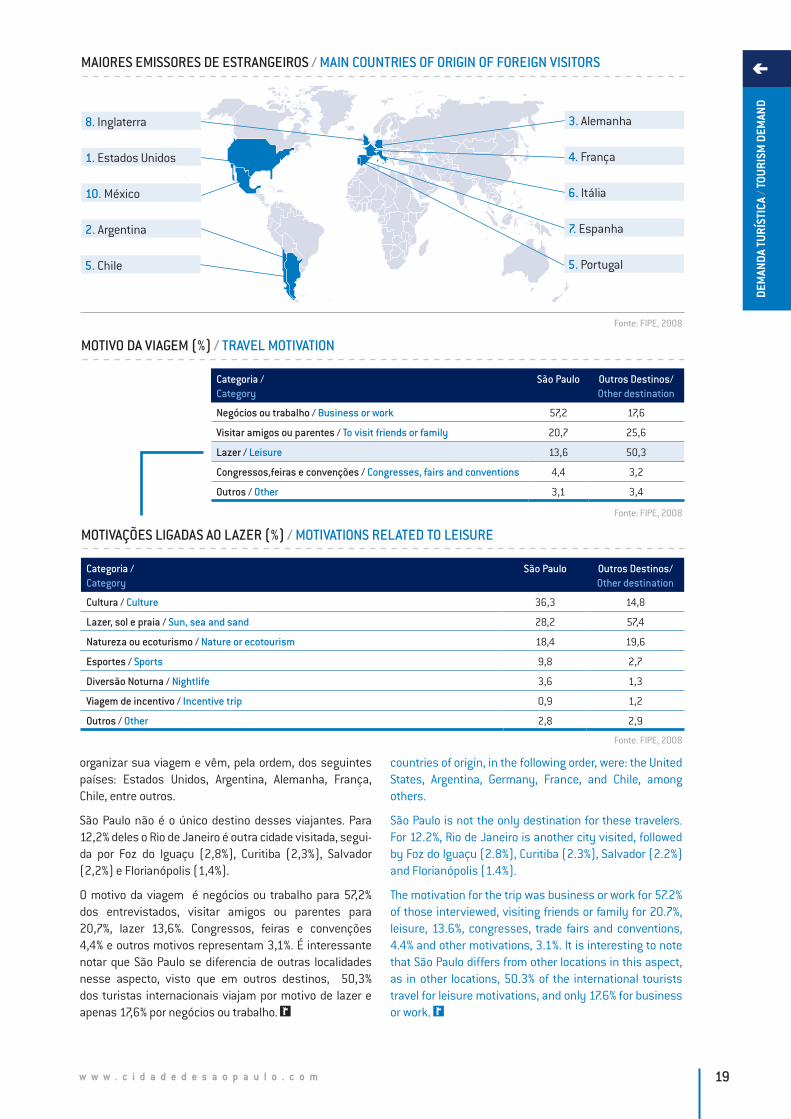
organizar sua viagem e vêm, pela ordem, dos seguintes países: Estados Unidos, Argentina, Alemanha, França, Chile, entre outros.
São Paulo não é o único destino desses viajantes. Para 12,2% deles o Rio de Janeiro é outra cidade visitada, segui-da por Foz do Iguaçu (2,8%), Curitiba (2,3%), Salvador (2,2%) e Florianópolis (1,4%).
O motivo da viagem é negócios ou trabalho para 57,2% dos entrevistados, visitar amigos ou parentes para 20,7%, lazer 13,6%. Congressos, feiras e convenções 4,4% e outros motivos representam 3,1%. É interessante notar que São Paulo se diferencia de outras localidades nesse aspecto, visto que em outros destinos, 50,3% dos turistas internacionais viajam por motivo de lazer e apenas 17,6% por negócios ou trabalho.
countries of origin, in the following order, were: the United States, Argentina, Germany, France, and Chile, among others.
São Paulo is not the only destination for these travelers. For 12.2%, Rio de Janeiro is another city visited, followed by Foz do Iguaçu (2.8%), Curitiba (2.3%), Salvador (2.2%) and Florianópolis (1.4%).
The motivation for the trip was business or work for 57.2% of those interviewed, visiting friends or family for 20.7%, leisure, 13.6%, congresses, trade fairs and conventions, 4.4% and other motivations, 3.1%. It is interesting to note that São Paulo differs from other locations in this aspect, as in other locations, 50.3% of the international tourists travel for leisure motivations, and only 17.6% for business or work.
Fonte: FIPE, 2008
Fonte: FIPE, 2008
Fonte: FIPE, 2008
w w w . c i d a d e d e s a o p a u l o . c o m20
CONSIDERED WITH REGARD TO THE EVOLUTION OF KEY INDICATORS OF THE SÃO PAULO HOTEL INDUSTRY (OCCUPANCY RATE, AVERAGE DAILY RATES, REVENUE PER AVAILABLE ROOM); MOVEMENT OF PASSENGERS AND AIRCRAFT AT THE CONGONHAS AND GUARULHOS AIRPORTS; MOVEMENT OF PASSENGERS AND VEHICLES AT THE TIETÊ, BARRA FUNDA AND JABAQUARA BUS TERMINALS; AND THE VOLUME OF SERVICE TAXES (ISS) PAID IN BY “GRUPO 13” COMPANIES, WHICH INCLUDE THE ACTIVITIES OF TOURISM, LODGING, EVENTS, AND THE LIKE. CONTAINING ALSO INFORMATION ON THE EVENTS THAT OCCUR ANNUALLY FROM 2005 TO 2008, THE CHAPTER PROVIDES A CONJUNCTURAL SCENARIO OF SOME OF THE MOST SIGNIFICANT FACTORS OF THE TOURISM SECTOR IN THE CITY OF SÃO PAULO.
ASPECTOS CONJUNTURAIS DO TURISMO PAULISTANOCONJUNCTURAL ASPECTS OF TOURISM IN SÃO PAULO
II/
CONSIDERADO PELA EVOLUÇÃO DOS PRINCIPAIS INDICA-DORES DA HOTELARIA PAULISTANA (TAXA DE OCUPAÇÃO, DIÁRIA MÉDIA, REVENUE PER AVAILABLE ROOM); DOS FLUXOS DE PASSAGEIROS E AERONAVES NOS AEROPORTOS DE CONGONHAS E GUARULHOS; DOS TERMINAIS RODOVIÁ-RIOS DE TIETÊ, BARRA FUNDA E JABAQUARA; E, DO VOLUME DO ISS ARRECADADO PELO GRUPO 13 COMPREENDIDO PELAS ATIVIDADES DE TURISMO, HOSPEDAGEM, EVENTOS E ASSEMELHADOS. TAMBÉM COM INFORMAÇÕES SOBRE OS EVENTOS QUE OCORREM ANUALMENTE, DE 2005 A 2008, O CAPÍTULO OFERECE UM CENÁRIO CONJUNTURAL DE ALGUNS DOS FATORES MAIS SIGNIFICATIVOS DO SETOR TURÍS-TICO DA CIDADE DE SÃO PAULO.
CAPÍTULO / CHAPTER
w w w . c i d a d e d e s a o p a u l o . c o m 21
ASPE
CTOS
CON
JUNT
URAI
S / C
ONJU
NCTU
RAL
ASPE
CTS
HOTELARIAHOTEL INDUSTRY
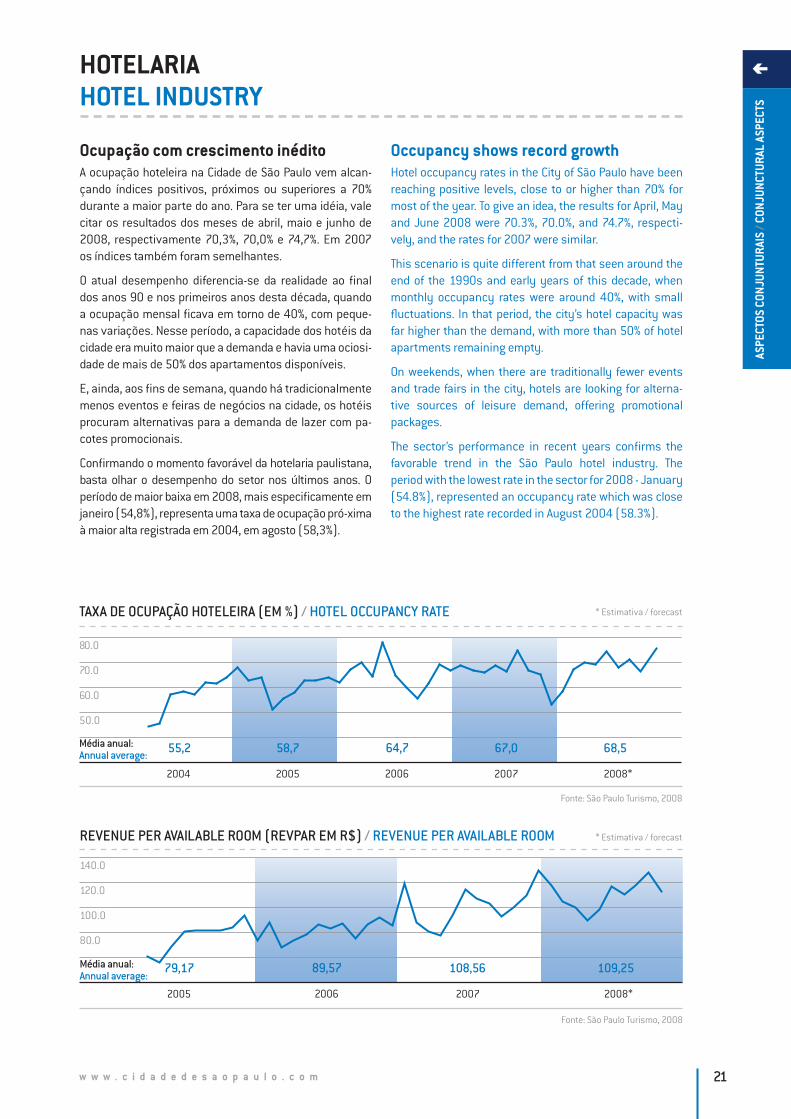
Ocupação com crescimento inéditoA ocupação hoteleira na Cidade de São Paulo vem alcan-çando índices positivos, próximos ou superiores a 70% durante a maior parte do ano. Para se ter uma idéia, vale citar os resultados dos meses de abril, maio e junho de 2008, respectivamente 70,3%, 70,0% e 74,7%. Em 2007 os índices também foram semelhantes.
O atual desempenho diferencia-se da realidade ao final dos anos 90 e nos primeiros anos desta década, quando a ocupação mensal ficava em torno de 40%, com peque-nas variações. Nesse período, a capacidade dos hotéis da cidade era muito maior que a demanda e havia uma ociosi-dade de mais de 50% dos apartamentos disponíveis.
E, ainda, aos fins de semana, quando há tradicionalmente menos eventos e feiras de negócios na cidade, os hotéis procuram alternativas para a demanda de lazer com pa-cotes promocionais.
Confirmando o momento favorável da hotelaria paulistana, basta olhar o desempenho do setor nos últimos anos. O período de maior baixa em 2008, mais especificamente em janeiro (54,8%), representa uma taxa de ocupação pró-xima à maior alta registrada em 2004, em agosto (58,3%).
Occupancy shows record growthHotel occupancy rates in the City of São Paulo have been reaching positive levels, close to or higher than 70% for most of the year. To give an idea, the results for April, May and June 2008 were 70.3%, 70.0%, and 74.7%, respecti-vely, and the rates for 2007 were similar.
This scenario is quite different from that seen around the end of the 1990s and early years of this decade, when monthly occupancy rates were around 40%, with small fluctuations. In that period, the city’s hotel capacity was far higher than the demand, with more than 50% of hotel apartments remaining empty.
On weekends, when there are traditionally fewer events and trade fairs in the city, hotels are looking for alterna-tive sources of leisure demand, offering promotional packages.
The sector’s performance in recent years confirms the favorable trend in the São Paulo hotel industry. The period with the lowest rate in the sector for 2008 - January (54.8%), represented an occupancy rate which was close to the highest rate recorded in August 2004 (58.3%).
2005
100.0
120.0
140.0
80.0
2006 2008*2007
79,17 89,57 109,25108,56Média anual:Annual average:
REVENUE PER AVAILABLE ROOM (REVPAR EM R$) / REVENUE PER AVAILABLE ROOM
Fonte: São Paulo Turismo, 2008
2004 2005
60.0
70.0
80.0
50.0
2006 2008*2007
55,2 58,7Média anual:Annual average: 64,7 68,567,058,7
TAXA DE OCUPAÇÃO HOTELEIRA (EM %) / HOTEL OCCUPANCY RATE
Fonte: São Paulo Turismo, 2008
* Estimativa / forecast
* Estimativa / forecast
w w w . c i d a d e d e s a o p a u l o . c o m22
ASPE
CTOS
CON
JUNT
URAI
S / C
ONJU
NCTU
RAL
ASPE
CTS
AnoYear
ZonaZone
DadoData
JanJan
FevFeb
MarMar
AbrApr
MaiMay
JunJun
JulJul
AgoAug
SetSep
OutOct
NovNov
DecDec
ZSTO 43,2 45,0 57,2 58,6 60,5 63,8 62,0 64,3 70,0 64,9 64,2 52,4
DM 147,7 147,3 142,3 161,0 163,6 157,0 158,4 143,5 150,3 135,5 154,4 148,6
ZNTO 25,9 29,1 53,5 59,5 59,7 61,3 46,6 63,5 60,3 48,3 42,0 42,5
DM 150,8 119,1 116,8 111,0 99,4 106,1 136,6 115,0 133,3 108,0 98,7 97,2
ZLTO 45,8 56,6 57,2 56,1 53,7 52,6 57,1 58,4 58,8 57,5 58,0 49,1
DM 102,3 106,3 101,0 102,3 101,4 107,9 109,5 102,9 112,8 105,1 115,0 107,9
CETO 52,3 49,3 57,1 58,3 56,4 58,0 68,6 60,8 66,1 61,1 67,1 50,3
DM 83,4 88,3 101,6 94,9 102,7 95,5 77,6 121,3 109,0 87,3 92,5 84,9
ZOTO 47,9 58,5 70,5 73,0 69,0 70,0 67,1 73,9 78,4 67,8 75,9 63,9
DM 219,1 153,2 153,3 162,4 164,8 144,1 145,4 159,8 101,2 149,9 147,0 154,6
ZSTO 42,2 43,1 55,7 59,0 61,1 60,4 62,1 65,9 71,3 62,4 65,8 53,4
DM 150,4 145,4 145,0 158,3 161,6 159,7 157,7 140,3 155,7 133,3 155,9 145,0
ZNTO 24,4 29,1 54,6 61,4 56,8 60,4 44,5 67,8 60,2 49,7 39,4 43,3
DM 149,3 120,4 117,2 111,1 97,5 106,9 137,5 115,5 133,3 104,2 99,1 99,2
ZLTO 47,7 59,0 59,7 55,1 55,5 57,4 59,7 60,5 55,7 56,7 59,7 50,8
DM 100,4 108,0 98,6 104,4 100,5 105,7 107,5 101,7 114,4 103,9 116,0 106,5
CETO 54,3 51,0 56,7 57,4 55,7 59,3 70,4 61,3 67,9 62,3 68,4 51,3
DM 84,2 89,8 102,3 96,5 104,3 97,5 77,5 122,3 106,5 90,6 90,4 86,2
ZOTO 50,9 60,0 71,2 70,6 69,8 76,7 69,0 75,8 80,9 70,6 73,5 65,7
DM 215,4 154,6 153,5 162,4 166,0 143,2 146,7 155,5 160,8 102,3 152,5 150,6
ZSTO 56,3 55,9 72,2 67,9 69,4 68,4 67,0 66,8 68,0 73,8 68,4 64,6
DM 154,3 161,7 181,3 179,6 168,5 159,5 169,3 166,0 166,7 188,4 176,1 176,7
ZNTO 52,5 44,5 48,3 55,3 60,2 64,7 63,0 64,6 68,7 54,0 57,1 57,9
DM 129,7 123,5 144,1 150,6 137,5 123,0 153,1 156,0 124,5 137,8 112,8 123,3
ZLTO 66,6 53,5 70,4 62,3 71,6 63,0 62,0 60,1 65,6 63,3 64,7 56,0
DM 123,4 126,9 123,4 156,5 126,8 130,3 131,6 129,5 130,6 139,0 129,5 133,1
CETO 57,0 81,0 64,0 66,1 68,1 62,1 63,0 64,0 57,8 68,3 65,6 60,7
DM 119,7 120,2 105,5 109,7 109,0 105,0 107,6 105,5 110,8 120,3 118,8 106,3
ZOTO 56,3 62,4 78,7 71,7 77,8 72,8 71,2 70,6 73,8 74,8 78,1 59,0
DM 186,8 136,7 225,6 140,6 132,7 148,2 203,1 167,0 141,0 148,1 142,6 141,4
ZSTO 55,4 59,9 68,1 71,5 71,3 75,7 68,1 72,8 80,4 81,8* 83,2* 84,3*
DM 177,6 182,1 167,8 174,4 184,7 185,5 181,1 182,4 194,2 197,6* 201,1* 204,1*
ZNTO 50,9 41,5 35,6 58,0 67,9 59,5 76,8 63,6 60,9 62,3* 63,9* 65,4*
DM 160,0 153,1 189,9 150,9 143,8 181,2 174,1 123,0 134,6 139,1* 145,4* 151,2*
ZLTO 56,7 54,1 67,4 72,3 64,0 74,5 59,7 82,9 76,4 75,4* 74,5* 73,6*
DM 138,1 140,3 141,7 140,0 142,4 140,2 131,7 115,7 135,6 137,2* 138,1* 140,1*
CETO 51,0 57,5 67,8 64,7 66,3 67,5 64,5 78,8 58,2 59,9* 61,8* 63,8*
DM 114,4 138,7 126,0 130,2 128,8 139,2 162,6 185,6 149,1 152,1* 151,1* 159,7*
ZOTO 55,9 70,1 76,1 73,7 68,9 78,7 64,5 61,3 76,4 74,4* 72,5* 70,6*
DM 190,6 165,7 189,8 179,6 198,0 175,5 140,5 134,5 186,8 188,1* 181,1* 190,1*
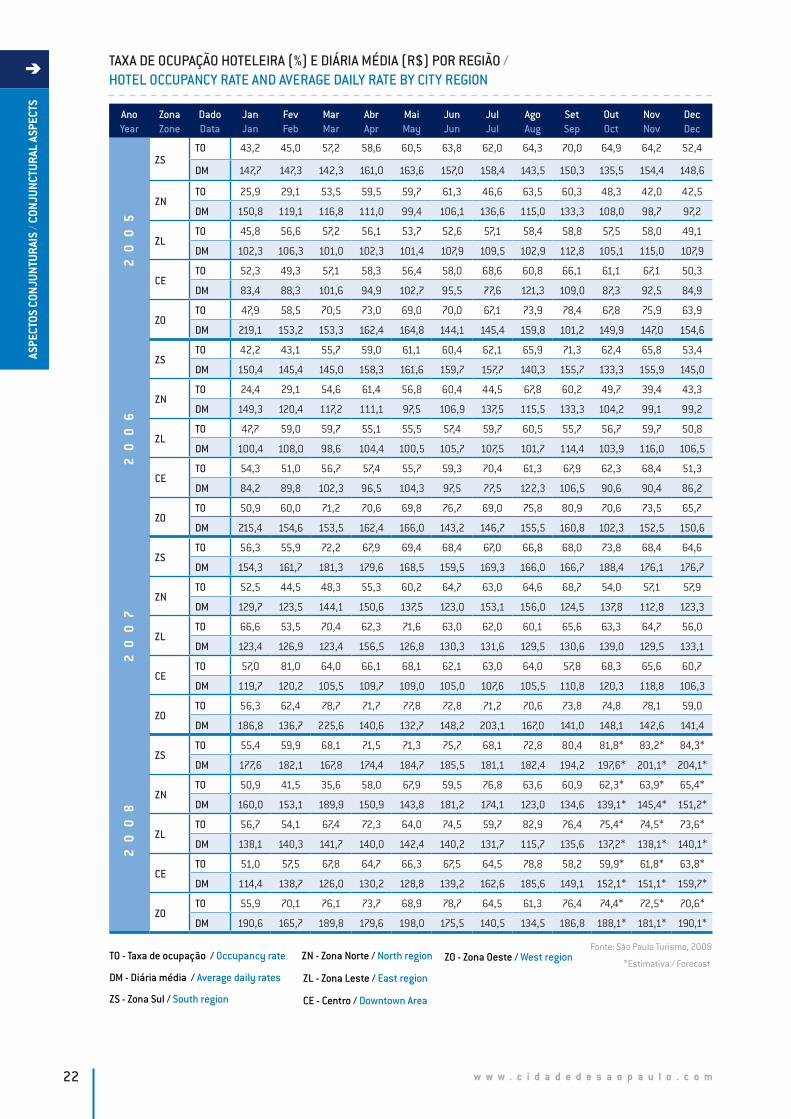
TAXA DE OCUPAÇÃO HOTELEIRA (%) E DIÁRIA MÉDIA (R$) POR REGIÃO / HOTEL OCCUPANCY RATE AND AVERAGE DAILY RATE BY CITY REGION
20
08
20
07
20
06
20
05
Fonte: São Paulo Turismo, 2008
*Estimativa / ForecastTO - Taxa de ocupação / Occupancy rate
ZS - Zona Sul / South region
ZN - Zona Norte / North region
ZL - Zona Leste / East region
CE - Centro / Downtown Area
ZO - Zona Oeste / West region
DM - Diária média / Average daily rates
w w w . c i d a d e d e s a o p a u l o . c o m 23
ASPE
CTOS
CON
JUNT
URAI
S / C
ONJU
NCTU
RAL
ASPE
CTS
HOTELARIA – UNIDADES HABITACIONAIS / ACCOMMODATION UNITS
CONCENTRAÇÃO DOS MEIOS DE HOSPEDAGEM / CONCENTRATION OF ACCOMMODATION FACILITIES
35
4
3
5
19
2
7
6
8
17
10
12
22
36
39
30
24
1615
31
32
13
19 14
23
11
20
18
2838
33
34
25
27
29
21
37 26
1 - Morumbi2 - Vila Andrade3 - Jardim São Luís4 - Jardim Ângela5 - Jabaquara6 - Campo Belo7 - Saúde8 - Vila Mariana9 - Ipiranga10 - Mooca11 - Vila Guilherme12 - Santana13 - Tatuapé
14 - Vila Formosa15 - São Lucas16 - Itaim Bibi17 - Santo Amaro18 - Jardim Paulista19 - Pinheiros20 - Perdizes21 - Bela Vista22 - Butantã23 - Alto de Pinheiros24 - Lapa25 - Liberdade26 - Sé
27 - Pari28 - Barra Funda29 - Brás30 - Freguesia do Ó31 - Tucuruvi32 - Moema33 - Consolação34 - Santa Cecília35 - Grajaú36 - C. Grande37 - República38 - Bom Retiro39 - Vila Maria
4 - 55
56 - 158
235 - 575
576 - 956
957 - 1576
1577 - 4264
4265 - 8134159 - 234
Meios de hospedagemAccommodation facilities
UNIDADES HABITACIONAIS POR DISTRITO / ACCOMODATION UNITS BY DISTRICT
Fonte: São Paulo Turismo, 2008
w w w . c i d a d e d e s a o p a u l o . c o m24
ASPE
CTOS
CON
JUNT
URAI
S / C
ONJU
NCTU
RAL
ASPE
CTS
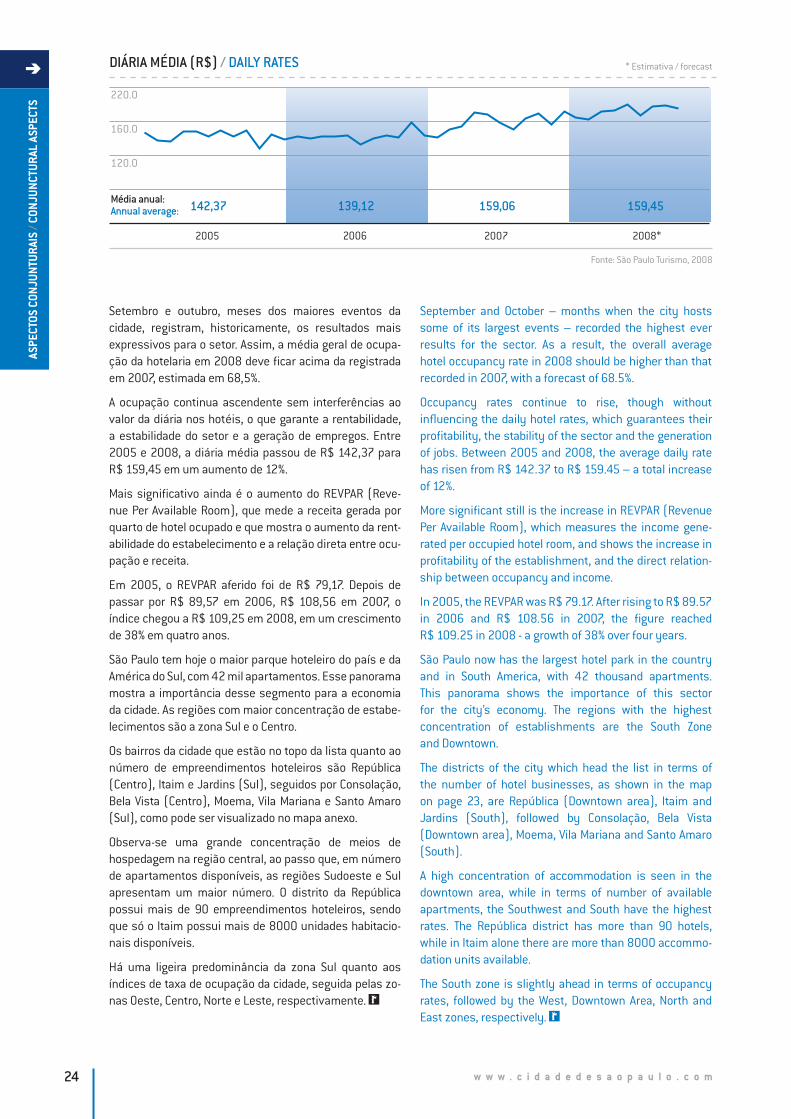
Setembro e outubro, meses dos maiores eventos da cidade, registram, historicamente, os resultados mais expressivos para o setor. Assim, a média geral de ocupa-ção da hotelaria em 2008 deve ficar acima da registrada em 2007, estimada em 68,5%.
A ocupação continua ascendente sem interferências ao valor da diária nos hotéis, o que garante a rentabilidade, a estabilidade do setor e a geração de empregos. Entre 2005 e 2008, a diária média passou de R$ 142,37 para R$ 159,45 em um aumento de 12%.
Mais significativo ainda é o aumento do REVPAR (Reve-nue Per Available Room), que mede a receita gerada por quarto de hotel ocupado e que mostra o aumento da rent-abilidade do estabelecimento e a relação direta entre ocu-pação e receita.
Em 2005, o REVPAR aferido foi de R$ 79,17. Depois de passar por R$ 89,57 em 2006, R$ 108,56 em 2007, o índice chegou a R$ 109,25 em 2008, em um crescimento de 38% em quatro anos.
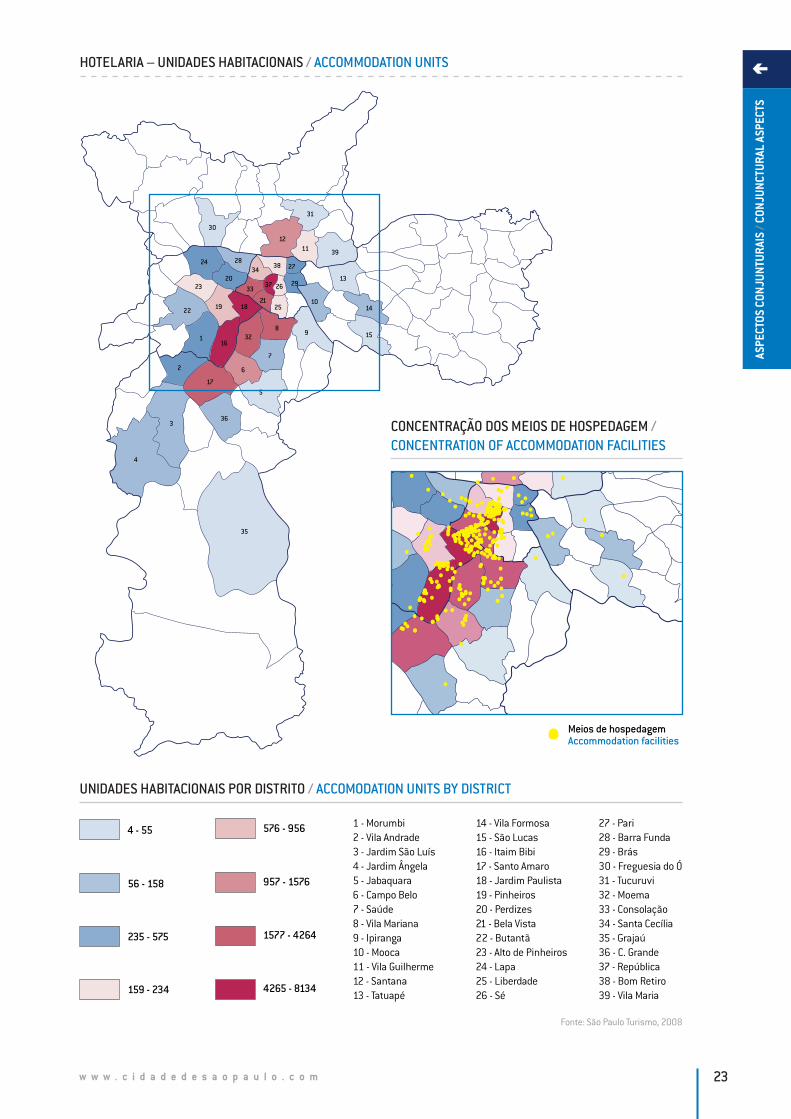
São Paulo tem hoje o maior parque hoteleiro do país e da América do Sul, com 42 mil apartamentos. Esse panorama mostra a importância desse segmento para a economia da cidade. As regiões com maior concentração de estabe-lecimentos são a zona Sul e o Centro.
Os bairros da cidade que estão no topo da lista quanto ao número de empreendimentos hoteleiros são República (Centro), Itaim e Jardins (Sul), seguidos por Consolação, Bela Vista (Centro), Moema, Vila Mariana e Santo Amaro (Sul), como pode ser visualizado no mapa anexo.
Observa-se uma grande concentração de meios de hospedagem na região central, ao passo que, em número de apartamentos disponíveis, as regiões Sudoeste e Sul apresentam um maior número. O distrito da República possui mais de 90 empreendimentos hoteleiros, sendo que só o Itaim possui mais de 8000 unidades habitacio-nais disponíveis.
Há uma ligeira predominância da zona Sul quanto aos índices de taxa de ocupação da cidade, seguida pelas zo-nas Oeste, Centro, Norte e Leste, respectivamente.
September and October – months when the city hosts some of its largest events – recorded the highest ever results for the sector. As a result, the overall average hotel occupancy rate in 2008 should be higher than that recorded in 2007, with a forecast of 68.5%.
Occupancy rates continue to rise, though without influencing the daily hotel rates, which guarantees their profitability, the stability of the sector and the generation of jobs. Between 2005 and 2008, the average daily rate has risen from R$ 142.37 to R$ 159.45 – a total increase of 12%.
More significant still is the increase in REVPAR (Revenue Per Available Room), which measures the income gene-rated per occupied hotel room, and shows the increase in profitability of the establishment, and the direct relation-ship between occupancy and income.
In 2005, the REVPAR was R$ 79.17. After rising to R$ 89.57 in 2006 and R$ 108.56 in 2007, the figure reached R$ 109.25 in 2008 - a growth of 38% over four years.
São Paulo now has the largest hotel park in the country and in South America, with 42 thousand apartments. This panorama shows the importance of this sector for the city’s economy. The regions with the highest concentration of establishments are the South Zone and Downtown.
The districts of the city which head the list in terms of the number of hotel businesses, as shown in the map on page 23, are República (Downtown area), Itaim and Jardins (South), followed by Consolação, Bela Vista (Downtown area), Moema, Vila Mariana and Santo Amaro (South).
A high concentration of accommodation is seen in the downtown area, while in terms of number of available apartments, the Southwest and South have the highest rates. The República district has more than 90 hotels, while in Itaim alone there are more than 8000 accommo-dation units available.
The South zone is slightly ahead in terms of occupancy rates, followed by the West, Downtown Area, North and East zones, respectively.
160.0
220.0
120.0
2005 2006 2008*2007
142,37 139,12 159,45159,06Média anual:Annual average:
DIÁRIA MÉDIA (R$) / DAILY RATES
Fonte: São Paulo Turismo, 2008
* Estimativa / forecast
w w w . c i d a d e d e s a o p a u l o . c o m 25
ASPE
CTOS
CON
JUNT
URAI
S / C
ONJU
NCTU
RAL
ASPE
CTS
FLUXO AÉREOAIR TRAFFIC
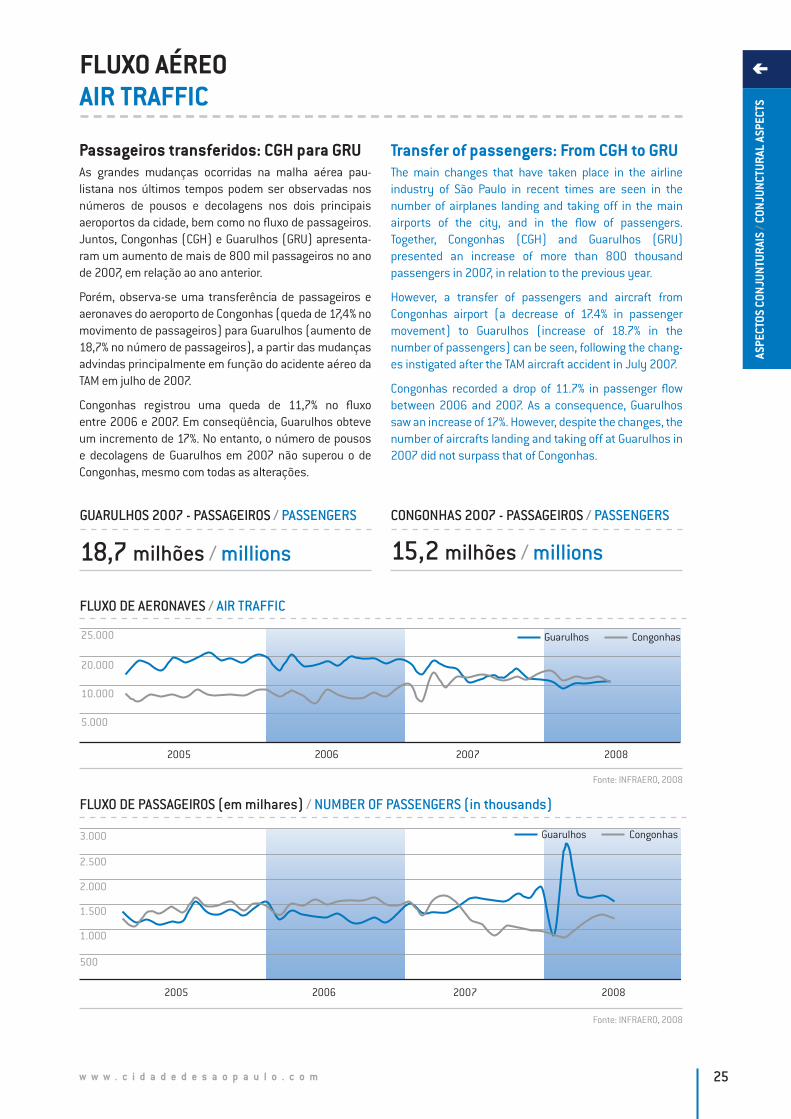
Passageiros transferidos: CGH para GRUAs grandes mudanças ocorridas na malha aérea pau-listana nos últimos tempos podem ser observadas nos números de pousos e decolagens nos dois principais aeroportos da cidade, bem como no fluxo de passageiros. Juntos, Congonhas (CGH) e Guarulhos (GRU) apresenta-ram um aumento de mais de 800 mil passageiros no ano de 2007, em relação ao ano anterior.
Porém, observa-se uma transferência de passageiros e aeronaves do aeroporto de Congonhas (queda de 17,4% no movimento de passageiros) para Guarulhos (aumento de 18,7% no número de passageiros), a partir das mudanças advindas principalmente em função do acidente aéreo da TAM em julho de 2007.
Congonhas registrou uma queda de 11,7% no fluxo entre 2006 e 2007. Em conseqüência, Guarulhos obteve um incremento de 17%. No entanto, o número de pousos e decolagens de Guarulhos em 2007 não superou o de Congonhas, mesmo com todas as alterações.
Transfer of passengers: From CGH to GRUThe main changes that have taken place in the airline industry of São Paulo in recent times are seen in the number of airplanes landing and taking off in the main airports of the city, and in the flow of passengers. Together, Congonhas (CGH) and Guarulhos (GRU) presented an increase of more than 800 thousand passengers in 2007, in relation to the previous year.
However, a transfer of passengers and aircraft from Congonhas airport (a decrease of 17.4% in passenger movement) to Guarulhos (increase of 18.7% in the number of passengers) can be seen, following the chang-es instigated after the TAM aircraft accident in July 2007.
Congonhas recorded a drop of 11.7% in passenger flow between 2006 and 2007. As a consequence, Guarulhos saw an increase of 17%. However, despite the changes, the number of aircrafts landing and taking off at Guarulhos in 2007 did not surpass that of Congonhas.
FLUXO DE AERONAVES / AIR TRAFFIC
25.000
10.000
5.000
20.000
2005 2006 20082007
CongonhasGuarulhos
Fonte: INFRAERO, 2008
FLUXO DE PASSAGEIROS (em milhares) / NUMBER OF PASSENGERS (in thousands)
1.500
1.000
500
2.000
2.500
3.000
2005 2006 20082007
CongonhasGuarulhos
Fonte: INFRAERO, 2008
GUARULHOS 2007 - PASSAGEIROS / PASSENGERS
18,7 milhões / millions
CONGONHAS 2007 - PASSAGEIROS / PASSENGERS
15,2 milhões / millions
w w w . c i d a d e d e s a o p a u l o . c o m26
ASPE
CTOS
CON
JUNT
URAI
S / C
ONJU
NCTU
RAL
ASPE
CTS
Caracas
Miami
Dallas
México
Washington, DCNew York
Toronto
La Paz
FrankfurtAmsterdãLondres
Paris
MadriLisboa
Assunção
Lima
Bogot á
Montevidéu
Joanesburgo
DubaiDoha
Roma
São PauloSantiago
Buenos Aires
Pequim
Tóquio
VÔOS DIRETOS PARA SÃO PAULO / DIRECT FLIGHTS TO SÃO PAULO
Fonte: São Paulo Turismo, 2008
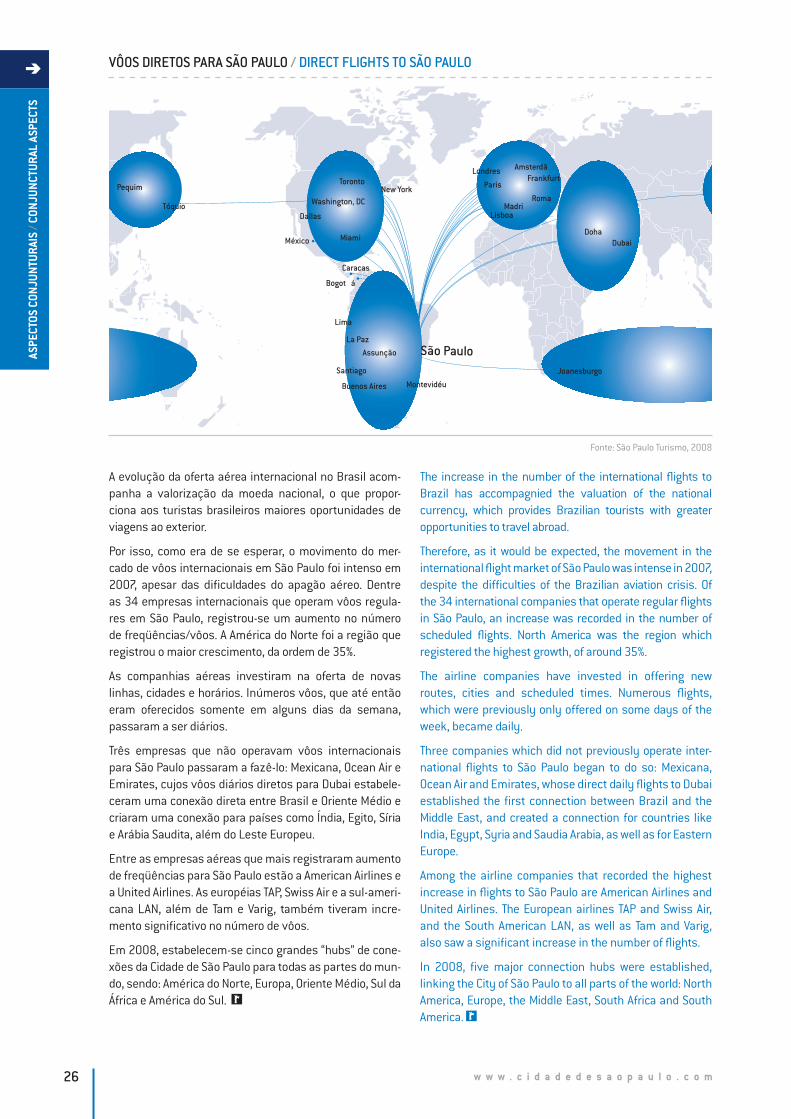
A evolução da oferta aérea internacional no Brasil acom-panha a valorização da moeda nacional, o que propor-ciona aos turistas brasileiros maiores oportunidades de viagens ao exterior.
Por isso, como era de se esperar, o movimento do mer-cado de vôos internacionais em São Paulo foi intenso em 2007, apesar das dificuldades do apagão aéreo. Dentre as 34 empresas internacionais que operam vôos regula-res em São Paulo, registrou-se um aumento no número de freqüências/vôos. A América do Norte foi a região que registrou o maior crescimento, da ordem de 35%.
As companhias aéreas investiram na oferta de novas linhas, cidades e horários. Inúmeros vôos, que até então eram oferecidos somente em alguns dias da semana, passaram a ser diários.
Três empresas que não operavam vôos internacionais para São Paulo passaram a fazê-lo: Mexicana, Ocean Air e Emirates, cujos vôos diários diretos para Dubai estabele-ceram uma conexão direta entre Brasil e Oriente Médio e criaram uma conexão para países como Índia, Egito, Síria e Arábia Saudita, além do Leste Europeu.
Entre as empresas aéreas que mais registraram aumento de freqüências para São Paulo estão a American Airlines e a United Airlines. As européias TAP, Swiss Air e a sul-ameri-cana LAN, além de Tam e Varig, também tiveram incre-mento significativo no número de vôos.
Em 2008, estabelecem-se cinco grandes “hubs” de cone-xões da Cidade de São Paulo para todas as partes do mun-do, sendo: América do Norte, Europa, Oriente Médio, Sul da África e América do Sul.
The increase in the number of the international flights to Brazil has accompagnied the valuation of the national currency, which provides Brazilian tourists with greater opportunities to travel abroad.
Therefore, as it would be expected, the movement in the international flight market of São Paulo was intense in 2007, despite the difficulties of the Brazilian aviation crisis. Of the 34 international companies that operate regular flights in São Paulo, an increase was recorded in the number of scheduled flights. North America was the region which registered the highest growth, of around 35%.
The airline companies have invested in offering new routes, cities and scheduled times. Numerous flights, which were previously only offered on some days of the week, became daily.
Three companies which did not previously operate inter-national flights to São Paulo began to do so: Mexicana, Ocean Air and Emirates, whose direct daily flights to Dubai established the first connection between Brazil and the Middle East, and created a connection for countries like India, Egypt, Syria and Saudia Arabia, as well as for Eastern Europe.
Among the airline companies that recorded the highest increase in flights to São Paulo are American Airlines and United Airlines. The European airlines TAP and Swiss Air, and the South American LAN, as well as Tam and Varig, also saw a significant increase in the number of flights.
In 2008, five major connection hubs were established, linking the City of São Paulo to all parts of the world: North America, Europe, the Middle East, South Africa and South America.
w w w . c i d a d e d e s a o p a u l o . c o m 27
ASPE
CTOS
CON
JUNT
URAI
S / C
ONJU
NCTU
RAL
ASPE
CTS
TERMINAIS RODOVIÁRIOSBUS TERMINALS
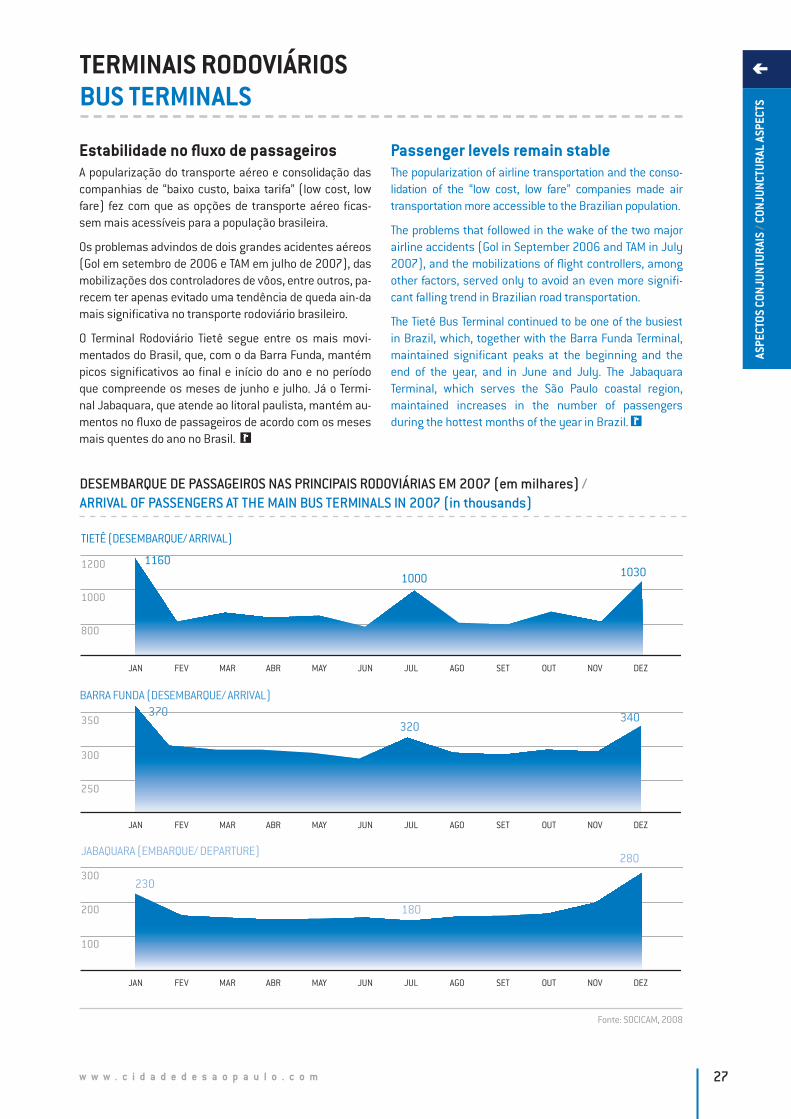
Estabilidade no fluxo de passageirosA popularização do transporte aéreo e consolidação das companhias de “baixo custo, baixa tarifa” (low cost, low fare) fez com que as opções de transporte aéreo ficas-sem mais acessíveis para a população brasileira.
Os problemas advindos de dois grandes acidentes aéreos (Gol em setembro de 2006 e TAM em julho de 2007), das mobilizações dos controladores de vôos, entre outros, pa-recem ter apenas evitado uma tendência de queda ain-da mais significativa no transporte rodoviário brasileiro.
O Terminal Rodoviário Tietê segue entre os mais movi-mentados do Brasil, que, com o da Barra Funda, mantém picos significativos ao final e início do ano e no período que compreende os meses de junho e julho. Já o Termi-nal Jabaquara, que atende ao litoral paulista, mantém au-mentos no fluxo de passageiros de acordo com os meses mais quentes do ano no Brasil.
Passenger levels remain stableThe popularization of airline transportation and the conso- lidation of the “low cost, low fare” companies made air transportation more accessible to the Brazilian population.
The problems that followed in the wake of the two major airline accidents (Gol in September 2006 and TAM in July 2007), and the mobilizations of flight controllers, among other factors, served only to avoid an even more signifi-cant falling trend in Brazilian road transportation.
The Tietê Bus Terminal continued to be one of the busiest in Brazil, which, together with the Barra Funda Terminal, maintained significant peaks at the beginning and the end of the year, and in June and July. The Jabaquara Terminal, which serves the São Paulo coastal region, maintained increases in the number of passengers during the hottest months of the year in Brazil.
DESEMBARQUE DE PASSAGEIROS NAS PRINCIPAIS RODOVIÁRIAS EM 2007 (em milhares) / ARRIVAL OF PASSENGERS AT THE MAIN BUS TERMINALS IN 2007 (in thousands)
JAN FEV MAR ABR MAY JUN JUL AGO SET OUT NOV DEZ
100
300
200
JABAQUARA (EMBARQUE/ DEPARTURE)
230
180
280
JAN FEV MAR ABR MAY JUN JUL AGO SET OUT NOV DEZ
250
350
300
BARRA FUNDA (DESEMBARQUE/ ARRIVAL)370
320340
JAN FEV MAR ABR MAY JUN JUL AGO SET OUT NOV DEZ
800
1200
1000
TIETÊ (DESEMBARQUE/ ARRIVAL)
1160
1000 1030
Fonte: SOCICAM, 2008
w w w . c i d a d e d e s a o p a u l o . c o m28
ASPE
CTOS
CON
JUNT
URAI
S / C
ONJU
NCTU
RAL
ASPE
CTS
VOLUME DO ISSVOLUME OF ISS
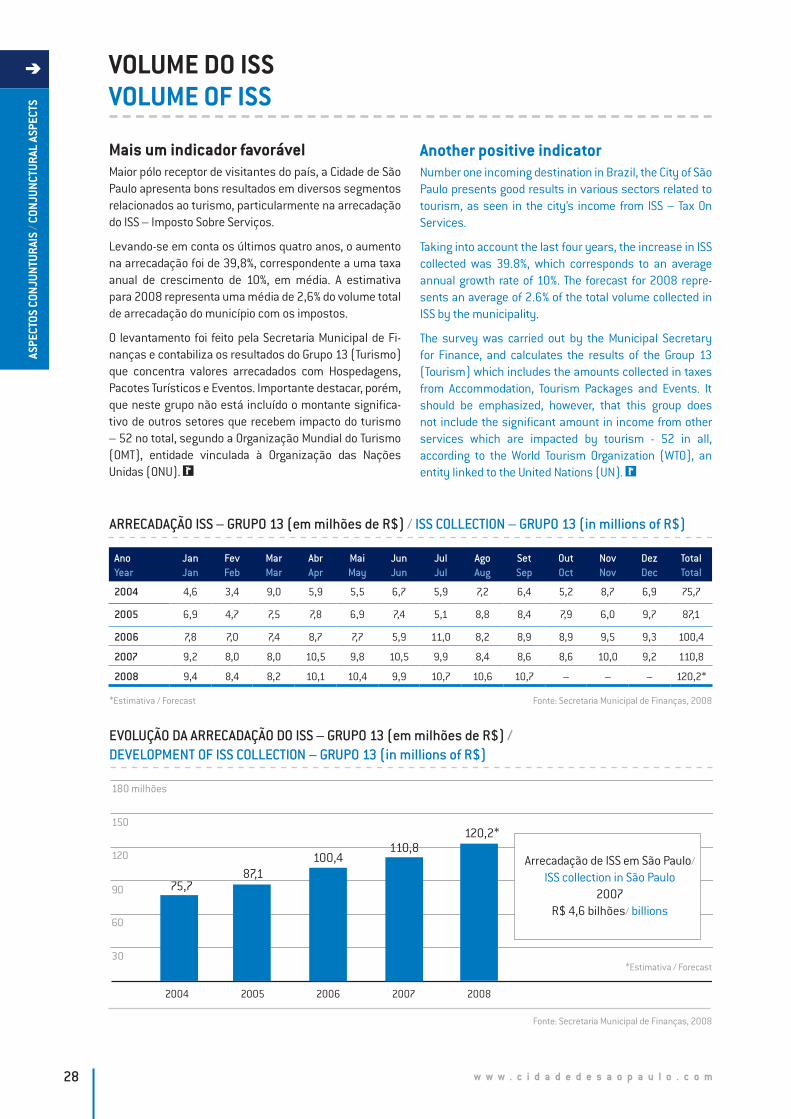
Mais um indicador favorávelMaior pólo receptor de visitantes do país, a Cidade de São Paulo apresenta bons resultados em diversos segmentos relacionados ao turismo, particularmente na arrecadação do ISS – Imposto Sobre Serviços.
Levando-se em conta os últimos quatro anos, o aumento na arrecadação foi de 39,8%, correspondente a uma taxa anual de crescimento de 10%, em média. A estimativa para 2008 representa uma média de 2,6% do volume total de arrecadação do município com os impostos.
O levantamento foi feito pela Secretaria Municipal de Fi-nanças e contabiliza os resultados do Grupo 13 (Turismo) que concentra valores arrecadados com Hospedagens, Pacotes Turísticos e Eventos. Importante destacar, porém, que neste grupo não está incluído o montante significa-tivo de outros setores que recebem impacto do turismo – 52 no total, segundo a Organização Mundial do Turismo (OMT), entidade vinculada à Organização das Nações Unidas (ONU).
Another positive indicatorNumber one incoming destination in Brazil, the City of São Paulo presents good results in various sectors related to tourism, as seen in the city’s income from ISS – Tax On Services.
Taking into account the last four years, the increase in ISS collected was 39.8%, which corresponds to an average annual growth rate of 10%. The forecast for 2008 repre-sents an average of 2.6% of the total volume collected in ISS by the municipality.
The survey was carried out by the Municipal Secretary for Finance, and calculates the results of the Group 13 (Tourism) which includes the amounts collected in taxes from Accommodation, Tourism Packages and Events. It should be emphasized, however, that this group does not include the significant amount in income from other services which are impacted by tourism - 52 in all, according to the World Tourism Organization (WTO), an entity linked to the United Nations (UN).
AnoYear
JanJan
FevFeb
MarMar
AbrApr
MaiMay
JunJun
JulJul
AgoAug
SetSep
OutOct
NovNov
DezDec
TotalTotal
2004 4,6 3,4 9,0 5,9 5,5 6,7 5,9 7,2 6,4 5,2 8,7 6,9 75,7
2005 6,9 4,7 7,5 7,8 6,9 7,4 5,1 8,8 8,4 7,9 6,0 9,7 87,1
2006 7,8 7,0 7,4 8,7 7,7 5,9 11,0 8,2 8,9 8,9 9,5 9,3 100,4
2007 9,2 8,0 8,0 10,5 9,8 10,5 9,9 8,4 8,6 8,6 10,0 9,2 110,8
2008 9,4 8,4 8,2 10,1 10,4 9,9 10,7 10,6 10,7 – – – 120,2*
ARRECADAÇÃO ISS – GRUPO 13 (em milhões de R$) / ISS COLLECTION – GRUPO 13 (in millions of R$)
Fonte: Secretaria Municipal de Finanças, 2008
EVOLUÇÃO DA ARRECADAÇÃO DO ISS – GRUPO 13 (em milhões de R$) / DEVELOPMENT OF ISS COLLECTION – GRUPO 13 (in millions of R$)
180 milhões
150
120
90
60
30
20052004
87,175,7
2006
100,4
2007
110,8
2008
120,2*
Arrecadação de ISS em São Paulo/
ISS collection in São Paulo2007
R$ 4,6 bilhões/ billions
Fonte: Secretaria Municipal de Finanças, 2008
*Estimativa / Forecast
*Estimativa / Forecast
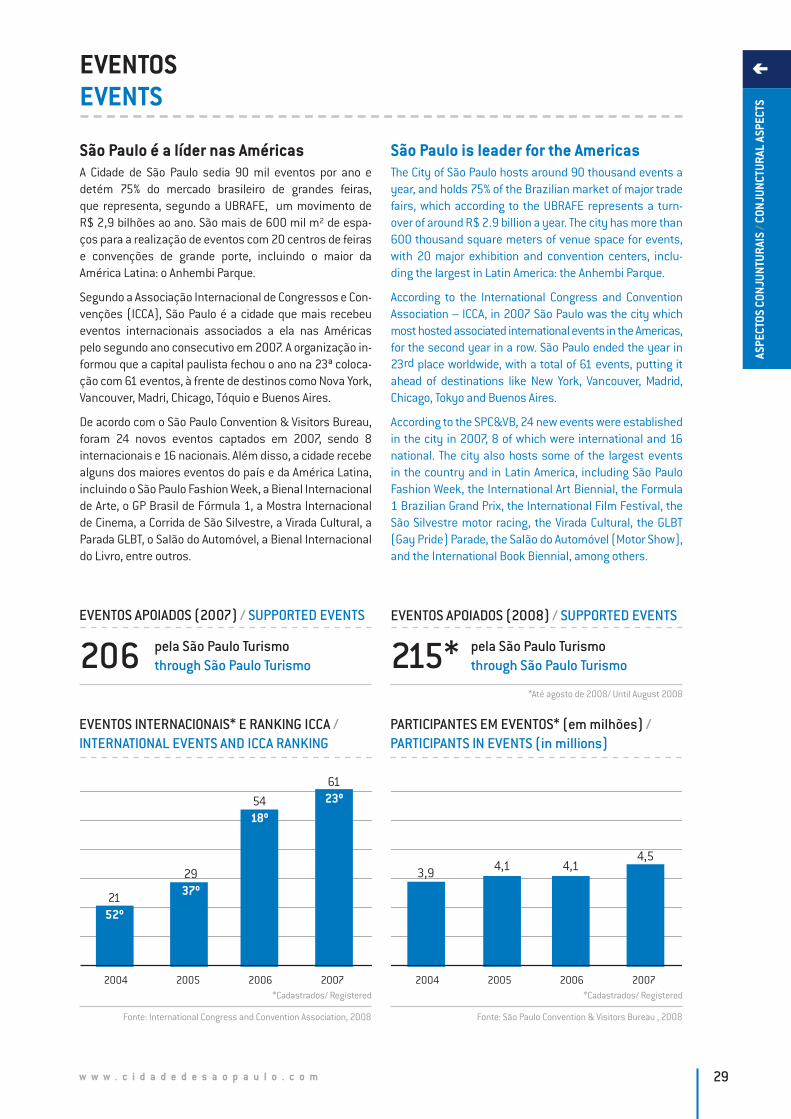
w w w . c i d a d e d e s a o p a u l o . c o m 29
ASPE
CTOS
CON
JUNT
URAI
S / C
ONJU
NCTU
RAL
ASPE
CTS
EVENTOSEVENTS
São Paulo é a líder nas AméricasA Cidade de São Paulo sedia 90 mil eventos por ano e detém 75% do mercado brasileiro de grandes feiras, que representa, segundo a UBRAFE, um movimento de R$ 2,9 bilhões ao ano. São mais de 600 mil m² de espa-ços para a realização de eventos com 20 centros de feiras e convenções de grande porte, incluindo o maior da América Latina: o Anhembi Parque.
Segundo a Associação Internacional de Congressos e Con-venções (ICCA), São Paulo é a cidade que mais recebeu eventos internacionais associados a ela nas Américas pelo segundo ano consecutivo em 2007. A organização in-formou que a capital paulista fechou o ano na 23ª coloca-ção com 61 eventos, à frente de destinos como Nova York, Vancouver, Madri, Chicago, Tóquio e Buenos Aires.
De acordo com o São Paulo Convention & Visitors Bureau, foram 24 novos eventos captados em 2007, sendo 8 internacionais e 16 nacionais. Além disso, a cidade recebe alguns dos maiores eventos do país e da América Latina, incluindo o São Paulo Fashion Week, a Bienal Internacional de Arte, o GP Brasil de Fórmula 1, a Mostra Internacional de Cinema, a Corrida de São Silvestre, a Virada Cultural, a Parada GLBT, o Salão do Automóvel, a Bienal Internacional do Livro, entre outros.
São Paulo is leader for the AmericasThe City of São Paulo hosts around 90 thousand events a year, and holds 75% of the Brazilian market of major trade fairs, which according to the UBRAFE represents a turn-over of around R$ 2.9 billion a year. The city has more than 600 thousand square meters of venue space for events, with 20 major exhibition and convention centers, inclu-ding the largest in Latin America: the Anhembi Parque.
According to the International Congress and Convention Association – ICCA, in 2007 São Paulo was the city which most hosted associated international events in the Americas, for the second year in a row. São Paulo ended the year in 23rd place worldwide, with a total of 61 events, putting it ahead of destinations like New York, Vancouver, Madrid, Chicago, Tokyo and Buenos Aires.
According to the SPC&VB, 24 new events were established in the city in 2007, 8 of which were international and 16 national. The city also hosts some of the largest events in the country and in Latin America, including São Paulo Fashion Week, the International Art Biennial, the Formula 1 Brazilian Grand Prix, the International Film Festival, the São Silvestre motor racing, the Virada Cultural, the GLBT (Gay Pride) Parade, the Salão do Automóvel (Motor Show), and the International Book Biennial, among others.
EVENTOS INTERNACIONAIS* E RANKING ICCA / INTERNATIONAL EVENTS AND ICCA RANKING
PARTICIPANTES EM EVENTOS* (em milhões) / PARTICIPANTS IN EVENTS (in millions)
2004 2005 2006 2007
2152º
2937º
5418º
6123º
2004 2005 2006 2007
3,9 4,1 4,14,5
Fonte: International Congress and Convention Association, 2008 Fonte: São Paulo Convention & Visitors Bureau , 2008
*Até agosto de 2008/ Until August 2008
*Cadastrados/ Registered *Cadastrados/ Registered
EVENTOS APOIADOS (2007) / SUPPORTED EVENTS EVENTOS APOIADOS (2008) / SUPPORTED EVENTS
206 215*pela São Paulo Turismothrough São Paulo Turismo
pela São Paulo Turismothrough São Paulo Turismo
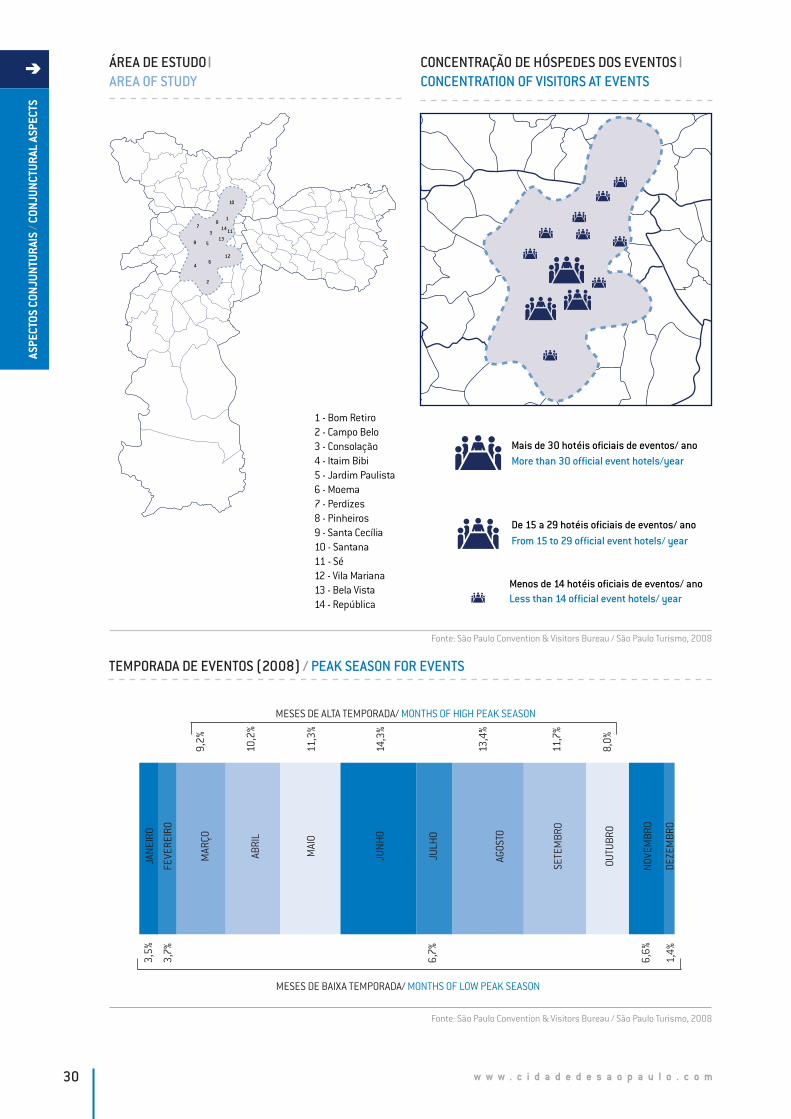
w w w . c i d a d e d e s a o p a u l o . c o m30
ASPE
CTOS
CON
JUNT
URAI
S / C
ONJU
NCTU
RAL
ASPE
CTS
CONCENTRAÇÃO DE HÓSPEDES DOS EVENTOS CONCENTRATION OF VISITORS AT EVENTS
TEMPORADA DE EVENTOS (2008) / PEAK SEASON FOR EVENTS
ÁREA DE ESTUDO AREA OF STUDY
2
12
13
14
10
46
8
7
5
1
3
9
11
1 - Bom Retiro 2 - Campo Belo3 - Consolação4 - Itaim Bibi5 - Jardim Paulista6 - Moema7 - Perdizes8 - Pinheiros9 - Santa Cecília10 - Santana11 - Sé12 - Vila Mariana13 - Bela Vista14 - República
Mais de 30 hotéis oficiais de eventos/ anoMore than 30 official event hotels/year
De 15 a 29 hotéis oficiais de eventos/ anoFrom 15 to 29 official event hotels/ year
Less than 14 official event hotels/ yearMenos de 14 hotéis oficiais de eventos/ ano
JAN
EIRO
FEVE
REIR
O
MAR
ÇO
ABRI
L
MAI
O
JUN
HO
JULH
O
AGOS
TO
SETE
MBR
O
OUTU
BRO
NOVE
MBR
O
DEZE
MBR
O
MESES DE BAIXA TEMPORADA/ MONTHS OF LOW PEAK SEASON
MESES DE ALTA TEMPORADA/ MONTHS OF HIGH PEAK SEASON
9,2%
10,2
%
11,3
%
14,3
%
13,4
%
8,0%
11,7
%
3,5%
6,7%
6,6%
1,4%
3,7%
Fonte: São Paulo Convention & Visitors Bureau / São Paulo Turismo, 2008
Fonte: São Paulo Convention & Visitors Bureau / São Paulo Turismo, 2008
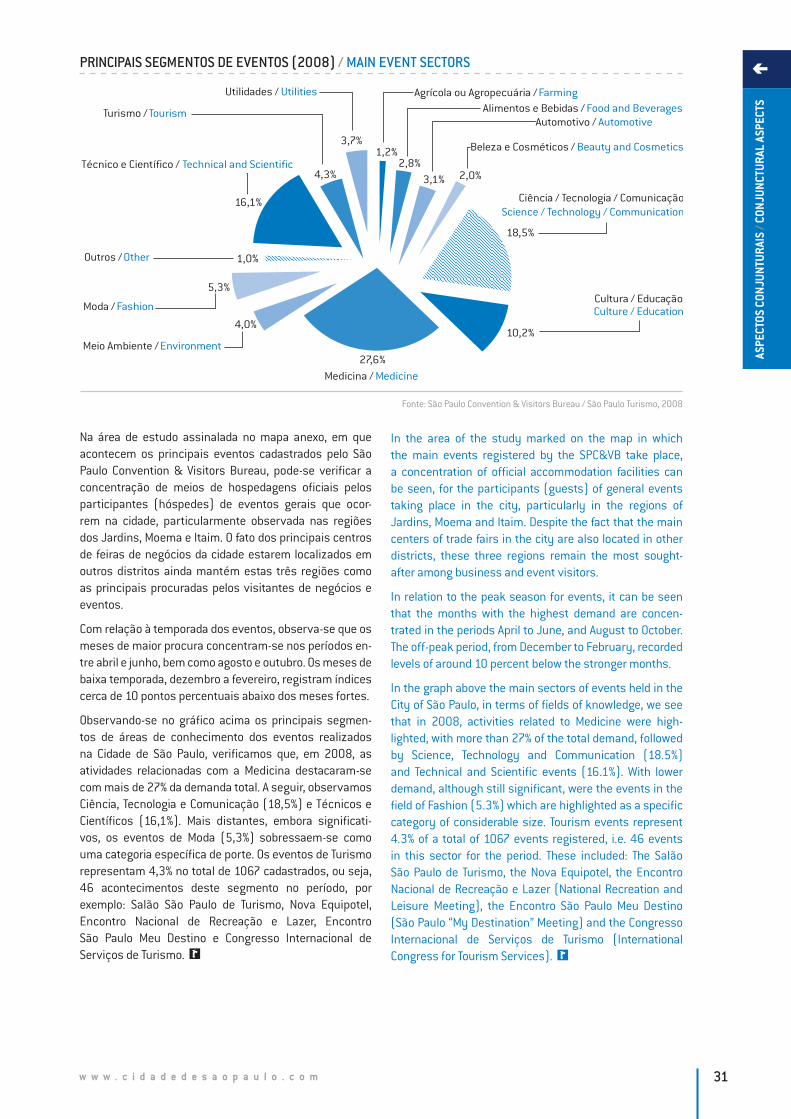
w w w . c i d a d e d e s a o p a u l o . c o m 31
ASPE
CTOS
CON
JUNT
URAI
S / C
ONJU
NCTU
RAL
ASPE
CTS
PRINCIPAIS SEGMENTOS DE EVENTOS (2008) / MAIN EVENT SECTORS
Agrícola ou Agropecuária / FarmingAlimentos e Bebidas / Food and Beverages
Automotivo / Automotive
Beleza e Cosméticos / Beauty and Cosmetics
Ciência / Tecnologia / ComunicaçãoScience / Technology / Communication
Cultura / EducaçãoCulture / Education
Medicina / Medicine
Meio Ambiente / Environment
Moda / Fashion
Técnico e Científico / Technical and Scientific
Turismo / Tourism
Utilidades / Utilities
Outros / Other
1,2%2,8%
3,1% 2,0%
18,5%
10,2%
27,6%
5,3%
1,0%
16,1%
4,3%
4,0%
3,7%
Na área de estudo assinalada no mapa anexo, em que acontecem os principais eventos cadastrados pelo São Paulo Convention & Visitors Bureau, pode-se verificar a concentração de meios de hospedagens oficiais pelos participantes (hóspedes) de eventos gerais que ocor-rem na cidade, particularmente observada nas regiões dos Jardins, Moema e Itaim. O fato dos principais centros de feiras de negócios da cidade estarem localizados em outros distritos ainda mantém estas três regiões como as principais procuradas pelos visitantes de negócios e eventos.
Com relação à temporada dos eventos, observa-se que os meses de maior procura concentram-se nos períodos en-tre abril e junho, bem como agosto e outubro. Os meses de baixa temporada, dezembro a fevereiro, registram índices cerca de 10 pontos percentuais abaixo dos meses fortes.
Observando-se no gráfico acima os principais segmen-tos de áreas de conhecimento dos eventos realizados na Cidade de São Paulo, verificamos que, em 2008, as atividades relacionadas com a Medicina destacaram-se com mais de 27% da demanda total. A seguir, observamos Ciência, Tecnologia e Comunicação (18,5%) e Técnicos e Científicos (16,1%). Mais distantes, embora significati-vos, os eventos de Moda (5,3%) sobressaem-se como uma categoria específica de porte. Os eventos de Turismo representam 4,3% no total de 1067 cadastrados, ou seja, 46 acontecimentos deste segmento no período, por exemplo: Salão São Paulo de Turismo, Nova Equipotel, Encontro Nacional de Recreação e Lazer, Encontro São Paulo Meu Destino e Congresso Internacional de Serviços de Turismo.
In the area of the study marked on the map in which the main events registered by the SPC&VB take place, a concentration of official accommodation facilities can be seen, for the participants (guests) of general events taking place in the city, particularly in the regions of Jardins, Moema and Itaim. Despite the fact that the main centers of trade fairs in the city are also located in other districts, these three regions remain the most sought- after among business and event visitors.
In relation to the peak season for events, it can be seen that the months with the highest demand are concen-trated in the periods April to June, and August to October. The off-peak period, from December to February, recorded levels of around 10 percent below the stronger months.
In the graph above the main sectors of events held in the City of São Paulo, in terms of fields of knowledge, we see that in 2008, activities related to Medicine were high-lighted, with more than 27% of the total demand, followed by Science, Technology and Communication (18.5%) and Technical and Scientific events (16.1%). With lower demand, although still significant, were the events in the field of Fashion (5.3%) which are highlighted as a specific category of considerable size. Tourism events represent 4.3% of a total of 1067 events registered, i.e. 46 events in this sector for the period. These included: The Salão São Paulo de Turismo, the Nova Equipotel, the Encontro Nacional de Recreação e Lazer (National Recreation and Leisure Meeting), the Encontro São Paulo Meu Destino (São Paulo “My Destination” Meeting) and the Congresso Internacional de Serviços de Turismo (International Congress for Tourism Services).
Fonte: São Paulo Convention & Visitors Bureau / São Paulo Turismo, 2008
w w w . c i d a d e d e s a o p a u l o . c o m32
COMPRISED OF BASIC INDICATORS GATHERED FROM SURVEYS CARRIED OUT BY SÃO PAULO TURISMO AT MEGA-EVENTS HELD IN THE CITY OF SÃO PAULO, WITH EMPHASIS ON THE PERFORMANCE OF THE MAIN CONTROL VARIABLES RELATED TO THE SOCIO-DEMOGRAPHIC PROFILE OF THE DEMAND, AND THE EVALUATION OF SUPPORT INFRA- STRUCTURE OF THE CITY. IN THE VIEW OF ITS VISITORS, PROPOSED BY A WORKING GROUP INCLUDING THE MAIN ENTITIES IN THE TOURISM TRADE. IT INCLUDES A HISTORI-CAL SERIES OF TEN EVENTS, NAMELY: THE ADVENTURE SPORTS FAIR, CARNIVAL, THE INTERNATIONAL BOOK BIENNIAL, FRANCAL (INTERNATIONAL FAIR OF FOOTWEAR, FASHION ACCESSORIES, MACHINES AND COMPONENTS), FORMULA 1 GRAND PRIX, HOSPITALAR (INTERNATIONAL FAIR OF PRO-DUCTS, EQUIPMENT, SERVICES AND TECH-NOLOGY FOR HOSPITALS, LABORATORIES, PHARMACIES, HEALTH CLINICS AND MEDICAL OFFICES), THE GLBT PARADE, THE VIRADA CULTURAL AND THE SALÃO DO AUTOMÓVEL (INTERNATIONAL AUTOMOBILE TRADE SHOW):
PESQUISAS EM EVENTOS DE GRANDE PORTESURVEYS IN HIGH PROFILE EVENTS
COMPOSTO POR INDICADORES BÁSICOS DAS PESQUISAS REALIZADAS PELA SÃO PAULO TURISMO NOS MEGA-EVENTOS REALIZADOS NA CIDADE DE SÃO PAULO, COM ÊNFASE NO DESEMPENHO DAS PRINCIPAIS VARIÁVEIS DE CONTROLE RELATIVAS AO PERFIL SOCIODEMOGRÁFICO DA DEMANDA E NA AVALIAÇÃO DA INFRA-ESTRUTURA DE APOIO DA CIDADE, SOB A ÓTICA DOS SEUS VISITANTES. PRO-POSTO POR UM GRUPO DE TRABALHO DO QUAL FIZERAM PARTE AS PRINCIPAIS ENTIDADES DO TRADE TURÍSTICO. INCLUI UMA SÉRIE HISTÓRICA DE NOVE EVENTOS, A SABER: ADVENTURE SPORTS FAIR, CARNAVAL, BIENAL DO LIVRO, FRANCAL, GP FÓRMULA 1, HOSPITALAR, PARADA GLBT, VIRADA CULTU-RAL E SALÃO DO AUTOMÓVEL:
III/CAPÍTULO / CHAPTER
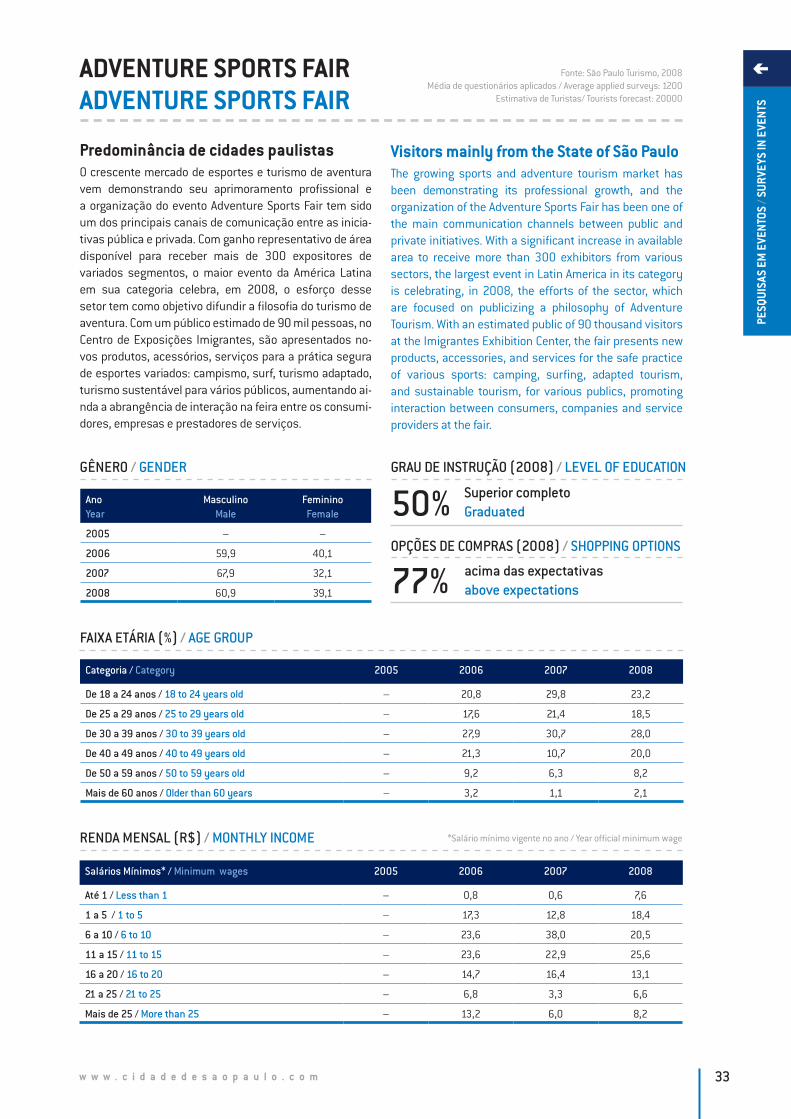
w w w . c i d a d e d e s a o p a u l o . c o m 33
PESQ
UISA
S EM
EVE
NTOS
/ SU
RVEY
S IN
EVE
NTS
ADVENTURE SPORTS FAIRADVENTURE SPORTS FAIR
Predominância de cidades paulistasO crescente mercado de esportes e turismo de aventura vem demonstrando seu aprimoramento profissional e a organização do evento Adventure Sports Fair tem sido um dos principais canais de comunicação entre as inicia-tivas pública e privada. Com ganho representativo de área disponível para receber mais de 300 expositores de variados segmentos, o maior evento da América Latina em sua categoria celebra, em 2008, o esforço desse setor tem como objetivo difundir a filosofia do turismo de aventura. Com um público estimado de 90 mil pessoas, no Centro de Exposições Imigrantes, são apresentados no-vos produtos, acessórios, serviços para a prática segura de esportes variados: campismo, surf, turismo adaptado, turismo sustentável para vários públicos, aumentando ai-nda a abrangência de interação na feira entre os consumi-dores, empresas e prestadores de serviços.
Visitors mainly from the State of São PauloThe growing sports and adventure tourism market has been demonstrating its professional growth, and the organization of the Adventure Sports Fair has been one of the main communication channels between public and private initiatives. With a significant increase in available area to receive more than 300 exhibitors from various sectors, the largest event in Latin America in its category is celebrating, in 2008, the efforts of the sector, which are focused on publicizing a philosophy of Adventure Tourism. With an estimated public of 90 thousand visitors at the Imigrantes Exhibition Center, the fair presents new products, accessories, and services for the safe practice of various sports: camping, surfing, adapted tourism, and sustainable tourism, for various publics, promoting interaction between consumers, companies and service providers at the fair.
RENDA MENSAL (R$) / MONTHLY INCOME
Fonte: São Paulo Turismo, 2008Média de questionários aplicados / Average applied surveys: 1200
Estimativa de Turistas/ Tourists forecast: 20000
Salários Mínimos* / Minimum wages 2005 2006 2007 2008
Até 1 / Less than 1 – 0,8 0,6 7,6
1 a 5 / 1 to 5 – 17,3 12,8 18,4
6 a 10 / 6 to 10 – 23,6 38,0 20,5
11 a 15 / 11 to 15 – 23,6 22,9 25,6
16 a 20 / 16 to 20 – 14,7 16,4 13,1
21 a 25 / 21 to 25 – 6,8 3,3 6,6
Mais de 25 / More than 25 – 13,2 6,0 8,2
FAIXA ETÁRIA (%) / AGE GROUP
Categoria / Category 2005 2006 2007 2008
De 18 a 24 anos / 18 to 24 years old – 20,8 29,8 23,2
De 25 a 29 anos / 25 to 29 years old – 17,6 21,4 18,5
De 30 a 39 anos / 30 to 39 years old – 27,9 30,7 28,0
De 40 a 49 anos / 40 to 49 years old – 21,3 10,7 20,0
De 50 a 59 anos / 50 to 59 years old – 9,2 6,3 8,2
Mais de 60 anos / Older than 60 years – 3,2 1,1 2,1
GÊNERO / GENDER
AnoYear
MasculinoMale
FemininoFemale
2005 – –
2006 59,9 40,1
2007 67,9 32,1
2008 60,9 39,1
GRAU DE INSTRUÇÃO (2008) / LEVEL OF EDUCATION
50%OPÇÕES DE COMPRAS (2008) / SHOPPING OPTIONS
77%
Superior completoGraduated
acima das expectativasabove expectations
*Salário mínimo vigente no ano / Year official minimum wage
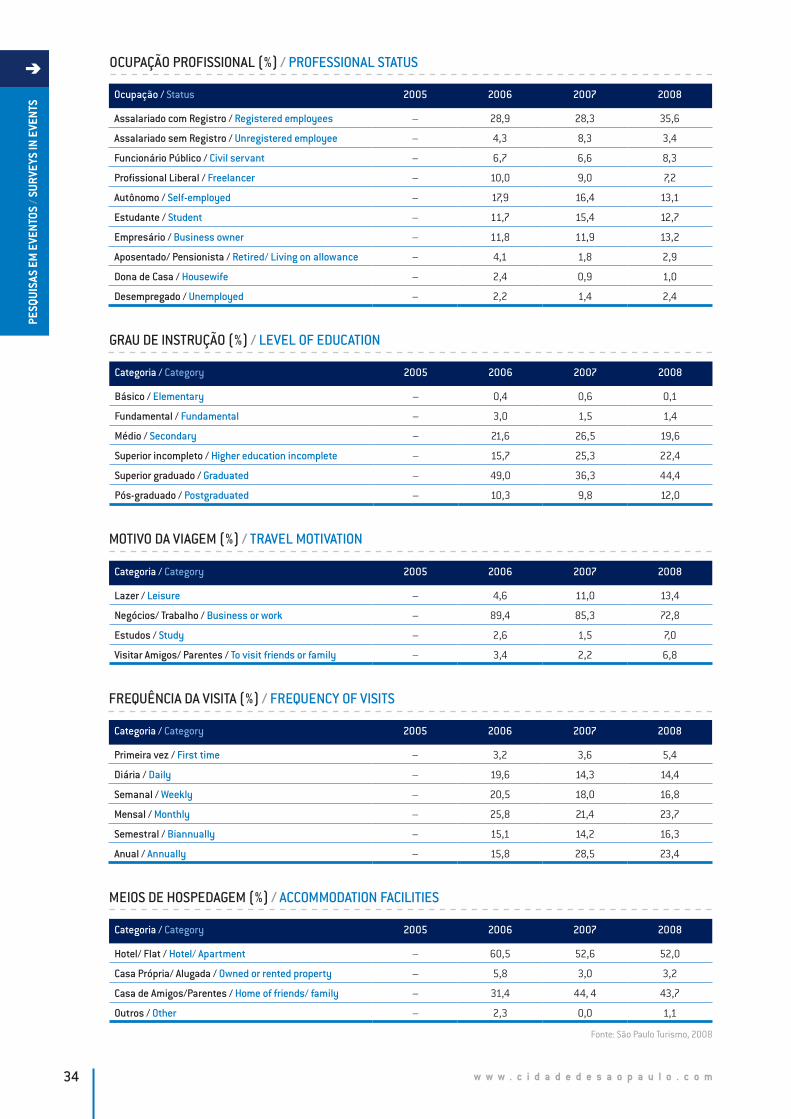
w w w . c i d a d e d e s a o p a u l o . c o m34
PESQ
UISA
S EM
EVE
NTOS
/ SU
RVEY
S IN
EVE
NTS
OCUPAÇÃO PROFISSIONAL (%) / PROFESSIONAL STATUS
Ocupação / Status 2005 2006 2007 2008
Assalariado com Registro / Registered employees – 28,9 28,3 35,6
Assalariado sem Registro / Unregistered employee – 4,3 8,3 3,4
Funcionário Público / Civil servant – 6,7 6,6 8,3
Profissional Liberal / Freelancer – 10,0 9,0 7,2
Autônomo / Self-employed – 17,9 16,4 13,1
Estudante / Student – 11,7 15,4 12,7
Empresário / Business owner – 11,8 11,9 13,2
Aposentado/ Pensionista / Retired/ Living on allowance – 4,1 1,8 2,9
Dona de Casa / Housewife – 2,4 0,9 1,0
Desempregado / Unemployed – 2,2 1,4 2,4
FREQUÊNCIA DA VISITA (%) / FREQUENCY OF VISITS
Categoria / Category 2005 2006 2007 2008
Primeira vez / First time – 3,2 3,6 5,4
Diária / Daily – 19,6 14,3 14,4
Semanal / Weekly – 20,5 18,0 16,8
Mensal / Monthly – 25,8 21,4 23,7
Semestral / Biannually – 15,1 14,2 16,3
Anual / Annually – 15,8 28,5 23,4
MEIOS DE HOSPEDAGEM (%) / ACCOMMODATION FACILITIES
Categoria / Category 2005 2006 2007 2008
Hotel/ Flat / Hotel/ Apartment – 60,5 52,6 52,0
Casa Própria/ Alugada / Owned or rented property – 5,8 3,0 3,2
Casa de Amigos/Parentes / Home of friends/ family – 31,4 44, 4 43,7
Outros / Other – 2,3 0,0 1,1
MOTIVO DA VIAGEM (%) / TRAVEL MOTIVATION
Categoria / Category 2005 2006 2007 2008
Lazer / Leisure – 4,6 11,0 13,4
Negócios/ Trabalho / Business or work – 89,4 85,3 72,8
Estudos / Study – 2,6 1,5 7,0
Visitar Amigos/ Parentes / To visit friends or family – 3,4 2,2 6,8
GRAU DE INSTRUÇÃO (%) / LEVEL OF EDUCATION
Categoria / Category 2005 2006 2007 2008
Básico / Elementary – 0,4 0,6 0,1
Fundamental / Fundamental – 3,0 1,5 1,4
Médio / Secondary – 21,6 26,5 19,6
Superior incompleto / Higher education incomplete – 15,7 25,3 22,4
Superior graduado / Graduated – 49,0 36,3 44,4
Pós-graduado / Postgraduated – 10,3 9,8 12,0
Fonte: São Paulo Turismo, 2008
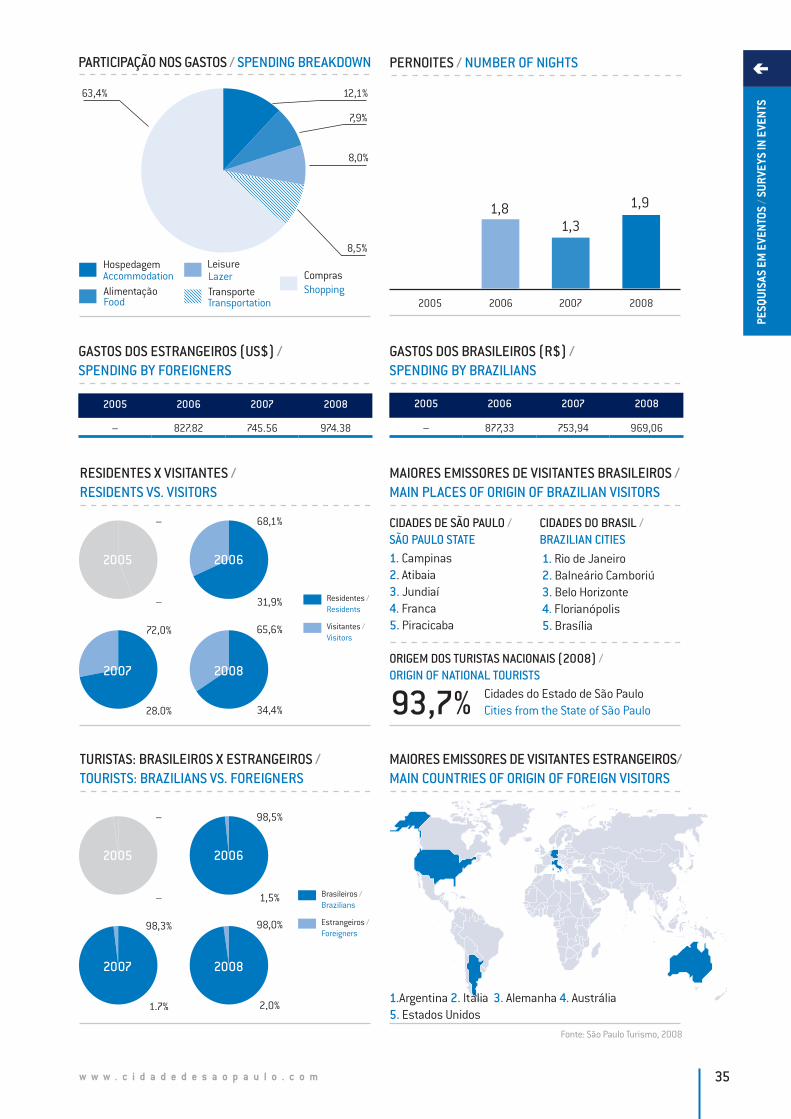
w w w . c i d a d e d e s a o p a u l o . c o m 35
PESQ
UISA
S EM
EVE
NTOS
/ SU
RVEY
S IN
EVE
NTS
PARTICIPAÇÃO NOS GASTOS / SPENDING BREAKDOWN
63,4%
8,0%
7,9%
12,1%
8,5%HospedagemAccommodationAlimentaçãoFood
ComprasShopping
LazerLeisure
TransporteTransportation
GASTOS DOS ESTRANGEIROS (US$) / SPENDING BY FOREIGNERS
1. Campinas2. Atibaia 3. Jundiaí4. Franca5. Piracicaba
RESIDENTES X VISITANTES / RESIDENTS VS. VISITORS
MAIORES EMISSORES DE VISITANTES BRASILEIROS / MAIN PLACES OF ORIGIN OF BRAZILIAN VISITORS
1. Rio de Janeiro 2. Balneário Camboriú3. Belo Horizonte4. Florianópolis5. Brasília
CIDADES DE SÃO PAULO /SÃO PAULO STATE
CIDADES DO BRASIL /BRAZILIAN CITIES
TURISTAS: BRASILEIROS X ESTRANGEIROS / TOURISTS: BRAZILIANS VS. FOREIGNERS
MAIORES EMISSORES DE VISITANTES ESTRANGEIROS/ MAIN COUNTRIES OF ORIGIN OF FOREIGN VISITORS
1.Argentina 2. Itália 3. Alemanha 4. Austrália 5. Estados Unidos
PERNOITES / NUMBER OF NIGHTS
2005 2006 20082007
1,3
1,91,8
2005 2006 2007 2008
– 827.82 745.56 974.38
2005 2006 2007 2008
– 877,33 753,94 969,06
Residentes / Residents
Visitantes / Visitors
2005 2006
20082007
–
–
28,0%
72,0%
31,9%
68,1%
34,4%
65,6%
Brasileiros / Brazilians
Estrangeiros / Foreigners
2005 2006
20082007
–
–
1,7%
98,3%
1,5%
98,5%
2,0%
98,0%
GASTOS DOS BRASILEIROS (R$) / SPENDING BY BRAZILIANS
93,7% Cidades do Estado de São PauloCities from the State of São Paulo
ORIGEM DOS TURISTAS NACIONAIS (2008) / ORIGIN OF NATIONAL TOURISTS
Fonte: São Paulo Turismo, 2008
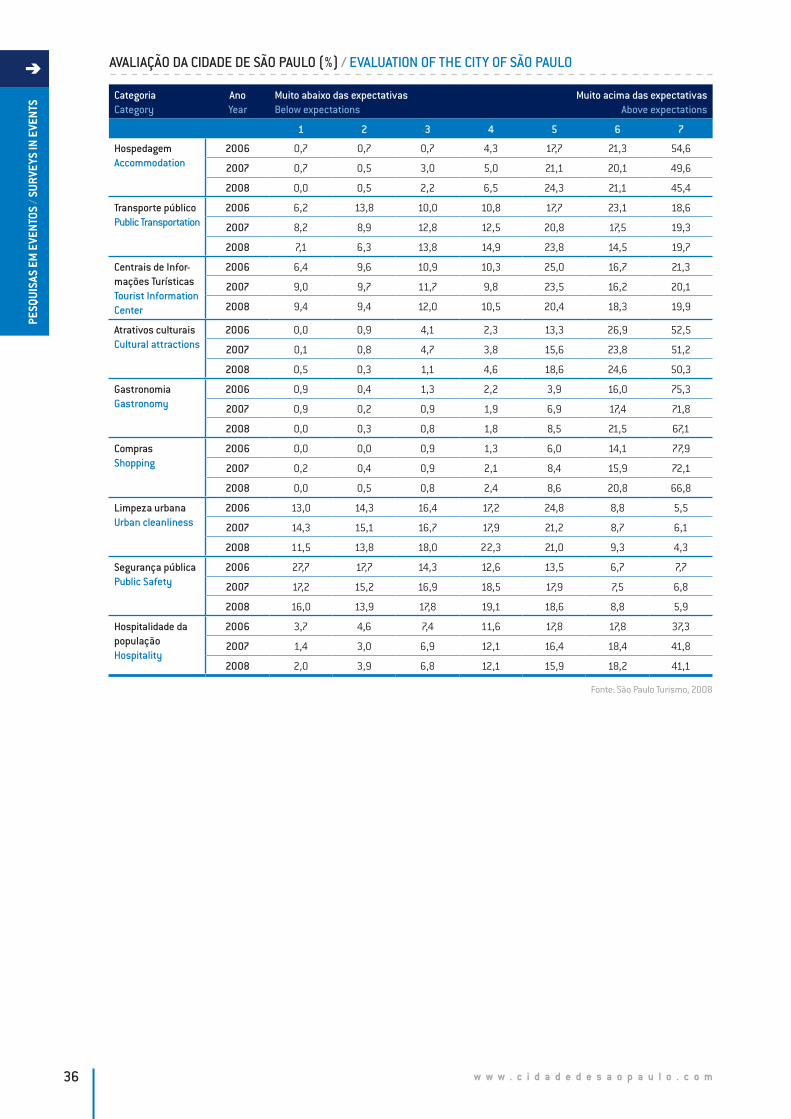
w w w . c i d a d e d e s a o p a u l o . c o m36
PESQ
UISA
S EM
EVE
NTOS
/ SU
RVEY
S IN
EVE
NTS Categoria
CategoryAnoYear
Muito abaixo das expectativasBelow expectations
Muito acima das expectativasAbove expectations
1 2 3 4 5 6 7
HospedagemAccommodation
2006 0,7 0,7 0,7 4,3 17,7 21,3 54,6
2007 0,7 0,5 3,0 5,0 21,1 20,1 49,6
2008 0,0 0,5 2,2 6,5 24,3 21,1 45,4
Transporte públicoPublic Transportation
2006 6,2 13,8 10,0 10,8 17,7 23,1 18,6
2007 8,2 8,9 12,8 12,5 20,8 17,5 19,3
2008 7,1 6,3 13,8 14,9 23,8 14,5 19,7
Centrais de Infor-mações TurísticasTourist Information Center
2006 6,4 9,6 10,9 10,3 25,0 16,7 21,3
2007 9,0 9,7 11,7 9,8 23,5 16,2 20,1
2008 9,4 9,4 12,0 10,5 20,4 18,3 19,9
Atrativos culturaisCultural attractions
2006 0,0 0,9 4,1 2,3 13,3 26,9 52,5
2007 0,1 0,8 4,7 3,8 15,6 23,8 51,2
2008 0,5 0,3 1,1 4,6 18,6 24,6 50,3
GastronomiaGastronomy
2006 0,9 0,4 1,3 2,2 3,9 16,0 75,3
2007 0,9 0,2 0,9 1,9 6,9 17,4 71,8
2008 0,0 0,3 0,8 1,8 8,5 21,5 67,1
ComprasShopping
2006 0,0 0,0 0,9 1,3 6,0 14,1 77,9
2007 0,2 0,4 0,9 2,1 8,4 15,9 72,1
2008 0,0 0,5 0,8 2,4 8,6 20,8 66,8
Limpeza urbanaUrban cleanliness
2006 13,0 14,3 16,4 17,2 24,8 8,8 5,5
2007 14,3 15,1 16,7 17,9 21,2 8,7 6,1
2008 11,5 13,8 18,0 22,3 21,0 9,3 4,3
Segurança públicaPublic Safety
2006 27,7 17,7 14,3 12,6 13,5 6,7 7,7
2007 17,2 15,2 16,9 18,5 17,9 7,5 6,8
2008 16,0 13,9 17,8 19,1 18,6 8,8 5,9
Hospitalidade da populaçãoHospitality
2006 3,7 4,6 7,4 11,6 17,8 17,8 37,3
2007 1,4 3,0 6,9 12,1 16,4 18,4 41,8
2008 2,0 3,9 6,8 12,1 15,9 18,2 41,1
AVALIAÇÃO DA CIDADE DE SÃO PAULO (%) / EVALUATION OF THE CITY OF SÃO PAULO
Fonte: São Paulo Turismo, 2008
w w w . c i d a d e d e s a o p a u l o . c o m 37
PESQ
UISA
S EM
EVE
NTOS
/ SU
RVEY
S IN
EVE
NTS
O gênero masculino corresponde à grande maioria dos participantes do evento (60,9%), embora, em 2008, perceba-se um crescimento moderado do extrato feminino (39,1%).
Com uma faixa etária jovem e em maior número compreen-dida entre 30 e 39 anos, também abriga um público das faixas próximas. Notadamente a renda mensal do público é elevada, concentrada no patamar de ganhos entre 11 e 15 salários mínimos, com ocupação predominantemente de assalariados com registro, autônomos, empresários e estudantes.
A grande maioria tem curso superior completo e, em 12% dos casos, em 2008, tem pós-graduação.
A motivação da viagem é de negócios, em média 80% dos participantes procuram a Adventure Sports Fair por inte-resse comercial com uma sensível derivação, em 2008, explicada pelos estudos (7%) e mesmo por lazer (13,4%). A freqüência da visita é mensal, em média, de 23,6%, seguida por uma expressiva tendência anual (23,4%) em 2008.
A maioria dos turistas hospeda-se em hotéis, com mais de 52,0% no período de estudo, seguidos por casa de ami-gos/parentes) com 43,7% em 2008. A categoria “Outros”, na qual se incluem albergues, pousadas e pensões, cor-responde a 1,1% das acomodações.
O gasto médio diário dos turistas brasileiros corresponde a R$ 510,03, e o dos estrangeiros, em média, US$ 512.83. A participação dos gastos é predominantemente em compras (63,4%), em 2008, dividindo-se o restante em: hospedagem (12,1%), transporte (8,5%), lazer (8,0%), alimentação (7,9%).
A participação dos visitantes foi, no ano de 2008, da ordem de 34,4%, restando 65,6% ao público de residentes. Desse montante de turistas, 2% refere-se a estrangeiros provenientes, na maioria, da Argentina, Itália, Alemanha, Austrália e Estados Unidos. A grande parcela de visitantes é originária de cidades do Estado de São Paulo, com 93,7%, destacando-se Campinas, Atibaia, Jundiaí, Franca e Piraci-caba. Das cidades brasileiras, observa-se uma procedên-cia de visitantes do Rio de Janeiro, Balneário Camboriú, Belo Horizonte, Florianópolis e Brasília.
A avaliação dos principais equipamentos e serviços da Ci-dade de São Paulo, no período de 2006 a 2008, demonstra uma elevada satisfação nos itens referentes a compras, gastronomia e atrativos culturais, todos, em média, acima de 50%. A expectativa referente à categoria hospedagem também é satisfatória, embora apresente uma relativa queda de avaliação. Igualmente o item referente à hospi-talidade da população atinge níveis esperados. Os demais itens - centrais de informação e transporte - podem ser considerados regulares sendo os dois últimos - limpeza e segurança pública - os mais críticos em relação ao quadro geral.
The majority of participants in the event were male (60.9%), although in 2008, a moderate growth was seen in the female contingent (39.1%).
With a predominantly young public, aged mainly from 30 to 39 years, the event also attracts people from the age ranges on either side. Notably, the monthly income of the public is high, concentrated at earnings levels between 11 and 15 minimum wages, comprised mainly of registered employees, self-employed people, business people, and students.
The majority has completed higher education and of these, 12% have postgraduate degrees in 2008.
The purpose of the trip is mainly business – approxima-tely 80% of the participants visit the Adventure Sports Fair for commercial interest, and a significant portion in 2008 was made up of students (7%) and those visiting for leisure purposes (13.4%). The frequency of visits is monthly, on average, with 23.6%, followed by a significant portion who visited the city once a year (23.4%) in 2008.
The majority of the tourists stays at hotels - more than 52% in the period studied, followed by the homes of friends/relatives with 43.7% in 2008. The category “Other”, which includes hostels, lodges and inns, accounts for 1.1% of the accommodation.
The average daily spending of the Brazilian tourists was R$ 510.03, while that of the foreign visitors was US$ 512.83. In 2008 these sums were spent mainly on shopping (63.4%), with the rest being spent on: accommodation (12.1%), transportation (8.5%), leisure (8.0%), food and drink (7.9%).
Of the total public in 2008, around 34.4% were visitors, while the remaining 65.6% was comprised of residents. Of the total volume of tourists, 2% were foreigners, mainly from Argentina, Italy, Germany, Australia and the United States. The vast majority of visitors, 93.7%, were from within the State of São Paulo, in particular, Campinas, Atibaia, Jundiaí, Franca and Piracicaba. With regard to other regions of Brazil, it was registered that the majority of visitors was from Rio de Janeiro, Balneário Camboriú, Belo Horizonte, Florianópolis and Brasília.
The evaluation of the main facilities and services in the City of São Paulo, for the period of 2006 to 2008, demonstrates a high level of satisfaction in relation to shopping, gastronomy and cultural attractions, all receiving an average score of over 50%. The evaluation of the accommodation facilities was also satisfactory, although this category showed a relative decrease in the evaluation. Likewise, the item relating to hospitality of the population met the visitor’s expectations. The other items – Tourist Information Centers and transportation – were considered regular while the last two – clean-liness and public safety – were the most critical of all the categories.
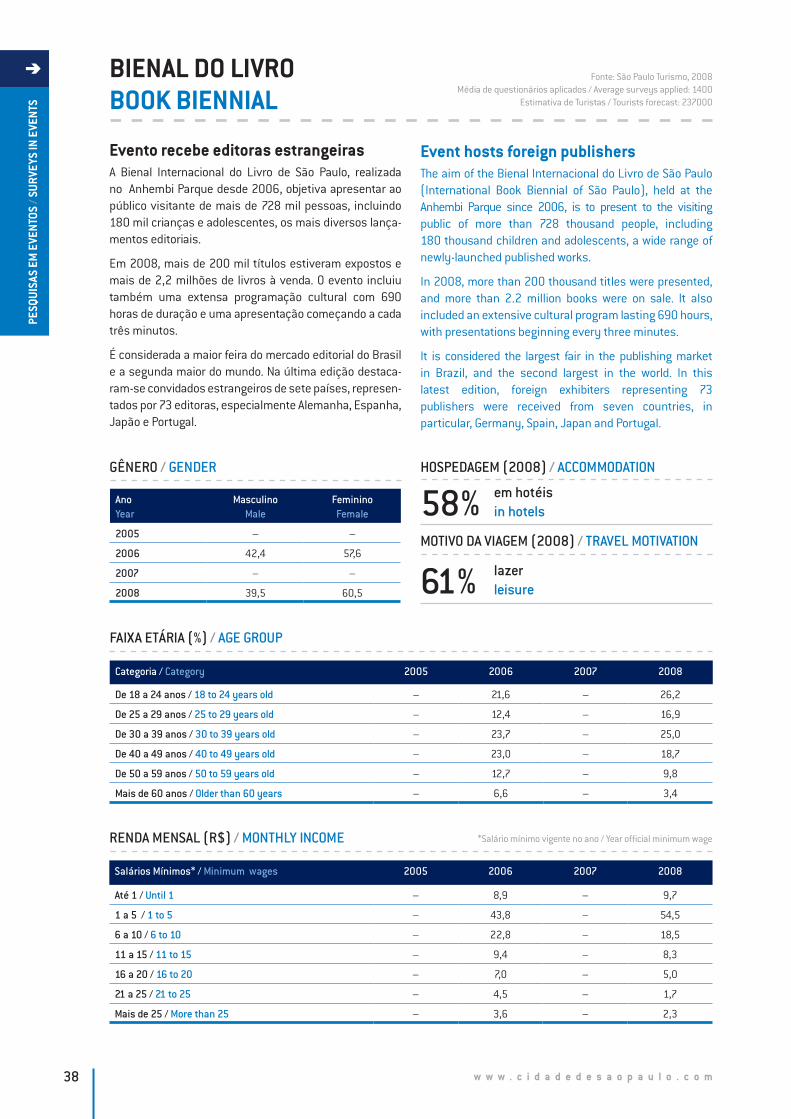
w w w . c i d a d e d e s a o p a u l o . c o m38
PESQ
UISA
S EM
EVE
NTOS
/ SU
RVEY
S IN
EVE
NTS
BIENAL DO LIVROBOOK BIENNIAL
Evento recebe editoras estrangeirasA Bienal Internacional do Livro de São Paulo, realizada no Anhembi Parque desde 2006, objetiva apresentar ao público visitante de mais de 728 mil pessoas, incluindo 180 mil crianças e adolescentes, os mais diversos lança-mentos editoriais.
Em 2008, mais de 200 mil títulos estiveram expostos e mais de 2,2 milhões de livros à venda. O evento incluiu também uma extensa programação cultural com 690 horas de duração e uma apresentação começando a cada três minutos.
É considerada a maior feira do mercado editorial do Brasil e a segunda maior do mundo. Na última edição destaca-ram-se convidados estrangeiros de sete países, represen-tados por 73 editoras, especialmente Alemanha, Espanha, Japão e Portugal.
Event hosts foreign publishersThe aim of the Bienal Internacional do Livro de São Paulo (International Book Biennial of São Paulo), held at the Anhembi Parque since 2006, is to present to the visiting public of more than 728 thousand people, including 180 thousand children and adolescents, a wide range of newly-launched published works.
In 2008, more than 200 thousand titles were presented, and more than 2.2 million books were on sale. It also included an extensive cultural program lasting 690 hours, with presentations beginning every three minutes.
It is considered the largest fair in the publishing market in Brazil, and the second largest in the world. In this latest edition, foreign exhibiters representing 73 publishers were received from seven countries, in particular, Germany, Spain, Japan and Portugal.
RENDA MENSAL (R$) / MONTHLY INCOME
Fonte: São Paulo Turismo, 2008Média de questionários aplicados / Average surveys applied: 1400
Estimativa de Turistas / Tourists forecast: 237000
Salários Mínimos* / Minimum wages 2005 2006 2007 2008
Até 1 / Until 1 – 8,9 – 9,7
1 a 5 / 1 to 5 – 43,8 – 54,5
6 a 10 / 6 to 10 – 22,8 – 18,5
11 a 15 / 11 to 15 – 9,4 – 8,3
16 a 20 / 16 to 20 – 7,0 – 5,0
21 a 25 / 21 to 25 – 4,5 – 1,7
Mais de 25 / More than 25 – 3,6 – 2,3
FAIXA ETÁRIA (%) / AGE GROUP
Categoria / Category 2005 2006 2007 2008
De 18 a 24 anos / 18 to 24 years old – 21,6 – 26,2
De 25 a 29 anos / 25 to 29 years old – 12,4 – 16,9
De 30 a 39 anos / 30 to 39 years old – 23,7 – 25,0
De 40 a 49 anos / 40 to 49 years old – 23,0 – 18,7
De 50 a 59 anos / 50 to 59 years old – 12,7 – 9,8
Mais de 60 anos / Older than 60 years – 6,6 – 3,4
GÊNERO / GENDER
AnoYear
MasculinoMale
FemininoFemale
2005 – –
2006 42,4 57,6
2007 – –
2008 39,5 60,5
HOSPEDAGEM (2008) / ACCOMMODATION
MOTIVO DA VIAGEM (2008) / TRAVEL MOTIVATION
58% em hotéisin hotels
61% lazerleisure
*Salário mínimo vigente no ano / Year official minimum wage
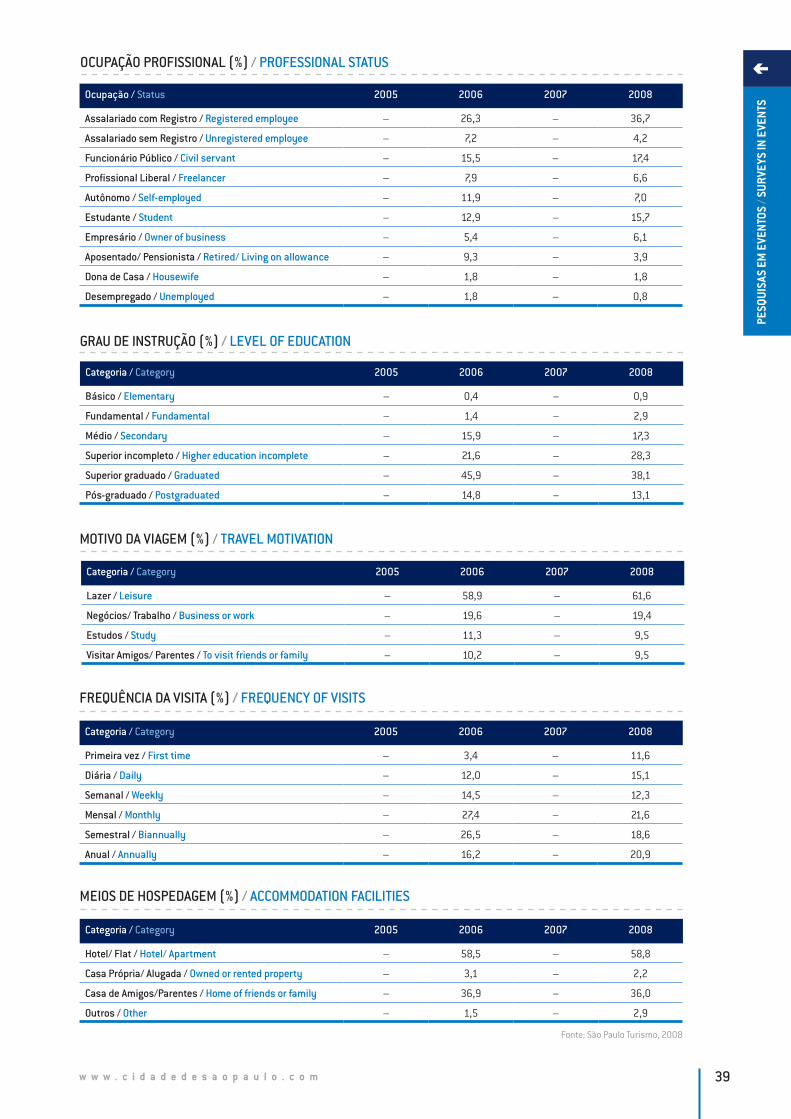
w w w . c i d a d e d e s a o p a u l o . c o m 39
PESQ
UISA
S EM
EVE
NTOS
/ SU
RVEY
S IN
EVE
NTS
OCUPAÇÃO PROFISSIONAL (%) / PROFESSIONAL STATUS
Ocupação / Status 2005 2006 2007 2008
Assalariado com Registro / Registered employee – 26,3 – 36,7
Assalariado sem Registro / Unregistered employee – 7,2 – 4,2
Funcionário Público / Civil servant – 15,5 – 17,4
Profissional Liberal / Freelancer – 7,9 – 6,6
Autônomo / Self-employed – 11,9 – 7,0
Estudante / Student – 12,9 – 15,7
Empresário / Owner of business – 5,4 – 6,1
Aposentado/ Pensionista / Retired/ Living on allowance – 9,3 – 3,9
Dona de Casa / Housewife – 1,8 – 1,8
Desempregado / Unemployed – 1,8 – 0,8
FREQUÊNCIA DA VISITA (%) / FREQUENCY OF VISITS
MEIOS DE HOSPEDAGEM (%) / ACCOMMODATION FACILITIES
Categoria / Category 2005 2006 2007 2008
Primeira vez / First time – 3,4 – 11,6
Diária / Daily – 12,0 – 15,1
Semanal / Weekly – 14,5 – 12,3
Mensal / Monthly – 27,4 – 21,6
Semestral / Biannually – 26,5 – 18,6
Anual / Annually – 16,2 – 20,9
Categoria / Category 2005 2006 2007 2008
Hotel/ Flat / Hotel/ Apartment – 58,5 – 58,8
Casa Própria/ Alugada / Owned or rented property – 3,1 – 2,2
Casa de Amigos/Parentes / Home of friends or family – 36,9 – 36,0
Outros / Other – 1,5 – 2,9
MOTIVO DA VIAGEM (%) / TRAVEL MOTIVATION
Categoria / Category 2005 2006 2007 2008
Lazer / Leisure – 58,9 – 61,6
Negócios/ Trabalho / Business or work – 19,6 – 19,4
Estudos / Study – 11,3 – 9,5
Visitar Amigos/ Parentes / To visit friends or family – 10,2 – 9,5
GRAU DE INSTRUÇÃO (%) / LEVEL OF EDUCATION
Categoria / Category 2005 2006 2007 2008
Básico / Elementary – 0,4 – 0,9
Fundamental / Fundamental – 1,4 – 2,9
Médio / Secondary – 15,9 – 17,3
Superior incompleto / Higher education incomplete – 21,6 – 28,3
Superior graduado / Graduated – 45,9 – 38,1
Pós-graduado / Postgraduated – 14,8 – 13,1
Fonte: São Paulo Turismo, 2008
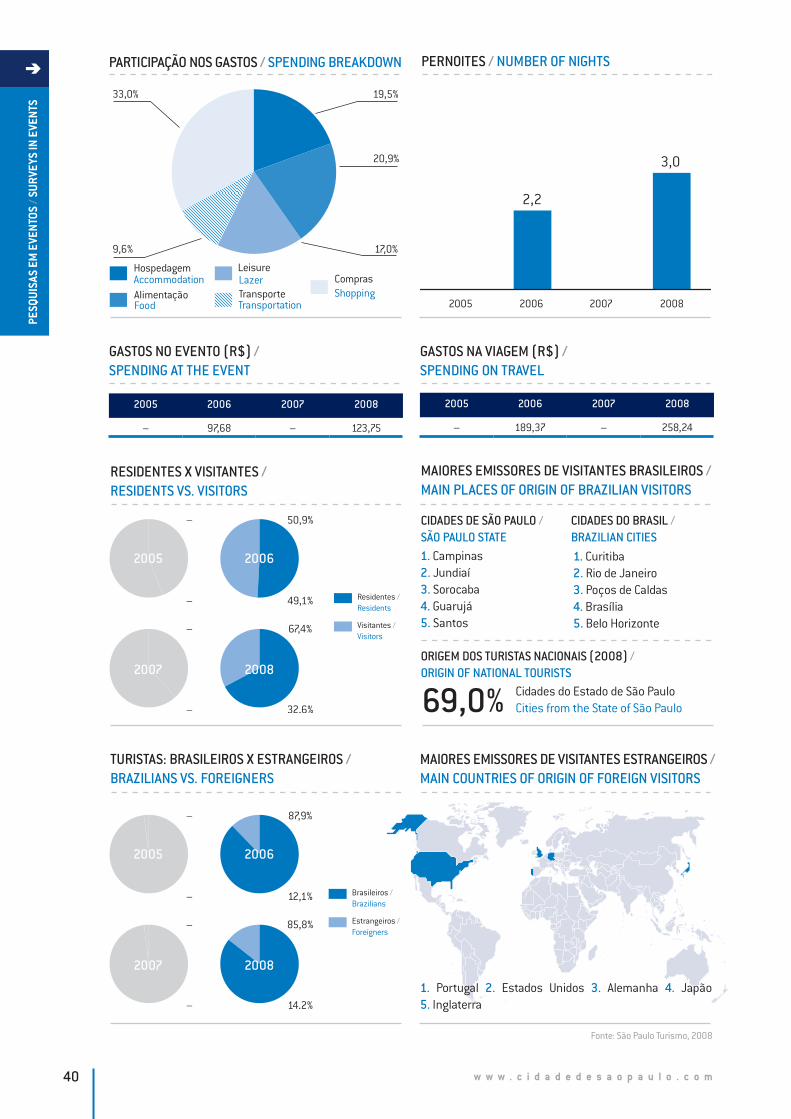
w w w . c i d a d e d e s a o p a u l o . c o m40
PESQ
UISA
S EM
EVE
NTOS
/ SU
RVEY
S IN
EVE
NTS
PARTICIPAÇÃO NOS GASTOS / SPENDING BREAKDOWN
33,0%
20,9%
9,6%
19,5%
17,0%
HospedagemAccommodationAlimentaçãoFood
ComprasShopping
LazerLeisure
TransporteTransportation
GASTOS NO EVENTO (R$) / SPENDING AT THE EVENT
RESIDENTES X VISITANTES / RESIDENTS VS. VISITORS
TURISTAS: BRASILEIROS X ESTRANGEIROS / BRAZILIANS VS. FOREIGNERS
MAIORES EMISSORES DE VISITANTES ESTRANGEIROS / MAIN COUNTRIES OF ORIGIN OF FOREIGN VISITORS
1. Portugal 2. Estados Unidos 3. Alemanha 4. Japão 5. Inglaterra
PERNOITES / NUMBER OF NIGHTS
2005 2006 20082007
3,0
2,2
2005 2006 2007 2008
– 97,68 – 123,75
2005 2006 2007 2008
– 189,37 – 258,24
Residentes / Residents
Visitantes / Visitors
2005 2006
20082007
–
–
–
–
32,6%
67,4%
49,1%
50,9%
Brasileiros / Brazilians
Estrangeiros / Foreigners
2005 2006
20082007
–
–
–
–
14,2%
85,8%
12,1%
87,9%
GASTOS NA VIAGEM (R$) / SPENDING ON TRAVEL
MAIORES EMISSORES DE VISITANTES BRASILEIROS / MAIN PLACES OF ORIGIN OF BRAZILIAN VISITORS
CIDADES DE SÃO PAULO /SÃO PAULO STATE
CIDADES DO BRASIL /BRAZILIAN CITIES
69,0% Cidades do Estado de São PauloCities from the State of São Paulo
ORIGEM DOS TURISTAS NACIONAIS (2008) / ORIGIN OF NATIONAL TOURISTS
1. Campinas2. Jundiaí3. Sorocaba4. Guarujá5. Santos
1. Curitiba2. Rio de Janeiro3. Poços de Caldas4. Brasília5. Belo Horizonte
Fonte: São Paulo Turismo, 2008
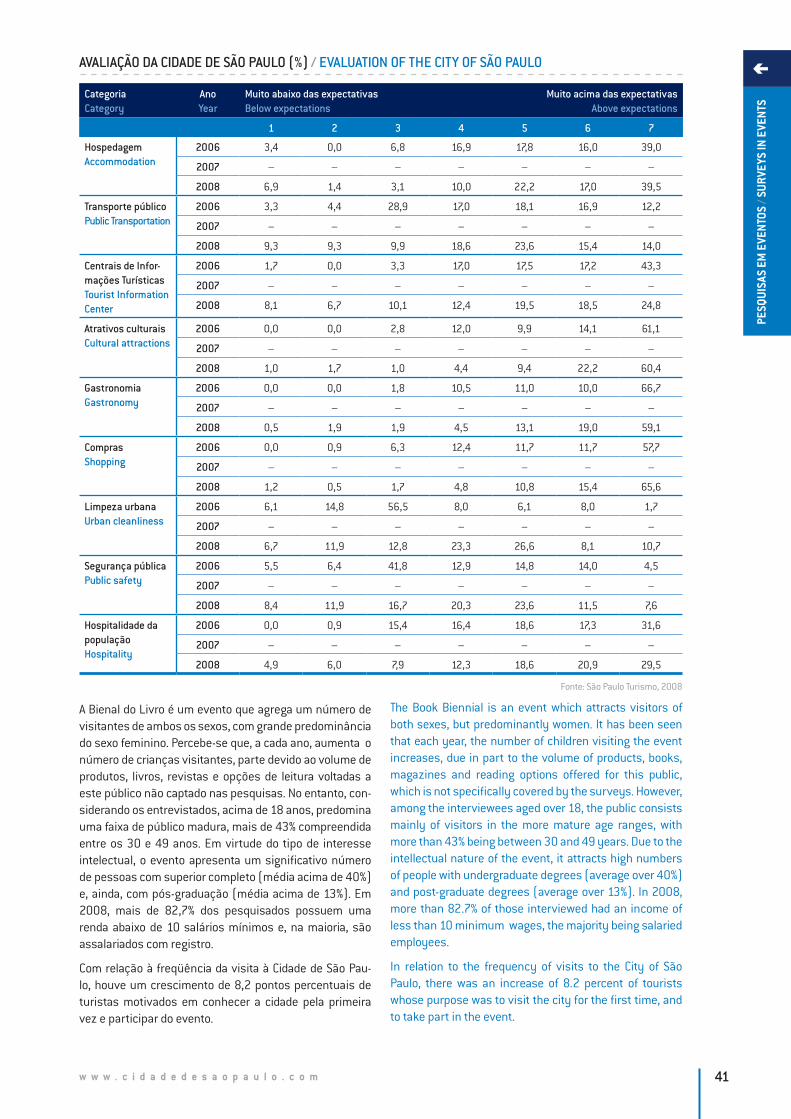
w w w . c i d a d e d e s a o p a u l o . c o m 41
PESQ
UISA
S EM
EVE
NTOS
/ SU
RVEY
S IN
EVE
NTS
AVALIAÇÃO DA CIDADE DE SÃO PAULO (%) / EVALUATION OF THE CITY OF SÃO PAULO
A Bienal do Livro é um evento que agrega um número de visitantes de ambos os sexos, com grande predominância do sexo feminino. Percebe-se que, a cada ano, aumenta o número de crianças visitantes, parte devido ao volume de produtos, livros, revistas e opções de leitura voltadas a este público não captado nas pesquisas. No entanto, con-siderando os entrevistados, acima de 18 anos, predomina uma faixa de público madura, mais de 43% compreendida entre os 30 e 49 anos. Em virtude do tipo de interesse intelectual, o evento apresenta um significativo número de pessoas com superior completo (média acima de 40%) e, ainda, com pós-graduação (média acima de 13%). Em 2008, mais de 82,7% dos pesquisados possuem uma renda abaixo de 10 salários mínimos e, na maioria, são assalariados com registro.
Com relação à freqüência da visita à Cidade de São Pau-lo, houve um crescimento de 8,2 pontos percentuais de turistas motivados em conhecer a cidade pela primeira vez e participar do evento.
The Book Biennial is an event which attracts visitors of both sexes, but predominantly women. It has been seen that each year, the number of children visiting the event increases, due in part to the volume of products, books, magazines and reading options offered for this public, which is not specifically covered by the surveys. However, among the interviewees aged over 18, the public consists mainly of visitors in the more mature age ranges, with more than 43% being between 30 and 49 years. Due to the intellectual nature of the event, it attracts high numbers of people with undergraduate degrees (average over 40%) and post-graduate degrees (average over 13%). In 2008, more than 82.7% of those interviewed had an income of less than 10 minimum wages, the majority being salaried employees.
In relation to the frequency of visits to the City of São Paulo, there was an increase of 8.2 percent of tourists whose purpose was to visit the city for the first time, and to take part in the event.
CategoriaCategory
AnoYear
Muito abaixo das expectativasBelow expectations
Muito acima das expectativasAbove expectations
1 2 3 4 5 6 7
HospedagemAccommodation
2006 3,4 0,0 6,8 16,9 17,8 16,0 39,0
2007 – – – – – – –
2008 6,9 1,4 3,1 10,0 22,2 17,0 39,5
Transporte públicoPublic Transportation
2006 3,3 4,4 28,9 17,0 18,1 16,9 12,2
2007 – – – – – – –
2008 9,3 9,3 9,9 18,6 23,6 15,4 14,0
Centrais de Infor-mações TurísticasTourist Information Center
2006 1,7 0,0 3,3 17,0 17,5 17,2 43,3
2007 – – – – – – –
2008 8,1 6,7 10,1 12,4 19,5 18,5 24,8
Atrativos culturaisCultural attractions
2006 0,0 0,0 2,8 12,0 9,9 14,1 61,1
2007 – – – – – – –
2008 1,0 1,7 1,0 4,4 9,4 22,2 60,4
GastronomiaGastronomy
2006 0,0 0,0 1,8 10,5 11,0 10,0 66,7
2007 – – – – – – –
2008 0,5 1,9 1,9 4,5 13,1 19,0 59,1
ComprasShopping
2006 0,0 0,9 6,3 12,4 11,7 11,7 57,7
2007 – – – – – – –
2008 1,2 0,5 1,7 4,8 10,8 15,4 65,6
Limpeza urbanaUrban cleanliness
2006 6,1 14,8 56,5 8,0 6,1 8,0 1,7
2007 – – – – – – –
2008 6,7 11,9 12,8 23,3 26,6 8,1 10,7
Segurança públicaPublic safety
2006 5,5 6,4 41,8 12,9 14,8 14,0 4,5
2007 – – – – – – –
2008 8,4 11,9 16,7 20,3 23,6 11,5 7,6
Hospitalidade da populaçãoHospitality
2006 0,0 0,9 15,4 16,4 18,6 17,3 31,6
2007 – – – – – – –
2008 4,9 6,0 7,9 12,3 18,6 20,9 29,5
Fonte: São Paulo Turismo, 2008
w w w . c i d a d e d e s a o p a u l o . c o m42
PESQ
UISA
S EM
EVE
NTOS
/ SU
RVEY
S IN
EVE
NTS
Dos turistas, em média, 58% se hospedam em hotéis e flats da Cidade de São Paulo e uma parcela de 36% aloja-se em casa de amigos e parentes. Estes visitantes gastaram na viagem, em 2008, um montante de R$ 258,24 com pre-dominância em compras (33,0%), alimentação (20,9%), hospedagem (19,5%), lazer (17,0%) e transporte (9,6%).
Na Bienal de 2008, comparada com 2006, houve um au-mento de 26,7% nos gastos efetuados durante o evento. Os gastos na viagem apontados pelo estudo não incluem as compras de livros realizadas no evento. Houve também um aumento na permanência dos visitantes na cidade, de 2,2 para 3,0 pernoites.
Observa-se que há uma grande parcela de residentes no evento, com redução no número de visitantes em 2008 (32,6%). Dentre os maiores emissores de visitantes de cidades do Estado de São Paulo, destacam-se Campinas, Jundiaí, Sorocaba, Guarujá e Santos. E de cidades do Brasil, observa-se uma procura por turistas de Curitiba, Rio de Janeiro, Poços de Caldas, Brasília e Belo Horizonte.
Nota-se uma predominância do público de turistas bra-sileiros, embora seja constatada a presença de visitantes estrangeiros, da ordem de 14%, procedentes de Portugal, Estados Unidos, Alemanha, Japão e Inglaterra.
Em termos da expectativa dos avaliados sobre os equi pamentos e serviços de apoio ao turismo na cidade, des-tacam-se com excelência (item 7) os itens de compras, atrativos culturais e gastronomia, com 60% de aprovação máxima. Em 2008, houve uma queda na avaliação das categorias hospedagem, Centrais de Informações Turísti-cas e hospitalidade da população. Destaca-se um aumen-to de 9% em relação à satisfação quanto à limpeza urbana, bem como 1,8% para o transporte público e 3,1% para a segurança pública.
Of the tourists, an average of 58% stayed at hotels and apartments in the City of São Paulo, while 36% stayed with friends or relatives. In 2008, these visitors spent R$ 258,24 during their trip, mainly on shopping (33.0%), food (20.9%), accommodation (19.5%), leisure (17.0%) and transportation (9.6%).
At the Book Biennial 2008, compared with 2006, there was an increase of 26.7% on spending during the event. Expenditure during the trip, as indicated by the study, does not include the purchase of books during the event. There was also an increase in the length of time visitors stayed in the city, from 2.2 to 3.0 nights.
It was noted that a high proportion of visitors to the event were residents of the city, with a reduction in the number of visitors from outside the city in 2008 (32.6%) Within the State of São Paulo, the main places of origin of visitors were Campinas, Jundiaí, Sorocaba, Guarujá and Santos. For the other regions of Brazil, visitors were mainly from Curitiba, Rio de Janeiro, Poços de Caldas, Brasília and Belo Horizonte.
A predominance of Brazilian tourists was registered among the public at the event, although there was also a fair number of foreign visitors, around 14%, from Portugal, the United States, Germany, Japan and England.
In terms of expectations of those interviewed, in rela-tion to the tourism facilities and support services in the city, the main highlights (item 7) were shopping, cultural attractions, and gastronomy, with 60% of the highest score (i.e. above expectations). In 2008, there was a drop in the evaluation of the categories accommodation, Tourist Information Centers and hospitality of the population. An increase of 9% is highlighted, in relation to satisfaction with the urban cleanliness, as well as a 1.8% increase for satisfaction with public transportation, and 3.1% for public safety.
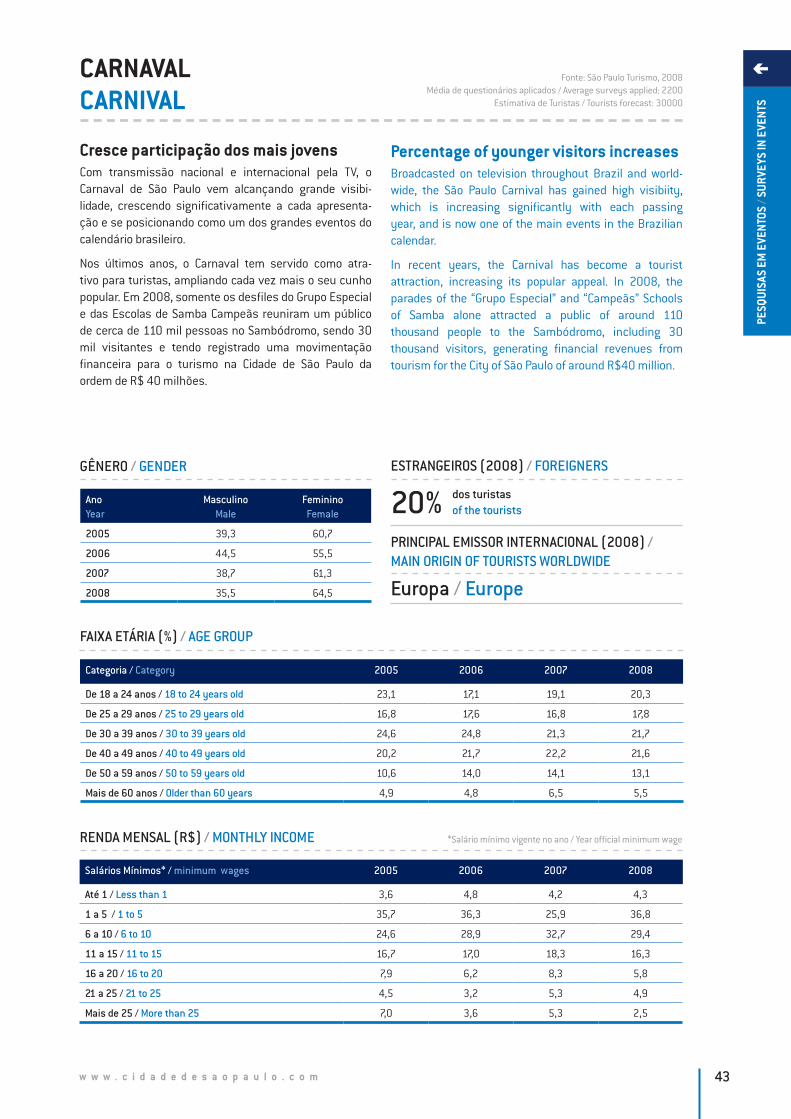
w w w . c i d a d e d e s a o p a u l o . c o m 43
PESQ
UISA
S EM
EVE
NTOS
/ SU
RVEY
S IN
EVE
NTS
CARNAVALCARNIVAL
Cresce participação dos mais jovensCom transmissão nacional e internacional pela TV, o Carnaval de São Paulo vem alcançando grande visibi-lidade, crescendo significativamente a cada apresenta-ção e se posicionando como um dos grandes eventos do calendário brasileiro.
Nos últimos anos, o Carnaval tem servido como atra-tivo para turistas, ampliando cada vez mais o seu cunho popular. Em 2008, somente os desfiles do Grupo Especial e das Escolas de Samba Campeãs reuniram um público de cerca de 110 mil pessoas no Sambódromo, sendo 30 mil visitantes e tendo registrado uma movimentação financeira para o turismo na Cidade de São Paulo da ordem de R$ 40 milhões.
Percentage of younger visitors increasesBroadcasted on television throughout Brazil and world-wide, the São Paulo Carnival has gained high visibiity, which is increasing significantly with each passing year, and is now one of the main events in the Brazilian calendar.
In recent years, the Carnival has become a tourist attraction, increasing its popular appeal. In 2008, the parades of the “Grupo Especial” and “Campeãs” Schools of Samba alone attracted a public of around 110 thousand people to the Sambódromo, including 30 thousand visitors, generating financial revenues from tourism for the City of São Paulo of around R$40 million.
RENDA MENSAL (R$) / MONTHLY INCOME
Fonte: São Paulo Turismo, 2008Média de questionários aplicados / Average surveys applied: 2200
Estimativa de Turistas / Tourists forecast: 30000
Salários Mínimos* / minimum wages 2005 2006 2007 2008
Até 1 / Less than 1 3,6 4,8 4,2 4,3
1 a 5 / 1 to 5 35,7 36,3 25,9 36,8
6 a 10 / 6 to 10 24,6 28,9 32,7 29,4
11 a 15 / 11 to 15 16,7 17,0 18,3 16,3
16 a 20 / 16 to 20 7,9 6,2 8,3 5,8
21 a 25 / 21 to 25 4,5 3,2 5,3 4,9
Mais de 25 / More than 25 7,0 3,6 5,3 2,5
FAIXA ETÁRIA (%) / AGE GROUP
Categoria / Category 2005 2006 2007 2008
De 18 a 24 anos / 18 to 24 years old 23,1 17,1 19,1 20,3
De 25 a 29 anos / 25 to 29 years old 16,8 17,6 16,8 17,8
De 30 a 39 anos / 30 to 39 years old 24,6 24,8 21,3 21,7
De 40 a 49 anos / 40 to 49 years old 20,2 21,7 22,2 21,6
De 50 a 59 anos / 50 to 59 years old 10,6 14,0 14,1 13,1
Mais de 60 anos / Older than 60 years 4,9 4,8 6,5 5,5
GÊNERO / GENDER
AnoYear
MasculinoMale
FemininoFemale
2005 39,3 60,7
2006 44,5 55,5
2007 38,7 61,3
2008 35,5 64,5
ESTRANGEIROS (2008) / FOREIGNERS
PRINCIPAL EMISSOR INTERNACIONAL (2008) / MAIN ORIGIN OF TOURISTS WORLDWIDE
20% dos turistasof the tourists
Europa / Europe
*Salário mínimo vigente no ano / Year official minimum wage
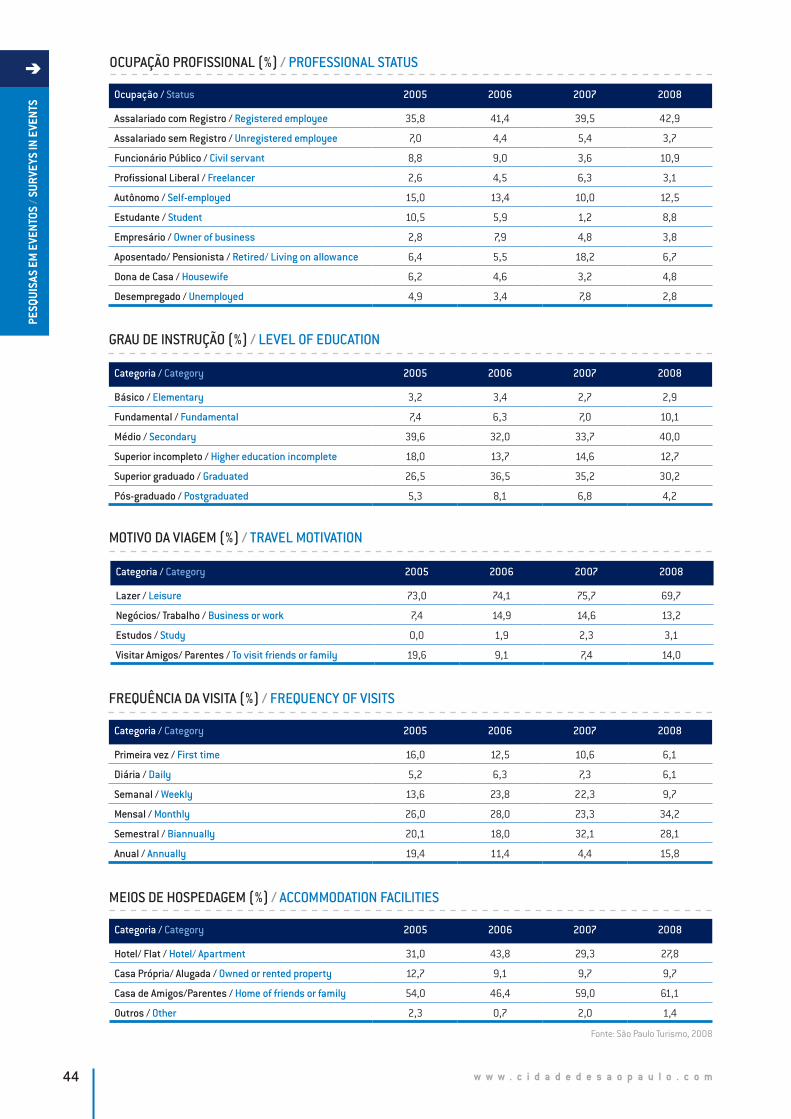
w w w . c i d a d e d e s a o p a u l o . c o m44
PESQ
UISA
S EM
EVE
NTOS
/ SU
RVEY
S IN
EVE
NTS
OCUPAÇÃO PROFISSIONAL (%) / PROFESSIONAL STATUS
Ocupação / Status 2005 2006 2007 2008
Assalariado com Registro / Registered employee 35,8 41,4 39,5 42,9
Assalariado sem Registro / Unregistered employee 7,0 4,4 5,4 3,7
Funcionário Público / Civil servant 8,8 9,0 3,6 10,9
Profissional Liberal / Freelancer 2,6 4,5 6,3 3,1
Autônomo / Self-employed 15,0 13,4 10,0 12,5
Estudante / Student 10,5 5,9 1,2 8,8
Empresário / Owner of business 2,8 7,9 4,8 3,8
Aposentado/ Pensionista / Retired/ Living on allowance 6,4 5,5 18,2 6,7
Dona de Casa / Housewife 6,2 4,6 3,2 4,8
Desempregado / Unemployed 4,9 3,4 7,8 2,8
FREQUÊNCIA DA VISITA (%) / FREQUENCY OF VISITS
MEIOS DE HOSPEDAGEM (%) / ACCOMMODATION FACILITIES
Categoria / Category 2005 2006 2007 2008
Primeira vez / First time 16,0 12,5 10,6 6,1
Diária / Daily 5,2 6,3 7,3 6,1
Semanal / Weekly 13,6 23,8 22,3 9,7
Mensal / Monthly 26,0 28,0 23,3 34,2
Semestral / Biannually 20,1 18,0 32,1 28,1
Anual / Annually 19,4 11,4 4,4 15,8
Categoria / Category 2005 2006 2007 2008
Hotel/ Flat / Hotel/ Apartment 31,0 43,8 29,3 27,8
Casa Própria/ Alugada / Owned or rented property 12,7 9,1 9,7 9,7
Casa de Amigos/Parentes / Home of friends or family 54,0 46,4 59,0 61,1
Outros / Other 2,3 0,7 2,0 1,4
MOTIVO DA VIAGEM (%) / TRAVEL MOTIVATION
Categoria / Category 2005 2006 2007 2008
Lazer / Leisure 73,0 74,1 75,7 69,7
Negócios/ Trabalho / Business or work 7,4 14,9 14,6 13,2
Estudos / Study 0,0 1,9 2,3 3,1
Visitar Amigos/ Parentes / To visit friends or family 19,6 9,1 7,4 14,0
GRAU DE INSTRUÇÃO (%) / LEVEL OF EDUCATION
Categoria / Category 2005 2006 2007 2008
Básico / Elementary 3,2 3,4 2,7 2,9
Fundamental / Fundamental 7,4 6,3 7,0 10,1
Médio / Secondary 39,6 32,0 33,7 40,0
Superior incompleto / Higher education incomplete 18,0 13,7 14,6 12,7
Superior graduado / Graduated 26,5 36,5 35,2 30,2
Pós-graduado / Postgraduated 5,3 8,1 6,8 4,2
Fonte: São Paulo Turismo, 2008

w w w . c i d a d e d e s a o p a u l o . c o m 45
PESQ
UISA
S EM
EVE
NTOS
/ SU
RVEY
S IN
EVE
NTS
PARTICIPAÇÃO NOS GASTOS / SPENDING BREAKDOWN
37,3%
18,7%
8,8%
15,0%
20,2%
HospedagemAccommodationAlimentaçãoFood
ComprasShopping
LazerLeisure
TransporteTransportation
GASTOS DOS ESTRANGEIROS (US$) / SPENDING BY FOREIGNERS
RESIDENTES X VISITANTES / RESIDENTS VS. VISITORS
MAIORES EMISSORES DE VISITANTES BRASILEIROS / MAIN PLACES OF ORIGIN OF BRAZILIAN TOURISTS
TURISTAS: BRASILEIROS X ESTRANGEIROS / TOURISTS: BRAZILIANS VS. FOREIGNERS
MAIORES EMISSORES DE VISITANTES ESTRANGEIROS / MAIN COUNTRIES OF ORIGIN OF FOREIGN VISITORS
1. Inglaterra 2. Alemanha 3. Itália 4. Colômbia 5. México
2005 2006 20082007
6,45,8
6,7 6,8
2005 2006 2007 2008
1023.97 1061.88 1141.25 1041.27
2005 2006 2007 2008
1077,87 1147,98 1267,95 1388,37
Residentes / Residents
Visitantes / Visitors
2005 2006
20082007
24,8%
75,2%
26,2%
73,8%
28,5%
71,5%
25,6%
74,4%
Brasileiros / Brazilians
Estrangeiros / Foreigners
2005 2006
20082007
19,8%
80,2%
19,4%
80,6%
20,8%
79,2%
25,6%
74,4%
GASTOS DOS BRASILEIROS (R$) / SPENDING BY BRAZILIANS
PERNOITES / NUMBER OF NIGHTS
1. Campinas2. Mogi das Cruzes3. Santos4. São Roque5. Jundiaí
1. Curitiba 2. Maceió3. Porto Alegre4. Recife5. Salvador
CIDADES DE SÃO PAULO /SÃO PAULO STATE
CIDADES DO BRASIL /BRAZILIAN CITIES
80,1% Cidades do Estado de São PauloCities from the State of São Paulo
ORIGEM DOS TURISTAS NACIONAIS (2008) / ORIGIN OF NATIONAL TOURISTS
Fonte: São Paulo Turismo, 2008

w w w . c i d a d e d e s a o p a u l o . c o m46
PESQ
UISA
S EM
EVE
NTOS
/ SU
RVEY
S IN
EVE
NTS Categoria
CategoryAnoYear
Muito abaixo das expectativasBelow expectations
Muito acima das expectativasAbove expectations
1 2 3 4 5 6 7
HospedagemAccommodation
2006 – – – – – – –
2007 0,6 0,2 1,8 7,7 9,5 37,6 42,6
2008 0,0 2,6 2,6 1,3 20,5 16,7 56,3
Transporte públicoPublic Transportation
2006 – – – – – – –
2007 8,0 7,3 9,3 13,9 24,1 15,3 22,1
2008 5,0 3,0 4,0 10,0 18,0 24,0 36,0
Centrais de Infor-mações TurísticasTourist Information Center
2006 – – – – – – –
2007 7,0 5,6 9,5 12,7 23,9 16,6 24,7
2008 3,1 1,5 4,6 16,9 18,5 16,9 38,5
Atrativos culturaisCultural attractions
2006 – – – – – – –
2007 0,7 0,4 0,9 4,4 11,2 19,3 63,0
2008 0,0 1,7 0,0 1,7 9,3 22,0 65,3
GastronomiaGastronomy
2006 – – – – – – –
2007 0,0 0,6 0,0 1,3 7,2 10,2 80,7
2008 0,8 0,0 0,8 3,3 7,4 18,0 69,7
ComprasShopping
2006 – – – – – – –
2007 0,0 0,2 0,4 1,5 5,5 12,5 79,9
2008 0,0 0,8 0,8 1,6 7,4 11,5 77,9
Limpeza urbanaUrban cleanliness
2006 – – – – – – –
2007 9,4 9,6 13,6 21,6 27,3 12,2 6,3
2008 4,7 3,9 8,7 16,5 37,0 13,4 15,7
Segurança públicaPublic Safety
2006 – – – – – – –
2007 13,6 10,1 15,2 20,8 20,2 10,5 9,7
2008 5,6 4,8 6,5 15,3 32,3 18,5 16,9
Hospitalidade da populaçãoHospitality
2006 – – – – – – –
2007 3,8 3,6 5,7 7,6 16,5 19,0 43,9
2008 0,8 2,4 4,0 6,4 15,2 15,2 56,0
AVALIAÇÃO DA CIDADE DE SÃO PAULO (%) / EVALUATION OF THE CITY OF SÃO PAULO
Durante o Carnaval observa-se a predominância da partici-pação do gênero feminino, acima de 60,0% em todo período analisado, sendo que a média da faixa etária que participa do evento é compreendida pelo público de 30 a 49 anos.
A instrução do público envolvido está distribuída em dois grandes blocos: o de nível médio, e o de curso superior completo, representativa de um volume superior a 70,0% no ano de 2008.
Embora haja predominância de ganhos mensais na faixa entre um e dez salários mínimos (70,5%), em 2008, pode-se destacar uma participação considerável de público com renda acima de dez salários mínimos, sendo 2,5% com valores acima do patamar de 25 salários mínimos. Na ocupação profissional, destacam-se os assalariados com registro, seguidos pelos autônomos e funcionários públicos.
O gasto na viagem dos visitantes brasileiros duran-te o Carnaval foi, em 2008, de R$ 1388,37 para 6,8
During the Carnival, a predominance of female visitors is noted - over 60.0% throughout the period analyzed, while the average age range of those taking part in the event is between 30 and 49 years.
The level of education of the public is divided into two main blocks: those with secondary education and those with higher education, representing a volume of over 70.0% in 2008.
Although there is a predominance of monthly income of between one and ten minimum wages (70.5%), in 2008, a considerable participation of public with incomes of over ten minimum wages was seen, with 2.5% of the event’s visitors earning more than 25 minimum wages. In terms of professional occupation, a high proportion was com-prised of salaried employees, followed by self-employed people and civil servants.
The amount spent during the Carnival, for the Brazilian visitors, in 2008, was R$ 1388.37, with an average stay of
Fonte: São Paulo Turismo, 2008
w w w . c i d a d e d e s a o p a u l o . c o m 47
PESQ
UISA
S EM
EVE
NTOS
/ SU
RVEY
S IN
EVE
NTS
pernoites. Entre seus principais gastos relacionam-se com maior participação em compras (37,3%), lazer (20,2%) e hospedagem (15,0%).
O motivo da viagem é prioritariamente lazer e assistir ao desfile. Em 2008, observa-se esta predominância (69,7%), muito embora tenha sido verificado um relativo aumento na visitação aos amigos e parentes (14,0%). A freqüência da visita é a mensal, seguida pela semestral.
De 2005 a 2008, verifica-se um decréscimo dos visitan-tes que chegam pela primeira vez à Cidade de São Paulo. Os meios de hospedagem mais utilizados são as casas de amigos e parentes (61,1%), superando a utilização de hotéis (27,8%). Há predominância do público de residen-tes no evento (71,5%) com um relativo aumento de visi-tantes que, em 2008, atinge um patamar de 28,5%.
Destacam-se como os cinco maiores emissores de visi-tantes para o Carnaval da Cidade de São Paulo as cidades de Campinas, Mogi das Cruzes, Santos, São Roque e Jun-diaí. Por sua vez, Curitiba, Maceió, Porto Alegre, Recife e Salvador são apontadas como as cidades brasileiras que mais enviaram visitantes para assistir ao Carnaval de 2008. Merecem destaque nesta análise a presença de cidades tradicionais carnavalescas, como Maceió, Recife e Salvador serem representativas no evento paulistano. Notadamente o número de brasileiros participando do evento é maioria (80%); muito embora, observa-se uma crescente evolução no número de estrangeiros (20%), para o período analisado.
A avaliação dos principais equipamentos e serviços da Cidade de São Paulo, no período de 2007 a 2008 (não houve avaliação para este quesito em 2006), demonstra uma elevada satisfação no que tange aos itens: hospeda-gem, atrativos culturais, gastronomia, compras e hospi-talidade da população. As expectativas assinaladas para os demais itens: centrais de informação, transporte, limpeza, segurança pública, foram consideradas boas e regulares - sendo os três últimos mais críticos em relação ao quadro geral, embora com melhora de desempenho no ano de 2008.
6.8 nights. The main spending related to shopping (37.3%), leisure (20.2%) and accommodation (15.0%).
The purpose of the trip was primarily leisure and watching the parade (69.7%), although there was also an increase in visits to relatives and friends (14.0%). The frequency of visits was monthly, followed by weekly.
From 2005 to 2008, a decrease was seen in the num-ber of visitors arriving in São Paulo for the first time. The accommodation facilities most frequently used were homes of friends or relatives (61.1%), which was higher than the use of hotels (27.8%). A high proportion of the public at the event were residents of the city (71.5%), although the number of visitors also increased, to 28.5% in 2008.
Of the visitors to the São Paulo Carnival 2008 coming from within the State of São Paulo, the majority were from Campinas, Mogi das Cruzes, Santos, São Roque and Jundi-aí. Meanwhile, for other regions of Brazil, Curitiba, Maceió, Porto Alegre, Recife and Salvador were the main places of origin of the spectators. Also worth mentioning in this analysis is the presence of people from the traditional carnival cities, like Maceió, Recife and Salvador, all of which were represented at the São Paulo event. Notably, the number of Brazilians taking part in the event was higher (80%). However, a growing proportion of foreigners (20%) was registered for the period analyzed.
The visitors’ evaluation of the main facilities and services in the City of São Paulo, in the period 2007 to 2008 (this question was not evaluated in 2006), demonstrates a high satisfaction in relation to the items: accommo- dation, cultural attractions, gastronomy, shopping and hospita-lity of the population. The scores given to the remaining items: Tourist Information Centers, transporta-tion, cleanliness, and public safety, were considered good to regular, the last three being the most critical in relation to the overall picture, although their performance has improved in 2008.
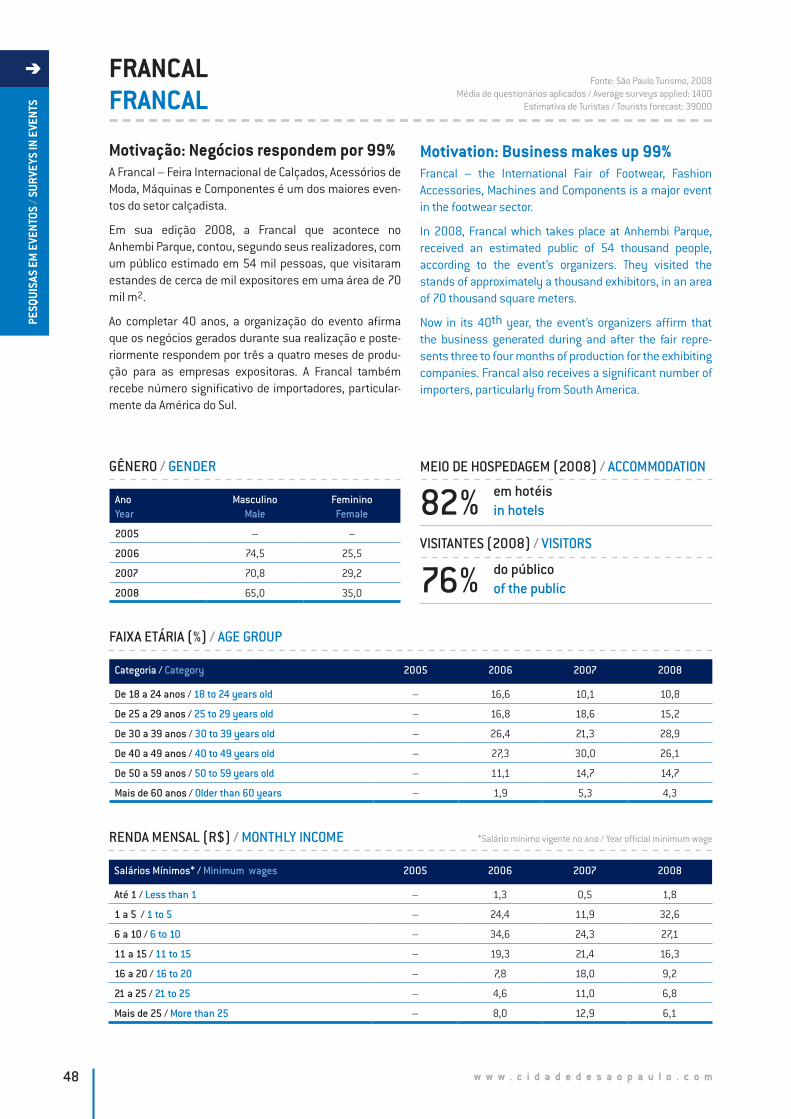
w w w . c i d a d e d e s a o p a u l o . c o m48
PESQ
UISA
S EM
EVE
NTOS
/ SU
RVEY
S IN
EVE
NTS
FRANCALFRANCAL
Motivação: Negócios respondem por 99% A Francal – Feira Internacional de Calçados, Acessórios de Moda, Máquinas e Componentes é um dos maiores even-tos do setor calçadista.
Em sua edição 2008, a Francal que acontece no Anhembi Parque, contou, segundo seus realizadores, com um público estimado em 54 mil pessoas, que visitaram estandes de cerca de mil expositores em uma área de 70 mil m2.
Ao completar 40 anos, a organização do evento afirma que os negócios gerados durante sua realização e poste- riormente respondem por três a quatro meses de produ-ção para as empresas expositoras. A Francal também recebe número significativo de importadores, particular-mente da América do Sul.
Motivation: Business makes up 99% Francal – the International Fair of Footwear, Fashion Accessories, Machines and Components is a major event in the footwear sector.
In 2008, Francal which takes place at Anhembi Parque, received an estimated public of 54 thousand people, according to the event’s organizers. They visited the stands of approximately a thousand exhibitors, in an area of 70 thousand square meters.
Now in its 40th year, the event’s organizers affirm that the business generated during and after the fair repre-sents three to four months of production for the exhibiting companies. Francal also receives a significant number of importers, particularly from South America.
RENDA MENSAL (R$) / MONTHLY INCOME
Fonte: São Paulo Turismo, 2008Média de questionários aplicados / Average surveys applied: 1400
Estimativa de Turistas / Tourists forecast: 39000
Salários Mínimos* / Minimum wages 2005 2006 2007 2008
Até 1 / Less than 1 – 1,3 0,5 1,8
1 a 5 / 1 to 5 – 24,4 11,9 32,6
6 a 10 / 6 to 10 – 34,6 24,3 27,1
11 a 15 / 11 to 15 – 19,3 21,4 16,3
16 a 20 / 16 to 20 – 7,8 18,0 9,2
21 a 25 / 21 to 25 – 4,6 11,0 6,8
Mais de 25 / More than 25 – 8,0 12,9 6,1
FAIXA ETÁRIA (%) / AGE GROUP
Categoria / Category 2005 2006 2007 2008
De 18 a 24 anos / 18 to 24 years old – 16,6 10,1 10,8
De 25 a 29 anos / 25 to 29 years old – 16,8 18,6 15,2
De 30 a 39 anos / 30 to 39 years old – 26,4 21,3 28,9
De 40 a 49 anos / 40 to 49 years old – 27,3 30,0 26,1
De 50 a 59 anos / 50 to 59 years old – 11,1 14,7 14,7
Mais de 60 anos / Older than 60 years – 1,9 5,3 4,3
GÊNERO / GENDER
AnoYear
MasculinoMale
FemininoFemale
2005 – –
2006 74,5 25,5
2007 70,8 29,2
2008 65,0 35,0
MEIO DE HOSPEDAGEM (2008) / ACCOMMODATION
VISITANTES (2008) / VISITORS
82%
76%
em hotéisin hotels
do públicoof the public
*Salário mínimo vigente no ano / Year official minimum wage
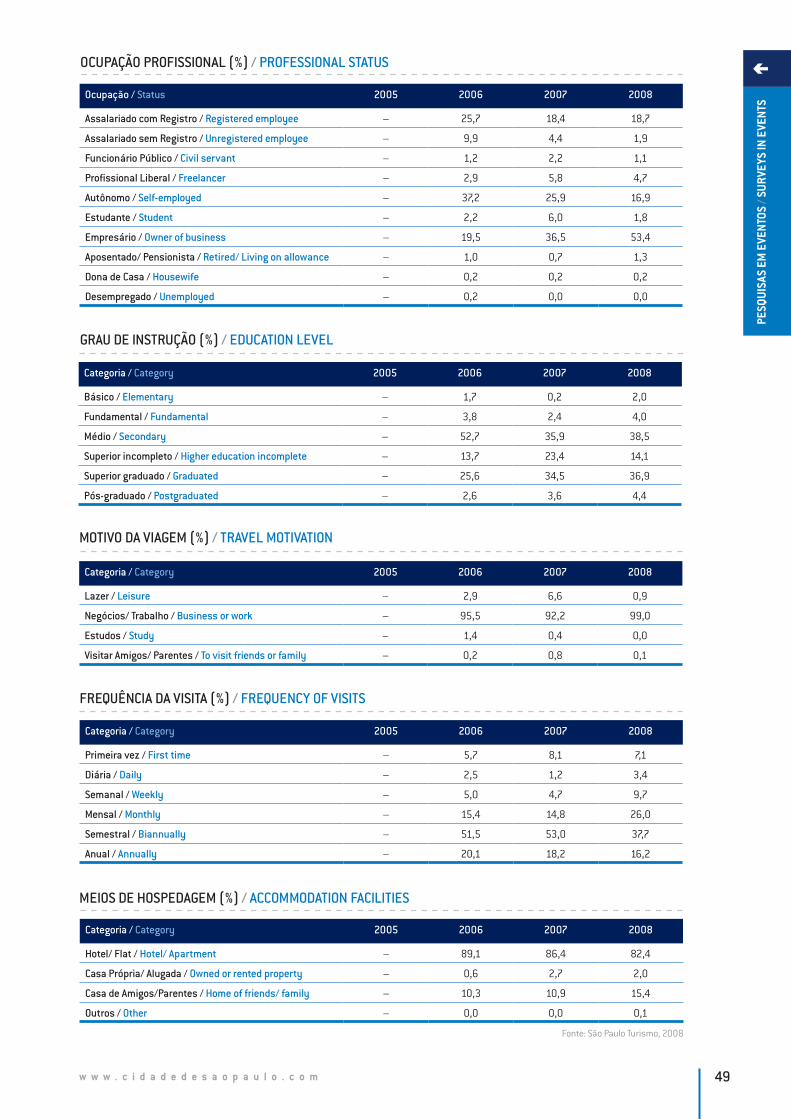
w w w . c i d a d e d e s a o p a u l o . c o m 49
PESQ
UISA
S EM
EVE
NTOS
/ SU
RVEY
S IN
EVE
NTS
OCUPAÇÃO PROFISSIONAL (%) / PROFESSIONAL STATUS
Ocupação / Status 2005 2006 2007 2008
Assalariado com Registro / Registered employee – 25,7 18,4 18,7
Assalariado sem Registro / Unregistered employee – 9,9 4,4 1,9
Funcionário Público / Civil servant – 1,2 2,2 1,1
Profissional Liberal / Freelancer – 2,9 5,8 4,7
Autônomo / Self-employed – 37,2 25,9 16,9
Estudante / Student – 2,2 6,0 1,8
Empresário / Owner of business – 19,5 36,5 53,4
Aposentado/ Pensionista / Retired/ Living on allowance – 1,0 0,7 1,3
Dona de Casa / Housewife – 0,2 0,2 0,2
Desempregado / Unemployed – 0,2 0,0 0,0
FREQUÊNCIA DA VISITA (%) / FREQUENCY OF VISITS
MEIOS DE HOSPEDAGEM (%) / ACCOMMODATION FACILITIES
Categoria / Category 2005 2006 2007 2008
Primeira vez / First time – 5,7 8,1 7,1
Diária / Daily – 2,5 1,2 3,4
Semanal / Weekly – 5,0 4,7 9,7
Mensal / Monthly – 15,4 14,8 26,0
Semestral / Biannually – 51,5 53,0 37,7
Anual / Annually – 20,1 18,2 16,2
Categoria / Category 2005 2006 2007 2008
Hotel/ Flat / Hotel/ Apartment – 89,1 86,4 82,4
Casa Própria/ Alugada / Owned or rented property – 0,6 2,7 2,0
Casa de Amigos/Parentes / Home of friends/ family – 10,3 10,9 15,4
Outros / Other – 0,0 0,0 0,1
MOTIVO DA VIAGEM (%) / TRAVEL MOTIVATION
Categoria / Category 2005 2006 2007 2008
Lazer / Leisure – 2,9 6,6 0,9
Negócios/ Trabalho / Business or work – 95,5 92,2 99,0
Estudos / Study – 1,4 0,4 0,0
Visitar Amigos/ Parentes / To visit friends or family – 0,2 0,8 0,1
GRAU DE INSTRUÇÃO (%) / EDUCATION LEVEL
Categoria / Category 2005 2006 2007 2008
Básico / Elementary – 1,7 0,2 2,0
Fundamental / Fundamental – 3,8 2,4 4,0
Médio / Secondary – 52,7 35,9 38,5
Superior incompleto / Higher education incomplete – 13,7 23,4 14,1
Superior graduado / Graduated – 25,6 34,5 36,9
Pós-graduado / Postgraduated – 2,6 3,6 4,4
Fonte: São Paulo Turismo, 2008
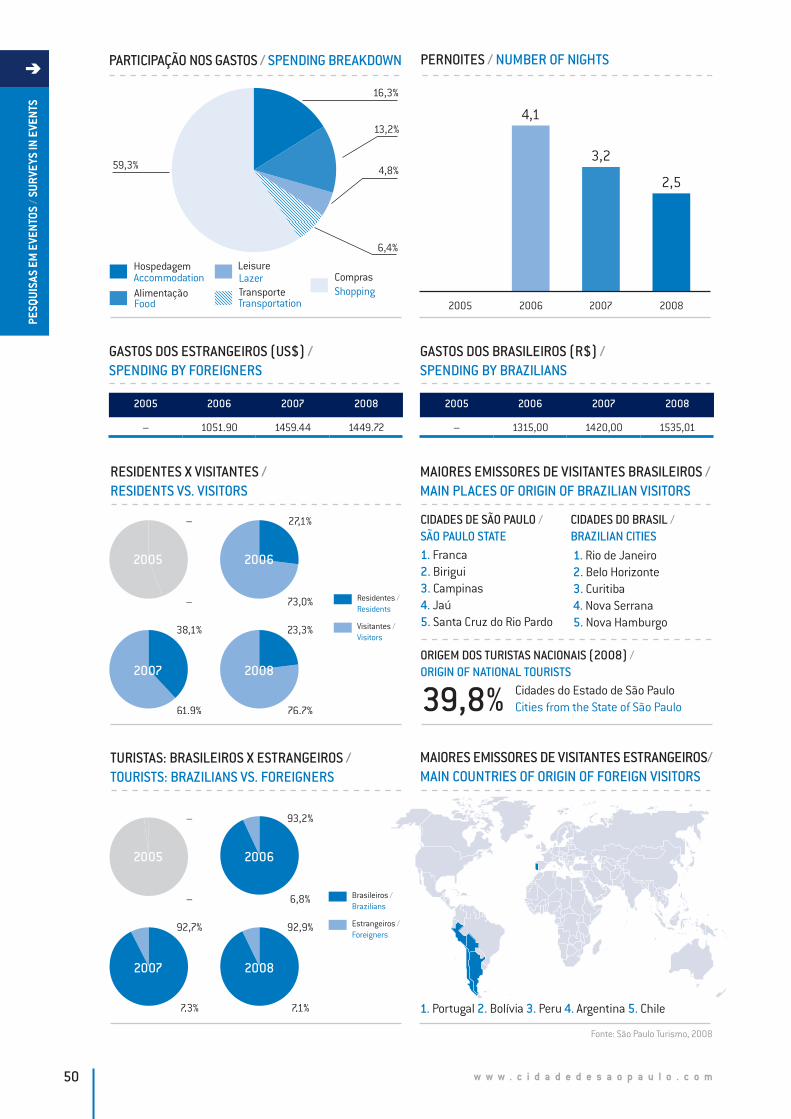
w w w . c i d a d e d e s a o p a u l o . c o m50
PESQ
UISA
S EM
EVE
NTOS
/ SU
RVEY
S IN
EVE
NTS
PARTICIPAÇÃO NOS GASTOS / SPENDING BREAKDOWN
59,3%
13,2%
4,8%
16,3%
6,4%
HospedagemAccommodationAlimentaçãoFood
ComprasShopping
LazerLeisure
TransporteTransportation
GASTOS DOS ESTRANGEIROS (US$) / SPENDING BY FOREIGNERS
RESIDENTES X VISITANTES / RESIDENTS VS. VISITORS
MAIORES EMISSORES DE VISITANTES BRASILEIROS / MAIN PLACES OF ORIGIN OF BRAZILIAN VISITORS
TURISTAS: BRASILEIROS X ESTRANGEIROS / TOURISTS: BRAZILIANS VS. FOREIGNERS
MAIORES EMISSORES DE VISITANTES ESTRANGEIROS/ MAIN COUNTRIES OF ORIGIN OF FOREIGN VISITORS
1. Portugal 2. Bolívia 3. Peru 4. Argentina 5. Chile
2005 2006 20082007
4,1
3,2
2,5
2005 2006 2007 2008
– 1051.90 1459.44 1449.72
2005 2006 2007 2008
– 1315,00 1420,00 1535,01
Residentes / Residents
Visitantes / Visitors
2005 2006
20082007
–
–
61,9%
38,1%
76,7%
23,3%
73,0%
27,1%
Brasileiros / Brazilians
Estrangeiros / Foreigners
2005 2006
20082007
–
–
7,3%
92,7%
7,1%
92,9%
6,8%
93,2%
GASTOS DOS BRASILEIROS (R$) / SPENDING BY BRAZILIANS
PERNOITES / NUMBER OF NIGHTS
1. Franca 2. Birigui 3. Campinas4. Jaú5. Santa Cruz do Rio Pardo
1. Rio de Janeiro 2. Belo Horizonte 3. Curitiba4. Nova Serrana5. Nova Hamburgo
CIDADES DE SÃO PAULO /SÃO PAULO STATE
CIDADES DO BRASIL /BRAZILIAN CITIES
39,8% Cidades do Estado de São PauloCities from the State of São Paulo
ORIGEM DOS TURISTAS NACIONAIS (2008) / ORIGIN OF NATIONAL TOURISTS
Fonte: São Paulo Turismo, 2008

w w w . c i d a d e d e s a o p a u l o . c o m 51
PESQ
UISA
S EM
EVE
NTOS
/ SU
RVEY
S IN
EVE
NTSCategoria
CategoryAnoYear
Muito abaixo das expectativasBelow expectations
Muito acima das expectativasAbove expectations
1 2 3 4 5 6 7
HospedagemAccommodation
2006 0,3 1,0 4,8 7,0 22,9 23,5 40,6
2007 0,0 0,0 1,9 1,9 24,3 36,7 35,2
2008 1,2 0,8 2,6 7,4 30,4 24,6 33,1
Transporte públicoPublic Transportation
2006 3,1 1,9 3,1 17,6 20,1 24,5 29,6
2007 0,0 0,0 0,9 8,4 24,3 30,8 35,5
2008 8,4 7,0 8,8 7,9 23,8 18,1 25,9
Centrais de Infor-mações TurísticasTourist Information Center
2006 2,9 0,7 7,3 18,8 15,9 21,7 32,6
2007 1,4 0,0 1,4 1,4 20,3 32,4 43,2
2008 3,8 3,8 5,5 11,3 21,6 24,1 29,9
Atrativos culturaisCultural attraction
2006 0,0 0,5 3,0 5,5 13,5 23,0 54,5
2007 0,0 0,0 0,6 3,1 22,0 36,6 37,8
2008 0,4 1,3 2,3 6,6 17,9 23,0 48,5
GastronomiaGastronomy
2006 0,8 0,6 2,2 3,6 11,2 23,5 58,0
2007 0,0 0,0 0,4 2,0 12,6 30,0 55,1
2008 1,0 0,8 2,2 4,9 15,7 22,9 52,5
ComprasShopping
2006 0,0 0,0 0,6 3,0 8,2 19,5 68,8
2007 0,0 0,0 0,0 1,2 10,8 28,9 59,0
2008 0,2 0,2 0,7 2,0 12,8 20,2 63,7
Limpeza urbanaUrban cleanliness
2006 7,5 5,9 10,6 17,3 27,3 18,8 12,6
2007 2,9 3,7 7,4 20,2 44,0 11,9 9,9
2008 8,9 9,0 16,9 21,7 26,1 9,5 7,9
Segurança públicaPublic Safety
2006 12,7 7,4 14,9 12,7 25,1 16,0 11,3
2007 2,5 7,8 11,1 18,9 34,4 19,3 6,2
2008 10,3 10,9 16,9 17,3 24,5 10,2 9,9
Hospitalidade da populaçãoHospitality
2006 3,4 2,7 4,2 8,1 20,1 22,1 39,5
2007 0,4 0,0 0,8 5,5 26,3 28,2 38,8
2008 3,8 3,3 8,5 11,5 20,9 22,1 29,8
AVALIAÇÃO DA CIDADE DE SÃO PAULO (%) / EVALUATION OF THE CITY OF SÃO PAULO
O público da Feira Francal é, em termos de gênero, pre-dominantemente masculino, muito embora venha apre-sentando uma crescente participação do sexo feminino no decorrer dos últimos três anos (25,5% em 2006, 29,2% em 2007 e 35,0% em 2008). A média da faixa etária dos participantes do evento é representada por pessoas jovens entre 30 a 39 anos (28,9%), seguida da faixa de 40 a 49 anos (26,1%).
A instrução do público presente, em 2008, abrange dois tipos de nível: o médio (38,5%) e o superior completo/graduado (36,9%). Este indicativo também foi verificado nos anos anteriores. A renda mensal média predominante foi de um a cinco salários mínimos (32,6%). Em termos de ocupação profissional metade do público no evento (53,4%) é composta de empresários, seguido de autôno-mos (16,9%) e de assalariados com registro (18,7%). São inexpressivas as demais categorias pesquisadas, incluin-do ausência de desempregados.
In terms of gender, the public of the Francal Fair is mainly male, although there has been a growing participation of women over the last three years (25.5% in 2006, 29.2% in 2007 and 35.0% in 2008). The average age range of the participants was young - between 30 and 39 years (28.9%), followed by the 40 to 49 year age group (26.1%).
The level of education of the public present in 2008 covers two categories: Complete secondary education (38.5%) and higher education/graduation (36.9%). The predomi-nant average monthly income was one to five minimum wages (32.6%). In terms of professional occupation, just over half of the event’s public (53.4%) consisted of busi-ness people, followed by self-employed people (16.9%) and salaried employees (18.7%). The other categories researched were insignificant, indicating an absence of unemployed people.
In 2008, the total spending in the City of São Paulo, among Brazilian visitors to the Francal Fair, was R$ 1535.01, with
Fonte: São Paulo Turismo, 2008
w w w . c i d a d e d e s a o p a u l o . c o m52
PESQ
UISA
S EM
EVE
NTOS
/ SU
RVEY
S IN
EVE
NTS
Em 2008, o gasto total na Cidade de São Paulo real-izado pelos visitantes brasileiros da Feira Francal foi de R$ 1535,01 revelando prioritariamente um dispêndio maior nas compras (59,3%), seguido do item hospeda-gem (16,3%), alimentação (13,2%), transporte (6,4%) e lazer (4,8%).
A permanência média verificada no período (2006 a 2008) foi de 3,3 dias, havendo predominância dos hotéis/flats como a hospedagem mais apontada pelos entrevistados (82,4%). Notadamente a permanência em casa de amigos e parentes é bem menor sendo, no período dos últimos três anos, correspondente de uma média de 12,2% . O mo-tivo da viagem é notadamente negócios/trabalho, repre-sentativo da quase totalidade das respostas na pesquisa de 2008 (99,0%). Não houve realização da pesquisa no ano de 2005.
Apesar da predominância da freqüência de visitação ter sido semestral, em 2006 e 2007, indicadores vêm apon-tando um aumento da opção mensal em 2008, ou seja, os participantes vêm aumentando o número de vindas à Cidade de São Paulo no período analisado.
A média do número de visitantes (70,0%) ainda é predom-inante, comparada com os residentes (30,0%), no período de 2006 a 2008, embora seja significativa a participação destes residentes no evento. Entre os maiores emissores de cidades visitantes no evento, de cidades paulistas, de-stacamos: Franca, Birigui, Campinas, Jaú e Santa Cruz do Rio Pardo. Por outro lado, entre os maiores emissores visi-tantes de cidade brasileiras, destacamos: Rio de Janeiro, Belo Horizonte, Curitiba, Nova Serrana e Novo Hamburgo.
Em termos da hospedagem (33,1%), da gastronomia (52,5%), dos atrativos culturais (48,5%) e das compras (63,7%) observa-se um elevado índice de satisfação, com uma relativa queda da expectativa para 2008. Os demais itens avaliados demonstram uma diminuição no nível da expectativa, particularmente com relação à hospitalidade da população (29,8%) que teve uma relativa redução em seus valores máximos.
the highest amounts being spent on shopping (59.3%), followed by accommodation (16.3%), food and drink (13.2%), transportation (6.4%) and leisure (4.8%).
The average length of stay for the period (2006 to 2008) was 3.3 days, with hotels/apartments being the type of accommodation most frequently cited by the interviewees (82.4%). Notably, the percentage of people staying at the homes of friends and family was much lower, with an average of 12.2% over the past three years. The purpose of travel was mainly business/work, representing almost all the responses to the survey in 2008 (99.0%). No survey was carried out in 2005.
In terms of frequency of visits, compared with the past two years (2006 and 2007), despite the predominance of weekly visits, the indicators for 2008 showed an increase in monthly visits, i.e. participants have been increasing the number of visits to the City of São Paulo in the period analyzed.
The percentage of visitors from outside the State (70.0%) was still higher than the number of residents (30.0%), for the period 2006 to 2008, although the participation of residents at the event was nonetheless significant. In relation to the visitor’s places of origin, the main ones within the State of São Paulo were: Franca, Birigui, Campinas, Jaú and Santa Cruz do Rio Pardo. And for the rest of Brazil, the main cities of origin of the visitors were: Rio de Janeiro, Belo Horizonte, Curitiba, Nova Serrana and Novo Hamburgo.
High levels of satisfaction were noted in relation to the accommodation (33.1%), gastronomy (52.5%), cultural attractions (48.5%) and shopping (63.7%), there was a decrease in expectations in 2008. The other items evaluated showed a relative reduction in scores, particu-larly hospitality of the population (29.8%).
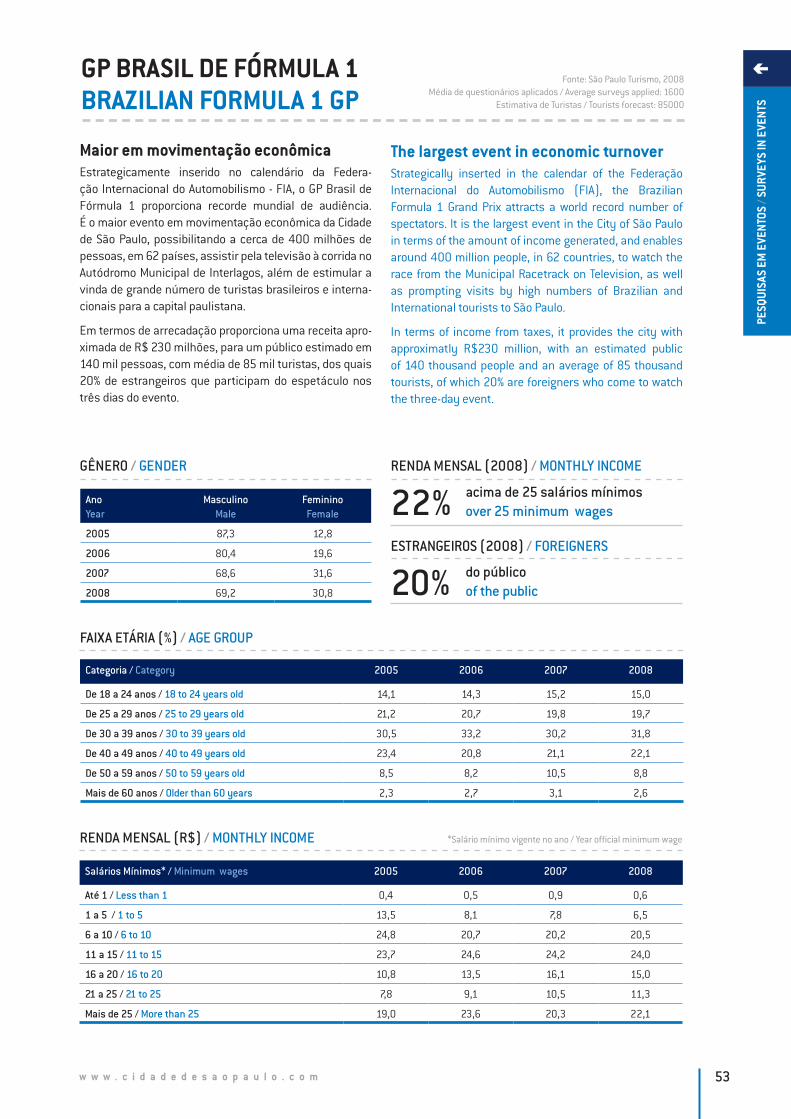
w w w . c i d a d e d e s a o p a u l o . c o m 53
PESQ
UISA
S EM
EVE
NTOS
/ SU
RVEY
S IN
EVE
NTS
GP BRASIL DE FÓRMULA 1BRAZILIAN FORMULA 1 GP
Maior em movimentação econômicaEstrategicamente inserido no calendário da Federa-ção Internacional do Automobilismo - FIA, o GP Brasil de Fórmula 1 proporciona recorde mundial de audiência. É o maior evento em movimentação econômica da Cidade de São Paulo, possibilitando a cerca de 400 milhões de pessoas, em 62 países, assistir pela televisão à corrida no Autódromo Municipal de Interlagos, além de estimular a vinda de grande número de turistas brasileiros e interna-cionais para a capital paulistana.
Em termos de arrecadação proporciona uma receita apro-ximada de R$ 230 milhões, para um público estimado em 140 mil pessoas, com média de 85 mil turistas, dos quais 20% de estrangeiros que participam do espetáculo nos três dias do evento.
The largest event in economic turnoverStrategically inserted in the calendar of the Federação Internacional do Automobilismo (FIA), the Brazilian Formula 1 Grand Prix attracts a world record number of spectators. It is the largest event in the City of São Paulo in terms of the amount of income generated, and enables around 400 million people, in 62 countries, to watch the race from the Municipal Racetrack on Television, as well as prompting visits by high numbers of Brazilian and International tourists to São Paulo.
In terms of income from taxes, it provides the city with approximatly R$230 million, with an estimated public of 140 thousand people and an average of 85 thousand tourists, of which 20% are foreigners who come to watch the three-day event.
RENDA MENSAL (R$) / MONTHLY INCOME
Fonte: São Paulo Turismo, 2008Média de questionários aplicados / Average surveys applied: 1600
Estimativa de Turistas / Tourists forecast: 85000
Salários Mínimos* / Minimum wages 2005 2006 2007 2008
Até 1 / Less than 1 0,4 0,5 0,9 0,6
1 a 5 / 1 to 5 13,5 8,1 7,8 6,5
6 a 10 / 6 to 10 24,8 20,7 20,2 20,5
11 a 15 / 11 to 15 23,7 24,6 24,2 24,0
16 a 20 / 16 to 20 10,8 13,5 16,1 15,0
21 a 25 / 21 to 25 7,8 9,1 10,5 11,3
Mais de 25 / More than 25 19,0 23,6 20,3 22,1
FAIXA ETÁRIA (%) / AGE GROUP
Categoria / Category 2005 2006 2007 2008
De 18 a 24 anos / 18 to 24 years old 14,1 14,3 15,2 15,0
De 25 a 29 anos / 25 to 29 years old 21,2 20,7 19,8 19,7
De 30 a 39 anos / 30 to 39 years old 30,5 33,2 30,2 31,8
De 40 a 49 anos / 40 to 49 years old 23,4 20,8 21,1 22,1
De 50 a 59 anos / 50 to 59 years old 8,5 8,2 10,5 8,8
Mais de 60 anos / Older than 60 years 2,3 2,7 3,1 2,6
GÊNERO / GENDER
AnoYear
MasculinoMale
FemininoFemale
2005 87,3 12,8
2006 80,4 19,6
2007 68,6 31,6
2008 69,2 30,8
RENDA MENSAL (2008) / MONTHLY INCOME
ESTRANGEIROS (2008) / FOREIGNERS
22% acima de 25 salários mínimosover 25 minimum wages
20% do públicoof the public
*Salário mínimo vigente no ano / Year official minimum wage
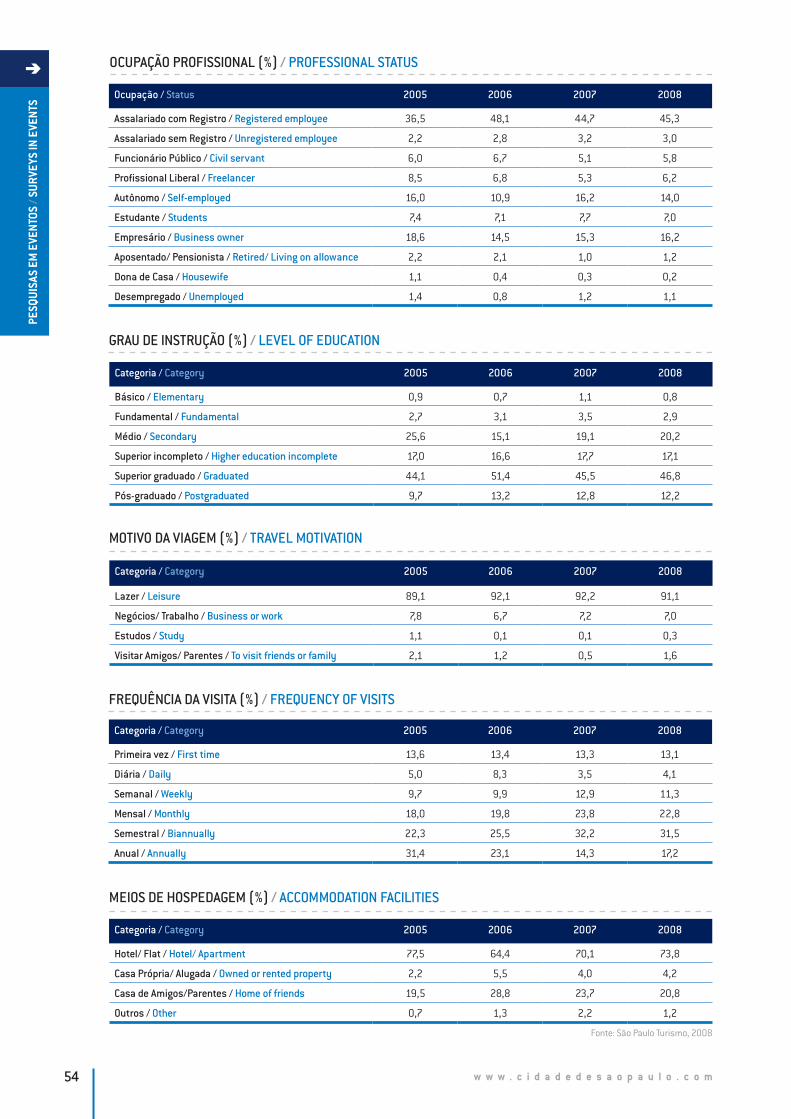
w w w . c i d a d e d e s a o p a u l o . c o m54
PESQ
UISA
S EM
EVE
NTOS
/ SU
RVEY
S IN
EVE
NTS
OCUPAÇÃO PROFISSIONAL (%) / PROFESSIONAL STATUS
Ocupação / Status 2005 2006 2007 2008
Assalariado com Registro / Registered employee 36,5 48,1 44,7 45,3
Assalariado sem Registro / Unregistered employee 2,2 2,8 3,2 3,0
Funcionário Público / Civil servant 6,0 6,7 5,1 5,8
Profissional Liberal / Freelancer 8,5 6,8 5,3 6,2
Autônomo / Self-employed 16,0 10,9 16,2 14,0
Estudante / Students 7,4 7,1 7,7 7,0
Empresário / Business owner 18,6 14,5 15,3 16,2
Aposentado/ Pensionista / Retired/ Living on allowance 2,2 2,1 1,0 1,2
Dona de Casa / Housewife 1,1 0,4 0,3 0,2
Desempregado / Unemployed 1,4 0,8 1,2 1,1
FREQUÊNCIA DA VISITA (%) / FREQUENCY OF VISITS
MEIOS DE HOSPEDAGEM (%) / ACCOMMODATION FACILITIES
Categoria / Category 2005 2006 2007 2008
Primeira vez / First time 13,6 13,4 13,3 13,1
Diária / Daily 5,0 8,3 3,5 4,1
Semanal / Weekly 9,7 9,9 12,9 11,3
Mensal / Monthly 18,0 19,8 23,8 22,8
Semestral / Biannually 22,3 25,5 32,2 31,5
Anual / Annually 31,4 23,1 14,3 17,2
Categoria / Category 2005 2006 2007 2008
Hotel/ Flat / Hotel/ Apartment 77,5 64,4 70,1 73,8
Casa Própria/ Alugada / Owned or rented property 2,2 5,5 4,0 4,2
Casa de Amigos/Parentes / Home of friends 19,5 28,8 23,7 20,8
Outros / Other 0,7 1,3 2,2 1,2
MOTIVO DA VIAGEM (%) / TRAVEL MOTIVATION
Categoria / Category 2005 2006 2007 2008
Lazer / Leisure 89,1 92,1 92,2 91,1
Negócios/ Trabalho / Business or work 7,8 6,7 7,2 7,0
Estudos / Study 1,1 0,1 0,1 0,3
Visitar Amigos/ Parentes / To visit friends or family 2,1 1,2 0,5 1,6
GRAU DE INSTRUÇÃO (%) / LEVEL OF EDUCATION
Categoria / Category 2005 2006 2007 2008
Básico / Elementary 0,9 0,7 1,1 0,8
Fundamental / Fundamental 2,7 3,1 3,5 2,9
Médio / Secondary 25,6 15,1 19,1 20,2
Superior incompleto / Higher education incomplete 17,0 16,6 17,7 17,1
Superior graduado / Graduated 44,1 51,4 45,5 46,8
Pós-graduado / Postgraduated 9,7 13,2 12,8 12,2
Fonte: São Paulo Turismo, 2008
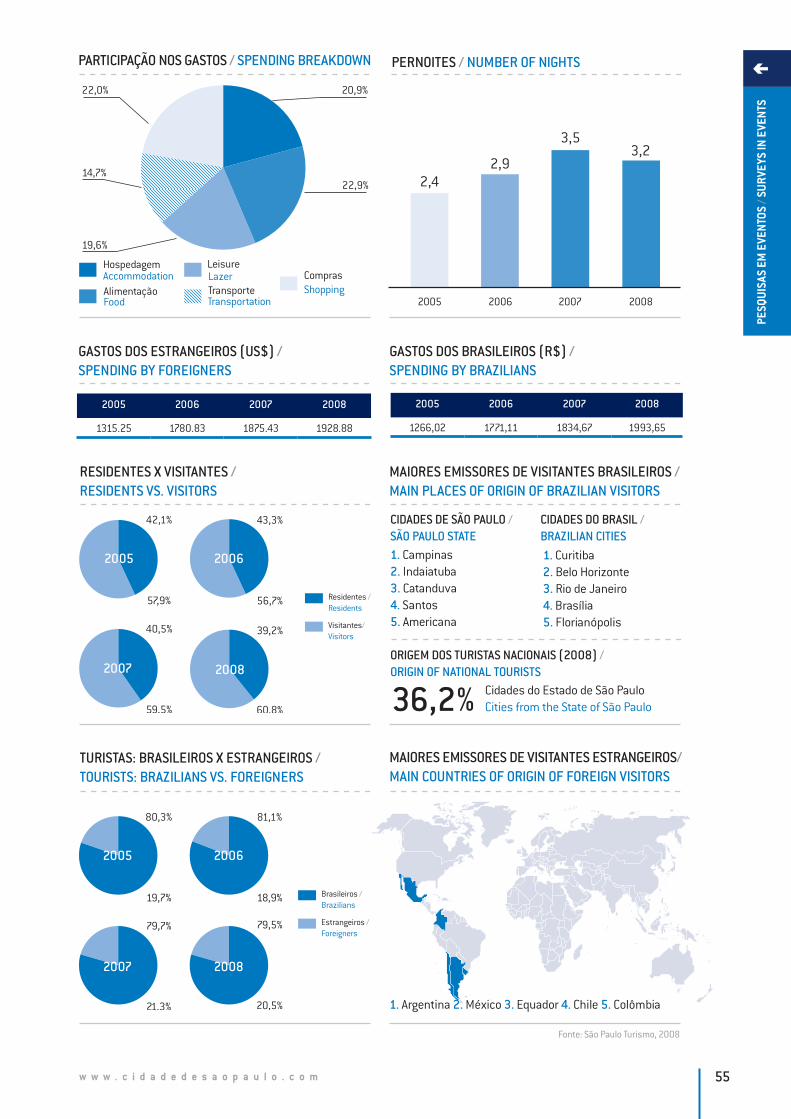
w w w . c i d a d e d e s a o p a u l o . c o m 55
PESQ
UISA
S EM
EVE
NTOS
/ SU
RVEY
S IN
EVE
NTS
PARTICIPAÇÃO NOS GASTOS / SPENDING BREAKDOWN
22,0%
22,9%14,7%
20,9%
19,6%
HospedagemAccommodationAlimentaçãoFood
ComprasShopping
LazerLeisure
TransporteTransportation
GASTOS DOS ESTRANGEIROS (US$) / SPENDING BY FOREIGNERS
RESIDENTES X VISITANTES / RESIDENTS VS. VISITORS
MAIORES EMISSORES DE VISITANTES BRASILEIROS / MAIN PLACES OF ORIGIN OF BRAZILIAN VISITORS
TURISTAS: BRASILEIROS X ESTRANGEIROS / TOURISTS: BRAZILIANS VS. FOREIGNERS
MAIORES EMISSORES DE VISITANTES ESTRANGEIROS/ MAIN COUNTRIES OF ORIGIN OF FOREIGN VISITORS
1. Argentina 2. México 3. Equador 4. Chile 5. Colômbia
2005 2006 20082007
2,92,4
3,53,2
2005 2006 2007 2008
1315.25 1780.83 1875.43 1928.88
2005 2006 2007 2008
1266,02 1771,11 1834,67 1993,65
60,8%
39,2%
Residentes / Residents
Visitantes/ Visitors
2005 2006
20082007
57,9%
42,1%
59,5%
40,5%
56,7%
43,3%
2005
Brasileiros / Brazilians
Estrangeiros / Foreigners
2005 2006
20082007
19,7%
80,3%
21,3%
79,7%
18,9%
81,1%
20,5%
79,5%
GASTOS DOS BRASILEIROS (R$) / SPENDING BY BRAZILIANS
PERNOITES / NUMBER OF NIGHTS
1. Campinas2. Indaiatuba3. Catanduva4. Santos5. Americana
1. Curitiba2. Belo Horizonte3. Rio de Janeiro4. Brasília5. Florianópolis
CIDADES DE SÃO PAULO /SÃO PAULO STATE
CIDADES DO BRASIL /BRAZILIAN CITIES
36,2% Cidades do Estado de São PauloCities from the State of São Paulo
ORIGEM DOS TURISTAS NACIONAIS (2008) / ORIGIN OF NATIONAL TOURISTS
Fonte: São Paulo Turismo, 2008

w w w . c i d a d e d e s a o p a u l o . c o m56
PESQ
UISA
S EM
EVE
NTOS
/ SU
RVEY
S IN
EVE
NTS Categoria
CategoryAnoYear
Muito abaixo das expectativasBelow expectations
Muito acima das expectativasAbove expectations
1 2 3 4 5 6 7
HospedagemAccommodation
2006 1,3 0,8 2,3 5,0 22,5 26,5 41,7
2007 0,4 2,0 3,6 2,8 18,3 20,2 52,8
2008 0,3 1,5 2,1 3,3 16,1 23,1 53,6
Transporte públicoPublic Transportation
2006 3,7 2,0 6,7 8,7 24,1 26,1 28,7
2007 5,5 3,3 4,9 10,9 23,0 21,9 30,6
2008 5,8 3,9 4,8 10,1 22,1 24,2 29,1
Centrais de Infor-mações TurísticasTourist Information Center
2006 3,7 2,0 6,7 8,7 24,1 26,1 28,7
2007 6,1 6,1 5,5 11,6 21,6 24,3 24,9
2008 6,0 6,8 6,4 12,1 20,2 23,2 25,3
Atrativos culturaisCultural attractions
2006 0,9 0,9 2,2 3,6 17,3 24,1 51,0
2007 0,9 0,0 2,6 4,0 20,6 25,0 46,9
2008 0,1 0,2 1,5 3,5 20,2 26,7 47,8
GastronomiaGastronomy
2006 0,5 0,3 1,1 2,5 9,9 17,0 68,6
2007 1,1 1,1 1,8 1,4 10,2 18,3 66,3
2008 0,4 1,0 1,2 2,0 10,3 18,1 68,9
ComprasShopping
2006 0,4 0,3 0,6 1,3 8,5 19,5 69,5
2007 0,0 0,4 2,8 2,8 8,2 17,7 68,1
2008 0,1 0,2 2,0 2,3 8,4 18,1 68,9
Limpeza urbanaUrban cleanliness
2006 5,0 6,0 15,2 19,1 26,6 14,1 14,1
2007 4,5 10,2 13,1 17,9 24,6 15,0 14,7
2008 4,0 8,2 14,1 18,5 26,2 14,9 14,1
Segurança públicaPublic Safety
2006 5,8 5,5 11,4 17,8 24,3 16,9 18,4
2007 2,0 3,6 7,5 19,6 24,5 19,0 23,9
2008 2,8 4,8 6,9 18,7 23,2 19,5 24,1
Hospitalidade da populaçãoHospitality
2006 0,9 2,7 2,8 7,7 18,9 22,9 44,0
2007 1,6 2,9 2,2 8,9 15,6 20,3 48,6
2008 1,5 2,5 2,3 7,3 14,1 23,2 49,1
AVALIAÇÃO DA CIDADE DE SÃO PAULO (%) / EVALUATION OF THE CITY OF SÃO PAULO
É um evento com predominância do extrato masculino, embora o GP Fórmula 1 esteja, nos dois últimos anos, revelando um crescente aumento de mulheres, hoje com uma participação acima de 30%.
A demanda caracteriza-se por um público maduro em ter-mos de faixa etária, compreendida entre 30 e 39 anos, acima de 30% para 2008, embora haja uma incidência de pessoas nas faixas de idade entre 25 e 29 anos (19,7%) e de 40 e 49 anos (22,1%). O público acima de 60 anos é relativamente pequeno (2,6%).
Na média, a renda mensal dos participantes é relativamente alta e concentra-se no nível de 11 a 15 salários mínimos (24%), com expressiva participação de um público com ganhos acima de 16 salários mínimos. No patamar acima de 25 salários, observa-se um grupo de renda bastante elevado, compreendido por mais de 20% do total.
O grau de instrução dos participantes do evento é con-siderado também alto, composto por uma maioria de pes-
It is an event which attracts mainly men, although the Formula 1 Grand Prix has, over the past two years, shown an increase in women, who now make up 30% of visitors.
The demand is characterized by a mature public in terms of age, with 30% in the 30 and 39 year age group, in 2008, although there are also significant proportions aged 25 to 29 years (19.7%) and 40 to 49 years (22.1%). The public over 60 years is small (2.6%).
The average monthly income of the participants is rela-tively high, concentrated at the 11 to 15 minimum wages range (24%), with a significant portion of public earning over 16 minimum wages. A group with a very high income was also registered – over 25 wages – comprising more than 20% of the total.
The educational level of the participants in the event was also high, comprised of a majority of people with higher education - 46.8%, for the year 2008, as well as a signi-ficant portion with postgraduate degrees - around 12.2%.
Fonte: São Paulo Turismo, 2008
w w w . c i d a d e d e s a o p a u l o . c o m 57
PESQ
UISA
S EM
EVE
NTOS
/ SU
RVEY
S IN
EVE
NTS
soas com formação superior completa, apresentada por 46,8%, para o ano de 2008, além de uma parcela signifi-cativa com pós-graduação, da ordem de 12,2%.
Em termos de ocupação observa-se uma hegemonia do público assalariado com registro, em média de 45%, seguida pela categoria dos empresários e dos autônomos com 16,2% e 14,0%, respectivamente.
Observa-se que a quase totalidade da motivação da via-gem é de lazer (média de 90%), com freqüência da visita semestral à Cidade de São Paulo, acima de 30% para os dois últimos anos (2007 e 2008). Nota-se ainda uma in-cidência das viagens mensais, acima de 20%.
Em 2008, 73,8% ficaram hospedados em hotéis e flats, 20,8% em casa de amigos/parentes, e 5,4% em hospeda-gens alternativas como albergues, pensões, hospedarias e outros.
Em termos comportamentais, a permanência média dos turistas na cidade vem se posicionando em 3,0 dias, especificamente em 3,5 e 3,2 pernoites nos anos de 2007 e 2008.
Os gastos diários realizados pelos turistas brasileiros do GP de Fórmula 1, em 2008, correspondem a uma média diária estimada em R$ 623,01, enquanto os estrangeiros gastam o equivalente a US$ 602.77.
Motivados pelo evento chegam à cidade cerca de 85 mil visitantes, sendo deste total 20% estrangeiros. Esta demanda contribuiu com uma significativa movimenta-ção de gastos na cidade sendo, em particular, para o ano de 2008, representativa de 20,9% em hospedagem, 22,9% em alimentação, 22,0% em compras, 19,6% em lazer e 14,7% em transporte.
Entre os países que mais enviam turistas estrangeiros, destacam-se a Argentina, o México, o Equador, o Chile e a Colômbia. Em relação às cidades emissoras brasileiras, observa-se que a grande parcela é proveniente do Estado de São Paulo, impulsionando a chegada de 36,2% visitan-tes, particularmente com chegadas de Campinas, Indaia-tuba, Catanduva, Santos e Americana. Quanto ao restante brasileiro destacam-se os visitantes de Curitiba, Belo Hori-zonte, Rio de Janeiro, Brasília e Florianópolis.
Em termos da avaliação de São Paulo, os visitantes pre-ferem, em primeiro lugar, as opções da alta gastronomia e as opções de compras, com avaliações muito acima da expectativa, da ordem de 68,9% para 2008. Também são bem consideradas as categorias relativas à hospedagem (53,6%), à hospitalidade da população (49,1%) e aos atrativos culturais (47,8%). Encontram-se em níveis in-termediários de satisfação, o atendimento das Centrais de Informações Turísticas (25,3%), a segurança pública (24,1%) e a limpeza urbana (14,1%).
In terms of occupation, a hegemony of salaried employ-ees was registered, around 45%, followed by the catego-ries of business people and self-employed people, with 16.2% and 14.0% respectively.
It was noted that the purpose of the trip was nearly always leisure (average 90%), with the frequency of visits to the city being mainly weekly (over 30%) for the last two years (2007 and 2008). A significant incidence was also noted for monthly trips, with over 20%.
In 2008, 73.8% of the public stayed in hotels and apart-ments, 20.8% at the homes of friends/relatives and 5.4% in alternative accommodation facilities, such as hostels, guesthouses, inns and others.
In behavioral terms, the average stay of tourists in the city was 3.0 days, more specifically, 3.5 and 3.2 nights, for the years 2007 and 2008.
The daily spending of Brazilian tourists at the Formula 1 Grand Prix in 2008 corresponded to an estimated average of R$ 623.01, while foreigners spent an equivalent of US$ 602.77.
For the main purpose of attending the event, around 80 thousand visitors arrived in the city, of which 20% were foreigners. This demand contributed to a significant turn-over of spending in the city, particularly for the year 2008, with 20.9% being spent on accommodation, 22.9% on food and drink, 22.0% on shopping, 19.6% on leisure and 14.7% on transportation.
Of the origin countries of foreign tourists, the main ones were Argentina, Mexico, Ecuador, Chile and Colombia. For the cities in Brazil, a large portion of visitors from the State of São Paulo was registered, prompting the arrival of 36,2% of visitors, particularly from the cities of Campinas, Indaiatuba, Catanduva, Santos and Americana. As for the rest of Brazil, high numbers of visitors were noticed from Curitiba, Belo Horizonte, Rio de Janeiro, Brasília and Florianópolis.
In terms of the visitors’ evaluation of São Paulo, the visitors preferred, in first place, the gastronomical options and the shopping options, with evaluations far above expectations – around 68.9% for 2008. The categories accommodation (53.6%), hospitality of the population (49.1%) and cultural attractions (47.8%) also scored highly. Intermediate levels of satisfaction were found in relation to the service of the Tourist Information Centers (25.3%), public safety (24.1%) and urban cleanliness (14.1%).
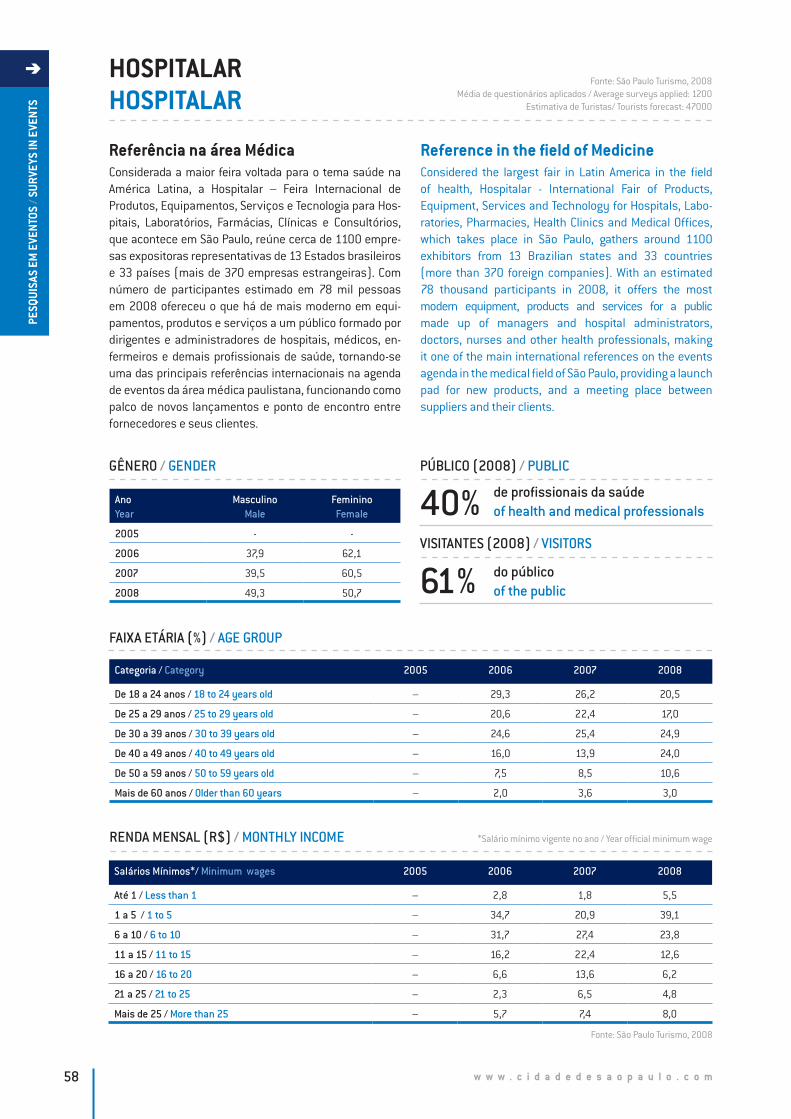
w w w . c i d a d e d e s a o p a u l o . c o m58
PESQ
UISA
S EM
EVE
NTOS
/ SU
RVEY
S IN
EVE
NTS
HOSPITALARHOSPITALAR
Referência na área MédicaConsiderada a maior feira voltada para o tema saúde na América Latina, a Hospitalar – Feira Internacional de Produtos, Equipamentos, Serviços e Tecnologia para Hos-pitais, Laboratórios, Farmácias, Clínicas e Consultórios, que acontece em São Paulo, reúne cerca de 1100 empre-sas expositoras representativas de 13 Estados brasileiros e 33 países (mais de 370 empresas estrangeiras). Com número de participantes estimado em 78 mil pessoas em 2008 ofereceu o que há de mais moderno em equi-pamentos, produtos e serviços a um público formado por dirigentes e administradores de hospitais, médicos, en-fermeiros e demais profissionais de saúde, tornando-se uma das principais referências internacionais na agenda de eventos da área médica paulistana, funcionando como palco de novos lançamentos e ponto de encontro entre fornecedores e seus clientes.
Reference in the field of MedicineConsidered the largest fair in Latin America in the field of health, Hospitalar - International Fair of Products, Equipment, Services and Technology for Hospitals, Labo-ratories, Pharmacies, Health Clinics and Medical Offices, which takes place in São Paulo, gathers around 1100 exhibitors from 13 Brazilian states and 33 countries (more than 370 foreign companies). With an estimated 78 thousand participants in 2008, it offers the most modern equipment, products and services for a public made up of managers and hospital administrators, doctors, nurses and other health professionals, making it one of the main international references on the events agenda in the medical field of São Paulo, providing a launch pad for new products, and a meeting place between suppliers and their clients.
RENDA MENSAL (R$) / MONTHLY INCOME
Fonte: São Paulo Turismo, 2008Média de questionários aplicados / Average surveys applied: 1200
Estimativa de Turistas/ Tourists forecast: 47000
Salários Mínimos*/ Minimum wages 2005 2006 2007 2008
Até 1 / Less than 1 – 2,8 1,8 5,5
1 a 5 / 1 to 5 – 34,7 20,9 39,1
6 a 10 / 6 to 10 – 31,7 27,4 23,8
11 a 15 / 11 to 15 – 16,2 22,4 12,6
16 a 20 / 16 to 20 – 6,6 13,6 6,2
21 a 25 / 21 to 25 – 2,3 6,5 4,8
Mais de 25 / More than 25 – 5,7 7,4 8,0
FAIXA ETÁRIA (%) / AGE GROUP
Categoria / Category 2005 2006 2007 2008
De 18 a 24 anos / 18 to 24 years old – 29,3 26,2 20,5
De 25 a 29 anos / 25 to 29 years old – 20,6 22,4 17,0
De 30 a 39 anos / 30 to 39 years old – 24,6 25,4 24,9
De 40 a 49 anos / 40 to 49 years old – 16,0 13,9 24,0
De 50 a 59 anos / 50 to 59 years old – 7,5 8,5 10,6
Mais de 60 anos / Older than 60 years – 2,0 3,6 3,0
GÊNERO / GENDER
AnoYear
MasculinoMale
FemininoFemale
2005 - -
2006 37,9 62,1
2007 39,5 60,5
2008 49,3 50,7
PÚBLICO (2008) / PUBLIC
VISITANTES (2008) / VISITORS
61%
40% de profissionais da saúdeof health and medical professionals
do público of the public
*Salário mínimo vigente no ano / Year official minimum wage
Fonte: São Paulo Turismo, 2008
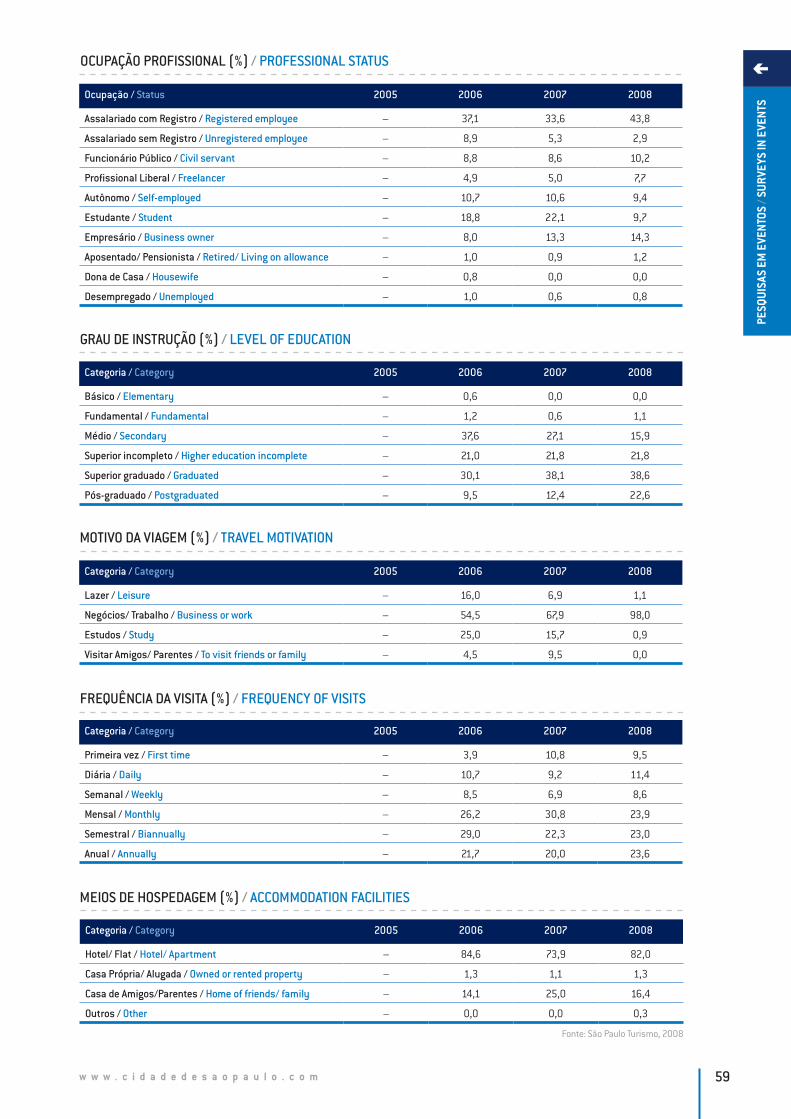
w w w . c i d a d e d e s a o p a u l o . c o m 59
PESQ
UISA
S EM
EVE
NTOS
/ SU
RVEY
S IN
EVE
NTS
OCUPAÇÃO PROFISSIONAL (%) / PROFESSIONAL STATUS
Ocupação / Status 2005 2006 2007 2008
Assalariado com Registro / Registered employee – 37,1 33,6 43,8
Assalariado sem Registro / Unregistered employee – 8,9 5,3 2,9
Funcionário Público / Civil servant – 8,8 8,6 10,2
Profissional Liberal / Freelancer – 4,9 5,0 7,7
Autônomo / Self-employed – 10,7 10,6 9,4
Estudante / Student – 18,8 22,1 9,7
Empresário / Business owner – 8,0 13,3 14,3
Aposentado/ Pensionista / Retired/ Living on allowance – 1,0 0,9 1,2
Dona de Casa / Housewife – 0,8 0,0 0,0
Desempregado / Unemployed – 1,0 0,6 0,8
FREQUÊNCIA DA VISITA (%) / FREQUENCY OF VISITS
MEIOS DE HOSPEDAGEM (%) / ACCOMMODATION FACILITIES
Categoria / Category 2005 2006 2007 2008
Primeira vez / First time – 3,9 10,8 9,5
Diária / Daily – 10,7 9,2 11,4
Semanal / Weekly – 8,5 6,9 8,6
Mensal / Monthly – 26,2 30,8 23,9
Semestral / Biannually – 29,0 22,3 23,0
Anual / Annually – 21,7 20,0 23,6
Categoria / Category 2005 2006 2007 2008
Hotel/ Flat / Hotel/ Apartment – 84,6 73,9 82,0
Casa Própria/ Alugada / Owned or rented property – 1,3 1,1 1,3
Casa de Amigos/Parentes / Home of friends/ family – 14,1 25,0 16,4
Outros / Other – 0,0 0,0 0,3
MOTIVO DA VIAGEM (%) / TRAVEL MOTIVATION
Categoria / Category 2005 2006 2007 2008
Lazer / Leisure – 16,0 6,9 1,1
Negócios/ Trabalho / Business or work – 54,5 67,9 98,0
Estudos / Study – 25,0 15,7 0,9
Visitar Amigos/ Parentes / To visit friends or family – 4,5 9,5 0,0
GRAU DE INSTRUÇÃO (%) / LEVEL OF EDUCATION
Categoria / Category 2005 2006 2007 2008
Básico / Elementary – 0,6 0,0 0,0
Fundamental / Fundamental – 1,2 0,6 1,1
Médio / Secondary – 37,6 27,1 15,9
Superior incompleto / Higher education incomplete – 21,0 21,8 21,8
Superior graduado / Graduated – 30,1 38,1 38,6
Pós-graduado / Postgraduated – 9,5 12,4 22,6
Fonte: São Paulo Turismo, 2008

w w w . c i d a d e d e s a o p a u l o . c o m60
PESQ
UISA
S EM
EVE
NTOS
/ SU
RVEY
S IN
EVE
NTS
PARTICIPAÇÃO NOS GASTOS / SPENDING BREAKDOWN
36,7%
16,5%
12,3%
24,1%
10,4%
HospedagemAccommodationAlimentaçãoFood
ComprasShopping
LazerLeisure
TransporteTransportation
GASTOS DOS ESTRANGEIROS (US$) / SPENDING BY FOREIGNERS
RESIDENTES X VISITANTES / RESIDENTES VS. VISITORS
MAIORES EMISSORES DE VISITANTES BRASILEIROS / MAIN PLACES OF ORIGIN OF BRAZILIAN VISITORS
TURISTAS: BRASILEIROS X ESTRANGEIROS / TOURISTS: BRAZILIANS VS. FOREIGNERS
MAIORES EMISSORES DE VISITANTES ESTRANGEIROS / MAIN COUNTRIES OF ORIGIN OF FOREIGN VISITORS
1.Bolívia 2. Paraguai 3. Estados Unidos 4. Equador 5. Peru
2005 2006 20082007
1,41,9
2,5
2005 2006 2007 2008
– 596.40 897.38 1307.65
2005 2006 2007 2008
– 649,30 950,10 1352,75
Residentes / Residents
Visitantes / Visitors
2005 2006
20082007
–
–
42,8%
57,2%
61,4%
38,6%
46,3%
53,7%
Brasileiros / Brasilians
Estrangeiros / Foreigners
2005 2006
20082007
–
–
2,8%
97,2%
3,6%
96,4%
2,5%
97,5%
GASTOS DOS BRASILEIROS (R$) / SPENDING BY BRAZILIANS
PERNOITES / NUMBER OF NIGHTS
1. Campinas2. São José dos Campos3. Ribeirão Preto4. Sorocaba5. São Carlos
1. Rio de Janeiro 2. Belo Horizonte 3. Curitiba4. Porto Alegre5. Goiânia
CIDADES DE SÃO PAULO /SÃO PAULO STATE
CIDADES DO BRASIL /BRAZILIAN CITIES
53,9% Cidades do Estado de São PauloCities from the State of São Paulo
ORIGEM DOS TURISTAS NACIONAIS (2008) / ORIGIN OF NATIONAL TOURISTS
Fonte: São Paulo Turismo, 2008
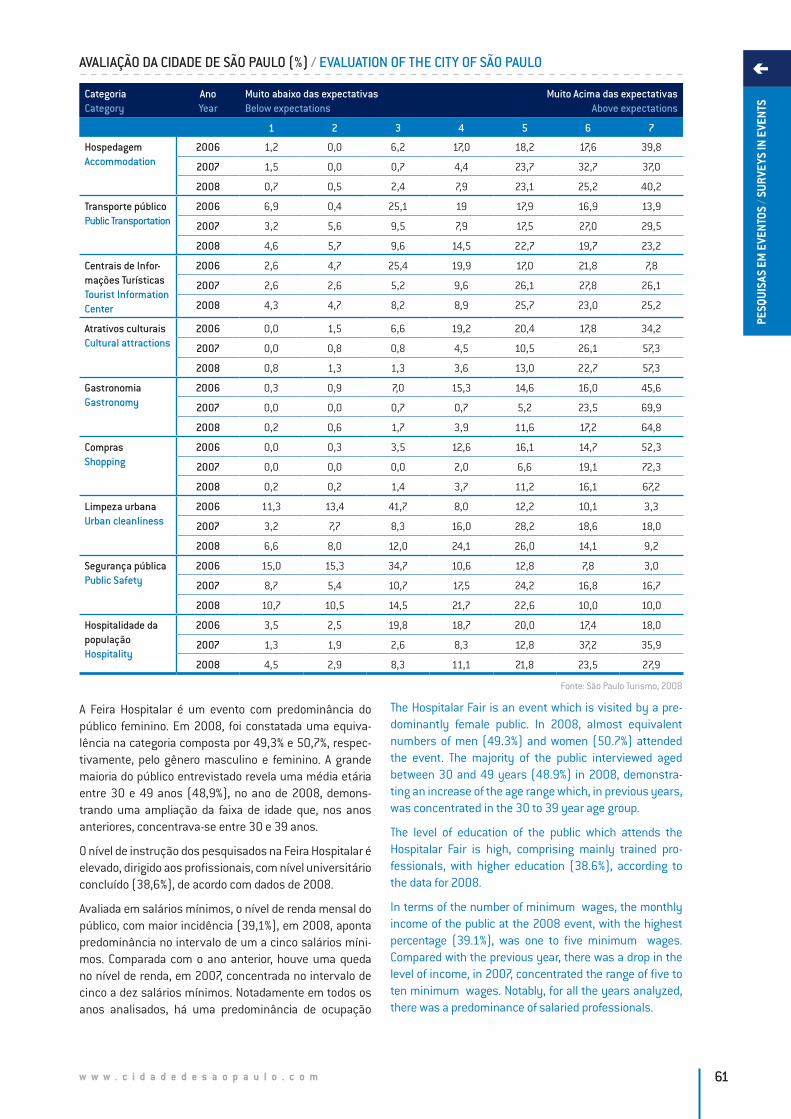
w w w . c i d a d e d e s a o p a u l o . c o m 61
PESQ
UISA
S EM
EVE
NTOS
/ SU
RVEY
S IN
EVE
NTS
CategoriaCategory
AnoYear
Muito abaixo das expectativasBelow expectations
Muito Acima das expectativasAbove expectations
1 2 3 4 5 6 7
HospedagemAccommodation
2006 1,2 0,0 6,2 17,0 18,2 17,6 39,8
2007 1,5 0,0 0,7 4,4 23,7 32,7 37,0
2008 0,7 0,5 2,4 7,9 23,1 25,2 40,2
Transporte públicoPublic Transportation
2006 6,9 0,4 25,1 19 17,9 16,9 13,9
2007 3,2 5,6 9,5 7,9 17,5 27,0 29,5
2008 4,6 5,7 9,6 14,5 22,7 19,7 23,2
Centrais de Infor-mações TurísticasTourist Information Center
2006 2,6 4,7 25,4 19,9 17,0 21,8 7,8
2007 2,6 2,6 5,2 9,6 26,1 27,8 26,1
2008 4,3 4,7 8,2 8,9 25,7 23,0 25,2
Atrativos culturaisCultural attractions
2006 0,0 1,5 6,6 19,2 20,4 17,8 34,2
2007 0,0 0,8 0,8 4,5 10,5 26,1 57,3
2008 0,8 1,3 1,3 3,6 13,0 22,7 57,3
GastronomiaGastronomy
2006 0,3 0,9 7,0 15,3 14,6 16,0 45,6
2007 0,0 0,0 0,7 0,7 5,2 23,5 69,9
2008 0,2 0,6 1,7 3,9 11,6 17,2 64,8
ComprasShopping
2006 0,0 0,3 3,5 12,6 16,1 14,7 52,3
2007 0,0 0,0 0,0 2,0 6,6 19,1 72,3
2008 0,2 0,2 1,4 3,7 11,2 16,1 67,2
Limpeza urbanaUrban cleanliness
2006 11,3 13,4 41,7 8,0 12,2 10,1 3,3
2007 3,2 7,7 8,3 16,0 28,2 18,6 18,0
2008 6,6 8,0 12,0 24,1 26,0 14,1 9,2
Segurança públicaPublic Safety
2006 15,0 15,3 34,7 10,6 12,8 7,8 3,0
2007 8,7 5,4 10,7 17,5 24,2 16,8 16,7
2008 10,7 10,5 14,5 21,7 22,6 10,0 10,0
Hospitalidade da populaçãoHospitality
2006 3,5 2,5 19,8 18,7 20,0 17,4 18,0
2007 1,3 1,9 2,6 8,3 12,8 37,2 35,9
2008 4,5 2,9 8,3 11,1 21,8 23,5 27,9
AVALIAÇÃO DA CIDADE DE SÃO PAULO (%) / EVALUATION OF THE CITY OF SÃO PAULO
A Feira Hospitalar é um evento com predominância do público feminino. Em 2008, foi constatada uma equiva-lência na categoria composta por 49,3% e 50,7%, respec-tivamente, pelo gênero masculino e feminino. A grande maioria do público entrevistado revela uma média etária entre 30 e 49 anos (48,9%), no ano de 2008, demons-trando uma ampliação da faixa de idade que, nos anos anteriores, concentrava-se entre 30 e 39 anos.
O nível de instrução dos pesquisados na Feira Hospitalar é elevado, dirigido aos profissionais, com nível universitário concluído (38,6%), de acordo com dados de 2008.
Avaliada em salários mínimos, o nível de renda mensal do público, com maior incidência (39,1%), em 2008, aponta predominância no intervalo de um a cinco salários míni-mos. Comparada com o ano anterior, houve uma queda no nível de renda, em 2007, concentrada no intervalo de cinco a dez salários mínimos. Notadamente em todos os anos analisados, há uma predominância de ocupação
The Hospitalar Fair is an event which is visited by a pre-dominantly female public. In 2008, almost equivalent numbers of men (49.3%) and women (50.7%) attended the event. The majority of the public interviewed aged between 30 and 49 years (48.9%) in 2008, demonstra-ting an increase of the age range which, in previous years, was concentrated in the 30 to 39 year age group.
The level of education of the public which attends the Hospitalar Fair is high, comprising mainly trained pro- fessionals, with higher education (38.6%), according to the data for 2008.
In terms of the number of minimum wages, the monthly income of the public at the 2008 event, with the highest percentage (39.1%), was one to five minimum wages. Compared with the previous year, there was a drop in the level of income, in 2007, concentrated the range of five to ten minimum wages. Notably, for all the years analyzed, there was a predominance of salaried professionals.
Fonte: São Paulo Turismo, 2008
w w w . c i d a d e d e s a o p a u l o . c o m62
PESQ
UISA
S EM
EVE
NTOS
/ SU
RVEY
S IN
EVE
NTS
profissional pelo assalariado com registro formal.
O gasto médio dos brasileiros pesquisados durante a visita à Cidade de São Paulo foi da ordem de R$ 1352,75, em 2008, enquanto dos estrangeiros foi de US$ 1307.65.
Dos gastos apontados, há predominância dos dispêndios em compras (36,7%), particularmente por instrumen-tos, equipamentos e outros bens relacionados à área de saúde hospitalar e odontológica. Em 2008, seguem as opções de gastos em hospedagem (24,1%), alimenta-ção (16,5%), transporte (12,3%) e lazer (10,4%).
O número apontado de pernoites em 2008 foi de 2,5, considerando a utilização da hospedagem em hotéis/flats da Cidade de São Paulo como predominante (82,0%). O motivo da viagem apontado é de negócios/trabalho (98,0%) direcionado para a área de saúde. Motivações de viagens por lazer, visitas aos amigos/parentes e estudos são inexpressivas.
Com incidência majoritária mensal no período analisado (2006 a 2008), a freqüência de visitantes demonstra amplitude de maior elasticidade para o ano de 2008, com valores distribuídos no decorrer da avaliação mensal (23,9%), semestral (23%) e anual (23,6%).
Com um público predominante de visitantes (61,4%), no ano de 2008, a maioria desses turistas é procedente de cidades do interior do Estado de São Paulo, ordenadas pelas cinco principais, a saber: Campinas, São José dos Campos, Ribeirão Preto, Sorocaba e São Carlos.
Na quase totalidade a Feira Hospitalar atrai um número bastante expressivo de brasileiros (96,4%) em 2008, (97,2%) em 2007, e (97,5%) em 2006, basicamente pro-cedentes do Rio de Janeiro, Belo Horizonte, Curitiba, Porto Alegre e Goiânia. A incidência de turistas estrangeiros na Feira Hospitalar, em 2008, foi mais expressiva (3,6%) que os anos anteriores.
No que se refere à avaliação específica dos itens, direta e indiretamente, ligados ao turismo, podemos classificar na categoria de ótimo (hospedagem, atrativos culturais, gas-tronomia, compras); muito bom (hospitalidade da popula-ção) bom (transporte público, CITs,); e, regular (limpeza urbana, segurança pública).
Nota-se uma redução, no ano de 2008, do nível das expectativas positivas de todos os itens, incluindo a hospitalidade da população (27,9%); com exceção do item sobre a hospedagem (40,2%), que continua bem avaliado, com expectativa muito acima da registrada no ano de 2007.
Em 2008 observou-se a participação de 39,3% de médi-cos, dentistas e profissionais de saúde, com destaque para cardiologia e oncologia como as especialidades médicas mais procuradas pelos clientes-pacientes na Cidade de São Paulo.
The average spending of the Brazilians interviewed, during the visit to the City of São Paulo, was around R$ 1352.75 in 2008, while that of foreigners was US$ 1307.65.
In 2008 most of this amount was spent on shopping (36.7%), particularly instruments, equipment and other goods related to the field of hospital and odontological health. This was followed by accommodation (24.1%), food and drink (16.5%), transportation (12.3%) and leisure (10.4%).
The number of nights spent in the city in 2008 was 2.5, with hotels/apartments in the City of São Paulo being the main accommodation facilities (82.0%). The main purpose of the trip was business/work (98.0%) focusing on the field of health. The other motivations - leisure, visits to friends/family and study - were insignificant.
In terms of frequency of visits, the majority visited the city on a monthly basis during the period analyzed (2006 to 2008). The frequency of visitors showed a greater varia-tion for the year 2008, with values evenly distributed into monthly (23.9%), weekly (23%) and annually (23.6%).
With the public comprised mainly of visitors from outside the State of São Paulo (61.4%) in 2008, the majority of these tourists were from cities in the interior of the State of São Paulo, particularly Campinas, São José dos Campos, Ribeirão Preto, Sorocaba and São Carlos, in that order.
Almost all visitors of the Hospitalar Fair were Brazilians (96.4%) in 2008, (97.2%) in 2007, and (97.5%) in 2006, mainly from the cities of Rio de Janeiro, Belo Horizonte, Curitiba, Porto Alegre and Goiânia. The number of foreign tourists at the Hospitalar Fair in 2008 was more signifi-cant (3.6%) than other years.
In the specific evaluation of the items directly and indirectly linked to tourism, these were classified according to the categories excellent (accommodation, cultural attractions, gastronomy, shopping); very good (hospitality of the population); good (public transporta-tion, Tourist Information Centers); and regular (urban cleanliness, public safety).
In 2008, a reduction in the level of positive evaluations of all items including the hospitality of the population (27,9%), was registered, with the exception of accom-modation (40.2%), which continued to score highly, with expectations far above those registered for 2007.
In 2008, 39.3% participants were comprised of doctors, dentists and health professionals. Cardiologists and oncologists were the medical specialties most sought after by client-patients in the City of São Paulo.

w w w . c i d a d e d e s a o p a u l o . c o m 63
PESQ
UISA
S EM
EVE
NTOS
/ SU
RVEY
S IN
EVE
NTS
PARADA DO ORGULHO GLBTGLBT PARADE
Milhões na Avenida PaulistaMuitos turistas chegam anualmente à cidade de São Paulo para curtir a Parada GLBT que, de forma geral, agrega um público de 3 milhões de pessoas (segundo a Associa-ção da Parada do Orgulho GLBT de São Paulo) na Avenida Paulista, Rua da Consolação e adjacências. É estimado que o evento de 2008, na sua 12ª edição, tenha atraído um total de 320 mil visitantes, 20% a mais do que o ano anterior e 40% a mais que 2006 - desses turistas, 5% são estrangeiros. Em termos financeiros, considera-se que tenha gerado R$ 189 milhões, caracterizando-se como o segundo maior evento em movimentação econômica com o turismo na cidade.
Millions crowd Avenida PaulistaMany tourists arrive each year in São Paulo for the GLBT Parade, which in general, gathers a public of 3 million people in Avenida Paulista (according to the Associação da Parada do Orgulho GLBT de São Paulo), Rua da Conso-lação and adjacent streets. It is estimated that the 2008 event, now in its 12th edition, attracted an estimated total of 320 thousand visitors, 20% more than the previous year and 40% more than 2006 – of these tourists 5% were foreigners. In financial terms, the event is considered to have generated R$189 million, making it the second largest event in terms of economic income from tourism in the city.
RENDA MENSAL (R$) / MONTHLY INCOME
Fonte: São Paulo Turismo, 2008Média de questionários aplicados / Average surveys applied: 1500
Estimativa de Turistas / Tourists forecast: 320000
Salários Mínimos* / Minimum wages 2005 2006 2007 2008
Até 1 / Less than 1 9,1 8,7 11,7 14,7
1 a 5 / 1 to 5 53,0 47,8 48,8 57,0
6 a 10 / 6 to 10 17,0 24,5 22,2 16,0
11 a 15 / 11 to 15 9,5 9,6 9,3 5,5
16 a 20 / 16 to 20 3,0 3,7 3,4 2,5
21 a 25 / 21 to 25 4,4 2,3 2,3 1,6
Mais de 25 / More than 25 4,0 3,4 2,3 2,7
FAIXA ETÁRIA (%) / AGE GROUP
Categoria / Category 2005 2006 2007 2008
De 18 a 24 anos / 18 to 24 years old 37,0 39,0 38,9 40,3
De 25 a 29 anos / 25 to 29 years old 28,0 21,1 20,8 19,9
De 30 a 39 anos / 30 to 39 years old 19,0 21,9 19,0 21,2
De 40 a 49 anos / 40 to 49 years old 10,0 12,9 14,3 12,3
De 50 a 59 anos / 50 to 59 years old 4,0 4,2 5,5 4,1
Mais de 60 anos / Older than 60 years 2,0 0,9 1,5 2,2
GÊNERO / GENDER
AnoYear
MasculinoMale
FemininoFemale
2005 66,0 34,0
2006 61,0 39,0
2007 60,0 40,0
2008 53,0 47,0
PRINCIPAL EMISSOR INTERNACIONAL (2008) / MAIN ORIGIN OF TOURISTS
Estados UnidosGASTOS NO EVENTO (2008) / EVENT’S SPENDING
R$ 100,72
*Salário mínimo vigente no ano / Year official minimum wage
Fonte: São Paulo Turismo, 2008

w w w . c i d a d e d e s a o p a u l o . c o m64
PESQ
UISA
S EM
EVE
NTOS
/ SU
RVEY
S IN
EVE
NTS
OCUPAÇÃO PROFISSIONAL (%) / PROFESSIONAL STATUS
Ocupação / Status 2005 2006 2007 2008
Assalariado com Registro / Registered employee 29,0 37,9 44,4 44,8
Assalariado sem Registro / Unregistered employee 8,0 7,3 9,3 8,5
Funcionário Público / Civil servant 8,0 11,0 6,9 8,6
Profissional Liberal / Freelancer 15,0 6,0 1,9 4,5
Autônomo / Self-employed 15,0 15,6 16,1 13,9
Estudante / Student 12,0 13,3 10,1 9,9
Empresário / Business owner 3,0 2,4 4,0 3,8
Aposentado/ Pensionista / Retired/ Living on allowance 2,0 2,4 1,9 2,3
Dona de Casa / Housewife 2,0 0,8 0,9 1,1
Desempregado / Unemployed 6,0 3,3 4,5 2,6
FREQUÊNCIA DA VISITA (%) / FREQUENCY OF VISITS
MEIOS DE HOSPEDAGEM (%) / ACCOMMODATION FACILITIES
Categoria / Category 2005 2006 2007 2008
Primeira vez / First time – 6,5 10,1 11,5
Diária / Daily – 10,6 6,9 6,8
Semanal / Weekly – 11,9 12,9 14,2
Mensal / Monthly – 24,0 23,0 26,0
Semestral / Biannually – 28,2 22,2 16,7
Anual / Annually – 18,8 24,9 24,8
Categoria / Category 2005 2006 2007 2008
Hotel/ Flat / Hotel/ Apartment – 57,6 42,9 43,6
Casa Própria/ Alugada / Owned or rented property – 4,6 7,9 8,8
Casa de Amigos/Parentes / Home of friends or family – 36,6 46,6 45,9
Outros / Other – 1,2 2,6 1,7
MOTIVO DA VIAGEM (%) / TRAVEL MOTIVATION
Categoria / Category 2005 2006 2007 2008
Lazer / Leisure – 85,9 84,1 85,9
Negócios/ Trabalho / Business or work – 7,8 10,5 7,7
Estudos / Study – 1,9 1,9 1,2
Visitar Amigos/ Parentes / To visit friends or family – 4,4 3,5 5,2
GRAU DE INSTRUÇÃO (%) / LEVEL OF EDUCATION
Categoria / Category 2005 2006 2007 2008
Básico / Elementary 0,0 1,3 3,4 2,5
Fundamental / Fundamental 5,0 3,9 3,9 5,4
Médio / Secondary 36,0 38,0 40,6 43,5
Superior incompleto / Higher education incomplete 19,0 22,4 19,6 21,8
Superior graduado / Graduated 30,0 26,2 27,6 19,8
Pós-graduado / Postgraduated 10,0 8,2 4,9 7,0
Fonte: São Paulo Turismo, 2008
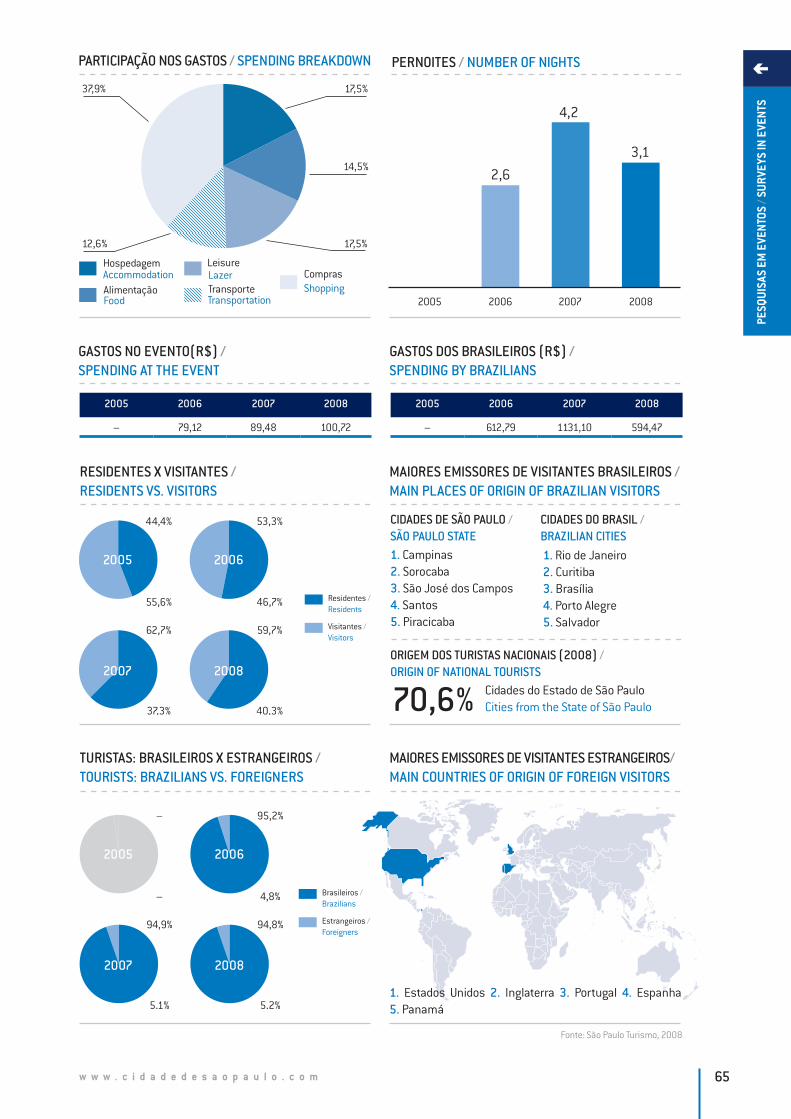
w w w . c i d a d e d e s a o p a u l o . c o m 65
PESQ
UISA
S EM
EVE
NTOS
/ SU
RVEY
S IN
EVE
NTS
PARTICIPAÇÃO NOS GASTOS / SPENDING BREAKDOWN
37,9%
14,5%
12,6%
17,5%
17,5%
HospedagemAccommodationAlimentaçãoFood
ComprasShopping
LazerLeisure
TransporteTransportation
GASTOS NO EVENTO(R$) / SPENDING AT THE EVENT
RESIDENTES X VISITANTES / RESIDENTS VS. VISITORS
MAIORES EMISSORES DE VISITANTES BRASILEIROS / MAIN PLACES OF ORIGIN OF BRAZILIAN VISITORS
TURISTAS: BRASILEIROS X ESTRANGEIROS / TOURISTS: BRAZILIANS VS. FOREIGNERS
MAIORES EMISSORES DE VISITANTES ESTRANGEIROS/ MAIN COUNTRIES OF ORIGIN OF FOREIGN VISITORS
1. Estados Unidos 2. Inglaterra 3. Portugal 4. Espanha5. Panamá
2005 2006 20082007
2,6
4,2
3,1
2005 2006 2007 2008
– 79,12 89,48 100,72
2005 2006 2007 2008
– 612,79 1131,10 594,47
Residentes / Residents
Visitantes / Visitors
2005 2006
20082007
55,6%
44,4%
37,3%
62,7%
40,3%
59,7%
46,7%
53,3%
Brasileiros / Brazilians
Estrangeiros / Foreigners
2005 2006
20082007
–
–
5,1%
94,9%
5,2%
94,8%
4,8%
95,2%
GASTOS DOS BRASILEIROS (R$) / SPENDING BY BRAZILIANS
PERNOITES / NUMBER OF NIGHTS
1. Campinas 2. Sorocaba3. São José dos Campos4. Santos5. Piracicaba
1. Rio de Janeiro 2. Curitiba 3. Brasília4. Porto Alegre5. Salvador
CIDADES DE SÃO PAULO /SÃO PAULO STATE
CIDADES DO BRASIL /BRAZILIAN CITIES
70,6% Cidades do Estado de São PauloCities from the State of São Paulo
ORIGEM DOS TURISTAS NACIONAIS (2008) / ORIGIN OF NATIONAL TOURISTS
Fonte: São Paulo Turismo, 2008
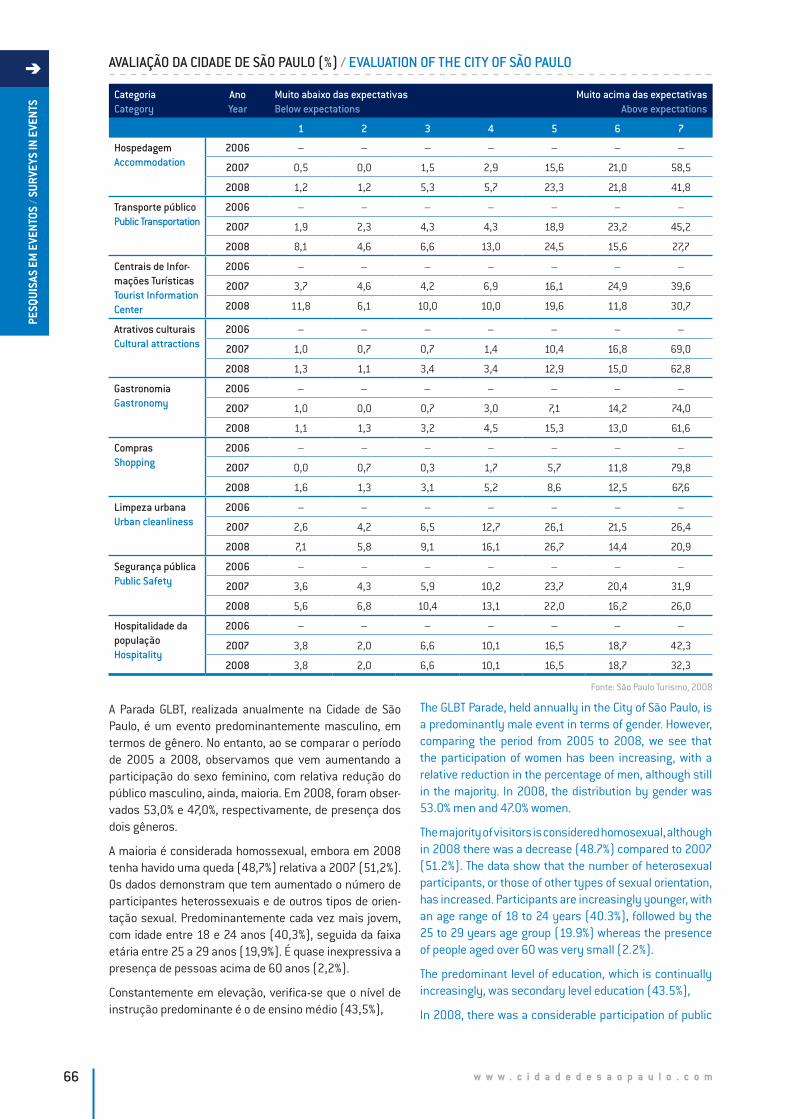
w w w . c i d a d e d e s a o p a u l o . c o m66
PESQ
UISA
S EM
EVE
NTOS
/ SU
RVEY
S IN
EVE
NTS Categoria
CategoryAnoYear
Muito abaixo das expectativasBelow expectations
Muito acima das expectativasAbove expectations
1 2 3 4 5 6 7
HospedagemAccommodation
2006 – – – – – – –
2007 0,5 0,0 1,5 2,9 15,6 21,0 58,5
2008 1,2 1,2 5,3 5,7 23,3 21,8 41,8
Transporte públicoPublic Transportation
2006 – – – – – – –
2007 1,9 2,3 4,3 4,3 18,9 23,2 45,2
2008 8,1 4,6 6,6 13,0 24,5 15,6 27,7
Centrais de Infor-mações TurísticasTourist Information Center
2006 – – – – – – –
2007 3,7 4,6 4,2 6,9 16,1 24,9 39,6
2008 11,8 6,1 10,0 10,0 19,6 11,8 30,7
Atrativos culturaisCultural attractions
2006 – – – – – – –
2007 1,0 0,7 0,7 1,4 10,4 16,8 69,0
2008 1,3 1,1 3,4 3,4 12,9 15,0 62,8
GastronomiaGastronomy
2006 – – – – – – –
2007 1,0 0,0 0,7 3,0 7,1 14,2 74,0
2008 1,1 1,3 3,2 4,5 15,3 13,0 61,6
ComprasShopping
2006 – – – – – – –
2007 0,0 0,7 0,3 1,7 5,7 11,8 79,8
2008 1,6 1,3 3,1 5,2 8,6 12,5 67,6
Limpeza urbanaUrban cleanliness
2006 – – – – – – –
2007 2,6 4,2 6,5 12,7 26,1 21,5 26,4
2008 7,1 5,8 9,1 16,1 26,7 14,4 20,9
Segurança públicaPublic Safety
2006 – – – – – – –
2007 3,6 4,3 5,9 10,2 23,7 20,4 31,9
2008 5,6 6,8 10,4 13,1 22,0 16,2 26,0
Hospitalidade da populaçãoHospitality
2006 – – – – – – –
2007 3,8 2,0 6,6 10,1 16,5 18,7 42,3
2008 3,8 2,0 6,6 10,1 16,5 18,7 32,3
AVALIAÇÃO DA CIDADE DE SÃO PAULO (%) / EVALUATION OF THE CITY OF SÃO PAULO
A Parada GLBT, realizada anualmente na Cidade de São Paulo, é um evento predominantemente masculino, em termos de gênero. No entanto, ao se comparar o período de 2005 a 2008, observamos que vem aumentando a participação do sexo feminino, com relativa redução do público masculino, ainda, maioria. Em 2008, foram obser-vados 53,0% e 47,0%, respectivamente, de presença dos dois gêneros.
A maioria é considerada homossexual, embora em 2008 tenha havido uma queda (48,7%) relativa a 2007 (51,2%). Os dados demonstram que tem aumentado o número de participantes heterossexuais e de outros tipos de orien-tação sexual. Predominantemente cada vez mais jovem, com idade entre 18 e 24 anos (40,3%), seguida da faixa etária entre 25 a 29 anos (19,9%). É quase inexpressiva a presença de pessoas acima de 60 anos (2,2%).
Constantemente em elevação, verifica-se que o nível de instrução predominante é o de ensino médio (43,5%),
The GLBT Parade, held annually in the City of São Paulo, is a predominantly male event in terms of gender. However, comparing the period from 2005 to 2008, we see that the participation of women has been increasing, with a relative reduction in the percentage of men, although still in the majority. In 2008, the distribution by gender was 53.0% men and 47.0% women.
The majority of visitors is considered homosexual, although in 2008 there was a decrease (48.7%) compared to 2007 (51.2%). The data show that the number of heterosexual participants, or those of other types of sexual orientation, has increased. Participants are increasingly younger, with an age range of 18 to 24 years (40.3%), followed by the 25 to 29 years age group (19.9%) whereas the presence of people aged over 60 was very small (2.2%).
The predominant level of education, which is continually increasingly, was secondary level education (43.5%),
In 2008, there was a considerable participation of public
Fonte: São Paulo Turismo, 2008
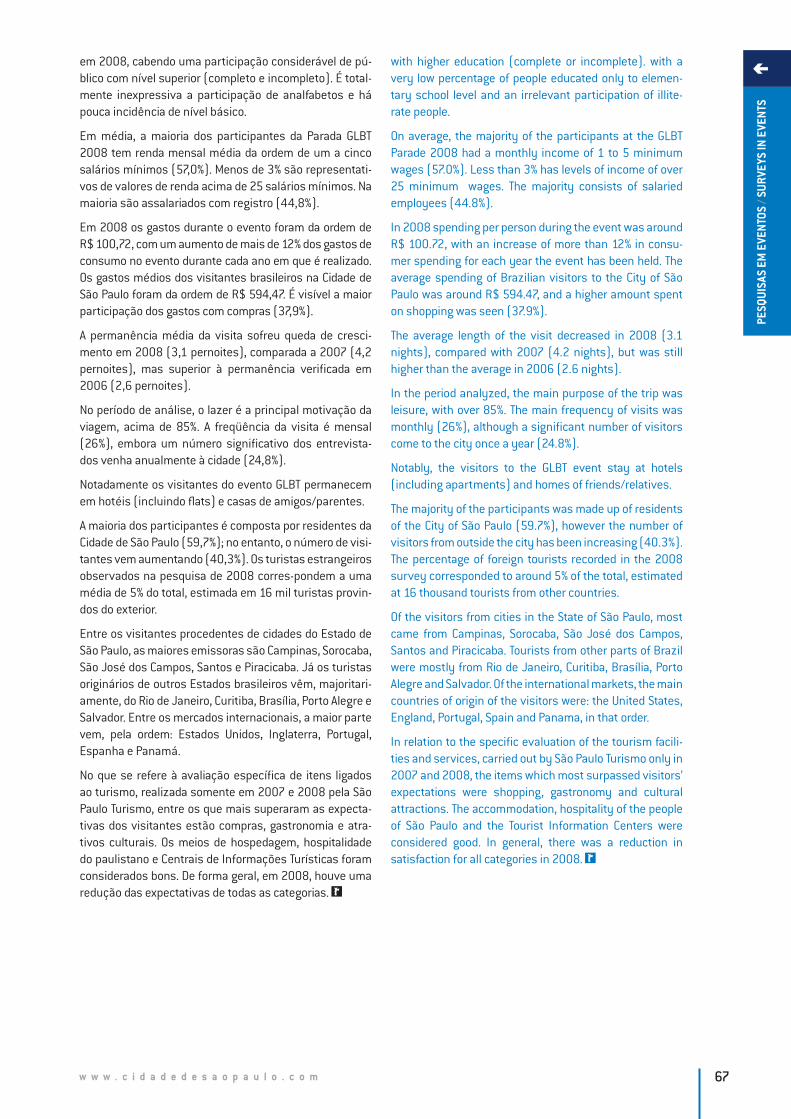
w w w . c i d a d e d e s a o p a u l o . c o m 67
PESQ
UISA
S EM
EVE
NTOS
/ SU
RVEY
S IN
EVE
NTS
em 2008, cabendo uma participação considerável de pú-blico com nível superior (completo e incompleto). É total-mente inexpressiva a participação de analfabetos e há pouca incidência de nível básico.
Em média, a maioria dos participantes da Parada GLBT 2008 tem renda mensal média da ordem de um a cinco salários mínimos (57,0%). Menos de 3% são representati-vos de valores de renda acima de 25 salários mínimos. Na maioria são assalariados com registro (44,8%).
Em 2008 os gastos durante o evento foram da ordem de R$ 100,72, com um aumento de mais de 12% dos gastos de consumo no evento durante cada ano em que é realizado. Os gastos médios dos visitantes brasileiros na Cidade de São Paulo foram da ordem de R$ 594,47. É visível a maior participação dos gastos com compras (37,9%).
A permanência média da visita sofreu queda de cresci-mento em 2008 (3,1 pernoites), comparada a 2007 (4,2 pernoites), mas superior à permanência verificada em 2006 (2,6 pernoites).
No período de análise, o lazer é a principal motivação da viagem, acima de 85%. A freqüência da visita é mensal (26%), embora um número significativo dos entrevista-dos venha anualmente à cidade (24,8%).
Notadamente os visitantes do evento GLBT permanecem em hotéis (incluindo flats) e casas de amigos/parentes.
A maioria dos participantes é composta por residentes da Cidade de São Paulo (59,7%); no entanto, o número de visi-tantes vem aumentando (40,3%). Os turistas estrangeiros observados na pesquisa de 2008 corres-pondem a uma média de 5% do total, estimada em 16 mil turistas provin-dos do exterior.
Entre os visitantes procedentes de cidades do Estado de São Paulo, as maiores emissoras são Campinas, Sorocaba, São José dos Campos, Santos e Piracicaba. Já os turistas originários de outros Estados brasileiros vêm, majoritari-amente, do Rio de Janeiro, Curitiba, Brasília, Porto Alegre e Salvador. Entre os mercados internacionais, a maior parte vem, pela ordem: Estados Unidos, Inglaterra, Portugal, Espanha e Panamá.
No que se refere à avaliação específica de itens ligados ao turismo, realizada somente em 2007 e 2008 pela São Paulo Turismo, entre os que mais superaram as expecta-tivas dos visitantes estão compras, gastronomia e atra-tivos culturais. Os meios de hospedagem, hospitalidade do paulistano e Centrais de Informações Turísticas foram considerados bons. De forma geral, em 2008, houve uma redução das expectativas de todas as categorias.
with higher education (complete or incomplete). with a very low percentage of people educated only to elemen-tary school level and an irrelevant participation of illite-rate people.
On average, the majority of the participants at the GLBT Parade 2008 had a monthly income of 1 to 5 minimum wages (57.0%). Less than 3% has levels of income of over 25 minimum wages. The majority consists of salaried employees (44.8%).
In 2008 spending per person during the event was around R$ 100.72, with an increase of more than 12% in consu-mer spending for each year the event has been held. The average spending of Brazilian visitors to the City of São Paulo was around R$ 594.47, and a higher amount spent on shopping was seen (37.9%).
The average length of the visit decreased in 2008 (3.1 nights), compared with 2007 (4.2 nights), but was still higher than the average in 2006 (2.6 nights).
In the period analyzed, the main purpose of the trip was leisure, with over 85%. The main frequency of visits was monthly (26%), although a significant number of visitors come to the city once a year (24.8%).
Notably, the visitors to the GLBT event stay at hotels (including apartments) and homes of friends/relatives.
The majority of the participants was made up of residents of the City of São Paulo (59.7%), however the number of visitors from outside the city has been increasing (40.3%). The percentage of foreign tourists recorded in the 2008 survey corresponded to around 5% of the total, estimated at 16 thousand tourists from other countries.
Of the visitors from cities in the State of São Paulo, most came from Campinas, Sorocaba, São José dos Campos, Santos and Piracicaba. Tourists from other parts of Brazil were mostly from Rio de Janeiro, Curitiba, Brasília, Porto Alegre and Salvador. Of the international markets, the main countries of origin of the visitors were: the United States, England, Portugal, Spain and Panama, in that order.
In relation to the specific evaluation of the tourism facili-ties and services, carried out by São Paulo Turismo only in 2007 and 2008, the items which most surpassed visitors’ expectations were shopping, gastronomy and cultural attractions. The accommodation, hospitality of the people of São Paulo and the Tourist Information Centers were considered good. In general, there was a reduction in satisfaction for all categories in 2008.
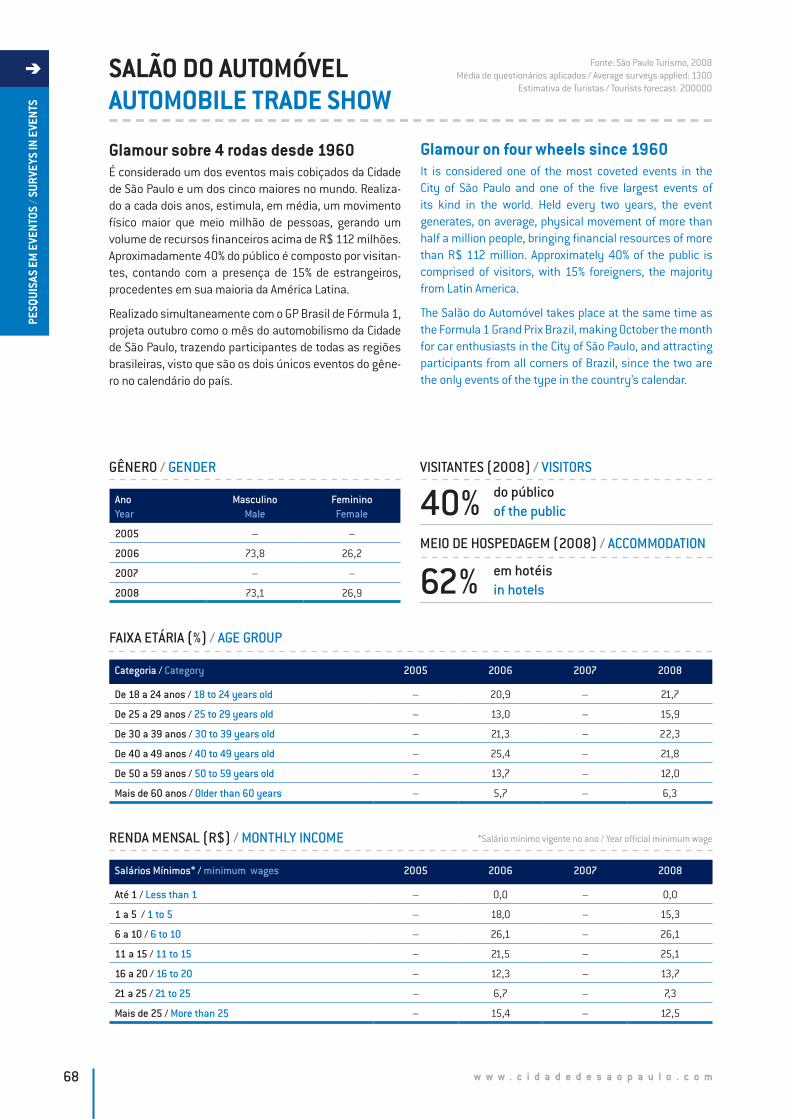
w w w . c i d a d e d e s a o p a u l o . c o m68
PESQ
UISA
S EM
EVE
NTOS
/ SU
RVEY
S IN
EVE
NTS
SALÃO DO AUTOMÓVELAUTOMOBILE TRADE SHOW
Glamour sobre 4 rodas desde 1960 É considerado um dos eventos mais cobiçados da Cidade de São Paulo e um dos cinco maiores no mundo. Realiza-do a cada dois anos, estimula, em média, um movimento físico maior que meio milhão de pessoas, gerando um volume de recursos financeiros acima de R$ 112 milhões. Aproximadamente 40% do público é composto por visitan-tes, contando com a presença de 15% de estrangeiros, procedentes em sua maioria da América Latina.
Realizado simultaneamente com o GP Brasil de Fórmula 1, projeta outubro como o mês do automobilismo da Cidade de São Paulo, trazendo participantes de todas as regiões brasileiras, visto que são os dois únicos eventos do gêne-ro no calendário do país.
Glamour on four wheels since 1960 It is considered one of the most coveted events in the City of São Paulo and one of the five largest events of its kind in the world. Held every two years, the event generates, on average, physical movement of more than half a million people, bringing financial resources of more than R$ 112 million. Approximately 40% of the public is comprised of visitors, with 15% foreigners, the majority from Latin America.
The Salão do Automóvel takes place at the same time as the Formula 1 Grand Prix Brazil, making October the month for car enthusiasts in the City of São Paulo, and attracting participants from all corners of Brazil, since the two are the only events of the type in the country’s calendar.
RENDA MENSAL (R$) / MONTHLY INCOME
Fonte: São Paulo Turismo, 2008Média de questionários aplicados / Average surveys applied: 1300
Estimativa de Turistas / Tourists forecast: 200000
Salários Mínimos* / minimum wages 2005 2006 2007 2008
Até 1 / Less than 1 – 0,0 – 0,0
1 a 5 / 1 to 5 – 18,0 – 15,3
6 a 10 / 6 to 10 – 26,1 – 26,1
11 a 15 / 11 to 15 – 21,5 – 25,1
16 a 20 / 16 to 20 – 12,3 – 13,7
21 a 25 / 21 to 25 – 6,7 – 7,3
Mais de 25 / More than 25 – 15,4 – 12,5
FAIXA ETÁRIA (%) / AGE GROUP
Categoria / Category 2005 2006 2007 2008
De 18 a 24 anos / 18 to 24 years old – 20,9 – 21,7
De 25 a 29 anos / 25 to 29 years old – 13,0 – 15,9
De 30 a 39 anos / 30 to 39 years old – 21,3 – 22,3
De 40 a 49 anos / 40 to 49 years old – 25,4 – 21,8
De 50 a 59 anos / 50 to 59 years old – 13,7 – 12,0
Mais de 60 anos / Older than 60 years – 5,7 – 6,3
GÊNERO / GENDER
AnoYear
MasculinoMale
FemininoFemale
2005 – –
2006 73,8 26,2
2007 – –
2008 73,1 26,9
VISITANTES (2008) / VISITORS
MEIO DE HOSPEDAGEM (2008) / ACCOMMODATION
40% do públicoof the public
62% em hotéisin hotels
*Salário mínimo vigente no ano / Year official minimum wage

w w w . c i d a d e d e s a o p a u l o . c o m 69
PESQ
UISA
S EM
EVE
NTOS
/ SU
RVEY
S IN
EVE
NTS
OCUPAÇÃO PROFISSIONAL (%) / PROFESSIONAL STATUS
Ocupação / Status 2005 2006 2007 2008
Assalariado com Registro / Registered employee – 36,5 – 35,1
Assalariado sem Registro / Unregistered employee – 4,4 – 2,9
Funcionário Público / Civil Servant – 7,4 – 6,3
Profissional Liberal / Freelancer – 4,3 – 4,8
Autônomo / Self-employed – 19,9 – 22,2
Estudante / Students – 8,5 – 11,2
Empresário / Business owner – 11,6 – 11,7
Aposentado/ Pensionista / Retired/ Living on allowance – 3,8 – 3,6
Dona de Casa / Housewife – 2,1 – 1,3
Desempregado / Unemployed – 1,5 – 0,9
FREQUÊNCIA DA VISITA (%) / FREQUENCY OF VISITS
MEIOS DE HOSPEDAGEM (%) / ACCOMMODATION FACILITIES
Categoria / Category 2005 2006 2007 2008
Primeira vez / First time – 3,3 – 3,8
Diária / Daily – 21,4 – 19,6
Semanal / Weekly – 17,0 – 17,9
Mensal / Monthly – 30,8 – 31,7
Semestral / Biannually – 19,8 – 20,8
Anual / Annually – 7,7 – 6,2
Categoria / Category 2005 2006 2007 2008
Hotel/ Flat / Hotel/ Apartment – 62,4 – 62,2
Casa Própria/ Alugada / Owned or rented property – 12,9 – 10,3
Casa de Amigos/Parentes / Home of friends/ family – 24,7 – 27,2
Outros / Other – 0,0 – 0,3
MOTIVO DA VIAGEM (%) / TRAVEL MOTIVATION
Categoria / Category 2005 2006 2007 2008
Lazer / Leisure – 83,6 – 84,1
Negócios/ Trabalho / Business or work – 15,4 – 13,6
Estudos / Study – 0,0 – 0,2
Visitar Amigos/ Parentes / To visit friends or family – 1,2 – 2,1
GRAU DE INSTRUÇÃO (%) / LEVEL OF EDUCATION
Categoria / Category 2005 2006 2007 2008
Básico / Elementary – 0,0 – 0,0
Fundamental / Fundamental – 0,7 – 1,3
Médio / Secondary – 22,3 – 21,1
Superior incompleto / Higher education incomplete – 16,4 – 17,0
Superior graduado / Graduated – 53,1 – 55,1
Pós-graduado / Postgraduated – 7,5 – 5,5
Fonte: São Paulo Turismo, 2008
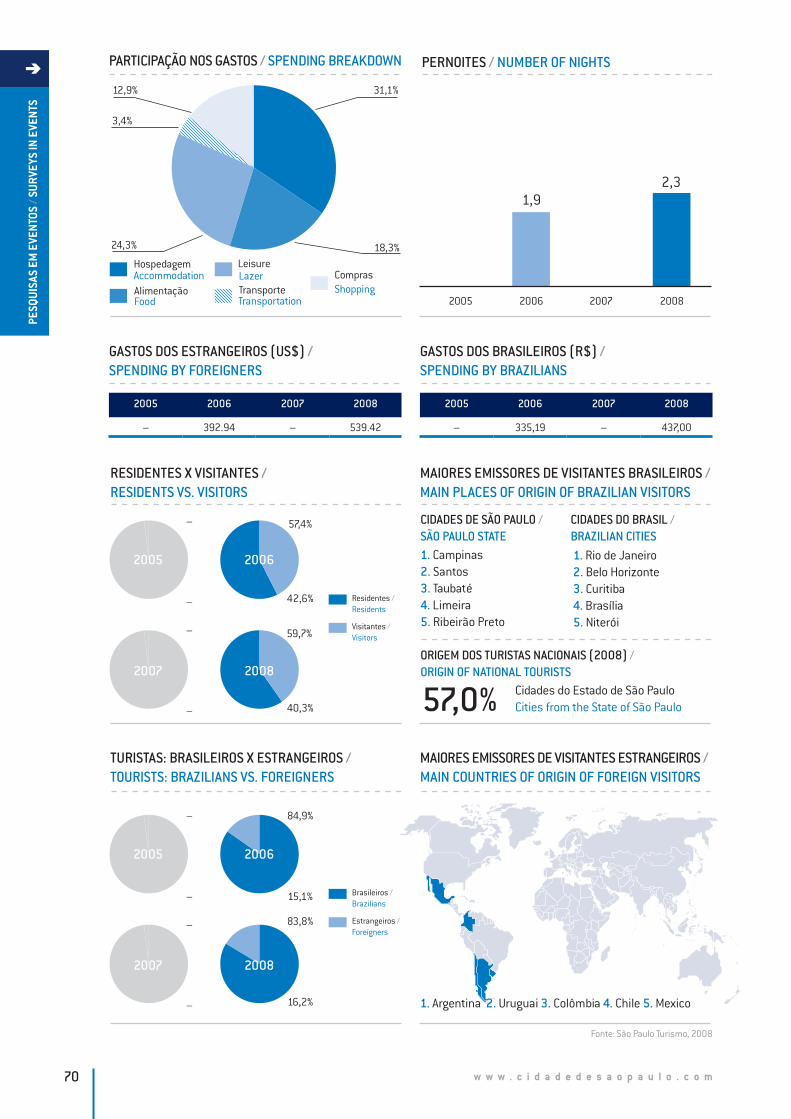
w w w . c i d a d e d e s a o p a u l o . c o m70
PESQ
UISA
S EM
EVE
NTOS
/ SU
RVEY
S IN
EVE
NTS
PARTICIPAÇÃO NOS GASTOS / SPENDING BREAKDOWN
12,9%
3,4%
18,3%
31,1%
24,3%
HospedagemAccommodationAlimentaçãoFood
ComprasShopping
LazerLeisure
TransporteTransportation
GASTOS DOS ESTRANGEIROS (US$) / SPENDING BY FOREIGNERS
RESIDENTES X VISITANTES / RESIDENTS VS. VISITORS
MAIORES EMISSORES DE VISITANTES BRASILEIROS / MAIN PLACES OF ORIGIN OF BRAZILIAN VISITORS
TURISTAS: BRASILEIROS X ESTRANGEIROS / TOURISTS: BRAZILIANS VS. FOREIGNERS
MAIORES EMISSORES DE VISITANTES ESTRANGEIROS / MAIN COUNTRIES OF ORIGIN OF FOREIGN VISITORS
1. Argentina 2. Uruguai 3. Colômbia 4. Chile 5. Mexico
2005 2006 20082007
1,92,3
2005 2006 2007 2008
– 392.94 – 539.42
2005 2006 2007 2008
– 335,19 – 437,00
Residentes / Residents
Visitantes / Visitors
2005 2006
20082007
–
–
–
–
57,4%
42,6%
40,3%
59,7%
Brasileiros / Brazilians
Estrangeiros / Foreigners
2005 2006
20082007
–
–
–
–
15,1%
84,9%
16,2%
83,8%
GASTOS DOS BRASILEIROS (R$) / SPENDING BY BRAZILIANS
PERNOITES / NUMBER OF NIGHTS
1. Campinas 2. Santos3. Taubaté4. Limeira5. Ribeirão Preto
1. Rio de Janeiro2. Belo Horizonte3. Curitiba4. Brasília5. Niterói
CIDADES DE SÃO PAULO /SÃO PAULO STATE
CIDADES DO BRASIL /BRAZILIAN CITIES
57,0% Cidades do Estado de São PauloCities from the State of São Paulo
ORIGEM DOS TURISTAS NACIONAIS (2008) / ORIGIN OF NATIONAL TOURISTS
Fonte: São Paulo Turismo, 2008
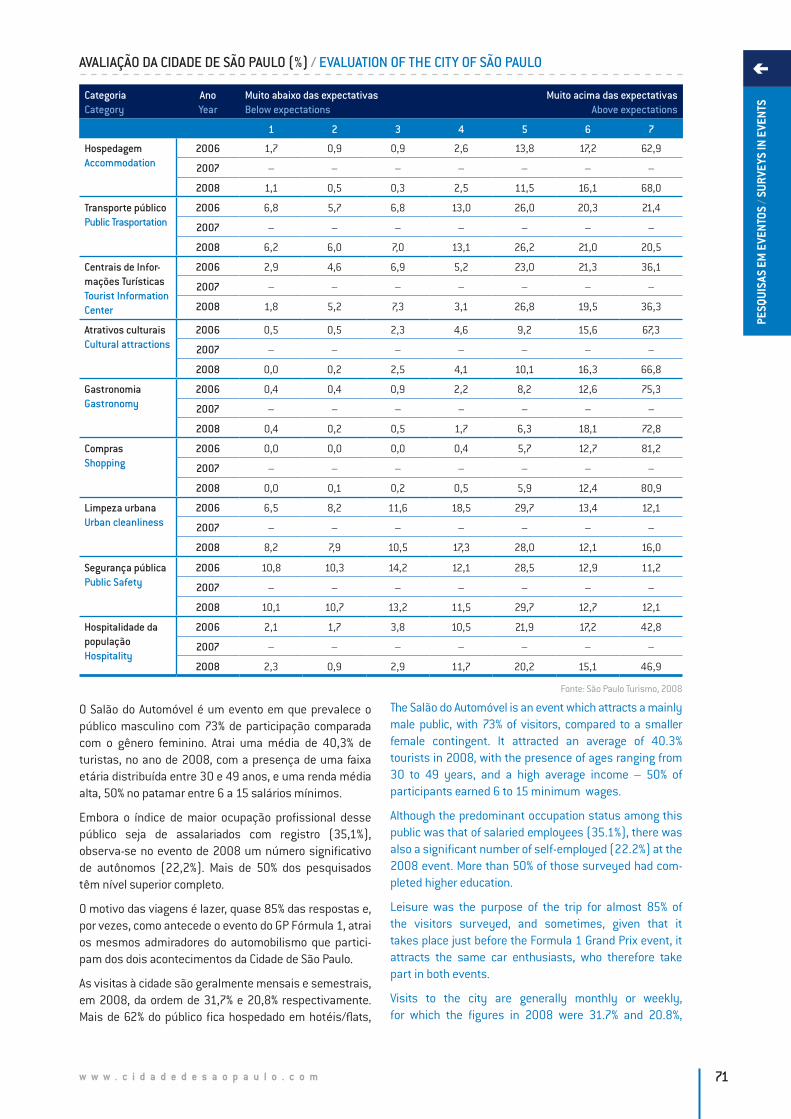
w w w . c i d a d e d e s a o p a u l o . c o m 71
PESQ
UISA
S EM
EVE
NTOS
/ SU
RVEY
S IN
EVE
NTSCategoria
CategoryAnoYear
Muito abaixo das expectativasBelow expectations
Muito acima das expectativasAbove expectations
1 2 3 4 5 6 7
HospedagemAccommodation
2006 1,7 0,9 0,9 2,6 13,8 17,2 62,9
2007 – – – – – – –
2008 1,1 0,5 0,3 2,5 11,5 16,1 68,0
Transporte públicoPublic Trasportation
2006 6,8 5,7 6,8 13,0 26,0 20,3 21,4
2007 – – – – – – –
2008 6,2 6,0 7,0 13,1 26,2 21,0 20,5
Centrais de Infor-mações TurísticasTourist Information Center
2006 2,9 4,6 6,9 5,2 23,0 21,3 36,1
2007 – – – – – – –
2008 1,8 5,2 7,3 3,1 26,8 19,5 36,3
Atrativos culturaisCultural attractions
2006 0,5 0,5 2,3 4,6 9,2 15,6 67,3
2007 – – – – – – –
2008 0,0 0,2 2,5 4,1 10,1 16,3 66,8
GastronomiaGastronomy
2006 0,4 0,4 0,9 2,2 8,2 12,6 75,3
2007 – – – – – – –
2008 0,4 0,2 0,5 1,7 6,3 18,1 72,8
ComprasShopping
2006 0,0 0,0 0,0 0,4 5,7 12,7 81,2
2007 – – – – – – –
2008 0,0 0,1 0,2 0,5 5,9 12,4 80,9
Limpeza urbanaUrban cleanliness
2006 6,5 8,2 11,6 18,5 29,7 13,4 12,1
2007 – – – – – – –
2008 8,2 7,9 10,5 17,3 28,0 12,1 16,0
Segurança públicaPublic Safety
2006 10,8 10,3 14,2 12,1 28,5 12,9 11,2
2007 – – – – – – –
2008 10,1 10,7 13,2 11,5 29,7 12,7 12,1
Hospitalidade da populaçãoHospitality
2006 2,1 1,7 3,8 10,5 21,9 17,2 42,8
2007 – – – – – – –
2008 2,3 0,9 2,9 11,7 20,2 15,1 46,9
AVALIAÇÃO DA CIDADE DE SÃO PAULO (%) / EVALUATION OF THE CITY OF SÃO PAULO
O Salão do Automóvel é um evento em que prevalece o público masculino com 73% de participação comparada com o gênero feminino. Atrai uma média de 40,3% de turistas, no ano de 2008, com a presença de uma faixa etária distribuída entre 30 e 49 anos, e uma renda média alta, 50% no patamar entre 6 a 15 salários mínimos.
Embora o índice de maior ocupação profissional desse público seja de assalariados com registro (35,1%), observa-se no evento de 2008 um número significativo de autônomos (22,2%). Mais de 50% dos pesquisados têm nível superior completo.
O motivo das viagens é lazer, quase 85% das respostas e, por vezes, como antecede o evento do GP Fórmula 1, atrai os mesmos admiradores do automobilismo que partici-pam dos dois acontecimentos da Cidade de São Paulo.
As visitas à cidade são geralmente mensais e semestrais, em 2008, da ordem de 31,7% e 20,8% respectivamente. Mais de 62% do público fica hospedado em hotéis/flats,
The Salão do Automóvel is an event which attracts a mainly male public, with 73% of visitors, compared to a smaller female contingent. It attracted an average of 40.3% tourists in 2008, with the presence of ages ranging from 30 to 49 years, and a high average income – 50% of participants earned 6 to 15 minimum wages.
Although the predominant occupation status among this public was that of salaried employees (35.1%), there was also a significant number of self-employed (22.2%) at the 2008 event. More than 50% of those surveyed had com-pleted higher education.
Leisure was the purpose of the trip for almost 85% of the visitors surveyed, and sometimes, given that it takes place just before the Formula 1 Grand Prix event, it attracts the same car enthusiasts, who therefore take part in both events.
Visits to the city are generally monthly or weekly, for which the figures in 2008 were 31.7% and 20.8%,
Fonte: São Paulo Turismo, 2008
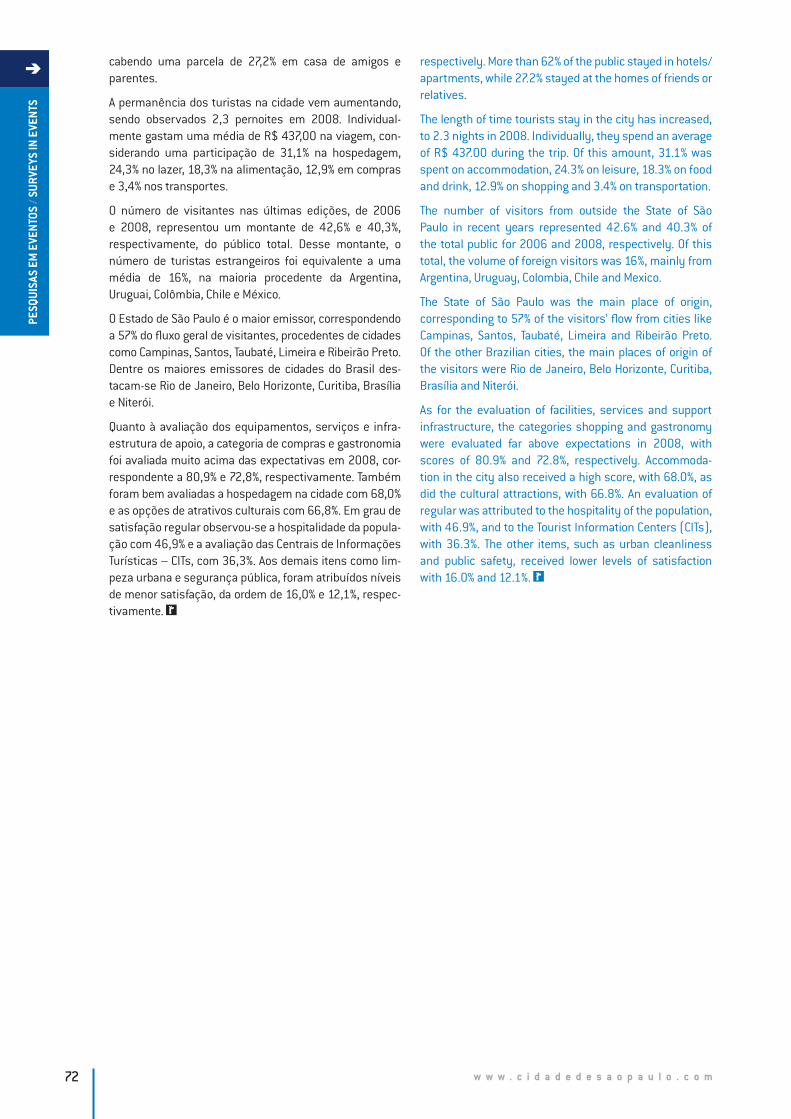
w w w . c i d a d e d e s a o p a u l o . c o m72
PESQ
UISA
S EM
EVE
NTOS
/ SU
RVEY
S IN
EVE
NTS
cabendo uma parcela de 27,2% em casa de amigos e parentes.
A permanência dos turistas na cidade vem aumentando, sendo observados 2,3 pernoites em 2008. Individual-mente gastam uma média de R$ 437,00 na viagem, con-siderando uma participação de 31,1% na hospedagem, 24,3% no lazer, 18,3% na alimentação, 12,9% em compras e 3,4% nos transportes.
O número de visitantes nas últimas edições, de 2006 e 2008, representou um montante de 42,6% e 40,3%, respectivamente, do público total. Desse montante, o número de turistas estrangeiros foi equivalente a uma média de 16%, na maioria procedente da Argentina, Uruguai, Colômbia, Chile e México.
O Estado de São Paulo é o maior emissor, correspondendo a 57% do fluxo geral de visitantes, procedentes de cidades como Campinas, Santos, Taubaté, Limeira e Ribeirão Preto. Dentre os maiores emissores de cidades do Brasil des-tacam-se Rio de Janeiro, Belo Horizonte, Curitiba, Brasília e Niterói.
Quanto à avaliação dos equipamentos, serviços e infra-estrutura de apoio, a categoria de compras e gastronomia foi avaliada muito acima das expectativas em 2008, cor-respondente a 80,9% e 72,8%, respectivamente. Também foram bem avaliadas a hospedagem na cidade com 68,0% e as opções de atrativos culturais com 66,8%. Em grau de satisfação regular observou-se a hospitalidade da popula-ção com 46,9% e a avaliação das Centrais de Informações Turísticas – CITs, com 36,3%. Aos demais itens como lim-peza urbana e segurança pública, foram atribuídos níveis de menor satisfação, da ordem de 16,0% e 12,1%, respec-tivamente.
respectively. More than 62% of the public stayed in hotels/apartments, while 27.2% stayed at the homes of friends or relatives.
The length of time tourists stay in the city has increased, to 2.3 nights in 2008. Individually, they spend an average of R$ 437.00 during the trip. Of this amount, 31.1% was spent on accommodation, 24.3% on leisure, 18.3% on food and drink, 12.9% on shopping and 3.4% on transportation.
The number of visitors from outside the State of São Paulo in recent years represented 42.6% and 40.3% of the total public for 2006 and 2008, respectively. Of this total, the volume of foreign visitors was 16%, mainly from Argentina, Uruguay, Colombia, Chile and Mexico.
The State of São Paulo was the main place of origin, corresponding to 57% of the visitors’ flow from cities like Campinas, Santos, Taubaté, Limeira and Ribeirão Preto. Of the other Brazilian cities, the main places of origin of the visitors were Rio de Janeiro, Belo Horizonte, Curitiba, Brasília and Niterói.
As for the evaluation of facilities, services and support infrastructure, the categories shopping and gastronomy were evaluated far above expectations in 2008, with scores of 80.9% and 72.8%, respectively. Accommoda-tion in the city also received a high score, with 68.0%, as did the cultural attractions, with 66.8%. An evaluation of regular was attributed to the hospitality of the population, with 46.9%, and to the Tourist Information Centers (CITs), with 36.3%. The other items, such as urban cleanliness and public safety, received lower levels of satisfaction with 16.0% and 12.1%.
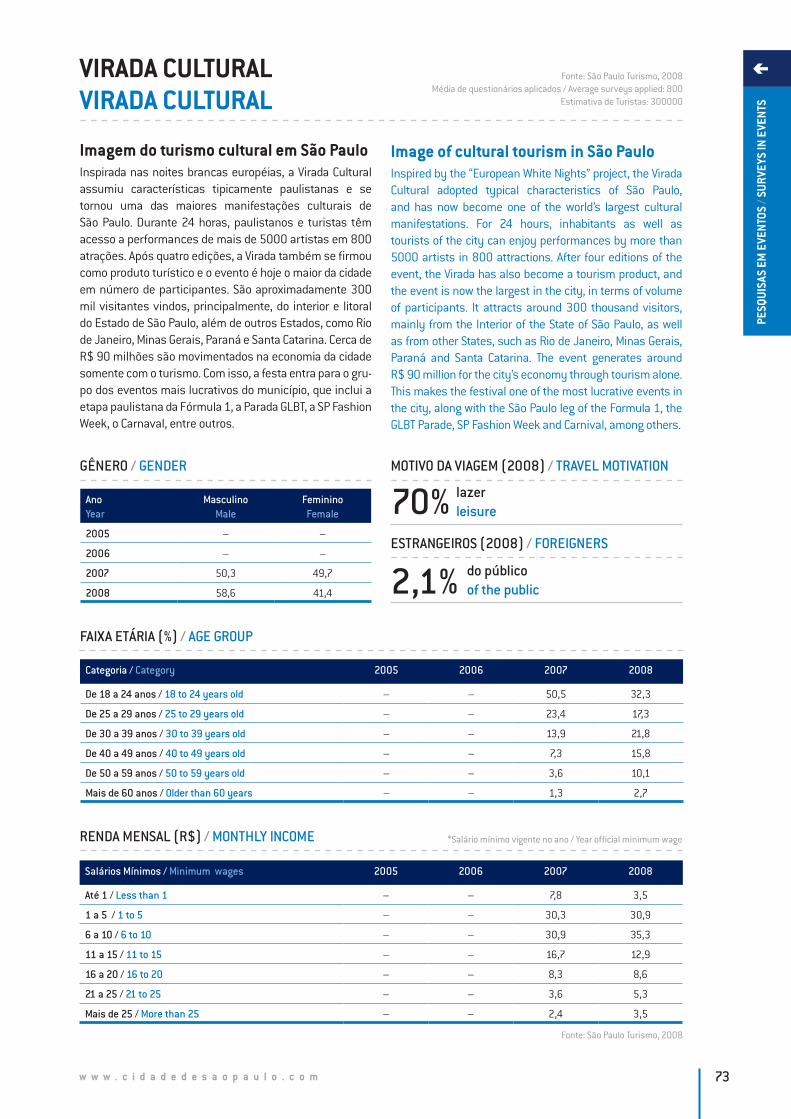
w w w . c i d a d e d e s a o p a u l o . c o m 73
PESQ
UISA
S EM
EVE
NTOS
/ SU
RVEY
S IN
EVE
NTS
VIRADA CULTURALVIRADA CULTURAL
Imagem do turismo cultural em São PauloInspirada nas noites brancas européias, a Virada Cultural assumiu características tipicamente paulistanas e se tornou uma das maiores manifestações culturais de São Paulo. Durante 24 horas, paulistanos e turistas têm acesso a performances de mais de 5000 artistas em 800 atrações. Após quatro edições, a Virada também se firmou como produto turístico e o evento é hoje o maior da cidade em número de participantes. São aproximadamente 300 mil visitantes vindos, principalmente, do interior e litoral do Estado de São Paulo, além de outros Estados, como Rio de Janeiro, Minas Gerais, Paraná e Santa Catarina. Cerca de R$ 90 milhões são movimentados na economia da cidade somente com o turismo. Com isso, a festa entra para o gru-po dos eventos mais lucrativos do município, que inclui a etapa paulistana da Fórmula 1, a Parada GLBT, a SP Fashion Week, o Carnaval, entre outros.
Image of cultural tourism in São PauloInspired by the “European White Nights” project, the Virada Cultural adopted typical characteristics of São Paulo, and has now become one of the world’s largest cultural manifestations. For 24 hours, inhabitants as well as tourists of the city can enjoy performances by more than 5000 artists in 800 attractions. After four editions of the event, the Virada has also become a tourism product, and the event is now the largest in the city, in terms of volume of participants. It attracts around 300 thousand visitors, mainly from the Interior of the State of São Paulo, as well as from other States, such as Rio de Janeiro, Minas Gerais, Paraná and Santa Catarina. The event generates around R$ 90 million for the city’s economy through tourism alone. This makes the festival one of the most lucrative events in the city, along with the São Paulo leg of the Formula 1, the GLBT Parade, SP Fashion Week and Carnival, among others.
RENDA MENSAL (R$) / MONTHLY INCOME
Fonte: São Paulo Turismo, 2008Média de questionários aplicados / Average surveys applied: 800
Estimativa de Turistas: 300000
Salários Mínimos / Minimum wages 2005 2006 2007 2008
Até 1 / Less than 1 – – 7,8 3,5
1 a 5 / 1 to 5 – – 30,3 30,9
6 a 10 / 6 to 10 – – 30,9 35,3
11 a 15 / 11 to 15 – – 16,7 12,9
16 a 20 / 16 to 20 – – 8,3 8,6
21 a 25 / 21 to 25 – – 3,6 5,3
Mais de 25 / More than 25 – – 2,4 3,5
FAIXA ETÁRIA (%) / AGE GROUP
Categoria / Category 2005 2006 2007 2008
De 18 a 24 anos / 18 to 24 years old – – 50,5 32,3
De 25 a 29 anos / 25 to 29 years old – – 23,4 17,3
De 30 a 39 anos / 30 to 39 years old – – 13,9 21,8
De 40 a 49 anos / 40 to 49 years old – – 7,3 15,8
De 50 a 59 anos / 50 to 59 years old – – 3,6 10,1
Mais de 60 anos / Older than 60 years – – 1,3 2,7
GÊNERO / GENDER
AnoYear
MasculinoMale
FemininoFemale
2005 – –
2006 – –
2007 50,3 49,7
2008 58,6 41,4
MOTIVO DA VIAGEM (2008) / TRAVEL MOTIVATION
ESTRANGEIROS (2008) / FOREIGNERS
70% lazerleisure
2,1% do públicoof the public
*Salário mínimo vigente no ano / Year official minimum wage
Fonte: São Paulo Turismo, 2008
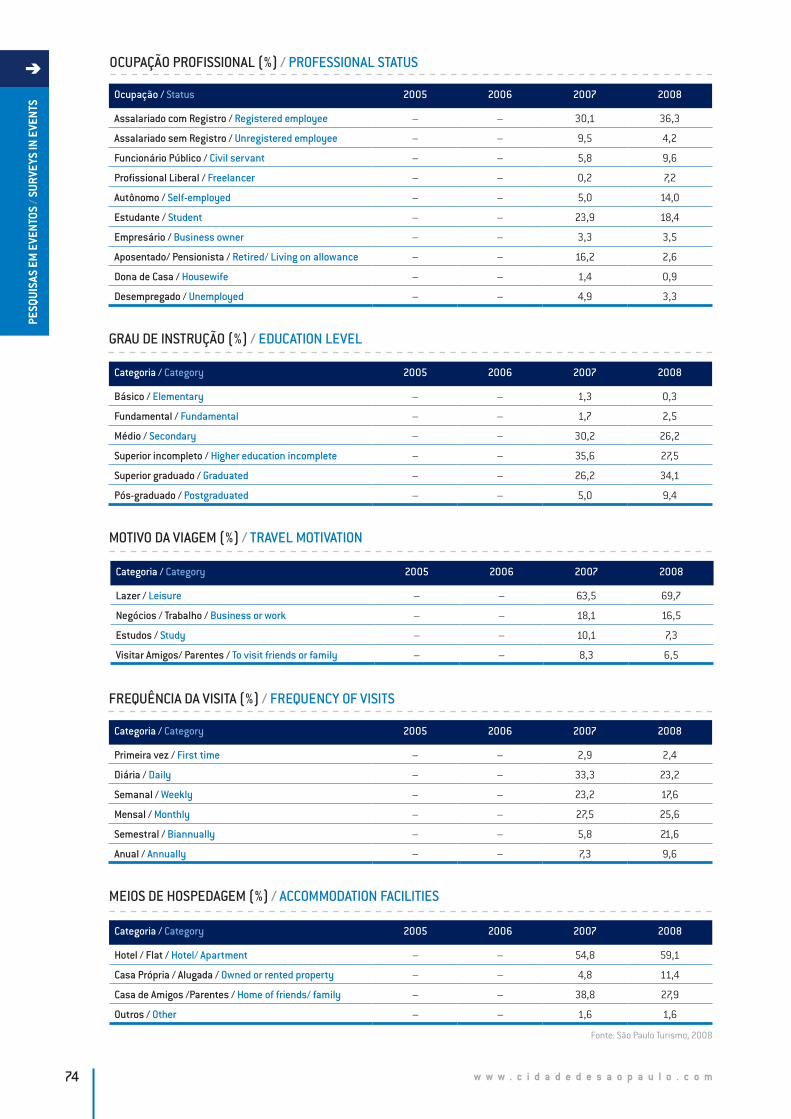
w w w . c i d a d e d e s a o p a u l o . c o m74
PESQ
UISA
S EM
EVE
NTOS
/ SU
RVEY
S IN
EVE
NTS
OCUPAÇÃO PROFISSIONAL (%) / PROFESSIONAL STATUS
Ocupação / Status 2005 2006 2007 2008
Assalariado com Registro / Registered employee – – 30,1 36,3
Assalariado sem Registro / Unregistered employee – – 9,5 4,2
Funcionário Público / Civil servant – – 5,8 9,6
Profissional Liberal / Freelancer – – 0,2 7,2
Autônomo / Self-employed – – 5,0 14,0
Estudante / Student – – 23,9 18,4
Empresário / Business owner – – 3,3 3,5
Aposentado/ Pensionista / Retired/ Living on allowance – – 16,2 2,6
Dona de Casa / Housewife – – 1,4 0,9
Desempregado / Unemployed – – 4,9 3,3
FREQUÊNCIA DA VISITA (%) / FREQUENCY OF VISITS
MEIOS DE HOSPEDAGEM (%) / ACCOMMODATION FACILITIES
Categoria / Category 2005 2006 2007 2008
Primeira vez / First time – – 2,9 2,4
Diária / Daily – – 33,3 23,2
Semanal / Weekly – – 23,2 17,6
Mensal / Monthly – – 27,5 25,6
Semestral / Biannually – – 5,8 21,6
Anual / Annually – – 7,3 9,6
Categoria / Category 2005 2006 2007 2008
Hotel / Flat / Hotel/ Apartment – – 54,8 59,1
Casa Própria / Alugada / Owned or rented property – – 4,8 11,4
Casa de Amigos /Parentes / Home of friends/ family – – 38,8 27,9
Outros / Other – – 1,6 1,6
MOTIVO DA VIAGEM (%) / TRAVEL MOTIVATION
Categoria / Category 2005 2006 2007 2008
Lazer / Leisure – – 63,5 69,7
Negócios / Trabalho / Business or work – – 18,1 16,5
Estudos / Study – – 10,1 7,3
Visitar Amigos/ Parentes / To visit friends or family – – 8,3 6,5
GRAU DE INSTRUÇÃO (%) / EDUCATION LEVEL
Categoria / Category 2005 2006 2007 2008
Básico / Elementary – – 1,3 0,3
Fundamental / Fundamental – – 1,7 2,5
Médio / Secondary – – 30,2 26,2
Superior incompleto / Higher education incomplete – – 35,6 27,5
Superior graduado / Graduated – – 26,2 34,1
Pós-graduado / Postgraduated – – 5,0 9,4
Fonte: São Paulo Turismo, 2008
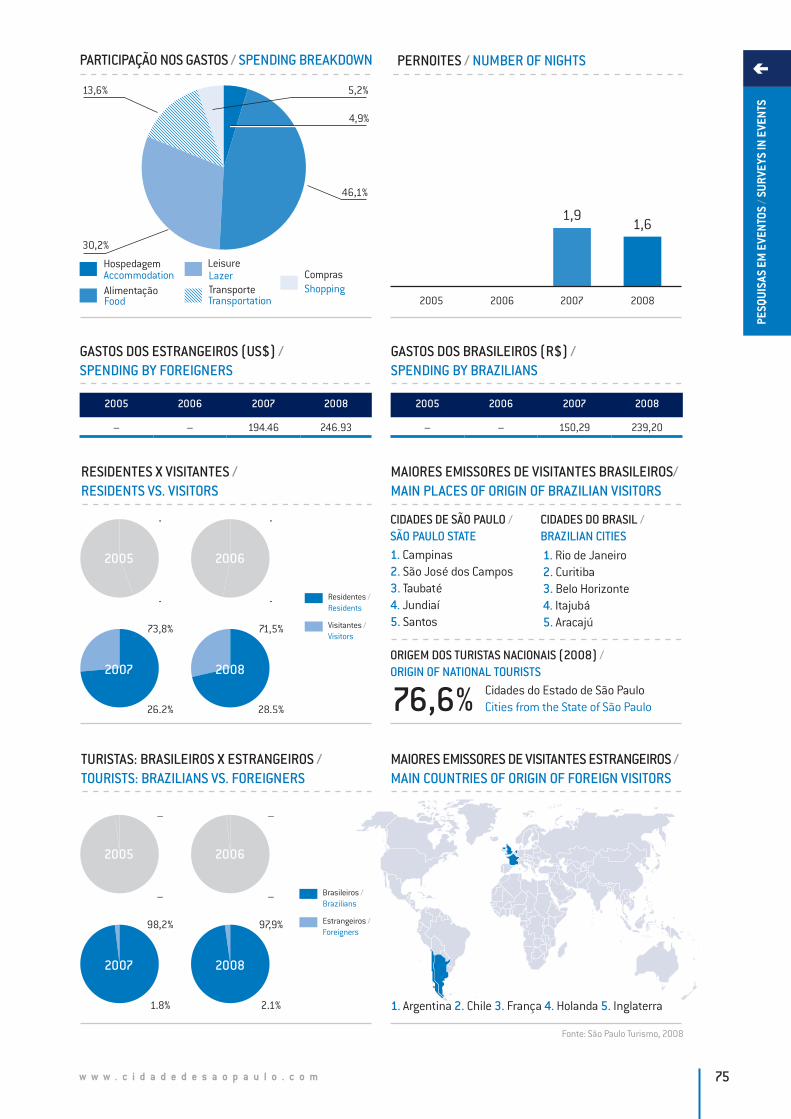
w w w . c i d a d e d e s a o p a u l o . c o m 75
PESQ
UISA
S EM
EVE
NTOS
/ SU
RVEY
S IN
EVE
NTS
PARTICIPAÇÃO NOS GASTOS / SPENDING BREAKDOWN
13,6%
4,9%
30,2%
5,2%
46,1%
HospedagemAccommodationAlimentaçãoFood
ComprasShopping
LazerLeisure
TransporteTransportation
GASTOS DOS ESTRANGEIROS (US$) / SPENDING BY FOREIGNERS
RESIDENTES X VISITANTES / RESIDENTS VS. VISITORS
MAIORES EMISSORES DE VISITANTES BRASILEIROS/ MAIN PLACES OF ORIGIN OF BRAZILIAN VISITORS
TURISTAS: BRASILEIROS X ESTRANGEIROS / TOURISTS: BRAZILIANS VS. FOREIGNERS
MAIORES EMISSORES DE VISITANTES ESTRANGEIROS / MAIN COUNTRIES OF ORIGIN OF FOREIGN VISITORS
1. Argentina 2. Chile 3. França 4. Holanda 5. Inglaterra
2005 2006 20082007
1,91,6
2005 2006 2007 2008
– – 194.46 246.93
2005 2006 2007 2008
– – 150,29 239,20
Residentes / Residents
Visitantes / Visitors
2005 2006
20082007
-
-
26,2%
73,8%
28,5%
71,5%
-
-
Brasileiros / Brazilians
Estrangeiros / Foreigners
2005 2006
20082007
–
–
1,8%
98,2%
2,1%
97,9%
–
–
GASTOS DOS BRASILEIROS (R$) / SPENDING BY BRAZILIANS
PERNOITES / NUMBER OF NIGHTS
1. Campinas2. São José dos Campos3. Taubaté4. Jundiaí5. Santos
1. Rio de Janeiro 2. Curitiba 3. Belo Horizonte4. Itajubá5. Aracajú
CIDADES DE SÃO PAULO /SÃO PAULO STATE
CIDADES DO BRASIL /BRAZILIAN CITIES
76,6% Cidades do Estado de São PauloCities from the State of São Paulo
ORIGEM DOS TURISTAS NACIONAIS (2008) / ORIGIN OF NATIONAL TOURISTS
Fonte: São Paulo Turismo, 2008
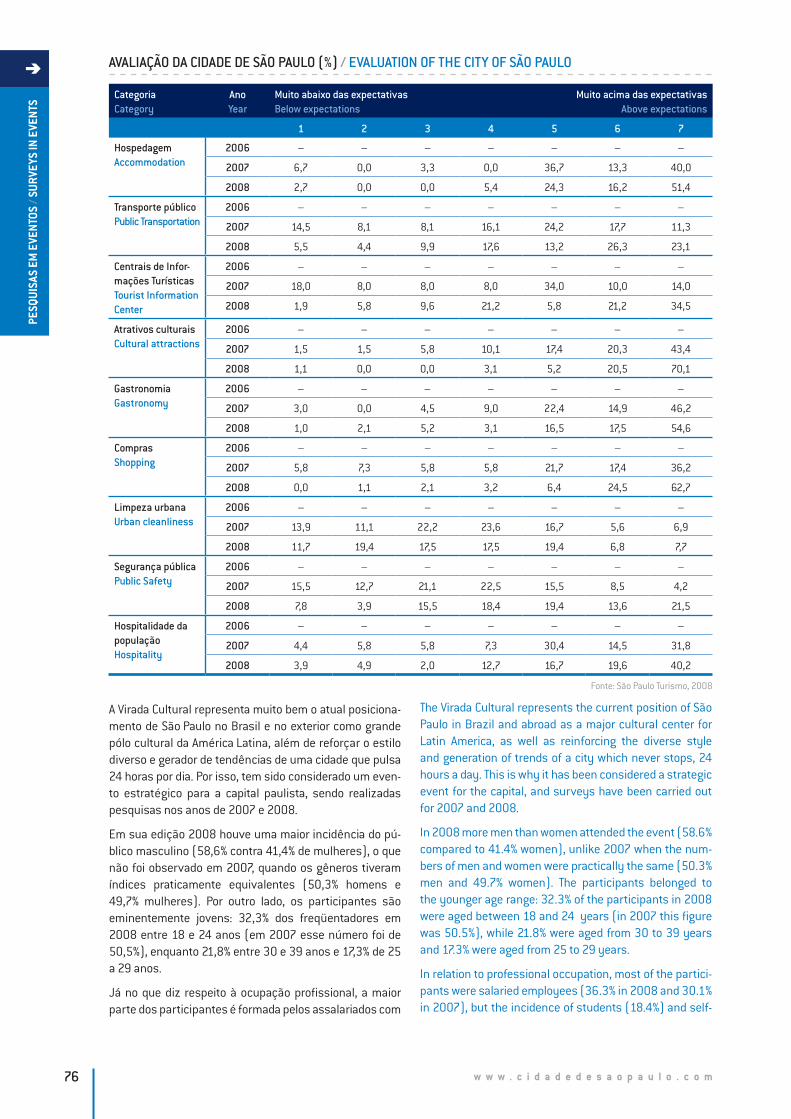
w w w . c i d a d e d e s a o p a u l o . c o m76
PESQ
UISA
S EM
EVE
NTOS
/ SU
RVEY
S IN
EVE
NTS Categoria
CategoryAnoYear
Muito abaixo das expectativasBelow expectations
Muito acima das expectativasAbove expectations
1 2 3 4 5 6 7
HospedagemAccommodation
2006 – – – – – – –
2007 6,7 0,0 3,3 0,0 36,7 13,3 40,0
2008 2,7 0,0 0,0 5,4 24,3 16,2 51,4
Transporte públicoPublic Transportation
2006 – – – – – – –
2007 14,5 8,1 8,1 16,1 24,2 17,7 11,3
2008 5,5 4,4 9,9 17,6 13,2 26,3 23,1
Centrais de Infor-mações TurísticasTourist Information Center
2006 – – – – – – –
2007 18,0 8,0 8,0 8,0 34,0 10,0 14,0
2008 1,9 5,8 9,6 21,2 5,8 21,2 34,5
Atrativos culturaisCultural attractions
2006 – – – – – – –
2007 1,5 1,5 5,8 10,1 17,4 20,3 43,4
2008 1,1 0,0 0,0 3,1 5,2 20,5 70,1
GastronomiaGastronomy
2006 – – – – – – –
2007 3,0 0,0 4,5 9,0 22,4 14,9 46,2
2008 1,0 2,1 5,2 3,1 16,5 17,5 54,6
ComprasShopping
2006 – – – – – – –
2007 5,8 7,3 5,8 5,8 21,7 17,4 36,2
2008 0,0 1,1 2,1 3,2 6,4 24,5 62,7
Limpeza urbanaUrban cleanliness
2006 – – – – – – –
2007 13,9 11,1 22,2 23,6 16,7 5,6 6,9
2008 11,7 19,4 17,5 17,5 19,4 6,8 7,7
Segurança públicaPublic Safety
2006 – – – – – – –
2007 15,5 12,7 21,1 22,5 15,5 8,5 4,2
2008 7,8 3,9 15,5 18,4 19,4 13,6 21,5
Hospitalidade da populaçãoHospitality
2006 – – – – – – –
2007 4,4 5,8 5,8 7,3 30,4 14,5 31,8
2008 3,9 4,9 2,0 12,7 16,7 19,6 40,2
AVALIAÇÃO DA CIDADE DE SÃO PAULO (%) / EVALUATION OF THE CITY OF SÃO PAULO
A Virada Cultural representa muito bem o atual posiciona-mento de São Paulo no Brasil e no exterior como grande pólo cultural da América Latina, além de reforçar o estilo diverso e gerador de tendências de uma cidade que pulsa 24 horas por dia. Por isso, tem sido considerado um even-to estratégico para a capital paulista, sendo realizadas pesquisas nos anos de 2007 e 2008.
Em sua edição 2008 houve uma maior incidência do pú-blico masculino (58,6% contra 41,4% de mulheres), o que não foi observado em 2007, quando os gêneros tiveram índices praticamente equivalentes (50,3% homens e 49,7% mulheres). Por outro lado, os participantes são eminentemente jovens: 32,3% dos freqüentadores em 2008 entre 18 e 24 anos (em 2007 esse número foi de 50,5%), enquanto 21,8% entre 30 e 39 anos e 17,3% de 25 a 29 anos.
Já no que diz respeito à ocupação profissional, a maior parte dos participantes é formada pelos assalariados com
The Virada Cultural represents the current position of São Paulo in Brazil and abroad as a major cultural center for Latin America, as well as reinforcing the diverse style and generation of trends of a city which never stops, 24 hours a day. This is why it has been considered a strategic event for the capital, and surveys have been carried out for 2007 and 2008.
In 2008 more men than women attended the event (58.6% compared to 41.4% women), unlike 2007 when the num-bers of men and women were practically the same (50.3% men and 49.7% women). The participants belonged to the younger age range: 32.3% of the participants in 2008 were aged between 18 and 24 years (in 2007 this figure was 50.5%), while 21.8% were aged from 30 to 39 years and 17.3% were aged from 25 to 29 years.
In relation to professional occupation, most of the partici-pants were salaried employees (36.3% in 2008 and 30.1% in 2007), but the incidence of students (18.4%) and self-
Fonte: São Paulo Turismo, 2008
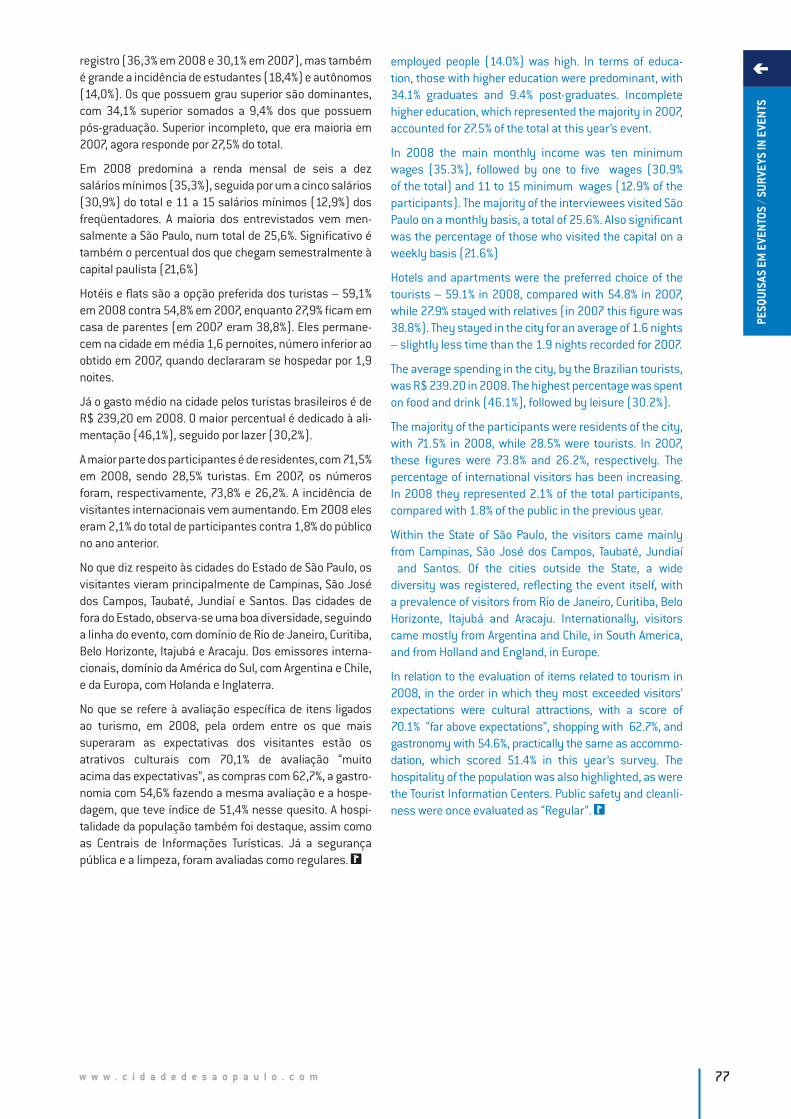
w w w . c i d a d e d e s a o p a u l o . c o m 77
PESQ
UISA
S EM
EVE
NTOS
/ SU
RVEY
S IN
EVE
NTS
registro (36,3% em 2008 e 30,1% em 2007), mas também é grande a incidência de estudantes (18,4%) e autônomos (14,0%). Os que possuem grau superior são dominantes, com 34,1% superior somados a 9,4% dos que possuem pós-graduação. Superior incompleto, que era maioria em 2007, agora responde por 27,5% do total.
Em 2008 predomina a renda mensal de seis a dez salários mínimos (35,3%), seguida por um a cinco salários (30,9%) do total e 11 a 15 salários mínimos (12,9%) dos freqüentadores. A maioria dos entrevistados vem men-salmente a São Paulo, num total de 25,6%. Significativo é também o percentual dos que chegam semestralmente à capital paulista (21,6%)
Hotéis e flats são a opção preferida dos turistas – 59,1% em 2008 contra 54,8% em 2007, enquanto 27,9% ficam em casa de parentes (em 2007 eram 38,8%). Eles permane-cem na cidade em média 1,6 pernoites, número inferior ao obtido em 2007, quando declararam se hospedar por 1,9 noites.
Já o gasto médio na cidade pelos turistas brasileiros é de R$ 239,20 em 2008. O maior percentual é dedicado à ali-mentação (46,1%), seguido por lazer (30,2%).
A maior parte dos participantes é de residentes, com 71,5% em 2008, sendo 28,5% turistas. Em 2007, os números foram, respectivamente, 73,8% e 26,2%. A incidência de visitantes internacionais vem aumentando. Em 2008 eles eram 2,1% do total de participantes contra 1,8% do público no ano anterior.
No que diz respeito às cidades do Estado de São Paulo, os visitantes vieram principalmente de Campinas, São José dos Campos, Taubaté, Jundiaí e Santos. Das cidades de fora do Estado, observa-se uma boa diversidade, seguindo a linha do evento, com domínio de Rio de Janeiro, Curitiba, Belo Horizonte, Itajubá e Aracaju. Dos emissores interna-cionais, domínio da América do Sul, com Argentina e Chile, e da Europa, com Holanda e Inglaterra.
No que se refere à avaliação específica de itens ligados ao turismo, em 2008, pela ordem entre os que mais superaram as expectativas dos visitantes estão os atrativos culturais com 70,1% de avaliação “muito acima das expectativas”, as compras com 62,7%, a gastro-nomia com 54,6% fazendo a mesma avaliação e a hospe-dagem, que teve índice de 51,4% nesse quesito. A hospi-talidade da população também foi destaque, assim como as Centrais de Informações Turísticas. Já a segurança pública e a limpeza, foram avaliadas como regulares.
employed people (14.0%) was high. In terms of educa-tion, those with higher education were predominant, with 34.1% graduates and 9.4% post-graduates. Incomplete higher education, which represented the majority in 2007, accounted for 27.5% of the total at this year’s event.
In 2008 the main monthly income was ten minimum wages (35.3%), followed by one to five wages (30.9% of the total) and 11 to 15 minimum wages (12.9% of the participants). The majority of the interviewees visited São Paulo on a monthly basis, a total of 25.6%. Also significant was the percentage of those who visited the capital on a weekly basis (21.6%)
Hotels and apartments were the preferred choice of the tourists – 59.1% in 2008, compared with 54.8% in 2007, while 27.9% stayed with relatives (in 2007 this figure was 38.8%). They stayed in the city for an average of 1.6 nights – slightly less time than the 1.9 nights recorded for 2007.
The average spending in the city, by the Brazilian tourists, was R$ 239.20 in 2008. The highest percentage was spent on food and drink (46.1%), followed by leisure (30.2%).
The majority of the participants were residents of the city, with 71.5% in 2008, while 28.5% were tourists. In 2007, these figures were 73.8% and 26.2%, respectively. The percentage of international visitors has been increasing. In 2008 they represented 2.1% of the total participants, compared with 1.8% of the public in the previous year.
Within the State of São Paulo, the visitors came mainly from Campinas, São José dos Campos, Taubaté, Jundiaí and Santos. Of the cities outside the State, a wide diversity was registered, reflecting the event itself, with a prevalence of visitors from Rio de Janeiro, Curitiba, Belo Horizonte, Itajubá and Aracaju. Internationally, visitors came mostly from Argentina and Chile, in South America, and from Holland and England, in Europe.
In relation to the evaluation of items related to tourism in 2008, in the order in which they most exceeded visitors’ expectations were cultural attractions, with a score of 70.1% “far above expectations”, shopping with 62.7%, and gastronomy with 54.6%, practically the same as accommo- dation, which scored 51.4% in this year’s survey. The hospitality of the population was also highlighted, as were the Tourist Information Centers. Public safety and cleanli-ness were once evaluated as “Regular”.
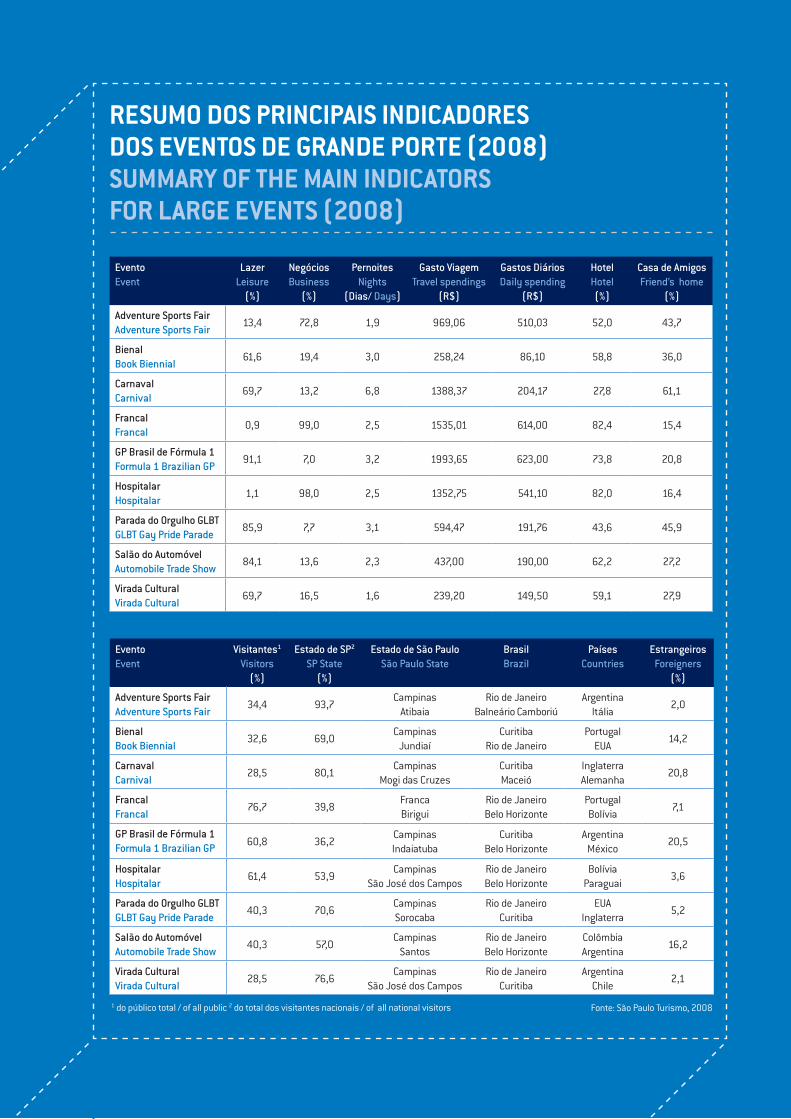
w w w . c i d a d e d e s a o p a u l o . c o m78
PESQ
UISA
S EM
EVE
NTOS
/ SU
RVEY
S IN
EVE
NTS
RESUMO DOS PRINCIPAIS INDICADORES DOS EVENTOS DE GRANDE PORTE (2008) SUMMARY OF THE MAIN INDICATORS FOR LARGE EVENTS (2008)
EventoEvent
LazerLeisure
(%)
NegóciosBusiness
(%)
PernoitesNights
(Dias/ Days)
Gasto ViagemTravel spendings
(R$)
Gastos DiáriosDaily spending
(R$)
HotelHotel(%)
Casa de AmigosFriend’s home
(%)
Adventure Sports FairAdventure Sports Fair
13,4 72,8 1,9 969,06 510,03 52,0 43,7
BienalBook Biennial
61,6 19,4 3,0 258,24 86,10 58,8 36,0
CarnavalCarnival
69,7 13,2 6,8 1388,37 204,17 27,8 61,1
FrancalFrancal
0,9 99,0 2,5 1535,01 614,00 82,4 15,4
GP Brasil de Fórmula 1Formula 1 Brazilian GP
91,1 7,0 3,2 1993,65 623,00 73,8 20,8
HospitalarHospitalar
1,1 98,0 2,5 1352,75 541,10 82,0 16,4
Parada do Orgulho GLBTGLBT Gay Pride Parade
85,9 7,7 3,1 594,47 191,76 43,6 45,9
Salão do AutomóvelAutomobile Trade Show
84,1 13,6 2,3 437,00 190,00 62,2 27,2
Virada CulturalVirada Cultural
69,7 16,5 1,6 239,20 149,50 59,1 27,9
EventoEvent
Visitantes1
Visitors(%)
Estado de SP2
SP State(%)
Estado de São PauloSão Paulo State
BrasilBrazil
PaísesCountries
EstrangeirosForeigners
(%)
Adventure Sports FairAdventure Sports Fair
34,4 93,7Campinas
AtibaiaRio de Janeiro
Balneário CamboriúArgentina
Itália2,0
BienalBook Biennial
32,6 69,0Campinas
JundiaíCuritiba
Rio de JaneiroPortugal
EUA14,2
CarnavalCarnival
28,5 80,1Campinas
Mogi das CruzesCuritibaMaceió
InglaterraAlemanha
20,8
FrancalFrancal
76,7 39,8FrancaBirigui
Rio de JaneiroBelo Horizonte
PortugalBolívia
7,1
GP Brasil de Fórmula 1Formula 1 Brazilian GP
60,8 36,2CampinasIndaiatuba
CuritibaBelo Horizonte
ArgentinaMéxico
20,5
HospitalarHospitalar
61,4 53,9Campinas
São José dos CamposRio de JaneiroBelo Horizonte
BolíviaParaguai
3,6
Parada do Orgulho GLBTGLBT Gay Pride Parade
40,3 70,6CampinasSorocaba
Rio de JaneiroCuritiba
EUAInglaterra
5,2
Salão do AutomóvelAutomobile Trade Show
40,3 57,0Campinas
SantosRio de JaneiroBelo Horizonte
ColômbiaArgentina
16,2
Virada CulturalVirada Cultural
28,5 76,6Campinas
São José dos CamposRio de Janeiro
CuritibaArgentina
Chile2,1
Fonte: São Paulo Turismo, 20081 do público total / of all public 2 do total dos visitantes nacionais / of all national visitors
w w w . c i d a d e d e s a o p a u l o . c o m 79
GIVES BASIC INFORMATION ON THE DEVELOPMENT OF TWO INTERNAL ACTIONS OF SÃO PAULO TURISMO, FOCUSING ON THE RESULTS OF THE CONTINUING SURVEYS APPLIED AT THE TOURIST INFORMATION CENTERS. SOME SPECIAL CHARACTERISTICS OF THE TOURISM DEVELOPMENT PLAN FOR THE LIMITED DOWNTOWN AREA ARE ALSO HIGH- LIGHTED. THIS PROJECT WAS CONCLUDED IN 2008, AS A MARK OF SUSTAINABILITY OF TOURISM AND ITS INTEGRATION WITH ITS AGENTS AND PARTICIPATING SECTORS IN THE CITY OF SÃO PAULO.
AÇÕES PARA O DESENVOLVIMENTO DO TURISMOPROJECTS FOR TOURISM DEVELOPMENT
COMPOSTO POR INFORMAÇÕES BÁSICAS SOBRE O DESENVOLVIMENTO DE DUAS AÇÕES INTERNAS DA SÃO PAULO TURISMO, FOCADO NOS RESULTADOS DA PESQUISA CONTÍNUA APLICADA NO ATENDIMENTO DAS CENTRAIS DE INFORMAÇÕES TURÍSTICAS. DESTACA TAMBÉM ALGUMAS PARTICULARIDADES DA PESQUISA DO PLANO DE DESEN-VOLVIMENTO DO TURISMO NO CENTRO, CUJO PROJETO FOI CONCLUÍDO EM 2008, COMO MARCO DE SUSTENTABILI-DADE DO TURISMO E DE SUA INTEGRAÇÃO COM AGENTES E SETORES PARTÍCIPES NA CIDADE DE SÃO PAULO.
IV/CAPÍTULO / CHAPTER
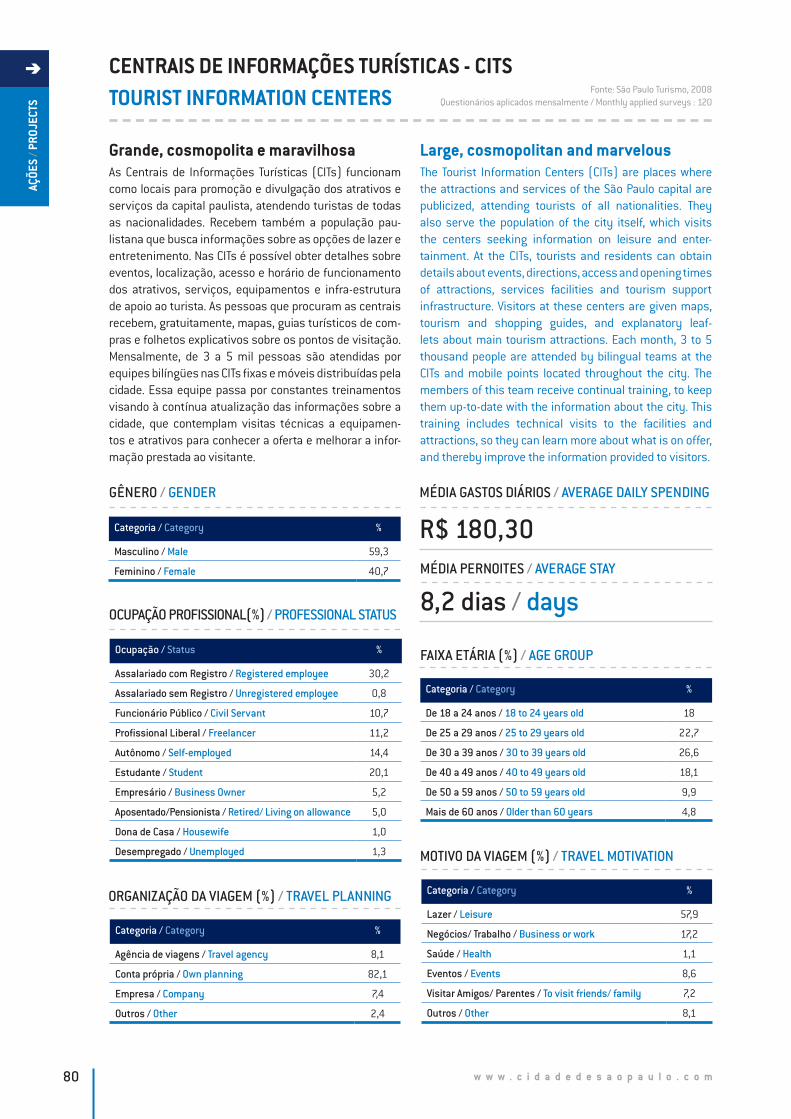
w w w . c i d a d e d e s a o p a u l o . c o m80
AÇÕE
S / P
ROJE
CTS
CENTRAIS DE INFORMAÇÕES TURÍSTICAS - CITSTOURIST INFORMATION CENTERS
Grande, cosmopolita e maravilhosaAs Centrais de Informações Turísticas (CITs) funcionam como locais para promoção e divulgação dos atrativos e serviços da capital paulista, atendendo turistas de todas as nacionalidades. Recebem também a população pau-listana que busca informações sobre as opções de lazer e entretenimento. Nas CITs é possível obter detalhes sobre eventos, localização, acesso e horário de funcionamento dos atrativos, serviços, equipamentos e infra-estrutura de apoio ao turista. As pessoas que procuram as centrais recebem, gratuitamente, mapas, guias turísticos de com-pras e folhetos explicativos sobre os pontos de visitação. Mensalmente, de 3 a 5 mil pessoas são atendidas por equipes bilíngües nas CITs fixas e móveis distribuídas pela cidade. Essa equipe passa por constantes treinamentos visando à contínua atualização das informações sobre a cidade, que contemplam visitas técnicas a equipamen-tos e atrativos para conhecer a oferta e melhorar a infor- mação prestada ao visitante.
Large, cosmopolitan and marvelousThe Tourist Information Centers (CITs) are places where the attractions and services of the São Paulo capital are publicized, attending tourists of all nationalities. They also serve the population of the city itself, which visits the centers seeking information on leisure and enter-tainment. At the CITs, tourists and residents can obtain details about events, directions, access and opening times of attractions, services facilities and tourism support infrastructure. Visitors at these centers are given maps, tourism and shopping guides, and explanatory leaf-lets about main tourism attractions. Each month, 3 to 5 thousand people are attended by bilingual teams at the CITs and mobile points located throughout the city. The members of this team receive continual training, to keep them up-to-date with the information about the city. This training includes technical visits to the facilities and attractions, so they can learn more about what is on offer, and thereby improve the information provided to visitors.
OCUPAÇÃO PROFISSIONAL(%) / PROFESSIONAL STATUS
MÉDIA GASTOS DIÁRIOS / AVERAGE DAILY SPENDING
R$ 180,30MÉDIA PERNOITES / AVERAGE STAY
8,2 dias / days
Fonte: São Paulo Turismo, 2008Questionários aplicados mensalmente / Monthly applied surveys : 120
Ocupação / Status %
Assalariado com Registro / Registered employee 30,2
Assalariado sem Registro / Unregistered employee 0,8
Funcionário Público / Civil Servant 10,7
Profissional Liberal / Freelancer 11,2
Autônomo / Self-employed 14,4
Estudante / Student 20,1
Empresário / Business Owner 5,2
Aposentado/Pensionista / Retired/ Living on allowance 5,0
Dona de Casa / Housewife 1,0
Desempregado / Unemployed 1,3 MOTIVO DA VIAGEM (%) / TRAVEL MOTIVATION
Categoria / Category %
Lazer / Leisure 57,9
Negócios/ Trabalho / Business or work 17,2
Saúde / Health 1,1
Eventos / Events 8,6
Visitar Amigos/ Parentes / To visit friends/ family 7,2
Outros / Other 8,1
FAIXA ETÁRIA (%) / AGE GROUP
Categoria / Category %
De 18 a 24 anos / 18 to 24 years old 18
De 25 a 29 anos / 25 to 29 years old 22,7
De 30 a 39 anos / 30 to 39 years old 26,6
De 40 a 49 anos / 40 to 49 years old 18,1
De 50 a 59 anos / 50 to 59 years old 9,9
Mais de 60 anos / Older than 60 years 4,8
GÊNERO / GENDER
ORGANIZAÇÃO DA VIAGEM (%) / TRAVEL PLANNING
Categoria / Category %
Agência de viagens / Travel agency 8,1
Conta própria / Own planning 82,1
Empresa / Company 7,4
Outros / Other 2,4
Categoria / Category %
Masculino / Male 59,3
Feminino / Female 40,7

w w w . c i d a d e d e s a o p a u l o . c o m 81
AÇÕE
S / P
ROJE
CTS
GASTO MÉDIO DO TURISTA POR PAÍS DE ORIGEM / AVERAGE TOURIST SPENDING BY COUNTRY OF ORIGIN
Categoria / Category Gastos (R$) / Spending (R$) Pernoites (dias) / Stay (days)
Brasil / Brazil 1286,85 6,9
Argentina / Argentina 1579,65 7,7
Estados Unidos / United States 2153,80 8,9
PRINCIPAIS EMISSORES INTERNACIONAIS / MAIN ORIGIN OF FOREIGN VISITORS
PRINCIPAIS EMISSORES NACIONAIS / MAIN ORIGINS OF BRAZILIAN VISITORS
PRINCIPAIS EMISSORES DO ESTADO / MAIN ORIGIN OF VISITORS FROM THE STATE
9. Belém (Pará)
10. Peru
3. Estados Unidos
4. Chile
2. Argentina
7. México
9. França
8. Inglaterra
1. Brasil
6. Espanha
5. Alemanha
1. Campinas
4. São Carlos
5. Sorocaba
9. Jundiaí
8. Bauru
6. Lorena
3. Ribeirão Preto
2. São José dos Campos
7. Atibaia
10. Araraquara
8. Manaus (Amazonas)
10. Brasília (Distrito Federal)
5. Curitiba (Paraná)
6. Porto Alegre (Rio Grande do Sul)
7. Fortaleza (Ceará)
4. Recife (Pernambuco)
3. Salvador (Bahia)
2. Belo Horizonte (Minas Gerais)
1. Rio de Janeiro (Rio de Janeiro)
Fonte: São Paulo Turismo, 2008
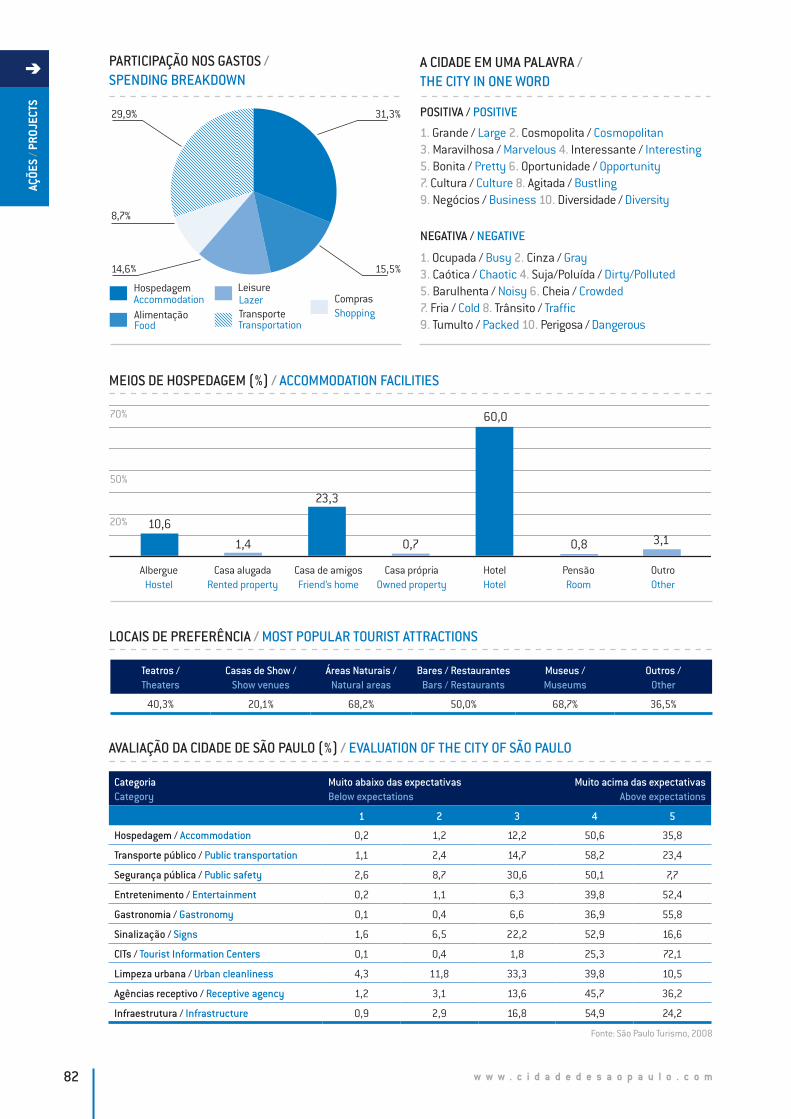
w w w . c i d a d e d e s a o p a u l o . c o m82
AÇÕE
S / P
ROJE
CTS
CategoriaCategory
Muito abaixo das expectativasBelow expectations
Muito acima das expectativasAbove expectations
1 2 3 4 5
Hospedagem / Accommodation 0,2 1,2 12,2 50,6 35,8
Transporte público / Public transportation 1,1 2,4 14,7 58,2 23,4
Segurança pública / Public safety 2,6 8,7 30,6 50,1 7,7
Entretenimento / Entertainment 0,2 1,1 6,3 39,8 52,4
Gastronomia / Gastronomy 0,1 0,4 6,6 36,9 55,8
Sinalização / Signs 1,6 6,5 22,2 52,9 16,6
CITs / Tourist Information Centers 0,1 0,4 1,8 25,3 72,1
Limpeza urbana / Urban cleanliness 4,3 11,8 33,3 39,8 10,5
Agências receptivo / Receptive agency 1,2 3,1 13,6 45,7 36,2
Infraestrutura / Infrastructure 0,9 2,9 16,8 54,9 24,2
AVALIAÇÃO DA CIDADE DE SÃO PAULO (%) / EVALUATION OF THE CITY OF SÃO PAULO
PARTICIPAÇÃO NOS GASTOS / SPENDING BREAKDOWN
29,9%
8,7%
14,6%
31,3%
15,5%
HospedagemAccommodationAlimentaçãoFood
ComprasShopping
LazerLeisure
TransporteTransportation
1. Grande / Large 2. Cosmopolita / Cosmopolitan3. Maravilhosa / Marvelous 4. Interessante / Interesting 5. Bonita / Pretty 6. Oportunidade / Opportunity 7. Cultura / Culture 8. Agitada / Bustling 9. Negócios / Business 10. Diversidade / Diversity
A CIDADE EM UMA PALAVRA / THE CITY IN ONE WORD
POSITIVA / POSITIVE
LOCAIS DE PREFERÊNCIA / MOST POPULAR TOURIST ATTRACTIONS
1. Ocupada / Busy 2. Cinza / Gray3. Caótica / Chaotic 4. Suja/Poluída / Dirty/Polluted5. Barulhenta / Noisy 6. Cheia / Crowded7. Fria / Cold 8. Trânsito / Traffic9. Tumulto / Packed 10. Perigosa / Dangerous
NEGATIVA / NEGATIVE
Teatros / Theaters
Casas de Show / Show venues
Áreas Naturais / Natural areas
Bares / Restaurantes Bars / Restaurants
Museus / Museums
Outros / Other
40,3% 20,1% 68,2% 50,0% 68,7% 36,5%
MEIOS DE HOSPEDAGEM (%) / ACCOMMODATION FACILITIES
AlbergueHostel
Casa alugadaRented property
Casa de amigosFriend’s home
Casa própriaOwned property
HotelHotel
PensãoRoom
OutroOther
10,6
0,8
70%
50%
20%
23,3
0,7
60,0
1,4 3,1
Fonte: São Paulo Turismo, 2008
w w w . c i d a d e d e s a o p a u l o . c o m 83
AÇÕE
S / P
ROJE
CTS
As pesquisas realizadas nas CITS objetivam caracterizar o perfil dos turistas que buscam a prestação de informação turística na Cidade de São Paulo. Os dados coletados apon-tam que a maioria dos turistas que visitam a cidade e pro-curam as CITs são homens (59,3%), assalariados com re-gistro (30,2%), e têm idade entre 30 e 39 anos (26,6%).
A organização da viagem de 82,1% dos entrevistados é rea-lizada por conta própria, enquanto empresas que mandam seus funcionários a trabalho representam 7,4% dos entre-vistados.
Em relação à hospedagem, 60,0% dos turistas afirmaram estar hospedados em hotéis, e a casa de amigos é citada por 23,3% dos entrevistados. A média de permanência dos turistas que procuram as centrais é de 8,2 dias.
A principal motivação de 57,9% dos turistas entrevistados nas CITS é a busca por lazer, seguido de negócios (17,2%) e eventos que respondem por 8,6% das respostas. Quando questionados sobre os locais de preferência na cidade, museus, áreas naturais e bares/restaurantes são os itens mais citados aparecendo respectivamente em 68,7%, 68,2% e 50,0% das respostas.
A média de gasto diário por pessoa indicada pela pesquisa, de R$ 180,30, indica uma boa utilização da infra-estrutura turística da cidade. Hospedagem e transporte são os itens de maior despesa, respondendo por 31,3% e 29,9% do total dos gastos. Nessa ordem, seguem-se gastos com alimenta-ção (15,5%), lazer (14,6%) e compras (8,7%).
Em relação à origem dos turistas, o brasileiro é o que mais visita as CITs, representando 48,2% do público. Argentinos vêm em segundo lugar representando 5,76%, seguidos de americanos (4,53%) e chilenos (4,29%). Na seqüência aparecem alemães, espanhóis, mexicanos, ingleses e fran-ceses que juntos representam 16,0%.
Considerando-se apenas o turista nacional, os cariocas são a maioria e respondem por 28,8% dos turistas brasileiros seguidos pelos mineiros (18,4%), baianos (16,8%) e per-nambucanos (15,7%). Dentro do Estado de São Paulo, as cidades de Campinas (39,3%), São José dos Campos (13,1%) e Ribeirão Preto (8,2%) são as que mais se destacam.
A opinião dos turistas sobre a cidade e seus serviços é muito positiva. As CITs aparecem como o serviço mais bem avalia-do com 97,4% dos entrevistados considerando-as acima ou muito acima das expectativas. Bem avaliadas também são gastronomia (92,7%), entretenimento (92,2%) e hospeda-gem (86,4%). Os serviços mais mal avaliados são limpeza urbana e segurança, considerados como abaixo ou muito abaixo da expectativa por 16,1% e 11,3% dos entrevistados. Para definir a cidade em uma única palavra, os turistas a identificaram principalmente e pela ordem como: grande, cosmopolita, maravilhosa, interessante e bonita. Dentre as qualificações negativas aparecem: ocupada, cinza, caótica, poluída e barulhenta.
The aim of the surveys carried out by the CITs is to characterize the profile of the tourists seeking tourism information in the City of São Paulo. The data collected indicate that the majority of tourists who visit the city and seek out the CITs are men (59.3%), salaried employees (30.2%), and aged between 30 and 39 years (26.6%).
82.1% of the interviewees organize their own travel, while companies which send their employees on business trips represent 7.4% of the interviewees.
In relation to accommodation, 60.0% of the tourists said they were staying at hotels, while 23.3% of the inter- viewees cited friend’s homes. The average length of stay of the tourists who visit the CITs is 8.2 days.
The main travel motivation, for 57.9% of the tourists inter-viewed at the CITs, is leisure, followed by business (17.2%) and events, which account for 8.6% of the responses. When questioned about their favorite places in the city, museums, natural areas and bars/restaurants were the most mentioned items, with 68.7%, 68.2% and 50.0% of the responses, respectively.
The average daily spending of R$ 180.30 per person indi-cated by the survey shows good use of the tourism infra-structure of the city. Accommodation and transportation were also items with high spending, accounting for 31.3% and 29.9% of the total. These were followed by food and drink (15.5%), leisure (14.6%) and shopping (8.7%), in that order.
In relation to the tourists’ countries of origin, Brazilians were the tourists who most visited the CITs, representing 48.2% of the public. Argentineans were in second place (5.76%), followed by Americans (4.53%) and Chileans (4.29%). Next came Germans, Spanish, Mexicans, English and French, together representing 16.0%.
Considering only national tourism, visitors from Rio de Janeiro were in the majority, accounting for 28.8% of the Brazilian tourists, followed by visitors from Minas Gerais (18.4%), Bahia (16.8%) and Pernambuco (15.7%). Within the State of São Paulo, the cities of Campinas (39.3%), São José dos Campos (13.1%) and Ribeirão Preto (8.2%) headed the list as places of origin.
The tourists’ opinions of the city and its services were very positive. The CITs appear to be a service which is given a high evaluation, with 97.4% of the interviewees consi- dering it above or far above expectations. Also high on the list were gastronomy (92.7%), entertainment (92.2%) and accommodation (86.4%). The services which received poor scores were urban cleanliness and public safety, which were considered below or far below expectations by 16.1% and 11.3% of the interviewees, respectively. When asked to describe the city in a single word, the descriptions tourists came up with, in order of frequency, were: large, cosmopolitan, marvelous, interesting and pretty. Negative descriptions included: busy, gray, chaotic, polluted and noisy.
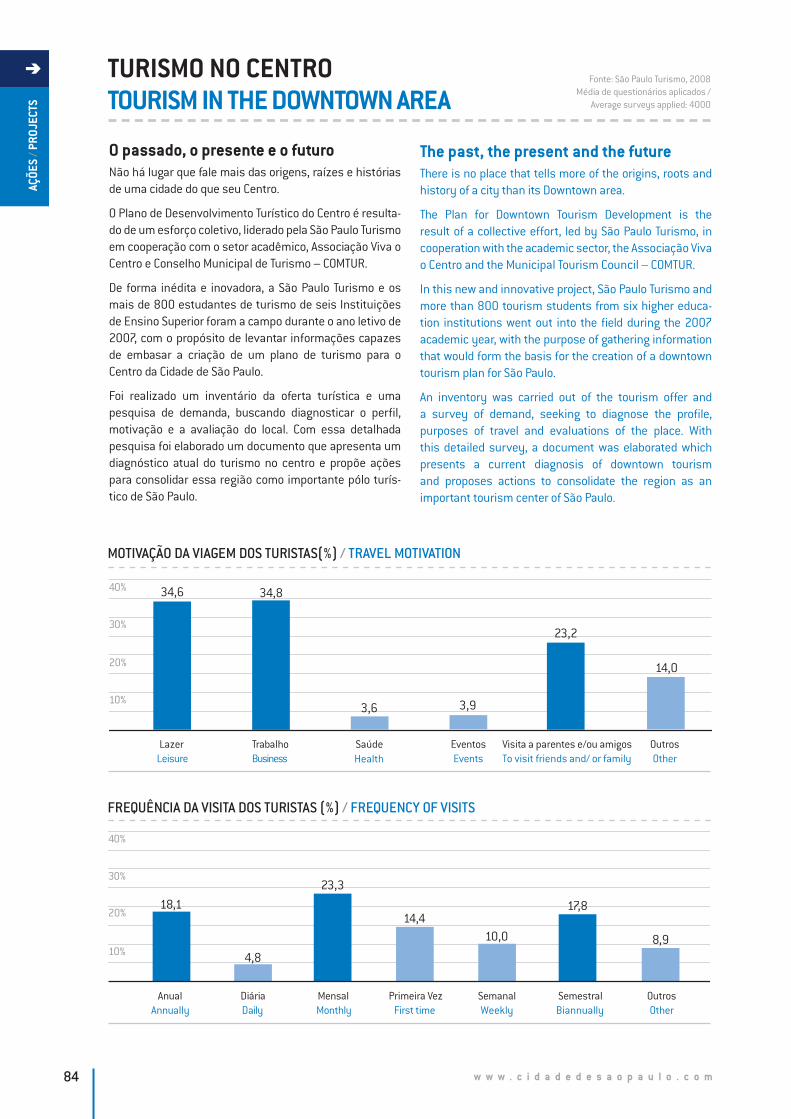
w w w . c i d a d e d e s a o p a u l o . c o m84
AÇÕE
S / P
ROJE
CTS
TURISMO NO CENTROTOURISM IN THE DOWNTOWN AREA
O passado, o presente e o futuroNão há lugar que fale mais das origens, raízes e histórias de uma cidade do que seu Centro.
O Plano de Desenvolvimento Turístico do Centro é resulta-do de um esforço coletivo, liderado pela São Paulo Turismo em cooperação com o setor acadêmico, Associação Viva o Centro e Conselho Municipal de Turismo – COMTUR.
De forma inédita e inovadora, a São Paulo Turismo e os mais de 800 estudantes de turismo de seis Instituições de Ensino Superior foram a campo durante o ano letivo de 2007, com o propósito de levantar informações capazes de embasar a criação de um plano de turismo para o Centro da Cidade de São Paulo.
Foi realizado um inventário da oferta turística e uma pesquisa de demanda, buscando diagnosticar o perfil, motivação e a avaliação do local. Com essa detalhada pesquisa foi elaborado um documento que apresenta um diagnóstico atual do turismo no centro e propõe ações para consolidar essa região como importante pólo turís-tico de São Paulo.
The past, the present and the futureThere is no place that tells more of the origins, roots and history of a city than its Downtown area.
The Plan for Downtown Tourism Development is the result of a collective effort, led by São Paulo Turismo, in cooperation with the academic sector, the Associação Viva o Centro and the Municipal Tourism Council – COMTUR.
In this new and innovative project, São Paulo Turismo and more than 800 tourism students from six higher educa-tion institutions went out into the field during the 2007 academic year, with the purpose of gathering information that would form the basis for the creation of a downtown tourism plan for São Paulo.
An inventory was carried out of the tourism offer and a survey of demand, seeking to diagnose the profile, purposes of travel and evaluations of the place. With this detailed survey, a document was elaborated which presents a current diagnosis of downtown tourism and proposes actions to consolidate the region as an important tourism center of São Paulo.
Fonte: São Paulo Turismo, 2008Média de questionários aplicados /
Average surveys applied: 4000
FREQUÊNCIA DA VISITA DOS TURISTAS (%) / FREQUENCY OF VISITS
AnualAnnually
18,1
DiáriaDaily
4,8
30%
40%
20%
10%
MensalMonthly
23,3
Primeira VezFirst time
14,4
SemanalWeekly
10,0
SemestralBiannually
17,8
OutrosOther
8,9
MOTIVAÇÃO DA VIAGEM DOS TURISTAS(%) / TRAVEL MOTIVATION
LazerLeisure
34,6
Trabalho SaúdeHealthBusiness
34,8
30%
40%
20%
10%3,6
EventosEvents
3,9
Visita a parentes e/ou amigosTo visit friends and/ or family
23,2
OutrosOther
14,0

w w w . c i d a d e d e s a o p a u l o . c o m 85
AÇÕE
S / P
ROJE
CTS
CategoriaCategory
Muito abaixo das expectativasBelow expectations
Muito acima das expectativasAbove expectations
1 2 3 4 5 6 7
Shoppings/ Shopping malls6,3 9,9 14,0 17,2 21,1 15,0 16,9
2,2 2,1 5,5 9,2 18,4 25,1 37,5
Teatros / Theaters3,6 6,1 10,4 14,6 23,1 22,1 19,9
3,6 6,1 10,4 14,6 23,1 22,1 19,9
Museus / Museums4,9 6,5 10,2 15,2 23,6 21,0 18,6
2,9 3,7 6,8 13,1 24,9 24,1 25,0
Restaurantes / Restaurants3,5 5,8 11,9 18,5 22,7 20,8 17,0
1,5 2,5 4,4 10,3 21,1 25,4 34,7
Bares / Bars4,4 7,7 14,1 17,8 23,8 17,4 14,8
2,6 2,9 6,4 13,1 20,0 22,8 32,1
Hotéis / Hotels5,8 8,9 14,0 19,0 23,1 16,0 14,0
2,9 3,2 5,8 13,7 21,5 25,6 27,2
Táxis / Taxis4,4 7,0 14,5 21,1 21,0 18,0 13,9
3,7 4,2 9,0 17,8 25,3 20,0 19,8
Trânsito / Traffic40,0 22,6 15,8 9,2 5,8 3,9 2,9
41,1 22,6 16,0 8,6 5,1 3,8 2,7
Sinalização Viária / Signs10,4 14,3 21,4 22,9 15,3 10,1 5,7
7,5 10,5 20,8 23,5 19,9 11,6 6,7
Sinalização Turística / Tourism signs20,7 20,7 23,3 16,0 10,7 5,8 5,8
16,5 19,0 21,7 18,7 13,7 6,5 3,7
ORIGEM DOS VISITANTES (%) / ORIGIN OF TOURISTS
15,4
12,4
13,5
5,2
16,9
São Paulo
Rio de Janeiro
Minas Gerais
ForeignersEstrangeiros
Paraná
Other StatesOutros Estados
36,6
Avaliação do Centro / Visitantes entrevistados no Centro de São Paulo Evaluation of the Downtown area / Visitors interviewed in Downtown São Paulo
Avaliação da cidade / Visitantes entrevistados em outros pontos da cidade Evaluation of the city / Visitors interviewed in other locations of the city
LOCAL DE HOSPEDAGEM (%) / REGION OF ACCOMMODATION
22,1
42,9
24,57
5,8
3,4
Norte/ North
Sul/ South
Oeste/ WestLeste/ East
Centro/ Downtown
AVALIAÇÃO DO CENTRO E DA CIDADE (%)/ EVALUATION OF THE CITY OF SÃO PAULO
Fonte: São Paulo Turismo, 2008
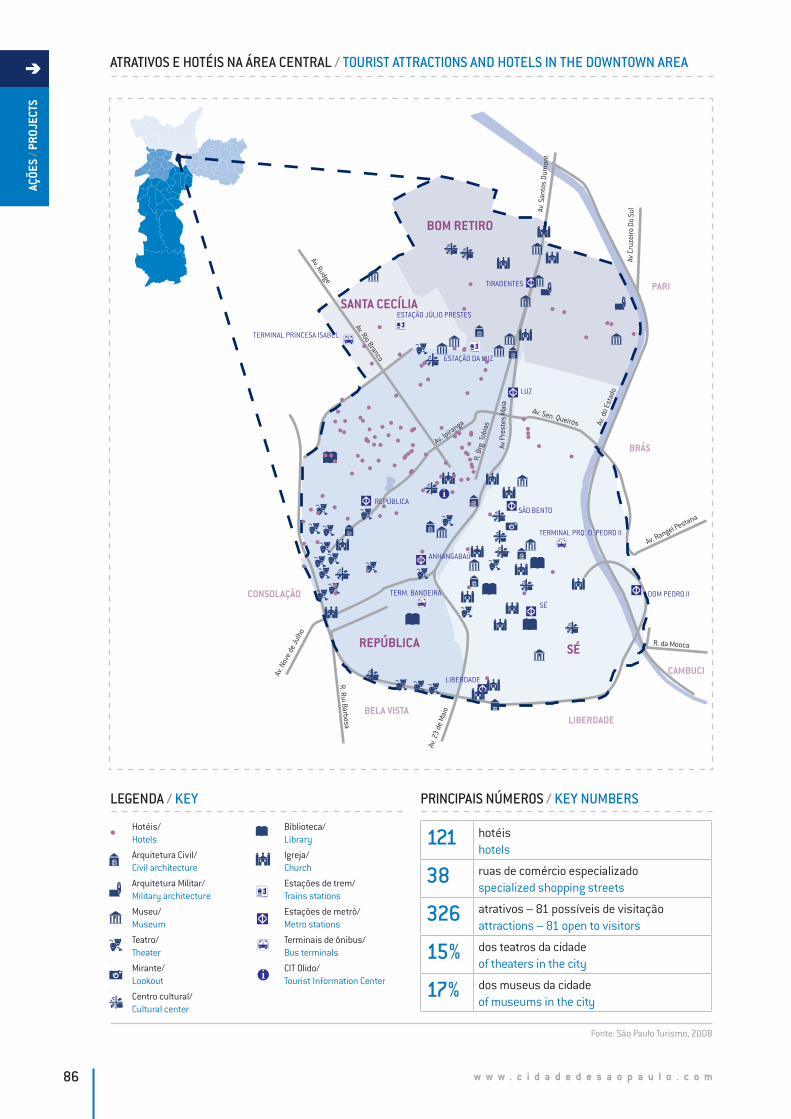
w w w . c i d a d e d e s a o p a u l o . c o m86
AÇÕE
S / P
ROJE
CTS
Av. Rio Branco
Av. Ipira
nga
R. da Mooca
Av. 2
3 de
Mai
o
Av. N
ove
de Ju
lho
Av. Rudge
Av C
ruze
iro D
o Su
l
R. B
rg. T
obia
s
Av P
rest
es M
aia
Av. Sen. Queirós
R. Rui Barbosa
Av. Rangel Pestana
Av. S
anto
s Du
mon
t
Av. d
o Es
tadoLUZ
SÃO BENTOREPÚBLICA
LIBERDADE
TIRADENTES
ANHANGABAÚ
DOM PEDRO IITERM. BANDEIRA
ESTAÇÃO DA LUZ
ESTAÇÃO JÚLIO PRESTES
TERMINAL PRQ. D. PEDRO II
TERMINAL PRINCESA ISABEL
SÉ
BRÁS
PARI
BOM RETIRO
CAMBUCI
SANTA CECÍLIA
BELA VISTA
REPÚBLICA
LIBERDADE
CONSOLAÇÃO
SÉ
ATRATIVOS E HOTÉIS NA ÁREA CENTRAL / TOURIST ATTRACTIONS AND HOTELS IN THE DOWNTOWN AREA
Hotéis/ Hotels
Arquitetura Civil/ Civil architecture
Arquitetura Militar/ Military architecture
Museu/ Museum
Teatro/ Theater
Mirante/ Lookout
Centro cultural/ Cultural center
Biblioteca/ Library
Igreja/ Church
Estações de trem/ Trains stations
Estações de metrô/ Metro stations
Terminais de ônibus/ Bus terminals
CIT Olido/ Tourist Information Center
LEGENDA / KEY
121 hotéis hotels
38 ruas de comércio especializado specialized shopping streets
326 atrativos – 81 possíveis de visitação attractions – 81 open to visitors
15% dos teatros da cidade of theaters in the city
17% dos museus da cidade of museums in the city
PRINCIPAIS NÚMEROS / KEY NUMBERS
Fonte: São Paulo Turismo, 2008
w w w . c i d a d e d e s a o p a u l o . c o m 87
AÇÕE
S / P
ROJE
CTS
A área do estudo é composta pelos distritos República e Sé, além de uma pequena parcela dos distritos de Santa Cecília e Bom Retiro. Trata-se de um espaço ínfimo em relação à dimensão territorial paulistana, porém de incon-testável relevância no contexto municipal.
Oferta – A variedade de opções de comércio representa um importante poder de atração para o turismo no Centro, sendo considerado um de seus grandes diferenciais.
O estudo indicou a existência de 326 atrativos culturais, sendo que 81 possibilitam visitação interna. Os teatros são os de maior ocorrência, representando 25% do total dos atrativos com visitação e quase 15% dos teatros de São Paulo. Museus representam 20% do total dos atrativos e 17% do total desse tipo de equipamento.
A proximidade e facilidade de acesso entre eles são fatores extremamente positivos que permitem o usufruto intenso do espaço, com economia de tempo e deslocamentos. É preciso apenas ações que crie uma maior sinergia entre eles, incentivando a circulação.
Demanda – O perfil do morador de outras regiões da cidade em visita ao centro é formado em sua maioria por assalariados com registro, com idade entre 18 e 24 anos, originário da zona Sul e que vai ao centro por motivo de trabalho. Este dado representa o maior número de entre-vistados, mas outras variáveis apresentadas devem ser consideradas para conhecimento do público que visita a região.
O perfil do turista é semelhante ao do residente, apre-sentando maior variação na faixa etária, predominando pessoas entre 30 e 39 anos. A maioria são brasileiros vin-dos do interior do Estado de São Paulo, seguido por minei-ros e cariocas. No caso da demanda internacional, o maior emissor de turistas para o Centro é a Argentina.
O turista do Centro permanece em média 7,0 dias na cidade, com equilíbrio de motivação por lazer (34,6%) e trabalho (34,8%), além de visita a amigos e parentes (23,2%). Essa motivação também reflete na hospeda-gem, já que mais de 50% dos entrevistados permanecem na casa de amigos e parentes.
Avaliação – A avaliação da infra-estrutura do centro de São Paulo foi realizada para identificar os pontos fortes e fracos com base na visão dos turistas e residentes.
De forma geral, sob a ótica dos visitantes entrevistados, os equipamentos do Centro da cidade são avaliados como os demais da cidade nos quesitos: teatro, trânsito e sina-lização (viária e turística). Entretanto, nas categorias: shoppings, museus, restaurantes, bares, hotéis e táxis, a avaliação atribuída à cidade como um todo é superior à existente no Centro de São Paulo.
A pesquisa completa, o plano e o acompanhamento das ações já iniciadas estão disponíveis no site:
www.cidadedesaopaulo.com/turismonocentro
The area of the study is comprised of the districts of República and Sé, plus small parts of the districts of Santa Cecília and Bom Retiro. It is a relatively small area in rela-tion to the territorial size of the city, but its importance in the municipal context is undisputed.
Offer – The variety of retail options represents an important power of attraction for downtown tourism, and is considered one of its great advantages. The study also indicates the existence of 326 cultural attractions, of which 81 can be visited internally. Theaters are the highest in number, representing 25% of all the attractions visited by tourists, and almost 15% of the theaters in São Paulo. Museums represent 20% of the total attractions in the downtown area, and 17% of all the museums in the city as a whole.
The proximity and ease of access between them is an extremely positive factor, which enables visitors to make full use of the area, without having to spend a lot of time traveling between them. All that is needed now is actions to create a greater synergy and motivate circulation between the various museums.
Demand – The profile of inhabitants from other parts of the city who visit the downtown is comprised mainly of salaried employees, aged between 18 and 24 years, from the South zone, coming into the downtown area for work. This profile represents the highest number of those inter-viewed, but other variables should also be considered in order to gain an understanding of the public that visits the region.
The profile of the tourists is similar to that of the resi-dent, but with a greater variation in age range, with the tourists being mainly between 30 and 39 years of age. The majority are Brazilian, from the Interior of the State of São Paulo, followed by visitors from Minas Gerais and Rio de Janeiro. In terms of international demand, the main coun-try of tourists origin to the downtown area is Argentina.
Tourists to the downtown area stay on average 7.0 days in the city, mainly for the purposes of leisure (34.6%) and business (34.8%) and to visit friends and relatives (23.2%). This motivation is also reflected in the accommo-dation, as more than 50% of the interviewees stay at the homes of friends or relatives.
Evaluation – the evaluation of the infrastructure in the downtown area of São Paulo was carried out to identify the strengths and weaknesses, according to the views of tourists and residents.
The same items were also evaluated to enable the identifi-cation of possible highlights or problems in the downtown area, in the views of tourists, compared with São Paulo as a whole. Despite minor differences, it was noticed that the evaluations for the downtown, and the rest of the city, were very similar.
The complete survey, and the follow-up plan of the actions already implemented is available on the website:
www.cidadedesaopaulo.com/turismonocentro

w w w . c i d a d e d e s a o p a u l o . c o m88
COMPRISED OF BASIC INDICATORS FROM TWO SPECIFIC SURVEYS, THE OBJECTIVE IS TO PRESENT A CHARACTERIZATION OF THE TOURISM DEMAND IN SPECIFIC SEGMENTS, SELECTED DUE TO THEIR SIGNIFICANT ROLE IN THE TOURISM OF SÃO PAULO: GASTRONOMY AND CULTURE; AND CORPORATE BUSINESS, BOTH OF WHICH ARE CONSIDERED AS FUNDAMENTAL SECTORS IN THE GENERATION OF INCOME AND JOBS FOR THE CITY OF SÃO PAULO. THE CHAPTER ALSO INCLUDES AN ONLINE SURVEY TO IDENTIFY THE MAIN TRAVEL MOTIVATIONS OF HOTEL GUESTS.
PESQUISAS POR SEGMENTOSURVEYS BY SEGMENTS
COMPOSTO POR INDICADORES BÁSICOS DE DUAS PES-QUISAS PONTUAIS QUE APRESENTAM A CARACTERIZAÇÃO DA DEMANDA TURÍSTICA DE SEGMENTOS ESPECÍFICOS, SELECIONADOS POR SUA EXPRESSIVIDADE NO TURISMO PAULISTANO, OU SEJA: GASTRONOMIA E CULTURA; E, NEGÓCIOS CORPORATIVOS, CONSIDERADOS COMO SETORES FUNDAMENTAIS NA GERAÇÃO DE RECEITA E NA CRIAÇÃO DE EMPREGOS NA CIDADE DE SÃO PAULO. O CAPÍTULO INCLUI TAMBÉM UMA PESQUISA ON-LINE PARA IDENTIFICAR NA REDE HOTELEIRA AS PRINCIPAIS MOTIVAÇÕES DE VIAGENS DOS SEUS HÓSPEDES.
V/
CAPÍTULO / CHAPTER
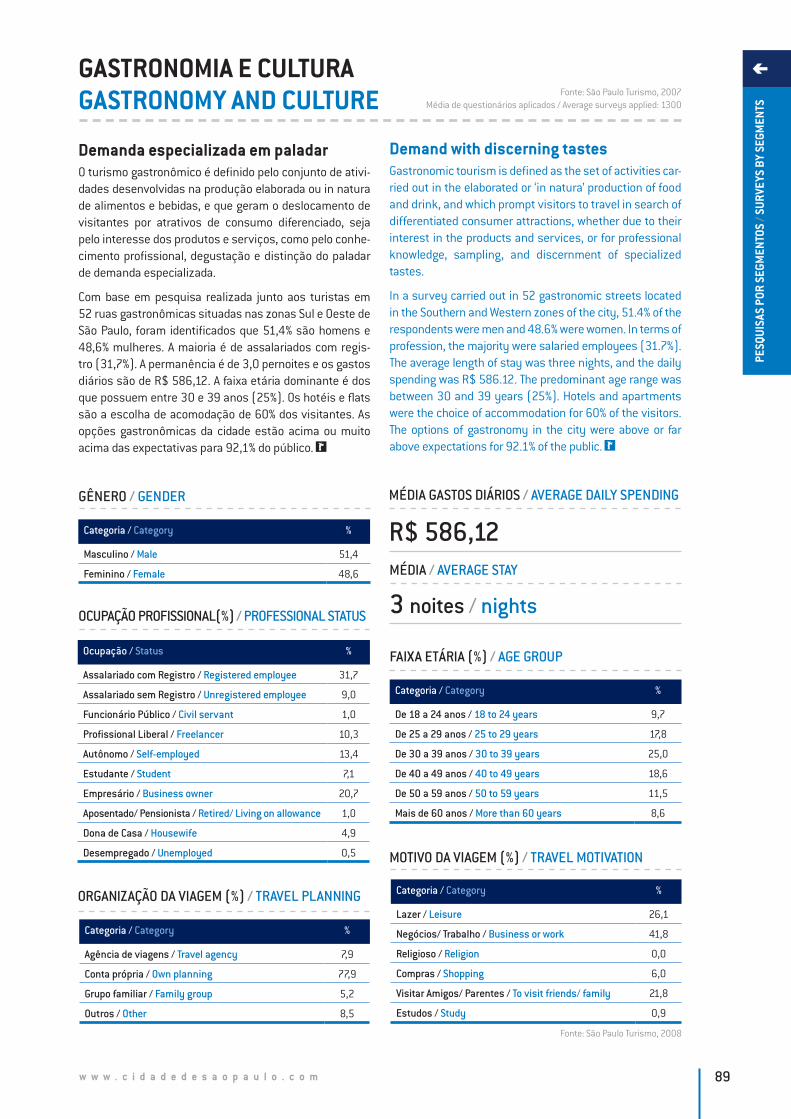
w w w . c i d a d e d e s a o p a u l o . c o m 89
PESQ
UISA
S PO
R SE
GMEN
TOS
/ SUR
VEYS
BY
SEGM
ENTS
GASTRONOMIA E CULTURAGASTRONOMY AND CULTURE
Demanda especializada em paladarO turismo gastronômico é definido pelo conjunto de ativi-dades desenvolvidas na produção elaborada ou in natura de alimentos e bebidas, e que geram o deslocamento de visitantes por atrativos de consumo diferenciado, seja pelo interesse dos produtos e serviços, como pelo conhe-cimento profissional, degustação e distinção do paladar de demanda especializada.
Com base em pesquisa realizada junto aos turistas em 52 ruas gastronômicas situadas nas zonas Sul e Oeste de São Paulo, foram identificados que 51,4% são homens e 48,6% mulheres. A maioria é de assalariados com regis-tro (31,7%). A permanência é de 3,0 pernoites e os gastos diários são de R$ 586,12. A faixa etária dominante é dos que possuem entre 30 e 39 anos (25%). Os hotéis e flats são a escolha de acomodação de 60% dos visitantes. As opções gastronômicas da cidade estão acima ou muito acima das expectativas para 92,1% do público.
Demand with discerning tastesGastronomic tourism is defined as the set of activities car-ried out in the elaborated or ‘in natura’ production of food and drink, and which prompt visitors to travel in search of differentiated consumer attractions, whether due to their interest in the products and services, or for professional knowledge, sampling, and discernment of specialized tastes.
In a survey carried out in 52 gastronomic streets located in the Southern and Western zones of the city, 51.4% of the respondents were men and 48.6% were women. In terms of profession, the majority were salaried employees (31.7%). The average length of stay was three nights, and the daily spending was R$ 586.12. The predominant age range was between 30 and 39 years (25%). Hotels and apartments were the choice of accommodation for 60% of the visitors. The options of gastronomy in the city were above or far above expectations for 92.1% of the public.
OCUPAÇÃO PROFISSIONAL(%) / PROFESSIONAL STATUS
MÉDIA GASTOS DIÁRIOS / AVERAGE DAILY SPENDING
R$ 586,12MÉDIA / AVERAGE STAY
3 noites / nights
Fonte: São Paulo Turismo, 2007Média de questionários aplicados / Average surveys applied: 1300
Ocupação / Status %
Assalariado com Registro / Registered employee 31,7
Assalariado sem Registro / Unregistered employee 9,0
Funcionário Público / Civil servant 1,0
Profissional Liberal / Freelancer 10,3
Autônomo / Self-employed 13,4
Estudante / Student 7,1
Empresário / Business owner 20,7
Aposentado/ Pensionista / Retired/ Living on allowance 1,0
Dona de Casa / Housewife 4,9
Desempregado / Unemployed 0,5 MOTIVO DA VIAGEM (%) / TRAVEL MOTIVATION
Categoria / Category %
Lazer / Leisure 26,1
Negócios/ Trabalho / Business or work 41,8
Religioso / Religion 0,0
Compras / Shopping 6,0
Visitar Amigos/ Parentes / To visit friends/ family 21,8
Estudos / Study 0,9
FAIXA ETÁRIA (%) / AGE GROUP
Categoria / Category %
De 18 a 24 anos / 18 to 24 years 9,7
De 25 a 29 anos / 25 to 29 years 17,8
De 30 a 39 anos / 30 to 39 years 25,0
De 40 a 49 anos / 40 to 49 years 18,6
De 50 a 59 anos / 50 to 59 years 11,5
Mais de 60 anos / More than 60 years 8,6
GÊNERO / GENDER
ORGANIZAÇÃO DA VIAGEM (%) / TRAVEL PLANNING
Categoria / Category %
Agência de viagens / Travel agency 7,9
Conta própria / Own planning 77,9
Grupo familiar / Family group 5,2
Outros / Other 8,5
Categoria / Category %
Masculino / Male 51,4
Feminino / Female 48,6
Fonte: São Paulo Turismo, 2008
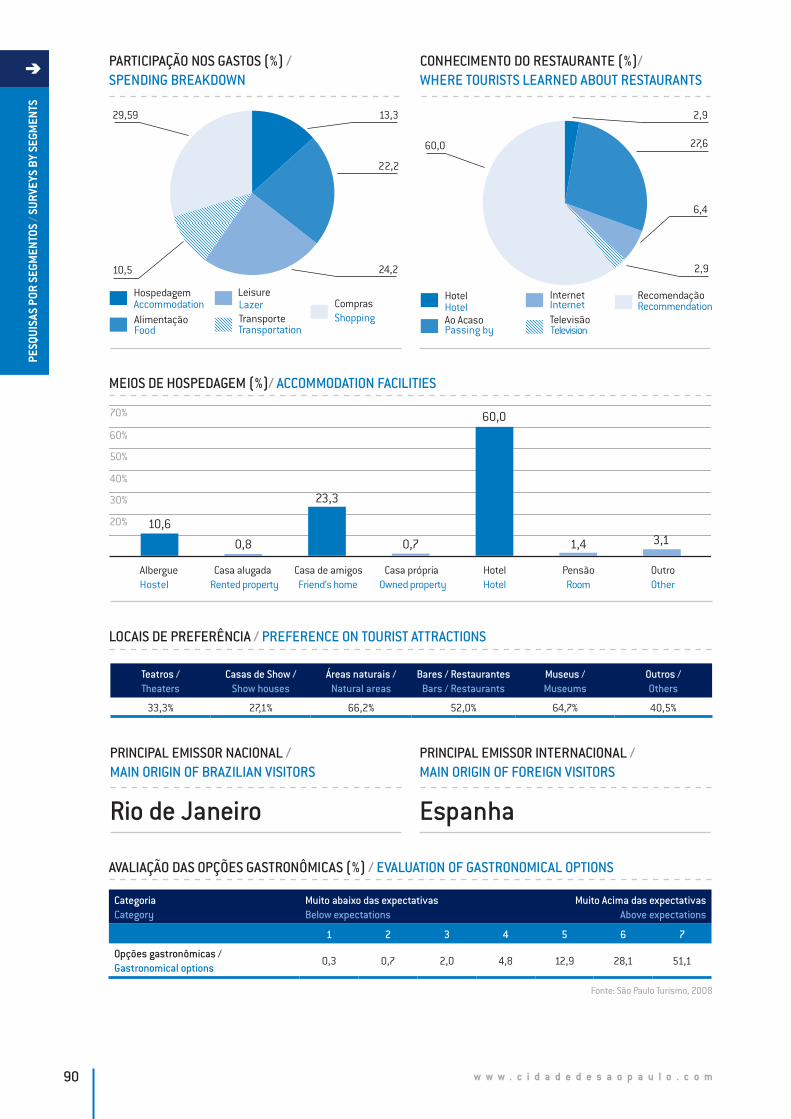
w w w . c i d a d e d e s a o p a u l o . c o m90
PESQ
UISA
S PO
R SE
GMEN
TOS
/ SUR
VEYS
BY
SEGM
ENTS
CategoriaCategory
Muito abaixo das expectativasBelow expectations
Muito Acima das expectativasAbove expectations
1 2 3 4 5 6 7
Opções gastronômicas / Gastronomical options
0,3 0,7 2,0 4,8 12,9 28,1 51,1
AVALIAÇÃO DAS OPÇÕES GASTRONÔMICAS (%) / EVALUATION OF GASTRONOMICAL OPTIONS
PARTICIPAÇÃO NOS GASTOS (%) / SPENDING BREAKDOWN
29,59
22,2
10,5
13,3
24,2
HospedagemAccommodationAlimentaçãoFood
ComprasShopping
LazerLeisure
TransporteTransportation
LOCAIS DE PREFERÊNCIA / PREFERENCE ON TOURIST ATTRACTIONS
Teatros / Theaters
Casas de Show / Show houses
Áreas naturais / Natural areas
Bares / Restaurantes Bars / Restaurants
Museus / Museums
Outros / Others
33,3% 27,1% 66,2% 52,0% 64,7% 40,5%
MEIOS DE HOSPEDAGEM (%)/ ACCOMMODATION FACILITIES
AlbergueHostel
Casa alugadaRented property
Casa de amigosFriend’s home
Casa própriaOwned property
HotelHotel
PensãoRoom
OutroOther
10,6
0,8
70%
50%
40%
30%
60%
20%
23,3
0,7
60,0
1,4 3,1
CONHECIMENTO DO RESTAURANTE (%)/ WHERE TOURISTS LEARNED ABOUT RESTAURANTS
60,0 27,6
2,9
2,9
6,4
HotelHotel
Passing byAo Acaso
RecomendaRecommendation
çãoInternetInternet
TelevisãoTelevision
PRINCIPAL EMISSOR NACIONAL / MAIN ORIGIN OF BRAZILIAN VISITORS
Rio de Janeiro
PRINCIPAL EMISSOR INTERNACIONAL / MAIN ORIGIN OF FOREIGN VISITORS
Espanha
Fonte: São Paulo Turismo, 2008
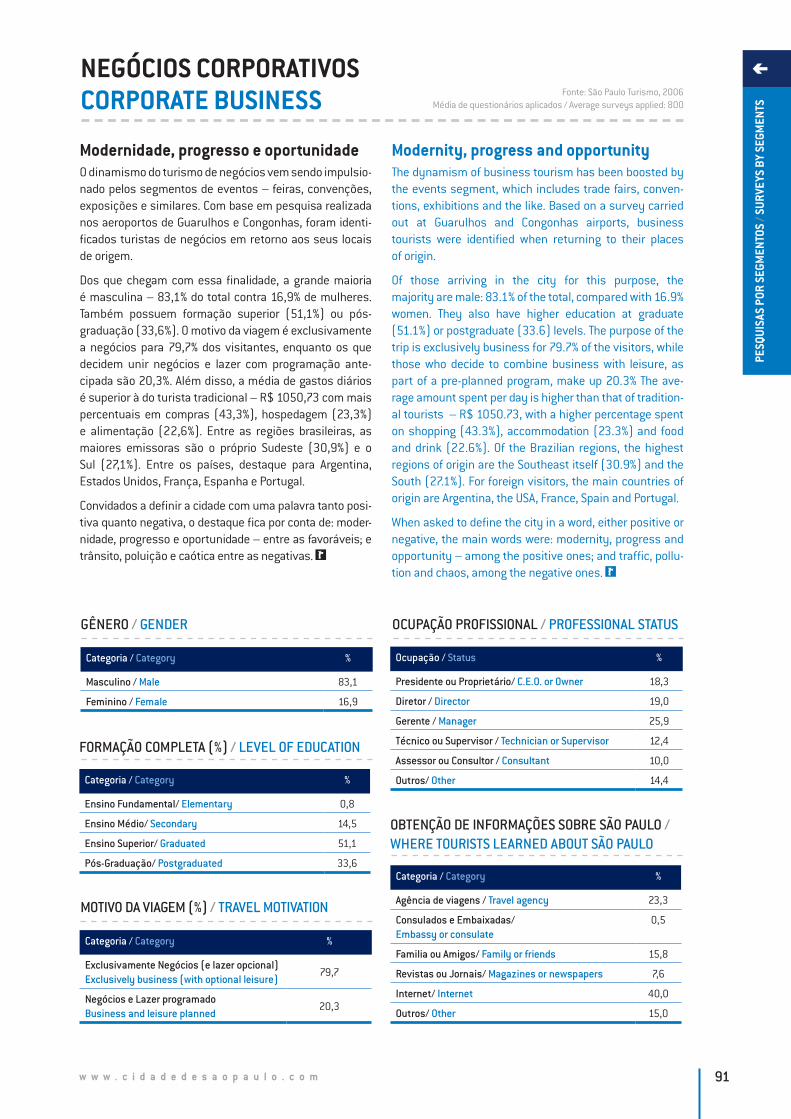
w w w . c i d a d e d e s a o p a u l o . c o m 91
PESQ
UISA
S PO
R SE
GMEN
TOS
/ SUR
VEYS
BY
SEGM
ENTS
NEGÓCIOS CORPORATIVOSCORPORATE BUSINESS
Modernidade, progresso e oportunidadeO dinamismo do turismo de negócios vem sendo impulsio-nado pelos segmentos de eventos – feiras, convenções, exposições e similares. Com base em pesquisa realizada nos aeroportos de Guarulhos e Congonhas, foram identi-ficados turistas de negócios em retorno aos seus locais de origem.
Dos que chegam com essa finalidade, a grande maioria é masculina – 83,1% do total contra 16,9% de mulheres. Também possuem formação superior (51,1%) ou pós-graduação (33,6%). O motivo da viagem é exclusivamente a negócios para 79,7% dos visitantes, enquanto os que decidem unir negócios e lazer com programação ante-cipada são 20,3%. Além disso, a média de gastos diários é superior à do turista tradicional – R$ 1050,73 com mais percentuais em compras (43,3%), hospedagem (23,3%) e alimentação (22,6%). Entre as regiões brasileiras, as maiores emissoras são o próprio Sudeste (30,9%) e o Sul (27,1%). Entre os países, destaque para Argentina, Estados Unidos, França, Espanha e Portugal.
Convidados a definir a cidade com uma palavra tanto posi-tiva quanto negativa, o destaque fica por conta de: moder-nidade, progresso e oportunidade – entre as favoráveis; e trânsito, poluição e caótica entre as negativas.
OCUPAÇÃO PROFISSIONAL / PROFESSIONAL STATUS
Fonte: São Paulo Turismo, 2006Média de questionários aplicados / Average surveys applied: 800
Ocupação / Status %
Presidente ou Proprietário/ C.E.O. or Owner 18,3
Diretor / Director 19,0
Gerente / Manager 25,9
Técnico ou Supervisor / Technician or Supervisor 12,4
Assessor ou Consultor / Consultant 10,0
Outros/ Other 14,4
FORMAÇÃO COMPLETA (%) / LEVEL OF EDUCATION
Categoria / Category %
Ensino Fundamental/ Elementary 0,8
Ensino Médio/ Secondary 14,5
Ensino Superior/ Graduated 51,1
Pós-Graduação/ Postgraduated 33,6
MOTIVO DA VIAGEM (%) / TRAVEL MOTIVATION
Categoria / Category %
Exclusivamente Negócios (e lazer opcional)Exclusively business (with optional leisure)
79,7
Negócios e Lazer programadoBusiness and leisure planned
20,3
GÊNERO / GENDER
OBTENÇÃO DE INFORMAÇÕES SOBRE SÃO PAULO / WHERE TOURISTS LEARNED ABOUT SÃO PAULO
Categoria / Category %
Agência de viagens / Travel agency 23,3
Consulados e Embaixadas/ Embassy or consulate
0,5
Familia ou Amigos/ Family or friends 15,8
Revistas ou Jornais/ Magazines or newspapers 7,6
Internet/ Internet 40,0
Outros/ Other 15,0
Categoria / Category %
Masculino / Male 83,1
Feminino / Female 16,9
Modernity, progress and opportunityThe dynamism of business tourism has been boosted by the events segment, which includes trade fairs, conven-tions, exhibitions and the like. Based on a survey carried out at Guarulhos and Congonhas airports, business tourists were identified when returning to their places of origin.
Of those arriving in the city for this purpose, the majority are male: 83.1% of the total, compared with 16.9% women. They also have higher education at graduate (51.1%) or postgraduate (33.6) levels. The purpose of the trip is exclusively business for 79.7% of the visitors, while those who decide to combine business with leisure, as part of a pre-planned program, make up 20.3% The ave-rage amount spent per day is higher than that of tradition-al tourists – R$ 1050.73, with a higher percentage spent on shopping (43.3%), accommodation (23.3%) and food and drink (22.6%). Of the Brazilian regions, the highest regions of origin are the Southeast itself (30.9%) and the South (27.1%). For foreign visitors, the main countries of origin are Argentina, the USA, France, Spain and Portugal.
When asked to define the city in a word, either positive or negative, the main words were: modernity, progress and opportunity – among the positive ones; and traffic, pollu-tion and chaos, among the negative ones.
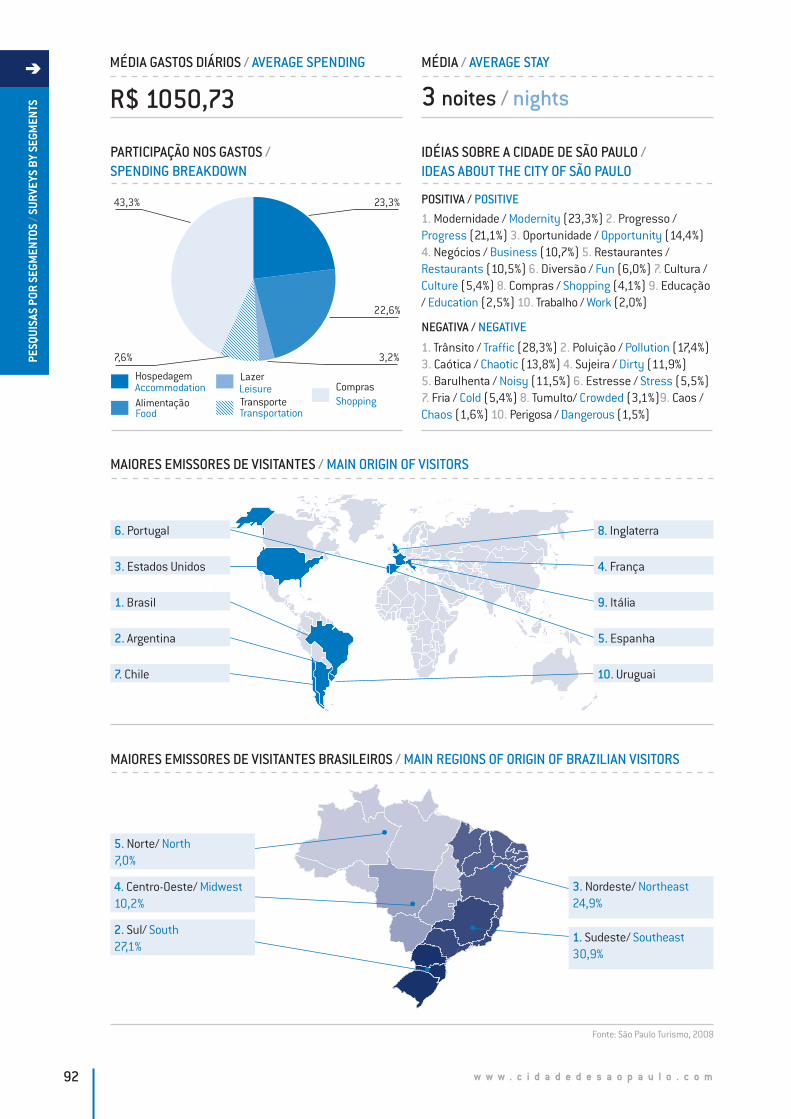
w w w . c i d a d e d e s a o p a u l o . c o m92
PESQ
UISA
S PO
R SE
GMEN
TOS
/ SUR
VEYS
BY
SEGM
ENTS
MÉDIA GASTOS DIÁRIOS / AVERAGE SPENDING
R$ 1050,73
MÉDIA / AVERAGE STAY
3 noites / nights
PARTICIPAÇÃO NOS GASTOS / SPENDING BREAKDOWN
43,3%
22,6%
7,6%
23,3%
3,2%
HospedagemAccommodationAlimentaçãoFood
ComprasShopping
LazerLeisureTransporteTransportation
1. Modernidade / Modernity (23,3%) 2. Progresso / Progress (21,1%) 3. Oportunidade / Opportunity (14,4%) 4. Negócios / Business (10,7%) 5. Restaurantes / Restaurants (10,5%) 6. Diversão / Fun (6,0%) 7. Cultura / Culture (5,4%) 8. Compras / Shopping (4,1%) 9. Educação / Education (2,5%) 10. Trabalho / Work (2,0%)
IDÉIAS SOBRE A CIDADE DE SÃO PAULO / IDEAS ABOUT THE CITY OF SÃO PAULO
POSITIVA / POSITIVE
1. Trânsito / Traffic (28,3%) 2. Poluição / Pollution (17,4%) 3. Caótica / Chaotic (13,8%) 4. Sujeira / Dirty (11,9%) 5. Barulhenta / Noisy (11,5%) 6. Estresse / Stress (5,5%) 7. Fria / Cold (5,4%) 8. Tumulto/ Crowded (3,1%)9. Caos / Chaos (1,6%) 10. Perigosa / Dangerous (1,5%)
NEGATIVA / NEGATIVE
MAIORES EMISSORES DE VISITANTES / MAIN ORIGIN OF VISITORS
MAIORES EMISSORES DE VISITANTES BRASILEIROS / MAIN REGIONS OF ORIGIN OF BRAZILIAN VISITORS
1. Brasil
6. Portugal
7. Chile
2. Argentina
3. Estados Unidos
9. Itália
8. Inglaterra
10. Uruguai
5. Espanha
4. França
5. Norte/ North7,0%
4. Centro-Oeste/ Midwest10,2%
2. Sul/ South27,1%
3. Nordeste/ Northeast24,9%
1. Sudeste/ Southeast30,9%
Fonte: São Paulo Turismo, 2008
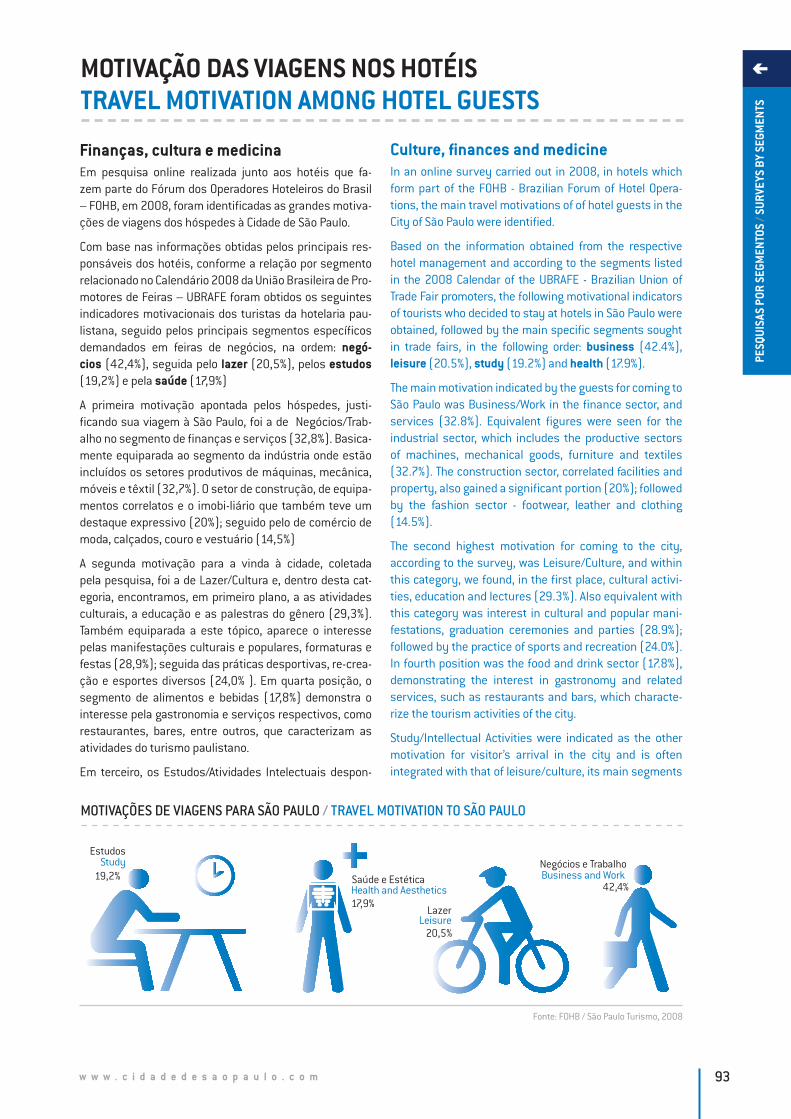
w w w . c i d a d e d e s a o p a u l o . c o m 93
PESQ
UISA
S PO
R SE
GMEN
TOS
/ SUR
VEYS
BY
SEGM
ENTS
MOTIVAÇÃO DAS VIAGENS NOS HOTÉISTRAVEL MOTIVATION AMONG HOTEL GUESTS
Finanças, cultura e medicinaEm pesquisa online realizada junto aos hotéis que fa-zem parte do Fórum dos Operadores Hoteleiros do Brasil – FOHB, em 2008, foram identificadas as grandes motiva-ções de viagens dos hóspedes à Cidade de São Paulo.
Com base nas informações obtidas pelos principais res-ponsáveis dos hotéis, conforme a relação por segmento relacionado no Calendário 2008 da União Brasileira de Pro-motores de Feiras – UBRAFE foram obtidos os seguintes indicadores motivacionais dos turistas da hotelaria pau-listana, seguido pelos principais segmentos específicos demandados em feiras de negócios, na ordem: negó-cios (42,4%), seguida pelo lazer (20,5%), pelos estudos (19,2%) e pela saúde (17,9%)
A primeira motivação apontada pelos hóspedes, justi-ficando sua viagem à São Paulo, foi a de Negócios/Trab-alho no segmento de finanças e serviços (32,8%). Basica-mente equiparada ao segmento da indústria onde estão incluídos os setores produtivos de máquinas, mecânica, móveis e têxtil (32,7%). O setor de construção, de equipa-mentos correlatos e o imobi-liário que também teve um destaque expressivo (20%); seguido pelo de comércio de moda, calçados, couro e vestuário (14,5%)
A segunda motivação para a vinda à cidade, coletada pela pesquisa, foi a de Lazer/Cultura e, dentro desta cat-egoria, encontramos, em primeiro plano, a as atividades culturais, a educação e as palestras do gênero (29,3%). Também equiparada a este tópico, aparece o interesse pelas manifestações culturais e populares, formaturas e festas (28,9%); seguida das práticas desportivas, re-crea-ção e esportes diversos (24,0% ). Em quarta posição, o segmento de alimentos e bebidas (17,8%) demonstra o interesse pela gastronomia e serviços respectivos, como restaurantes, bares, entre outros, que caracterizam as atividades do turismo paulistano.
Em terceiro, os Estudos/Atividades Intelectuais despon-
Culture, finances and medicineIn an online survey carried out in 2008, in hotels which form part of the FOHB - Brazilian Forum of Hotel Opera-tions, the main travel motivations of of hotel guests in the City of São Paulo were identified.
Based on the information obtained from the respective hotel management and according to the segments listed in the 2008 Calendar of the UBRAFE - Brazilian Union of Trade Fair promoters, the following motivational indicators of tourists who decided to stay at hotels in São Paulo were obtained, followed by the main specific segments sought in trade fairs, in the following order: business (42.4%), leisure (20.5%), study (19.2%) and health (17.9%).
The main motivation indicated by the guests for coming to São Paulo was Business/Work in the finance sector, and services (32.8%). Equivalent figures were seen for the industrial sector, which includes the productive sectors of machines, mechanical goods, furniture and textiles (32.7%). The construction sector, correlated facilities and property, also gained a significant portion (20%); followed by the fashion sector - footwear, leather and clothing (14.5%).
The second highest motivation for coming to the city, according to the survey, was Leisure/Culture, and within this category, we found, in the first place, cultural activi-ties, education and lectures (29.3%). Also equivalent with this category was interest in cultural and popular mani-festations, graduation ceremonies and parties (28.9%); followed by the practice of sports and recreation (24.0%). In fourth position was the food and drink sector (17.8%), demonstrating the interest in gastronomy and related services, such as restaurants and bars, which characte-rize the tourism activities of the city.
Study/Intellectual Activities were indicated as the other motivation for visitor’s arrival in the city and is often integrated with that of leisure/culture, its main segments
Fonte: FOHB / São Paulo Turismo, 2008
MOTIVAÇÕES DE VIAGENS PARA SÃO PAULO / TRAVEL MOTIVATION TO SÃO PAULO
42,4%
20,5%
17,9%
19,2%Negócios e TrabalhoBusiness and Work
StudyEstudos
Saúde e EstéticaHealth and Aesthetics
LazerLeisure
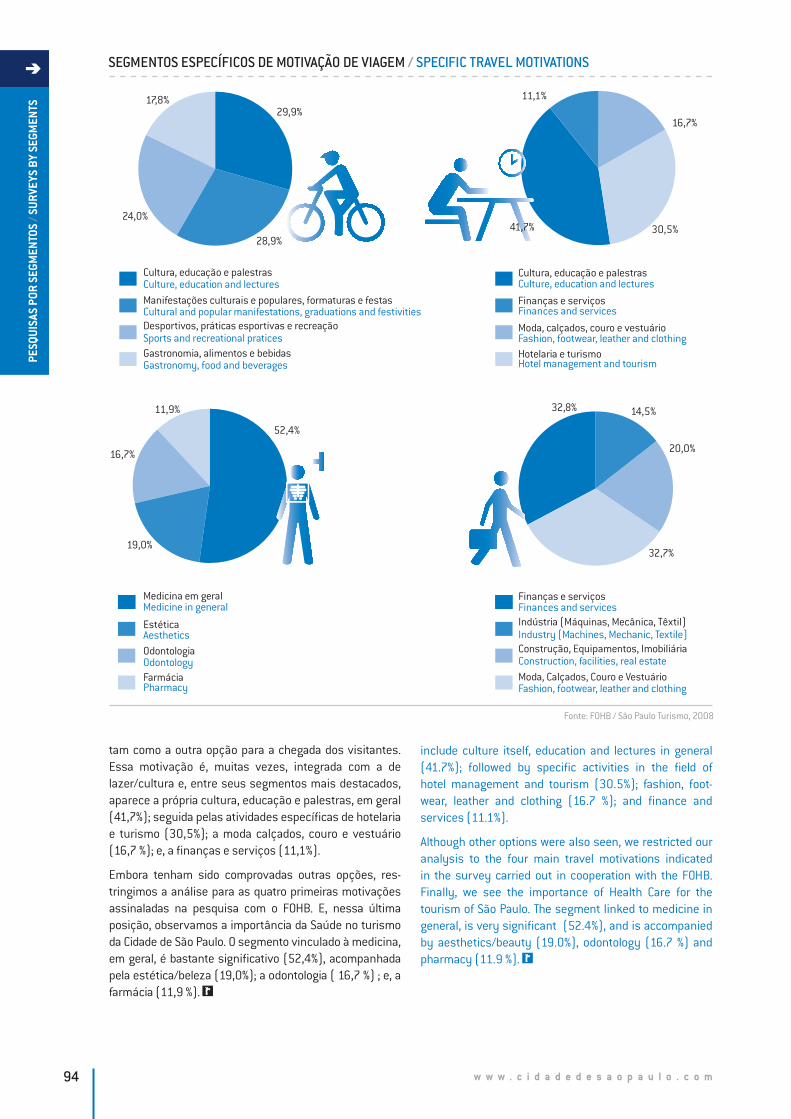
w w w . c i d a d e d e s a o p a u l o . c o m94
PESQ
UISA
S PO
R SE
GMEN
TOS
/ SUR
VEYS
BY
SEGM
ENTS
42,7%
20,5%
17,9%
19,2%
Negócios e Trabalho
Estudos, Treinamentos Profissionais e Científicos
Saúde e Estética
Lazer
30,5%41,7%
14,5%
20,0%
19,0%
52,4%
11,9%
16,7%
32,7%
32,8%
11,1%
16,7%29,9%
28,9%
24,0%
17,8%
Cultura, educação e palestrasCulture, education and lectures
Finanças e serviçosFinances and services
Moda, calçados, couro e vestuárioFashion, footwear, leather and clothingHotelaria e turismo Hotel management and tourism
Cultura, educação e palestrasCulture, education and lectures
Gastronomia, alimentos e bebidasGastronomy, food and beverages
Manifestações culturais e populares, formaturas e festasCultural and popular manifestations, graduations and festivitiesDesportivos, práticas esportivas e recreaçãoSports and recreational pratices
Medicine in generalMedicina em geral
EstéticaAestheticsOdontologiaOdontologyFarmáciaPharmacy
Finanças e serviçosFinances and servicesIndústria (Máquinas, Mecânica, Têxtil)Industry (Machines, Mechanic, Textile)Construção, Equipamentos, ImobiliáriaConstruction, facilities, real estateModa, Calçados, Couro e VestuárioFashion, footwear, leather and clothing
Fonte: FOHB / São Paulo Turismo, 2008
SEGMENTOS ESPECÍFICOS DE MOTIVAÇÃO DE VIAGEM / SPECIFIC TRAVEL MOTIVATIONS
42,7%
20,5%
17,9%
19,2%
Negócios e Trabalho
Estudos, Treinamentos Profissionais e Científicos
Saúde e Estética
Lazer
42,7%
20,5%
17,9%
19,2%
Negócios e Trabalho
Estudos, Treinamentos Profissionais e Científicos
Saúde e Estética
Lazer
42,7%
20,5%
17,9%
19,2%
Negócios e Trabalho
Estudos, Treinamentos Profissionais e Científicos
Saúde e Estética
Lazer
42,7%
20,5%
17,9%
19,2%
Negócios e Trabalho
Estudos, Treinamentos Profissionais e Científicos
Saúde e Estética
Lazer
tam como a outra opção para a chegada dos visitantes. Essa motivação é, muitas vezes, integrada com a de lazer/cultura e, entre seus segmentos mais destacados, aparece a própria cultura, educação e palestras, em geral (41,7%); seguida pelas atividades específicas de hotelaria e turismo (30,5%); a moda calçados, couro e vestuário (16,7 %); e, a finanças e serviços (11,1%).
Embora tenham sido comprovadas outras opções, res-tringimos a análise para as quatro primeiras motivações assinaladas na pesquisa com o FOHB. E, nessa última posição, observamos a importância da Saúde no turismo da Cidade de São Paulo. O segmento vinculado à medicina, em geral, é bastante significativo (52,4%), acompanhada pela estética/beleza (19,0%); a odontologia ( 16,7 %) ; e, a farmácia (11,9 %).
include culture itself, education and lectures in general (41.7%); followed by specific activities in the field of hotel management and tourism (30.5%); fashion, foot-wear, leather and clothing (16.7 %); and finance and services (11.1%).
Although other options were also seen, we restricted our analysis to the four main travel motivations indicated in the survey carried out in cooperation with the FOHB. Finally, we see the importance of Health Care for the tourism of São Paulo. The segment linked to medicine in general, is very significant (52.4%), and is accompanied by aesthetics/beauty (19.0%), odontology (16.7 %) and pharmacy (11.9 %).
w w w . c i d a d e d e s a o p a u l o . c o m 95
/DIAGNÓSTICOS E CONCLUSÕES/DIAGNOSES AND CONCLUSIONS
w w w . c i d a d e d e s a o p a u l o . c o m96
MET
ODOL
OGIA
/ M
ETHO
DOLO
GY
O fluxo de visitantes da Cidade de São Paulo é composto por uma diversidade de segmentos, cada qual com uma carac-terística, um público diferenciado, um comportamento específico, uma cultura e uma etnia distinta. Com tantas alterna-tivas, a imagem desse grandioso lugar é bem típica, comparada a um caleidoscópio, num cenário multifacetado, colorido e fascinante, contendo de tudo e para todos. É um destino turístico que atrai as pessoas tanto por seus negócios, como pelos seus muitos eventos e também pelo seu lazer de variados aspectos culturais e opções de entretenimento, onde se incluem as compras e uma gastronomia notável.
A elaboração e divulgação dos dados, descritos nesta obra, teve por finalidade iniciar o processo de revelação inúmeras pos-sibilidades da capital paulista, por meio dos principais componentes da sua demanda e de parte da sua oferta turística.
Dimensionada por um número estimado de 11,0 milhões de visitantes em 2008, que aqui chegam durante temporadas distintas, prevê-se que até o final desta década, a cidade esteja recebendo uma média de mais de 12,0 milhões de pessoas interessadas em seus atrativos famosos. Importa assim que ela seja preparada, planejada e em condições de abrigar o grande volume da demanda esperada.
O trabalho aqui iniciado não se esgota, deve ser sempre atualizado, aprimorado, para que estas informações sejam uti-lizadas em planos estratégicos dos envolvidos, tanto do setor público como privado. Esperamos que a proposta abrigue novos exemplos e que outros destinos turísticos possam se beneficiar dessa base de dados gerenciais, realizada com originalidade por meio das pesquisas da empresa, com outras instituições como a Fundação Instituto de Pesquisas Econômicas, o São Paulo Convention & Visitors Bureau e o Fórum dos Operadores Hoteleiros do Brasil.
Com os agradecimentos a todos que colaboraram nesta publicação idealizada pela São Paulo Turismo, esperamos ter contribuído para um melhor entendimento do significado do turismo na Cidade de São Paulo.
Visitor traffic to the City of São Paulo is made up of a wide variety of segments, each with its own characteristics, its own unique public, specific behaviors, distinct culture and ethnic profile. Given so many alternatives, the image of this great city is like a kaleidoscope, in a multifaceted, colorful and fascinating scenario containing something for everybody. It is a tourism destination which attracts people for business, such as the many events, and also for leisure and various cultural aspects and entertainment options, which include shopping and the great range of restaurants.
The purpose of the elaboration and publication of the numerical data described in this work is to iniciate the process of revealing the multitudinous possibilities of the city, by means of the main components of its demand and its tourism offer.
Capable of receiving more than 11.0 millions of visitors, who arrive here during different seasons, it is forecast that by the end of this decade, the city will be receiving an average of over 12.0 million people interested in its famous attractions. It is also important that the city is prepared and able to accommodate the high volume of expected demand.
The present work is not exhaustive; it needs to be continually updated and improved, so that the information can be used as a foundation in the strategic plans of those involved, both in public and private sectors. We hope that the pro-posal includes new examples and that also other tourism destinations will benefit from this database of management data, produced for the first time, through surveys carried out by the company and by other companies such as the Fundação Instituto de Pesquisas Econômicas (Institute for Economic Research Foundation), São Paulo Convention & Visitors Bureau, Fórum dos Operadores Hoteleiros do Brasil (Brazilian Hotel Operators Institute).
Expressing our sincerest thanks to all those, who took part in this publication idealized by São Paulo Turismo, we hope the data contained in it will contribute to a better understanding of the significance of tourism for the City of São Paulo.
DIAGNÓSTICOS E CONCLUSÕES
DIAGNOSES AND CONCLUSIONS
w w w . c i d a d e d e s a o p a u l o . c o m 97
/ REMARKS ON THE METHODOLOGY/ ASPECTOS DA METODOLOGIA
w w w . c i d a d e d e s a o p a u l o . c o m98
MET
ODOL
OGIA
/ M
ETHO
DOLO
GY 1. A escolha dos eventos de grande porte pesquisados foram propostas por um grupo de trabalho, em 2005, do qual fizeramparte as principais entidades do trade turístico.
2. As investigações tiveram propósito de caráter exploratório, visando contribuir com ações de promoção e políticas públicas do turismo na Cidade de São Paulo.
3. Na estimativa do número de turistas apontados, incluem-se os visitantes do interior e litoral do Estado de São Paulo, de outros Estados e estrangeiros.
4. Para efeito da análise, os termos “visitantes” e “turistas” foram assumidos de forma equivalente.
5. Procurou-se construir uma série histórica de todos os eventos selecionados. Por problemas técnicos, não puderam ser realizadas pesquisas em casos excepcionais assinalados no período de 2005 a 2008.
6. Foram estimados os resultados apresentados para o ano de 2008 das pesquisas do Salão do Automóvel e do GP Fórmula 1.
7. Foi estimada a média da ocupação da hotelaria para o ano de 2008 a partir dos dados do primeiro semestre, comparado com os anos 2005, 2006 e 2007.
8. Foi estimado o volume do ISS para o ano de 2008 com base nos dados apresentados do período anterior e na projeção dos resultados do 1º semestre.
9. Os dados apurados referentes à taxa de ocupação, diária média e REVPAR foram obtidos por meio de pesquisa mensal realizada pela SP Turis junto a 410 hotéis de todas as categorias na cidade, sendo validadas 100 respostas proporcionais ao número de hotéis de cada categoria na cidade.
10. Na análise dos megaeventos, não foram incluídos os emissores de visitantes das cidades que compõem a grande metrópole.
11. Para cada pesquisa foi aplicado um tipo de metodologia e de constatação; considerando-se que em alguns casos, questões específicas foram incluídas para atender a finalidade proposta.
12. Os valores apresentados de cada pesquisa registram uma tendência, mas não necessariamente refletem o comportamento geral da demanda do turismo na Cidade de São Paulo.
13. O sistema de análise de dados utilizado na tabulação e construção das pesquisas foi o SPHINX Léxica (V5).
14. Não foram objeto das investigações a realização de entrevistas com os expositores dos eventos pesquisados, nacionais ou internacionais.
15. Foram escolhidos como pesquisadores, alunos universitários oriundos de várias entidades de ensino da Cidade de São Paulo, em caráter voluntário, selecionados e treinados para os respectivos levantamentos de campo.
16. O valor da renda mensal corresponde ao salário mínimo adotado no ano vigente.
17. Para a estimativa da demanda turística foi utilizada base de dados secundários de pesquisas elaboradas pela FIPE, a partir de 2006.
18. Dados da oferta turística em constante revisão pela SPTuris.
19. Dados referentes ao ano de 2007 e 2008 sujeitos a revisão.
20. A publicação restringe-se a uma apresentação sintetizada de variáveis básicas. A série completa, inclusive a “Ca- racterização e Dimensionamento da Demanda Turística do Município de São Paulo” (FIPE, 2008), pode ser obtida na SPTuris, através de sua Diretoria de Turismo e Entretenimento.
OBSERVAÇÕES SOBRE A METODOLOGIA

w w w . c i d a d e d e s a o p a u l o . c o m 99
MET
ODOL
OGIA
/ M
ETHO
DOLO
GY1. The choice of events for inclusion in the survey was proposed by a working group in 2005, made up of key entities in the tourism trade.
2. The investigations were of an exploratory nature, seeking to contribute to the actions of tourism promotion and public policies in the City of São Paulo.
3. The estimates of the total number of tourists include all visitors from interior and coast from São Paulo State, as well as other states and countries.
4. For analysis purposes, the terms “visitors” and “tourists” were considered equivalent.
5. The aim was to construct a historical series for all the events selected. Due to technical difficulties, surveys could not be carried out in the few cases mentioned, for the period 2005 to 2008.
6. The results presented for the “Salão Automóvel” (Motor Show) and Formula 1 Grand Prix for 2008 are estimates.
7. The average hotel occupancy rate for the year 2008 was estimated, based on the data for the first six months, and compared with the years 2005, 2006 and 2007.
8. The volume of ISS for the year 2008 was estimated, based on data presented for the previous period, and the forecast from the 1st half of the current year.
9. The data calculated for occupancy rate, average daily rate and REVPAR were obtained through a monthly survey carried out by SP Turis, with 410 hotels in all categories in the city, for which 100 responses were validated in proportion to the number of hotels for each category in the city.
10. In the analysis of the origin cities of visitors to the mega events, those of the greater metropolitan area were not included.
11. For each segment, specific variables were analyzed; considering in some cases, specific questions included for the purposes of the survey.
12. The values presented for each survey indicate a trend, but do not necessarily reflect the general behavior of the tourism demand in the City of São Paulo.
13. The system of data analysis used to tabulate and construct the surveys was the SPHINX Léxica (V5)
14. Interviews with national or international exhibitors at the events surveyed were not the object of investigation.
15. University students from various teaching institutions in the City of São Paulo were chosen to work, on a voluntary basis, as researchers. The students were selected and trained for the respective field surveys.
16. The value of monthly income corresponds to minimum wage of the year.
17. The tourism demand forecast was estimated by using the FIPE database of surveys, since 2006.
18. Information on the tourism offer continously revised by SPTuris.
19. Information from 2007 and 2008 being revised.
20. The publication is restricted to a summary presentation of the basic variables. The complete series, including the “Characteriztion and Size of Tourism Demand in the City of São Paulo” (FIPE, 2008), can be obtained from SPTuris, through its Tourism and Entertainment Directorate.
REMARKS ON THE METHODOLOGY

Impresso em novembro de 2008. Tiragem: 5000 exemplares.
O objetivo da São Paulo Turismo é promover a Cidade de São Paulo de forma indepen-dente e sem nenhum vínculo com os esta-belecimentos mencionados.
Todas as informações que constam nesse material estão sujeitas a alterações sem aviso prévio.
Printed in November 2008. Print run: 5000 copies.
The objective of São Paulo Turismo is to promote the City of São Paulo in an inde-pendent manner and with no ties to the estabilishments mentioned here in.
All information contained in this book is subject to change without prior notice.
