c ibanez sem_eco_gener2013
TRANSCRIPT
Regime shift in a large river: top-down versus bottom-up effects C. Ibáñez, C. Alcaraz, N. Caiola, A. Rovira, R. Trobajo, C. Duran, A. Munné and N. Prat
IRTA Aquatic Ecosystems, Sant Carles de la Ràpita, Catalonia, Spain; [email protected]
Confederación Hidrográfica del Ebro, Zaragoza, Aragón, Spain.
Agència Catalana de l’Aigua, Barcelona, Catalonia, Spain.
Departament d’Ecologia, Universitat de Barcelona, Catalonia, Spain.
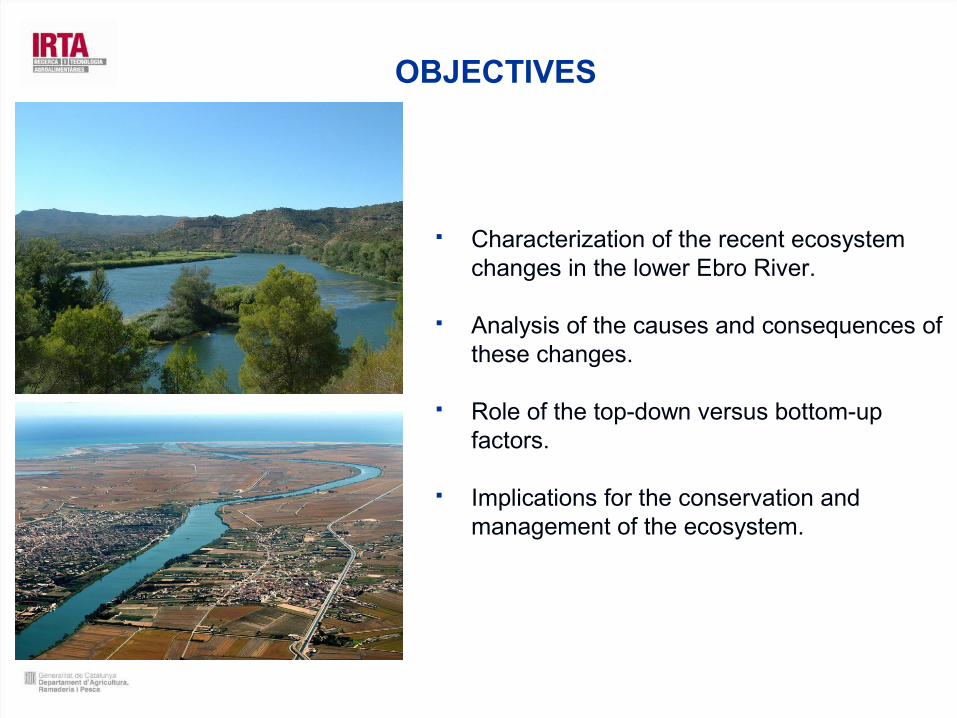
Characterization of the recent ecosystem changes in the lower Ebro River.
Analysis of the causes and consequences of these changes.
Role of the top-down versus bottom-up factors.
Implications for the conservation and management of the ecosystem.
OBJECTIVES

A NOVEL ECOSYSTEM SHIFT ?New conditions: less nutrients, lower discharge and alien species
Potamogeton pectinatusSilurus glanis
Corbicula flumineaSimulium erytrhocephalum
Dreissena polymorpha
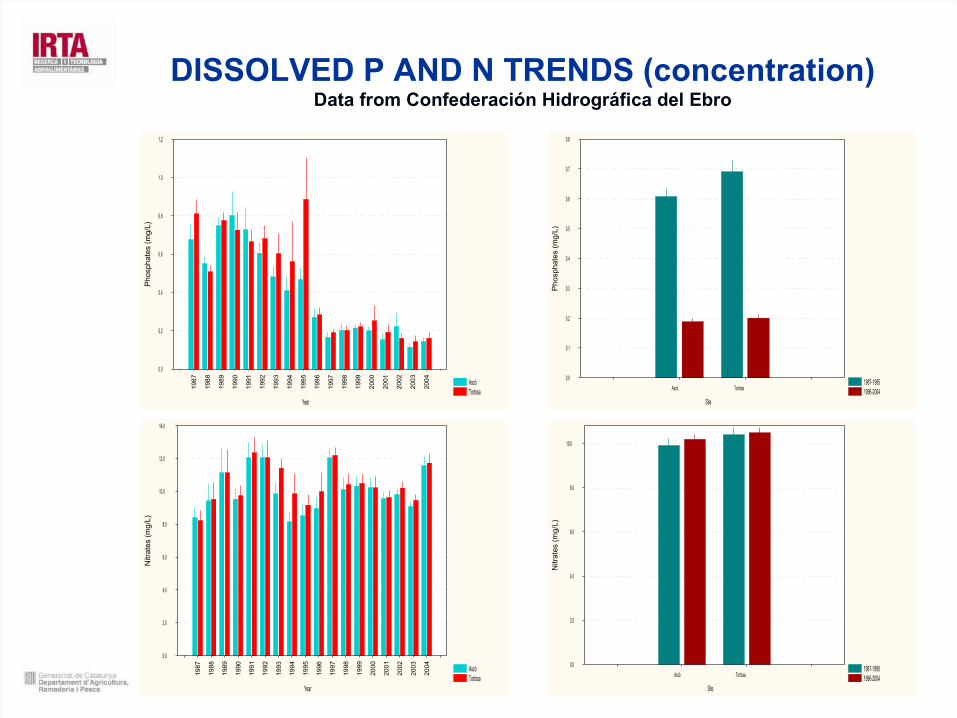
DISSOLVED P AND N TRENDS (concentration)Data from Confederación Hidrográfica del Ebro
Ascó Tortosa
198
7
198
8
1989
1990
199
1
199
2
1993
1994
199
5
199
6
1997
1998
199
9
200
0
2001
2002
200
3
200
4
Year
0.0
0.2
0.4
0.6
0.8
1.0
1.2P
hosp
hat
es (
mg/
L)
1987-1995 1996-2004Ascó Tortosa
Site
0.0
0.1
0.2
0.3
0.4
0.5
0.6
0.7
0.8
Pho
spha
tes
(mg/
L)
Ascó Tortosa
1987
1988
198
9
1990
199
1
199
2
1993
199
4
1995
1996
199
7
1998
199
9
200
0
2001
200
2
2003
2004
Year
0.0
2.0
4.0
6.0
8.0
10.0
12.0
14.0
Nitr
ates
(m
g/L)
1987-1995 1996-2004Ascó Tortosa
Site
0.0
2.0
4.0
6.0
8.0
10.0
Nitr
ates
(m
g/L)

DISSOLVED PHOSPHATE Data from Confederación Hidrográfica del Ebro (Ascó)
Fosfatos
0
0,5
1
1,5
2
2,5
3
3,5
06/0
4/19
81
06/0
4/19
82
06/0
4/19
83
06/0
4/19
84
06/0
4/19
85
06/0
4/19
86
06/0
4/19
87
06/0
4/19
88
06/0
4/19
89
06/0
4/19
90
06/0
4/19
91
06/0
4/19
92
06/0
4/19
93
06/0
4/19
94
06/0
4/19
95
06/0
4/19
96
06/0
4/19
97
06/0
4/19
98
06/0
4/19
99
06/0
4/20
00
06/0
4/20
01
06/0
4/20
02
06/0
4/20
03
06/0
4/20
04
06/0
4/20
05
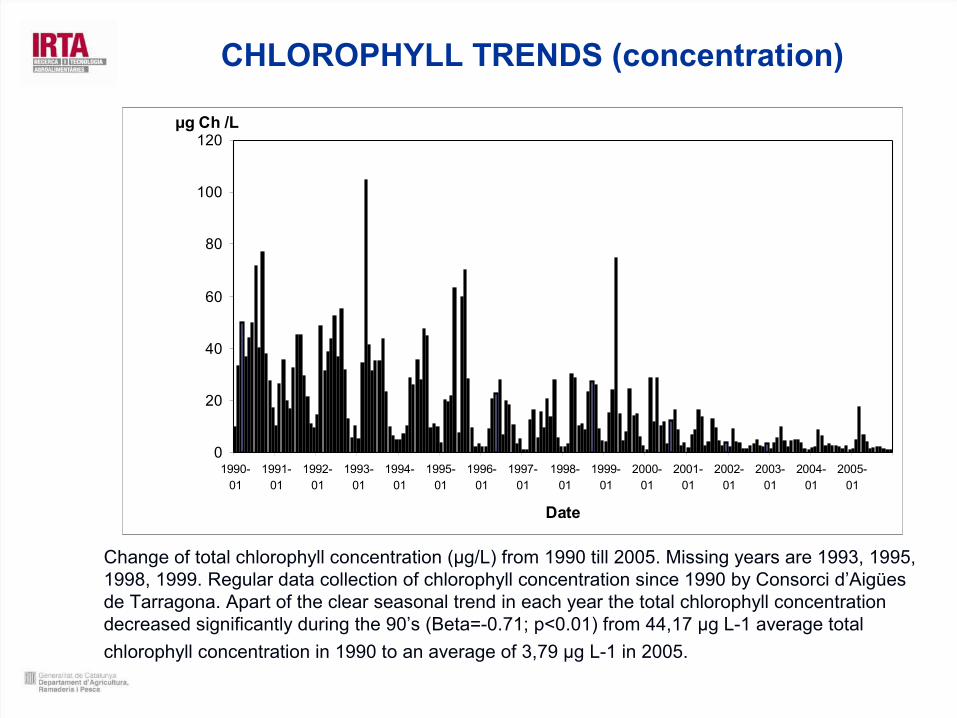
CHLOROPHYLL TRENDS (concentration)
Change of total chlorophyll concentration (μg/L) from 1990 till 2005. Missing years are 1993, 1995, 1998, 1999. Regular data collection of chlorophyll concentration since 1990 by Consorci d’Aigües de Tarragona. Apart of the clear seasonal trend in each year the total chlorophyll concentration decreased significantly during the 90’s (Beta=-0.71; p<0.01) from 44,17 μg L-1 average total
chlorophyll concentration in 1990 to an average of 3,79 μg L-1 in 2005.
0
20
40
60
80
100
120
1990-01
1991-01
1992-01
1993-01
1994-01
1995-01
1996-01
1997-01
1998-01
1999-01
2000-01
2001-01
2002-01
2003-01
2004-01
2005-01
Date
μg Ch /L
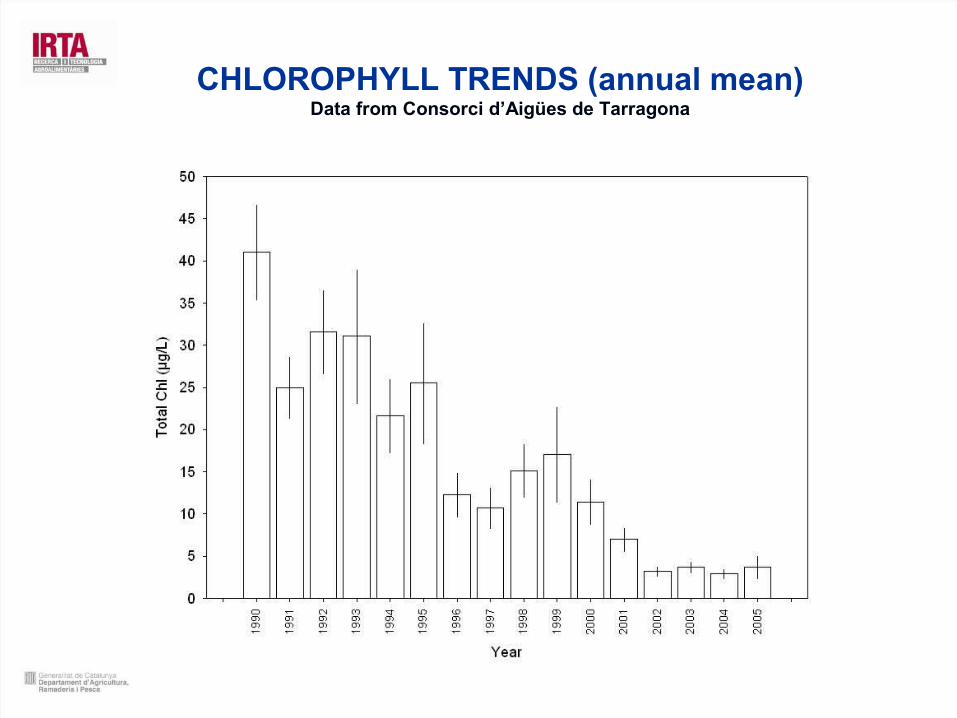
CHLOROPHYLL TRENDS (annual mean)Data from Consorci d’Aigües de Tarragona
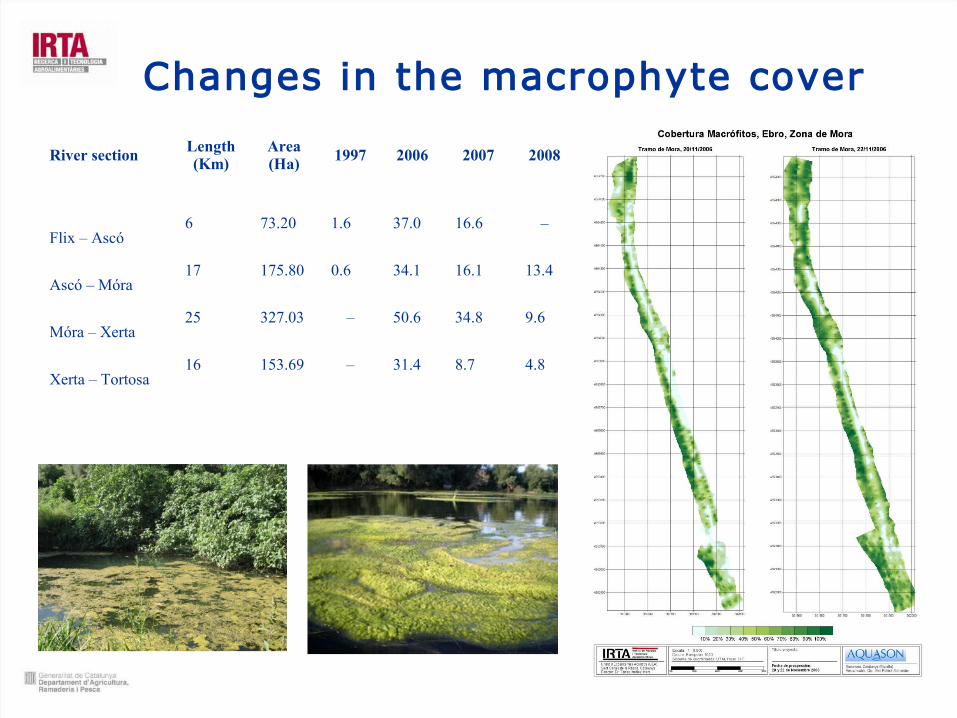
Changes in the macrophyte cover
El musclo zebrat al tram final de l'Ebre i els seus impactes
River sectionLength (Km)
Area (Ha) 1997 2006 2007 2008
Flix – Ascó6 73.20 1.6 37.0 16.6 –
Ascó – Móra17 175.80 0.6 34.1 16.1 13.4
Móra – Xerta25 327.03 – 50.6 34.8 9.6
Xerta – Tortosa16 153.69 – 31.4 8.7 4.8
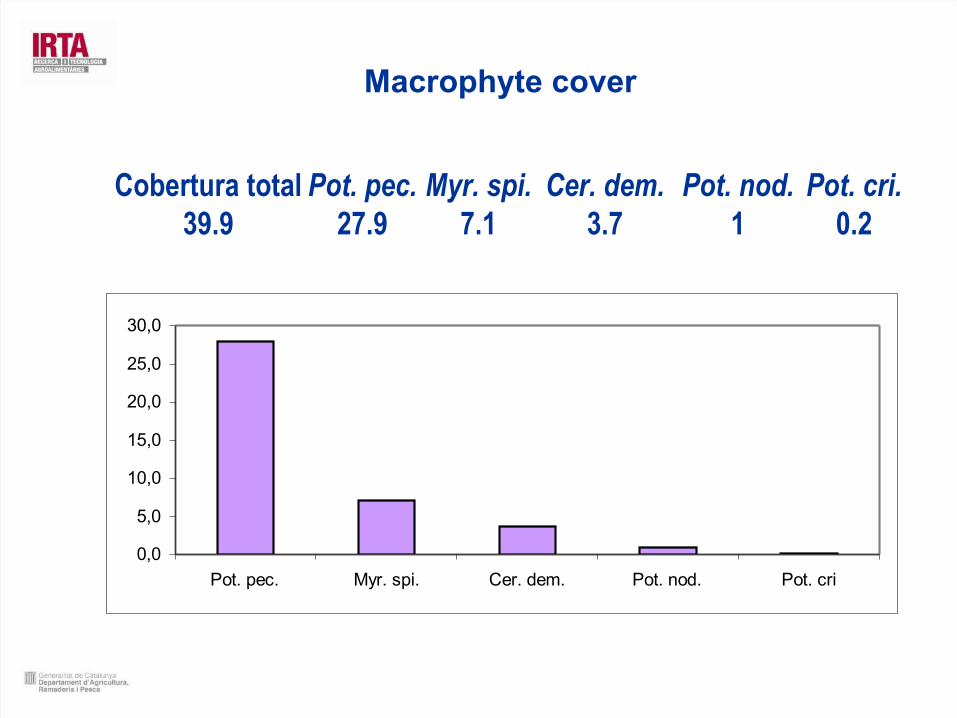
Macrophyte cover
0,0
5,0
10,0
15,0
20,0
25,0
30,0
Pot. pec. Myr. spi. Cer. dem. Pot. nod. Pot. cri
Cobertura total Pot. pec. Myr. spi. Cer. dem. Pot. nod. Pot. cri.39.9 27.9 7.1 3.7 1 0.2
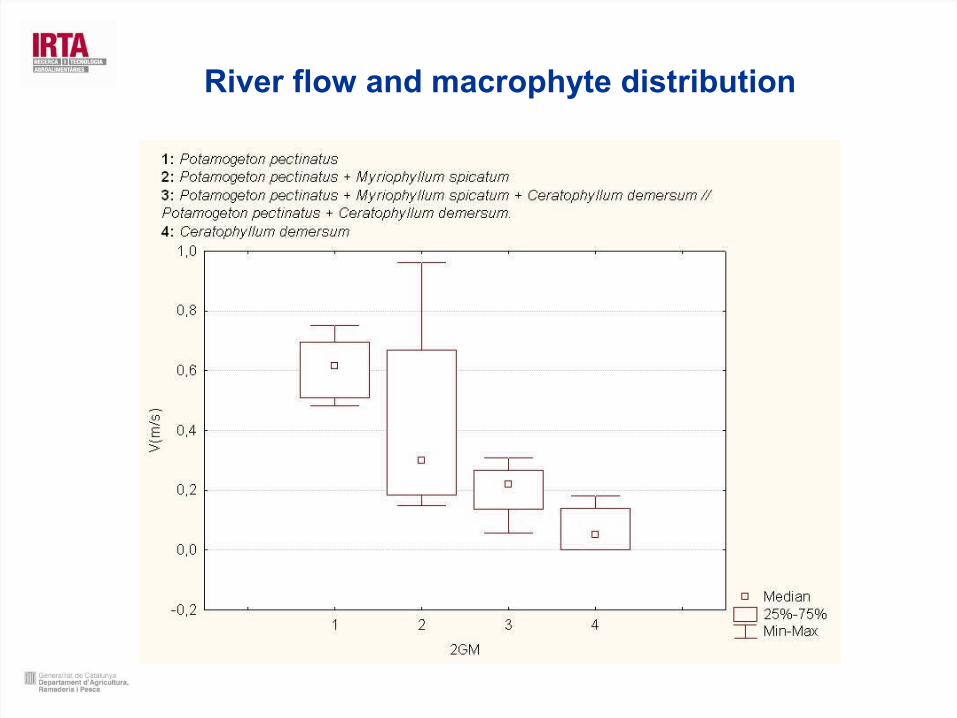
River flow and macrophyte distribution

Increased water transparency (phytoplankton decline) due to:
Lower eutrophication (bottom-up)Ibáñez et al. (2008). Changes in dissolved nutrients in the
lower Ebro River: causes and consequences. Limnetica 27(1): 131-142.
Colonization of Zebra mussel (top-down)Sabater et al. (2008). Longitudinal development of
chlorophyll and phytoplankton assemblages in a regulated large river (the Ebro River). Science of the Total Environment 404: 196-206.
More regular and lower discharge (light penetration, velocity, temperature)
HYPOTHESIS TO EXPLAIN THE ECOSYSTEM SHIFT
The aim of this study was to elucidate which are the final causes of decrease in chlorophyll, and the subsequent spreading of submerged macrophytes occurred in the lower Ebro River, including data from zebra mussel density (top-down effects). Ibáñez et al. (2012). Science of the Total Environment 416: 314-322.
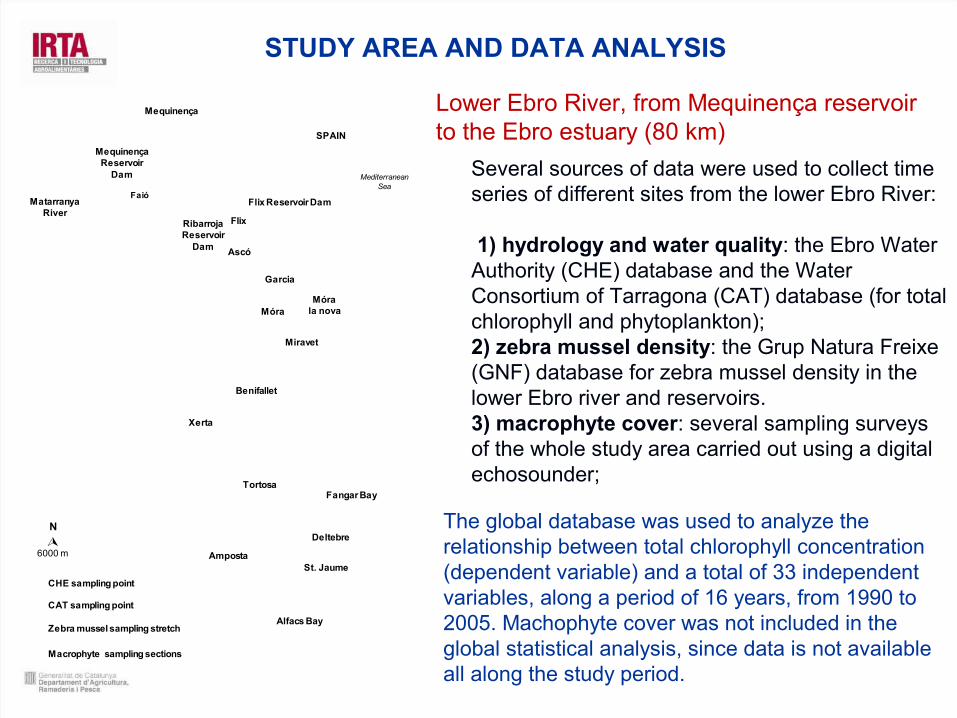
Several sources of data were used to collect time series of different sites from the lower Ebro River:
1) hydrology and water quality: the Ebro Water Authority (CHE) database and the Water Consortium of Tarragona (CAT) database (for total chlorophyll and phytoplankton); 2) zebra mussel density: the Grup Natura Freixe (GNF) database for zebra mussel density in the lower Ebro river and reservoirs.3) macrophyte cover: several sampling surveys of the whole study area carried out using a digital echosounder;
STUDY AREA AND DATA ANALYSIS
Lower Ebro River, from Mequinença reservoir to the Ebro estuary (80 km)
MequinençaReservoir
Dam
Mequinença
Faió
RibarrojaReservoir
Dam
Flix
Ascó
Móra
Garcia
MatarranyaRiver
N
Flix Reservoir Dam
SPAIN
PORTUGAL
FRANCE
Mediterranean Sea
6000 m
Xerta
Tortosa
Amposta
Deltebre
St. Jaume
Fangar Bay
Alfacs Bay
Mórala nova
CAT sampling point
CHE sampling point
Zebra mussel sampling stretch
Macrophyte sampling sections
Benifallet
Miravet
The global database was used to analyze the relationship between total chlorophyll concentration (dependent variable) and a total of 33 independent variables, along a period of 16 years, from 1990 to 2005. Machophyte cover was not included in the global statistical analysis, since data is not available all along the study period.
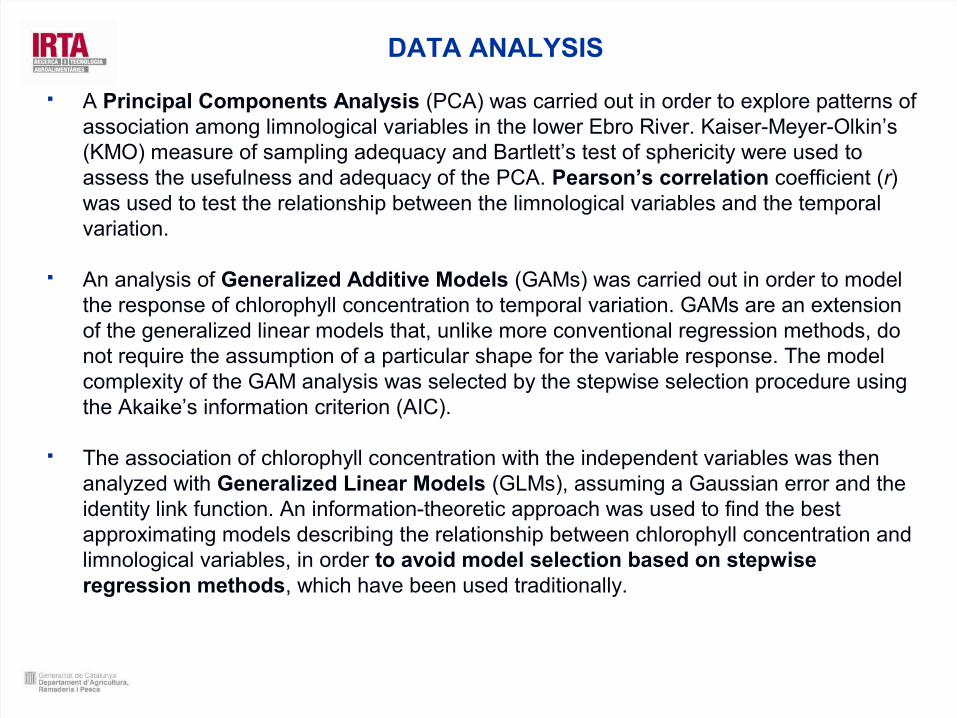
DATA ANALYSIS
A Principal Components Analysis (PCA) was carried out in order to explore patterns of association among limnological variables in the lower Ebro River. Kaiser-Meyer-Olkin’s (KMO) measure of sampling adequacy and Bartlett’s test of sphericity were used to assess the usefulness and adequacy of the PCA. Pearson’s correlation coefficient (r) was used to test the relationship between the limnological variables and the temporal variation.
An analysis of Generalized Additive Models (GAMs) was carried out in order to model the response of chlorophyll concentration to temporal variation. GAMs are an extension of the generalized linear models that, unlike more conventional regression methods, do not require the assumption of a particular shape for the variable response. The model complexity of the GAM analysis was selected by the stepwise selection procedure using the Akaike’s information criterion (AIC).
The association of chlorophyll concentration with the independent variables was then analyzed with Generalized Linear Models (GLMs), assuming a Gaussian error and the identity link function. An information-theoretic approach was used to find the best approximating models describing the relationship between chlorophyll concentration and limnological variables, in order to avoid model selection based on stepwise regression methods, which have been used traditionally.
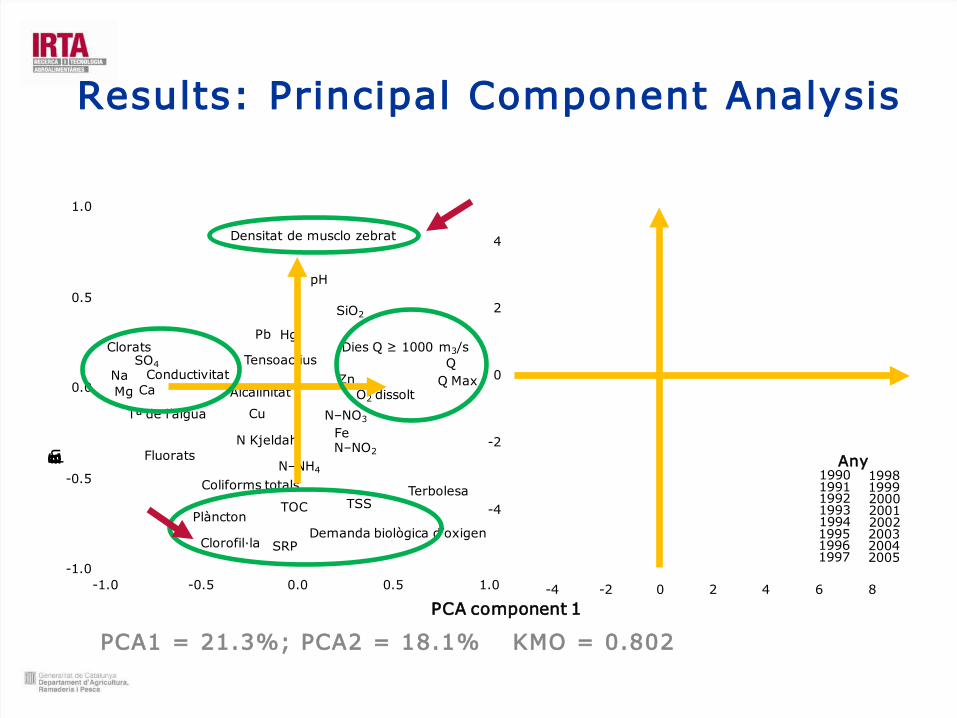
Results: Principal Component Analysis
-1.0
-0.5
0.0
0.5
1.0
-1.0 -0.5 0.0 0.5 1.0
Demanda biològica d’oxigenSRPClorofil·la
TerbolesaTSSTOC
Plàncton
Fluorats
Coliforms totals
FeN–NO2
N–NH4
N–NO3
N Kjeldahl
Tª de l’aigua Cu
QQ Max
O2 dissolt
Dies Q ≥ 1000 m3/s
Zn
Densitat de musclo zebrat
pH
SiO2
Tensoactius
HgPb
AlcalinitatNa
SO4
Clorats
ConductivitatCaMg
19901991199219931994199519961997
19981999200020012002200320042005
Any
4
2
0
-2
-4
-2-4 6 82 40
PCA component 2
PCA component 1
KMO = 0.802 PCA1 = 21.3%; PCA2 = 18.1%

GAMs: changes in total chlorophyll (monthly data)
El musclo zebrat al tram final de l'Ebre i els seus impactes
Non-linear F1, 189 = 4.74, P = 0.031
Null model deviance = 45.8
Model deviance = 20.6
Model F2, 189 = 115.6, P < 0.0001
A slight change of tendency is observed around the year 2000
Zebra mussel ?0.0
0.5
1.0
1.5
2.0
Log(Chlorophyll concentration (µg/L))
MonthJan 92 Jan 96 Jan 00 Jan 04
24 48 72 96 120 144 168 1921
El musclo zebrat al tram final de l'Ebre i els seus impactes
Log(Chlorophyll concentration (µg/L))
0.0
0.5
1.0
1.5
2.0
1.6 1.8 2.0 2.2 2.4 2.6 2.8
Log(SRP concentration (µg/L))
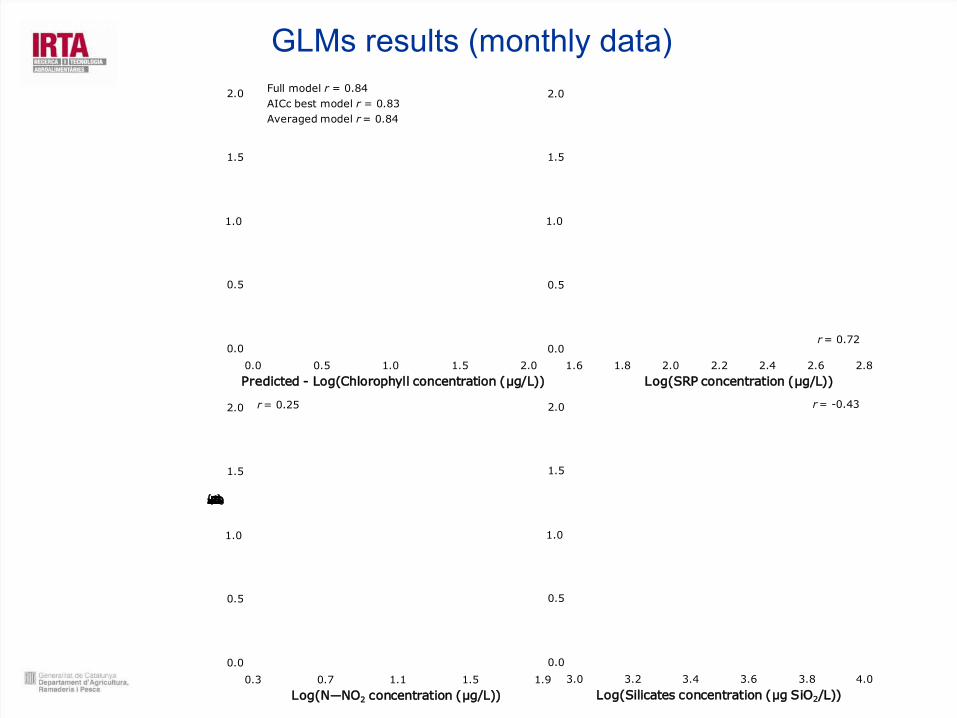
r = 0.72
Full model r = 0.84AICc best model r = 0.83Averaged model r = 0.84
0.0
0.5
1.0
1.5
2.0
2.01.51.00.50.0
Predicted - Log(Chlorophyll concentration (µg/L))
0.0
0.5
1.0
1.5
2.0
0.3
Log(N―NO2 concentration (µg/L))0.7 1.1 1.5 1.9
r = 0.25
3.0
Log(Silicates concentration (µg SiO2/L))
0.0
0.5
1.0
1.5
2.0
3.2 3.4 3.6 3.8 4.0
r = -0.43
GLMs results (monthly data)
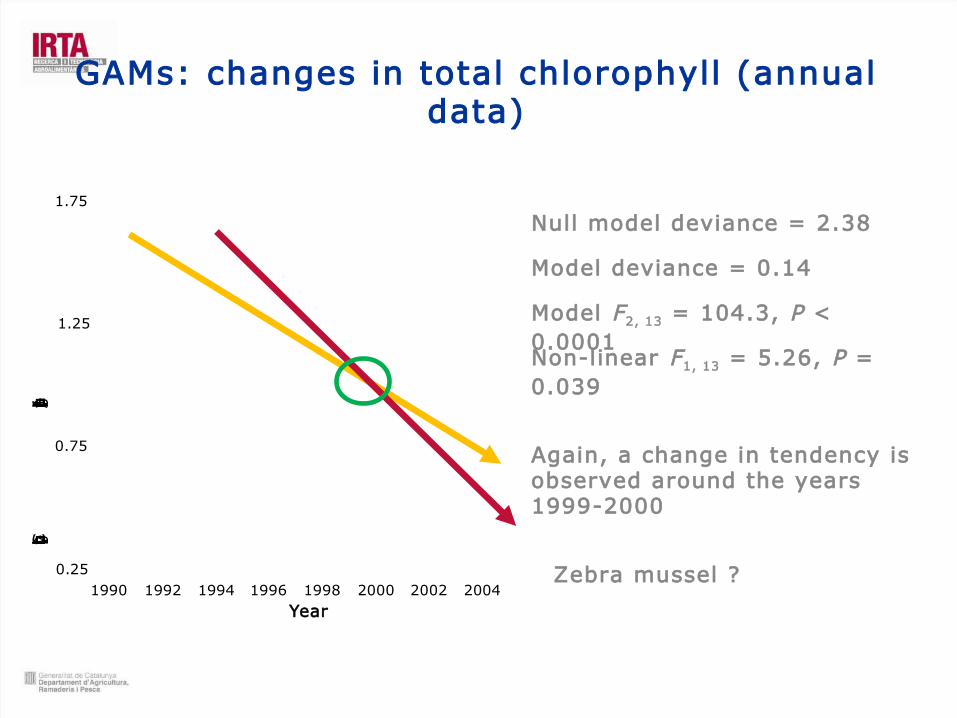
GAMs: changes in total chlorophyll (annual data)
El
Non-linear F1, 13 = 5.26, P = 0.039
Null model deviance = 2.38
Model deviance = 0.14
Model F2, 13 = 104.3, P < 0.0001
Again, a change in tendency is observed around the years 1999-2000
Zebra mussel ?0.25
0.75
1.25
1.75
Log(Chlorophyll concentration (µg/L))
1990 1992 1994 1996 1998 2000 2002 2004
Year

VariableModel mensual
(Complet) N = 29Model mensual(Pre-) N = 52
Model mensual(Post-) N = 207
Model anualN = 25
β SP Bias β SP Bias β SP Bias β SP Bias
Constante 1.792 0.150 1.360 0.260 2.889 -0.413 -3.777 2.472Periode de disminució -0.306 1.000 0.021 -0.108 0.037 -0.656Cabal promig (m
3/s) -0.141 0.460 -0.048 -0.242 0.621 -0.088 -0.255 0.419 0.333 -0.215 0.008 -2.395
SRP (µg/L) 0.719 1.000 -0.012 0.577 1.000 -0.020 0.857 0.935-0.129 0.961 0.989 0.252N–NO2 (µg/L) 0.412 1.000 -0.033 0.417 0.983 -0.040 0.388 0.722-0.117 1.629 0.485 0.019N–NO3 (µg/L) 0.252 0.342 0.074 0.355 0.395 0.095 -0.336 0.217 0.692 0.796 0.023 0.666N–NH4 (µg/L) -0.144 0.796 -0.001 -0.085 0.369 0.023 -0.463 0.903-0.025 -0.401 0.373 0.549TOC (µg C/L) 0.082 0.257 -0.113 0.152 0.268 -0.203 -0.130 0.176-0.700 1.067 0.301 2.136Silicats (mg/L SiO2) -0.523 1.000 0.025 -0.532 1.000 0.005 -0.244 0.274 0.289 -0.505 0.145 0.036TSS (mg/L) -0.029 0.255 0.475 -0.083 0.300 0.444 -0.086 0.205 0.195 0.529 0.787 -0.326Tª de l’aigua (ºC) 1.010 1.000 0.023 1.200 1.000 0.019 0.468 0.493 0.254 1.655 0.047 1.609Cond. (µS/cm 20ºC) -0.680 1.000 -0.121 -0.610 0.906 -0.099 -0.908 0.992-0.062 -1.147 0.289 -0.672Musclo zebrat (ind/m2) No seleccionat -0.047 0.330 0.276 -0.073 0.071 0.498
GLMs: response of chlorophyll to the independent variables
In the annual model SRP is the independent variable that mostly explains the change in total clorophyll; the zebra mussel is selected but his explanatory importance is ≈14 time lower that the SRP.
In the monthly model the zebra mussel is not selected (no effect on chlorphyll). SRP, NO2, SiO2, Tº and Conductivity are the most rellevant variables.

El musclo zebrat al tram final de l'Ebre i els seus impactes
0.25
0.75
1.25
1.75
Log(Chlorophyll concentration (µg/L))
Full model r = 0.99AICc best model r = 0.98Averaged model r = 0.99
1.750.25 0.75 1.25 1.6 1.8 2.0 2.2 2.4
Predicted - Log(Chlorophyll concentration (µg/L)) Log(SRP concentration (µg/L))
0.25
0.75
1.25
1.75
r = 0.93
r = 0.85 r = 0.790.25
0.75
1.25
1.75
1.2 3.5 3.7 3.9 4.1 4.3
Log(N―NO2 concentration (µg/L)) Log(Total suspended solids (µg/L))
0.25
0.75
1.25
1.75
1.3 1.4 1.5
GLMs results (annual data)

Discussion: why the Zebra mussel is not the cause of the decrese in total chlorophyll?
Density of zebra mussel is only high in some locations and in some years, but in average is low.
The volume (reservoirs) and turnover (river) of the water is high.
When the zebra mussel (or another filterer) is the main cause of phytoplancton decrease, dissolved phosphorus uses to increase, but in the Ebro it has decreased.
Phytoplancton decrease and macrophyte spreading has also occured upstream the reservoirs, where there was no Zebra mussel and Corbicula.
Dissolved phosphorus explains most of the chlorophyll variation. SRP has decreased all along the Ebro basin (90% of the monitoring stations).
Actually, it looks like the decrease in SRP has prevented a stronger invasion of the zebra mussel.
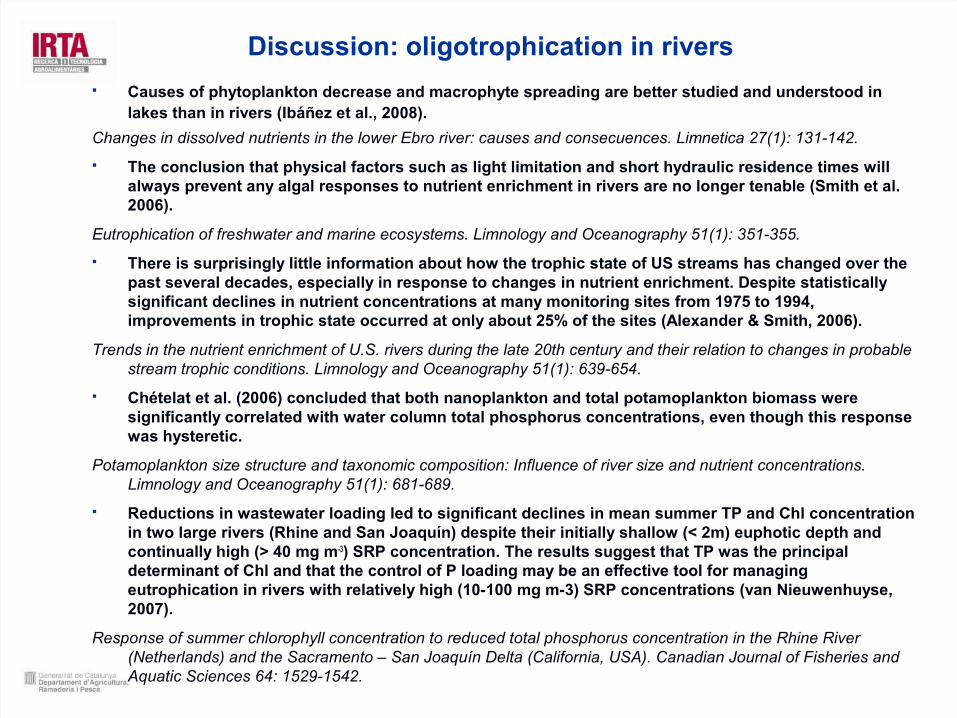
Discussion: oligotrophication in rivers
Causes of phytoplankton decrease and macrophyte spreading are better studied and understood in lakes than in rivers (Ibáñez et al., 2008).
Changes in dissolved nutrients in the lower Ebro river: causes and consecuences. Limnetica 27(1): 131-142.
The conclusion that physical factors such as light limitation and short hydraulic residence times will always prevent any algal responses to nutrient enrichment in rivers are no longer tenable (Smith et al. 2006).
Eutrophication of freshwater and marine ecosystems. Limnology and Oceanography 51(1): 351-355.
There is surprisingly little information about how the trophic state of US streams has changed over the past several decades, especially in response to changes in nutrient enrichment. Despite statistically significant declines in nutrient concentrations at many monitoring sites from 1975 to 1994, improvements in trophic state occurred at only about 25% of the sites (Alexander & Smith, 2006).
Trends in the nutrient enrichment of U.S. rivers during the late 20th century and their relation to changes in probable stream trophic conditions. Limnology and Oceanography 51(1): 639-654.
Chételat et al. (2006) concluded that both nanoplankton and total potamoplankton biomass were significantly correlated with water column total phosphorus concentrations, even though this response was hysteretic.
Potamoplankton size structure and taxonomic composition: Influence of river size and nutrient concentrations. Limnology and Oceanography 51(1): 681-689.
Reductions in wastewater loading led to significant declines in mean summer TP and Chl concentration in two large rivers (Rhine and San Joaquín) despite their initially shallow (< 2m) euphotic depth and continually high (> 40 mg m-3) SRP concentration. The results suggest that TP was the principal determinant of Chl and that the control of P loading may be an effective tool for managing eutrophication in rivers with relatively high (10-100 mg m-3) SRP concentrations (van Nieuwenhuyse, 2007).
Response of summer chlorophyll concentration to reduced total phosphorus concentration in the Rhine River (Netherlands) and the Sacramento – San Joaquín Delta (California, USA). Canadian Journal of Fisheries and Aquatic Sciences 64: 1529-1542.
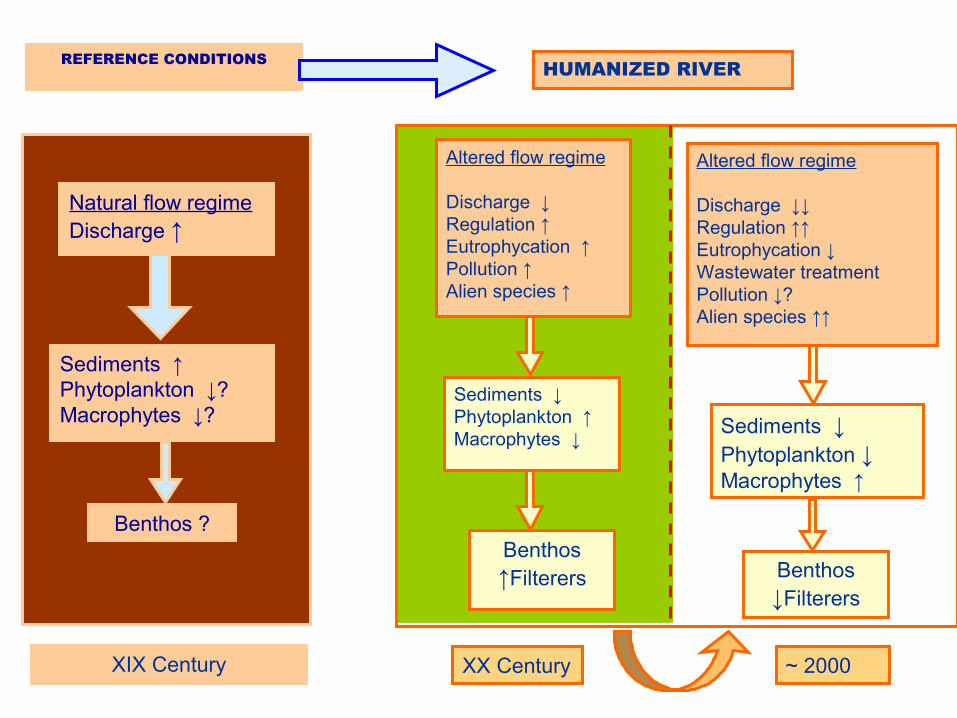
REFERENCE CONDITIONS
Natural flow regimeDischarge ↑
Sediments ↑Phytoplankton ↓?Macrophytes ↓?
Benthos ?
XIX Century
HUMANIZED RIVER
Altered flow regime
Discharge ↓Regulation ↑Eutrophycation ↑Pollution ↑Alien species ↑
Altered flow regime
Discharge ↓↓Regulation ↑↑ Eutrophycation ↓Wastewater treatmentPollution ↓?Alien species ↑↑
Sediments ↓Phytoplankton ↑Macrophytes ↓
Sediments ↓Phytoplankton ↓Macrophytes ↑
Benthos↑Filterers
XX Century ~ 2000
Benthos↓Filterers
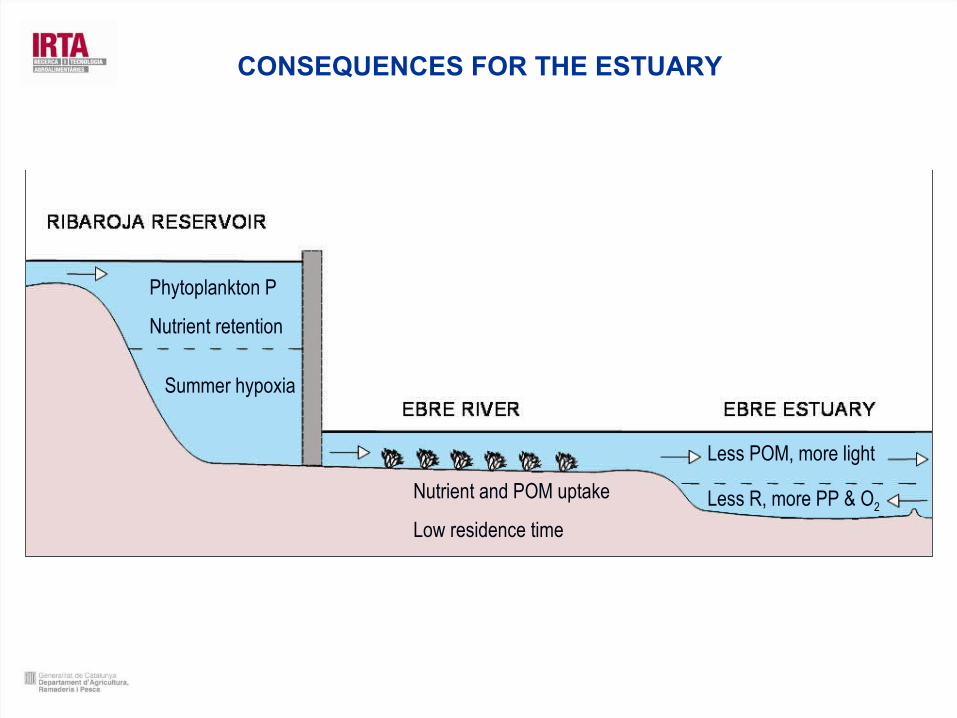
CONSEQUENCES FOR THE ESTUARY
Phytoplankton P
Nutrient retention
Summer hypoxia
Nutrient and POM uptake
Low residence time
Less POM, more light
Less R, more PP & O2

CONCLUSIONS
Recent changes in the trophic status of the lower Ebro River are basically due to a significant decrease in dissolved phosphorus. Zebra mussel plays a minor role.
This has caused a quick regime shift from a phytoplankton to a macrophyte dominated river ecosystem.
Low and regular river discharge conditions and lack of suspended sediments (after dam construction) may facilitate the colonization and spreading of macrophytes, but its possible effect was shaded by the eutrophication in the 70’s and 80’s.
Present ecosystem structure and dynamics is completely new, with local species controlling primary production (macrophytes) and alien species controlling secondary production (Zebra mussel, Corbicula, Silurus, Alburnus, etc.).
The way back to reference conditions and good ecological status is not possible without the recovery of floods and suspended sediments. However, the effects of invasive species and climate change make impossible the full recovery of original conditions.
Phosphorus reduction in the Ebro river (mostly point source) was an effective way to reduce eutrophication in the river and the estuary.
FURTHER RESEARCH
To which extent the cultural oligotrophication is unfolding in rivers worlwide and in particular in Western rivers ? What are the most common effects of this process ?
To which extent the response of rivers to nutrient changes is different from lakes ? Is different the response in large rivers and streams ?
To which extent the response of rivers to cultural oligotrophication is different between calcareous and siliceous basins ? Is it just a quantitative difference or it is qualitative one ?
To which extent the response of Mediterranean rivers is different from other river types ?
What is the relationship and feed-backs between oligotrophication, river regulation and invasive species ?. What is the effect of climate change ?
What is the expected evolution of our fluvial ecosystems under this scenario ?