c lickers in the c lassroom basic software training angie hammons educational technology...
TRANSCRIPT

CCLICKERSLICKERS IN THEIN THE C CLASSROOMLASSROOMBasic Software
Training
Angie Hammons Educational
Technology Specialist [email protected] 102B University
Center 341-6195

ObjectivesObjectives Understand how TurningPoint
integrates into Microsoft Suite Create Slides Modify slides Run a Session Save a Session

Five Steps to Success

Install Turning PointInstall Turning Point IT will install Turning Point on your
computers and on the classrooms computers. A Help Request will be entered on your
behalf, and you will be contacted for a date/time to install TP on your desktop and/or laptop
TP will be installed on the instructor station in your scheduled classroom.

TurningPoint Menu Ribbon

Step 1: Create SlidesStep 1: Create Slides
Click Insert Slide Types of Slides
Chart Slides Summary Slides for
Competitions Template Slides Special Slides
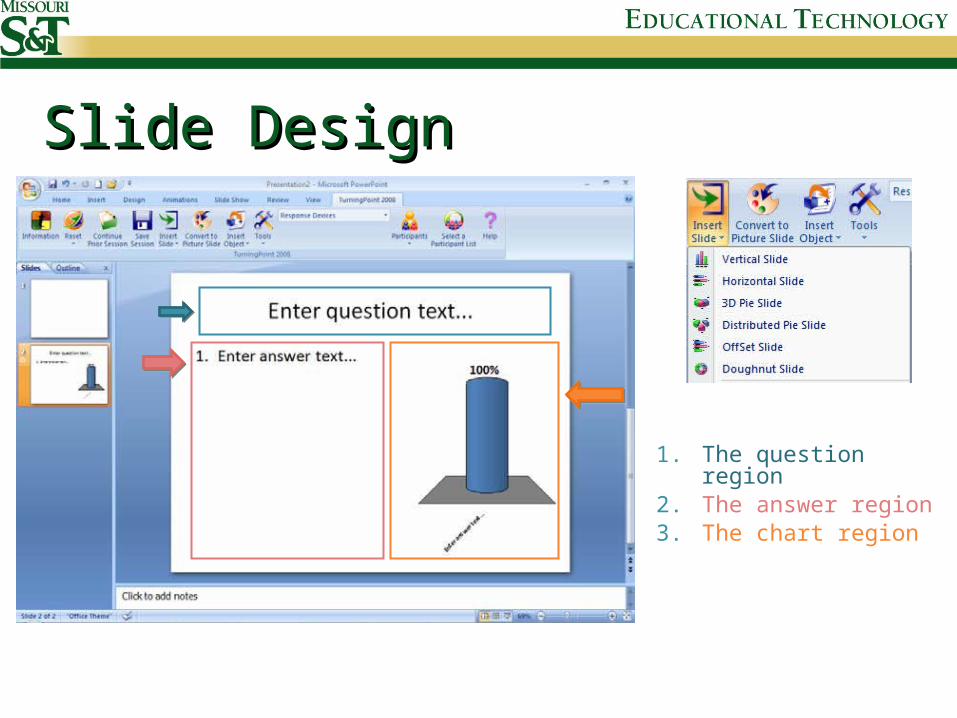
Slide DesignSlide Design
1. The question region
2. The answer region3. The chart region

Types of ChartsTypes of Charts

Convert to Picture SlideConvert to Picture Slide
1. Create a TurningPoint slide2. Insert pictures to use as answers using
the options in PowerPoint’s Insert > Picture menu
3. Resize and arrange the pictures the way you want them to appear on the slide.
4. Select the Convert to Picture Slide from the toolbar (artist’s palette).

Correct Answers and PointsCorrect Answers and Points
Place your cursor in the answer region of the slide, an Answer Value task pane will appear. Choose the answer(s) you want to give value, then choose the value from the dropdown menu.

Add ObjectsAdd Objects
The Insert Object menu gives you the ability to: Choose Charts – Change your chart type on your slide. Choose Answer Now – Add an answer now indicator to your slide. Choose Countdown – Add a countdown time to your slide. Choose Response Counter – Add a counter that will count your incoming
responses to your slide. Choose Response Table – Add a table that will illustrate individual incoming
responses. Choose Correct Answer Indicator – Demonstrate to your audience what the
correct answer was before proceeding to the next slide. Choose Stats – Add statistical data to your slide. Choose Text Message – When using vPads, to send a text message to the
audience.

Add an Answer Now IndicatorAdd an Answer Now Indicator1. Select Insert Object2. Select Answer Now
to display the submenu of Answer Now indicators.
3. Select the type of Answer Now indicator you would like to appear on the slide.

Add a Countdown IndicatorAdd a Countdown Indicator1. Select Insert Object
from the toolbar.2. Select Countdown to
display the submenu of Countdown indicators.
3. Select the type of Countdown indicator you would like to appear on the slide.

Add a Response CounterAdd a Response Counter1. Select Insert Object
from the toolbar.2. Select Response
Counter to display the submenu of Response Counters
3. Select the type of Response Counter you would like to appear on the slide.

Add a Correct Answer Add a Correct Answer IndicatorIndicator
1. Select Insert Object from the toolbar.
2. Select Correct Answer Indicator to display the submenu of Correct Answer Indicators.
3. Select the type of Correct Answer Indicator you would like to appear on the slide.

SettingsSettings
Information Presentation Slides Global Changes

Step 2: Set Up the Response Step 2: Set Up the Response DevicesDevices
RF Clicker XR Clicker

Response Device WizardResponse Device Wizard From the
TurningPoint 2008 tab make sure Response Devices is selected from the drop down menu.

Select Settings tab Check to see if a Receiver has been found Set the number of expected Devices.

Run a Polling TestRun a Polling Test From the
TurningPoint 2008 toolbar, select Tools then Settings.
Select the Polling Test tab.
Click Start Test.
Press a key on each response device to be used.
Click End Test.

Step 3: Create a Participant Step 3: Create a Participant ListList
• Select the Education Template for the new Participant List.
• Click Next.• Select the Participant List Field.
(Student Name, Student ID)• Name your Participant List and click
Finish.

Importing ListImporting List1. Click Participants2. Select Import a
Participant List3. Click File and click
Save to save the data in the Participant List before closing the Participant Information window.

Modifying a Participant ListModifying a Participant List1. From the toolbar, click
Participants and select Edit a Participant List
2. Open the desired list.3. Edit the existing data
in the white fields by selecting entries and typing new information.
4. Add a new participant by right-clicking in the Participant Information window and selecting Add Participant to Location.

Keyboard - PLKeyboard - PL You can use this feature to test your
slides. It will also give you data to try reports
with.

Step 4: Run a Presentation Step 4: Run a Presentation SessionSession1. Open Presentation2. Run the Response Device Wizard.3. From the toolbar, click Reset and click
Session.4. From the toolbar, click Select a
Particpant List. From the window on the right hand side of the screen select your list and click Use Selected List.

Run the Slide ShowRun the Slide Show

Click the mouse to control the progress of the slide show. Open Polling Click a second time to close polling and
display results. Click again to advance to the next slide
Run the Slide ShowRun the Slide Show

Step 5: Save Session ResultsStep 5: Save Session Results From the TurningPoint toolbar, select
the Save Session button. Make sure to save on YOUR S: Drive.
You can also save to removable media such as a USB flash drive.
DO NOT save results to the C: drive.

View a ReportView a Report1. Click Tools in the
toolbar.2. Select Turning
Reports.3. Select Generate
Reports.4. Choose a Session
File.

Create ReportsCreate Reports1. Select the type of
report.2. Specify whether
to include page breaks by checking the Insert Page Breaks check box.
3. Click Generate Report.

Types of ReportsTypes of Reports Results by
Questions Demographic Participant Results Results by
Participant Participant List Standards
Attendance Individual Scoring Ranking and
Moment to Moment Outline Participant
Questions and Comments

REMEMBERREMEMBER Technology can and will let you down. Please have a back up!

Additional SupportAdditional Support Angie Hammons
Education Technology Specialist 341-6195
Turning Technologies Customer Support: 1-866-746-3015 www.turningtechnologies.com
edtech.mst.edu