c m p a yo n p r e s e n t a it o n - toscana aeroporti · pisa airport catchment area by nbr. of...
TRANSCRIPT

P R E S E N T A IT O N
O NC M P A Y
SAT Società Aeroporto Toscano Galileo Galilei S.p.A
Small Cap Conference 2013 November 21st, 2013

Pisa International Airport
2 - FY2012 results
Index
3 – 9M2013 results and FY2013 Outlook
4 - People Mover and SAT Real Estate Strategy
1 - SAT Highlights
2
5 - Q & A

Pisa International Airport
1 – SAT Highlights
3

Pisa International Airport
CAGR PISA AIRPORT 2000/2012: +11,3%
PISA INTERNAL AIRPORT PASSENGER TRAFFIC (millions)
3,01
2,332,031,98
1,651,38
1,25
2000 2001 2002 2003 2004 2005 2006
3,73
2007
3,96
2008 2009
4,02 4,07
2010 2011
4,53
� SAT, on the basis of a 40 years concession signed in 2006, manages the “Galileo Galilei” Pisa InternationalAirport, the main one in Tuscany.
� With 4.5 million passengers in 2012, the Galilei airport is the sixth regional airport in Italy.� Outperforming growth: Pisa Airport passenger traffic CAGR 2000-2012, equal to 11.3%, is almost 3 times
higher than the Italian Airport System one (+3.9).
SAT Highlights
4
4,50
2012
CAGR ITALIAN AIRPORT SYSTEM 2000/2012: +3,9%
1995: Entry of privateshareholders
1998: SAT opens to low-costcarriers: first Ryanair flightfrom Pisa
December 2006:40-year Concession
Agreement
1980:SAT starts operating
’80s ‘90s
October 2005: openingof a Ryanair base inPisa.
Summer 1997Airlines: 4 (only IATA)
Destinations: 10
June 2007:Launch of Pisa-NYC
direct flight.
2005 2006 2007
July 2007: listing on Italian Stock Exchange
2009
August 2009:Sign of ENAC-SAT
Regulated Tariff Contract..
Summer 2013Airlines: 15
Destinations: 77
20132008
4

Pisa International Airport
*Data Source: Assaeroporti
ITALIAN REGIONAL AIRPORTin 2012 by international traffic (pax/000)**
Venice
Pisa
6,345
3,155
Bologna 4,176
Naples 2,814
(**) Excluding Roma and Milan airport systems
Pisa International Airport ranks 3rd
in the Italian Airports International pax traffic ranking
10
THE 6TH ITALIAN REGIONAL AIRPORT 2012 (pax/000)
9
8
7
6
5
4
3
2
1 8,2 (-4.6%)
6,2 (-8.1%)
5,9 (+1.2%)
4,6 (-7.7%)
5,8 (+0.6%)
4,5 (-0.7%)
3,5 (-5.1%)
3,2 (-5.5%)
3,6 (-2.9%)
3,8 (+ 1.5%)
36,7 (-0.5%)
414,8 (-2.3%)Rome (system)
Milan (system)
Venice
Catania
Naples
Palermo
Bologna
Pisa
Cagliari
Verona
Turin
Bari
146,9 (-1.3%)Total Italian Airoports:
Pisa International Airport ranks 6th in the Italian regional airports ranking.
(+) Rome (System): Rome Fiumicino and Rome Ciampino Milan System: Milan Linate, Milan Malpensa and Bergamo Orio al Serio
5
SAT Highlights

Pisa International Airport
SAT highlights
Despite difficult economic scenario, in 2012 SAT reported passenger traffic results in line with 2011 (record year) and the highest annual profit in
company history
CAGR 2000/2011: +12,4% CAGR 2000/2012: +10,8%
2012/2011+45,4%
Net Profit (€ mil.)
CAGR 2000/2012: +13,4%CAGR 2000/2012: +11,3%
Pax Traffic (€ mil.)
CAGR ITALY 2000/2012: +3,9%
6

Pisa International Airport
7
Exceptionally resilient business model� The transport demand is normally related to GDP, then sensitive to crisis scenario like theone we are currently facing.
� The traffic results achieved by Pisa Airport over the latest years – despite the difficulteconomic background – confirm the correlation with the company’s strategic choices ratherthan with the GDP’s trend.
SAT Highlights
CAGR 2007/2013SAT +3,8%
CAGR 2007/2013IT. AIRPORTS +1,5%
CAGR 2007/2013ITALY GDP -1,4%

Pisa International Airport
� 4,5 milioni passengers (2012)
� 15.000 daily visitors
� 2.400 staff (500 SAT)
� Cargo terminal: 6,300 smq
� 1 cargo scheduled airline (Fedex)
� Passenger terminal:
20,700 mq
� 15 passengers scheduled airlines
(2013)
� Apron: 170.000 mq
� 21 parking stands
� 2 runways
� Pisa Airport railway station
(People Mover by 2015)
� 5 on-airport car parks
� Over 3,100 car parking spaces
� Car rental Terminal
� 10 leading rental car companies
� Over 1,500 parking spaces
� 3rd in Italy in terms of rented cars
� 100 sub-concessionary
companies
� 27 shops
� 12 food & beverage
8
Pisa International Airport at a glance

Pisa International Airport
9
SAT HighlightsOPERATING REVENUES (€/mln) EBITDA (€/mln)
EQUITY (€/mln)
CAGR +6,22% CAGR +14,44%
CAGR +26,88%
NET FINANCIAL DEBT (€/000)
PASSENGERS (mln)
CAGR +3,80%
NET PROFIT (€/mln)
debt/equity 2012: 0,12

Pisa International Airport
Aviation Development Strategies
10

Pisa International Airport
Pisa Airport Catchment Area by nbr. of inhabitants*
Lucca
Livorno
SienaArezzo
*Source: 2009 ISTAT data, elaborated by GIS System
PratoPistoia
La Spezia
MassaCarrara
Tuscany: nbr. of inhabitants: 3.707.818
Nbr. of inhabitants by distance from Pisa Airport:
less than 30’
815.992 nbr. of inhabitants
less than 60’
2.598.717 nbr. of inhabitants
less than 120’
5.444.247 nbr. of inhabitants
Grosseto
less than 1 hour from the airport for “short-haul” flights
less than 2 hours from the airport for “medium and long-haul” flights reaching Genoa and Bologna provinces
11

Pisa International Airport
12
� The “reverse marketing” strategy implemented by SAT hasthe objective of increasing the number of Europeanpassengers travelling to Pisa Airport (“incoming traffic”)and not only the number of passengers departing from itscatchment area (“outgoing traffic”).
Domestic Traffic 53%
InternationalTraffic 47%
“Europe at the mouth of Arno”
BREAKDOWN OF TRAFFIC BY DESTINATION
1997 2012
International Traffic 70%
Domestic Traffic 30%
We keep Tuscany’s profile high in the world
Pisa International Airport. Sharing Tuscany’s style
Pisa Airport gateway to Tuscany
� Strategic partnerships with airlines in order to developtraffic by promoting Pisa Airport and Tuscany in theairlines’ markets.
AIRLINESTRAFFIC BUILDING
� SAT carried out marketing activities jointly with variousairlines in order to attract more traffic to Pisa
� Minimum levels of passengers, flights and destinations for acertain number of years agreed by SAT and partner airlines
CO-MARKETING AND CONSULTING AGREEMENTS
“Reverse Marketing” Strategy

Pisa International Airport
Summer 2013 : scheduled pax destinations15 operating carriers:
2 home base carriers
1 intercontinental carrier
4 other “hub” carriers
8 other “point-to point” carriers
77 destinations (10 domestic / 67 international)
21 markets served with direct scheduled flights
420 weekly freq./around 60 flightsx day
21 markets served with direct scheduled flights:
� Albania� Belgium � Czech Republic� Denmark� France� Germany� Greece� Hungary� Ireland� Italy� Malta� Netherlands� Norway� Poland� Romania� Spain� Sweden� United Kingdom
� Morocco� Russian Federation� Unites States
7 new destinations
13

Pisa International Airport
Markets’ broad diversification (*)
Country 1998 2008 2009 2010 2011 2012
Total passengers traffic 1.122.794 3.963.717 4.018.662 4.067.012 4.526.723 4.494.915
United Kingdom 295.749 1.006.486 918.087 839.578 855.334 906.817
Spain 10.609 377.316 326.158 493.885 601.758 489.281
France 39.671 329.776 342.223 318.002 385.927 389.319
Germany 48.346 410.585 398.707 329.623 313.184 272.751
Netherlands - 178.294 192.853 169.777 176.016 179.642
Belgium - 136.873 138.533 134.626 144.248 141.622
Scandinavian countries - 122.651 127.819 150.491 135.447 142.209
Albania 41.545 43.344 55.227 95.126 94.948
Romania 26.488 30.332 67.078 85.106 71.086
Morocco 18.213 59.891 63.270 59.519
Greece 13.196 35.894 67.365
Ireland - 86.146 79.642 54.840 57.960 52.922
U.S.A. - 67.256 59.238 48.418 33.448 21.549
Italy 534.174 937.665 1.089.645 1.058.388 1.291.577 1.316.020
* Scheduled O/D flights only 14

Pisa International Airport
Liverpool
Glasgow PIK
Dublino
Madrid
Palermo
Edimburgo
Leeds
Trapani
Alghero
Malta
Billund
East Midlands
Barcellona GRO
Valencia
����
Lamezia T.
Marsiglia
Constanta
Bournemouth
Bruxelles CRL
Maastricht
Dusseldorf NRN
Londra STN
Parigi BVA
Oslo TRF
Fuerteventura Fez
Cracovia
Stoccolma (Skavsta)
Francoforte HHN
Gotheborg
Budapest
Bari
Brindisi
Eindhoven
Cagliari
Tenerife
Gran Canaria
Cefalonia
RodiChiania
Kos
Targu Mures
Haugesund
Norimberga
Varsavia
Network at PSA
7 based aircrafts
Network 2013:50 destinations
17 markets served
Marrakech
Ibiza
15
Lipsia
Amburgo LBC
Siviglia
= 2013 new destinations
Partnership, renewed in 2013, runs until
December 31st, 2018

Pisa International Airport
16
AirOne/Alitalia Network PSA - 2013
2013: one AB 320 -165/180- seats
AirOne’s aircraft based at Galilei
AirportCatania
Praga
OlbiaTirana
Palma di Maiorca
Seasonal Routes
Mosca
San Pietroburgo
New Destinations
Roma
8 destinations

Pisa International Airport
17
Non Aviation Development Strategies

Pisa International Airport
Description 2002 2003 2004 2005 2006 2007 2008 2009 2010 2011 2012
Passengers(Nbr)
1.654.570 1.982.897 2.031.890 2.334.843 3.014.656 3.725.770 3.963.717 4.018.662 4.067.012 4.547.197 4.494.915
Total N.A.revenues (€uro)
4.820.134 5.839.175 6.198.729 7.172.941 10.055.584 13.156.412 14.405.159 15.511.477 15.801.548 15.766.141 16.720.344
4.820.1345.839.175 6.198.729
7.172.941
10.055.584
13.156.412
14.405.15915.511.477
16.720.34415.766.14115.801.548
-1.000.0002.000.0003.000.0004.000.0005.000.0006.000.0007.000.0008.000.0009.000.000
10.000.00011.000.00012.000.00013.000.00014.000.00015.000.00016.000.00017.000.00018.000.00019.000.00020.000.00021.000.00022.000.000
2002 2003 2004 2005 2006 2007 2008 2009 2010 2011 2012
Commercial Non Aviation revenues. Passengers
Commercial Non Aviation Revenues (*): trend 2003 -2013
(*) “Non Aviation” business activities relatedto: Parking, Advertising, Retail, Food, CarRental, Real Estate Sub-concession and otherkind of subconcession.
*
Non Aviation Development Strategies
Year 2002 2012 ∆∆∆∆12/02%
Revenues (€) 4.820.134 16.720.344 247 %
Passengers 1.654.570 4.494.915 172 %
F

Pisa International Airport
SAT manages all existing landside and airside commercial activities inside Galilei Airport premises through sub-concession granted by
third parties and/or direct management.
• Catering (bars, restaurants)
• Retail
• Car rental
• Car wash
• Tenant Sub-concessions
• Petrol station
• Vip Lounge
• Others
• P1 “West” Car Park
• P2 “Multilevel” Car Park
• P3 “Short-stay” Car Park
• P4 ” East – Long-term” Car Park
•Advertising
• Business Centre
• Welcome desk
• Newsagent (Landside)
Commercial activities
Direct managementSub-concession
Commercial activities
19

Pisa International Airport
20
Galilei Airport is the main gateway to Tuscany and, as such, represents the first and last“taste” of the Region, promoting products, as well as its artistic and cultural contents,actually its style of life.
Galilei Airport, a showcase for Tuscany
Non Aviation Development Strategies - Food & Retail
Type/Area 2011 2012 2013
Retail Landside 14 17 18
Retail Airside 9 8 9
Food 11 12 12
Total 34 37 39

Pisa International Airport
3 – SAT 9M2013 results and FY2013 Outlook
21

Pisa International Airport
22222222222222(*) Rome System: Rome Fiumicino and Rome Ciampino, Milan System: Milan Linate, Milan Malpensa and Bergamo Orio al Serio.
Data Source: Assaeroporti
N. Airport Pax %
Rome (System) 31.534.659 -2,2
Milan (System) 27.661.113 -3,1
1 Venice 6.645.416 4,3
2 Catania 5.000.530 -1,5
3 Bologna 4.787.946 3,6
4 Naples 4.238.022 -7,5
5 Pisa 3.555.439 -1,5
6 Palermo 3.410.298 -6,8
7 Cagliari 2.873.141 -0,4
8 Bari 2.776.664 -5,7
9 Turin 2.409.068 -11,5
10 Verona 2.295.000 -15,3
11 Olbia 1.786.936 6,3
12 Lamezia T. 1.730.197 -1,0
13 Treviso 1.692.113 -7,6
14 Brindisi 1.555.378 -5,6
15 Firenze 1.545.369 6,4
TOTAL ITALIAN AIRPORT SYSTEM
112.397.902 -2,7
Italian Airports – January-September pax traffic 2013 (*)
Airports with over 5 mln pax per year Airports with 3-4 mln pax per yearAirport System Airports with 1-2 mln pax per year

23232323
Pisa airport pax traffic figures
Passenger traffic % compared to 30th Sept. 2007
PISA AIRPORT CONSTANTLY OVERPERFORMED THE MARKET

24
In 2013 (Jan-Sept) Pisa International Airport ranks, for the first time in its history, 9th in the overall Italian Airports ranking by pax traffic (*)
(*) Data source: Assaeroporti
N. Airport Passengers
1 Rome FCO 28.029.300
2 Milan MXP 13.861.670
3 Milan LIN 6.917.544
4 Bergamo 6.881.899
5 Venice 6.645.416
6 Catania 5.000.530
7 Bologna 4.787.946
8 Naples 4.238.022
9 Pisa 3.555.439
10 Rome CIA 3.505.359
11 Palermo 3.410.298
12 Cagliari 2.873.141
13 Bari 2.776.664
14 Turin 2.409.068
15 Verona 2.295.000
Italian Airports – Passenger traffic1st January - 30th September 2013
Italian Airports – January-September pax traffic 2013

Revenues
25
TOTAL REVENUES (€ mln)
-5,4%
OPERATING REVENUES (€ mln)SERVICES CONSTRUCTION
REVENUES (€ mln)
CAGR 2010/2012: +5,72% CAGR 2010/2012: -45,30%
-39,1%
-3,5%

Operating revenuesAVIATION OPERATING REVENUES
(€ mln)
NON AVIATION OPERATING REVENUES (€mln)
26
CAGR 2010/2012: +6,39%
-3,1%-3,7%
CAGR 2010/2012: +4,12%

10,08,8
3,0 2,71,7
0
2
4
6
8
10
12
2010 2011 2012 9M2012 9M2013
48,150,9 51,4
39,4 39,9
0
10
20
30
40
50
2010 2011 2012 9M2012 9M2013
Expenses
27
SERVICES CONSTRUCTION EXPENSES (€ mln)
TOTAL EXPENSES (€ mln)
OPERATING EXPENSES (€ mln)
-39,1%
-1,3%
+1,4%

6,8
8,59,1
0
2
4
6
8
10
2010 2011 2012
12,6
14,616,0
0
4
8
12
16
20
2010 2011 2012
Key financialsEBITDA (€ mln)
28
% Revenues
18,6%15,9%
10,9
6,1
-22,2%
13,3
-18,4%
9M2012 9M2013
% Revenues
EBIT (€ mln)
9M2012 9M2013
2,9
-45,4%5,3%
1,6
-27,3%
5,9
8,8%
17,8%
22,7%
19,6%
CAGR 2010/2012: +12,86%
CAGR 2010/2012: +15,75%
9,7%
11,4%13,0%
1H2012 1H2013
4,824,0%
20,7%
1H2012 1H2013
8,1
14,7% 11,3%

3,5
4,4
6,4
0
2
4
6
2010 2011 2012
6,5
7,88,4
0
2
4
6
8
10
2010 2011 2012
Key financialsPBT (€ mln)
29
% Revenues
7,7%
2,5
1,3-50,2%
7,6
-28,8%
9M2012 9M2013
% Revenues
9M2012 9M2013
1,5
-56,6%2,1%
0,63-37,5% 2,7
4,4%
9,2%
11,9%
10,5%
CAGR 2010/2012: +13,55%
CAGR 2010/2012: +34,6%
5,0% 5,9%
9,0%
NET INCOME (€ mln)
1H2012 1H2013
13,7%
4,2%
10,3%
5,4
1H2012 1H2013
4,3
7,8%
5,1%

30
Total assets
Total liabilities
Total liabilities and equity
Net Financial Debt
130.460
63.730
125.872
7.669
125.872
67.460
130.460
10.167
Equity 62.14363.000
30 sept 2013(€/000) 31 dec 2012
Balance Sheet
∆∆∆∆
4.588
3.730
858
4.588
2.498

31
9M2012(€/000) 2011
Net Financial Position
∆∆∆∆NET FINANCIAL POSITION 30.09.2013 31.12.2012 ∆ 30.09.2012∆ vs
30.09.2012
Cash and cash equivalents 7.033 10.748 (3.715) 6.500 533
Current bank loans 0 0 0 0 0
Current net financial position (a) 7.033 10.748 (3.715) 6.500 533
Non-Current bank loans (17.200) (18.416) (1.217) (18.410) 1.210
Non-Current net financial position (b)
(17.200) (18.416) (1.217) (18.410) 1.210
Net financial position (a+b) (10.167) (7.669) (2.498) (11.911) 1.744
Euro/000
SAT financial strength confirmed by the Debt to Equity ratio = 0,16

32
NWC
Fixed Assets
Net invested capital
Total Shareholders’ Equity
(8.860)
98.089
69.811
62.143
(13.224)
98.511
73.167
63.000
Non-current liabilities (15.054)(16.483)
30 sept 2013(€/000) 31 dec 2012
Balance Sheet
∆∆∆∆
4.364
421
(1.429)
3.356
858
Net debt 7.66910.167 2.498

Pisa International Airport
33
Pisa International Airport - Pax traffic 2013
A marked recovery of passenger traffic trend during the year.
2013 – Pisa Galilei Airport passenger traffic figures
Pax nr.
In the absence of "Wind Jet disruption”, as at oct 31st
2013, passenger traffic at Galilei airport would have
grown by 2,1%.
YOY ∆∆∆∆% 2013/2012

Pisa International Airport
34
4 –People Mover and SAT Real Estate Strategy

Pisa International Airport
3535
Length: approx. 1,40 km.
People Mover track: Overhead arrival to the Terminal
People Mover ground level route.
Pisa Airport railway station.
12
4
1
Control room and mantainance
Parking modal interchange.
2
Pisa Main Railway Station.
3
4
3 Length: approx. 0,44 km.People Mover overhead route.
People Mover

Pisa International Airport
36
3 MAIN EFFECTS
1. Improve rail accessibility from/to Florence and from/to Central Italy(Pisa is the second railway station in Tuscany in terms of passengers andconnections)
2. Exploit a valuable area to be used as City Gate (with a serviceplatform open to passengers and inhabitants similar to the SchipholPlaza but with a regional airport size)
People Mover
Target: to replace the rail connection between Pisa Airport and PisaMain Railway Station with a fully automated shuttle service.
3. Revaluation of SAT’s real estate properties.

Pisa International Airport
37
Pisa Airport
Pisa Airport Railway Station
“Shipyard”
Modal interchange parkings
To Leghorn’s port via «Navicelli»
channel
Pisa Central Railway Station
Modal interchange railway station
People Mover
37
Pisa International Airport
38
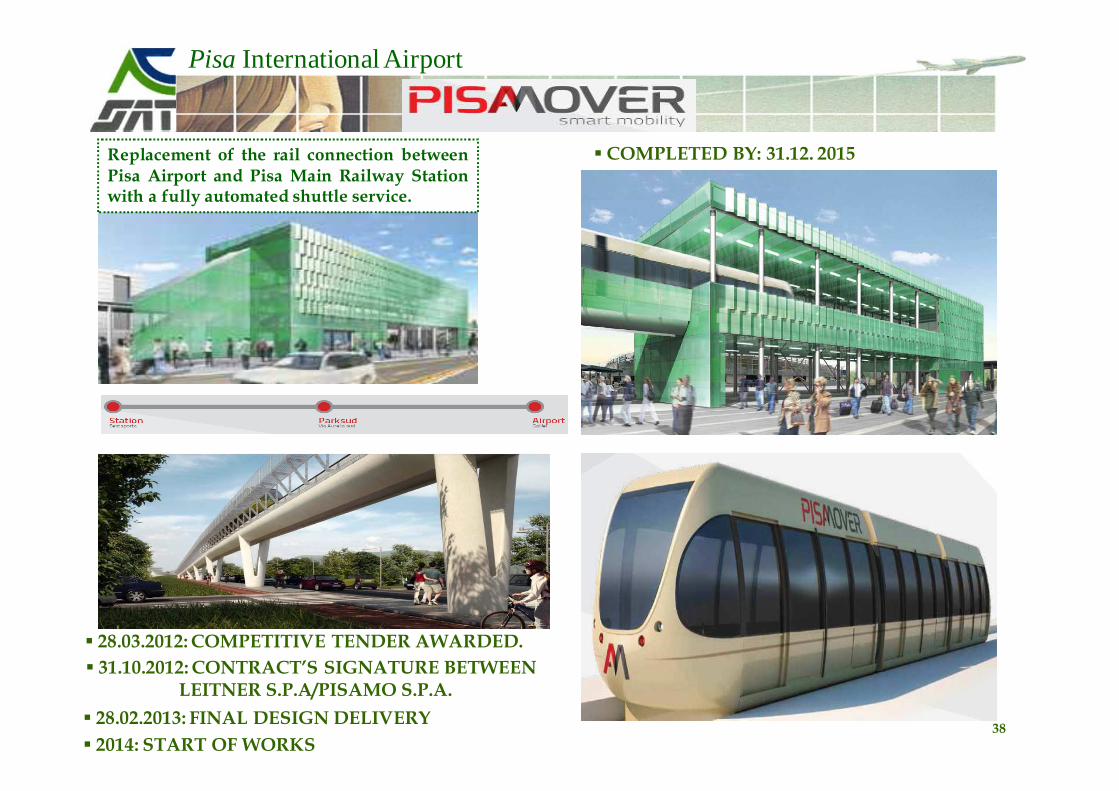
� 28.03.2012: COMPETITIVE TENDER AWARDED. � 31.10.2012: CONTRACT’S SIGNATURE BETWEEN
LEITNER S.P.A/PISAMO S.P.A.
� 28.02.2013: FINAL DESIGN DELIVERY
� 2014: START OF WORKS
� COMPLETED BY: 31.12. 2015Replacement of the rail connection betweenPisa Airport and Pisa Main Railway Stationwith a fully automated shuttle service.

Pisa International Airport
People MoverESTIMATED COSTS: estimated costs are about 69 millions euro, 27,8 of which provided by Tuscany Region throughEU funds. The remaining amount will be covered by the awarding company, which will carry it out through a «projectfinancing» and run it for at least 40 years. In particular, the Public Private Partnership form is a contract DBFO (Design,Build, Finance and Operate) that is based on the juridicial institution of the concession to build and operate and whichprovides project financing.
SAT’S ROLE: on the basis of an Agreement Programme (*) which does not include any financial commitment for theCompany, SAT is committed to make available all properties involved by the project, in order to allow itsimplementation as per agreed schedule. SAT has also signed an agreement with the Municipality of Pisa and PisaMo,providing its own staff for the project development.
(*) Agreement by which the parties involved coordinate their activities for the realization of the work.
EXECUTING COMPANY: PisaMo S.p.A.(controlled by the Municipality of Pisa).
28th March 2012: AWARD NOTICE. On 28th March 2012 it was awarded the competitive tender by Pisamo SpA to leavethe design, making and management of the People Mover. Contractor: Leitner S.p.A. in temporary joint venture withSocietà Italiana per Condotte d’Acqua SpA, Inso SpA and Agudio S.p.A..
CONSTRUCTION KICK OFF: 2014 - END OF WORKS: BY 31st DECEMBER , 2015
October 31st, 2012: the contract between PisaMo S.p.A. and Leitner S.p.A. has been signed.
February 28th, 2013: FINAL DESIGN WORK DELIVERY
39
June 18th, 2013: EU Commissioner for Regional Policy (Johannes Hahn) signed the green light to financing to bedevoted to People Mover.
December 15th, 2013: suspension of the rail link between the Airport and Pisa main train station and contemporary beginning of the bus service replacement.

Pisa International Airport
People mover:Railway station-airport
Shipyards area
Interchange parking
Functional recovery and conversion areas
Pisa International
Airport
Cittadella Aeroportuale
about 80.000 mq. of SAT property area
Full effectiveness of the zoning variance by December 31st, 2013 40
Real Estate Strategies

Pisa International Airport
� Traffic building strategy (reverse marketing) based on the cultural and historical appealof the Region Tuscany.
� Exceptionally resilient business model: growth despite economic crisis and recentextraordinary events
� The Regulated Charges ensuring solid basis of revenues for the future airportdevelopment.
� Strong partnerships with airlines (e.g. partnership with Ryanair recently renewed and inplace until 2018).
� A runway system (2 runways) able to accommodate all types of aircraft, ensuringbusiness continuity.
� Non Aviation revenues allowing Reverse Marketing initiatives.
� People Mover (“The airport inside the railway station/The railway station inside theairport”)
� Opportunity to develop collateral airport related business activities as service platformopen to passengers and inhabitants – “City Gate”
Investment case
41

Pisa International Airport
5 - Q & A
42

Pisa International Airport
SAT Shareholders
�On July 23rd, 2013 Region of Tuscany (16,90%), Province of Pisa (9,27%), Province of Leghorn (0,34%), Province ofFlorence (0,20%), Province of Lucca (0,10%), Municipality of Pisa (8,45%), Municipality of Leghorn (0,27%),Municipality of Florence (0,70%), Florence Chamber of Commerce (1,42%), Leghorn Chamber of Commerce(0,31%), Pisa Chamber of Commerce (7,87%) and Pisa Foundation (8,62%) have drawn up a three-year lastingshareholders’ aggreement (54,45%).
�On September 12th, 2011, Finatan S.p.A., Fada S.p.A and Savimag S.r.l. ( 23,39% as a whole) have drawn up a three-year lasting shareholders’ agreement.
* Direct shareholder. Declaring subject: Lami Maria

Pisa International Airport
CONTACTS
Gabriele Paoli Investor & Media Relations Manager
Ph. +39 050 849 240
SAT - SOCIETÀ AEROPORTO TOSCANO
G. GALILEI - S.P.A.
Market MTA
ISIN IT0000214293
Price (20/11/2013) € 10,75
1M performance +3,46%
6M performance +11,28%
1Y performance +24,06%
SAT: 1Y performance (as at 20th november 2013)
Stock data & performances
44
SAT: +24,06%FTSE MIB: +22,34%

Pisa International Airport
45
This document has been prepared by SAT – Società Aeroporto Toscano Galileo Galilei – S.p.A. solely for informationpurposes and for use in presentations of the Company. The information contained herein has not been independentlyverified. No representation or warranty, express or implied, is made as to, and no reliance should be placed on, thefairness, accuracy, completeness or correctness of the information or opinions contained herein. None of the company,its affiliates, or its representatives shall have any liability whatsoever (in negligence or otherwise) for any losshowsoever arising from any use of this document or its contents or otherwise arising in connection with thisdocument.This document includes forward-looking statements. These forward-looking statements express current expectationsand projections about future events, involve predictions and are subject to a number of factors that may influence theaccuracy of the statements and the projections upon which the statements are based.Prospective investors are cautioned not to place undue reliance on these forward-looking statements because theyinvolve known and unknown risks, uncertainties and other factors which are, in many cases, beyond our control.In light of these risks, uncertainties, and assumptions, the forward-looking events discussed in this document mightnot occur and no assurance can be given that the anticipated results will be achieved.Actual events or results may differ materially as a results of risks and uncertainties facing SAT – Società AeroportoToscano – S.p.A.. Such risks and uncertainties include, but are not limited to increased competition and regulatory,legislative and judicial developments that could cause actual results to vary materially from future results indicated,expressed or implied in such forwardlooking statements.Moreover, any statements regarding past trends or activities should not be taken as a representation that such trendsor activities will continue in the future.This document does not constitute an offer or invitation to purchase or subscribe for any shares and no part of it shallform the basis of or be relied upon in connection with any contract or commitment whatsoever.The executive responsible for the drafting of the company’s accounting and corporate documents, Marco Forte, herebydeclares pursuant to clause 2, art.154 bis, decree law 58/1998, that the accounting information in this release is in linewith the Company’s accounting records and registers.
Disclaimer

P R E S E N T A IT O N
O NC M P A Y
SAT Società Aeroporto Toscano Galileo Galilei S.p.A
Small Cap Conference 2013 Milan November 21st, 2013