c o v e r s h e e t · i n t e r n a t i o n a l container termin al services, inc. and subsidia...
TRANSCRIPT

*SGVFS033016*
C O V E R S H E E Tfor
AUDITED FINANCIAL STATEMENTS
SEC Registration Number
1 4 7 2 1 2
C O M P A N Y N A M E
I N T E R N A T I O N A L C O N T A I N E R T E R M I N
A L S E R V I C E S , I N C . A N D S U B S I D I A
R I E S
PRINCIPAL OFFICE ( No. / Street / Barangay / City / Town / Province )
I C T S I A D M I N I S T R A T I O N B U I L D I N G ,
M A N I L A I N T E R N A T I O N A L C O N T A I N E R
T E R M I N A L S O U T H A C C E S S R O A D , M A
N I L A
Form Type Department requiring the report Secondary License Type, If Applicable
1 7 - A C R M D N / A
C O M P A N Y I N F O R M A T I O N
Company’s Email Address Company’s Telephone Number Mobile Number
[email protected] 245-4101 09285031362
No. of Stockholders Annual Meeting (Month / Day) Fiscal Year (Month / Day)
1,383 04/11 12/31
CONTACT PERSON INFORMATION
The designated contact person MUST be an Officer of the Corporation
Name of Contact Person Email Address Telephone Number/s Mobile Number
Jose Joel M. Sebastian [email protected] 247-8053 09209744633
CONTACT PERSON’s ADDRESS
3F ICTSI Administration Building, Manila International Container Terminal South Access Road,Manila
NOTE 1 : In case of death, resignation or cessation of office of the officer designated as contact person, such incident shall be reported to the Commission withinthirty (30) calendar days from the occurrence thereof with information and complete contact details of the new contact person designated.
2 : All Boxes must be properly and completely filled-up. Failure to do so shall cause the delay in updating the corporation’s records with the Commissionand/or non-receipt of Notice of Deficiencies. Further, non-receipt of Notice of Deficiencies shall not excuse the corporation from liability for its deficiencies.

SECURITIES AND EXCHANGE COMMISSION
SEC FORM 17-A
ANNUAL REPORT PURSUANT TO SECTION 17 OF THE SECURITIES REGULATIONCODE AND SECTION 141 OF THE CORPORATION CODE OF THE PHILIPPINES
1. For the fiscal year ended DECEMBER 31, 2018
2. SEC Identification No: 147212
3. BIR Tax Identification No.: 000-323-228
4. Exact name of issuer as specified in its charter:INTERNATIONAL CONTAINER TERMINAL SERVICES, INC.
5. Province, Country or other jurisdiction of incorporation: Philippines
6. Industry Classification Code: __________(SEC Use Only)
7. Address of principal office: ICTSI Administration Building, MICT South Access Road,Manila Postal Code: 1012
8. Issuer's telephone number, including area code: (632) 245-4101
9. Former name, former address, and former fiscal year, if changed since last report: Not applicable
10. Securities registered pursuant to Sections 8 and 12 of the SRC, or Sec. 4 and 8 of the RevisedSecurities Act:
Title of Each ClassNumber of Shares of Common Stock
Outstanding as of March 5, 2019
Common Stock 2,011,573,443
Amount of consolidated debt outstanding as of December 31, 2018: US$1,307.1 million
11. Common Stocks are listed in the Philippine Stock Exchange.

12. Check whether the Issuer:
(a) has filed all reports required to be filed by Section 17 of the SRC and SRC Rule 17 thereunderand Sections 26 and 141 of The Corporation Code of the Philippines during the preceding 12months (or for such shorter period that the registrant was required to file such reports);
Yes [ x ] No [ ]
(b) has been subject to such filing for the past 90 days.Yes [ x ] No [ ]
13. The aggregate market value as of March 5, 2019 of the voting stock held by non-affiliates is aboutP=229.2 billion (US$4.4 billion), based on average price of ICTSI common shares as ofMarch 5, 2019.

SEC FORM 17-A
TABLE OF CONTENTS
PART I – BUSINESS AND GENERAL INFORMATION............................................................. 1Item 1. Business .............................................................................................................................. 1Item 2. Properties .......................................................................................................................... 20Item 3. Legal Proceedings............................................................................................................. 29Item 4. Submission of Matters to a Vote of Security Holders ...................................................... 32
PART II – SECURITIES OF THE REGISTRANT.......................................................................33Item 5. Market for Issuer’s Common Equity and Related Stockholder Matters ........................... 33
PART III – FINANCIAL INFORMATION ...............................................................................36Item 6. Management’s Discussion and Analysis or Plan of Operations ....................................... 36Item 7. Consolidated Financial Statements ................................................................................... 66Item 8. Changes in and Disagreements with Accountants of Accounting
and Financial Disclosure ................................................................................................... 66
PART IV – MANAGEMENT AND CERTAIN SECURITY HOLDERS...........................................67Item 9. Directors and Executive Officers...................................................................................... 67Item 10. Executive Compensation .................................................................................................. 81Item 11. Security Ownership of Certain Beneficial Owners and Management .............................. 82Item 12. Certain Relationships and Related Transactions............................................................... 84
PART V – CORPORATE GOVERNANCE ..............................................................................86Item 13. Corporate Governance ...................................................................................................... 86
PART VI – EXHIBITS AND SCHEDULES ...............................................................................87Item 14. Reports on SEC Form 17-C .............................................................................................. 87
SIGNATURES ...................................................................................................................88
INDEX TO CONSOLIDATED FINANCIAL STATEMENTS AND SUPPLEMENTARY SCHEDULES..89

PART I – BUSINESS AND GENERAL INFORMATION
Item 1. Business
1.1 Business Development
International Container Terminal Services, Inc. (“ICTSI” or, “the Company” or, “the ParentCompany”) was incorporated on December 24, 1987 in connection with the public bidding to operate,manage and develop the Manila International Container Terminal (MICT), which handles internationalcontainer cargo at the Port of Manila.
In May 1988, the Philippine Ports Authority (PPA) awarded to ICTSI a concession to be the exclusiveoperator of MICT for a period of 25 years. ICTSI started operating MICT on June 12, 1988. OnMarch 23, 1992, ICTSI’s common shares were listed with the Philippine Stock Exchange following theinitial public offering of its shares at an issue price of P=6.70 per share.
ICTSI’s concession contract for MICT (MICT Contract) was extended for another 25 years up toMay 18, 2038, upon completion of agreed additional investments in port equipment and infrastructures,payment of upfront fees amounting to P=670.0 million (US$16.4 million), and turnover and execution ofDeed of Transfer of port facilities and equipment used at MICT and part of committed investmentunder the original concession agreement, among others. Under the renewal agreement and for theextended term of the MICT Contract, ICTSI shall be liable and committed to: (i) pay the PPA a fixedfee of US$600.0 million payable in 100 advanced quarterly installments; (ii) pay annual fixed fee onstorage and berthside operations of P=55.8 million (approximately US$1.3 million); (iii) pay variable feeof 20 percent of the gross revenue earned at MICT and 30 percent of annual gross storage revenuesfrom international cargo operations in excess of P=273.0 million, among others; (iv) upgrade, expandand develop the MICT, particularly the construction and development of Berth 7; (v) continuously alignits Management Information System (MIS) with the MIS of the PPA with the objective towardspaperless transaction and reporting system; and (vi) pay certain other fees based on the attainment ofagreed volume levels.
On May 14, 2008, the Board of Investments (BOI) approved the registration of ICTSI’sconstruction of Berth 6 of MICT as “New Operator of Port Infrastructure (Berth 6)” on a Pioneerstatus under the Omnibus Investments Code of 1987. Berth 6 was completed and inaugurated inJuly 2012. From November 2011, Berth 6 is entitled, among others, to an income tax holiday for aperiod of six years.
On July 2, 2015, the Board of Investments (BOI) approved the registration of ICTSI’s constructionof Berth 7 of the MICT as “Expanding Operator of Container Yard” on a Non-Pioneer status underthe Omnibus Investment Code of 1987. Berth 7 is entitled to an income tax holiday of three yearsstarting from July 2017.
The Company has built upon the experience gained in rehabilitating, developing and operating MICT toestablish an extensive international network concentrated in emerging economies. For the last threeyears, ICTSI and subsidiaries (collectively referred to as “the Group”) have expanded its network ofterminals as follows:
On January 23, 2014, the Company, through its subsidiary ICTSI Cooperatief U.A. (ICTSICooperatief), forged a business partnership with La Societe de Gestion Immobiliere Lengo(SIMOBILE) for the establishment and formation of a joint venture company, ICTSI DR Congo(IDRC). IDRC, which was then 60 percent-owned by ICTSI Cooperatief, will build a new terminalalong the river bank of the Congo River in Matadi and manage, develop and operate the same as acontainer terminal, as well as provide exclusive container handling services and general cargo servicestherein. On May 19, 2015, ICTSI, through its subsidiary, ICTSI Cooperatief, and its joint venturepartner, SIMOBILE, transferred their respective 8% and 2% ownership interest in IDRC to SocieteCommerciale Des Transports Et Des Ports S.A. (SCTP SA) in exchange for the latter’s contribution of

2
technical knowledge, skills and substantial experience in the port and port system in DR Congo andoperation of railroad system and undertaking to facilitate the activities of IDRC and to assist in itsrelations with the public authorities. SIMOBILE transferred to its subsidiary, La Societed’Investissement et de Placement (SIP) Sprl, its 10% ownership in IDRC. Thereafter, IDRC is owned52% by ICTSI, 28% by SIMOBILE, 10% by SIP Sprl and 10% by SCTP SA. Phase 1 of the facilityconsists of two berths that can handle 175,000 twenty-foot equivalent units (TEUs) and 350,000 metrictons. The capacity and berth length can, subject to demand, be doubled in Phase 2. Phase 1 wascompleted in the fourth quarter of 2016. Initial operations started in the third quarter of 2016 whilecommercial operations started in January 2017.
On April 10, 2014, ICTSI, through its wholly owned subsidiary ICTSI (M.E.) DMCC [formerly ICTSI(M.E.) JLT] (ICTSI Dubai), and General Company for Ports of Iraq (GCPI) signed the Contract for theConstruction and Operation of Three New Quays and Management and Operation of Quay No. 20(“Contract”) in the Port of Umm Qasr (“Port”) in Iraq. The Contract grants ICTSI the rights to:(a) manage and operate the existing container facility at Berth 20 of the Port for a period of 10 years,(b) build, under a build-operate-transfer (BOT) scheme, a new container and general cargo terminal inthe Port for a concession period of 26 years, and (c) provide container and general cargo terminalservices in both components. On March 1, 2016, an addendum to the Contract (“Addendum”) wassigned by the parties granting ICTSI, through ICTSI Dubai, the right to manage and operate anadditional existing Quay No. 19 for a total of 13 years, with the first three years for the completion ofrehabilitation works. Also, the Addendum extended the original term for the management and operationof Quay No. 20 from 10 to 13 years. On March 26, 2017, a second addendum to the Contract (“SecondAddendum”) was signed by the parties granting ICTSI, through ICTSI Dubai, the right to manage andoperate Quay No. 21 co-terminus with the Contact and the First Addendum. The Second Addendumextended the term for the management and operation of Quay No. 19 and 20 from 13 to 21 years. ICTSIcommenced trial operations at Berth 20 in September 2014 and full-fledged commercial operations inNovember 2014. ICTSI commenced commercial operations of Berth 19 in June 2016. Berth 21 startedcommercial operations in the third quarter of 2018 while rehabilitation works are on-going. Phase 1 ofthe expansion project (Berth 27) under the BOT scheme has 250 meters of berth with an estimatedcapacity of 300,000 TEUs. The facility will have 600 meters of quay with an estimated capacity of900,000 TEUs. Berth 27 was completed and fully operational in the first quarter of 2017.On October 22, 2017, ICTSI signed an agreement with GCPI for the Phase 2 of expansion developmentof the Port. The Phase 2 expansion project will involve development of two new berths, Berths 25 and26, including a 20-hectare yard area. This expansion will increase the Port’s container handlingcapacity by 600,000 TEUs to 1,200,000 TEUs and its capability to handle large container vessels of upto 10,000 TEUs. The development of this phase of the expansion project is on-going and is expected tobe completed in the third quarter of 2019.
On May 2, 2014, ICTSI, through its subsidiary in Australia, Victoria International Container TerminalLtd. (VICT), signed a contract in Melbourne with Port of Melbourne Corporation (“POMC”) for thedesign, construction, commissioning, operation, maintaining and financing of the Webb DockContainer Terminal (Terminal) and Empty Container Park (ECP) at Webb Dock East (WDE) in thePort of Melbourne. Initially, VICT was 90% owned by ICTSI through ICTSI Far East Pte. Ltd. (IFEL),a wholly owned subsidiary, and 10% by Anglo Ports Pty Limited (“Anglo Ports”). On February 4,2015, IFEL acquired the 10% non-controlling interest from Anglo Ports and became 100% owner ofVICT. On January 7, 2016, IFEL’s ownership interest in VICT was transferred to another subsidiary,ICTSI Oceania B.V. (IOBV), making IOBV the new 100% owner of VICT. The Contract grants VICTthe rights to: (a) design, build and commission the new Terminal at berths WDE 4 and WDE 5,(b) design, build and commission the new ECP at WDE, and (c) operate the Terminal and ECP untilJune 30, 2040. Phase 1 of the Terminal and ECP with capacities of 350,000 TEUs and 250,000 TEUs,respectively, commenced commercial operations in the second quarter of 2017, Phase 2 of the Terminalcommenced commercial operations in the first quarter of 2018 and has increased the capacity to1,000,000 TEUs.

3
On May 27, 2015, ICTSI, through its subsidiary, ICTSI Tuxpan B.V., acquired from Grupo TMMS.A.B and Immobiliaria TMM S.A. de C.V 100% of the capital stock of Terminal Maritima de Tuxpan,S.A de C.V (TMT) for US$54.5 million. TMT is a company duly incorporated in accordance with thelaws of Mexico with a concession to construct and operate a maritime container terminal in the Port ofTuxpan, Mexico and is the owner of the real estate where the maritime container terminal will beconstructed. The concession agreement is valid until May 25, 2021, subject to extension for another 20years. The concession covers an area of 29,109.68 square meters, which is adjacent to the 43 hectaresof land owned by TMT. Under the concession agreement, TMT is liable and committed to:(1) pay fixed fee of MXN23.24 plus VAT, per square meter of assigned area, in twelve equal monthlyinstallments; and (2) pay minimum guaranteed fee starting January 2018 ranging fromMXN145.33 (US$9.51) per TEU to MXN340.60 (US$22.29) per TEU for containerized cargo andMXN3.37 (US$0.22) per ton to MXN5.62 (US$0.37) per ton for general cargo, based on agreedminimum volume. As of March 5, 2019, management is currently working on a development plan onTMT.
On May 21, 2009, ICTSI, through New Muara Container Terminal Services Sdn Bhd (NMCTS),entered into an Agreement with the Government of Brunei Darussalam for the operation andmaintenance of the Muara Container Terminal in Brunei Darussalam. The Agreement was valid for aperiod of four years from commencement date or May 22, 2009. The term was extendible for a periodof one year at a time, for a maximum of two years subject to the mutual agreement of the parties.Since 2012, the Agreement had been extended yearly for a period of one year or until May 20, 2017 asan interim operator. However, as part of the Government's ongoing overall restructuring, state-ownedenterprise Darusalam Assets Sdn Bhd will take over the Muara Container Terminal operations from theBrunei Ports Department effective February 21, 2017. The future plans for Muara Container Terminalcontemplate its integration with the development of a Special Economic Zone, which is not ICTSI’score competency and will require huge investments on the part of NMCTS. As part of ICTSI's efforts atrationalising its portfolio to achieve the best possible sources of long term growth and return for itsshareholders, ICTSI, through NMCTS, is no longer interested in signing a new contract with the state-owned enterprise Darusalam Assets Sdn Bhd. Thus, the Agreement was pre-terminated effectiveFebruary 21, 2017.
In October 2016, the Board of ICTSI Ltd. has authorized the management of ICTSI Oregon, Inc.(ICTSI Oregon) to negotiate with the Port of Portland and reach terms mutually acceptable to bothparties with respect to the termination of the lease agreement after two major customers, HanjinShipping Co. and Hapag-Lloyd stopped calling the Port of Portland in March 2015 due to continuinglabor disruptions. During the latter part of 2016, the Port of Portland and ICTSI Oregon begandiscussions of a mutual agreement to terminate the lease agreement. As of December 31, 2016, theCompany provided for the amount of probable loss on the pre-termination of the lease agreement basedon the Group’s best estimate of the probable outcome of the negotiations with the Port of Portland. Theestimated amount of probable loss from the pre-termination of the lease agreement charged to the 2016consolidated statement of income was US$23.4 million, which includes the carrying value of thecontainer handling equipment and spare parts.
On March 8, 2017, ICTSI, through ICTSI Oregon, and the Port of Portland signed a Lease TerminationAgreement and both parties have mutually agreed to terminate the 25-year Lease Agreement to operatethe container facility at Terminal 6 of the Port of Portland with an effective date of March 31, 2017.The Lease Termination Agreement allowed ICTSI Oregon to be relieved of its long-term leaseobligations. In exchange, the Port of Portland received US$11.45 million in cash compensation onMarch 29, 2017 and container handling equipment including spare parts and tools on March 31, 2017.As a result of the Lease Termination Agreement, ICTSI Oregon is no longer engaged in containeroperations at Terminal 6 or at any other locations. ICTSI Oregon’s activities are currently devoted tosupporting the on-going legal proceedings.
On April 21, 2017, ICTSI, through its wholly-owned subsidiary, Cavite Gateway Terminal (CGT), inpartnership with the Philippine Department of Transportation, project launched the country’s firstcontainer roll-on roll-off barge terminal in Tanza, Cavite. CGT will facilitate off-the-roads seaborn

4
transport of containers between Port of Manila and Cavite and service industrial locators in Cavite area.CGT’s barge terminal will have an annual capacity of 115,000 TEUs, which is equivalent to 140,000fewer truck trips on city roads each year. The terminal was formally inaugurated and commencedcommercial operations on November 22, 2018.
On August 10, 2012, ICTSI, through its wholly-owned subsidiary, Lekki International ContainerTerminal Services LFTZ Enterprise (LICTSLE), and Lekki Port LFTZ Enterprise (Lekki Port, theConcessionaire) signed the Sub-concession Agreement (Agreement) that grants LICTSLE, as a sub-concessionaire, an exclusive right to develop and operate, and to provide handling equipment andcontainer terminal services at the container terminal within Lekki Port located at Ibeju Lekki, LagosState, Federal Republic of Nigeria for a period of 21 years. On May 17, 2017, ICTSI and Lekki Portmutually agreed to terminate the Agreement subject to a payment by Lekki Port of an agreed amount.On May 23, 2017, ICTSI received the agreed amounts of US$12.5 million representing the return ofpayments made to Lekki Port pursuant to the Agreement, and US$7.5 million representingcompensation of costs incurred by ICTSI in relation to the project which was recognized as “Otherincome” in the 2017 consolidated statement of income. The termination of the Agreement was finalizedand deemed effective on May 24, 2017.
In September 2017, ICTSI received a notification from PNG Ports Corporation Limited (PNGPCL), aPapua New Guinea (PNG) state-owned enterprise, of the confirmation by the Independent Consumerand Competition Commission in PNG with respect to the two 25-year agreements signed by ICTSI’sPNG subsidiaries, Motukea International Terminal Limited (MITL) and South Pacific InternationalContainer Terminal Limited (SPICTL), with PNGPCL for the operation, management and developmentof the two international ports in Motukea and Lae in PNG. SPICTL and MITL were allowed byPNGPCL to take over the port facilities and begin operations at the Port of Lae in February 2018 and atthe Port of Motukea in May 2018, respectively. The terminal operating agreements and other relatedcontracts took effect on June 1, 2018 after all the parties have complied with the agreed conditionsprecedent.
On September 21, 2017, the BOD of ICTSI granted the authority to acquire shares in Manila NorthHarbour Port, Inc. (MNHPI). On the same date, ICTSI signed a Share Purchase Agreement (SPA) withPetron Corporation for the acquisition of 10,449,000 MNHPI shares, representing 34.83% of the totalissued and outstanding shares of MNHPI for a consideration of Php1.75 billion (US$33.8 million). Thecompletion of the SPA was subject to several conditions, one of which was the approval of theacquisition by the Philippine Ports Authority which was obtained on October 20, 2017. The SPA wascompleted on October 30, 2017. An additional investment cost of Php2.45 billion (US$47.3 million)was incurred in relation to this acquisition. On September 5, 2018, ICTSI has signed an SPA withHarbour Centre Port Terminal, Inc. (HCPTI) for the acquisition of 4,550,000 shares in MNHPI fromHCPTI. The subject shares represent 15.17% of the total issued and outstanding shares of MNHPI. Thetotal consideration is Php910.0 million (US$16.8 million). As of March 5, 2019, the completion of theSPA remains subject to a number of conditions precedent. Upon completion of this transaction, ICTSI'sshareholdings in MNHPI will increase from 34.83% to 50%. An additional investment cost will beincurred in relation to this acquisition.
On November 2, 2017, PT ICTSI Jasa Prima Tbk (IJP), an ICTSI subsidiary in Indonesia, signed aConditional Share Purchase Agreement with PT Samudera Terminal Indonesia (STI) for the purchaseof IJP’s interest in PT Perusahaan Bongkar Muat Olah Jasa Anda (OJA), subject to certain conditions.As of March 5, 2019, the conditions precedent have not yet been fulfilled.

5
On January 3, 2019, ICTSI, through its wholly-owned subsidiary ICTSI Middle East DMCC, signed aConcession Agreement with the Sea Ports Corporation of Sudan (SPC) to operate, manage and developthe South Port Container Terminal (SPCT) at Port Sudan, Republic of the Sudan for 20 years. The portof Port Sudan is the only major modern port in the country and serves as the international gateway formore than 95% of Sudan’s cargo flows. In February 2019, ICTSI established Africa Gateway Terminal(AGT), a Sudanese entity, to operate the container terminal. The Group is currently working with SPCfor the handover preparations and is expecting to take over the container terminal in the first half of2019.
1.2 Business of Issuer
Overview
ICTSI is an international operator of common user container terminals serving the global containershipping industry whose principal business includes the operation, management, development andacquisition of container terminals focusing on facilities with total annual throughputs ranging from50,000 TEUs to 3,000,000 TEUs. The primary mechanism for the operation of these terminals is long-term concession agreements with local port authorities and governments through ICTSI and itssubsidiaries. As at March 5, 2019, the Group is involved in 32 terminal concessions and portdevelopment projects in 19 countries worldwide. There are 30 operating terminals in nine key ports,including the acquisition of shares of stock in Manila North Harbour Port, Inc. (MNHPI) in 2018, abarge terminal and an inland container terminal in the Philippines, two each in Indonesia and in PapuaNew Guinea (PNG), one each in China, Ecuador, Brazil, Poland, Georgia, Madagascar, Croatia,Pakistan, Mexico, Honduras, Iraq, Argentina, Colombia, Democratic Republic (DR) of Congo, andAustralia; an existing concession to construct and operate a port in Tuxpan, Mexico; and the recentlysigned concession in Sudan. In 2016, 2017 and 2018, the Group handled consolidated throughput of8,689,363 TEUs, 9,153,458 TEUs, and 9,736,621 TEUs, respectively.
The Group provides different services in each of the port operated based on the nature of business andindustry of the country of operations and the general needs of customers including shipping lines, cargoowners and port users. The Group primarily handles international containerized cargoes, which includecargoes shipped in containers for international import or export. The Group’s customer base mainlyincludes shipping lines and cargo owners. The Group also provides a number of ancillary services suchas storage, container stripping and stuffing, inspection, weighing and services for refrigeratedcontainers or reefers, as well as roll-on/roll-off and anchorage services to non-containerized cargoes orgeneral cargoes on a limited basis.
These services fall into three general categories:
On-vessel. This refers to all work performed on board a ship. This includes the loading and unloadingof cargoes, rigging gears, opening and closing hatches, securing cargo stored on board and shiftingcargo to and from vessels;
Off-vessel. This refers to the services involved in moving containers from container yards to the gate.This includes the receiving, handling, checking and delivery of containers over piers, wharves, transitsheds, warehouses and open storage areas and the transfer of containers from the tail of a consignee’stransportation unit; and
Other Services. At some terminals, maintenance services to ships that are docked in the harbor forwhich the port operator receives berthing and harbor fees from shipping lines are provided. ICTSI alsooffers ancillary services relating to its core services, such as container and truck weighing, use of reeferoutlets to provide power to refrigerated containers and extended storage.
The fee structure for the Group’s services varies across the terminals it operates based upon localregulations and practices. In some terminals, such as MICT, the Company charges shipping lines fees

6
for on-vessel charges and charges cargo owners separately for off-vessel services. The Philippine PortAuthority (PPA) sets different tariffs for on-vessel and off-vessel services. In other jurisdictions, theGroup charges only the shipping lines or the cargo owners who have separate arrangements amongthemselves. ICTSI mostly charges cargo owners on a cash-on-delivery basis. Containers are notallowed to leave the port facility until actual cash payment has been made and confirmed received.Shipping lines may be granted credit lines of up to 30 days.
For the three years ended December 31, 2016, 2017 and 2018, the percentage contribution of foreignoperations or operations outside the Republic of the Philippines to revenues from cargo handlingservices and net income attributable to equity holders of the parent are as follows:
2016 2017 2018Gross revenues 60.6% 64.1% 63.2%Net income attributable to
equity holders of the parent*44.8% 42.6% 65.4%
* 2016 amount includes loss on pre-termination of lease agreement in IOI of US$23.4 million.
Competition
The Group’s primary competitors are other international port operators, including financial investors,shipping lines and domestic concerns that operate terminals or that provide alternate routes for shippinglines that would otherwise utilize the Group’s terminals.
Asia
Currently, South Harbor is MICT’s only competitor in the international marine container servicemarket in Manila. The PPA authorized Asian Terminals, Inc. (ATI) to provide fully integrated cargohandling services at the South Harbor from March 1992 to May 2013. It was granted a 25-yearextension from May 2013. The PPA’s tariffs are applied uniformly to both MICT and the SouthHarbor. MICT has an estimated market share of 67% of the container traffic in Manila. OtherPhilippine terminals either dominate the market or do not have any direct competitor in their immediatearea of operations.
After the Company’s acquisition of 51% of YICT and divestment of its holdings in YRDICTL inJuly 2014, higher yielding international container cargo in the Port of Yantai has been handledexclusively by YICT. Domestic cargo has been handled exclusively by YRDICTL.
The Port of Karachi is one of South Asia’s largest and busiest deep-water seaports, handlingapproximately 65% of Pakistan’s container traffic. The port currently has three terminals: ICTSI’sPICT, Karachi International Container Terminal (KICT) and South Asia Pakistan Terminals (SAPT), ofwhich both KICT and SAPT are operated by Hutchison Port Holdings. Also on the other side of the cityof Karachi is Qasim International Container Terminal (QICT), operated by Dubai Ports World at PortQasim, which handles approximately 36% of the country’s container traffic. The Company believesthat PICT captured approximately 19% in 2018, with QICT, KICT and SAPT handling 36%, 23% and22%, respectively of container traffic.
VICT, being the new player in the Melbourne container market, is facing competition from establishedterminal operators, DP World and Patrick Terminals. VICT is continuing to ramp up volume as theycontinue to negotiate for new shipping line services contracts. VICT captured 10% of the containervolume in Melbourne in 2018.
MITL and SPICTL, the two terminals in PNG, do not have competitors in Motukea and Lae.

7
Americas
The Group has seven terminals in the Americas: Tecon Suape, SA (TSSA); Contecon Guayaquil, SA(CGSA); Tecplata, SA (Tecplata); Sociedad Puerto Industrial Aguadulce, S.A. (SPIA); ConteconManzanillo, SA (CMSA); Operadora Portuaria Centroamericana, SA (OPC) and Terminal Maritima deTuxpan, S.A de C.V (TMT). All of the terminals in the Americas are operational except for TMT asmanagement is currently working on its development plan. Tecplata is ready to operate and is yet toservice its first international shipping line.
OPC, on the other hand, dominates the Honduras market and a good portion of the El Salvador,Nicaragua and Guatemala markets. OPC faces limited competition from Puerto Castilla due to thecompetitor’s small capacity. OPC has captured 82% of the container market in 2018.
The Manzanillo market, where CMSA operates, is currently dominated by SSA de Mexico, S.A. deC.V with 53% market share. CMSA’s entry in the market is designed to address the congestion at thecompeting terminals and the competitor’s inability to further expand their capacity to absorb thegrowing demand. CMSA has an estimated 31% market share in 2018.
CGSA operates the port of Guayaquil, which serves as Ecuador’s main international trading gateway.The port is connected to the main terrestrial highways of Ecuador and has good access to otherprincipal cities in the country. The Port of Guayaquil is currently experiencing higher level ofcompetition with capacity expansion of Terminal Portuario Guayaquil (TPG), operated by the Chileancompany SAAM. CGSA’s market share in 2018 was 43% of the traffic at the port.
TSSA faces limited local competition operating the Port of Suape as the nearest local ports are at least800 kilometers away following the cessation of regular container handling activities of the port atRecife in 2004. TSSA has a market share of 100% and 40% of the container traffic at Pernambuco andNortheast region of Brazil, respectively.
Europe, Middle East and Africa (EMEA)
The Group has six operating terminals in the EMEA region: Baltic Container Terminal (BCT);Madagascar International Container Terminal, Ltd. (MICTSL); Batumi International ContainerTerminal (BICTL); Adriatic Gateway Container Terminal (AGCT); ICTSI Iraq; and IDRC. Comparedwith other operating terminals in the region, BCT, BICTL and AGCT face stiffer competition. The stiffcompetition faced by BCT comes from Deepwater Container Terminal (DCT) in Gdansk, which hasmade efforts in 2011 to strengthen its efficiency by adding new equipment and has alreadycommissioned the second berth in December 2016. BCT’s market share in 2018 is estimated to be at15% of the container traffic in Poland. BICTL is facing competition from its main competitor, Poti SeaPort. BICTL captured 20% of the market in 2018. AGCT is experiencing stiff competition as well fromthe ports of Koper and Trieste. In 2018, AGCT captured 12% of the market. In contrast, MICTSL isdominating the Madagascar container market and practically has no competition. ICTSI Iraq hasestablished itself as Iraq’s leading terminal by capturing 40% of the container volume in 2018 after justfour years of operations. IDRC handled 63% of the container volume in the Democratic Republic ofCongo in 2018.

8
Key Competitive Strengths
Despite the presence of competition where ICTSI and subsidiaries operate, the Group has identified thefollowing as its key competitive strengths:
Globally diversified revenue base
ICTSI owns or operates ports in 19 countries across three geographic regions namely: Asia, theAmericas, and EMEA. This geographical scoping reduces the concentration of ICTSI’s business in anyparticular country, region or industry. In 2018, Asia accounted for 53.8% of throughput and 50.1% ofconsolidated gross revenues from port operations, the Americas accounted for 30.1% of throughput and29.4% of consolidated gross revenues from port operations, and EMEA accounted for 16.1% ofthroughput and 20.5% of consolidated gross revenues from port operations. Moreover, port facilities invarious terminals serve a number of different shipping lines, which reduces reliance on any oneparticular customer. There is no single dominating customer, and no customer has contributed to morethan 10% of the Group’s consolidated gross revenues in 2016, 2017 and 2018.
Leading market positions in key targeted markets
The Group’s major terminals enjoy leading positions in their respective geographic markets. Inaddition, most of its major terminals are strategically located in emerging markets with strong growthand profit potentials, including Asia, EMEA and Americas. The Company’s terminals mainly serve asend-destination ports for discrete markets and cargo cachement areas. The Company believes that itsstrong market position in the regions where it operates allows it to enhance operating efficiencies andmaximize throughput, which increases profitability. The Company owns or operates the largestcontainer terminals in terms of volume throughput and capacity in the Philippines, Ecuador, theBrazilian state of Pernambuco, Madagascar, Yantai in China, Honduras, Iraq, DR Congo and morerecently, in Papua New Guinea. At these terminals, there are limited opportunities for competitionfrom other port operators, other ports or other terminals within the same ports due to high barriers toentry. Some of these barriers include the limited number of port sites, government controls and highterminal construction costs. This means that there are few substitutes for the Company’s services,which allows it to maintain significant pricing power contributing to strong margins. The Company hastargeted its acquisitions at port concessions that are privatized from government control. Many of theseports are in emerging markets, which generally exhibit stronger growth than developed markets; thusthe Company believes that its leading position in these markets will allow it to directly capture organicgrowth in line with the economic growth of these markets. Furthermore, all of the Company’sconcession agreements are long-term agreements that ensure continued benefits from long-term GDPgrowth trends.
Experienced and dynamic management team
The Group’s management team has extensive experience in the container terminal and containershipping sectors. Management structure is decentralized with extensive authority delegated to theregional operating units where management teams are closest to their customers and have the mostcomprehensive knowledge for the regulatory, labor and other key operating conditions prevailing intheir respective jurisdictions. The decentralized structure also allows a lean and flat management team,which reduces administrative costs. Meanwhile, senior management at the corporate level focuses onproviding overall strategy, direction and oversight as well as managing key global functions such asinformation technology, engineering and finance. The Group has strong financial controls over eachoperating entity through standardized monthly reporting, annual budget process, regular financial andoperating audits, control over external sourcing of funds and capital, insurance coverage and riskmanagement.

9
Established track record of improving operational efficiency and performance
The Group has also made substantial investments in terminal facilities to enhance handling capacityand operating efficiency, modernizing information technology systems and expanding andrehabilitating civil works. The Group also provides its know-how through enhanced training andimproved work processes to streamline labor practices, and rationalize commercial strategies to boostyield per TEU. The Group has received commendations and recognitions for its success in improvingcargo handling and assisting in the development of private sector. The Group has been cited by theWorld Bank for its success in public-private partnerships in South America, Africa and Europe.
Strong and stable cash flows and strong capital structure
The Group believes that its major terminals provide stable cash flows because of its globally diversifiedoperations and long-term concession agreements, which have a capacity-weighted average remainingterm of approximately 18 years. In addition, the Group’s terminals focus on end-destination cargo,which accounts for substantially all of the Group’s consolidated throughput volume. The Groupbelieves that its focus on end-destination cargo limits concentration risk to individual containershipping lines in that if a shipping line that calls at one of its terminals ceases to operate, the cargointended for that particular destination will simply transfer to another shipping line that is still calling inthat terminal. As of December 31, 2018, the Company’s total indebtedness was US$1,307.1 millionand its total indebtedness to total equity ratio (interest-bearing debt over total equity, as shown in theconsolidated balance sheet) was 0.59 times, providing head room for future financial leverage. TheCompany believes that its cash flows and debt structure will provide it with a solid platform to pursueinvestment opportunities, supported by its active balance sheet management strategies and liabilitymanagement initiatives which have helped streamline its debt maturity profile and interest paymentschedules significantly.
Demonstrated ability to control operating costs
Lastly, the Group has continuously demonstrated its ability to control operating costs effectively, whichallows the Group to generate profitable margins in both weak and strong economic environments. Costcontainment measures are continuously enforced all throughout the Group. These programmes mayinclude cost reductions, equipment upgrades, and projects to improve labour efficiencies and processes.As an example, the Company recently implemented its Terminal Appointment Booking System(TABS), which helps to improve capacity and operational efficiency in its terminals. Improvements tothe labor pool also come from knowledge and experience sharing across ports. The Company also plansto expand the handling capacity of its ports as needed, such as the construction of new yard facilities atthe MICT.
Principal Suppliers
The Group is neither dependent on a single nor a few suppliers, of which the loss of any or more wouldhave a material adverse effect on its operations, nor has existing major supply contracts.
Customers
Consistent with the high degree of concentration in the global shipping industry, major containershipping lines contribute significantly to the Group’s business and revenues. However, ICTSI’sbusiness, primarily serving domestic markets as oppose to transshipment business, is as such notdependent on a single or a few customers, of which the loss of any or more would have a materialadverse effect on the Group’s operations taken as a whole (In a the domestic market the departure of aspecific shipping line or consortium will not automatically result in loss of volumes to the Gate-wayterminal operator since cargo volumes then shift to another shipping line or consortium). Although theGroup provides services to many of its customers at two or more of its terminals, each entity negotiatescontracts independently at each port and generally does not entertain any bulk rebates. The Groupconducts selected marketing and sales activities with its shipping line customers in each terminal andhas established a global commercial department to support the business units and regions, ensuring that
10
the Group can take advantage of a shipping line’s global presence. The Group maintains TerminalService as well as Service Level Agreements with a number of shipping lines specifying service andperformance standards. The Company will continue to maintain high-level relationships with a numberof its clients, as it believes that this engagement is necessary to anticipate changes in a dynamicshipping industry and in turn to ensure alignment with ICTSI’s service delivery. On the other hand, itsbusiness or profitability is not materially dependent on any relationship with any individualcustomer. As also seen in the previous years, ICTSI’s customer base remains very broad. There is nosingle dominating customer, and no customer has contributed to more than 10% of the Group’sconsolidated revenues in 2016, 2017 and 2018.
Related Parties
Related party transactions are discussed in Part IV, Item 12 of this report, and inNote 22, Related Party Transactions, to the 2018 Annual Audited Consolidated Financial Statements.
Intellectual Property, Licenses, Contracts and Agreements
The “ICTSI” name and logo are registered trademarks in the Philippines. The Company also possessescopyrights for certain proprietary software systems, whose remaining useful lives range from one tofive years. The Group sees to it that its rights for the design, source codes and use of these softwaresystems are secured at all times to ensure continued use and support from vendors.
Please refer also to Note 24, Significant Contracts and Agreements, to the Annual AuditedConsolidated Financial Statements for detailed discussion of the Group’s contracts and agreements tooperate, manage and develop the terminals.
Government Regulations and Licenses
The Group’s operations are subject to a variety of laws and regulations promulgated by the national andlocal government of each jurisdiction in which it operates. Rights and obligations under the concessionagreements are discussed in Note 24, Significant Contracts and Agreements, to the Annual AuditedConsolidated Financial Statements. The Group believes that it is in compliance, in all material aspects,with applicable government regulations in each jurisdiction in which it operates. The Group is notaware of any governmental proceedings or investigations to which it might become a party and whichmay have a material adverse effect on the Group’s properties and operations.
Various governmental and quasi-governmental agencies and regulatory bodies require the holding ofcertain licenses, concessions and permits with respect to port and port-related operations. For example,the PPA regulates all port operations in the Philippines, except for ports in Misamis Oriental and Subic,which are regulated by PHIVIDEC Industrial Authority and Subic Bay Metropolitan Authority(SBMA), respectively. Services and fees being offered to the port users may be controlled andapproved by the respective regulatory agency. Overseas operations are conducted under valid licenses,concessions, permits or certificates granted by the applicable regulatory body in that jurisdiction.
In addition, the fee structure for the Group’s services varies across the terminals it operates based onlocal regulations and practices. In some terminals, the operator charges shipping lines fees foron-vessel services and charges cargo owners separately for off-vessel services. The port authority setsdifferent tariffs for on-vessel and off-vessel services. In other jurisdictions, the operator charges onlythe shipping lines or the cargo owners who have separate arrangement among themselves. ICTSIcharges cargo owners mostly on a cash-on-delivery basis. Containers are not allowed to leave the portfacility until actual cash payment has been made and confirmed received. Shipping lines may begranted credit lines up to 30 days. Yet in some jurisdictions, release order of cargoes should come fromthe port authority.

11
The Group maintains regular dialogue with local government and regulatory authorities through itsmanagement teams or representatives in each jurisdiction, to ensure compliance with the requirementsand conditions for obtaining and maintaining the aforementioned licenses, concessions, permits orcertificates.
As of December 31, 2018, there are no pending requests for government approval for any of theGroup’s principal activities, except those arising from new or ongoing bids to operate, manage, ordevelop ports, which the Group’s Business Development Offices undertake.
Development Activities Expenses
Amount spent during the last three years on business development activities pursuing future portacquisitions are as follows (amounts in millions):
Amounts % of Revenues2016 US$6.2 0.55%2017 4.0 0.32%2018 6.2 0.45%
Insurance
The Company has established a world-class comprehensive insurance program that maintains insurancepolicies that cover its physical assets as well as its employees. The Company’s main insuranceprograms are its Global Port All Risk Property Policy, which covers handling equipment and terminalinfrastructure from damage and loss due to, among others, natural catastrophe perils such asearthquake, seaquake, flood, named windstorm, tsunami, volcanic eruption and tornado, physicaldamage, and coverage for strikes, riots, labour disturbances and civil commotion; Terminal Operator’sLiability Program, which embodies the standard terms of insurance coverage for port properties andterminal operators’ liability for all its operations globally which coverage includes, but is not limited to,liabilities for cargo damage, uncollected cargo, unintended and unexpected pollution and disposal costs,third party property damage and third party liability; and Employee Benefits programs which coversamong others the health care needs of its employees in the countries in which it operates and otherinsurance programs as reasonably needed by its terminals. The Company believes that its insurancecoverage is more than adequate to cover all normal risks associated with the operation of its businessand is consistent with industry standards.
Safety, Quality, Maintenance and Compliance with Environmental Laws
Equipment Inspection and Maintenance
To help ensure equipment reliability and support operational efficiency, the Group provides regularinspection and maintenance of its equipment and facilities. It has established formal procedures forperiodic maintenance and inspection of equipment in line with international guidelines andmanufacturers’ recommendations. Formal corporate policies are issued to address maintenance of thecritical components such as the structure, hoisting mechanisms, twist locks, safety devices interlocksand load path crane components. On a regular basis, the Group commissions structural professionalconsultants to provide testing of equipment, such as crane structures. Purchase of wire ropes is alwaysaccompanied with load test certificates. Wire ropes installed on different container handling equipmentare monitored and tested for defects through visual and mechanical inspection and discarded fromusage based on established discard criteria. All these activities are recorded and maintained as part ofGroup’s Asset Management System.

12
Quality, Health and Safety, Environmental Management Systems and Compliance with EnvironmentalLaws
Preventing incidents and safeguarding the health and safety of the workforce is the Group’s toppriority. The Group is committed to carry out business operations in a safe, efficient, andenvironmentally responsible manner and to care for the well-being of all those on sites and who may beimpacted by the Group’s activities. Aside from ensuring that all applicable laws are complied with,part of this commitment is to provide a safe and healthy workplace for employees and contractors byimplementing and maintaining Health & Safety and Environmental (HSE) management systems thatprevent risk in the business activities. To demonstrate this commitment, the Group’s terminalsworldwide have maintained the following management system certifications:
Terminal CertificationsMICT International Ship and Port Facility Security Code
ISO 9001:2008 Quality Management SystemISO 14001:2004 Environmental Management System
BIPI International Ship and Port Facility Security CodeDIPSSCOR International Ship and Port Facility Security Code
ISO 9001:2015 Quality Management SystemMICTSI International Ship and Port Facility Security CodeMTS International Ship and Port Facility Security Code
ISO 9001:2008 Quality Management SystemPT OJA International Ship and Port Facility Security CodePICT International Ship and Port Facility Security Code
ISO 9001:2008 Quality Management SystemISO 14001:2004 Environmental Management SystemOHSAS 18001:2007 Occupational Health and Safety
Management SystemSBITC International Ship and Port Facility Security Code
ISO 9001:2008 Quality Management SystemSCIPSI International Ship and Port Facility Security Code
ISO 9001:2008 Quality Management SystemISO 14001:2004 Environmental Management SystemOHSAS 18001:2007 Occupational Health and Safety Management
SystemVICT International Ship and Port Facility Security CodeYICT International Ship and Port Facility Security Code
ISO 9001:2015 Quality Management SystemISO 14001:2015 Environmental Management SystemOHSAS 18001:2007 Occupational Health and Safety
Management SystemAGCT International Ship and Port Facility Security CodeBCT International Ship and Port Facility Security Code
ISO 9001:2008 Quality Management SystemISO 14001:2004 Environmental Management SystemISO 22000:2005 Food Safety Management SystemISO 5001:2011 Energy Management System
BGT International Ship and Port Facility Security CodeBICT International Ship and Port Facility Security CodeIDRC International Ship and Port Facility Security CodeMICTSL International Ship and Port Facility Security Code
ISO 9001:2015 Quality Management SystemISO 14001:2015 Environmental Management SystemISO 28000:2007 Supply Chain Security Management System
CGSA International Ship and Port Facility Security Code

13
Terminal CertificationsISO 9001:2008 Quality Management SystemISO 14001:2004 Environmental Management SystemOHSAS 18001:2007 Occupational Health and Safety
Management SystemISO 28000:2007 Supply Chain Security Management SystemBASC for Safe and Secure International Trade
CMSA International Ship and Port Facility Security CodeISO 9001:2015 Quality Management SystemISO 14001:2015 Environmental Management SystemOHSAS 18001:2007 Occupational Health and Safety
Management SystemISO 28000:2007 Supply Chain Security Management System
OPC International Ship and Port Facility Security CodeISO 9001:2015 Quality Management SystemISO 14001:2015 Environmental Management SystemOHSAS 18001:2007 Occupational Health and Safety
Management SystemSPIA International Ship and Port Facility Security CodeTSSA International Ship and Port Facility Security Code
ISO 9001:2008 Quality Management SystemISO 14001:2004 Environmental Management System
The Group continuously strives to promote a robust health and safety and environmentally-friendlyculture across its business operations. Every employee who works for the Company is expected todemonstrate positive health, safety and environmental behaviors and report and mitigate potentialrisks. Managers are held accountable for attaining HSE goals, defining clear roles and responsibilities,providing appropriate resources and measuring, reviewing and continuously improving the Group’sHSE performance.
Costs incurred by the Group to implement its Health, Safety and Environmental programs andinitiatives amounted to US$0.2 million in 2016 and US$0.3 million both in 2017 and in 2018.
14
Employees
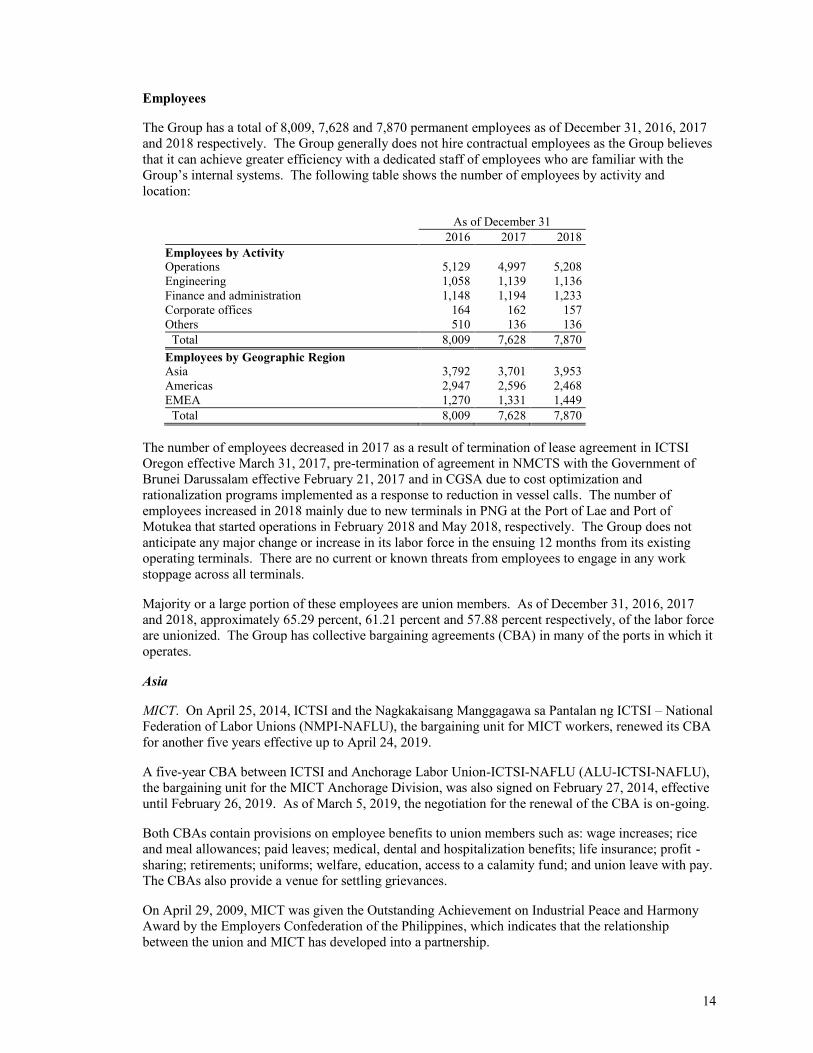
The Group has a total of 8,009, 7,628 and 7,870 permanent employees as of December 31, 2016, 2017and 2018 respectively. The Group generally does not hire contractual employees as the Group believesthat it can achieve greater efficiency with a dedicated staff of employees who are familiar with theGroup’s internal systems. The following table shows the number of employees by activity andlocation:
As of December 312016 2017 2018
Employees by ActivityOperations 5,129 4,997 5,208Engineering 1,058 1,139 1,136Finance and administration 1,148 1,194 1,233Corporate offices 164 162 157Others 510 136 136
Total 8,009 7,628 7,870Employees by Geographic RegionAsia 3,792 3,701 3,953Americas 2,947 2,596 2,468EMEA 1,270 1,331 1,449
Total 8,009 7,628 7,870
The number of employees decreased in 2017 as a result of termination of lease agreement in ICTSIOregon effective March 31, 2017, pre-termination of agreement in NMCTS with the Government ofBrunei Darussalam effective February 21, 2017 and in CGSA due to cost optimization andrationalization programs implemented as a response to reduction in vessel calls. The number ofemployees increased in 2018 mainly due to new terminals in PNG at the Port of Lae and Port ofMotukea that started operations in February 2018 and May 2018, respectively. The Group does notanticipate any major change or increase in its labor force in the ensuing 12 months from its existingoperating terminals. There are no current or known threats from employees to engage in any workstoppage across all terminals.
Majority or a large portion of these employees are union members. As of December 31, 2016, 2017and 2018, approximately 65.29 percent, 61.21 percent and 57.88 percent respectively, of the labor forceare unionized. The Group has collective bargaining agreements (CBA) in many of the ports in which itoperates.
Asia
MICT. On April 25, 2014, ICTSI and the Nagkakaisang Manggagawa sa Pantalan ng ICTSI – NationalFederation of Labor Unions (NMPI-NAFLU), the bargaining unit for MICT workers, renewed its CBAfor another five years effective up to April 24, 2019.
A five-year CBA between ICTSI and Anchorage Labor Union-ICTSI-NAFLU (ALU-ICTSI-NAFLU),the bargaining unit for the MICT Anchorage Division, was also signed on February 27, 2014, effectiveuntil February 26, 2019. As of March 5, 2019, the negotiation for the renewal of the CBA is on-going.
Both CBAs contain provisions on employee benefits to union members such as: wage increases; riceand meal allowances; paid leaves; medical, dental and hospitalization benefits; life insurance; profit -sharing; retirements; uniforms; welfare, education, access to a calamity fund; and union leave with pay.The CBAs also provide a venue for settling grievances.
On April 29, 2009, MICT was given the Outstanding Achievement on Industrial Peace and HarmonyAward by the Employers Confederation of the Philippines, which indicates that the relationshipbetween the union and MICT has developed into a partnership.

15
MICTSI. On March 20, 2015, a CBA was signed between MICTSI and Mindanao InternationalContainer Terminal Services, Inc. Labor Union - Federation of Democratic Labor Union Organization(MICTSILU-FDLO) with a term of five years ending on March 20, 2020. One of the provisions in theCBA is to agree on the renegotiation solely on the wage increase on the 4th and 5th year upon theexpiration of the 3rd year of this agreement.
Other salient provisions of the CBA include wage increases, leaves, hours of work, medical andhospitalization benefits, retirement, education fund contribution, group life insurance, plant uniform,rice subsidy, production incentive bonus, Christmas package and signing bonus. Other matters relativeto the union are periodically discussed in the Labor Management Council, consisting of representativesfrom the management of MICTSI and MICTSILU-FDLO, which meets once every month.
DIPPSCOR. On September 15, 2016, DIPSSCOR and DIPSSCOR Employees and Workers Union -Association of Trade Unions-TUCP (DEWU-ATU/TUCP), being the sole bargaining unit, signed anew five-year CBA. The CBA came into effect on June 1, 2016 and will expire on May 31, 2021.
The CBA contains provision on employee benefits to union members such as: wage increase,productivity incentives, rice subsidy, meal allowances, paid leaves, medical, dental and hospitalizationbenefits, life insurance, retirement benefits, death aids, uniforms, access to personal cash advances,union leave with pay and grievance machinery. The economic provisions of the CBA will berenegotiated on the 3rd year of the effectivity of the CBA.
On March 4, 2016, DIPSSCOR received a Certificate of Compliance on Labor Relations from theDepartment of Labor and Employment (DOLE) for having been compliant with Labor Relations uponevaluation of the aforementioned CBA.
SCIPSI. On November 5, 2012, the management of SCIPSI and the PRO-LABOR Champ Movement inMakar (PCM-M) entered into a CBA for a term of five years or until November 05, 2017.
60 days before the expiration of the said CBA, petition for election was filed by two intervenors,SCIPSI Employees Union-Southern Philippines Federation of Labor (SCIPSI EU-SPFL) and MakarPort Labor Organization (MPLO) at the DOLE. On March 9, 2018, a certification election was heldand the labor union PCM-M was re-elected.
On January 9, 2019, negotiation on renewal of CBA between PCM-M and the management of SCIPSIwas started.
In November 2009, the DOLE cited SCIPSI for Best Labor Management Cooperation (LMC) in RegionXII in the Philippines given by the National Conciliation and Mediation Board (NCMB) in Mindanaoand awarded as National Finalist in Outstanding LMC for Industrial Peace in the Philippines inNovember 2015. It is important to note that the Company’s LMC is an important vehicle indisseminating its corporate values and ensuring industrial peace.
MTS. On April 15, 2016, MTS and Serikat Pekrja Mandiri PT Makassar Terminal Services (SPMMTS), the labor union, signed a CBA that is effective for two years from April 15, 2016 toApril 14, 2018. The CBA was approved by the Pemerintah Kota Makassar, Suku Dinas TenagaKerja (the Department of Labor in the City of Makassar) on April 29, 2016. As at March 5, 2019, therenewal of CBA is on-going.
The CBA contains provisions on benefits for all employees such as: wage increases, box shareallowance, meal allowance, transport allowance, government and religious mandated leaves and leavesfor important reasons like worker’s marriage, paternity leaves, child baptism, marriage of worker’schildren, death of immediate worker’s family member, among others.
OJA. There is no labor union in OJA.

16
YICT. The right to unionize is guaranteed for the employees of YICT. All employees are unionized bylaw. Unionism is not a big issue in China since unions are considered as partners in a stable workforce.
PICT. The Democratic Employees Union (PICT-DEU) was formed on April 23, 2014 as thebargaining unit for PICT workers. The CBA was renewed on January 1, 2019 and will be effective for aperiod of two years.
VICT. VICT signed an Enterprise Agreement with the Australian Maritime Officers Union that wasendorsed by the Fair Work Commission on October 19, 2016. It has an initial term of four years andwill expire on October 19, 2020. The Agreement primarily covers rates of pay, working hours and leaveentitlements. The Agreement covers the operational staff at VICT.
MITL and SPICTL. MITL and SPICTL assumed, through implementation agreement, the CBA enteredinto between the Employers Federation of Papua New Guinea and the PNG Maritime and TransportWorkers Union called the Papua New Guinea National Stevedoring and Handling Workers’ UnionIndustrial Agreement. The CBA was signed on November 26, 2016 and is effective until November 25,2019. The Agreement regulates employment contracts, normal and overtime hours, remunerationconditions including timing and rates of increases, employment groups such as guaranteed wageearners, permanent and casual workers, vacation and shift schedules, health and safety requirements,retirement and conditions for termination of employment contracts.
There are no labor unions in SBITC, ICTSI Subic, BIPI and LGICT.
Americas
CGSA. There is a unionized Works Council since October 2008 and a CBA signed initially on July 16,2009. The CBA was renewed in January 2019 and will be effective for the next two years. Besides thebenefits that any worker is entitled by law, CBA secures for the employees some additional benefits: in-out transportation, food service and uniform. There have been no cases of strikes or walkouts sinceCGSA took over operations in 2007.
TSSA. The administrative and maintenance employees in TSSA are represented by the Sindicato dosAuxiliares de Administracao de Aramazens Gerais do Estado de Pernambuco (SINDAGE). The CBAwith SINDAGE is renewed every two years and was last signed in June 2017. TSSA and the unionhave a good relationship and there had not been any major labor disturbances, such as strikes,slowdown, boycott or mass absences in years. The employees receive benefits such as dental and healthinsurance, local restaurant privileges, support for professional development, leaves and transportationservices. The CBA will expire on June 30, 2019. Occasional workers at the customs inspections areaand all other operations personnel, both represented by occasional labor unions, have entered into aCBA with TSSA. The CBA relating to customs inspections area workers expired in February 2019 andnegotiations on renewal of CBA is on-going as at March 5, 2019. Meanwhile, the CBA relating to allother operations personnel will expire in June 2019.
CMSA. CMSA has a Collective Work Contract (CWC) signed in November 2010 with Union deEstibadores y Jornaleros del Pacifico, which is part of Confederacion Regional Obrero Mexicana(CROM). CROM has not had a strike since it was founded 95 years ago. The CWC is effective untilyear 2044 and extendible based on any extension on the concession agreement with AdministracionPortuaria Integral de Manzanillo, S.A., de C.V. There is an annual review of the salaries and every twoyears there is a salaries and benefits comprehensive review. CMSA is committed to give benefits inaddition to those required by the Mexican Labor Law i.e., 5% savings fund, transportation, uniforms,scholarships, contributions in the case of death of workers, sports support and life insurance. There isan additional fee of 16.23% of salary paid to the union to support the administration expenses andretirement fund of the workers.

17
OPC. OPC has an existing collective agreement signed with all employees. The collective agreementstipulates employees’ benefits like pension, medical and life insurance, trainings, employeeengagement, vacation bonus, meal subsidy, special leaves, salary loans, among others.
Tecplata. As of March 5, 2019, there is no labor union in Tecplata.
EMEA
BCT. On March 20, 2008, the labor union at the terminal of BCT in Gdynia, Poland declared a strikebecause of a deadlock in the 2008 salary negotiations. The strike lasted until April 1, 2008. Anagreement on salary regulations was signed between the Strike Committee and BCT ManagementBoard.
Renegotiation on the CBA also began in 2009, but was suspended at the insistence of the union. Theunion has not approached BCT’s management to resume negotiations. The new Remuneration andWork Regulations address the outstanding issues of the CBA and remain in place pending completionof the negotiations.
MICTSL. MICTSL assumed the CBA entered into by the previous port operator. The agreement setsout the obligations of the port operator with respect to matters such as medical care, housing allowancesand holidays. A salary grid is produced from time to time under the agreement that sets forthapplicable wages. Under the CBA and applicable employment regulations, union representatives mayonly be dismissed after the employer has successfully petitioned the Labor Inspectorate to do so. TheCBA stipulates that there should be no diminution of benefits
The right to strike is protected, provided that at least 48 hours’ notice is given to management. In 2009,there was a two-day temporary operational disruption due to political unrest wherein the then Presidentof Madagascar was ousted. The disruption did not produce any adverse effect on MICTSL. In 2010,MICTSL experienced two strikes attributed to the politicization of the concession agreement andprivatization of port operations. The CBA was renewed on October 1, 2015 for a period of five years,and can be subject to review three years after effectivity date upon the request of either of the parties.
AGCT. AGCT’s CBA was signed on June 28, 2016 and is effective until end of 2019. The CBAregulates employment contracts, overtimes, add-ons, vacations, salary increases or decreases, otherbenefits, health and safety requirements and conditions for termination of employment contracts. Therehave been no cases of strikes or walkouts since AGCT took over operations in 2011.
IDRC. There is no labor union in IDRC but there is a framework in place for communication andgrievances with elected labor representatives.
ICTSI Iraq and BICT. There are no labor unions in ICTSI Iraq, and BICT.
Risks Relating to the Group’s Business
The Group’s business is highly dependent on regional and global economic trends.
The volume of containers the Company handles and the usage of other port-related services areinfluenced by the performance and growth of regional and international trading economies. TheCompany has a substantial port operations business within the Philippines as well as an internationalportfolio of terminals. Its core business consists of the management, operation and development ofcontainer terminals and the provision of cargo handling and other port-related services. Such servicesare required by the Company’s shipping line customers for the transportation of containerized goods bysea within the global and regional marketplace. As a result, there is a correlation between the conditionof global and regional economies and the volume of container throughput the Company handles.Because the Company tends to operate small- to medium-sized end-destination terminals, theCompany’s results of operations are highly influenced by specific conditions in the local markets whereit operates. Furthermore, the global markets have experienced, and may continue to experience,

18
economic downturn and political instability in several areas of the world, which may result in increasedfuel prices, lower trade volumes, interruptions of the continuity of operations, decreases in imports andexports or reduced trading partners, which may adversely affect the Group’s business and results ofoperations.
The Group operates in a number of emerging markets that have experienced economic and politicalinstability.
The Group operates mainly in emerging markets, many of which have experienced political andeconomic instability in the past and may be continuing up to the present. Many of the countries wherethe Group operates or may operate in the future continue to face significant budget deficits, limitedforeign currency reserves, volatile exchange rates, and highly regulated and less sophisticated bankingsectors. Furthermore, many of ICTSI’s subsidiaries, including the Philippines, have experiencedfrequent changes in governments, political scandals, terrorist attacks and civil strife. There is noassurance that the future political environment in these countries will become stable or that current orfuture governments will be able to adopt economic policies that will sustain economic growth.
The Group is dependent on concessions and other key contracts to conduct its business.
The conduct of the Group’s business is restricted within the terms of the concession and other keycontracts that put a limit to its operational and strategic options. ICTSI and subsidiaries usually onlyobtain the right, subject to certain conditions, to operate, manage and develop terminals for a set periodof time. These contracts contain provisions that allow the relevant port authority to suspend, cancel orterminate the contract on specified grounds, including noncompliance with the terms of the contractand, in certain instances, the occurrence of a “change in control” of ICTSI without the consent of therelevant port authority or if the relevant port authority determines that the public interest may be betterserved by the cancellation of the contract in accordance with its regulations. Hence, there can be noassurance that further challenges in the Group’s operations will not be raised or that its concessions willnot be terminated for public policy reason. Also, these concessions and key contracts may limit theability of the Group to raise tariffs that it charges to customers. The Group’s major contracts andagreements are disclosed in Note 24, Significant Contracts and Agreements, to the Annual AuditedConsolidated Financial Statements.
The Group is limited in its ability to raise the tariffs billable to customers in most terminals.
The aforementioned contracts and agreements may prescribe maximum tariffs that the Group cancharge or bill shipping lines and customers and either prohibit any changes in those tariffs without priorapproval of the relevant port authority or subject the tariffs to an automatic adjustment mechanism. Atcertain terminals, tariff increases have recently been implemented in phases causing timing differenceswhen the Company petitioned for an increase and the actual increase in tariff. In countries in whichtariffs are not prescribed, such as Poland, Brazil, Australia and DR Congo, the Group is still limited inits ability to raise tariffs by market norms, competition and local demand.
The Group faces competition at its domestic and international terminals on factors such as location,facilities, supporting infrastructure, service and price.
Competition is heightened at domestic and international terminals on factors such as location, facilities,supporting infrastructure, service and price. The Group’s competitors may offer lower tariffs than whatits own terminal offers in a certain location; or have greater financial resources with which to developthe ports that they operate to provide better access and improved facilities, structure and services. Oneof the strategies that the Group employs is to acquire terminals in emerging markets, then improveoperations and grow volume organically. If trading volume increase, competitors may begin to targetthese same markets. Increased competition from existing and future competitors may result in areduction in the Group’s market share in locations where it operates, a decrease in volume of containersit handles, or increased price competition which could result in possible declines in the Group’s cashflows, operating margins and profitability.

19
The Group’s failure to effectively manage its existing container terminal operations and growth as aresult of rapid expansion and development may adversely impact the Group’s business.
The Group is rapidly expanding its container terminal operations, in particular, those located overseas.This rapid expansion into new markets diminishes the Group’s management resources to effectivelygovern its existing container terminal operations and more ambitious growth. It has presented, and willcontinue to present significant challenges for the Group’s management, operational and administrativesystems and its ability to maintain effective systems of internal controls. The Group may notsuccessfully integrate new acquisitions to meets its efficiency and performance standards, nor keepexisting facilities up to those same standards. The Group needs to constantly develop and adjustmanagement and administrative responsibilities to match market conditions and its growth andexpansion strategies. The Group’s continued development into a global terminal operator requires it toidentify new qualified personnel with widespread knowledge of its industry and the countries in whichit operates. Failure to identify suitable personnel for these management and administrative positionsmay adversely affect the Group’s ability to manage its growth and continue to pursue its growthstrategy and eventually impact its business, results of operations and financial condition.
The Group’s results of operations and financial condition may be adversely affected by exchange ratefluctuations.
Because of the geographic diversity of the Group’s business, it receives revenue and incurs expenses ina variety of currencies. Its revenues are primarily in U.S. dollars, Philippine pesos, Brazilian real,Mexican Pesos and Euros while its expenses are generally in local currencies. The Group attempts tooperationally hedge its foreign exchange exposure by matching its revenues and expenses wheneverpossible and, from to time, engages in hedging activities to mitigate residual foreign exchange cashflow exposures. The Company is subject to translation risks whereby changes in exchange rates impactits reported revenues in U.S. dollar terms. Because the Company reports its financial statements in U.S.dollars, increases in the value of the U.S. dollar against the currencies in which it receives revenues inits international operations, such as Philippine pesos, Brazilian real, Mexican Pesos and Euros, couldrestrict its revenue growth in U.S. dollar terms and vice versa. Continued fluctuations in the value ofthe U.S. dollar against its other subsidiaries’ functional currencies could cause the Company’s revenuesto decrease in U.S. dollar terms and distort comparisons of its results of operations and financialcondition across periods.
The Group’s business has high dependence upon key personnel with special skills that are not readilyavailable in the market.
In order for the Group to maintain its operating and performance standards, it highly leverages on thecontinued service of key personnel. The Group has a relatively small management team which makes itmore dependent on senior personnel than some of its larger competitors. With the rapid growth of thecontainer terminal industry, competition for skilled senior employees becomes intense and there arelimited numbers of qualified candidates. The Group’s business and results of operations may beadversely affected if any of the existing key personnel leaves their position and the Group fails to find asimilarly competent replacement.
The Group is subject to the risk of system failures.
The Group’s business is highly reliant on complex information technology and automated systems tohandle its terminal operations for high productivity and efficient handling of containers. Any systemsfailure may result in delayed or hindered terminal operations. These events may adversely affect theachievement of the Group’s planned business growth and results of operations.

20
The Group’s facilities could be exposed to unforeseen catastrophic events over which it has little or nocontrol.
The Group’s facilities could be exposed to effects of natural disasters and other potentially catastrophicevents, such as major accidents, acts of God, terrorist attacks, armed conflicts and hostilities. To cite,the Philippines is vulnerable to typhoons, earthquakes and other major natural disasters, which couldsuspend MICT’s operations temporarily or damage or destroy key equipment. Since operations atMICT have historically provided the majority of the Group’s revenues from port operations, occurrenceof a catastrophic event affecting the Philippines could have a material adverse effect on the Group’sbusiness, results of operations and financial condition.
The Group is subject to regulations that govern operational, environmental and safety standards.
Lastly, the Group’s terminal services are conducted under licenses, concessions, permits or certificatesgranted by applicable regulatory body in the countries in which it operates. Various environmental andsafety standards may also be enforced by each jurisdiction in which the Group operates. Failure tocomply with relevant laws and regulations may result in financial penalties or administrative or legalproceedings against the Group, including revocation or suspension of the Group’s concessions orlicenses, which may adversely impact results of operations and financial condition.
Henceforth, the Group has established an Enterprise Risk Management program to assess and ensurethat the potential impact and likelihood of any of these risks are minimized and will not adverselyimpact the Group’s business as a whole through an established risk assessment, communication,mitigation and monitoring process. These business risks, however, might result to financial statementrisks for which the Group identifies and includes as part of its financial risk management objectives andpolicies. These risk factors are further discussed in Part III, Item 6 of this report and in Note 27,Financial Risk Management Objectives and Policies, to the Annual Audited Consolidated FinancialStatements.
Item 2. Properties
2.1 Principal Facilities
Asia
Philippines - MICT. MICT provides a full range of container cargo handling services to shipping linestransporting international containerized cargo to and from the Port of Manila with an estimatedhandling capacity of 3,000,000 TEUs per year. MICT occupies a total land area of 105 hectares, ofwhich 94 hectares have been developed, and includes six berths. MICT also has a 1,750-meter longwharf which can accommodate six to seven ships, depending on the ships’ sizes. In 2012, ICTSIcompleted the development of Berth 6, which was a condition for the extension of the MICT Contractand to accommodate increasing volume. Adjacent to the MICT wharf is a container yard, with a totalstacking capacity of 62,625 TEUs, 1,534 TEUs of which are refrigeration-ready with reefer plugs.MICT also has three one hectare container freight stations (warehouses): two for imports; and one forexports. The facility also has a truck holding area, with 400 truck parking bays. MICT has three gates:two with six lanes; and one with seven lanes.
The terminal is fully equipped with security features recommended by the United States HomelandSecurity Agency, including gamma ray scanning devices and a closed-circuit television surveillancesystem.
On May 14, 2008, the Board of Investments (BOI) of the Philippines approved ICTSI’s registration ofthe construction of Berth 6 of MICT with Pioneer status under the Omnibus Investments Code of 1987,which entitles Berth 6 to an income tax holiday for a six-year period from November 2011, amongothers. Berth 6 was completed and inaugurated in July 2012, and increased the terminal capacity to
21
2,500,000 TEUs per year. The Berth 6 features additional 14 hectares of container space, threeadditional quay cranes for offloading ships and ten RTGs. On July 2, 2015, the BOI approved theregistration of ICTSI’s construction of Berth 7 of MICT on a Non-Pioneer status under the OmnibusInvestment Code of 1987. Berth 7 is entitled to an income tax holiday of three years starting from July2017.
As of December 31, 2018, ICTSI has a total of 16 quay cranes complemented by seven reach stackers,12 empty container handlers, 22 forklifts, 48 rubber-tired gantries (RTGs), and a huge fleet oftransportation equipment.
Philippines - New Container Terminal 1. Subic Bay International Terminal Corporation (SBITC)originally developed, managed and operated the NSD Waterfront Area in Subic, Philippines. However,in April 2008, the NSD Waterfront Area was replaced by the New Container Terminal (NCT-1). NCT 1is a 14-hectare terminal with a 280-meter berth and controlling depth of 13 meters, making it possibleto handle post-Panamax vessels. The estimated handling capacity of NCT-1 is 300,000 TEUs per year.As of December 31, 2018, SBITC has two post-Panamax cranes, four reach stackers, two emptycontainer handlers, three forklifts, 22 prime movers and 30 chassis.
Philippines - New Container Terminal 2. On July 27, 2011, SBMA and ICTSI signed the contract forthe operation and management of NCT-2 for a period of 25 years. ICTSI subsequently assigned saidcontract to ICTSI Subic, Inc. (ISI) and SBMA approved the assignment through a resolution datedAugust 19, 2011. NCT-2 is a 14-hectare terminal, which includes a 280-meter berth with 13 metersdepth. As of December 31, 2018, ISI has two post-Panamax quay cranes, three reach stackers and twoforklifts. The new terminal has an annual throughput capacity of 300,000 TEUs.
Philippines - Bauan Terminal. Bauan International Ports, Inc. (BIPI) owns a 20-hectare facility, ofwhich four hectares remain undeveloped, situated along the protected waters of Batangas Bay in Bauan,Batangas. The facility is a multi-purpose, multi-user terminal with a 240-meter berth with two berthingpositions. The facility also contains a storage area and a car terminal facility, and is supported withvarious heavy lift cranes and two ten-ton forklifts. The car terminal facility can handle 254,696completely built units per year.
Philippines - Mindanao Container Terminal (MCT). Mindanao International Container TerminalServices, Inc. or MICTSI operates the MCT located at Phividec Industrial Estate, Misamis Oriental.MICTSI has a 24-hectare terminal area for infrastructures, equipment and support facilities and handlescontainerized and non-containerized cargo. The terminal also has a 300-meter berth with a controllingdepth of 13 meters that can service two vessels at once. The terminal is also supported by an11-hectare yard area inclusive of container yard road networks, with a storage capacity of 6,816 TEUs.The terminal is also equipped with 262 reefer plugs at 440 volts. The estimated handling capacity ofMCT is 300,000 TEUs per year. As of December 31, 2018, MICTSI has two quay cranes, a reachstacker, two empty container handlers and four RTGs.
Philippines - Sasa Wharf. DIPSSCOR is a cargo handler at the Sasa International Port in Davao City,Philippines and the facilities are not for the exclusive use of DIPSSCOR. The terminal covers an areaof 16.75 hectares with 10 berthing positions of 10.6 meters in depth and occupying a total length of1,093 meters. The total throughput capacity of the terminal is 500,000 TEUs per year. As of December31, 2018, DIPSSCOR has three RTGs, six reach stackers, an empty container handler and 12 forklifts.
Philippines - Makar Wharf. SCIPSI is a stevedoring and cargo handling service provider at the MakarWharf, Port of General Santos, General Santos City, Southern Mindanao. The Makar Wharf is a generalpurpose wharf handling domestic and international containerized, general and roll-on/roll-off cargo aswell as domestic passenger traffic. The terminal surface area is 14 hectares that includes nine berths at850 meters in length with 8-12 meters depth. The terminal is also equipped with 204 reefer plugs andhas a total capacity of 250,000 TEUs per year. As of December 31, 2018, SCIPSI has four reachstackers, 22 chassis, 20 prime movers and 16 operating forklifts.

22
Philippines - Hijo Port. In 2012, ICTSI, through its wholly owned subsidiary, Abbotsford, togetherwith Hijo Resources Corp., a diversified group involved in leisure and tourism, agribusiness, propertydevelopment and port operations, invested in HIPS for the construction, development and operation ofHijo Port. Hijo Port is a private commercial port owned by HIPS located in Barangay Madaum, Tagum,Davao del Norte in the Gulf of Davao. The existing port sits within a reclaimed land of about 10.3hectares. It has two berths at 120 meters and 150 meters long, and various terminal support facilities.HIPS currently has a container handling capacity of 300,000 TEUs per annum. HIPS is currentlyhandling break bulk cargo. As of December 31, 2018, HIPS has one mobile harbor crane, an emptycontainer handler and three forklifts.
Philippines – Calamba, Laguna. On March 2, 2015, LGICT commenced operation of its one-stopinland container terminal located in Calamba City, Laguna. LGICT is 60%-owned by IW CargoHandlers, Inc., a wholly-owned subsidiary of the Company, and 40% owned by Nippon ContainerTerminals Co. Ltd., Transnational Diversified Corporation and NYK Fil-Japan Shipping Corp. LGICTprimarily operates as an extension of the seaport operations of MICT and is intended to function as aregional logistics hub, which will service and support the operations of exporters and importers. LGICTis situated on a 21-hectare property that is 58 kilometers from Metro Manila, located near variouseconomic export zones and adjacent to a railroad. As of December 31 2018, LGICT has two reachstackers and three side lifters.
Philippines – Tanza, Cavite. On April 21, 2017, ICTSI, through its wholly-owned subsidiary, CGT, inpartnership with the Philippine Department of Transportation, project launched the country’s soon-to-be first container roll-on roll-off barge terminal in Tanza, Cavite. CGT will facilitate off-the-roadsseaborn transport of containers between Port of Manila and Cavite and service industrial locators inCavite area. CGT’s barge terminal will have an annual capacity of 115,000 TEUs, which is equivalentto 140,000 fewer truck trips on city roads each year. The terminal was formally inaugurated onNovember 22, 2018. As of December 31 2018, CGT has an empty container handler and two forklifts.
Philippines - Manila North Harbor. On September 21, 2017, ICTSI signed a Share PurchaseAgreement (SPA) with Petron Corporation for the acquisition of 34.83% of the total issued andoutstanding shares of MNHPI. The SPA was finalized on October 30, 2017 upon the fulfillment ofcertain conditions, one of which was the approval of the acquisition by the Philippine Ports Authority(PPA) which was obtained on October 20, 2017. MNHPI has a concession contract with the PPA forthe development, management, operation and maintenance of Manila North Harbor. MNHPIcommenced operations on April 12, 2010. MNHPI is committed to modernize and develop ManilaNorth Harbor to transform it to a premier maritime hub. MNHPI provides cargo handling services forcontainerized and break-bulk cargoes to shipping lines and tramp vessel operators plying the domesticroutes. Overall, the port facility can accommodate up to 2,200,000 TEUs of containerized cargoes,2,000,000 metric tons of break-bulk cargoes and 2,500,000 passengers per year.
The 63.5 hectare land area is divided into three terminals namely, Container Terminal, Multi-PurposeTerminal, and Ro-Ro Terminal. These terminals work in synergy to optimize the port operations. Atpresent, the total quay length is 5,758 meters equivalent to 41 berthing positions. MNHPI handles anaverage of about 4,000 vessel calls per year.
In 2017, MNHPI completed its Phase 1 Development Program which provided modern port facilitiesincluding a modern Container Terminal, Ro-Ro Terminal, a modern Passenger Terminal Complex, andOne-Stop Processing Centers, all allowing efficient processing of transactions between shipping lines,MNHPI, PPA and other government agencies.
MNHPI also has a fleet of modern cargo handling equipment which include eight quay containercranes, 27 RTGs, 21 reach stackers, six empty container handlers and 33 heavy fork lifts, among others.Ancillary facilities were also built such as six weighbridges, the power center equipped with two2.5 megawatt generator sets for back-up power, and the reefer facility with 144 plugs.

23
China - Port of Yantai. YICT’s terminal covers an area of 76.6 hectares with four berthing positions of14 to 17 meters in depth and occupying a total length of 1,300 meters. The estimated handling capacityof YICT is 1,300,000 TEUs per year. As of December 31, 2018, YICT has seven quay cranes, whichhandle loading and unloading of cargoes with the support from one empty container handler, threeRTGs, five reach stackers, 15 prime movers, 20 forklifts, 20 RMGs and 33 chassis.
Indonesia - Makassar Container Terminal. Makassar Terminal Services (MTS) supplies and operatesequipment for PT Pelabuhan Indonesia IV (Pelindo IV), the Indonesian government agency whichoperates the Port of Makassar. MTS covers an area of 12.4 hectares with 850-meter berth length andseven berthing positions with 12 meters of depth. The total port terminal capacity is 650,000 TEUs withthe estimated handling capacity of MTS at 250,000 TEUs per year. As of December 31, 2018, MTS hastwo quay cranes, three RTGs, 9 prime movers and 9 chassis.
Indonesia - Port of Tanjung Priok. In July 2012, ICTSI acquired 100% of the equity interest of OJAthrough its indirect majority owned subsidiary, JASA. OJA is an Indonesian limited liability companyengaged in the loading and unloading of general goods and containers at the Port of Tanjung Priok,Jakarta, Indonesia. OJA has existing cooperation agreements with PT. Pelabuhan Indonesia II (Pelindo)under a profit sharing scheme. The scheme covers the terminal operations for berths 300, 301, 302 and303, which are operated by Pelindo and located in Terminal III of Tanjung Priok Port. Thesecooperation agreements have terms of two years that can be extended by the parties. On June 5, 2013,OJA signed a 15-year Cooperation Agreement with Pelindo, Tanjung Priok Branch for internationalcontainer stevedoring services under a profit sharing scheme. The terminal has a capacity of 400,000TEUs per year, berth length of 600 meters with two berthing positions of 11.5 meters in depth and 5.86hectares container yard. As of December 31, 2018, the terminal has seven quay cranes, seven reachstackers, five rail mounted gantries, a forklift, two RTGs, 30 prime movers and 31 chassis.
Pakistan - Karachi Port. In October 2012, ICTSI, through its wholly owned subsidiary ICTSIMauritius, completed the acquisition of a majority shareholding in PICT. PICT has a contract withKarachi Port Trust for the construction, development, operations and management of a common usercontainer terminal at Karachi Port for a period of 21 years commencing on June 18, 2002. The terminalhas a capacity of 750,000 TEUs per year and a berth length of 600 meters with a depth of 13.5 meters.As of December 31, 2018, PICT has six quay cranes supplemented by three empty container handlers,12 reach stackers, 15 forklifts, 20 RTGs and a large fleet of transportation equipment handling theexisting operations at Karachi Port.
Australia – Port of Melbourne. On May 2, 2014, ICTSI, through its subsidiary in Australia, VICT,signed a contract with the Port of Melbourne Corporation for the design, construction, commissioning,maintenance, operation and financing of Melbourne’s Webb Dock new international container terminaland empty container park. The contract grants a lease concession until 2040. Phase 1 of the terminalcomprised of a berth of 330 meters fitted with three neo-Panamax ship-to-shore cranes, 23.8 hectares ofyard with fully automated operations from gate to quayside, delivering an estimated capacity of350,000 TEUs. The terminal itself can handle vessels with a capacity in excess of 8,000 TEUs, and alsofeatures a 10-hectare empty container park with a working capacity of around 250,000 TEUs. Phase 2of the terminal comprised of a 330-meter berth fitted with additional two neo-Panamax ship-to-shorecranes and 11.5 hectares of yard increasing the capacity of the terminal to 1,000,000 TEUs.
Phase 1 and Phase 2 of the project commenced commercial operations in the second quarter of 2017and first quarter of 2018, respectively.
As of December 31, 2018, VICT has five quay cranes, one reach stacker, 20 automated stacking cranes,11 automated container carriers, 3 forklifts and 2 prime movers.

24
Papua New Guinea - Port of Lae and Port of Motukea. In September 2017, ICTSI received anotification from PNGPCL, a PNG state-owned enterprise, of the confirmation by the IndependentConsumer and Competition Commission in PNG with respect to the two 25-year agreements signed byICTSI’s PNG subsidiaries, MITL and SPICTL, with PNGPCL for the operation, management anddevelopment of the two international ports in Motukea and Lae in PNG.
SPICTL and MITL were allowed by PNGPCL to take over the port facilities and begin operations atthe Port of Lae in February 2018 and at the Port of Motukea in May 2018, respectively. The terminaloperating agreements and other related contracts took effect on June 1, 2018 after all the parties havecomplied with the agreed conditions precedent.
The Port of Lae is the largest container handling facility in PNG. Lae is the capital of Morobe Provinceand is the second largest city in PNG. The estimated annual capacity of the Lae Tidal Basin is 250,000TEUs. The total developed land area is 11.4 hectares and quay length is 250 meters. As ofDecember 31, 2018, SPICTL has four reach stackers, two empty container handlers, seven primemovers, three forklifts and 11 chassis.
The Port of Motukea is the only terminal in Port Moresby, the largest city in Papua New Guinea, that ispermitted to handle international containers. The estimated annual capacity of the Motukea port is250,000 TEUs. Total developed land area is 9.7 hectares and quay length is 240 meters. As ofDecember 31, 2018, MITL has two reach stackers, an empty container handler, three prime movers,three forklifts and six chassis.
Americas
Ecuador - Guayaquil Container and Multipurpose Terminal. CGSA is the exclusive operator of acontainer and multipurpose terminal in the Port of Guayaquil, Ecuador. The total land area of theterminal is 133.52 hectares, of which 92.5 hectares is developed. The total berth length is 1,717.5meters with 10 berthing positions including tugboat berth with 10.5 meters of depth. The estimatedhandling capacity of CGSA is 1,400,000 TEUs per year with 3,819 reefer plugs to accommodate thedemand for the containerization of bananas.
In 2008, CGSA completed upgrades to its inventory and maintenance processes and IT services. CGSAhad also made physical improvements of the terminal including container and multipurpose yardimprovements, construction of a new berth as a reinforcement of an existing one, construction of anelectric substation, and acquisitions of cranes and RTGs. New reefer stations and plugs were also addedto accommodate the shift from bananas as break bulk cargo to containers. As of December 31, 2018,CGSA has six quay cranes and three mobile harbor cranes that are supported by 23 RTGs, 14 reachstackers, 8 empty container handler, 42 forklifts, 63 prime movers, 64 chassis.
Brazil - Suape Container Terminal. TSSA is the exclusive operator of the container terminal in the portin Suape, Brazil until the earlier of (a) throughput of 250,000 boxes (approx. 400,000 TEUs) for threeconsecutive years or (b) after the first 15 years of the concession. The terminal covers a developed areaof 39.4 hectares and undeveloped area of 2.5 hectares. TSSA has a 660-meter long two-berth wharf, a30-hectare container yard, 576 reefer plugs, and a 4,900-square meter CFS and a truck weighing scale.The estimated handling capacity of TSSA is 700,000 TEUs per year.
TSSA has completed the build-out of the infrastructure of the Suape Container Terminal, including theacquisition of equipment and the development of civil works, such as yard expansions. As ofDecember 31, 2018, TSSA has six quay cranes, six reach stackers, four empty container handlers, 13forklifts, 14 RTGs, 38 prime movers and 48 chassis that complement the servicing of all movements ofcontainerized cargoes inside the terminal.

25
Colombia - Port of Buenaventura. SPIA owns 225 hectares of land in the Aguadulce Peninsula inBuenaventura. SPIA was granted a 30-year concession by the Colombian National Institute ofConcessions to develop, construct and operate a container handling facility in Aguadulce. TheAguadulce Peninsula is across the channel from the existing Port of Buenaventura. Buenaventura islocated on the west coast of Colombia. It is the biggest port in the country and the only Colombian porton the Pacific coast. SPIA started initial operations in the fourth quarter of 2016. The terminal has atotal area of 128 hectares and berth length of 600 meters with a depth of 14.5 meters, 11.3-hectarecontainer yard and 640 reefer plugs. Estimated annual capacity of SPIA is 550,000 TEUs. The terminalcan be accessed through a 20.7-kilometre road that circumvents the urban parts of Buenaventura. It alsohas 140 hectares along this access road for logistics development. As of December 31, 2018, SPIA hasfour quay cranes, three empty container handlers, three reach stackers, 10 RTGs, 32 prime movers and34 chassis.
Argentina - La Plata Port. In October 2008, Tecplata was granted a 30-year concession to build andoperate an all-purpose port terminal in the Port of La Plata, Argentina, by the Consorcio de Gestion delPuerto La Plata, which would expire in 2038. The port development project covers 41.2 hectares,29.6 hectares of which is from the concession agreement and 11.6 hectares is from Compania Fluvialdel Sud S.A. via a Usufruct Agreement for a term of 20 years renewable at Tecplata’s option for another20 years. The terminal has an estimated handling capacity of 450,000 TEUs with a 600-meter berthhaving four berthing positions and 11 meters of quay side depth. As of December 31, 2018, Tecplatahas four quay cranes, two reach stackers, three empty container handlers, 9 RTGs, seven forklifts, 18prime movers and 20 chassis. As at March 5, 2019, Tecplata is ready to operate.
Mexico - Port of Manzanillo. In June 2010, ICTSI signed a 34-year concession for the development andoperation of the Second Specialized Container Terminal (TEC-II) at the Port of Manzanillo in Mexico.ICTSI established CMSA to operate the Port of Manzanillo. The port development project covers about77 hectares with 1,080 meters of seafront. The development of the container terminal will be done inthree phases. Construction of Phase 1A development, which started in November 2011, was completedand CMSA formally commenced commercial operations in November 2013. Phase 1A has a berthlength of 720 meters with two berthing positions with a depth of 16 meters, yard capacity of 710,000TEUs and a handling capacity of 900,000 TEUs. Phase 1B was completed in May 2017 and startedcommercial operations thereafter. Phase 1B involved the construction of a yard that increased CMSA’syard capacity to 967,000 TEUs.
Phase 2A development started in December 2017 and it consists of three stages. Stage 1 Phase 2A wascompleted in the third quarter of 2018, Stage 2 Phase 2A is expected to be completed in the secondquarter of 2019 and shall be operational thereafter, while the additional yard in Stage 3 Phase 2A isexpected to be completed in December 2019. The Stage 3 Phase 2A shall also involve the constructionof 180 meters of berth and is expected to start development in June 2019 and be completed in June2020.
Stage 1 Phase 2A is expected to increase yard capacity by 380,000 TEUs, Stage 2 Phase 2A by 137,000TEUs and Stage 3 Phase 2A by 73,000 TEUs for an expected total yard capacity of 1.5 million TEUsafter the completion of Phase 2A. The expansion of the berth in Stage 3 of Phase 2A shall bringadditional berthing position. Two quay cranes and five RTGs are expected to be put to operations in2019.
As at December 31, 2018, the estimated handling capacity of CMSA is 1,000,000 TEUs with six quaycranes supported by six reach stackers, seven empty container handlers, 15 RTGs, 26 forklifts, 40 primemovers and 40 chassis.

26
Honduras - Puerto Cortés. On February 1, 2013, ICTSI won and was awarded the Contract for theDesign, Financing, Construction, Maintenance, Operation and Exploitation of the SpecializedContainer and General Cargo Terminal of Puerto Cortés in the Republic of Honduras for a periodof 29 years through a public hearing held in Tegucigalpa, Honduras. OPC started its commercialoperations in December 2013. The terminal has a 1,150-meter pier with four berthing positions anddepth from 11 to 14 meters, 21.7-hectare container yard, 1,744 reefer plugs, a 7,600-square meterCFS and has an estimated annual capacity of 1,000,000 TEUs. As of December 31, 2018, OPC hasthree quay cranes, four mobile harbor cranes, two empty container handlers, 19 reach stackers, 21forklifts, 47 terminal tractors and 61 chassis.
Mexico - Port of Tuxpan. On 27 May 2015, the Company acquired 100.0% of TMT from GrupoTMM, S.A.B. and Inmobiliaria TMM, S.A. de C.V. TMT is a Mexican company with a concessionto construct and operate a maritime container terminal in the Port of Tuxpan, Mexico and is theowner of land with an area of 29.1 hectares where the maritime container terminal will beconstructed.
EMEA
Poland – Port of Gdynia. BCT has a lease contract to operate the Container Terminal in Gdynia,Poland. The terminal covers an area of 57 hectares and its facilities include a 790-meter long wharfwith five berths (four of which are for container loading and unloading operations and one of which isequipped with a hydraulic ramp for roll-on roll-off operations), a container stacking yard, a cargohandling zone, two warehouses and a rail facility with three rail tracks. The estimated handling capacityof BCT is 1,200,000 TEUs per year. As of December 31, 2018, BCT has six quay cranes, two mobileharbor cranes, two rail-mounted gantries, three reach stackers, 18 RTGs, 22 forklifts, 2 straddlecarriers, 33 chassis, 34 prime movers and a large fleet of transportation equipment that handle loadingand unloading of containerized cargo at the terminal.
Madagascar - Port of Toamasina. MICTSL manages, operates and develops the Port of Toamasina,Madagascar. The terminal covers an area of 19 hectares and its facilities include two berths with acombined length of 307 meters and a depth in excess of up to 12 meters. The estimated handlingcapacity of MICTSL is 400,000 TEUs per year. As of December 31, 2018, MICTSL has three emptycontainer handlers, four mobile harbor cranes, four forklifts, three reach stackers, nine RTGs, 22 primemovers and 24 chassis.
Georgia - Port of Batumi. BICTL operates a container terminal and a ferry and dry bulk handlingfacility in the Port of Batumi, in Georgia. BICTL covers an area of 13.6 hectares, has two berths withcombined length of 465 meters and depth between 8 and 11.3 meters. The estimated handling capacityof BICTL is 150,000 TEUs per year. As of December 31, 2018, BICTL has two mobile harbor cranes,two empty container handler, four reach stackers, seven prime movers and eight forklifts.
Croatia - Brajdica Container Terminal. In March 2011, ICTSI, through its wholly owned subsidiary,ICBV, entered into a Share Purchase Agreement with Luka Rijeka D.D., a Croatian company to acquirea 51% interest in AGCT. AGCT operates the Brajdica Container Terminal in Rijeka, Croatia with aconcession period of 30 years until 2041. The port includes a 17 hectare yard, with a combined 790-meter quay and depth of 10.5 to 14.8 meters. The current capacity is 600,000 TEUs per year with 252reefer plugs. As of December 31, 2018, AGCT has four quay cranes, six RTGs, two rail-mountedgantries, four reach stackers, four forklifts, 14 prime movers and 21 chassis to support its operations.

27
Iraq – Port of Umm Qasr. On April 8, 2014, ICTSI, through its wholly owned subsidiary ICTSI Dubai,and General Company for Ports of Iraq (GCPI) signed the Contract for the Construction and Operationof Three New Quays and Management and Operation of Quay No. 20 (“Contract”) in the Port of UmmQasr (“Port”) in Iraq. The Contract grants ICTSI the rights to: (a) manage and operate the existingcontainer facility at Berth 20 of the Port for a period of 10 years, (b) build, under a build-operate-transfer (BOT) scheme, a new container and general cargo terminal in the Port for a concession periodof 26 years, and (c) provide container and general cargo terminal services in both components. OnMarch 1, 2016, an addendum to the Contract (“Addendum”) was signed by the parties granting ICTSI,through ICTSI Dubai, the right to manage and operate an additional existing Quay No. 19 for a total of13 years, with the first three years for the completion of rehabilitation works. Also, the Addendumextended the original term for the management and operation of Quay No. 20 from 10 to 13 years. OnMarch 26, 2017, a second addendum to the Contract (“Second Addendum”) was signed by the partiesgranting ICTSI, through ICTSI Dubai, the right to manage and operate Quay No. 21 co-terminus withthe Contact and the First Addendum. The Second Addendum extended the term for the managementand operation of Quay No. 19 and 20 from 13 to 21 years. ICTSI commenced trial operations atBerth 20 in September 2014 and full-fledged commercial operations in November 2014. ICTSIcommenced commercial operations of Berth 19 in June 2016. Berth 21 started commercial operationsin the third quarter of 2018 while rehabilitation works are on-going. Phase 1 of the expansion project(Berrh 27) under the BOT scheme has 250 meters of berth with an estimated capacity of 300,000TEUs. When fully developed, the facility will have 600 meters of quay with an estimated capacity of900,000 TEUs. Berth 27 was completed and fully operational in the first quarter of 2017.
On October 22, 2017, ICTSI signed an agreement with GCPI for the Phase 2 of expansion developmentof the Port. The Phase 2 expansion project will involve development of two new berths, Berths 25 and26, including a 20-hectare yard area. This expansion will increase the Port’s container handlingcapacity by 600,000 to 1,200,000 TEUs and its capability to handle large container vessels of up to10,000 TEUs. The development of this phase of the expansion project is on-going and is expected tobe completed in the third quarter of 2019.
The Port covers an area of 78.2 hectares, 35.2 hectares of which is still undeveloped. The Port has twoberths with length of 400 meters and depth of 12.5 meters. The estimated current handling capacity ofthe Port is 600,000 TEUs per year. As of December 31, 2018, the terminal has four quay cranes, twomobile harbor cranes, six empty container handlers, three RTGs, 20 forklifts, 14 reach stackers, 24chassis and 24 prime movers.
Congo - River Port in Matadi, Democratic Republic of Congo. On January 23, 2014, ICTSI, throughits subsidiary, ICTSI Cooperatief, forged a business partnership with SIMOBILE for the establishmentand formation of a joint venture company, ICTSI DR Congo (IDRC). IDRC will build a new terminalalong the river bank of the Congo River in Matadi and manage, develop and operate the same as acontainer terminal, as well as provide exclusive container handling services and general cargo servicestherein. SIMOBILE is a concessionaire of a parcel of land along the Congo river in the district ofMbengu, Township of Matadi in the Democratic Republic of Congo, intended for port use. Phase 1 ofthe facility consists of two berths that can handle 175,000 TEUs. The capacity and berth length can,subject to demand, be doubled in Phase 2. The first phase comprised of two berths with total length of350 meters, which service shipping lines, importers and exporters. Phase 1 was completed in the fourthquarter of 2016. Initial operations started in the third quarter of 2016 while commercial operationsstarted in January 2017. As of December 31, 2018, IDRC has two mobile harbor cranes, an emptycontainer handler, two forklifts, three reach stackers, six prime movers and seven chassis.

28
2.2 Other Properties Owned by ICTSI and Subsidiaries
Location Descriptions/Owner EncumbranceCabuyao, Laguna,
Philippines20-hectare property that was original site of the
inland container depot project/ IWI ContainerTerminal Holdings, Inc. (IWI CTHI, formerlyICTSI Warehousing, Inc.)1
None
Calamba, Laguna,Philippines
25-hectare property which is the site of LGICT’sone-stop inland container terminal/ICTSI
None
Bauan, Batangas,Philippines
20-hectare (approximately) property in Batangasacquired from AG&P in December 1997/BIPI2
None
Tanza, Cavite, Philippines 6-hectare property located in Tanza, Cavite acquiredby Cavite Gateway Terminal, Inc.1 (CGT) fromCapital Resources Corporation and the Heirs ofFrancisco Joaquin for use in the gateway terminalbusiness of CGT.
A smallportion of theproperty wasmortgaged bythe sellers toAsia PacificLendingCorporation(APLC)3.
Gdynia, Poland 3.5 hectares of lot with a building owned by BCTwas acquired from local real estatecompany. These properties are being leased tothird parties.
None
1 100% owned by ICTSI2 60% owned by IWI CTHI3 The sellers have represented that the mortgages in favor APLC have already been discharged or terminated, although the annotation of
the mortgages on the titles to the property could not be cancelled due to the dissolution of APLC.
2.3 Estimated Capital Expenditures and Sources of Financing
The Group’s capital expenditures for 2019 are expected to be approximately US$380.0 million. Theestimated capital expenditure budget will be utilized mainly for the ongoing expansion projects at BGT,CMSA and MICT; equipment acquisitions and upgrades; and for maintenance requirements. TheGroup expects to fund these capital expenditures through a combination of available cash, internally-generated funds, third party loans and other fund raising activities, if necessary.

29
Item 3. Legal Proceedings
Due to the nature of the Group’s business, it is involved in various legal proceedings, both as plaintiffand defendant, from time to time. The majority of outstanding litigation involves subrogation claimsunder which insurance companies have brought claims against the operator, shipping lines and/orbrokerage firms for reimbursement of their payment of insurance claims for damaged equipment,facilities and cargoes. Except as discussed below, ICTSI is not engaged in any legal or arbitrationproceedings (either as plaintiff or defendant), including those which are pending or known to becontemplated and its Board has no knowledge of any proceedings pending or threatened against theGroup or any facts likely to give rise to any litigation, claims or proceedings which might materiallyaffect its financial position or business. Management and its legal counsels believe that the Group hassubstantial legal and factual bases for its position and is of the opinion that losses arising from theselegal actions and proceedings, if any, will not have a material adverse impact on the Group’sconsolidated financial position and results of operations.
MICT
The MICT Berth 6 Project is a port development project being undertaken by the Company with theapproval of the PPA and in compliance with the Company’s commitment under its concession contractwith the PPA. The City Council of Manila issued Resolution No. 141 dated September 23, 2010,adopting the Committee Report of the ad hoc committee that investigated the reclamation done in IslaPuting Bato in Manila, which stated that the project should have had prior consultation with the City ofManila, approval and ordinance from the City of Manila, and consent from the City Mayor. TheCompany and its legal counsels’ position is that Resolution No. 141 of the City Council of Manila ispurely recommendatory and is not the final word on the issue whether the MICT Berth 6 Project isvalidly undertaken or not.
On November 26, 2010, the PPA, through the Office of the Solicitor General, filed a petition forcertiorari and prohibition with application for the issuance of a temporary restraining order and/or writof preliminary injunction assailing City Council Resolution No. 141 before the Supreme Court. TheSupreme Court granted a temporary restraining order (“TRO”) enjoining the Mayor of Manila and theCity Council of Manila from stopping or suspending the implementation of the MICT Berth 6 Projectof the PPA. The TRO is still valid and continuing until further orders from the Supreme Court. TheSupreme Court also granted the Company’s motion to intervene in the case of PPA vs. City of Manilaand City Council of Manila. The parties filed their respective comments and replies before the SupremeCourt. As of March 5, 2019, the parties still await the Supreme Court’s resolution on this case.
Notwithstanding the foregoing legal proceedings, the MICT Berth 6 Project was completed andinaugurated by the President of the Republic of the Philippines in July 2012.
In 2013, a case was filed by Malayan Insurance Co., Inc. (MICO) against ICTSI before the RegionalTrial Court of Manila, Branch 55, for damages allegedly sustained by the assured cargo of PhilippineLong Distance Telephone Company (PLDT) consisting of telecommunications equipment. The amountof claim is P=223.8 million (approximately US$4.5 million) plus legal interest and attorney's fees ofP=1.0 million (US$20.1 thousand).
PLDT initially filed a claim against ICTSI, claiming that the cargo had been dropped while inside acontainer at the terminal of ICTSI and holding the latter responsible for the value of theequipment. ICTSI did not pay the claim, arguing that there is no evidence that the cargo had beendamaged. ICTSI further argued that the containerized equipment was never dropped to the ground butwas merely wedged in between containers while being moved in the container yard. The case iscurrently on trial.

30
PICT
In 2007, the Trustees of the Port of Karachi (KPT) filed a civil suit against the Pakistan InternationalContainer Terminal (PICT) in the Honorable High Court of Sindh (HCS) claiming a sum ofapproximately US$2.2 million along with the interest, as default payment of wharfage and penaltythereon, for the alleged mis-declaration of the category of goods on the import of Ship to Shore Cranesand Rubber Tyre Gantry Cranes in 2004. The HCS has rendered a judgement and decree in favor ofPICT and ordered that KPT is not entitled to the amount of wharfage charges claimed by it. In June2017, KPT filed an appeal against the aforesaid judgment before the Divisional Bench of HCS. Uponadvice of PICT’s legal advisor, management believes that there is no merit in this claim.
Also in 2007, PICT has filed an interpleader civil suit before HCS against the Deputy District Officer,Excise and Taxation (DDO) and the Trustees of KPT in respect of demand raised by the DDO on PICTto pay property tax out of the Handling, Marshalling and Storage (HMS) Charges payable to KPTamounting to approximately US$0.2 million for the period from 2003 to 2007. In compliance with theOrder of HCS, PICT deposited the amount with Nazir of HCS, out of amount withheld by PICT fromHMS charges billed by KPT. In 2014, another demand was made by DDO amounting to approximatelyUS$0.7 million for the period from 2008 to 2014. On an application filed by PICT for directions, HCSordered for deposit of the aforementioned amount out of HMS charges billed by KPT and PICTsubsequently complied with the order of HCS. In 2015, HCS issued further orders directing PICT todeposit the remaining HMS charges due and payable with Nazir of HCS in quarterly installments andPICT complied accordingly. The decision of the suit is still pending, and PICT's legal advisor believesthat there may be no adverse implication for depositing the payments with Nazir of HCS due to KPT inview of complying with the HCS’s order.
While completing the tax audit proceedings for the tax year 2013, the Deputy Commissioner InlandRevenue (DCIR) modified the deemed assessment of PICT and made certain disallowances/additionson the taxable income and raised an income tax demand of approximately US$0.9 million. PICT filedan appeal before the Commissioner Inland Revenue - Appeals (CIR-A) who partially decided theappeal in favor of PICT. Consequently, PICT made the payment of approximately US$0.71 million, inrespect of issues confirmed by the CIR(A), and filed a second appeal before the Appellate TribunalInland Revenue, which is now pending for adjudication. Upon advice of PICT’s tax advisor,management believes that the issues involved in the appeal is expected to be decided in favor of PICT.
In 2017, the Assistant Commissioner Sindh Revenue Board (AC-SRB) under Sindh Sales Tax onServices Act, 2011 raised a demand of approximately US$3.7 million along with penalty and defaultsurcharge, for the tax periods January 2013 to December 2014 on exempt services provided by PICT.PICT filed an Appeal with Commissioner Appeals - SRB which is pending for hearing. The tax advisorof PICT is of the view that PICT has strong defense and appeal will be decided in favor of PICT.
In 2017, the Additional Commissioner Inland Revenue (ACIR) modified the deemed assessment ofPICT for the tax year 2016 by passing an order under section 122(5A) of the Income Tax Ordinance,2001 and made certain additions / disallowances to the taxable income and tax credits claimed by PICTand raised an income tax demand of approximately US$1.59 million. PICT filed an appeal before theCommissioner Inland Revenue – Appeals (CIR-A) who had decided the appeal partly in favor of PICT.Being aggrieved by the decision of CIR-A, PICT as well as the tax department filed the appeals beforeAppellate Tribunal Inland Revenue (ATIR) which are pending for adjudication. PICT has also soughtstay from HCS against the demand created by ACIR after appeal effect proceedings. HCS vide its finalorder directed the ACIR not to take any coercive recovery measures until the finalization of appealbefore the ATIR which is pending adjudication. The tax advisor of PICT is of the view that the issuesinvolved in the appeal will be decided in favor of PICT.
31
TSSA
In 2008, a civil suit was filed by former customer Interfood Comercio (Interfood) against TSSA fordamages to perishable cargo amounting to BRL7.0 million (approximately US$3.0 million).Interfood’s cargo (garlic and birdseed) was declared improper for human and animal consumption dueto long storage period at TSSA before it was claimed and such cargo was destroyed by Braziliancustoms authorities. The lower court and Court of Appeals ruled in favor of Interfood. The case hasbeen pending in the Supreme Court for more than four years. An amount of BRL12.0 million(approximately US$3.1 million) in TSSA’s bank account has been garnished by the lower court. Theprovision aggregating BRL13.8 million (US$4.2 million), BRL13.8 million (US$4.2 million) andBRL13.8 million (US$3.6 million) were recognized as part of “Accounts payable and other currentliabilities” account in the consolidated balance sheets as at December 31, 2016, 2017 and 2018,respectively. In July 2016, the State Court rendered a decision against TSSA. The said judgment,however, is still subject to a last appeal with the Supreme Court in Brasilia.
TICT
On December 28, 2012, TICT filed a Notice of Termination of its 10-year Investment Agreement withTartous Port General Company (TPGC) on the grounds of “unforeseen change of circumstances” and“Force Majeure”. In early 2013, TPGC submitted to arbitration TICT’s termination notice. OnApril 1, 2014, the arbitration panel decided in favor of TPGC. While the award has become executoryon April 20, 2015, management and its legal counsels believe that TPGC will not be able tosuccessfully enforce the award outside of Syria.
BICTL
In 2015, BICTL filed a case against Revenue Service with the Tbilisi City Court for the cancellation ofthe tax assessment in the amount of US$860.7 thousand (GEL2.3 million). The case involves Value-Added Tax on fees collected by BICTL for services rendered in relation to the export of scrapmaterials. The Revenue Service alleged that such fees are subject to VAT while BICTL believes that ithas good legal basis to treat the services as a VAT zero-rated sale of services. In March 2016, theTbilisi City Court rendered a decision in favor of Revenue Service. BICTL has appealed the saiddecision with the appellate court. The Tbilisi Court of Appeals considered BICTL’s arguments andposition. On May 16, 2018, the said court partially satisfied BICTL’s claim and major part of thepenalty was cancelled.
ICTSI Oregon
Due to continuing labor disruption caused by the International Longshore and Warehouse Union(ILWU) in Portland commencing in June 2012, ICTSI Oregon has filed two separate counter-claims infederal court against the ILWU seeking monetary damages. The first is a claim for damages caused bythe ILWU's unlawful secondary activity under the National Labor Relations Act. The second is anantitrust claim brought against the ILWU and the Pacific Maritime Association (PMA). The antitrustclaim was initially dismissed by the federal court. The judge granted ICTSI Oregon permission toappeal the dismissal to the United States Court of Appeals for the Ninth Circuit. In July 2017, the NinthCircuit upheld the dismissal of the claim. ICTSI Oregon filed a petition for writ of certiorari with theUnited States Supreme Court seeking to reverse the Ninth Circuit’s decision. This petition was denied.Accordingly, the antitrust claim has been finally disposed of.
ICTSI Oregon’s second counterclaim against ILWU is a claim for money damages caused by theILWU's unlawful secondary activity under the National Labor Relations Act. In connection with thatclaim, the National Labor Relations Board (NLRB) sought and obtained two federal court injunctionsagainst the ILWU, prohibiting illegal work stoppages as well as a finding of contempt of court againstthe union for injunction violations. The federal district court initially stayed ICTSI Oregon's damageclaim for unlawful secondary activity pending completion of administrative proceedings before theNLRB. The NLRB’s administrative proceedings were completed in a manner favorable to ICTSI

32
Oregon in 2015. However, the ILWU appealed to the United States Court of Appeals for the District ofColumbia Circuit in Washington D.C. On November 6, 2017, the US Court of Appeals rejected theILWU’s appeals and upheld two NLRB decisions declaring that the ILWU engaged in deliberate workstoppages and slowdowns, made false safety claims, and engaged in other illegal coercive conductagainst ICTSI Oregon and its customers.
As a result of the US Court of Appeals decisions, the federal district court in Oregon lifted the stay andhas scheduled a trial of ICTSI Oregon’s damage claim commencing in the later part of 2019. This is asubstantial claim, seeking a multi-million dollar judgment against the ILWU.
ICTSI also had brought a breach of fiduciary duty claim against the PMA in federal court. Based on asettlement between ICTSI and PMA, that claim was voluntarily dismissed in 2018.
SPIA
In February 2018, Conalvias Construcciones S.A.S., (Conalvias) filed an arbitration case at theArbitration Center of the Chamber of Commerce of Bogota against SPIA for the unlawful terminationof the Construction of Paving Works and Utilities contract (“the Contract”), and for several breachescommitted by SPIA under the Contract. The arbitration case is on-going and SPIA has filed acounterclaim against Conalvias for damages incurred as a result of contractual breaches committed byConalvias. The counterclaim filed by SPIA will be amended to indicate the amount of damages oncethe full assessment of the claim is completed.
Item 4. Submission of Matters to a Vote of Security Holders
None. There are no matters submitted during the fourth quarter of the fiscal year covered by the 17-Ato a vote of security holders, through the solicitation of proxies or otherwise.

33
In US Dollar In Philippine PesoOpening :High :
US$2.252.26
P=117.50118.00
Low : 2.16 112.80Closing : 2.16 112.80
PART II – SECURITIES OF THE REGISTRANT
Item 5. Market for Issuer’s Common Equity and Related Stockholder Matters
5.1 Market Information
Principal Market where Company’s common equity is traded: Philippine Stock Exchange
Principal Market for the Company’s common equity: Philippine Stock Exchange
As of the latest practicable trading date on March 5, 2019, the share prices of ICTSI were:
* Amounts expressed in Philippine peso have been translated to USD using the closing exchange rate quoted fromthe Bankers Association of the Philippines as at the end of March 5, 2019.
The high and low share prices for each quarter within the last two years are:
CalendarPeriod
Price/Common Share*High Low
In US Dollar In Philippine Peso In US Dollar In Philippine Peso2017Quarter 1 US$1.792 P=89.90 US$1.415 P=71.00Quarter 2 2.100 106.00 1.742 87.90Quarter 3 2.143 108.90 1.906 96.85Quarter 4 2.145 107.10 2.019 100.80
2018Quarter 1 US$2.176 P=113.50 US$1.917 P=100.00Quarter 2 1.875 100.00 1.447 77.20Quarter 3 1.761 95.15 1.431 77.30Quarter 4 1.959 103.00 1.712 90.00
* Amounts expressed in Philippine peso have been translated to USD using the closing exchange rates quoted from the PhilippineDealing System as at the end of each quarter in 2017 and 2018.
5.2 Holder
The number of stockholders of record as of the latest practicable date on December 28, 2018 was1,383. Common shares issued and outstanding as of the same date were 2,045,177,671 shares(including 34,175,740 treasury shares). While Preferred A and B shares outstanding as of the samedate were 3,800,000 shares and 700,000,000 shares, respectively.
As of December 31, 2018, the public ownership level of the Company is at 50.62% based only oncommon shares. The public ownership level of the Company is at 37.55% if both common andPreferred B voting shares are considered.
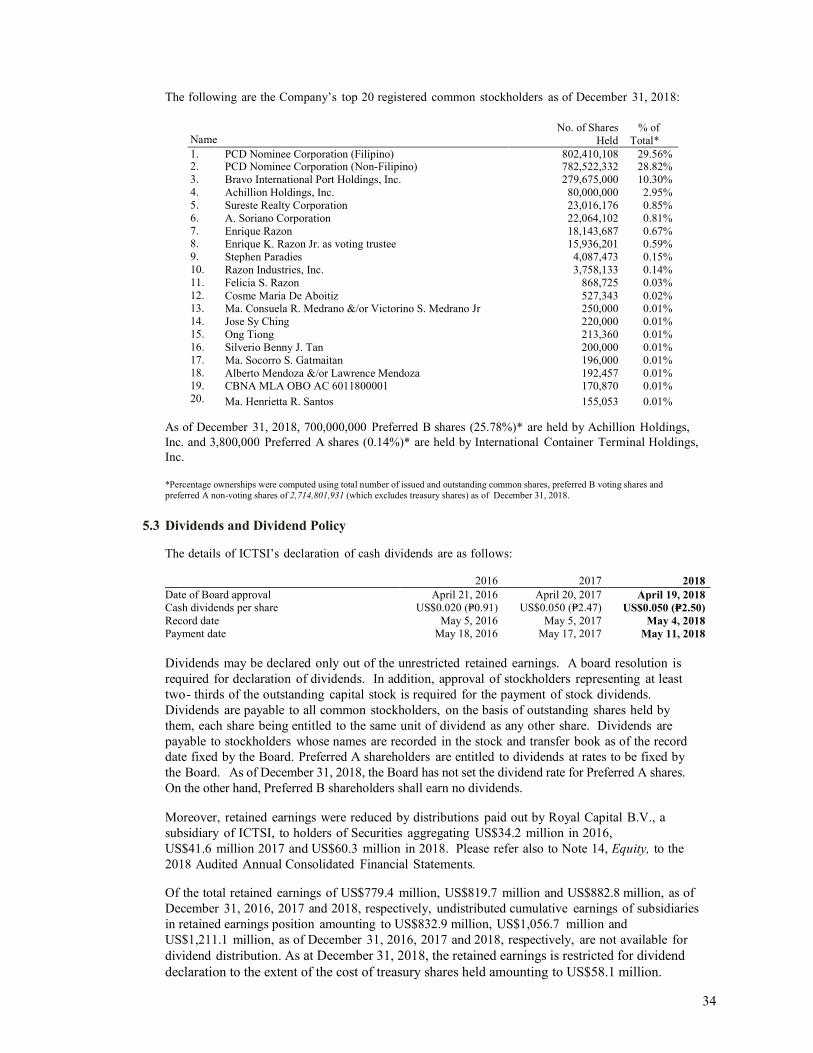
34
The following are the Company’s top 20 registered common stockholders as of December 31, 2018:
NameNo. of Shares
Held% of
Total*1. PCD Nominee Corporation (Filipino) 802,410,108 29.56%2. PCD Nominee Corporation (Non-Filipino) 782,522,332 28.82%3. Bravo International Port Holdings, Inc. 279,675,000 10.30%4. Achillion Holdings, Inc. 80,000,000 2.95%5. Sureste Realty Corporation 23,016,176 0.85%6. A. Soriano Corporation 22,064,102 0.81%7. Enrique Razon 18,143,687 0.67%8. Enrique K. Razon Jr. as voting trustee 15,936,201 0.59%9. Stephen Paradies 4,087,473 0.15%10. Razon Industries, Inc. 3,758,133 0.14%11. Felicia S. Razon 868,725 0.03%12. Cosme Maria De Aboitiz 527,343 0.02%13. Ma. Consuela R. Medrano &/or Victorino S. Medrano Jr 250,000 0.01%14. Jose Sy Ching 220,000 0.01%15. Ong Tiong 213,360 0.01%16. Silverio Benny J. Tan 200,000 0.01%17. Ma. Socorro S. Gatmaitan 196,000 0.01%18. Alberto Mendoza &/or Lawrence Mendoza 192,457 0.01%19. CBNA MLA OBO AC 6011800001 170,870 0.01%20. Ma. Henrietta R. Santos 155,053 0.01%
As of December 31, 2018, 700,000,000 Preferred B shares (25.78%)* are held by Achillion Holdings,Inc. and 3,800,000 Preferred A shares (0.14%)* are held by International Container Terminal Holdings,Inc.
*Percentage ownerships were computed using total number of issued and outstanding common shares, preferred B voting shares andpreferred A non-voting shares of 2,714,801,931 (which excludes treasury shares) as of December 31, 2018.
5.3 Dividends and Dividend Policy
The details of ICTSI’s declaration of cash dividends are as follows:
2016 2017 2018Date of Board approval April 21, 2016 April 20, 2017 April 19, 2018Cash dividends per share US$0.020 (P=0.91) US$0.050 (P=2.47) US$0.050 (P=2.50)Record date May 5, 2016 May 5, 2017 May 4, 2018Payment date May 18, 2016 May 17, 2017 May 11, 2018
Dividends may be declared only out of the unrestricted retained earnings. A board resolution isrequired for declaration of dividends. In addition, approval of stockholders representing at leasttwo- thirds of the outstanding capital stock is required for the payment of stock dividends.Dividends are payable to all common stockholders, on the basis of outstanding shares held bythem, each share being entitled to the same unit of dividend as any other share. Dividends arepayable to stockholders whose names are recorded in the stock and transfer book as of the recorddate fixed by the Board. Preferred A shareholders are entitled to dividends at rates to be fixed bythe Board. As of December 31, 2018, the Board has not set the dividend rate for Preferred A shares.On the other hand, Preferred B shareholders shall earn no dividends.
Moreover, retained earnings were reduced by distributions paid out by Royal Capital B.V., asubsidiary of ICTSI, to holders of Securities aggregating US$34.2 million in 2016,US$41.6 million 2017 and US$60.3 million in 2018. Please refer also to Note 14, Equity, to the2018 Audited Annual Consolidated Financial Statements.
Of the total retained earnings of US$779.4 million, US$819.7 million and US$882.8 million, as ofDecember 31, 2016, 2017 and 2018, respectively, undistributed cumulative earnings of subsidiariesin retained earnings position amounting to US$832.9 million, US$1,056.7 million andUS$1,211.1 million, as of December 31, 2016, 2017 and 2018, respectively, are not available fordividend distribution. As at December 31, 2018, the retained earnings is restricted for dividenddeclaration to the extent of the cost of treasury shares held amounting to US$58.1 million.

35
On April 21, 2016, the Board of the Parent Company approved the release of US$90.0 million fromappropriated retained earnings. On December 29, 2017, the Board of the Parent Company appropriatedUS$25.0 million for additional working capital requirements of its continuing domestic and foreignexpansion projects in 2018. On March 6, 2018, the Board of the Parent Company approved the releaseof US$150.0 million from the appropriated retained earnings back to unappropriated retained earningsdue to completion of the project in VICT in Australia. The remaining appropriated retained earnings ofthe Parent Company as of March 6, 2018 amounting to US$212.1 million was intended for capitalexpenditures for new and existing projects in MICT in Manila, OPC in Honduras, ICTSI Iraq in Iraqand CMSA in Mexico.
As at December 31, 2016, 2017 and 2018, total appropriated retained earnings of the Parent Companyamounted to US$337.1 million, US$362.1 million and US$212.1 million, respectively.
The unappropriated retained earnings of the Parent Company that is available for dividend declarationas of December 31, 2018 amounted to US$74.6 million.
5.4 Recent Sale of Unregistered Securities
On May 15, 2013, ICTSI issued 53,110,811 new common shares to Mr. Enrique K. Razon, Jr. for asubscription price of Php91.00 per share. This is an exempt transaction under SRC Rule 10.1(e) (Thesale of capital stock of a corporation to its own stockholders exclusively, where no commission or otherremuneration is paid or given directly or indirectly in connection with the sale of such capital stock.)
5.5 Description of Registrant’s Securities
ICTSI’s capital stock comprised of common and preferred shares. Common shares are listed andtraded in the Philippine Stock Exchange. Preferred shares comprising of preferred A and B shares arenot traded. Details and movement in the shares of stock of ICTSI are disclosed in Note 14, Equity, tothe 2018 Audited Annual Consolidated Financial Statements.
The stockholders of ICTSI, in a special stockholders meeting held on August 11, 2010, approved thecreation of a class of voting low par value preferred shares. The stockholders representing at least 2/3of the outstanding capital stock of ICTSI approved the amendment of the articles of incorporation ofICTSI to reclassify the existing 1,000,000,000 authorized Preferred Shares with a par value ofUS$0.048 (P=1.00) per share into: (a) 993,000,000 Preferred A Shares with a par value of US$0.048(P=1.00) per share, inclusive of the outstanding Preferred Shares, and (b) 7,000,000 Preferred shareswhich were further reclassified into 700,000,000 Preferred B Shares with a par value of US$0.0002(P=0.01). The creation of a class of low par value voting preferred shares was authorized by the Boardon June 18, 2010.
The Preferred A shares, which were subscribed to by International Container Terminal Holdings, Inc.,are non-voting, entitled to dividend at rates to be fixed by the Board, non-cumulative, convertible tocommon shares under such terms to be provided by the Board, redeemable at such price and termsdetermined by the Board and have preference over common shares in the distribution of the assets ofthe Parent Company (see Note 14.3 to the 2018 Audited Annual Consolidated Financial Statements).As at March 5, 2019, the Board has not fixed the dividend rate and terms of conversion of Preferred Ashares.
The Preferred B shares were issued to Achillion Holdings, Inc. (Achillion). As at March 5, 2019,Preferred B shares have the following features: voting; issued only to Philippine Nationals; notconvertible into common shares; earn no dividend and redeemable at the option of the Board.

36
PART III – FINANCIAL INFORMATION
Item 6. Management’s Discussion and Analysis or Plan of Operations
The following discussion and analysis relate to the consolidated financial position and results ofoperations of ICTSI and its wholly and majority-owned subsidiaries (collectively known as “ICTSIGroup”) and should be read in conjunction with the accompanying audited consolidated financialstatements and related notes as of and for the year ended December 31, 2018. References to “ICTSI”,“the Company”, and “Parent Company” pertain to ICTSI Parent Company, while references to “theGroup” pertain to ICTSI and its subsidiaries.
6.1 Overview
The Group is an international operator of common user container terminals serving the global containershipping industry. Its business is the acquisition, development, operation and management of containerterminals focusing on facilities with total annual throughputs ranging from 50,000 to 3,000,000 twenty-foot equivalent units (TEUs). It also handles break bulk cargoes (BBC) and provides a number ofancillary services such as storage, container packing and unpacking, inspection, weighing, and servicesfor refrigerated containers or reefers. As of report date, the Group is involved in 32 terminalconcessions and port development projects in 19 countries worldwide. There are 30 operatingterminals in nine key ports; an inland container terminal; and a barge terminal in the Philippines, twoeach in Indonesia and Papua New Guinea and one each in China, Ecuador, Brazil, Poland, Georgia,Madagascar, Croatia, Pakistan, Honduras, Mexico, Iraq, Argentina, DR Congo, Colombia andAustralia; an existing concession to construct and operate a port in Tuxpan, Mexico; and the recentlysigned concession in the Republic of Sudan.
ICTSI was established in 1987 in connection with the privatization of Manila International ContainerTerminal (MICT) in the Port of Manila, and has built upon the experience gained in rehabilitating,developing and operating MICT to establish an extensive international network concentrated inemerging market economies. International acquisitions principally in Asia, Europe, Middle East andAfrica (EMEA) and Americas substantially contributed to the growth in volume, revenues, EBITDAand net income. ICTSI’s business strategy is to continue to develop its existing portfolio of terminalsand proactively seek acquisition opportunities that meet its investment criteria.
The Group operates principally in one industry segment which is cargo handling and related services.ICTSI has organized its business into three geographical segments:
Asiao Manila - Manila International Container Terminal, Port of Manila, Philippines (MICT)o Zambales - New Container Terminal (NCT) 1 and 2, Subic Bay Freeport Zone, Olongapo City,
Philippines (SBITC/ICTSI Subic)o Batangas - Bauan Terminal, Bauan, Philippines (BIPI)o Laguna - Laguna Gateway Inland Container Terminal, Calamba City, Laguna, Philippines
(LGICT)o Cavite - Cavite Gateway Terminal, Tanza, Cavite, Philippines (CGT)o Davao - Sasa Wharf, Port of Davao (DIPSSCOR) and Hijo International Port, Davao del Norte,
Philippines (HIPS)o General Santos - Makar Wharf, Port of General Santos, Philippines (SCIPSI)o Misamis Oriental - Phividec Industrial Estate, Tagaloan, Philippines (MICTSI)o Manila - Manila North Harbour Port, Inc., North Harbor, Manila, Philippines (MNHPI)o Indonesia - Makassar Port Container Terminal, Makassar, South Sulawesi, Indonesia (MTS)
and Port of Tanjung Priok, Jakarta, Indonesia (OJA)o China - Yantai International Container Terminal, Port of Yantai, Shandong Province, China
(YICT)o Pakistan - Port of Karachi, Karachi, Pakistan (PICT)

37
o Australia - Webb Dock Container Terminal and ECP at Webb Dock East, Port of Melbourne,Australia (VICT)
o Papua New Guinea - Port of Motukea, Papua New Guinea (MITL) and Port of Lae, Papua NewGuinea (SPICTL)
EMEAo Poland - Baltic Container Terminal, Gdynia, Poland (BCT)o Georgia - Port of Batumi, Batumi, Georgia (BICTL)o Croatia - Brajdica Container Terminal, Rijeka, Croatia (AGCT)o Madagascar - Port of Toamasina, Toamasina, Madagascar (MICTSL)o DR Congo - Matadi Gateway Terminal, Mbengu, Matadi, Democratic Republic of Congo
(IDRC)o Iraq - Basra Gateway Terminal at Port of Umm Qasr, Iraq (ICTSI Iraq)o Sudan - Port of Port Sudan, Republic of Sudan (AGT)
Americaso Brazil - Suape Container Terminal, Suape, Brazil (TSSA)o Ecuador - Port of Guayaquil, Guayaquil, Ecuador (CGSA)o Argentina - Port of La Plata, Buenos Aires Province, Argentina (TECPLATA)o Mexico - Port of Manzanillo, Manzanillo, Mexico (CMSA) and Port of Tuxpan, Mexico
(TMT)o Colombia - Port of Buenaventura, Buenaventura, Colombia (SPIA)o Honduras - Puerto Cortés, Republic of Honduras (OPC)
Concessions for port operations entered into, acquired and terminated by ICTSI and subsidiaries for thelast three years are summarized below:
Port of Port Sudan, Republic of Sudan. On January 3, 2019, ICTSI, through its wholly-ownedsubsidiary ICTSI Middle East DMCC, signed a Concession Agreement with the Sea Ports Corporationof Sudan (SPC) to operate, manage and develop the container terminal at the port of Port Sudan,Republic of the Sudan for 20 years. Port Sudan is the only major modern port in the country and servesas the international gateway for more than 95% of Sudan’s cargo flows. The Group is currentlyworking with SPC for the handover preparations and is expecting to take over the container terminal inthe first half of 2019.
Manila North Harbour Port, Inc., Philippines. On September 21, 2017, the BOD of ICTSI granted theauthority to acquire shares in MNHPI. On the same date, ICTSI signed a Share Purchase Agreement(SPA) with Petron Corporation for the acquisition of 10,449,000 MNHPI shares, representing 34.83%of the total issued and outstanding shares of MNHPI for a total consideration of Php1.75 billion(US$33.8 million). The completion of the SPA was subject to several conditions, one of which was theapproval of the acquisition by the Philippine Ports Authority which was obtained on October 20, 2017.The SPA was completed on October 30, 2017. An additional investment cost of Php2.45 billion(US$47.3 million) was incurred in relation to this acquisition.
On September 5, 2018, ICTSI has signed a SPA with Harbour Centre Port Terminal, Inc. (HCPTI) forthe acquisition of 4,550,000 shares in MNHPI from HCPTI. The subject shares represent 15.17% ofthe total issued and outstanding shares of MNHPI. The total consideration is Php910.0 million(US$16.8 million). As of report date, the completion of the SPA remains subject to a number ofconditions precedent. Upon completion of this transaction, ICTSI's shareholdings in MNHPI willincrease from 34.83% to 50%. An additional investment cost will be incurred in relation to thisacquisition.

38
Port of Motukea and Port of Lae, Papua New Guinea. In September 2017, ICTSI received anotification from PNG Ports Corporation Limited (PNGPCL), a Papua New Guinea (PNG) state-ownedenterprise, of the confirmation by the Independent Consumer and Competition Commission in PNGwith respect to the two 25-year agreements signed by ICTSI through its wholly-owned subsidiaries,Motukea International Terminal Limited (MITL) and South Pacific International Container TerminalLimited (SPICTL), with PNGPCL for the operation, management and development of the twointernational ports in Motukea and Lae in PNG.
SPICTL and MITL were allowed by PNGPCL to take over the port facilities and begin operations atthe Port of Lae in February 2018 and at the Port of Motukea in May 2018, respectively. The terminaloperating agreements and other related contracts took effect on June 1, 2018 after all the parties havecomplied with the agreed conditions precedent.
Cavite Gateway Terminal, Philippines. On April 21, 2017, ICTSI, through its wholly-ownedsubsidiary, Cavite Gateway Terminal (CGT), in partnership with the Philippine Department ofTransportation, project launched the country’s first container roll-on roll-off barge terminal in Tanza,Cavite. CGT will facilitate off-the-roads seaborn transport of containers between Port of Manila andCavite and service industrial locators in Cavite area. CGT’s barge terminal has an annual capacity of115,000 TEUs. The terminal was formally inaugurated and commenced commercial operations onNovember 22, 2018.
Port of Umm Qasr, Iraq. In April 2014, ICTSI, through its wholly owned subsidiary ICTSI (M.E.)JLT, and General Company for Ports of Iraq (GCPI) signed the Contract for the Construction andOperation of Three New Quays and Management and Operation of Quay No. 20 (“Contract”) in thePort of Umm Qasr (“Port”) in Iraq. The Contract grants ICTSI the rights to: (a) manage and operate theexisting container facility at Berth 20 of the Port for a period of 10 years, (b) build, under a build-operate-transfer (BOT) scheme, a new container and general cargo terminal in the Port for a concessionperiod of 26 years, and (c) provide container and general cargo terminal services in both components.On March 1, 2016, an addendum to the Contract (“First Addendum”) was signed by the parties grantingICTSI, through ICTSI Dubai, the right to manage and operate an additional existing Quay No. 19 for atotal of 13 years, with the first three years for the completion of rehabilitation works. Also, the FirstAddendum extended the original term for the management and operation of Quay No. 20 from 10 to 13years. On March 26, 2017, a second addendum to the Contract (“Second Addendum”) was signed bythe parties granting ICTSI, through ICTSI Dubai, on the right to manage and operate Quay No. 21 co-terminus with the Contract and the First Addendum. The Second Addendum extended the term for themanagement and operation of Quay No. 19 and 20 from 13 to 21 years.
Berth 21 started commercial operations in the third quarter of 2018 while the remaining rehabilitationworks are being completed. Phase 1 of the expansion project (Berth 27) was completed and fullyoperational in the first quarter of 2017. On October 22, 2017, ICTSI signed an agreement with GCPIfor the Phase 2 of expansion development of the Port which involves development of two new berths,Berths 25 and 26, including a 20-hectare yard area. The development of this phase of the expansionproject is on-going and is expected to be completed in the third quarter of 2019.
Extension of ContractsDavao Sasa Port, Philippines. On April 21, 2006, the Philippine Ports Authority (PPA) grantedDIPSSCOR a ten-year contract for cargo handling services at Sasa Wharf, Port of Davao in thePhilippines that expired on April 20, 2016. Since then, the local office of the PPA in Davao City hasgranted DIPSSCOR a series of hold-over authorities for a period ranging from six months to one year.On November 12, 2018, a hold-over authority was issued by the PPA Port Manager with availability ofsix months starting August 26, 2018 or until the award of a new contract by the PPA, whichever isearlier, unless cancelled or revoked for reason by the PPA during the validity of the hold-overauthority. As of report date, DIPSSCOR has not yet received the extension of the hold-over authority.

39
Makar Wharf, Port of General Santos, South Cotabato, Philippines. On February 20, 2006, the PPAgranted South Cotabato Integrated Port Services, Inc. (SCIPSI) a ten-year contract for the exclusivemanagement and operation of arrastre, stevedoring, bagging and crated cargo handling services atMakar Wharf, Port of General Santos, General Santos City in the Philippines that expired on February19, 2016. Since then, the local office of the PPA in General Santos City has granted SCIPSI a series ofhold-over authorities for a period of one year. On October 19, 2018, a hold-over authority was issuedby the PPA Port Manager with availability of six months starting August 25, 2018 or until the award ofa new contract by the PPA, whichever is earlier, unless cancelled or revoked for reason by the PPAduring the validity of the hold-over authority. As of report date, SCIPSI has not yet received theextension of the hold-over authority.
Termination of ContractsDeep Water Port, Ibeju-Lekki, Lagos State, Federal Republic of Nigeria. On May 17, 2017, ICTSI,through its subsidiary Lekki International Container Terminal Services LFTZ Enterprise (LICTSE), andLekki Port LFTZ Enterprise (LPLE) signed a settlement and release agreement cancelling LICTSE’ssub-concession agreement dated August 10, 2012, subject to payment of an agreed amount toLICTSLE. The said Sub-concession Agreement (Agreement) granted LICTSLE exclusive right todevelop and operate, and to provide handling equipment and container terminal service at the containerterminal within Lekki Port located at Ibeju Lekki, Lagos State, Federal Republic of Nigeria for a periodof 21 years. On May 23, 2017, ICTSI received the agreed amounts of US$12.5 million representing thereturn of payments made to Lekki Port pursuant to the Agreement, and US$7.5 million representingcompensation of costs incurred by ICTSI in relation to the project. The termination of the Sub-concession Agreement has been finalized and was deemed effective May 24, 2017.
Port of Portland, Oregon, U.S.A. In October 2016, the Board of ICTSI Ltd. has authorized themanagement of ICTSI Oregon to negotiate with the Port of Portland and reach terms mutuallyacceptable to both parties with respect to the termination of the lease agreement after two majorcustomers, Hanjin Shipping Co. and Hapag-Lloyd stopped calling the Port of Portland in March 2015due to continuing labor disruptions. In late 2016, the Port of Portland and ICTSI Oregon begandiscussions of a mutual agreement to terminate the lease agreement. As a result, the Company hasprovided for probable loss on the pre-termination of the lease agreement amounting to US$23.4 millionin 2016 based on the Company’s best estimate of the probable outcome of the negotiations with thePort.
On March 8, 2017, ICTSI, through ICTSI Oregon, and the Port of Portland have signed a LeaseTermination Agreement and both parties have mutually agreed to terminate the 25-year LeaseAgreement to operate the container facility at Terminal 6 of the Port of Portland with an effective dateof March 31, 2017. The Lease Termination Agreement allows ICTSI Oregon to be relieved of its long-term lease obligations. In exchange, the Port of Portland will receive US$11.45 million in cashcompensation and container handling equipment including spare parts and tools.
Muara Container Terminal, Brunei Darussalam. The Agreement with the Brunei Government for theoperation and maintenance of the Muara Container Terminal in Brunei Darussalam was no longerrenewed and ended effective February 21, 2017.
OthersPort of Tanjung Priok, Indonesia. On November 2, 2017, PT ICTSI Jasa Prima Tbk (IJP), an ICTSIsubsidiary in Indonesia, signed a Conditional Share Purchase Agreement with PT Samudera TerminalIndonesia (STI) for the purchase of IJP’s interest in PT Perusahaan Bongkar Muat Olah Jasa Andal(OJA), subject to certain conditions. As of report date, the conditions precedent have not yet beenfulfilled.

40
6.2 Results of Operations and Key Performance Indicators
6.2.1 Results of Operations
The following table shows a summary of the results of operations for the year endedDecember 31, 2018 as compared with the same period in 2017 and 2016 as derived from theaccompanying audited consolidated financial statements.
Table 6.1 Audited Consolidated Statements of Income
For the Years Ended December 31In thousands, except % change data 2016 2017 2018 % Change
2016 vs 2017% Change
2017 vs 2018Gross revenues from port operations US$1,128,395 US$1,244,438 US$1,385,785 10.3 11.4Revenues from port operations,
net of port authorities’ share 944,693 1,053,911 1,182,679 11.6 12.2Total income (net revenues, interest and
other income) 980,396 1,104,418 1,238,637 12.7 12.2Total expenses (operating, financing and
other expenses) 723,355 856,155 929,782 18.4 8.6EBITDA1 525,078 578,012 642,221 10.1 11.1EBIT2 377,248 404,547 446,509 7.2 10.4Net income attributable to equity holders
of the parent 180,016 182,141 221,494 1.2 21.6
Earnings per shareBasic US$0.066 US$0.069 US$0.078 4.5 11.8Diluted 0.065 0.069 0.077 6.2 12.2
__________________1 EBITDA is not a uniform or legally defined financial measure. It generally represents earnings before interest, taxes, depreciation and
amortization. EBITDA is presented because the Group believes it is an important measure of its performance and liquidity. EBITDAis also frequently used by securities analysts, investors and other interested parties in the evaluation of companies in the industry.
The Group’s EBITDA figures are not; however, readily comparable with other companies’ EBITDA figures as they are calculateddifferently and thus, must be read in conjunction with related additional explanations. EBITDA has limitations as an analytical tooland should not be considered in isolation or as a substitute for analysis of the Group’s results as reported under PFRS. Some of thelimitations concerning EBITDA are:
EBITDA does not reflect cash expenditures or future requirements for capital expenditures or contractual commitments; EBITDA does not reflect changes in, or cash requirements for working capital needs; EBITDA does not reflect the interest expense, or the cash requirements necessary to service interest or principal debt
payments; Although depreciation and amortization are non-cash charges, the assets being depreciated or amortized will often have to
be replaced in the future, and EBITDA does not reflect any cash requirements for such replacements; and Other companies in the industry may calculate EBITDA differently, which may limit its usefulness as a comparative
measure.
Because of these limitations, EBITDA should not be considered as a measure of discretionary cash available to the Group to invest inthe growth of the business. The Group compensates for these limitations by relying primarily on the PFRS results and uses EBITDAonly as supplementary information.
2 EBIT, or Earnings Before Interest and Taxes, is calculated by taking net revenues from port operations and deducting cash operatingexpenses and depreciation and amortization.
__________________

41
The following table presents the computation of EBITDA as derived from the Group’s consolidated netincome attributable to equity holders of the parent for the year:
Table 6.2 EBITDA ComputationFor the Years Ended December 31
In thousands, except % change data 2016 2017 2018 % Change2016 vs 2017
% Change2017 vs 2018
Net income attributable to equity holdersof the parent US$180,016 US$182,141 US$221,494 1.2 21.6
Non-controlling interests 13,455 25,576 28,329 90.1 10.8Provision for income tax 63,571 40,547 59,032 (36.2) 45.6Income before income tax 257,042 248,264 308,855 ( 3.4) 24.4Add (deduct):
Depreciation and amortization 147,830 173,465 195,712 17.3 12.8Interest and other expenses 155,910 206,790 193,611 32.6 ( 6.4)Interest and other income (35,704) (50,507) (55,957) 41.5 10.8
EBITDA US$525,078 US$578,012 US$642,221 10.1 11.1
6.2.2 Key Performance Indicators
The five (5) key performance indicators (KPIs) include gross moves per hour per crane, craneavailability and berth utilization, which affect the operations of the Group, and volume growth intwenty-foot equivalent unit (TEU) and gross revenue growth, which are both financial in nature. TheseKPIs are discussed in detail in the succeeding paragraphs.
2018 Compared with 2017
Gross moves per hour per crane ranged from 16.2 to 31.5 moves per hour in 2017 to 14.3 to 30.7 movesper hour in 2018. Crane availability ranged from 81.6 percent to 99.4 percent in 2017 to 75.7 percent to99.7 percent in 2018. Berth utilization was at 18.1 percent to 90.7 percent in 2017 and 19.2 percent to84.6 percent in 2018.
2017 Compared with 2016
Gross moves per hour per crane ranged from 17.3 to 32.6 moves per hour in 2016 to 16.2 to 31.5 movesper hour in 2017. Crane availability ranged from 79.4 percent to 99.1 percent in 2016 to 81.6 percent to99.4 percent in 2017. Berth utilization was at 16.3 percent to 76.5 percent in 2016 and 18.1 percent to90.7 percent in 2017.
The gross moves per hour per crane is a measure of crane productivity while working on vessels duringdischarging or loading operations. The crane availability relates to the efficiency of the maintenance ofthe crane. While berth utilization is a measure of how long the berth is utilized for a given period andthis indicator measures the efficiency of the operations and the productivity on the vessel.

42
6.3 Comparison of Operating Results for the Years Ended December 31, 2018 and 2017
6.3.1 TEU Volume
The below table presents the volume (in TEU) handled by the Group for the years ended December 31,2017 and 2018:
Table 6.3 Volume
For the Years Ended December 312017 2018 % Change
Asia 4,815,905 5,237,452 8.8Americas 2,855,580 2,935,281 2.8EMEA 1,481,973 1,563,888 5.5
9,153,458 9,736,621 6.4
The Group’s consolidated volume increased by 6.4 percent to 9,736,621 TEUs for the year endedDecember 31, 2018 from 9,153,458 TEUs handled for the same period in 2017 mainly due toimprovement in trade activities; new contracts with shipping lines and services; and contribution ofnew terminals, VICT, SPICTL and MITL. Excluding new terminals, consolidated volume would haveincreased by 2.6 percent in 2018.
Volume from the Asia segment, consisting of terminals in the Philippines, China, Indonesia, Pakistan,Australia and Papua New Guinea grew by 8.8 percent to 5,237,452 TEUs for the year ended December31, 2018 from 4,815,905 TEUs for the same period in 2017 mainly due to improvement in tradeactivities at most of the Philippine terminals; new services at YICT; and contribution of new terminals,VICT, SPICTL and MITL, tapered by decreased vessel calls at PICT. Excluding new terminals,volume from Asia operations would have increased by 1.5 percent in 2018. The Asia operationsaccounted for 52.6 percent and 53.8 percent of the consolidated volume for the years ended December31, 2017 and 2018, respectively.
Volume from the Americas segment, consisting of terminals in Brazil, Ecuador, Honduras and Mexicoincreased by 2.8 percent to 2,935,281 TEUs for the year ended December 31, 2018 from 2,855,580TEUs for the same period in 2017 mainly due to new contracts with shipping lines and services andincreased transshipments at CMSA; and higher trade volumes at OPC, slightly tapered by reducedtransshipments at CGSA. The Americas operations accounted for 31.2 percent and 30.1 percent of theconsolidated volume for the years ended December 31, 2017 and 2018, respectively.
Volume from the EMEA segment, consisting of terminals in Iraq, DR Congo, Poland, Georgia,Madagascar and Croatia, increased by 5.5 percent to 1,563,888 TEUs for the year endedDecember 31, 2018 from 1,481,973 TEUs for the same period in 2017 mainly due to new shippinglines and services at BCT; and increased trade volumes at AGCT, BICT and IDRC, slightly tapered bymarket decline in Iraq resulting to decrease in trade volumes at BGT. The EMEA operations accountedfor 16.2 percent and 16.1 percent of the Group’s consolidated volume for the years endedDecember 31, 2017 and 2018, respectively.

43
6.3.2 Total Income
Total income consists of: (1) Revenues from port operations, net of port authorities’ share in grossrevenues; (2) Interest income; (3) Foreign exchange gain; and (4) Other income.
The table below illustrates the consolidated total income for the years ended December 31, 2017 and2018:
Table 6.4 Total Income
For the Years Ended December 31(In thousands, except % change data) 2017 2018 % ChangeGross revenues from port operations US$1,244,438 US$1,385,785 11.4Port authorities’ share in gross revenues 190,527 203,105 6.6
Net revenues 1,053,911 1,182,680 12.2Interest income 21,853 24,089 10.2Foreign exchange gain 5,048 3,577 (29.1)Other income 23,606 28,291 19.8
US$1,104,418 US$1,238,637 12.2
For the year ended December 31, 2018, net revenues stood at 95.5 percent of the total consolidatedincome while interest income, foreign exchange gain and other income accounted for 1.9 percent,0.3 percent and 2.3 percent, respectively. For the same period in 2017, net revenues stood at95.4 percent of the total consolidated income while interest income, foreign exchange gain and otherincome accounted for 2.0 percent, 0.5 percent and 2.1 percent, respectively.
6.3.2.1 Gross Revenues from Port Operations
Gross revenues from port operations include fees received for cargo handling, wharfage, berthing,storage, and special services.
The below table illustrates the consolidated gross revenues for the years ended December 31, 2017 and2018:
Table 6.5 Gross Revenues from Port Operations
For the Years Ended December 31(In thousands, except % change data) 2017 2018 % ChangeAsia US$591,246 US$694,300 17.4Americas 401,382 407,071 1.4EMEA 251,810 284,414 12.9
US$1,244,438 US$1,385,785 11.4
The Group’s consolidated gross revenues from port operations increased by 11.4 percent toUS$1,385.8 million for the year ended December 31, 2018 from US$1,244.4 million for the sameperiod in 2017 mainly due to volume growth; new contracts with shipping lines and services; increasein revenues from non-containerized cargoes, storage and ancillary services; tariff adjustments; andcontribution of new terminals, VICT, SPICTL and MITL. Excluding new terminals, consolidated grossrevenues would have increased by 6.6 percent in 2018.
Gross revenues from the Asia segment reported a growth of 17.4 percent to US$694.3 million for theyear ended December 31, 2018 from US$591.2 million for the same period in 2017 mainly due tovolume growth at most of the Philippine terminals and YICT; and contribution of new terminals, VICT,SPICTL and MITL, partially tapered by lower trade volumes at PICT; and unfavorable translationimpact of the depreciation of PHP-based revenues at Philippine terminals. Excluding new terminals,gross revenues from Asia operations would have increased by 7.5 percent in 2018. The Asia operationscaptured 47.5 percent and 50.1 percent of the consolidated gross revenues for the years endedDecember 31, 2017 and 2018, respectively.

44
Gross revenues from the Americas segment increased by 1.4 percent to US$407.1 million for the yearended December 31, 2018 from US$401.4 million for the same period in 2017 mainly due to volumegrowth, higher storage revenues at CMSA; and higher storage and ancillary revenues combined withtariff adjustments at OPC, tapered by lower transshipments at CGSA; and unfavorable translationimpact of the depreciation of BRL-based revenues at TSSA. The Americas operations accounted for32.3 percent and 29.4 percent of the consolidated gross revenues for the years ended December31, 2017 and 2018, respectively.
Gross revenues from the EMEA segment increased by 12.9 percent to US$284.4 million for the yearended December 31, 2018 from US$251.8 million for the same period in 2017 primarily due to volumegrowth at AGCT, BICT and IDRC; increase in general cargoes and storage revenues at BGT; newshipping lines and services combined with increase in revenues from general cargoes at BCT; andfavorable translation impact of the appreciation of EUR-based revenues at MICTSL and AGCT. TheEMEA operations stood at 20.2 percent and 20.5 percent of the consolidated gross revenues for theyears ended December 31, 2017 and 2018, respectively.
6.3.2.2 Port Authorities’ Share in Gross Revenues
Port authorities’ share in gross revenues, which represents the variable fees paid to Port Authorities bycertain terminals, grew by 6.6 percent to US$203.1 million for the year ended December 31, 2018 fromUS$190.5 million for the same period in 2017 as a result of volume growth and stronger revenues atthese terminals.
6.3.2.3 Interest Income, Foreign Exchange Gain and Other Income
Consolidated interest income increased by 10.2 percent to US$24.1 million for the year endedDecember 31, 2018 from US$21.9 million for the same period in 2017 mainly due to higher interestincome earned from advances to SPIA, a joint venture associate.
Foreign exchange gain decreased by 29.1 percent to US$3.6 million for the year endedDecember 31, 2018 from US$5.0 million for the same period in 2017 mainly due to the unfavorabletranslation impact of certain currencies against US dollar. Foreign exchange gain mainly arises fromthe settlement and translation or restatement adjustments of foreign currency-denominated monetaryassets and liabilities.
Other income increased by 19.8 percent to US$28.3 million for the year ended December 31, 2018from US$23.6 million for the same period in 2017 mainly due to a non-recurring gain from pre-termination of interest rate swap; and reversal of accrued taxes and provisions at CMSA in 2018,tapered by the absence of the non-recurring gain from reimbursement of costs incurred in relation to thetermination of the sub-concession agreement at LICTSLE in 2017; and recognition of income tax creditat OPC in 2017. Other income includes the Group’s rental, dividend income, and other sundry incomeaccounts.

45
6.3.3 Total Expenses
The below table shows the breakdown of total expenses for 2017 and 2018.
Table 6.6 Total Expenses
For the Years Ended December 31(In thousands, except % change data) 2017 2018 % ChangeManpower costs US$207,583 US$217,154 4.6Equipment and facilities-related expenses 157,207 198,971 26.6Administrative and other operating expenses 111,109 124,334 11.9
Total cash operating expenses 475,899 540,459 13.6Depreciation and amortization 173,465 195,712 12.8Interest expense and financing charges on borrowings 100,413 101,310 0.9Interest expense on concession rights payable 33,106 37,545 13.4Equity in net loss of joint ventures and an associate 36,337 22,268 (38.7)Foreign exchange loss and others 36,935 32,488 (12.0)
US$856,155 US$929,782 8.6
Total cash operating expenses of the Group increased by 13.6 percent to US$540.5 million for the yearended December 31, 2018 from US$475.9 million for the same period in 2017 mainly due to start-upcosts at new terminals, VICT, SPICTL and MITL; increase in prices of fuel; higher fuel and powerconsumption driven by volume growth, and equipment rentals at certain terminals, partially tapered bycontinuous monitoring of cost optimization measures; and favorable translation impact of PHP-basedexpenses at Philippine terminals and BRL-based expenses at TSSA. Excluding new terminals,consolidated cash operating expenses would have increased by 3.0 percent in 2018.
6.3.3.1 Manpower Costs
Manpower costs increased by 4.6 percent to US$217.2 million for the year ended December 31, 2018from US$207.6 million for the same period in 2017 primarily due to cost contribution of new terminals,VICT, SPICTL and MITL; and government-mandated and contracted salary rate adjustments at certainterminals, partially tapered by continuous monitoring of cost optimization measures. Excluding newterminals, consolidated manpower costs would have decreased by 1.3 percent in 2018.
Manpower costs accounted for 43.6 percent and 40.2 percent of consolidated cash operating expensesfor the years ended December 31, 2017 and 2018, respectively.
6.3.3.2 Equipment and Facilities-related Expenses
Equipment and facilities-related expenses consist mainly of repairs and maintenance costs of portequipment and facilities, fixed port leases, power and light, tools expenses, equipment rentals, and fuel,oil and lubricants.
Equipment and facilities-related expenses increased by 26.6 percent to US$199.0 million for the yearended December 31, 2018 from US$157.2 million for the same period in 2017 mainly due to costcontribution of new terminals, VICT, SPICTL and MITL; increase in prices of fuel; and higher fuel andpower consumption driven by volume growth, and equipment rentals at certain terminals. Excludingnew terminals, consolidated equipment and facilities-related expenses would have increased by 7.9percent in 2018.
Equipment and facilities-related expenses represented 33.0 percent and 36.8 percent of consolidatedcash operating expenses for the years ended December 31, 2017 and 2018, respectively.
46
6.3.3.3 Administrative and Other Operating Expenses
Administrative and other operating expenses increased by 11.9 percent to US$124.3 million for theyear ended December 31, 2018 from US$111.1 million for the same period in 2017 mainly due to costcontribution of new terminals, VICT, SPICTL and MITL; increase in information technology-relatedcosts; and increase in legal fees, partially tapered by continuous monitoring of cost optimizationsmeasures. Excluding new terminals, consolidated administrative and other operating expenses wouldhave increased by 5.4 percent in 2018.
Administrative and other operating expenses stood at 23.4 percent and 23.0 percent of consolidatedcash operating expenses for the years ended December 31, 2017 and 2018, respectively.
6.3.3.4 Depreciation and Amortization
Depreciation and amortization expense increased by 12.8 percent to US$195.7 million for the yearended December 31, 2018 from US$173.5 million for the same period in 2017 mainly due tocontribution of new terminals, VICT, SPICTL and MITL; and higher depreciation arising fromexpansion projects at ICTSI Iraq, CMSA and OPC.
6.3.3.5 Interest and Financing Charges on Borrowings
Interest and financing charges on borrowings increased marginally by 0.9 percent to US$101.3 millionfor the year ended December 31, 2018 from US$100.4 million for the same period in 2017 primarilydue to lower capitalized borrowing costs on qualifying assets; and new loans, partially tapered byinterest reduction from pre-termination of the Project Finance Facility at CMSA. Capitalizedborrowing costs on qualifying assets amounted to US$10.4 million in 2017 at a capitalization rateranging from 2.4 percent to 6.7 percent and US$4.3 million in 2018 at a capitalized rate ranging from3.5 percent to 7.0 percent.
6.3.3.6 Interest Expense on Concession Rights Payable
Interest on concession rights payable increased by 13.4 percent to US$37.5 million for the year endedDecember 31, 2018 from US$33.1 million for the same period in 2017 mainly due to the concessionright liabilities recognized at new terminals, SPICTL and MITL.
6.3.3.7 Equity in Net Loss of Joint Ventures and An Associate
Equity in net loss of joint ventures and an associate decreased by 38.7 percent to US$22.3 million forthe year ended December 31, 2018 from US$36.3 million for the same period in 2017 mainly due tothe decrease in the Company’s share in net loss at SPIA driven by volume growth and positiveEBITDA. Equity in net loss of joint ventures and an associate in 2018 is net of the Group’s share innet income of MNHPI, a 34.83%-owned associate.
6.3.3.8 Foreign Exchange Loss and Others
Foreign exchange loss and others decreased to US$32.5 million for the year endedDecember 31, 2018 from US$36.9 million for the same period in 2017 mainly due to lowerrestructuring and separation costs at certain terminals, partially tapered by non-recurring impairmentcharge on the goodwill of DIPSSCOR in 2018; and write-off of debt issue cost from pre-termination ofproject finance facility at CMSA in 2018. Foreign exchange loss mainly results from the translation orrestatement as well as from the settlement of foreign currency-denominated monetary assets andliabilities.
47
6.3.4 EBITDA and EBIT
Consolidated EBITDA grew by 11.1 percent to US$642.2 million for the year endedDecember 31, 2018 from US$578.0 million for the same period in 2017 mainly due to strong revenuescombined with positive contribution of new terminals, SPICTL and MITL, partially tapered by thehigher fixed port lease expense at VICT. Excluding the new terminals, consolidated EBITDA wouldhave increased by 9.0 percent in 2018. EBITDA margin slightly decreased to 46.3 percent in 2018from 46.4 percent in 2017.
Meanwhile, consolidated EBIT increased by 10.4 percent to US$446.5 million for the year endedDecember 31, 2018 from US$404.5 million for the same period in 2017 mainly due to strongerEBITDA, tapered by higher depreciation charges. Excluding the new terminals, consolidated EBITwould have increased by 10.7 percent in 2017. EBIT margin decreased to 32.2 percent in 2018 from32.5 percent in 2017.
6.3.5 Income Before Income Tax and Provision for Income Tax
Consolidated income before income tax increased by 24.4 percent to US$308.9 million for the yearended December 31, 2018 from US$248.3 million for the same period in 2017 as a result of strongoperating income; decrease in equity in net loss at SPIA; and lower restructuring and separation costs,tapered by increase in depreciation charges; and the impact of the non-recurring items. Excluding newterminals and the non-recurring items, consolidated income before income tax would have increased by23.3 percent in 2018. The ratio of income before income tax to consolidated gross revenues stood at19.9 percent and 22.3 percent in 2017 and 2018, respectively.
Consolidated provision for current and deferred income taxes increased to US$59.0 million for the yearended December 31, 2018 from US$40.5 million for the same period in 2017 mainly due to highertaxable income at most of the terminals. Effective income tax rate in 2017 and 2018 stood at16.3 percent and 19.1 percent, respectively.
6.3.6 Net Income
Consolidated net income increased by 20.3 percent to US$249.8 million for the year endedDecember 31, 2018 from US$207.7 million for the same period in 2017. Excluding new terminals andthe non-recurring items, consolidated net income would have increased by 21.8 percent in 2018.
The ratio of consolidated net income to gross revenues stood at 16.7 percent and 18.0 percent in 2017and 2018, respectively.
Consolidated net income attributable to equity holders grew by 21.6 percent to US$221.5 million forthe year ended December 31, 2018 from US$182.1 million for the same period in 2017. Excluding newterminals and the non-recurring items, net income attributable to equity holders would have increasedby 23.0 percent in 2018.
Basic and diluted earnings per share increased to US$0.078 in 2018 from US$0.069 in 2017 and toUS$0.077 in 2018 from US$0.069 in 2017 the same period in 2017, respectively, mainly due to highernet income, partially tapered by increase in distributions to holders of perpetual capital securities fromissuance of senior guaranteed perpetual capital securities in January 2018.

48
6.4 Comparison of Operating Results for the Years Ended December 31, 2017 and 2016
6.4.1. TEU Volume
The below table presents the volume (in TEU) handled by the Group for the years ended December 31,2016 and 2017:
Table 6.7 Volume
For the Years Ended December 312016 2017 % Change
Asia 4,552,881 4,815,905 5.8Americas 3,004,690 2,855,580 (5.0)EMEA 1,131,792 1,481,973 30.9
8,689,363 9,153,458 5.3
The Group’s consolidated volume increased by 5.3 percent from 8,689,363 TEUs for the year endedDecember 31, 2016 to 9,153,458 TEUs handled for the same period in 2017 mainly due to continuousimprovement in trade activities and continuous volume ramp-up at certain terminals; and contributionof new terminals, IDRC and VICT, partially tapered by decrease in vessel calls and lowertransshipments at CGSA. Excluding new terminals, consolidated volume would have increased by 3.6percent in 2017.
Volume from the Asia segment, consisting of terminals in the Philippines, China, Indonesia, Pakistanand Australia, increased by 5.8 percent from 4,552,881 TEUs for the year ended December 31, 2016 to4,815,905 TEUs for the same period in 2017 mainly due to continuous improvement in trade activitiesat most of the Philippine Terminals and YICT; and contribution of a new terminal, VICT, tapered bydecreased vessel calls and transshipments at PICT. Excluding VICT, volume from Asia operationswould have increased by 3.8 percent in 2017. The Asia operations accounted for 52.4 percent and52.6 percent of the consolidated volume for the years ended December 31, 2016 and 2017, respectively.
Volume from the Americas segment, consisting of terminals in Brazil, Ecuador, Honduras and Mexico,decreased by 5.0 percent from 3,004,690 TEUs for the year ended December 31, 2016 to 2,855,580TEUs for the same period in 2017 mainly due to reduced vessel calls and lower transshipments atCGSA, tapered by increased trade volumes and new services at CMSA; and marginal economicrecovery and improvement in trade activities at TSSA. The Americas operations accounted for34.6 percent and 31.2 percent of the consolidated volume for the years ended December 31, 2016 and2017, respectively.
Volume from the EMEA segment, consisting of terminals in Iraq, DR Congo, Poland, Georgia,Madagascar and Croatia, reported a 30.9 percent growth from 1,131,792 TEUs for the year endedDecember 31, 2016 to 1,481,973 TEUs for the same period in 2017 mainly due to continuous growthand ramp-up at ICTSI Iraq; continuous improvement in trade activities in the region resulting todouble-digit growth at all EMEA terminals; and contribution of a new terminal, IDRC. ExcludingIDRC, volume from EMEA operations would have increased by 26.3 percent in 2017. The EMEAoperations accounted for 13.0 percent and 16.2 percent of the Group’s consolidated volume for theyears ended December 31, 2016 and 2017, respectively.

49
6.4.2. Total Income
Total income consists of: (1) Revenues from port operations, net of port authorities’ share in grossrevenues; (2) Interest income; (3) Foreign exchange gain; and (4) Other income.
The table below illustrates the consolidated total income for the years ended December 31, 2016 and2017:
Table 6.8 Total Income
For the Years Ended December 31(In thousands, except % change data) 2016 2017 % ChangeGross revenues from port operations US$1,128,395 US$1,244,438 10.3Port authorities’ share in gross revenues 183,702 190,527 3.7
Net revenues 944,693 1,053,911 11.6Interest income 17,651 21,853 23.8Foreign exchange gain 4,659 5,048 8.3Other income 13,393 23,606 76.3
US$980,396 US$1,104,418 12.7
For the year ended December 31, 2017, net revenues stood at 95.4 percent of the total consolidatedincome while interest income, foreign exchange gain and other income accounted for 2.0 percent,0.5 percent and 2.1 percent, respectively. For the same period in 2016, net revenues stood at96.3 percent of the total consolidated income while interest income, foreign exchange gain and otherincome accounted for 1.8 percent, 0.5 percent and 1.4 percent, respectively.
6.4.2.1. Gross Revenues from Port Operations
Gross revenues from port operations include fees received for cargo handling, wharfage, berthing,storage, and special services.
The below table illustrates the consolidated gross revenues for the years ended December 31, 2016 and2017:
Table 6.9 Gross Revenues from Port Operations
For the Years Ended December 31(In thousands, except % change data) 2016 2017 % ChangeAsia US$581,405 US$591,246 1.7Americas 387,423 401,382 3.6EMEA 159,567 251,810 57.8
US$1,128,395 US$1,244,438 10.3
The Group’s consolidated gross revenues from port operations increased by 10.3 percent fromUS$1,128.4 million for the year ended December 31, 2016 to US$1,244.4 million for the same periodin 2017 mainly due to volume growth; tariff rate adjustments at certain terminals; new contracts withshipping lines and services; and contribution of new terminals, IDRC and VICT. Excluding newterminals, consolidated gross revenues would have increased by 6.0 percent in 2017.
Gross revenues from the Asia segment increased by 1.7 percent from US$581.4 million for the yearended December 31, 2016 to US$591.2 million for the same period in 2017 mainly due to volumegrowth at most of the Philippine terminals and YICT; and contribution of new terminal, VICT, taperedby unfavorable translation impact of the depreciation of PHP-based revenues at Philippine terminals.Excluding VICT, gross revenues from Asia operations would have decreased by 0.3 percent in 2017.The Asia operations captured 51.5 percent and 47.5 percent of the consolidated gross revenues for theyears ended December 31, 2016 and 2017, respectively.
Gross revenues from the Americas segment increased by 3.6 percent from US$387.4 million for theyear ended December 31, 2016 to US$401.4 million for the same period in 2017 mainly due to volumegrowth at CMSA; tariff rate adjustments at CGSA; and improvement in trade activities combined with

50
favorable translation impact of the appreciation of Brazilian Reais (BRL) at TSSA, partially tapered bydecreased vessel calls at CGSA. The Americas operations accounted for 34.3 percent and 32.3 percentof the consolidated gross revenues for the years ended December 31, 2016 and 2017, respectively.
Gross revenues from the EMEA segment grew by 57.8 percent from US$159.6 million for the yearended December 31, 2016 to US$251.8 million for the same period in 2017 primarily due to continuousvolume growth at ICTSI Iraq; continuous improvement in trade activities in the region; andcontribution of a new terminal, IDRC. Excluding IDRC, gross revenues from EMEA operations wouldhave increased by 37.6 percent in 2017. The EMEA operations stood at 14.2 percent and 20.2 percentof the consolidated gross revenues for the years ended December 31, 2016 and 2017, respectively.
6.4.2.2 Port Authorities’ Share in Gross Revenues
Port authorities’ share in gross revenues, which represents the variable fees paid to Port Authorities bycertain terminals, grew by 3.7 percent from US$183.7 million for the year ended December 31, 2016 toUS$190.5 million for the same period in 2017 as a result of volume growth and stronger revenues atthese terminals.
6.4.2.3 Interest Income, Foreign Exchange Gain and Other Income
Consolidated interest income increased by 23.8 percent from US$17.7 million for the year endedDecember 31, 2016 to US$21.9 million for the same period in 2017 mainly due to higher interestincome earned from advances to SPIA, a joint venture associate.
Foreign exchange gain increased by 8.3 percent from US$4.7 million for the year endedDecember 31, 2016 to US$5.0 million for the same period in 2017 mainly due to the favorabletranslation impact of certain currencies against US dollar. Foreign exchange gain mainly arises fromthe settlement and translation or restatement adjustments of foreign currency-denominated monetaryassets and liabilities.
Other income increased from US$13.4 million for the year ended December 31, 2016 toUS$23.6 million for the same period in 2017 mainly due to the one-time gain from reimbursement ofcosts related to the terminated sub-concession agreement at LICTSLE; and recognition of income taxcredit at OPC. Other income includes the Group’s rental, dividend income, and other sundry incomeaccounts.
6.4.3. Total Expenses
The below table shows the breakdown of total expenses for 2016 and 2017.
Table 6.10 Total Expenses
For the Years Ended December 31(In thousands, except % change data) 2016 2017 % ChangeManpower costs US$192,536 US$207,583 7.8Equipment and facilities-related expenses 119,877 157,207 31.1Administrative and other operating expenses 107,201 111,109 3.6
Total cash operating expenses 419,614 475,899 13.4Depreciation and amortization 147,830 173,465 17.3Interest expense and financing charges on borrowings 75,050 100,413 33.8Equity in net loss of a joint venture and an associate 5,572 36,337 552.1Interest expense on concession rights payable 34,050 33,106 (2.8)Foreign exchange loss and others 41,239 36,935 (10.4)
US$723,355 US$856,155 18.4
Total cash operating expenses of the Group increased by 13.4 percent from US$419.6 million for theyear ended December 31, 2016 to US$475.9 million for the same period in 2017 mainly due to costcontribution of new terminals, IDRC and VICT; higher fuel and power consumption as a result ofincrease in volume; increase in fuel prices and power tariff rate adjustments at certain terminals; and

51
unfavorable translation impact of BRL at TSSA, tapered by cost optimization measures implemented;and favorable translation impact of PHP-based expenses at Philippine terminals. Excluding newterminals, consolidated cash operating expenses would have increased marginally by 0.6 percent in2017.
6.4.3.1. Manpower Costs
Manpower costs increased by 7.8 percent from US$192.5 million for the year ended December 31,2016 to US$207.6 million for the same period in 2017 primarily due to contribution of new terminals,IDRC and VICT; government-mandated and contracted salary rate adjustments at certain terminals; andunfavorable translation impact of BRL at TSSA, partially tapered by cost optimization measuresimplemented; and favorable translation impact of PHP-based costs at Philippine terminals. Excludingnew terminals, consolidated manpower costs would have increased marginally by 0.8 percent in 2017.
Manpower costs accounted for 45.9 percent and 43.6 percent of consolidated cash operating expensesfor the years ended December 31, 2016 and 2017, respectively.
6.4.3.2. Equipment and Facilities-related Expenses
Equipment and facilities-related expenses consist mainly of repairs and maintenance costs of portequipment and facilities, fixed port leases, power and light, tools expenses, equipment rentals, and fuel,oil and lubricants.
Equipment and facilities-related expenses increased by 31.1 percent from US$119.9 million for the yearended December 31, 2016 to US$157.2 million for the same period in 2017 mainly due to costcontribution of new terminals, IDRC and VICT; fixed port lease expense at VICT; increase in fuelprices and power tariff rate adjustments at certain terminals; and unfavorable translation impact of BRLat TSSA, tapered by cancellation of port lease at ICTSI Oregon as a result of pre-termination of leaseagreement; and favorable translation impact of PHP-based expenses at Philippine terminals. Excludingnew terminals, consolidated equipment and facilities-related expenses would have stayed flat in 2017.
Equipment and facilities-related expenses represented 28.6 percent and 33.0 percent of consolidatedcash operating expenses for the years ended December 31, 2016 and 2017, respectively.
6.4.3.3. Administrative and Other Operating Expenses
Administrative and other operating expenses increased by 3.6 percent from US$107.2 million for theyear ended December 31, 2016 to US$111.1 million for the same period in 2017 mainly due tocontribution of new terminals, IDRC and VICT; increase in professional fees; and unfavorabletranslation impact of BRL at TSSA, tapered by reduction in insurance costs, documentary stamp taxes,travel and other office expenses in relation to cost optimization measures implemented; and favorabletranslation impact of Philippine-based expenses at Philippine terminals. Excluding new terminals,consolidated administrative and other operating expenses would have increased marginally by 0.7percent in 2017.
Administrative and other operating expenses stood at 25.5 percent and 23.4 percent of consolidatedcash operating expenses for the years ended December 31, 2016 and 2017, respectively.
6.4.3.4. Depreciation and Amortization
Depreciation and amortization expense increased by 17.3 percent from US$147.8 million for the yearended December 31, 2016 to US$173.5 million for the same period in 2017 mainly due to higherdepreciation arising from the depreciation of port facilities and equipment at the new terminals, IDRCand VICT; and expansion projects at ICTSI Iraq and CGSA.

52
6.4.3.5. Interest and Financing Charges on Borrowings
Interest and financing charges on borrowings increased by 33.8 percent from US$75.1 million for theyear ended December 31, 2016 to US$100.4 million for the same period in 2017 primarily due tohigher average loan balance and lower capitalized borrowing costs on qualifying assets. Capitalizedborrowing costs on qualifying assets amounted to US$24.3 million in 2016 at a capitalization rate of6.5 percent and US$10.4 million in 2017 at a capitalization rate ranging from 2.4 percent to 6.7 percent.
6.4.3.6. Equity in Net Loss of A Joint Venture and An Associate
Equity in net loss of a joint venture and an associate increased from US$5.6 million for the year endedDecember 31, 2016 to US$36.3 million for the same period in 2017 due to the increase in theCompany’s share in net loss at SPIA arising from start-up costs as SPIA started operations in January2017. Equity in net loss of a joint venture and an associate is net of the Group’s share in net income ofMNHPI, a 34.83%-owned associate, of US$0.4 million from October 30, 2017 to December 31, 2017.
6.4.3.7. Foreign Exchange Loss and Others
Foreign exchange loss and others decreased from US$41.2 million for the year endedDecember 31, 2016 to US$36.9 million for the same period in 2017 primarily due to the absence ofnon-recurring charge on pre-termination of lease agreement at ICTSI Oregon amounting to US$23.4million in 2016; and recognition of probable loss on non-trade advances and solidarity contribution onequity at CGSA in 2016, tapered by restructuring and separation costs at certain terminals in 2017; andwrite-off of costs incurred associated with the securing of the revolving credit facility, uponcancellation of the said facility in June 2017. Foreign exchange loss mainly results from the translationor restatement as well as from the settlement of foreign currency-denominated monetary assets andliabilities.
6.4.4. EBITDA and EBIT
Consolidated EBITDA grew by 10.1 percent from US$525.1 million for the year endedDecember 31, 2016 to US$578.0 million for the same period in 2017 primarily due to strong volumeand revenues; combined with cost optimization measures implemented; and positive contribution ofnew terminal, IDRC, tapered by the start-up costs and fixed port lease expense at VICT. Excluding thenew terminals, consolidated EBITDA would have increased by 11.1 percent in 2017. EBITDA marginslightly decreased from 46.5 percent in 2016 to 46.4 percent in 2017.
Meanwhile, consolidated EBIT increased by 7.2 percent from US$377.2 million for the year endedDecember 31, 2016 to US$404.5 million for the same period in 2017 mainly due to stronger EBITDA,tapered by higher depreciation charges. Excluding the new terminals, consolidated EBIT would haveincreased by 13.6 percent in 2017. EBIT margin decreased from 33.4 percent in 2016 to 32.5 percentin 2017.
6.4.5. Income Before Income Tax and Provision for Income Tax
Consolidated income before income tax decreased from US$257.0 million for the year ended December31, 2016 to US$248.3 million for the same period in 2017 primarily due to higher depreciation charges;higher interest and financing charges; restructuring and separation costs; and increase in equity in netloss of a joint venture, tapered by strong operating income; non-recurring gain from reimbursement ofcosts related to the terminated sub-concession agreement at LICTSLE in 2017; and absence of a non-recurring charge on pre-termination of lease agreement at ICTSI Oregon in 2016. Excluding newterminals; equity in net loss of a joint venture and an associate; and the non-recurring items,consolidated income before income tax would have increased by 18.2 percent in 2017. The ratio ofincome before income tax to consolidated gross revenues stood at 22.8 percent and 19.9 percent in2016 and 2017, respectively.

53
Consolidated provision for current and deferred income taxes decreased from US$63.6 million for theyear ended December 31, 2016 to US$40.5 million for the same period in 2017 mainly due to incometax exemption of OPC which was finalized in the first quarter of 2017. Effective income tax rate in2016 and 2017 stood at 24.7 percent and 16.3 percent, respectively.
6.4.6. Net Income
Consolidated net income increased by 7.4 percent from US$193.5 million for the year endedDecember 31, 2016 to US$207.7 million for the same period in 2017. Excluding new terminals; equityin net loss of a joint venture and an associate; and the non-recurring items, consolidated net incomewould have increased by 22.6 percent in 2017. The ratio of consolidated net income to gross revenuesstood at 17.1 percent and 16.7 percent in 2016 and 2017, respectively.
Consolidated net income attributable to equity holders increased by 1.2 percent from US$180.0 millionfor the year ended December 31, 2016 to US$182.1 million for the same period in 2017. Excluding newterminals; equity in net loss of a joint venture and an associate; and the non-recurring items, net incomeattributable to equity holders would have increased by 23.6 percent in 2017.
Basic and diluted earnings per share increased from US$0.066 in 2016 to US$0.069 in 2017 andUS$0.065 in 2016 to US$0.069 in 2017, respectively.
6.5 Trends, Events or Uncertainties Affecting Recurring Revenues and Profits
The Group is exposed to a number of trends, events or uncertainties which can affect its recurringrevenues and profits. These include levels of general economic activity and containerized trade volumein countries where it operates, as well as certain cost items, such as labor, fuel and power. In addition,the Group operates in a number of jurisdictions other than the Philippines and collects revenues invarious currencies. Continued appreciation of the US dollar relative to other major currencies,particularly the Philippine peso, Brazilian Reais, Mexican peso, Australian Dollars and the Euro, mayhave a negative impact on the Group’s reported levels of revenues and profits.
6.6 Financial Position
Table 6.11 Consolidated Balance Sheets
As of December 31(In thousands, except % change data) 2016 2017 2018 % Change % Change
2016 vs 2017 2017 vs 2018Total assets US$4,182,953 US$4,370,687 US$4,702,932 4.5 7.6Current assets 515,960 499,076 673,439 (3.3) 34.9Total equity 1,766,080 1,872,568 2,229,200 6.0 19.0Total equity attributable to equity
holders of the parent 1,624,397 1,707,930 2,063,696 5.1 20.8Total interest-bearing debt 1,381,364 1,493,605 1,307,053 8.1 (12.5)Current liabilities 446,547 401,320 438,712 (10.1) 9.3Total liabilities 2,416,873 2,498,119 2,473,733 3.4 (1.0)
Current assets/total assets 12.3% 11.4% 14.3%Current ratio 1.16 1.24 1.54Debt-equity ratio1 0.78 0.80 0.59
1 Debt includes interest-bearing debt. Equity means Total Equity as shown in the consolidated balance sheets.
Total assets increased by 7.6 percent to US$4.7 billion as of December 31, 2018 mainly due toinvestments in capital expenditures, which include the on-going rehabilitation and development worksat OPC; expansion projects at ICTSI Iraq, CMSA and MICT; terminal construction at CGT; andrecognition of concession rights, port equipment acquisitions and infrastructure development atSPICTL and MITL. These investments were funded mainly by cash generated from the Group’soperations and debt financing. Non-current assets stood at 88.6 percent and 85.7 percent of the totalconsolidated assets as of December 31, 2017 and December 31, 2018, respectively.

54
Current assets increased by 34.9 percent to US$673.4 million as of December 31, 2018 fromUS$499.1 million as of December 31, 2017 primarily due to net proceeds from issuance of seniorguaranteed perpetual capital securities in January 2018; and strong cash inflows generated fromoperations, tapered by continuous deployment of cash to fund capital expenditures; pre-termination ofproject finance facility at CMSA and repayment of loan at Parent Company. Current assets accountedfor 11.5 percent and 14.3 percent of the total consolidated assets of the Group as of December 31, 2017and December 31, 2018, respectively. Current ratio stood at 1.24 and 1.54 as of December 31, 2017and December 31, 2018, respectively.
Total equity increased by 19.0 percent to US$2.2 billion as of December 31, 2018 primarily due to netincome generated for the period; and issuance of a $400.0 million senior guaranteed perpetual capitalsecurities in January 2018, tapered by payment of dividends; distributions to holders of perpetualcapital securities; increase in other comprehensive loss as a result of net unfavorable exchangedifferences on translation of foreign operations’ financial statements; and purchase of treasury shares in2018. The proceeds from the issuance of a $400.0 million senior guaranteed perpetual capital securitiesin January 2018 will be used for the financing of acquisitions and capital expenditures and for generalcorporate purposes.
Total liabilities decreased by 1.0 percent to US$2.5 billion as of December 31, 2018 mainly due to pre-termination of project finance facility at CMSA, tapered by recognition of concession rights payable atSPICTL and MITL; drawdown from project finance facility at VICT; and loan availments at IDRC andOPC. Financial leverage, the ratio of total interest-bearing debt to total assets, stood at 34.2 percent and27.8 percent as of December 31, 2017 and December 31, 2018, respectively.
Meanwhile, current liabilities increased by 9.3 percent to US$438.7 million as of December 31, 2018mainly due to higher accounts payables arising from port equipment acquisitions at MICT and loanavailments at SPICTL and MITL, tapered by repayment of loan at Parent Company.
6.6.1 Material Variances Affecting the Balance Sheet
Balance sheet accounts as of December 31, 2018 with variances of plus or minus 5.0 percent againstDecember 31, 2017 balances are discussed, as follows:
Noncurrent Assets1. Intangible assets increased by 8.3 percent to US$2.0 billion as of December 31, 2018 mainly due to
recent acquisitions of port equipment and infrastructure development and recognition of concessionrights assets at SPICTL and MITL; on-going rehabilitation and development works at OPC; andexpansion projects at ICTSI Iraq and MICT.
2. Property and equipment decreased by 5.4 percent to US$1.4 billion as of December 31, 2018 due todepreciation expense recognized during the period, tapered by expansion project at CMSA; andterminal construction at CGT.
3. Investment properties decreased by 7.1 percent to US$7.4 million as of December 31, 2018 mainlydue to depreciation expense recognized during the period.
4. Deferred tax assets increased by 42.5 percent to US$158.3 million as of December 31, 2018 mainlydue to higher deferred income tax benefit from net operating loss carry-over at VICT; andunrealized foreign exchange losses, mainly Parent Company.
5. Other noncurrent assets increased by 41.2 percent to US$138.9 million as of December 31, 2018mainly due to advances to contractors related to expansion projects at CMSA and MICT; andincrease in deposits for the acquisition of investments.
Current Assets6. Cash and cash equivalents increased by 60.0 percent to US$447.1 million as of
December 31, 2018 due to net proceeds from issuance of senior guaranteed perpetual capitalsecurities in January 2018; strong cash inflows generated from operations, tapered by continuousdeployment of cash to fund capital expenditures; pre-termination of project finance facility atCMSA; and repayment of loan at Parent Company during the period.

55
7. Receivables increased by 6.7 percent to US$120.4 million as of December 31, 2018 primarily dueto contributions of new terminals, VICT, SPICTL and MITL.
8. Derivative assets increased by 38.1 percent to US$0.4 million as of December 31, 2018 mainly dueto gain on mark-to-market valuation from interest rate swap at CGSA.
Equity9. Treasury shares increased to US$58.1 million as of December 31, 2018 mainly as a result of
acquisition of 25,039,790 treasury shares in 2018.10. Retained earnings increased by 7.7 percent to US$882.8 million as of December 31, 2018
mainly due to net income attributable to equity holders of the parent for the year amounting toUS$221.5 million, tapered by declaration of dividends and distributions to holders of perpetualcapital securities amounting to US$97.6 million and US$60.3 million, respectively.
11. Perpetual capital securities increased by 51.5 percent to US$1.2 billion as of December 31, 2018due to RCBV’s issuance of a US$400.0 million 5.875 percent fixed-for-life senior guaranteedperpetual capital securities in January 2018.
12. Other comprehensive loss increased by 22.7 percent to US$314.8 million as ofDecember 31, 2018 due to net unfavorable exchange differences on translation of foreignoperations’ financial statements.
Noncurrent Liabilities13. Noncurrent portion of long-term debt decreased by 13.5 percent to US$1.2 billion as of
December 31, 2018 mainly due to pre-termination of project finance facility at CMSA, partiallytapered by loan availments at IDRC and OPC.
14. Noncurrent portion of concession rights payable increased by 12.9 percent to US$530.7 million asof December 31, 2018 mainly due to recognition of concession right liabilities at SPICTL andMITL.
15. Deferred tax liabilities increased by 29.6 percent to US$104.3 million as ofDecember 31, 2018 mainly due to the income tax effect of unrealized mark-to-market gain onderivative instruments; accelerated depreciation; translation difference between functionaland local currency; and difference in depreciation and amortization periods of portinfrastructure classified as concession rights.
16. Other noncurrent liabilities increased by 32.2 percent to US$179.5 million as ofDecember 31, 2018 arising mainly from accrual of lease expense at VICT.
Current Liabilities17. Loans payable decreased by 41.6 percent to US$35.7 million as of December 31, 2018 due to
repayment of loan at Parent Company, tapered by loan availments at SPICTL and MITL.18. Accounts payable and other current liabilities increased by 11.8 percent to US$309.3 million as of
December 31, 2018 primarily due to port equipment acquisitions at MICT.19. Current portion of long-term debt increased to US$50.8 million as of December 31, 2018 primarily
due to increase in term loans scheduled for repayment in the next twelve months at certainterminals.
20. Current portion of concession rights payable increased by 6.7 percent to US$10.6 million as ofDecember 31, 2018 arising from higher concession fees scheduled for payment in the next twelvemonths.
21. Income tax payable increased by 7.0 percent to US$31.6 million as of December 31, 2018 mainlydue to contribution of new terminals, SPICTL and MITL and higher taxable income at MICT.
22. Derivative liabilities decreased by 68.2 percent to US$0.6 million as of December 31, 2018 mainlydue to pre-termination of interest rate swap at CMSA.

56
Balance sheet accounts as of December 31, 2017 with variances of plus or minus 5.0 percent againstDecember 31, 2016 balances are discussed, as follows:
Noncurrent Assets23. Property and equipment increased by 5.4 percent to US$1.5 billion as of December 31, 2017 due to
increase in capital expenditures arising from completion of port facilities at IDRC, first phase andsecond phase at VICT; expansion project at CMSA; and ongoing terminal construction at CGT.
24. Investment properties increased by 28.1 percent to US$8.0 million as of December 31, 2017 mainlydue to land acquisition at BCT.
25. Deferred tax assets increased by 22.7 percent to US$111.1 million as of December 31, 2017 mainlydue to higher deferred income tax benefit from unrealized foreign exchange loss, mainly ParentCompany.
26. Investments in and advances to a joint venture and associate increased by 30.2 percent to US$382.2million as of December 31, 2017 due to acquisition of 34.83% stake in MNHPI and advancesgranted to SPIA.
27. Other noncurrent assets decreased by 7.5 percent to US$98.4 million mainly due to decrease inadvances to contractors related to on-going rehabilitation work and development at OPC andcompletion of port facilities at IDRC; and decrease in derivate assets due to loss on mark-to-marketvaluation from interest rate swap at VICT, tapered by increase in deposits for the acquisition ofinvestments.
Current Assets28. Cash and cash equivalents decreased by 14.0 percent to US$279.4 million as of
December 31, 2017 mainly due to continuous deployment of cash to fund the Group’s capitalexpenditures; settlement of lease liability at VICT; and acquisition of 34.83% stake in MNHPI,tapered by strong cash inflows generated from operations and net proceeds from debt financing.
29. Receivables increased by 9.7 percent to US$112.9 million as of December 31, 2017 primarily dueto strong revenues at CMSA, ICTSI Iraq, MICTSL and contributions of new terminals, VICT andIDRC.
30. Spare parts and supplies increased by 6.4 percent to US$35.7 million as of December 31, 2017primarily as a result of acquisition of spare parts at VICT.
31. Prepaid expenses and other current assets increased by 30.2 percent to US$70.8 million as ofDecember 31, 2017 mainly due to tax credit recognized by OPC in 2017 and timing of utilization ofprepaid taxes, particularly at Parent Company and CGSA.
32. Derivative assets increased to US$0.3 million as of December 31, 2017 due to gain on mark-to-market valuation from cross currency swap at MICTSL.
Equity33. Treasury shares decreased by 15.9 percent to US$15.1 million as of December 31, 2017 mainly as a
result of sale of 10,000,000 treasury shares in 2017.34. Retained earnings increased by 5.2 percent to US$819.6 million as of December 31, 2017
mainly due to net income attributable to equity holders of the parent for the year amounting toUS$182.1 million, tapered by payment of dividends and distributions to holders of perpetualcapital securities amounting to US$100.3 million and US$41.6 million, respectively.
35. Other comprehensive loss decreased by 10.1 percent to US$256.6 million as ofDecember 31, 2017 due to net favorable exchange differences on translation of foreign operations’financial statements.
36. Equity attributable to non-controlling interests increased by 16.2 percent to US$164.6 million asof December 31, 2017 mainly due to the recognition of the non-controlling interest’s share in netincome.

57
Noncurrent Liabilities37. Long-term debt increased by 6.3 percent to US$1.4 billion as of December 31, 2017 mainly
due to the drawdown from project finance facilities at VICT; loan availment at OPC, tapered bysettlement of the Group’s Revolving Credit Facility during the period.
38. Deferred tax liabilities increased by 12.8 percent to US$80.5 million as ofDecember 31, 2017 mainly due to the income tax effect of unrealized mark-to-market gain oninterest rate swap and capitalized borrowing costs, and translation of non-monetary assets toUS dollar.
39. Pension and other non-current liabilities increased by 49.3 percent to US$135.8 million as ofDecember 31, 2017 arising mainly from accrual of lease expense at VICT.
Current Liabilities40. Loans payable grew by 67.2 percent to US$61.2 million as of December 31, 2017 mainly due to a
short-term loan availment at Parent Company.41. Accounts payable and other current liabilities decreased by 20.5 percent to US$276.6 million as of
December 31, 2017 primarily due to settlement of lease liability at VICT.42. Current portion of long-term debt and debt securities increased by 19.8 percent to US$22.1 million
as of December 31, 2017 due to increase in maturing term loans of subsidiaries in 2018.43. Current portion of concession rights payable increased by 13.5 percent to US$9.9 million as of
December 31, 2017 arising from higher concession fees scheduled for payment at Parent Company,CGSA and MICTSL in 2018.
44. Income tax payable decreased by 8.6 percent to US$29.5 million as of December 31, 2017 mainlydue to income tax payments and income tax exemption at OPC.
45. Derivative liabilities decreased by 27.8 percent to US$1.9 million as of December 31, 2017 due togain on mark-to-market valuation from interest rate swap at CMSA.
6.7 Liquidity and Capital Resources
This section discusses the Group’s sources and uses of funds as well as its debt and equity capitalprofile.
6.7.1 Liquidity
The table below shows the Group’s consolidated cash flows for the years ended December 31, 2016,2017 and 2018:
Table 6.12 Consolidated Cash Flows
For the Year Ended December 31(In thousands, except % change data) 2016 2017 2018 % Change
2016 vs 2017% Change
2017 vs 2018Net cash provided by operating
activities US$466,948 US$564,012 US$642,404 20.8 13.9Net cash used in investing activities (468,466) (432,381) (327,900) (7.7) (24.2)Net cash used in financing activities (21,679) (184,772) (132,554) 752.3 (28.3)Effect of exchange rate changes on cash (6,226) 7,509 (14,298) (220.6) (290.4)Net increase (decrease) in cash and cash
equivalents (29,423) (45,632) 167,652 55.1 (467.4)Cash and cash equivalents, beginning 354,482 325,059 279,427 (8.3) (14.0)Cash and cash equivalents, end US$325,059 US$279,427 US$447,079 (14.0) 60.0
Consolidated cash and cash equivalents increased by 60.0 percent to US$447.1 million as of December31, 2018 from US$279.4 million for the same period in 2017 mainly due to the net proceeds fromissuance of senior guaranteed perpetual capital securities amounting to US$392.3 million in January2018; and strong cash inflows generated from operations, tapered by pre-termination of project financefacility at CMSA; and continuous deployment of cash to fund capital expenditures.

58
Net cash provided by operating activities increased by 13.9 percent to US$642.4 million for the yearended December 31, 2018 from US$564.0 million for the same period in 2017 mainly due to strongresults of operations.
Net cash used in investing activities for the year ended December 31, 2018 amounted toUS$327.9 million which consists mainly of capital expenditures of US$261.3 million, excludingcapitalized borrowing costs; and concession rights at SPICTL and MITL. The Group finances theserequirements through existing cash, cash generated from operations, external borrowings and/or equityissuances, as necessary. Net cash used in investing activities in 2017 includes settlement of leaseliability at VICT capitalized to property and equipment amounting to US$122.2 million; payment ofpre-termination fee at ICTSI Oregon amounting to US$11.5 million; and acquisition of the 34.83%stake in MNHPI, tapered by reimbursement of costs upon termination of sub-concession agreement atLICTSLE.
Net cash provided by financing activities for the year ended December 31, 2018 amounted toUS$132.6 million which consists mainly of the US$392.3 million net proceeds from the issuance ofsenior guaranteed perpetual capital securities in January 2018; drawdown from the project financefacility of VICT; and loan availments at IDRC and OPC, tapered by pre-termination of project financefacility at CMSA; repayment of loan at Parent Company; payment of dividends; distributions to holdersof perpetual capital securities; and increased debt servicing costs.
6.7.2 Capital Resources
The table below illustrates the Group’s capital sources as of December 31, 2016, 2017 and 2018:
Table 6.13 Capital Sources
As of December 31(In thousands, except % change data) 2016 2017 2018 % Change % Change
2016 vs 2017 2017 vs 2018Loans payable US$36,598 US$61,187 US$35,718 67.2 (41.6)Current portion of long-term debt 18,486 22,149 50,848 19.8 129.6Long-term debt, net of current portion 1,326,280 1,410,269 1,220,487 6.3 (13.5)Total short and long-term debt 1,381,364 1,493,605 1,307,053 8.1 (12.5)Equity 1,766,080 1,872,568 2,229,200 6.0 19.0
US$3,147,444 US$3,366,173 US$3,536,253 6.9 5.1
The Group’s total debt and equity capital increased by 5.1 percent as of December 31, 2018 primarilydue to increase in equity financing activities to fund expansion projects, capital expenditures and othergeneral corporate requirements; and net income generated during the period, tapered by pre-terminationof project finance facility at CMSA; and repayment of maturing loans.

59
6.7.2.1 Debt Financing
The table below provides the breakdown of the Group’s outstanding loans as of December 31, 2018:
Table 6.14 Outstanding Loans
(In thousands) CompanyFinalMaturity Interest Rate Amount
Short-Term DebtPGK Loan SPICTL 2019 Fixed US$17,868PGK Loan MITL 2019 Fixed 13,860US Dollar Loan BCT 2019 Floating 3,990
35,718Long-Term DebtUnsecured US Dollar Bond ITBV 2023 –
2025Fixed 757,902
Secured AUD Term Loan VICT 2023 –2031
Fixed* 250,038
Unsecured US Dollar Bond** Parent 2020 Fixed 179,256Unsecured US Dollar Term Loans OPC 2020 Floating 29,500Secured US Dollar Term Loans IDRC 2022 Fixed 23,958Unsecured US Dollar Term Loans CGSA 2021 Fixed* 17,206Secured RMB Term Loan YICT 2023 Floating 7,270Secured Euro Term Loans AGCT 2019 –
2024Fixed* 6,205
1,271,335Total Debt 1,307,053Less current portion and short-term 86,566Long-term debt, net of current portion US$1,220,487
*Under interest rate swap agreement**US$17.2 million under Euro-US Dollar cross currency swap agreement
As of December 31, 2018, 71.7 percent of the Group’s total debt capital is held by the Parent andITBV, which includes the US$179.3 million senior notes issued in 2010 and due in 2020; andUS$757.9 million MTN issued in 2013 to 2015 and due in 2023 to 2025.
The table below is a summary of debt maturities, net of unamortized debt issuance cost, of the Group asof December 31, 2018:
Table 6.15 Outstanding Debt Maturities
(In thousands) Amount2019 US$50,8482020 228,2612021 25,4092022 17,9892023 and onwards 948,828
Total US$1,271,335
MTN ProgrammeOn January 9, 2013, ICTSI Treasury B.V. (ICTSI Treasury), a majority-owned subsidiary throughICTSI Ltd., established the MTN Programme that would allow ICTSI Treasury from time to time toissue medium-term notes (MTN), unconditionally and irrevocably guaranteed by ICTSI and listed onthe Singapore Stock Exchange. The aggregate nominal amount of the MTN outstanding will not at anytime exceed US$750.0 million (or its equivalent in other currencies), subject to increase as described inthe terms and conditions of the Programme Agreement. In August 2013, the maximum aggregatenominal amount of the MTN outstanding that may be issued under the Programme was increased toUS$1.0 billion.
Pursuant to the MTN Programme, on January 9, 2013, ICTSI Treasury and ICTSI signed a SubscriptionAgreement with HSBC and UBS AG, Hong Kong Branch, for the issuance of 10-yearUS$300.0 million guaranteed MTN (the “Original MTN”). The Original MTN were issued on

60
January 16, 2013 to mature on January 16, 2023 at a fixed interest rate of 4.625 percent p.a., net ofapplicable taxes, set at a price of 99.014 and payable semi-annually in arrears. Moreover, onJanuary 28, 2013, an additional US$100.0 million guaranteed MTN was issued to form a single serieswith the original MTN.
In June 2013, ICTSI purchased a total of US$6.0 million of ICTSI Treasury’s US$400.0 million MTNat US$5.7 million.
In September 2013, ICTSI Treasury further issued US$207.5 million notes from the MTN Programmeat a fixed interest rate of 5.875 percent p.a. payable semi-annually and will be due in 2025 (“2025Notes”), in exchange for US$178.9 million of ICTSI’s US$450.0 million senior notes due in 2020(“2020 Notes”). Concurrent with the exchange offer, noteholders of the 2020 Notes provided theirconsent to the modifications to the terms and conditions of the 2020 Notes to conform to the terms andconditions of all the notes issued under the MTN Programme. Moreover, on April 30, 2014, anadditional US$75.0 million notes were issued to form a single series with the 2025 Notes.
In January 2015, an additional US$117.5 million notes were issued to form a single series with the2025 Notes. Of this new issue, US$102.6 million was used to fund the exchange for US$91.8 million ofthe 2020 Notes.
The aggregate net proceeds of the issuances under the MTN Programme were used to fund newprojects and capital expenditures, refinance some of ICTSI’s existing debt and for other generalcorporate purposes.
As of December 31, 2018, carrying value of notes under the MTN Programme amounted toUS$757.9 million.
US Dollar-denominated Notes
In March 2010, ICTSI signed a Subscription Agreement with HSBC and JP Morgan Securities, Ltd. forthe issuance of US$250.0 million ten-year senior notes (the “Original Notes”) bearing interest at a fixedrate of 7.375 percent, net of applicable taxes, payable semi-annually in arrears. In April 2010, ICTSItapped a further US$200.0 million (the “Further Notes”) of the Original Notes increasing the size toUS$450.0 million. The Further Notes were issued in May 2010 bearing interest at the fixed rate of7.375 percent, net of applicable taxes. The Original and Further Notes are collectively referred to asthe “2020 Notes”.
The net proceeds of the 2020 Notes amounting to US$448.1 million were used to fund ICTSI’sinvestments in existing and new terminal construction activities, refinance some of its existing debt andfor other general corporate purposes.
The 2020 Notes were not registered with the SEC. The Notes were offered in offshore transactionsoutside the United States in reliance on Regulation S under the Securities Act of 1933, as amended,and, subject to certain exceptions, may not be offered or sold within the United States. The 2020 Notesare traded and listed in the Singapore Stock Exchange.
In 2013 and 2015, ICTSI redeemed an aggregate of US$270.7 million of the 2020 Notes in exchangefor the 2025 Notes under the MTN Programme.

61
In March 2017, ICTSI entered into a cross currency swap that converts the US dollar bond with acoupon of 7.375 percent maturing on March 17, 2020 to a Euro liability that has a coupon of5.05 percent with the same maturity. The EUR15.0 million cross currency swap was designated as anet investment hedge to offset the movement of the Group’s Euro net investment in its subsidiary inMadagascar, MICTSL. As of December 31, 2018, the market valuation loss on the outstanding crosscurrency swap amounted to EUR1.2 million (US$1.1 million).
As of December 31, 2018, the carrying value of the 2020 Notes amounted to US$179.3 million.
Project Finance Facilities
CMSA. On October 21, 2015, CMSA signed a US$260.0 million Project Finance Facility withInternational Finance Corporation and Inter-American Development Bank (IADB). The CMSA Project(the Project) is for the development and operation of a Specialized Container terminal at the Port ofManzanillo in Manzanillo, Mexico. The financing package has a tenor of 12 years and an availabilityperiod of four years. Interest is payable semi-annually based on floating interest rate computed at 6-month LIBOR plus loan spread with a weighted average of 2.80 percent.
In January 2016, CMSA entered into interest rate swap transactions to hedge the interest rate exposureon its floating rate US$-denominated floating rate loan maturing in 2027. A total notional amount ofUS$181.0 million floating rate loan was swapped to fixed rate. Under the interest rate swaparrangements, CMSA pays annual fixed interest of an average 2.44 percent and receives floating rate ofsix-month LIBOR on the notional amount.
In May 2018, CMSA pre-terminated the project finance facility and the interest rate swaparrangements.
VICT. On July 15, 2016, VICT signed a syndicated project finance facilities with various internationaland regional banks for principal amount of US$300.0 million (AUD398.0 million) with interest ratesbased on Australian Bank Bill Swap Reference Rate (bid) (BBSY) plus average margin of 3.1 percentper annum and maturities until 2023, 2026 and 2031 and working capital facility of US$15.1 million(AUD20.0 million).
In 2016 and 2017, VICT entered into interest rate swap transactions to hedge the interest rate exposureson its floating rate AUD-denominated loans maturing in 2023, 2026 and 2031. A total notional amountof AUD338.3 million floating rate loan was swapped to fixed rate. Under the interest rate swaparrangements, VICT pays annual fixed interest of a range of 2.10 percent to 2.973 percent and receivesfloating rate of six-month Bank Bill Swap Bid Rate (BBSY) basis points on the notional amount. As ofDecember 31, 2018, the market valuation loss on the outstanding interest rate swaps amounted toAUD1.5 million (US$1.1 million).
As of December 31, 2018, the term facilities were fully drawn and the carrying value of the loansamounted to US$250.8 million (AUD354.7 million).
US dollar and Foreign Currency-denominated Term Loans and Securities
CGSA. In October 2015, CGSA availed of a three-year unsecured term loan with BBP Bank, S.A.amounting to US$4.0 million at a fixed interest rate of 6.78 percent. On September 18, 2018, CGSAfully paid the loan.
On March 29, 2016, CGSA (as “Borrower”), Metropolitan Bank and Trust Company (as “Lender”) andICTSI (as “Surety”) signed a loan agreement which consists of two tranches of loans amounting toUS$32.5 million (Tranche I) and US$7.5 million (Tranche II) with floating interest rates. Tranche I hasa final maturity in March 2021 while Tranche II in May 2017. On May 30, 2017, CGSA fully paid theloan under Tranche II.

62
In November 2016, ICTSI entered into an interest rate swap transaction to hedge the interest rateexposures of the CGSA’s floating rate US$-denominated floating rate loan maturing in 2021. A totalnotional amount of US$32.5 million floating rate loan was swapped to fixed rate. Under the interestrate swap arrangements, ICTSI pays annual fixed interest of 3.045 percent and receives floating rate ofsix-month LIBOR plus 160 basis points on the notional amount. As of December 31, 2018, the marketvaluation gain on the outstanding interest rate swaps amounted to US$0.3 million.
As of December 31, 2018, the outstanding balance of the loans aggregated to US$17.2 million.
YICT. On April 26, 2017, YICT obtained a US$21.8 million (RMB150.0 million) loan fromAgricultural Bank of China at an interest rate published by People's Bank of China (PBOC) less 5.00percent of such base rate and a final maturity in November 2023 to refinance its maturing loan. As ofDecember 31, 2018, the outstanding balance of the loan amounted to US$7.3 million(RMB 50.0 million).
AGCT. In 2013, AGCT signed a ten-year loan agreement for US$13.7 million (EUR10.6 million) withRaiffeisenbank Austria d.d. which carries a mark-up at the rate of 1-month EURIBOR plus 3.40 percentand is secured by AGCT’s port equipment. The principal is repayable in monthly installments untilApril 30, 2023.
The loan is under an interest rate swap agreement in which the floating rate Euro denominated loan wasswapped to fixed interest. Under the interest rate swap, AGCT pays fixed interest of 5.39 percent forUS$3.5 million (EUR2.9 million) and 4.75 percent for US$2.6 million (EUR2.2 million) and receivesfloating rate of one-month EURIBOR plus 3.40 bps on the US$6.1 million (EUR5.1 million). As ofDecember 31, 2018, the market valuation loss on the outstanding interest rate swap amounted toEUR0.2 million (US$0.3 million).
On April 30, 2018, AGCT obtained a loan amounting to US$0.7 million (EUR0.6 million) fromRaiffeisen Bank d.d. at a fixed rate of 2.50 percent and a maturity date of October 31, 2019.
As of December 31, 2018, the outstanding balance of the loans aggregated US$6.2 million(EUR5.4 million).
OPC. On July 11, 2017, OPC (as “Borrower”), Metropolitan Bank and Trust Company (as “Lender”)and ICTSI (as “Surety”) signed a loan agreement amounting to US$77.0 million with floating interestrate and maturity date of July 2020 to finance capital expenditures. The amount of the facility wasreduced to US$47.0 million on June 21, 2018 and was further reduced to US$39.5 million onSeptember 11, 2018. As of December 31, 2018, the outstanding balance of the loan amounted toUS$29.5 million.
SPICTL and MITL. On April 13, 2018, SPICTL and MITL obtained a loan facility with Australia andNew Zealand Banking Group (PNG) Limited amounting to US$31.1 million (PGK101.0 million) andUS$25.2 million (PGK82.0 million), respectively, at prevailing market rate and a maturity date of sixmonths from first drawdown date. On October 26, 2018, the loan facilities were extended for anothersix months at a reduced amount of US$22.3 million (PGK75.0 million) for SPICTL and US$16.4million (PGK55.0 million) for MITL. As of December 31, 2018, the outstanding balance of the loansamounted US$17.9 million (PGK60.2 million) for SPICTL and US$13.9 million (PGK46.7 million) forMITL.
IDRC. On October 9, 2018, IDRC availed of a four-year term loan with Rawbank RDC amounting toUS$25.0 million at a fixed interest rate of 8.00 percent per annum. As at December 31, 2018, theoutstanding balance of the loan amounted to US$24.0 million.

63
ICTSI Middle East DMCC. On January 9, 2019, ICTSI Middle East DMCC, as borrower, and ICTSI,as guarantor, signed a term loan facility agreement with Citigroup Global Markets Asia Limited andStandard Chartered Bank, the original mandated lead arrangers and bookrunners, for the principalamount of EUR260.0 million (US$297.6million) with interest rate based on EURIBOR plus an agreedmargin and maturing on December 20, 2022. The term facility agreement was entered into pursuant tothe Loan Facility Programme Agreement dated July 24, 2014 between ICTSI Global Finance B.V. asthe borrower, ICTSI as the guarantor, and The Bank of New York Mellon, Singapore Branch as thetrustee (“Loan Programme”). ICTSI Middle East DMCC acceded to the Loan Programme as anadditional borrower and an additional obligor thereunder.
On January 10, 2019, ICTSI Middle East DMCC has fully drawn the EUR260.0 million from thefacility.
6.7.2.2 Loan Covenants
The loans from local and foreign banks impose certain restrictions with respect to corporatereorganization, disposition of all or a substantial portion of ICTSI’s and subsidiaries’ assets,acquisitions of futures or stocks, and extending loans to others, except in the ordinary course ofbusiness. ICTSI is also required to comply with a specified financial ratio relating to their debt toEBITDA up to 4 times when incurring additional debt.
There was no material change in the covenants related to the Group’s long-term debts. As of December31, 2018, ICTSI and subsidiaries were in compliance with their loan covenants except for VICT whoseDebt Service Coverage Ratio requirement was not met but having been irrevocably waived by majorityof the creditors, no event of default has occurred.
6.7.2.3 Equity Financing
Perpetual Capital Securities
On January 29, 2015, RCBV issued US$300.0 million 6.25 percent Senior Guaranteed PerpetualCapital Securities unconditionally and irrevocably guaranteed by ICTSI at a price of 99.551 percent orUS$298.7 million. The new issue was partly used to finance the tendered US$230.0 million 8.375percent Subordinated Guaranteed Perpetual Capital Securities (“Original Securities) at a tender price of107.625 or US$247.5 million. The cash proceeds received by RCBV amounted to US$46.7 million, netof debt issuance cost.
On August 26, 2015, RCBV issued US$450.0 million 5.50 percent Senior Guaranteed Perpetual CapitalSecurities (“New Securities”) unconditionally and irrevocably guaranteed by ICTSI. The cash proceedsreceived by RCBV amounted to US$436.3 million, net of debt issue cost, will be used for refinancing,funding capital expenditures and general corporate purposes.
On March 10, 2016, RCBV (the “Issuer”) and ICTSI (the “Guarantor”) sent a notice to The Hong Kongand Shanghai Banking Corporation Limited (HSBC, as “Trustee” and “Agent”) for the redemption ofthe remaining US$108.3 million of the US$350-million Subordinated Guaranteed Perpetual CapitalSecurities (“Securities”) and payment of accrued distributions. The securities were eventuallyredeemed in May 2016.

64
On October 3, 2016, RCBV tendered its US$300.0 million 6.25 percent and US$450.0 million 5.50percent Senior Guaranteed Perpetual Capital Securities for redemption at a price of 106.75 and 105.75,respectively. On October 20, 2016, RCBV redeemed a total of US$345.5 million of the tenderedsecurities and paid the associated accrued distributions of US$9.3 million. Together with theredemption, RCBV issued US$375.0 million 4.875 percent Senior Guaranteed Perpetual CapitalSecurities unconditionally and irrevocably guaranteed by ICTSI at a price of 99.225 percent. The newissue was used to finance the redemption and payment of accrued distributions of the tenderedsecurities
On January 10, 2018, the Board approved the principal terms and conditions of the US$350.0 million5.875 percent fixed-for-life Senior Guaranteed Perpetual Capital Securities(the “New Securities”). The New Securities were unconditionally and irrevocably guaranteed by ICTSIat par. On January 11, 2018, the Board approved the issuance of additional Senior GuaranteedPerpetual Capital Securities amounting to US$50.0 million (“Additional Securities”) which wasconsolidated and formed a single series with the New Securities initially offered on January 10,2018. The Additional Securities were also unconditionally and irrevocϧably guaranteed by ICTSI atpar. The cash proceeds received by RCBV from the issuance of the New and Additional Securitiesamounted to US$392.3 million, net of debt issuance costs, which shall be used for the financing ofacquisitions and capital expenditures and for general corporate purposes.
6.8 Risks
ICTSI and its subsidiaries’ geographically diverse operations expose the Group to various market risks,particularly foreign exchange risk, interest rate risk and liquidity risk, which movements may materiallyimpact the financial results of the Group. The importance of managing these risks has significantlyincreased in light of the heightened volatility in both the Philippine and international financial markets.
With a view to managing these risks, the Group has incorporated a financial risk management functionin its organization, particularly in the treasury operations.
6.8.1 Foreign Exchange Risk
The Group has geographically diverse operations and transacts in currencies other than its functionalcurrency. Consequently, the Group is exposed to the risk of fluctuation of the exchange rates betweenthe US dollar and other local currencies such as PHP, AUD, BRL, MXN and EUR that may adverselyaffect its results of operations and financial position. The Group attempts to match its revenues andexpenses whenever possible and, from time to time, engages in hedging activities. Changes inexchange rates affect the US dollar value of the Group’s revenues and costs that are denominated inforeign currencies. The Group also enters into cross currency swap agreements in order to manage itsexposure to fluctuations in the net investments in its subsidiaries denominated in foreign currencies.
The Group’s non-US dollar currency-linked revenues was 45.6 percent and 50.9 percent of grossrevenues for the periods ended December 31, 2017 and 2018, respectively. Foreign currency-linkedrevenues include the following: (1) arrastre charges of MICT; and (2) non-US dollar revenues ofinternational subsidiaries. ICTSI incurs expenses in foreign currency for the operating and start uprequirements of its international subsidiaries. Concession fees payable to port authorities in certaincountries are either denominated in or linked to the US dollar.

65
The below table provides the currency breakdown of the Group’s revenue for the year endedDecember 31, 2018:
Table 6.16 Revenue Currency Profile
Subsidiary USD/EUR Composition Local CurrencyICTSI 42 % USD 58 % PhPSBITC/ICTSI Subic 56 % USD 44 % PhPDIPSSCOR 100 % PhPHIPS 100 % PhPSCIPSI 100 % PhPBIPI 100 % PhPMICTSI 100 % PhPLGICT 30 % USD 70 % PhPBCT 68 % USD/5 % EUR 27 % PLNTSSA 100 % BRLMICTSL 100 % EUR*PTMTS 100 % IDRYICT 100 % RMBAGCT 79 % EUR 21 % HRKCGSA 100 % USDBICT 100 % USDPICT 76 % USD 24 % PKROJA 70 % USD 30 % IDRCMSA 49 % USD 51 % MXNOPC 100 % USDICTSI Iraq 84 % USD 16 % IQDIDRC 100 % USDVICT 100 % AUDSPICTL/MITL 100 % PGK
*MGA pegged to the EURO
6.8.2 Interest Rate Risk
The Group’s exposure to market risk for changes in interest rates (cash flow interest rate risk) relatesprimarily to the Group’s bank loans and is addressed by a periodic review of the Group’s debt mix withthe objective of reducing interest cost and maximizing available loan terms. The Group also enters intointerest rate swap agreements in order to manage its exposure to interest rate fluctuations.
6.8.3 Liquidity Risk
The Group manages its liquidity profile to be able to finance its working capital and capital expenditurerequirements through internally generated cash and proceeds from debt and/or equity. As part of theliquidity risk management, the Group maintains strict control of its cash and makes sure that excesscash held by subsidiaries are up streamed timely to the Parent Company. The Group also monitors thereceivables and payables turnover to ensure that these are at optimal levels. In addition, it regularlyevaluates its projected and actual cash flow information and continually assesses the conditions in thefinancial market to pursue fund raising initiatives. These initiatives may include accessing bank loans,project finance facilities and the debt capital markets.
ICTSI monitors and maintains a level of cash and cash equivalents and bank credit facilities deemedadequate to finance the Group’s operations, ensure continuity of funding and to mitigate the effects offluctuations in cash flows.
There are no other known trends, demands, commitments, events or uncertainties that will materiallyaffect the company’s liquidity.

66
Item 7. Consolidated Financial Statements
The Group’s 2018 consolidated financial statements and accompanying notes are incorporatedherein by reference.
Item 8. Changes in and Disagreements with Accountants of Accounting and Financial Disclosure
There were no changes or disagreements with ICTSI’s external auditors, SyCip Gorres Velayo & Co.(a member firm of Ernst & Young Global Limited), on accounting and financial statement disclosures.
8.1 Information on Independent Accountant
The principal external auditor is the firm SGV & Co. The Group has engaged Mr. Arnel F. De Jesus,partner of SGV & Co., for the audit of the Group’s books and accounts in 2018.
8.2 External Audit Fees and Services
ICTSI paid its external auditors the following fees (in thousands) for the last three years forprofessional services rendered:
2016 2017 2018Audit Fees US$1,070.2 US$1,203.9 US$1,283.9Audit-related Fees 379.1 437.4 −Tax Fees 72.9 239.9 288.6Other Fees 151.1 92.3 348.9
Audit Fees include the audit of the Group’s annual financial statements.
Audited-Related Fees include the review of interim financial statements and issuance of comfortletters for the capital market raising transactions of the Group.
Tax fees paid to SGV & Co./Ernst & Young are for tax compliance, tax advisory services andtransfer-pricing studies. The increases in 2017 and 2018 were mainly due to increased number ofengagements on tax advisory and on tax planning for the restructuring of the subsidiaries.
Other fees mainly include due diligence services related to business development, sustainabilityreporting and other various one-time engagements.
The Audit Committee makes recommendations to the Board concerning the external auditors andpre-approves audit plans, scope and frequency before the conduct of the external audit. The AuditCommittee reviews the nature of the non-audit related services rendered by the external auditorsand the appropriate fees paid for these services.
The reappointment of SGV & Co. as the Company’s external auditors was approved by thestockholders in a meeting held on April 19, 2018.

67
PART IV – MANAGEMENT AND CERTAIN SECURITY
HOLDERS
Item 9. Directors and Executive Officers
The following are information on the business experience of the members of the Board of Directors(the Board) and Executive Officers of ICTSI for the last five (5) years.
The members of the Board of Directors and executive officers of ICTSI are:
Office Name Citizenship AgeChairman of the Board andPresident
Enrique K. Razon, Jr. Filipino 59
Director Cesar A. Buenaventura1 Filipino 89Director Octavio Victor R. Espiritu2 Filipino 75Director Joseph R. Higdon3 American 77Director Jose C. Ibazeta Filipino 76Director Stephen A. Paradies Filipino 65Director Andres Soriano III American 67Executive Vice President Martin O’Neil4 American/Irish 58Senior Vice President, ChiefFinancial Officer &Compliance Officer
Rafael D. Consing, Jr. Filipino 50
Senior Vice President,Finance
Jose Joel M. Sebastian Filipino 55
Vice President and Treasurer Gigi Iluminada T. Miguel5 Filipino 49Corporate Secretary Rafael T. Durian Filipino 85Asst. Corporate Secretary Silverio Benny J. Tan Filipino 62Asst. Corporate Secretary Benjamin M. Gorospe III Filipino 51
1Elected as Independent Director last February 12, 2019 by the remaining members of the Board to serve the unexpired term ofJon Ramon Aboitiz pursuant to Article III, Section 2 of the Amended By - Laws
2Independent Director3Independent Director4Retired on June 1, 20185Appointed on May 2, 2018
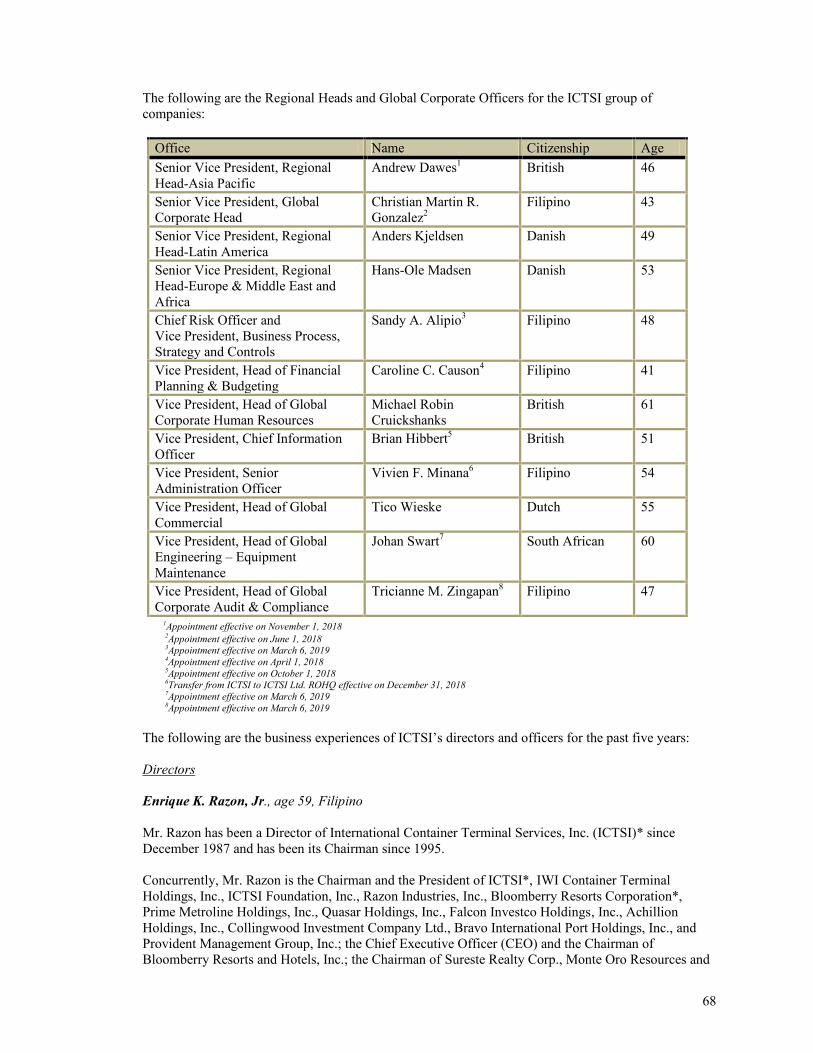
68
The following are the Regional Heads and Global Corporate Officers for the ICTSI group ofcompanies:
Office Name Citizenship AgeSenior Vice President, RegionalHead-Asia Pacific
Andrew Dawes1 British 46
Senior Vice President, GlobalCorporate Head
Christian Martin R.Gonzalez2
Filipino 43
Senior Vice President, RegionalHead-Latin America
Anders Kjeldsen Danish 49
Senior Vice President, RegionalHead-Europe & Middle East andAfrica
Hans-Ole Madsen Danish 53
Chief Risk Officer andVice President, Business Process,Strategy and Controls
Sandy A. Alipio3 Filipino 48
Vice President, Head of FinancialPlanning & Budgeting
Caroline C. Causon4 Filipino 41
Vice President, Head of GlobalCorporate Human Resources
Michael RobinCruickshanks
British 61
Vice President, Chief InformationOfficer
Brian Hibbert5 British 51
Vice President, SeniorAdministration Officer
Vivien F. Minana6 Filipino 54
Vice President, Head of GlobalCommercial
Tico Wieske Dutch 55
Vice President, Head of GlobalEngineering – EquipmentMaintenance
Johan Swart7 South African 60
Vice President, Head of GlobalCorporate Audit & Compliance
Tricianne M. Zingapan8 Filipino 47
1Appointment effective on November 1, 20182Appointment effective on June 1, 20183Appointment effective on March 6, 20194Appointment effective on April 1, 20185Appointment effective on October 1, 20186Transfer from ICTSI to ICTSI Ltd. ROHQ effective on December 31, 20187Appointment effective on March 6, 20198Appointment effective on March 6, 2019
The following are the business experiences of ICTSI’s directors and officers for the past five years:
Directors
Enrique K. Razon, Jr., age 59, Filipino
Mr. Razon has been a Director of International Container Terminal Services, Inc. (ICTSI)* sinceDecember 1987 and has been its Chairman since 1995.
Concurrently, Mr. Razon is the Chairman and the President of ICTSI*, IWI Container TerminalHoldings, Inc., ICTSI Foundation, Inc., Razon Industries, Inc., Bloomberry Resorts Corporation*,Prime Metroline Holdings, Inc., Quasar Holdings, Inc., Falcon Investco Holdings, Inc., AchillionHoldings, Inc., Collingwood Investment Company Ltd., Bravo International Port Holdings, Inc., andProvident Management Group, Inc.; the Chief Executive Officer (CEO) and the Chairman ofBloomberry Resorts and Hotels, Inc.; the Chairman of Sureste Realty Corp., Monte Oro Resources and

69
Energy, Inc. and Pilipinas Golf Tournament Inc.; and a Director of Sureste Properties, Inc., ICTSI(Hongkong) Ltd., Australian Container Terminals, Ltd., Pentland International Holdings Ltd., CLSAExchange Capital, and Xcell Property Ventures, Inc.
In addition, he is a member of the US-Philippines Society, the ASEAN Business Club, and Philippines,Inc.
The De La Salle University in the Philippines has conferred on Mr. Razon the degree of Doctor ofScience in Logistics honoris causa.
*Publicly-listed Corporation
Jon Ramon M. Aboitiz, age 70, Filipino (Deceased on November 30, 2018)
Mr. Aboitiz was a Director of ICTSI* from April 2008 and was appointed as a member of the ICTSIAudit Committee in April 2010 and the Chairman of the Related Party Transactions Committee in April2017.
Mr. Aboitiz was also the Chairman of Aboitiz & Co., Inc., and Aboitiz Equity Ventures, Inc.*, a Cebu-based investment and management enterprise engaged in numerous and diverse business concernsranging from power generation and distribution, banking and financial services, real estatedevelopment, construction, food, ship building and cement.
Mr. Aboitiz began his career with the Aboitiz Group in 1970 after graduating from the Sta. ClaraUniversity, California, with a B.S. Commerce Degree majoring in Management. He became thePresident of Aboitiz & Company in 1991 until 2008. He was the President and Chief Executive Officer(CEO) of Aboitiz Equity Ventures, Inc.* from 1993 - 2008.
He held various positions in the Aboitiz Group including Vice Chairman of Aboitiz PowerCorporation*, Vice Chairman of Union Bank of the Philippines and Chairman of the Bank'sCommittees namely: Executive Committee, Risk Management Committee and NominationsCommittee; Vice Chairman of Compensation and Remuneration Committee, and CorporateGovernance Committee. He was also a Director of Bloomberry Resorts Corporation* and was amember of its Audit Committee. He was Chairman and CEO of the Ramon Aboitiz Foundation, amember of the Board of Advisors of the Coca-Cola Export Corporation (Philippines) and PilipinasKAO Corporation. He was also a Board of Trustee of The Santa Clara University, California USA.
*Publicly-listed Corporation
Cesar A. Buenaventura, O.B.E., age 89, Filipino (replaced Mr. Aboitiz to serve his unexpired term)
Mr. Buenaventura was elected as an independent Director of ICTSI* last February 12, 2019. OnMarch 1, 2019, he was appointed as the Chairman of Corporate Governance Committee, Related PartyTransactions Committee, and a member of the Audit Committee of ICTSI. He is the Director andChairman of Mitsubishi Hitachi Power Systems Phils Inc. and Buenaventura Echauz and Partners, Inc.,Director and Vice Chairman of DMCI Holdings, Inc.*, Director of Semirara Mining and Power Corp.*,iPeople, Inc.*, Petroenergy Resources Corp.*, Concepcion Industrial Corp.* Pilipinas Shell PetroleumCorp.*, DM Consinji Inc., and The Country Club. He is likewise a Trustee and Chairman of PilipinasShell Foundation Inc., and Trustee of Bloomberry Cultural Foundation and ICTSI Foundation. He wasformerly a Director of Philippine American Life Insurance Co., AG&P Co. of Manila, AyalaCorporation*, First Philippine Holdings Corp.*, Philippine Airlines*, Philippine National Bank*,Benguet Corporation*, Asian Bank, Ma. Cristina Chemical Industries, Paysetter International Inc.,Maibarara Geothermal Inc., and Manila International Airport Authority.

70
His career started with Engineer David Consunji in 1951. Mr. Buenaventura then moved to the ShellGroup of Companies in 1956 where he served as the first Filipino CEO and Chairman from 1975 untilhis retirement in 1990. He served 2 more years in the capacity of non-executive chairman until 1992.He was appointed member of the Monetary Board of Central Bank of the Philippines representing theprivate sector from 1981 until 1987.
Mr. Buenaventura is the founding chairman of the Pilipinas Shell Foundation Inc., and foundingmember of the Board of Trustees of the Makati Business Club. He was a member of the Board ofRegents of the University of the Philippines from 1987 to 1994, the Board of Trustees of the AsianInstitute of Management from 1994 to 2007, and President of Benigno Aquino S. Foundation from1985-2010.
He is a recipient of many awards, among which are – Most Distinguished Alumnus, College ofEngineering, University of the Philippines in 1977, the Management Man of the year by theManagement Association of the Philippines in 1985, Outstanding Professional in Engineering by theProfessional Regulatory Commission in 1997, Outstanding Fulbrighter in the field of business by thePhilippine Fulbright Association in 2008, recipient of Centennial Award as one of the UP’s Top 100Alumni Engineering Graduates.
In 1991, Mr. Buenaventura was made Honorary Officer of the Order of the British Empire (OBE) byHer Majesty Queen Elizabeth II.
Mr. Buenaventura received his Bachelor of Science degree in Civil Engineering from the University ofthe Philippines and his Master’s degree in Civil Engineering majoring in Structures from LehighUniversity Bethlehem, Pennsylvania in 1954, as a Fulbright scholar.
*Publicly-listed Corporation
Octavio Victor R. Espiritu, age 75, Filipino
Mr. Espiritu has been an independent Director of ICTSI* since April 2002. On March 1, 2019, he wasappointed as Chairman of the Audit Committee and a member of the Corporate GovernanceCommittee, Nomination Sub-Committee, Remuneration Sub-Committee, Board Risk OversightCommittee and Related Party Transactions Committee of ICTSI. He is also a Director of Bank of thePhilippine Islands, Philippine Dealing System Holdings Corp. and Subsidiaries, and Phil StratbaseConsultancy Inc.
Formerly, Mr. Espiritu was a three-term former President of the Bankers Association of the Philippines,a former President and Chief Executive Officer (CEO) of Far East Bank and Trust Company, andChairman of the Board of Trustees of the Ateneo de Manila University for fourteen (14) years.
Mr. Espiritu received his primary, secondary, and college education from the Ateneo de ManilaUniversity, where he obtained his AB Economics degree in 1963. In 1966, he received his Master’sDegree in Economics from Georgetown University in Washington DC, USA.
*Publicly-listed Corporation

71
Joseph R. Higdon, age 77, American
Mr. Higdon has been an independent Director of ICTSI* since April 2007. On March 1, 2019, he wasappointed as member of the Corporate Governance Committee and Board Risk Oversight Committee ofICTSI. He is also an independent Director of SM Investments Corporation*, Security BankCorporation* and The Island Institute, a non-profit organization seeking to preserve island communitiesalong the coast of Maine and Trekkers, a community-based mentoring organization.
Formerly, Mr. Higdon was the Senior Vice President of Capital Research and Management, a LosAngeles (USA)-based international investment management firm, until June 2006. He joined CapitalResearch and Management in 1974 and has covered Philippine stocks from 1989 to 2006. He was theVice President of the New World Fund, which focused on companies doing business in emergingcountries and was a Director of Capital Strategy Research.
Mr. Higdon received his Bachelor of Science degree, major in Political Science, from the University ofTennessee in 1968.
*Publicly-listed Corporation
Jose C. Ibazeta, age 76, Filipino
Mr. Ibazeta has been a Director of ICTSI* since December 1987. On March 1, 2019, he was appointedas Chairman of the Nomination Sub-Committee and a former member of Audit Committee of ICTSI.
Formerly, he was named a Trustee and Vice-President of ICTSI Foundation in 2009, He also served asICTSI’s Treasurer until February 2007, and he was appointed as President and Chief Executive Officerof the Power Assets and Liabilities Management Corporation (PSALM) by the President of theRepublic of the Philippines. He served as PSALM President and CEO from February 1, 2007 to March30, 2010. In April 2010, he declined his nomination as Director of ICTSI by reason of his appointmentas Acting Secretary of the Department of Energy, a position he held from April 1, 2010 until June 30,2010. He was re-elected a Director of ICTSI* in August 2010.
In addition, Mr. Ibazeta is a Consultant to the Chairman of the Board of A Soriano Corporation*. He isa Director of A Soriano Corporation, Anscor Consolidated Corporation, AFC AgribusinessCorporation, Anscor Holdings, Inc., Minuet Realty Corporation, Phelps Dodge Philippines EnergyProducts Corporation, Seven Seas Resorts and Leisure, Inc, Island Aviation, Inc, and VicinetumHoldings, Inc. He is also the Chairman and President of Island Aviation, Inc, President of Seven SeasResorts and Leisure, Inc, and Pamalican Resort, Inc. Mr. Ibazeta is also the founding Chairman and aDirector of Philippine Stratbase Consultancy, Inc.
At AGP Group Holdings, PTE, Ltd, Mr Ibazeta is a member of the Board, the Executive Committeeand the Compliance Steering Committee as well as Chairman of the Audit Committee. He is Chairmanof the AG&P Estate Management, Inc, member of the Board of Atlantic, Gulf & Pacific Company ofManila, Inc, AG&P FieldCOM, Inc, and Gas Entec Co, Ltd. He is the Treasurer and a member of theBoard of AGP Philippines Holdings, Inc.
Mr. Ibazeta is a member of the Board of Trustees of Radio Veritas and St James the Great ParishFoundation. He received his Bachelor of Science in Economics degree from the Ateneo de ManilaUniversity in 1963 and his Masters Degree in Business Administration from the University of SanFrancisco, USA in 1968. He completed all academic requirements and passed the comprehensiveexams for an MBC in Banking and Finance from the New York University in 1975.
*Publicly-listed Corporation

72
Stephen A. Paradies, age 65, Filipino
Mr. Paradies has been a Director of ICTSI* since December 1987. On March 1, 2019, he was appointedas the Chairman of the Board Risk Oversight Committee and a member of Audit Committee,Nomination Sub-Committee, Remuneration Sub-Committee, and Related Party TransactionsCommittee of ICTSI. He is also a Director of IWI Container Terminal Holdings, Inc. and SociedadPuerto Industrial Aguadulce S.A. Moreover, Mr. Paradies is the Senior Vice President-Treasurer ofAboitiz & Company, Inc.; a Trustee of Bloomberry Cultural Foundation, Inc.; a Director of UnionProperties, Inc., Prime Metro BMD Corp., and Chairman of NapaGapa Beverages, Inc.
Mr. Paradies received his Bachelor of Science degree, major in Business Management, from the SantaClara University, California, USA.
*Publicly-listed Corporation
Andres Soriano III, age 67, American
Mr. Soriano has been a Director of ICTSI* since July 1992. Currently he is the Chairman of theRemuneration Sub-Committee and a member of Corporate Governance Committee of ICTSI.
In addition, Mr. Soriano is the Chairman and Chief Executive Officer (CEO) of A. SorianoCorporation*, the Chairman and President of Anscor Consolidated Corp., the Chairman of the AndresSoriano Foundation, Inc., Phelps Dodge International Philippines, Inc., Phelps Dodge PhilippinesEnergy Products Corp., and Seven Seas Resorts and Leisure, Inc., and a Director of Anscor PropertyHoldings, Inc., A. Soriano Air Corporation, and the Manila Peninsula Hotel, Inc.
Formerly, Mr. Soriano was the President and Chief Operating Officer (COO) of San MiguelCorporation* and later, its Chairman and CEO. He was also the Chairman of Coca Cola (Philippines),Coca Cola Amatil (Australia) and Nestle (Philippines) and was a Director of SPI Technologies, Inc.,eTelecare Global Solutions, Inc., G.E. Asian Advisory and Wharton East Asia Executive Board.
Mr. Soriano received a Bachelor of Science degree in Economics, major in Finance and InternationalBusiness, from Wharton School of Finance and Commerce, University of Pennsylvania in 1972.
*Publicly-listed Corporation
Executive Officers
Martin L. O’Neil, age 58, American / Irish
Mr. O’Neil was the Executive Vice President of ICTSI* prior to his retirement on June 1, 2018. He hasassumed the Executive Vice President role in October 2015. He previously served as the Senior VicePresident and the Chief Financial Officer of ICTSI* during the periods from 2006 to 2010 andJuly 2013 to October 2015. He is currently a Director and the Chairman of International ContainerTerminal Holdings, Inc. (ICTHI); a Director of Tecon Suape S.A. (TSSA), ICTSI Georgia Corp.,Sociedad Portuario Industrial Aguadulce S.A. (SPIA), Terminal Maritima de Tuxpan S.A. de C.V.(TMT), ICTSI (Hong Kong) Ltd., Tungsten RE Ltd., and Victoria International Container TerminalLimited (VICTL). From 2001 to 2003, he was the Head of the London office of Telegraph HillCommunications Partners, a San Francisco based firm advising on private equity investments andmanagement of private equity portfolio companies. He was a Managing Director of JP Morgan & Co.,where he was active in project finance, capital markets and mergers and acquisitions in New York,Hong Kong, and London. He was a Director of JP Morgan Capital Corporation, the JP Morgan’sprivate equity investment arm, and it was during this time that he invested in and served as a Directorof ICTSI International Holdings Corp. (IIHC). He joined JP Morgan & Co. in 1984.

73
Mr. O’Neil is a dual citizen of USA and Ireland and graduated from Harvard College in Cambridge,Massachusetts (USA), with a BA degree (cum laude) in 1983, and was also named a Harvard CollegeScholar. He currently serves as a member of Harvard’s Committee on University Resources.
*Publicly-listed Corporation
Rafael D. Consing, Jr., age 50, Filipino
Mr. Consing is the Senior Vice President and Chief Financial Officer of International ContainerTerminal Services, Inc. (ICTSI)*. He was appointed to the said position on October 5, 2015 and wassubsequently appointed as the Compliance Officer on February 9, 2016. Prior to such role, he was theVice President and Treasurer of ICTSI*. Concurrently, he is a Director and Treasurer of the followingICTSI subsidiaries: Hijo International Port Services, Inc., Subic Bay International Terminal Corp.,Subic Bay International Terminal Holdings, Inc., ICTSI Subic Inc., Cordilla Properties Holdings, Inc.,IW Cargo Handlers, Inc., IWI Container Terminal Holdings, Inc., Laguna Gateway Inland ContainerTerminal, Inc., Intermodal Terminal Holdings, Inc., Cavite Gateway Terminal, Inc., a Director ofFalconer Aircraft Management, Inc., Tecplata S.A., Contecon Manzanillo S.A., Terminal Maritima deTuxpan, S.A. de C.V., Sociedad Puerto Industrial Aguadulce S.A., Operadora PortuariaCentroamericana S.A. de C.V., ICTSI Oregon, Inc., Global Procurement Ltd., ICTSI Honduras Ltd.,Aeolina Investments Limited, Crixus Limited, ICTSI Georgia Corp., ICTSI QFC LLC, ICTSI ProjectDelivery Services Co. Pte. Ltd., ICTSI South Asia Pte. Ltd., ICTSI Mauritius Ltd., Consultports S.A.de C.V., Motukea International Terminal Limited, Asiastar Consultants Limited, ICTSI Far East Pte.Ltd., and Manila North Harbour Port, Inc.; the Chairman of CGSA Transportadora S.L. and SPIA SpainS.L.; a Director and the Deputy Chairman of ICTSI Ltd. and International Container TerminalHoldings, Inc.; a Director A of ICTSI Capital B.V., Royal Capital B.V., ICON Logistiek B.V., ICTSIAmericas B.V., ICTSI Cameroon B.V., Tecplata B.V., Global Container Capital B.V., CGSA B.V.,SPIA Colombia B.V., CMSA B.V., TSSA B.V., ICTSI Treasury B.V., ICTSI Cooperatief U.A., ICTSIOceania B.V., ICTSI Tuxpan B.V., ICTSI Africa B.V., ICTSI Global Cooperatief U.A., and ICTSIGlobal Finance B.V.; and a Commissioner of PT ICTSI Jasa Prima Tbk.
Mr. Consing started his career at the Multinational Investment Bancorporation in June 1989. From1999 to 2007, he assumed various roles in HSBC, including Director and the Head of Debt CapitalMarkets for the Philippines, and subsequently for South East Asia, and later on as the ManagingDirector and the Head of the Financing Solutions Group, Asia Pacific. In HSBC, Mr. Consing wasinvolved in strategic and situational financing and advisory activities, including acquisition andleveraged finance, debt capital markets, credit ratings and capital advisory. He also held positions ininvestment banking with Bankers Trust NY / Deutsche Bank and ING Barings. In 1993 to 1995, Mr.Consing served as the Vice President and the Treasurer of Aboitiz & Company, Inc. and Aboitiz EquityVentures, Inc*.
Mr. Consing received his A.B. degree, major in Political Science, from the De La Salle University,Manila, in 1989. He is an alumnus of the Emerging CFO: Strategic Financial Leadership Program ofthe Stanford Graduate School of Business.
*Publicly-listed Corporation

74
Jose Joel M. Sebastian, age 55, Filipino
Mr. Sebastian is the Senior Vice President, Finance. He was appointed to the said position on October5, 2015. He joined ICTSI* as the Vice President and Controller in September 2008. Concurrently, he isa Director and the President of International Container Terminal Holdings, Inc., ICTSI Ltd., and ICTSIGeorgia Corp.; the Deputy Chairman of CGSA Transportadora S.L. and SPIA Spain S.L.; a Directorand the President of Bauan International Ports, Inc., Davao Integrated Port & Stevedoring ServicesCorp., a Director and Treasurer ofMindanao International Container Terminal Services, Inc., SouthCotabato Integrated Ports Services, Inc., Abbotsford Holdings, Inc., ICTSI Asia Pacific BusinessServices, Inc. and Falconer Aircraft Management, Inc.; a Director A of ICTSI Capital B.V., RoyalCapital B.V., ICON Logistiek B.V., ICTSI Americas B.V., ICTSI Cameroon B.V., Tecplata B.V.,Global Container Capital B.V., CGSA B.V., SPIA Colombia B.V., CMSA B.V., TSSA B.V., ICTSITreasury B.V., ICTSI Cooperatief U.A., ICTSI Oceania B.V., ICTSI Tuxpan B.V., ICTSI Africa B.V.,ICTSI Global Cooperatief U.A., and ICTSI Global Finance B.V.; and a Director of Cordilla PropertiesHoldings, Inc., , Tartous International Container Terminal, JSC., International Container TerminalServices Private Limited, ICTSI DR Congo S.A., PT ICTSI Jasa Prima Tbk, Global Procurement Ltd.,ICTSI Honduras Ltd., Lekki International Container Terminal Services LFTZ Enterprises, Tecon SuapeS.A., Contecon Guayaquil S.A., Contecon Manzanillo S.A., Terminal Maritima de Tuxpan, S.A. deC.V., Aeolina Investments Limited, Crixus Limited, ICTSI (M.E.) DMCC, ICTSI Middle East DMCC,ICTSI QFC LLC, ICTSI South Asia Pte. Ltd., ICTSI Project Delivery Services Co. Pte. Ltd.,Consultports, S.A. de C.V., Motukea International Terminal Limited, South Pacific InternationalContainer Terminal Limited, Operadora Portuaria Centroamericana S.A. de C.V., Tungsten RE Ltd andManila North Harbour Port, Inc.
Mr. Sebastian started his professional career with SyCip Gorres Velayo & Co. (a member firm of Ernst& Young Global Limited) in 1984 and was admitted to the partnership in 1999. His expertise is infinancial audits of publicly-listed companies in the telecommunications, port services, shipping, realestate, retail, power generation and distribution, manufacturing, media and entertainment industries.
Mr. Sebastian is a Certified Public Accountant. He graduated from the De La Salle University, Manila,in 1983 with a degree in Bachelor of Science in Commerce major in Accounting. He also attended theAccelerated Development Programme of the University of New South Wales in 1996.
*Publicly-listed Corporation
Gigi Iluminada T. Miguel, age 49, Filipino
Ms. Miguel was appointed on May 2, 2018 as the Vice President and Treasurer of ICTSI*. Prior to suchrole, she was the Liability and Capital Director of ICTSI. Concurrently, she is also a Director ofPakistan International Container Terminal. Prior to joining ICTSI, she was already a seasoned banker,having been connected with China Banking Corporation.
Ms. Miguel received her Master’s Degree in Business Administration from Ateneo Graduate School ofBusiness, and is a graduate of BS Applied Mathematics from the University of the Philippines.
*Publicly-listed Corporation
75
Rafael T. Durian, age 85, Filipino
Atty. Durian has been the ICTSI*’s Corporate Secretary since 1987. He is likewise the CorporateSecretary of International Container Terminal Holdings, Inc. and ICTSI Foundation, Inc.; and theCorporate Secretary and a Director of Razon Industries, Inc., Sureste Realty Corp. and ProvidentManagement Group, Inc.
Atty. Durian earned his Bachelor of Laws degree from San Beda College and is a member of theIntegrated Bar of the Philippines. He was a Partner at Cruz Durian Alday & Cruz-Matters Law Office.
*Publicly-listed Corporation
Silverio Benny J. Tan, age 62, Filipino
Atty. Tan is a partner in and was managing partner from 2013 to 2015, in the law firm of Picazo BuycoTan Fider & Santos. He is a director and corporate secretary of Prime Metroline Holdings, Inc., BravoInternational Port Holdings Inc., Alpha International Port Holdings Inc., Eiffle House Inc., CylandCorp., OSA Industries Philippines Inc. and Negros Perfect Circles Food Corp. He is also a director ofthe following companies: Mapfre Insular Insurance Corporation, Celestial Corporation, Skywide AssetsLtd., Monte Oro Minerals (SL) Ltd., and Dress Line Holdings Inc. and its subsidiaries and affiliates. Heis the corporate secretary of several companies including: Apex Mining Company Inc.*, SuresteProperties, Inc., Bloomberry Resorts and Hotels Inc., Bloomberry Resorts Corporation*, LakelandVillage Holdings Inc., Devoncourt Estates Inc., Monte Oro Resources & Energy Inc., and PilipinasGolf Tournaments, Inc. He is the assistant corporate secretary of ICTSI*, International ContainerTerminal Holdings, Inc and ICTSI Ltd., ICTSI Honduras Ltd. and a trustee and the auditor of the ICTSIFoundation, Inc.
Atty. Tan holds a Bachelor of Laws, cum laude, from the University of the Philippines - College ofLaw and a Bachelor of Arts Major in Political Science, cum laude, from the University of thePhilippines College Iloilo. Atty. Tan placed third in the 1982 Philippine Bar exams.
*Publicly-listed Corporation
Benjamin M. Gorospe III, age 51, Filipino
Atty. Gorospe was appointed as the Assistant Corporate Secretary of ICTSI* on September 17, 2013.He is also the Global Head for Tax and Regional Legal Manager for the Americas of ICTSI*.Atty. Gorospe is a Director and the Corporate Secretary of Davao Integrated Port & StevedoringServices Corp., Mindanao International Container Terminal Services, Inc., Cordilla PropertiesHoldings, Inc.; the Assistant Secretary of International Container Terminal Holdings, Inc., GlobalProcurement Ltd., ICTSI Ltd., ICTSI Honduras Ltd. and ICTSI Georgia Corp.; and a Director of ICTSIFar East Pte. Ltd., ICTSI South Asia Pte. Ltd., Tungsten RE Ltd., and Consultports S.A. de C.V.
Atty. Gorospe joined ICTSI* in 2003 as a Tax Manager. Prior to this, he worked with the TaxDepartment of SyCip Gorres Velayo & Co. (a member firm of Ernst & Young Global Limited) forfive (5) years and with its Audit Department for one (1) year.
Atty. Gorospe completed his law degree at the University of the Philippines, Diliman. He is also aCertified Public Accountant. He graduated from Xavier University with a degree of Bachelor ofScience in Commerce, major in Accounting.
*Publicly-listed Corporation
76
Regional Heads and Global Corporate Officers for the ICTSI group of companies
Andrew James Dawes, age 46, British
Mr. Dawes is the Senior Vice President, Regional Head – Asia Pacific of the ICTSI* Group.
Mr. Dawes is the Director and Chairman of Victoria International Container Terminal Limited, andPakistan International Container Terminal Limited; the Director and President of ICTSI Subic, Inc.; anda Director of Yantai International Container Terminal Limited, ICTSI South Pacific Limited, MotukeaInternational Terminal Limited, South Pacific International Container Terminal Limited, and Subic BayInternational Container Terminal Corporation.
Prior to his current role, Mr. Dawes was Managing Director of APM Terminals Salalah in Oman.He also held senior roles in multinational port management companies in Europe, the Middle East,Africa and the Americas. He was chief executive officer of Intels Nigeria Ltd. in Lagos, managingdirector and chief operations officer of various APM Terminals in both regional and concessionslocations in Africa and the Middle East. He likewise held key roles in DP World, P&O Ports, andSouthampton Container Terminal in the UK.
*Publicly-listed Corporation
Christian Martin R. Gonzalez, age 43, Filipino
Mr. Gonzalez is the Senior Vice President, Global Corporate Head of the ICTSI* Group. He recentlyserved as Vice President, Regional Head – Asia Pacific.
Prior to his current role, he served as the Director General and Chief Executive Officer (CEO) ofMadagascar International Container Terminal Services Ltd. (MICTSL), which operates the port inToamasina, Madagascar, and thereafter, appointed as the Vice President and Head of Asia PacificRegion & Manila International Container Terminal.
When he first joined the ICTSI Group in 1997, he worked in various Operations departments before hewas appointed as the Assistant Manager for Special Projects of ICTSI Ltd. He was named MICTOperations Manager in 2003. In 2006, he was designated as the Chief Operating Officer and later CEOof MICTSL in 2009. In 2010, he was designated as a Director of Bloomberry Resorts and Hotels, Inc.and The Country Club. In 2012, Mr. Gonzalez was appointed as the Head of ICTSI’s BusinessDevelopment for Asia region. He was also appointed as the President of ICTSI Foundation, Inc. onApril 15, 2016. He is currently the Chairman and President of Cavite Gateway Terminal, Inc., LagunaGateway Inland Container Terminal, Inc., President of ICTSI Asia Pacific Business Services, Inc.,Chairman and President of Intermodal Terminal Holdings, Inc., President of IW Cargo Handlers, Inc.,ICTSI D.R. Congo S.A. and Subic Bay International Terminal Holdings, Inc.; the Chairman of, ICTSISubic, Inc., Cordilla Properties Holdings, Inc., and ICTSI Far East Pte. Ltd.; President Commissionerof PT ICTSI Jasa Prima Tbk.; a Director Yantai International Container Terminal Ltd., Director ofBauan International Port, Inc., Davao Integrated Port & Stevedoring Services Corp., Hijo InternationalPort Services, Inc., Chairman of Mindanao International Container Terminal Services, Inc., DirectorSouth Cotabato Integrated Ports Services, Inc., Director of Subic Bay International Terminal Corp.,Sociedad Puerto Industrial Aguadulce S.A., Contecon Guayaquil S.A., ICTSI Honduras Ltd., ICTSILtd., ICTSI (Hong Kong) Ltd., International Container Terminal Services Private Limited, AbbotsfordHoldings, Inc., IWI Container Terminal Holdings, Inc., ICTSI Project Delivery Services Co. Pte. Ltd.,ICTSI South Asia Pte. Ltd., ICTSI South Pacific Limited, Motukea International Terminal Limited,South Pacific International Container Terminal Limited, Asiastar Consultants Limited, Tungsten RELtd., Manila North Harbour Port, Inc., Bloomberry Resorts Corporation*, Sureste Properties, Inc., andPrime Metroline Transit Corporation; and a Commissioner of PT Makassar Terminal Services.

77
Mr. Gonzalez is a graduate of Instituto de Estudios Superiores de la Empresa (IESE) Business School,the graduate school of management of the University of Navarra, in Barcelona, Spain, where hereceived his Bilingual Masters in Business Administration. He is also a graduate of BusinessAdministration from Pepperdine University in California.
*Publicly-listed Corporation
Anders Kjeldsen, age 49, Danish
Mr. Kjeldsen is the Senior Vice President, Regional Head – Latin America of the ICTSI* Group. He islikewise a Director of Sociedad Puerto Industrial Aguadulce S.A.. Prior to joining ICTSI*, he served asHead of Latin America portfolio for APM Terminals until January 2017. Before moving to LatinAmerica, he was appointed as portfolio Chief Operation Officer for Global Ports Investment PLC.(GPI, PLC.) in Russia for 3 years.
Prior to his role in GPI PLC., Mr. Kjeldsen headed the APM Terminals West Med where he wasresponsible for a total of 5 million TEU capacity, being the business units in Algeciras and Tangier. Hejoined the A.P. Moller-Maersk Group in 1991. During the last 28 years, he worked in most disciplinesof the container terminal industry. He has been involved in terminal operations in most parts of theworld such as Denmark, Germany, Netherlands, Spain, Russia and Panama.
Mr. Kjeldsen is an officer from the Danish Army and undertook several executive developmentprograms at Wharton and IMD.
*Publicly-listed Corporation
Hans-Ole Madsen, age 53, Danish
Mr. Hans-Ole Madsen is the Senior Vice President, Regional Head for Europe and Middle East andAfrica of the ICTSI* Group. Concurrently, he is the Chairman of ICTSI DR Congo S.A.; a DeputyChairman of Adriatic Gate Container Terminal; and a Director of the following ICTSI subsidiaries:Pakistan International Container Terminal Limited, Baltic Container Terminal Ltd., BatumiInternational Container Terminal LLC; ICTSI (M.E.) DMCC, ICTSI Middle East DMCC, LekkiInternational Container Terminal Services LFTZ Enterprise, and Madagascar International ContainerTerminal Services, Ltd.
Mr. Madsen has more than 30 years of international experience within the port, shipping & logisticindustry.
*Publicly-listed Corporation
Sandy Alipio, age 48, Filipino
Mr. Alipio is the Chief Risk Officer and Vice President for Business Process, Strategy and Controls ofthe ICTSI* Group effective March 6, 2019. Before his current role, he was Vice President for Auditand Compliance.
Prior to his work at ICTSI*, he spent a decade working for the San Francisco-based, ElanPharmaceuticals, holding several positions such as Internal Control, Senior Director, R&D Finance,Vice President of BioNeurology Finance and the Vice President of Internal Audit & SOX.
From 2000 to 2004, Mr. Alipio was a Senior Manager for Audits and Business Advisory at KPMG LLPin San Francisco. He was with Makati-based SGV and Co. from 1994 and was seconded in Chicagoback in 1997. He was also a Manager for Assurance and Business Advisory Services in 2000.

78
A Certified Internal Auditor and a Certified Public Accountant, Mr. Alipio is a graduate of Universityof the Philippines, Diliman.
*Publicly-listed Corporation
Caroline C. Causon, age 41, Filipino
Ms. Causon is the Vice President for Financial Planning and Budgeting of the ICTSI* Group. She wasappointed to the said position in April 2018. She is also currently a Director of Batumi InternationalContainer Terminal Ltd.
Prior to ICTSI, she handled various senior assurance and financial advisory roles at SyCip GorresVelayo & Co. (a member firm of Ernst & Young Global Limited), Manabat Sanagustin & Co. (amember firm of KPMG International) and the Rizal Commercial Banking Corporation.
Ms. Causon is a Certified Public Accountant. She graduated from the University of Santo Tomas with adegree in Bachelor of Science in Accountancy (Cum Laude) in 1999.
*Publicly-listed Corporation
Michael Robin Cruickshanks, age 61, British
Mr. Cruickshanks is the Vice President for Global Corporate Human Resources of the ICTSI* Group.Mr. Cruickshanks has extensive experience within the field of human resources in the industries ofinvestment banking and logistics. Prior to ICTSI, Mr. Cruickshanks was the HR advisor to NationalCommercial Bank in Jeddah, Saudi Arabia. He also worked for global Swiss-based logistics companyPanalpina World Transport in the role of Global Head of Compensation and Benefits, covering 16,000plus employees in over 90 countries. Mr. Cruickshanks also held the position of Managing Director,Compensation and Benefits for the Dutch investment bank, Rabobank International. From 1993 - 1999,he was based in Madrid, Spain and New York, U.S.A. for Santander Investment to serve as GlobalHead of Compensation & Benefits as well as parallel generalists role supporting front line staff.
Mr. Cruickshanks holds a BSc (Honours) degree in Zoology from Newcastle University as well asPost-graduate Diploma in Business Information Technology.
*Publicly-listed Corporation
Brian Mark Hibbert, Age 51, British
Mr. Hibbert was appointed as Chief Information Officer of the ICTSI* Group on October 1, 2018 afterheading operational technology within the Group for several months.
Prior to joining ICTSI, Brian served as Head of Operations Technology and Transformation Leader in aglobal capacity for APM Terminals and as Vice President of Product Management for web-basedlogistics start-up International Asset Systems, Inc. in Oakland, CA. USA. Brian also served in multipleleadership roles between 1995 to 2008 as a member of the original pioneering team that grew NavisLLC, a terminal systems provider, into the market leading position it maintains today.
Brian was educated in the United Kingdom at Palmers College and later studied Product Managementand Marketing at Caltech in Pasadena, California. He graduated the APM Terminals Magnum programheld in conjunction with Esade of Barcelona in 2013.
*Publicly-listed Corporation

79
Vivien F. Miñana, age 54, Filipino
Ms. Miñana was appointed in 2006 as the Vice President and Senior Administration Officer of theICTSI* Group and ICTSI Ltd. Prior to her appointment in 2006, she was the Vice President andController of ICTSI* and ICTSI Ltd. from 2000 to 2006. Currently, Ms. Miñana is the Treasurer ofContainer Terminals Systems Solutions Philippines, Inc.
A Certified Public Accountant, Ms. Miñana received her Master’s Degree in Business Managementfrom the Asian Institute of Management in Manila, and is a graduate of BS Accounting from the De LaSalle University, Manila.
*Publicly-listed Corporation
Tico Wieske, age 55, Dutch
He is the Vice President for Global Commercial of the ICTSI* Group.
Mr. Wieske is a Director of Victoria International Container Terminal Limited and MotukeaInternational Terminal Limited. Before joining ICTSI*, he was the Global Head of Key ClientManagement Asia Carriers of APM Terminals, Hongkong. Prior to this, he was the Chief CommercialOfficer of APM Terminals, Asia Pacific Region. He represented APM Terminals in various boardsincluding, ACT Aqaba Container Terminal in Jordan, APMT Port of Bahrain, SAGT South Asia GateWay Terminals in Colombo Sri Lanka, SETV Abidjan Ivory Coast, DIT Douala Cameron and MPS inTema, Ghana.
Mr. Wieske earned his B.A. Economics degree in J. van Zwijndregt in Hague, the Netherlands.
Johan Swart, age 60, South African
Mr. Swart is Vice President, Head of Global Engineering – Equipment Maintenance of the ICTSI*Group effective March 6, 2019.
Prior to his current role, Mr. Swart served as Vice President for Maintenance at Global ContainerTerminals in Canada. From 2008 to 2015, he was Head of Engineering at APM Terminals in Ghana andNigeria. He also spent 30 years working for Transnet Port Terminals in Cape Town, holding severalpositions such as Container Crane Commissioning Electrician, Technical Assistant – ElectricalEngineering Container Cranes, Senior Technical Supervisor – Electrical Engineering Container LiftingEquipment and Technical Manager – Electrical and Mechanical.
Mr. Swart holds a National Technical Certificate in Electrical Engineering.
*Publicly-listed Corporation
Tricianne M. Zingapan, age 47, Filipino
Ms. Zingapan is the Vice President for Global Corporate Audit and Compliance for the ICTSI* Groupeffective March 6, 2019.
Prior to joining ICTSI Group, she was the Head of Internal Audit for Coca-Cola FEMSA Philippines.Ms. Zingapan spent more than 6 years with Coca-Cola FEMSA Philippines starting in 2012 where sheheld several leadership positions including National Key Accounts Finance Head, Financial Planning &Analysis Head, Internal Controls & Finance Transformation Head and Head of Internal Audit. Hercareer in Coca-Cola FEMSA included an assignment in Mexico with the Corporate Controllershipgroup.

80
She spent close to a decade in Shell holding various roles and leadership positions, including RetailFinance Head, Asia-Pacific Aviation Regional Finance Head based in Singapore and thereafter, as theLPG Philippine Finance Head while playing an important role in the Philippines LPG Portfolio Projectfor Shell.
Early in her career, she worked in Singapore as an Associate/Consultant for AT Kearney and as an e-Procurement Account Manager for Ariba.
Ms. Zingapan received her Bachelor of Science in Business Administration and Accountancy from theUniversity of the Philippines, Diliman (Cum Laude) and a Master’s degree in Business Administrationfrom the JL Kellogg Graduate School of Business, Northwestern University in the USA.
*Publicly-listed Corporation
The Directors of the Company are elected at the Annual Stockholders’ Meeting to hold office until thenext succeeding annual meeting, and until their respective successors have been elected and qualified.
Except for the Chairman, Enrique K. Razon, Jr., all Directors are nominees as they do not haveshareholdings sufficient to elect themselves to the Board.
9.1 Significant Employees
No person who is not an executive officer of ICTSI is expected to make a significant contribution toICTSI.
9.2 Family Relationships
Stephen A. Paradies is the brother-in-law and Christian R. Gonzalez is the nephew of Chairmanand President, Enrique K. Razon, Jr. There are no other family relationships among the directorsand officers listed.
9.3 Involvement in Certain Legal Proceedings
ICTSI is not aware of any of legal cases which occurred during the past five years that are materialto an evaluation of the ability or integrity of any of its directors, executive officers or controllingperson.

81
Item 10. Executive Compensation
The aggregate compensation paid to the Chairman of the Board and President, and four (4) highest paidexecutive officers named below, as a group, for 2018 amounted to US$2.6 million(2017: US$2.5 million). The estimated amount of compensation expected to be paid in 2019 to theChairman of the Board and President and four (4) highest paid executive officers as a group, amountedto US$2.4 million.
Name and Principal Position Year Salary Bonus and Others4 Total5
Enrique K. Razon, Jr.Chairman of the Board and PresidentMartin O’Neil1
Executive Vice-PresidentRafael D. Consing, Jr.Senior Vice-President, Chief Financial Officer
and Compliance OfficerJose Joel M. SebastianSenior Vice-President, FinanceGigi Iluminada T. Miguel2
Vice-President and TreasurerBenjamin M. Gorospe IIIAssistant Corporate SecretaryChairman of the Board and President and four
(4) highest paid executive officers, as a group2019
(Estimate) US$0.3M US$2.1M US$2.4M2018 (Actual) 0.4M 2.2M 2.6M2017 (Actual) 0.4M 2.1M 2.5M
All officers and Directors, as a group,Unnamed3
2019(Estimate) 1.4M 8.8M 10.2M
2018 (Actual) 1.2M 6.5M 7.7M2017 (Actual) 1.2M 6.8M 8.0M
1Retired on June 1, 20182Appointed on May 2, 20183Including four (4) highest paid executive officers4Mainly includes non-cash compensation based on Stock Incentive Plan paid out of the allocated Treasury Shares of ICTSI5Includes total compensation paid in the Philippines by the registrant and its subsidiaries
The members of the Board of Directors receive directors’ fees as compensation in accordance withthe Company’s By-Laws. There are no material terms of any other arrangements or contractswhere any director of ICTSI was compensated or is to be compensated, directly or indirectly, in2017, 2018 or in the coming year, for any service provided as a director.
Named executive officers are covered by Letters of Appointment with the Company stating thereintheir respective terms of employment.
There are no existing compensatory plans or arrangements, including payments to be received fromICTSI by any named executive officer from a change-in-control of the Company, except for theautomatic vesting of awarded shares under the Stock Incentive Plan referred to below.
Certain officers were granted awards under the Stock Incentive Plan (SIP) in 2016, 2017 and 2018.Discussion on the SIP is further disclosed in Note 19, Share-based Payment Plan, to the AnnualAudited Consolidated Financial Statements.

82
Item 11. Security Ownership of Certain Beneficial Owners and Management11.1 Security Ownership of Certain Record and Beneficial Owners
The following are known to the registrant to be directly or indirectly the record orbeneficial owner of the more than five (5) percent of registrant’s vot ing securities as ofDecember 31, 2018:
Title ofClass
Name, Address ofRecord Owner andRelationship withIssuer
Name of Beneficial Ownerand Relationship withRecord Owner
Citizenship No. ofShares Held
Percentage*
Common PCD NomineeCorporation (Non-Filipino)Makati Stock ExchangeBldg.,Ayala Avenue,Makati City 1200
The Hongkong & ShanghaiBanking Corp. Ltd. – Clients’Acct. - 4/F HSBC Centre 3058Fifth Avenue West BonifacioGlobal City Taguig 1634Represented by Maris Flores,Senior Vice President and Head,HSBC Securities Services andKathy Dela Torre, Senior VicePresident Client Services, onlyholds a legal title as custodian,and is not the beneficial owner ofthe lodged shares.shares.
Foreign 285,356,339(Lodged with
PCD)Indirect
10.51%
Common PCD Nominee Corporation(Non-Filipino)Makati Stock ExchangeBldg.,Ayala Avenue,Makati City 1200
Deutsche Bank Manila - Clients’Acct. - 23/F Tower One andExchange Plaza, Ayala Triangle,Ayala Avenue, 1226 Makati CityRepresented by Carlos DelaTorre, Head of Securities andCustody Operations, only holdslegal title as custodian in favor ofvarious clients, and is not thebeneficial owner of the lodgedshares.
Foreign 280,246,981(Lodged with
PCD)Indirect
10.32%
Common PCD Nominee Corporation(Filipino)Makati Stock ExchangeBldg.,Ayala Avenue,Makati City 1200
AB Capital Securities, Inc.,Units 1401-1403, 14th Floor,Tower One, Ayala Triangle,Ayala Avenue, Makati City 1200Represented by Victor L. Vital,President; Ericsson C. Wee, FirstVice, President; and LambertoM. Santos, Jr., Senior Advisor(effective January 1, 2018), onlyholds a legal title as custodianand is not the beneficial ownerof the lodged shares
Filipino 514,320,005(Lodged
with PCD)Indirect
18.95%
Common Bravo International PortHoldings, Inc.104 H.V. dela Costa St.,17-19 Floors LibertyCenter Salcedo Village,Makati City 1200
Bravo International PortHoldings, Inc. represented byEnrique K. Razon, Jr., itsPresident
Filipino 279,675,000 10.30%
Preferred B Achillion Holdings, Inc.104 H.V. dela Costa St.,17-19 Floors LibertyCenter Salcedo Village,Makati City 1200
Achillion Holdings, Inc.represented by Enrique K.Razon, Jr., its President
Filipino 700,000,000 25.78%
* Percentage ownerships were computed using total number of issued and outstanding common shares, preferred B votingshares and preferred A non-voting shares of 2,714,801,931 (which excludes treasury shares) as of December 31, 2018.

83
11.2 Security Ownership of Management as of December 31, 2018
Title ofClass Name Number of shares and nature
of beneficial ownership Citizenship Percentage 1
Common &Preferred B Enrique K. Razon, Jr.2 1,681,105,057 Direct &
Indirect Filipino 61.92%3
Common Andres Soriano III 3,150,481 Direct &Indirect American 0.12%
Common Stephen A. Paradies 4,087,573 Direct Filipino 0.15%
Common Jose C. Ibazeta 2,775,710 Direct Filipino 0.10%
Common Octavio Victor R.Espiritu 300,000 Direct Filipino 0.01%
Common Silverio Benny J. Tan 273,000 Direct Filipino 0.01%
Common Joseph R. Higdon 156,000 Direct American 0.01%
Common Rafael D. Consing, Jr. 123,527 Direct Filipino 0.00%
Common Jose Joel M. Sebastian 51,326 Direct Filipino 0.00%
Common Gigi Iluminada T.Miguel 9,504 Direct Filipino 0.00%
Common Benjamin M. Gorospe III 1,662 Direct Filipino 0.00%
Common Rafael T. Durian 1,000 Direct Filipino 0.00%
1 Percentage ownerships were computed using total number of issued and outstanding common shares,preferred B voting shares and preferred A non-voting shares of 2,714,801,931 (which excludestreasury shares) as of December 31, 2018.
2 Shares in the name of Enrique K. Razon, Jr. and Razon Group.3 The percentage ownership of Enrique K. Razon, Jr. and the Razon Group is at 62.01% if based on
the total number of issued and outstanding common shares and preferred B voting shares of2,711,001,931 (which excludes treasury shares and preferred A non-voting shares) as ofDecember 31, 2018.
11.3 Voting Trust Holders of 5% or More
None
11.4 Changes in Control
None

84
Item 12. Certain Relationships and Related Transactions
Transactions with Related PartiesThe table below summarizes transactions with related parties for the last three years, as disclosedin the accompanying consolidated financial statements:
2016 2017 2018
Related Party Relationship Nature of Transaction Amount
OutstandingReceivable
(Payable)Balance Amount
OutstandingReceivable
(Payable)Balance Amount
OutstandingReceivable
(Payable)Balance
(In Millions)ICBVSPIA Joint venture Interest-bearing loans (see
Note 8) (i) US$52.00 US$249.20 US$25.40 US$269.48 US$2.80 US$–Interest income (converted
into interest-bearingloan) (see Note 8) (i) 12.45 19.98 15.52 35.50 13.35 –
Interest receivable (i) 14.58 7.43 17.75 9.05 14.35 –SPIA Spain S.L.SPIA Joint venture Interest-bearing loans (see
Note 8) (i) – – – – (1.29) 270.99Interest income (converted
into interest-bearingloan) (see Note 8) (i) – – – – 4.41 53.26
Interest receivable (i) – – – – 4.95 9.73YICTYPH Non-controlling
shareholderPort fees (ii)
1.77 – 1.59 – 0.32 0.15Trade transactions (iii) – – – – 0.87 (0.07)Interest-bearing loans (iv) 21.60 (21.60) 21.60 – – –Interests on loans (iv) 0.07 (0.03) 0.28 – – –
YPG Commonshareholder
Port fees (ii)
2.36 (0.14) 3.10 (0.17) 3.86 (0.90)Trade transactions (iii) 1.87 (0.02) 1.66 – 1.74 (0.20)
SCIPSIAsian Terminals,
Inc.Non-controlling
shareholderManagement fees
0.20 (0.03) 0.17 (0.02) 0.19 (0.02)AGCTLuka Rijeka D.D.
(Luka Rijeka)Non-controlling
shareholderProvision of services (v)
0.37 (0.02) 0.25 (0.04) 0.32 (0.03)
PICTPremier Mercantile
Services (Private)Limited
CommonShareholder
Stevedoring and storagecharges (vi)
5.17 (0.03) 5.50 (0.40) 2.09 (0.01)Premier Software
(Private) LimitedCommon
shareholderSoftware maintenance
charges 0.01 – – – – –Marine Services
(Private) Limited,PortlinkInternational(Private) Limited,and AMI Pakistan(Private) Limited
Commonshareholder
Container handlingrevenue (vii)
0.52 0.03 0.37 0.01 0.13 –LGICTNCT Transnational
Corp.Non-controlling
shareholderManagement fees
0.41 (0.04) 0.47 (0.04) 0.45 (0.03)Maintenance and repairs 0.09 (0.02) 0.14 (0.01) 0.13 (0.02)
BIPIAtlantic Gulf and
Pacific Co. ofManila, Inc.(AG&P)
Commonshareholder
Rent expense
0.05 (0.02) 0.06 (0.02) 0.09 (0.03)Utilities 0.03 – 0.03 – 0.03 (0.01)
IDRCLedya SARL Non-controlling
shareholderManagement fees
– – 0.85 (0.85) 1.43 (0.53)
Parent CompanyPrime Metro
BMDCorporation
Commonshareholder
Construction services (viii)
– – – – 4.73 5.73Dredging services (viii) – – – – 1.41 0.40Rental income – – – – 0.22 –
CGTPrime Metro
BMDCorporation
Commonshareholder
Contract administrationand site managementservices (ix) – – 0.10 (0.02) 0.61 (0.25)

85
(i) On October 1, 2018, ICBV assigned to SPIA Spain S.L. all its outstanding interest-bearing loans, including interest converted into interest-bearing loan, and interestreceivable with SPIA as of the same date, amounting to US$321.1 million and US$9.6 million, respectively.
(ii) YICT is authorized under the Joint Venture Agreement to collect port charges levied on cargoes; port construction fees and facility security fee in accordance with governmentregulations. Port fees remitted by YICT for YPH /YPG are presented as part of “Port authorities’ share in gross revenues” in the consolidated statements of income.Outstanding payable to YPH/YPG related to these port charges are presented under “Accounts payable and other current liabilit ies” account in the consolidated balancesheets.
(iii) Trade transactions include utilities, rental and other transactions paid by YICT to YPH and YPG.
(iv) On December 5, 2016, YICT obtained a US$21.6 million (RMB150.0 million) short-term loan from YPH at an interest rate of 4.35 percent per annum and maturity date ofJanuary 25, 2017. The loan was used to refinance YICT’s maturing loan with ABC. On January 12 and March 1, 2017, YICT prepaid a total amount of US$3.0 million(RMB20.0 million) and the balance of US$18.9 million (RMB130 million) was renewed with an interest rate of 4.50 percent per annum and a maturity date of April 30, 2017.The remaining loan from YPH was fully paid upon the availment of a long-term loan from ABC on April 26, 2017 (see Notes 15.2.4 and 17).
(v) AGCT has entered into agreements with Luka Rijeka, a non-controlling shareholder, for the latter’s provision of services such as equipment maintenance, power and fuel andsupply of manpower, among others. Total expenses incurred by AGCT in relation to these agreements were recognized and presented in the consolidated statements of incomeas part of Manpower costs, Equipment and facilities-related expenses and Administrative and other operating expenses.
(vi) PICT has entered into an agreement with Premier Mercantile Services (Private) Limited for the latter to render stevedoring and other services, which are settled on a monthlybasis.
(vii) Marine Services (Private) Limited, Portlink International (Private) Limited, and AMI Pakistan (Private) Limited are customers of PICT.
(viii) ICTSI has entered into contracts with Prime Metro BMD Corporation for the construction of port facilities and sublease of office space.
(ix) CGT has entered into contract with Prime Metro BMD Corporation for contract administration and site management services.
The outstanding balances arising from these related party transactions are current and payablewithout the need for demand.
Outstanding balances at year-end are unsecured and interest-free and settlement occurs in cash.There have been no guarantees provided or received for any related party receivables or payables.For the years ended December 31, 2016, 2017 and 2018, the Group has not recorded anyimpairment of receivables relating to amounts owed by related parties. This assessment isundertaken each financial year through examining the financial position of the related party and themarket in which the related party operates.

86
PART V – CORPORATE GOVERNANCE
Item 13. Corporate Governance
Compliance with Leading Practice on Corporate Governance
The Group adopted a Manual on Corporate Governance in January 2003. Its latest Revised Manual onCorporate Governance (“CG Manual”), pursuant to SEC Memorandum Circular 19-2016, wassubmitted to the Philippine SEC on May 31, 2017 and is available in the Company website. LastJanuary 29, 2018, the Company, through its Compliance Officer, submitted a Certificate attesting to itsfull compliance with the objectives set forth in the CG Manual. The Company has not deviated from itsCG Manual and further commits itself to principles and best practices of governance in the attainmentof corporate goals.
Presently, the Compliance Officer is Rafael D. Consing, Jr. The Compliance Officer coordinates withthe SEC with respect to compliance requirements; monitors compliance with the CG Manual; andreports any governance-related issues to the Board.
On December 10, 2018, the Board approved the updated the internal self-rating and evaluation systemto measure compliance with the CG Manual by the Board of Directors and top-level management, aswell as observe and maintain high standards by the Company for leading practices on good corporategovernance. The Board is also responsible for ensuring accountability, fairness and transparentcorporate governance, and the implementation of the Company’s vision, mission, and strategicobjectives, including the means to effectively monitor the management’s performance.
The Company continues to improve its systems and processes to enhance adherence to andstrengthen practices of good corporate governance. In compliance with the latest mandates of theSEC such as those provided under SEC Memorandum Circular 19-2016 and incorporated in the CGManual, the Company has implemented significant developments. Among others, the Board hasestablished the Corporate Governance Committee, Board Risk Oversight Committee and RelatedParty Transactions Committee in addition with the Audit Committee, Nomination Subcommitteeand Remuneration Subcommittee. To achieve an appropriate mix of competence and expertise, thecomposition of the Board is checked against prevailing requirements. To ensure diversity andallow a healthy balance of ideas, wisdom and experience on the management and business ofICTSI, the Board is made to be a majority of Non-Executive Directors. The competence of theBoard is followed through by the Company by the conduct of annual continuing training for alldirectors and orientation program for first-time directors.
The Company also prioritizes healthy external relations. Through the Investor’s Relations Office,the Company effectively communicates and relates with all its stockholders as well as allstakeholders.
For the annual report on corporate governance, the SEC has recently implemented the use of theIntegrated Annual Corporate Governance Report (“I-ACGR”) by virtue of SEC Memorandum Circular15-2017. Accordingly, the Company submitted its 2017 I-ACGR last May 30, 2018. For the 2018I-ACGR, the Company is set to submit the same on or before the mandated deadline, which isMay 30, 2019.
In the previous years, ICTSI’s Independent Directors constitute at least 20% of the membership of theBoard, or two seats in the ICTSI Board, in accordance with prevailing laws. To further promote bestpractices in good corporate governance, the Board has elected its third Independent Directorlast February 2019.

87
PART VI – EXHIBITS AND SCHEDULES
Item 14. Reports on SEC Form 17-C
The following is a summary of submissions of SEC Form 17-C filed during the year 2018:
Date Filed ParticularsDecember 27, 2018 Share Buy-back transactionDecember 17, 2018 Share Buy-back transactionDecember 14, 2018 Clarification of News Report: PCC to require more information on ICTSI North Harbor dealDecember 13, 2018 Share Buy-Back transactionDecember 3, 2018 Jon Ramon Aboitiz passes onNovember 26, 2018 Share Buy-Back transactionNovember 26, 2018 Additional disclosure on Share Buy-back transactionsNovember 20, 2018 Share Buy-Back transactionNovember 12, 2018 Submission of a Letter of Intent to the PPA to develop two ports in IloiloNovember 7, 2018 3Q 2018 Revenue Increase ReleaseNovember 7, 2018 3Q 2018 Earnings ReleaseOctober 26, 2018 3Q 2018 Investors´ Briefing NoticeSeptember 6, 2018 ICTSI acquires additional 15.17% of MNHPIAugust 7, 2018 2Q 2018 Earnings ReleaseAugust 7, 2018 2Q 2018 Revenue Increase ReleaseJuly 30, 2018 2Q 2018 Investors´ Briefing Notice
July 13, 2018 ICTSI declared Preferred Bidder to operate, manage and develop the South Port Container Terminal(SPCT) at the port of Port Sudan, Republic of the Sudan.
June 27, 2018 Share Buy-Back transactionJune 26, 2018 Share Buy-Back transactionJune 18, 2018 Change in Number of Issued and/or Outstanding SharesMay 9, 2018 1Q 2018 Earnings ReleaseMay 2, 2018 Retirement and Appointment of officersApril 30, 2018 Share Buy-Back transactionApril 27, 2018 1Q 2018 Investors´ Briefing NoticeApril 27, 2018 Share Buy-Back transactionApril 26, 2018 Share Buy-Back transactionApril 25, 2018 Share Buy-Back transactionApril 19, 2018 Results of 2018 Annual Stockholders´ MeetingApril 19, 2018 Results of 2018 Organizational Meeting of Board of DirectorsApril 19, 2018 2018 Cash Dividend DeclarationMarch 27, 2018 Share Buy-Back transactionMarch 23, 2018 Share Buy-Back transactionMarch 14, 2018 Change in Issued and Outstanding SharesMarch 8, 2018 Release of US$150M to unappropriated retained earningsMarch 7, 2018 FY2017 Earnings ReleaseMarch 7, 2018 FY 2017 Revenue Increase releaseFebruary 27, 2018 FY 2017 Investors´ Briefing NoticeFebruary 19, 2018 Notice of Annual Stockholders' MeetingFebruary 2, 2018 Clarification of News Report: Razon wins againFebruary 1, 2018 ICTSI Papua New Guinea subsidiary starts operationJanuary 11, 2018 ICTSI announces the issuance of additional Senior Perpetual SecuritiesJanuary 11, 2018 ICTSI announces the Terms and Conditions of New Senior Perpetual SecuritiesJanuary 5, 2018 ICTSI Announces its Guarantee of New Senior Perpetual Securities
Note: Unless otherwise indicated, no financial statements were filed with the above reports.
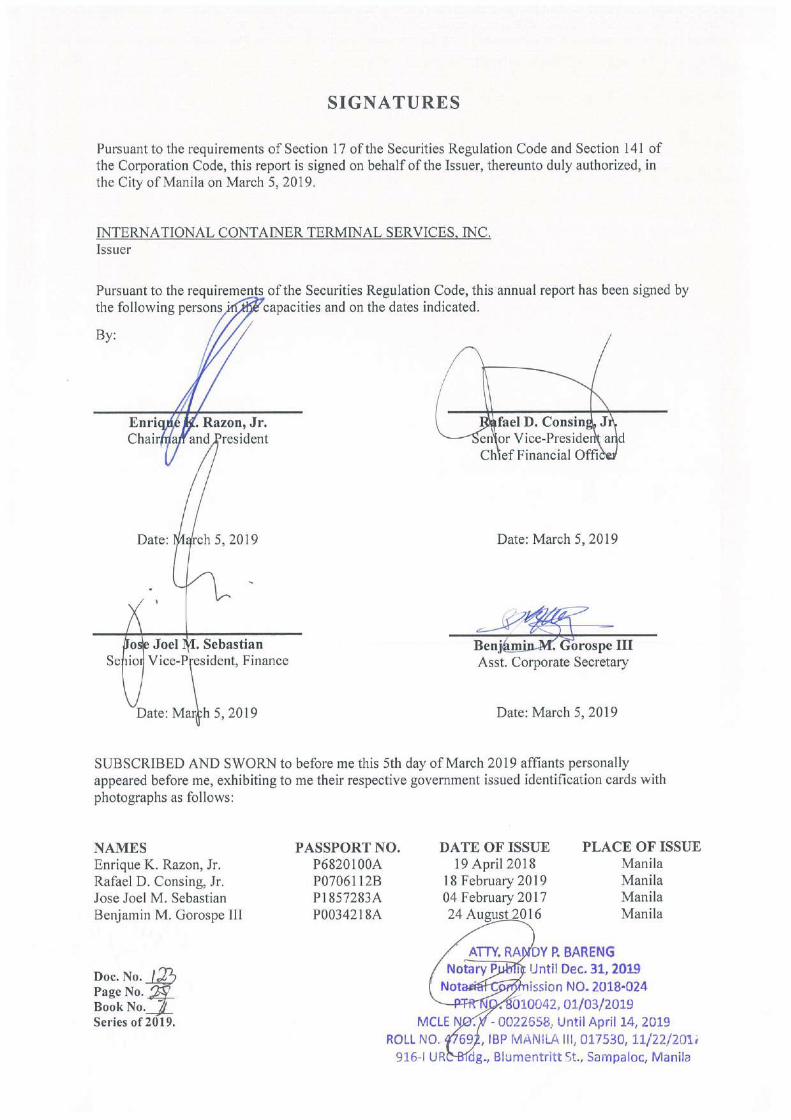

INDEX TO CONSOLIDATED FINANCIAL STATEMENTS AND
SUPPLEMENTARY SCHEDULES
Consolidated Financial Statements Page NumberStatement of Management’s Responsibility for
Financial Statements F1Report of Independent Public Accountants F2Consolidated Balance Sheets as of December 31, 2016, 2017 and 2018 F3Consolidated Statements of Income for the Years Ended
December 31, 2016, 2017 and 2018 F4Consolidated Statements of Comprehensive Income for the Years Ended
December 31, 2016, 2017 and 2018 December 31, 2016, 2017 and 2018F5Consolidated Statements of Changes in Equity for the Years Ended
December 31, 2016, 2017 and 2018 F6Consolidated Statements of Cash Flows for the Years Ended
December 31, 2016, 2017 and 2018 F7Notes to Consolidated Financial Statements F8
Supplementary SchedulesReport of Independent Public Accountants on
Supplementary Schedules S1A. Financial Assets S2B. Amounts Receivable from Directors, Officers, Employees, Related
Parties and Principal Stockholders (Other than Related Parties) S3C. Amounts Receivable from Related Parties which are Eliminated
during the Consolidation of Financial Statements S4D. Intangible Assets – Other Assets S5E. Long-term Debt S6F. Indebtedness to Affiliates and Related Parties (Long-term Loans from
Related Companies) S7G. Guarantees of Securities of Other Issuers S8H. Capital Stock S9I. Amounts Payable to Related Parties which are Eliminated during the
Consolidation of Financial StatementsS10
J. Parent Company Retained Earnings Available for DividendDeclaration
S11
K. Map of Subsidiaries S12L. List of Effective Standards and Interpretations as of December 31,
2018M. Financial Soundness Indicators
S13
S14


*SGVFS033016*
INDEPENDENT AUDITOR’S REPORT
The Stockholders and the Board of DirectorsInternational Container Terminal Services, Inc.ICTSI Administration BuildingMICT South Access Road, Manila
Opinion
We have audited the consolidated financial statements of International Container Terminal Services, Inc.(ICTSI) and its subsidiaries (the Group), which comprise the consolidated balance sheets as atDecember 31, 2016, 2017 and 2018, and the consolidated statements of income, consolidated statementsof comprehensive income, consolidated statements of changes in equity and consolidated statements ofcash flows for each of the three years in the period then ended, and notes to the consolidated financialstatements, including a summary of significant accounting policies.
In our opinion, the accompanying consolidated financial statements present fairly, in all material respects,the consolidated financial position of the Group as at December 31, 2016, 2017 and 2018, and itsconsolidated financial performance and its consolidated cash flows for each of the three years in theperiod then ended in accordance with Philippine Financial Reporting Standards (PFRSs).
Basis for Opinion
We conducted our audits in accordance with Philippine Standards on Auditing (PSA). Our responsibilitiesunder those standards are further described in the Auditor’s Responsibilities for the Audit of theConsolidated Financial Statements section of our report. We are independent of the Group in accordancewith the Code of Ethics for Professional Accountants in the Philippines (Code of Ethics), together withthe ethical requirements that are relevant to our audit of the consolidated financial statements in thePhilippines, and we have fulfilled our other ethical responsibilities in accordance with these requirementsand the Code of Ethics. We believe that the audit evidence we have obtained is sufficient and appropriateto provide a basis for our opinion.
Key Audit Matters
Key audit matters are those matters that, in our professional judgment, were of most significance in ouraudit of the consolidated financial statements of the current period. These matters were addressed in thecontext of our audit of the consolidated financial statements as a whole, and in forming our opinionthereon, and we do not provide a separate opinion on these matters. For each matter below, ourdescription of how our audit addressed the matter is provided in that context.
SyCip Gorres Velayo & Co.6760 Ayala Avenue1226 Makati CityPhilippines
Tel: (632) 891 0307Fax: (632) 819 0872ey.com/ph
BOA/PRC Reg. No. 0001, October 4, 2018, valid until August 24, 2021SEC Accreditation No. 0012-FR-5 (Group A), November 6, 2018, valid until November 5, 2021
A member firm of Ernst & Young Global Limited
*SGVFS033016*
- 2 -
We have fulfilled the responsibilities described in the Auditor’s Responsibilities for the Audit of theConsolidated Financial Statements section of our report, including in relation to these matters.Accordingly, our audit included the performance of procedures designed to respond to our assessment ofthe risks of material misstatement of the consolidated financial statements. The results of our auditprocedures, including the procedures performed to address the matters below, provide the basis for ouraudit opinion on the accompanying consolidated financial statements.
Impairment Assessment of Goodwill and Finite Life Intangible Assets and Property and Equipment
Under PFRS, the Group is required to perform an impairment test on goodwill and intangible assets notyet available for use annually and on finite life intangible assets and property and equipment whenimpairment indicators exist. These impairment tests are significant to our audit because the balance ofgoodwill and finite life intangible assets and property and equipment of certain subsidiaries aggregatingUS$426.0 million as of December 31, 2018, is material to the consolidated financial statements. Inaddition, management’s assessment process is highly judgmental and involves significant estimationbased on assumptions, specifically the forecasted revenue growth, earnings before interest, tax,depreciation and amortization (EBITDA) margins, capital expenditures and weighted average cost ofcapital, which are affected by expected future market or economic conditions, in the country where thecash generating unit operates.
The Group’s disclosure about the impairment testing of goodwill, intangible assets not yet available foruse, finite life intangible assets and property and equipment are included in Note 10 to the consolidatedfinancial statements.
Audit Response
We involved our internal specialist to assist us in evaluating the assumptions and methodologies used bythe Group in its value-in-use calculation. These assumptions include the forecasted revenue growth,EBITDA margins, capital expenditures and weighted average cost of capital. We reviewed the basis andassumptions for estimates of free cash flows, in particular those relating to the forecasted revenue growthand EBITDA margins, which we compared against historical performance of the cash-generating unit,available comparable market data in the country where it is situated, regionally and worldwide or with theother subsidiaries of the Group in the region. We tested the parameters used in the determination of thediscount rate against market data. We also focused on the Group’s disclosures about those assumptions towhich the outcome of the impairment test is most sensitive, specifically those that have the mostsignificant effect on the determination of the recoverable amount of the goodwill, intangible assets not yetavailable for use and finite life non-financial assets.
Recognition of Deferred Income Taxes
The Group operates port terminals in nineteen (19) countries and holds a significant number of domesticand foreign legal entities with varying income tax laws, regulations and incentives worldwide. Due tothe inherent complexity related to the different income tax laws, management’s assessment process for
A member firm of Ernst & Young Global Limited

*SGVFS033016*
- 3 -
recognition of deferred tax assets and liabilities involves significant judgments. As of December 31, 2018,the Group recognized deferred tax assets amounting to US$158.3 million and deferred tax liabilitiesamounting to US$104.3 million. In addition, deferred tax liabilities has not been recognized forundistributed cumulative earnings amounting to US$1,211.1 million as of December 31, 2018 because theParent Company has control over these earnings.
The Group’s disclosure about deferred tax assets and liabilities are included in Note 21 to theconsolidated financial statements.
Audit Response
We involved our internal specialists in different countries to review the deferred tax computation made bymanagement. We tested the significant consolidation adjustments related to deferred taxes arising fromcapitalization of borrowing costs at the consolidated level and fair value adjustments arising frombusiness combination, among others. We also reviewed the basis for non-recognition of deferred taxliabilities on undistributed cumulative earnings by reviewing the historical and forecasted dividenddeclaration made by the entities with undistributed cumulative earnings.
Adoption of PFRS 15, Revenue from Contracts with Customers
Effective January 1, 2018, the Group adopted the new revenue recognition standard, PFRS 15, Revenuefrom Contracts with Customers, under the modified retrospective approach. The adoption of PFRS 15 issignificant to our audit because this involves the application of significant management judgment in theidentification of the contract for the rendering of port services that would meet the requirements ofPFRS 15; determination whether or not the port services included in the contract are separate performanceobligations; determination whether the transaction price for the port services performed includes anyvariable consideration or is allocable to each of the port services; and determination of the timing ofrecognition of revenue from the rendering of port services.
The disclosures related to the adoption of PFRS 15 are included in Note 3 to the consolidated financialstatements.
Audit Response
We obtained an understanding of the Group’s process in implementing the new revenue recognitionstandard. We reviewed the PFRS 15 adoption documentation and accounting policies prepared bymanagement, including revenue streams identification and scoping, and contract analysis. For significantrevenue streams, we obtained sample contracts and reviewed whether the accounting policiesappropriately considered the five-step model of PFRS 15. In addition, we checked whether all serviceswithin the contracts have been identified; and whether management has identified all components of thetransaction price. We also tested the standalone selling price for each of the services included within thesample of contracts. Further, we reviewed and checked whether the Group’s timing of revenuerecognition is based on when the services have been rendered.
A member firm of Ernst & Young Global Limited

*SGVFS033016*
- 4 -
Other Information
Management is responsible for the other information. The other information comprises the SECForm 17 A for the year ended December 31, 2018 but does not include the consolidated financialstatements and our auditor’s report thereon, which we obtained prior to the date of this auditor’s report,and the SEC Form 20 IS (Definitive Information Statement) and Annual Report for the year endedDecember 31, 2018, which is expected to be made available to us after that date.
Our opinion on the consolidated financial statements does not cover the other information and we do notexpress any form of assurance conclusion thereon.
In connection with our audits of the consolidated financial statements, our responsibility is to read theother information and, in doing so, consider whether the other information is materially inconsistent withthe consolidated financial statements or our knowledge obtained in the audit or otherwise appears to bematerially misstated.
If, based on the work we have performed on the other information that we obtained prior to the date ofthis auditor’s report, we conclude that there is a material misstatement of this other information, we arerequired to report that fact. We have nothing to report in this regard.
Responsibilities of Management and Those Charged with Governance for the ConsolidatedFinancial Statements
Management is responsible for the preparation and fair presentation of the consolidated financialstatements in accordance with PFRSs, and for such internal control as management determines isnecessary to enable the preparation of consolidated financial statements that are free from materialmisstatement, whether due to fraud or error.
In preparing the consolidated financial statements, management is responsible for assessing the Group’sability to continue as a going concern, disclosing, as applicable, matters related to going concern andusing the going concern basis of accounting unless management either intends to liquidate the Group or tocease operations, or has no realistic alternative but to do so.
Those charged with governance are responsible for overseeing the Group’s financial reporting process.
Auditor’s Responsibilities for the Audit of the Consolidated Financial Statements
Our objectives are to obtain reasonable assurance about whether the consolidated financial statements as awhole are free from material misstatement, whether due to fraud or error, and to issue an auditor’s reportthat includes our opinion. Reasonable assurance is a high level of assurance, but is not a guarantee that anaudit conducted in accordance with PSA will always detect a material misstatement when it exists.Misstatements can arise from fraud or error and are considered material if, individually or in theaggregate, they could reasonably be expected to influence the economic decisions of users taken on thebasis of these consolidated financial statements.
A member firm of Ernst & Young Global Limited

*SGVFS033016*
- 5 -
As part of an audit in accordance with PSA, we exercise professional judgment and maintain professionalskepticism throughout the audit. We also:
∂ Identify and assess the risks of material misstatement of the consolidated financial statements,whether due to fraud or error, design and perform audit procedures responsive to those risks, andobtain audit evidence that is sufficient and appropriate to provide a basis for our opinion. The risk ofnot detecting a material misstatement resulting from fraud is higher than for one resulting from error,as fraud may involve collusion, forgery, intentional omissions, misrepresentations, or the override ofinternal control.
∂ Obtain an understanding of internal control relevant to the audit in order to design audit proceduresthat are appropriate in the circumstances, but not for the purpose of expressing an opinion on theeffectiveness of the Group’s internal control.
∂ Evaluate the appropriateness of accounting policies used and the reasonableness of accountingestimates and related disclosures made by management.
∂ Conclude on the appropriateness of management’s use of the going concern basis of accounting and,based on the audit evidence obtained, whether a material uncertainty exists related to events orconditions that may cast significant doubt on the Group’s ability to continue as a going concern. If weconclude that a material uncertainty exists, we are required to draw attention in our auditor’s report tothe related disclosures in the consolidated financial statements or, if such disclosures are inadequate,to modify our opinion. Our conclusions are based on the audit evidence obtained up to the date of ourauditor’s report. However, future events or conditions may cause the Group to cease to continue as agoing concern.
∂ Evaluate the overall presentation, structure and content of the consolidated financial statements,including the disclosures, and whether the consolidated financial statements represent the underlyingtransactions and events in a manner that achieves fair presentation.
∂ Obtain sufficient appropriate audit evidence regarding the financial information of the entities orbusiness activities within the Group to express an opinion on the consolidated financial statements.We are responsible for the direction, supervision and performance of the group audit. We remainsolely responsible for our audit opinion.
We communicate with those charged with governance regarding, among other matters, the planned scopeand timing of the audit and significant audit findings, including any significant deficiencies in internalcontrol that we identify during our audit.
We also provide those charged with governance with a statement that we have complied with relevantethical requirements regarding independence, and to communicate with them all relationships and othermatters that may reasonably be thought to bear on our independence, and where applicable, relatedsafeguards.
A member firm of Ernst & Young Global Limited

*SGVFS033016*
- 6 -
From the matters communicated with those charged with governance, we determine those matters thatwere of most significance in the audit of the consolidated financial statements of the current period andare therefore the key audit matters. We describe these matters in our auditor’s report unless law orregulation precludes public disclosure about the matter or when, in extremely rare circumstances, wedetermine that a matter should not be communicated in our report because the adverse consequences ofdoing so would reasonably be expected to outweigh the public interest benefits of such communication.
The engagement partner on the audit resulting in this independent auditor’s report is Arnel F. De Jesus.
SYCIP GORRES VELAYO & CO.
Arnel F. De JesusPartnerCPA Certificate No. 43285SEC Accreditation No. 0075-AR-4 (Group A), May 1, 2016, valid until May 1, 2019Tax Identification No. 152-884-385BIR Accreditation No. 08-001998-15-2018, March 14, 2018, valid until March 13, 2021PTR No. 7332542, January 3, 2019, Makati City
March 5, 2019
A member firm of Ernst & Young Global Limited

*SGVFS033016*
INTERNATIONAL CONTAINER TERMINAL SERVICES, INC.AND SUBSIDIARIESCONSOLIDATED BALANCE SHEETS
December 31, 2016 December 31, 2017 December 31, 2018
ASSETS
Noncurrent AssetsIntangibles (Notes 1, 5, 15, 20 and 24) US$1,788,737,047 US$1,815,712,424 US$1,965,646,951Property and equipment (Notes 1, 6, 15, 20 and 24) 1,381,483,081 1,456,191,640 1,378,048,546Investment properties (Notes 7 and 20) 6,255,304 8,011,137 7,438,718Investments in and advances to joint ventures and associates
(Notes 1, 8 and 22) 293,638,405 382,227,852 381,187,990Deferred tax assets (Notes 3, 4 and 21) 90,571,814 111,104,364 158,286,864Other noncurrent assets (Notes 1, 8, 9, 15, 20, 23, 24, 25 and 26) 106,307,159 98,363,669 138,883,890
Total Noncurrent Assets 3,666,992,810 3,871,611,086 4,029,492,959
Current AssetsCash and cash equivalents (Notes 1, 11 and 27) 325,058,592 279,427,071 447,079,325Receivables (Notes 3, 12 and 27) 102,930,437 112,891,114 120,423,777Spare parts and supplies (Notes 1 and 3) 33,525,428 35,669,801 34,045,427Prepaid expenses and other current assets (Note 13) 54,379,920 70,778,705 71,464,364Derivative assets (Notes 9 and 26) 65,756 308,834 426,415
Total Current Assets 515,960,133 499,075,525 673,439,308US$4,182,952,943 US$4,370,686,611 US$4,702,932,267
EQUITY AND LIABILITIES
Equity Attributable to Equity Holders of the ParentCapital stock:
Preferred stock (Note 14) US$236,222 US$236,222 US$236,222Common stock (Note 14) 67,330,188 67,330,188 67,330,188
Additional paid-in capital (Notes 14 and 19) 536,216,117 547,852,934 549,381,676Cost of shares held by subsidiaries (Note 14) (74,261,595) (74,261,595) (74,261,595)Treasury shares (Notes 14 and 19) (17,904,401) (15,059,524) (58,112,070)Excess of acquisition cost over the carrying value of non-controlling
interests (Notes 1 and 14) (142,555,041) (142,555,041) (142,555,041)Retained earnings (Note 14) 779,439,375 819,667,903 882,814,174Perpetual capital securities (Note 14) 761,341,287 761,341,287 1,153,615,197Other comprehensive loss - net (Notes 3, 8, 9, 14, 16, 23 and 26) (285,445,364) (256,622,429) (314,752,823)
Total equity attributable to equity holders of the parent 1,624,396,788 1,707,929,945 2,063,695,928
Equity Attributable to Non-controlling Interests (Note 14) 141,683,210 164,638,013 165,503,658Total Equity 1,766,079,998 1,872,567,958 2,229,199,586
Noncurrent LiabilitiesLong-term debt - net of current portion (Notes 5, 6, 9, 15, 20 and 26) 1,326,280,115 1,410,268,488 1,220,486,951Concession rights payable - net of current portion
(Notes 1, 5, 20, 24 and 26) 481,700,775 470,238,945 530,665,958Deferred tax liabilities (Notes 4 and 21) 71,376,805 80,486,462 104,345,534Other noncurrent liabilities (Notes 16, 23 and 26) 90,968,127 135,805,108 179,521,811
Total Noncurrent Liabilities 1,970,325,822 2,096,799,003 2,035,020,254
Current LiabilitiesLoans payable (Notes 17 and 26) 36,598,275 61,187,102 35,718,397Accounts payable and other current liabilities
(Notes 18, 20, 22 and 25) 347,709,086 276,566,419 309,320,049Current portion of long-term debt (Notes 5, 6, 15, 20 and 26) 18,485,813 22,149,388 50,848,341Current portion of concession rights payable (Notes 1, 5, 24 and 26) 8,760,661 9,942,171 10,603,454Income tax payable (Notes 4 and 21) 32,314,007 29,541,111 31,606,706Derivative liabilities (Notes 16 and 26) 2,679,281 1,933,459 615,480
Total Current Liabilities 446,547,123 401,319,650 438,712,427Total Liabilities 2,416,872,945 2,498,118,653 2,473,732,681
US$4,182,952,943 US$4,370,686,611 US$4,702,932,267
See accompanying Notes to Consolidated Financial Statements.
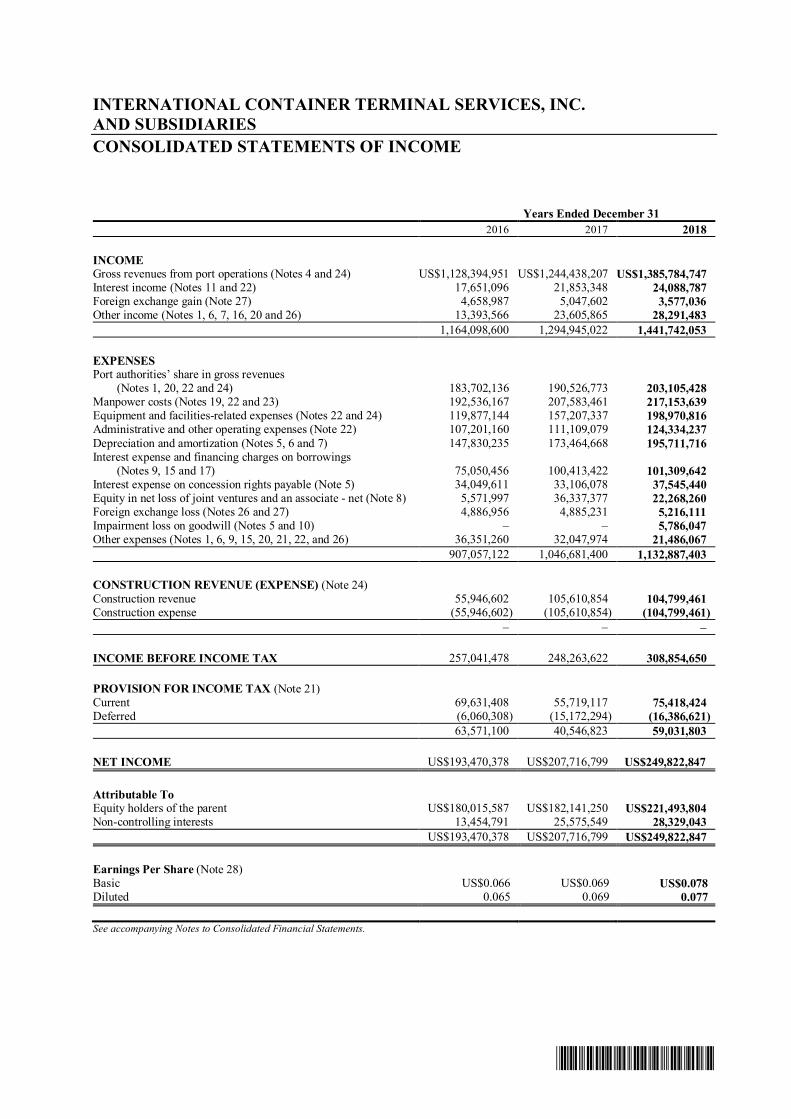
*SGVFS033016*
INTERNATIONAL CONTAINER TERMINAL SERVICES, INC.AND SUBSIDIARIESCONSOLIDATED STATEMENTS OF INCOME
Years Ended December 312016 2017 2018
INCOMEGross revenues from port operations (Notes 4 and 24) US$1,128,394,951 US$1,244,438,207 US$1,385,784,747Interest income (Notes 11 and 22) 17,651,096 21,853,348 24,088,787Foreign exchange gain (Note 27) 4,658,987 5,047,602 3,577,036Other income (Notes 1, 6, 7, 16, 20 and 26) 13,393,566 23,605,865 28,291,483
1,164,098,600 1,294,945,022 1,441,742,053
EXPENSESPort authorities’ share in gross revenues
(Notes 1, 20, 22 and 24) 183,702,136 190,526,773 203,105,428Manpower costs (Notes 19, 22 and 23) 192,536,167 207,583,461 217,153,639Equipment and facilities-related expenses (Notes 22 and 24) 119,877,144 157,207,337 198,970,816Administrative and other operating expenses (Note 22) 107,201,160 111,109,079 124,334,237Depreciation and amortization (Notes 5, 6 and 7) 147,830,235 173,464,668 195,711,716Interest expense and financing charges on borrowings
(Notes 9, 15 and 17) 75,050,456 100,413,422 101,309,642Interest expense on concession rights payable (Note 5) 34,049,611 33,106,078 37,545,440Equity in net loss of joint ventures and an associate - net (Note 8) 5,571,997 36,337,377 22,268,260Foreign exchange loss (Notes 26 and 27) 4,886,956 4,885,231 5,216,111Impairment loss on goodwill (Notes 5 and 10) – – 5,786,047Other expenses (Notes 1, 6, 9, 15, 20, 21, 22, and 26) 36,351,260 32,047,974 21,486,067
907,057,122 1,046,681,400 1,132,887,403
CONSTRUCTION REVENUE (EXPENSE) (Note 24)Construction revenue 55,946,602 105,610,854 104,799,461Construction expense (55,946,602) (105,610,854) (104,799,461)
– – –
INCOME BEFORE INCOME TAX 257,041,478 248,263,622 308,854,650
PROVISION FOR INCOME TAX (Note 21)Current 69,631,408 55,719,117 75,418,424Deferred (6,060,308) (15,172,294) (16,386,621)
63,571,100 40,546,823 59,031,803
NET INCOME US$193,470,378 US$207,716,799 US$249,822,847
Attributable ToEquity holders of the parent US$180,015,587 US$182,141,250 US$221,493,804Non-controlling interests 13,454,791 25,575,549 28,329,043
US$193,470,378 US$207,716,799 US$249,822,847
Earnings Per Share (Note 28)Basic US$0.066 US$0.069 US$0.078Diluted 0.065 0.069 0.077
See accompanying Notes to Consolidated Financial Statements.

*SGVFS033016*
INTERNATIONAL CONTAINER TERMINAL SERVICES, INC.AND SUBSIDIARIESCONSOLIDATED STATEMENTS OF COMPREHENSIVE INCOME
Years Ended December 312016 2017 2018
NET INCOME FOR THE YEAR US$193,470,378 US$207,716,799 US$249,822,847
OTHER COMPREHENSIVE GAIN (LOSS)Items to be reclassified to profit or loss in subsequent periodsExchange differences on translation of foreign operations’ financial
statements (Note 14) (39,958,651) 41,198,460 (67,213,068)Net change in unrealized mark-to-market values of derivatives
(Note 26) 6,133,973 (4,534,403) (2,955,996)Net unrealized gain on derivatives removed from equity and
capitalized as construction in-progress (Note 26) (345,538) – –Net unrealized mark-to-market gain (loss) on available-for-sale
investments (Notes 9 and 14) (173,874) (365,234) 393,072Share of other comprehensive gain (loss) of an associate
(Notes 8 and 14) – 1,043,169 (2,083,048)Income tax relating to components of other comprehensive income
(loss) (Note 26) (1,611,411) 1,099,025 1,174,531(35,955,501) 38,441,017 (70,684,509)
Items not to be reclassified to profit or loss in subsequent periodsShare of other comprehensive gain (loss) of an associate
(Notes 8 and 14) – (54,681) 193,807
Actuarial losses on defined benefit plans - net of tax(Note 23) (245,391) (109,651) (159,390)
(245,391) (164,332) 34,417(36,200,892) 38,276,685 (70,650,092)
TOTAL COMPREHENSIVE INCOMEFOR THE YEAR US$157,269,486 US$245,993,484 US$179,172,755
Attributable ToEquity holders of the parent US$153,206,643 US$210,964,185 US$163,363,410Non-controlling interests 4,062,843 35,029,299 15,809,345
US$157,269,486 US$245,993,484 US$179,172,755
See accompanying Notes to Consolidated Financial Statements.

*SGVFS033016*
INTERNATIONAL CONTAINER TERMINAL SERVICES, INC. AND SUBSIDIARIESCONSOLIDATED STATEMENTS OF CHANGES IN EQUITYFOR THE YEARS ENDED DECEMBER 31, 2016, 2017 AND 2018
Attributable to Equity Holders of the Parent (Note 14)
PreferredStock Common Stock
AdditionalPaid-inCapital
PreferredShares Held
by a Subsidiary
CommonShares Held
by a Subsidiary Treasury Shares
Excess of Acquisition
Cost over theCarrying Value
of Non-controlling Interests
RetainedEarnings
Perpetual Capital
Securities
Other Comprehensive
Loss - net Total
Attributable toNon-controlling
Interests(Note 14) Total Equity
Balance at December 31, 2015 US$236,222 US$67,330,188 US$534,808,153 (US$72,492,481) (US$1,769,114) (US$7,547,826) (US$142,555,041) US$723,158,999 US$831,910,439 (US$258,636,420) US$1,674,443,119 US$151,604,756 US$1,826,047,875Net income for the year – – – – – – – 180,015,587 – – 180,015,587 13,454,791 193,470,378Other comprehensive loss (Note 14) – – – – – – – – – (26,808,944) (26,808,944) (9,391,948) (36,200,892)Total comprehensive income for the year (Note 14) – – – – – – – 180,015,587 – (26,808,944) 153,206,643 4,062,843 157,269,486Cash dividends (Note 14) – – – – – – – (39,893,190) – – (39,893,190) (13,984,389) (53,877,579)Distributions on perpetual capital securities (Note 14) – – – – – – – (34,160,584) – – (34,160,584) – (34,160,584)Share-based payments (Note 19) – – 2,641,929 – – – – – – – 2,641,929 – 2,641,929Issuance of treasury shares for share-based payments
(Notes 14 and 19) – – (1,233,965) – – 1,233,965 – – – – – – –Acquisition of ICTSI common shares (Note 14) – – – – – (11,590,540) – – – – (11,590,540) – (11,590,540)Issuance and exchange of perpetual capital
securities (Note 14) – – – – – – – (49,681,437) (70,569,152) – (120,250,589) – (120,250,589)Balance at December 31, 2016 US$236,222 US$67,330,188 US$536,216,117 (US$72,492,481) (US$1,769,114) (US$17,904,401) (US$142,555,041) US$779,439,375 US$761,341,287 (US$285,445,364) US$1,624,396,788 US$141,683,210 US$1,766,079,998
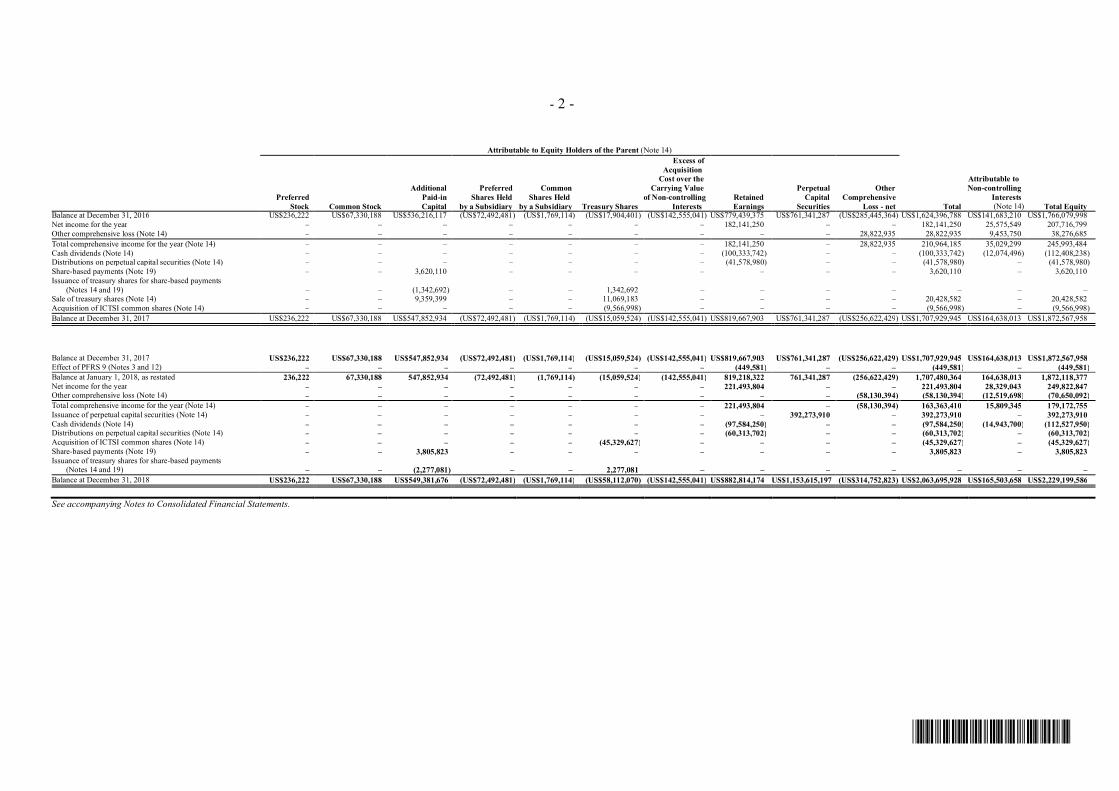
- 2 -
*SGVFS033016*
Attributable to Equity Holders of the Parent (Note 14)
PreferredStock Common Stock
AdditionalPaid-inCapital
PreferredShares Held
by a Subsidiary
CommonShares Held
by a Subsidiary Treasury Shares
Excess of Acquisition
Cost over theCarrying Value
of Non-controlling Interests
RetainedEarnings
Perpetual Capital
Securities
Other Comprehensive
Loss - net Total
Attributable toNon-controlling
Interests(Note 14) Total Equity
Balance at December 31, 2016 US$236,222 US$67,330,188 US$536,216,117 (US$72,492,481) (US$1,769,114) (US$17,904,401) (US$142,555,041) US$779,439,375 US$761,341,287 (US$285,445,364) US$1,624,396,788 US$141,683,210 US$1,766,079,998Net income for the year – – – – – – – 182,141,250 – – 182,141,250 25,575,549 207,716,799Other comprehensive loss (Note 14) – – – – – – – – – 28,822,935 28,822,935 9,453,750 38,276,685Total comprehensive income for the year (Note 14) – – – – – – – 182,141,250 – 28,822,935 210,964,185 35,029,299 245,993,484Cash dividends (Note 14) – – – – – – – (100,333,742) – – (100,333,742) (12,074,496) (112,408,238)Distributions on perpetual capital securities (Note 14) – – – – – – – (41,578,980) – – (41,578,980) – (41,578,980)Share-based payments (Note 19) – – 3,620,110 – – – – – – – 3,620,110 – 3,620,110Issuance of treasury shares for share-based payments
(Notes 14 and 19) – – (1,342,692) – – 1,342,692 – – – – – – –Sale of treasury shares (Note 14) – – 9,359,399 – – 11,069,183 – – – – 20,428,582 – 20,428,582Acquisition of ICTSI common shares (Note 14) – – – – – (9,566,998) – – – – (9,566,998) – (9,566,998)Balance at December 31, 2017 US$236,222 US$67,330,188 US$547,852,934 (US$72,492,481) (US$1,769,114) (US$15,059,524) (US$142,555,041) US$819,667,903 US$761,341,287 (US$256,622,429) US$1,707,929,945 US$164,638,013 US$1,872,567,958
Balance at December 31, 2017 US$236,222 US$67,330,188 US$547,852,934 (US$72,492,481) (US$1,769,114) (US$15,059,524) (US$142,555,041) US$819,667,903 US$761,341,287 (US$256,622,429) US$1,707,929,945 US$164,638,013 US$1,872,567,958Effect of PFRS 9 (Notes 3 and 12) – – – – – – – (449,581) – – (449,581) – (449,581)Balance at January 1, 2018, as restated 236,222 67,330,188 547,852,934 (72,492,481) (1,769,114) (15,059,524) (142,555,041) 819,218,322 761,341,287 (256,622,429) 1,707,480,364 164,638,013 1,872,118,377Net income for the year – – – – – – – 221,493,804 – – 221,493,804 28,329,043 249,822,847Other comprehensive loss (Note 14) – – – – – – – – – (58,130,394) (58,130,394) (12,519,698) (70,650,092)Total comprehensive income for the year (Note 14) – – – – – – – 221,493,804 – (58,130,394) 163,363,410 15,809,345 179,172,755Issuance of perpetual capital securities (Note 14) – – – – – – – – 392,273,910 – 392,273,910 – 392,273,910Cash dividends (Note 14) – – – – – – – (97,584,250) – – (97,584,250) (14,943,700) (112,527,950)Distributions on perpetual capital securities (Note 14) – – – – – – – (60,313,702) – – (60,313,702) – (60,313,702)Acquisition of ICTSI common shares (Note 14) – – – – – (45,329,627) – – – – (45,329,627) – (45,329,627)Share-based payments (Note 19) – – 3,805,823 – – – – – – – 3,805,823 – 3,805,823Issuance of treasury shares for share-based payments
(Notes 14 and 19) – – (2,277,081) – – 2,277,081 – – – – – – –Balance at December 31, 2018 US$236,222 US$67,330,188 US$549,381,676 (US$72,492,481) (US$1,769,114) (US$58,112,070) (US$142,555,041) US$882,814,174 US$1,153,615,197 (US$314,752,823) US$2,063,695,928 US$165,503,658 US$2,229,199,586
See accompanying Notes to Consolidated Financial Statements.

*SGVFS033016*
INTERNATIONAL CONTAINER TERMINAL SERVICES, INC.AND SUBSIDIARIESCONSOLIDATED STATEMENTS OF CASH FLOWS
Years Ended December 312016 2017 2018
CASH FLOWS FROM OPERATING ACTIVITIESIncome before income tax US$257,041,478 US$248,263,622 US$308,854,650Adjustments for: Depreciation and amortization (Notes 5, 6 and 7) 147,830,235 173,464,668 195,711,716 Interest expense on: Borrowings (Notes 9, 15 and 17) 75,050,456 100,413,422 101,309,642 Concession rights payable (Note 5) 34,049,611 33,106,078 37,545,440 Loss (gain) on:
Write-off of debt issuance costs and costs of securing arevolving credit facility due to cancellation(Notes 15 and 20) – 3,042,918 7,034,590
Disposal of property and equipment - net (Note 20) (1,501,293) 342,344 333,685 Pre-termination of lease agreement (Notes 1 and 20) 23,432,184 – –
Accrual of port lease (see Notes 16 and 18) – 34,181,603 60,044,036 Equity in net loss of joint ventures and an
associate - net (Note 8) 5,571,997 36,337,377 22,268,260 Impairment loss on goodwill (Notes 5 and 10) – – 5,786,047 Share-based payments (Notes 14 and 19) 2,882,755 3,332,323 3,905,795 Unrealized foreign exchange loss 1,104,768 281,773 226,052 Interest income (Notes 11 and 22) (17,651,096) (21,853,348) (24,088,787) Dividend income (Note 20) (198,706) (198,456) (179,163) Unrealized mark-to-market loss on derivatives - net
(Notes 20 and 26) 408,960 – –Operating income before changes in working capital 528,021,349 610,714,324 718,751,963Increase in: Receivables (17,586,640) (4,304,192) (12,054,160) Prepaid expenses and other current assets (9,243,104) (17,047,419) (7,794,919) Spare parts and supplies (2,882,808) (3,513,995) (230,603)Increase in: Accounts payable and other current liabilities 28,246,083 32,096,389 16,107,996 Pension liabilities 1,215,591 2,050,136 549,752Cash generated from operations 527,770,471 619,995,243 715,330,029Income taxes paid (60,822,253) (55,983,622) (72,926,146)Net cash flows provided by operating activities 466,948,218 564,011,621 642,403,883
CASH FLOWS FROM INVESTING ACTIVITIESAcquisitions of: Intangible assets (Notes 5 and 24) (105,775,868) (96,594,666) (171,939,604) Property and equipment (Note 6) (275,203,651) (213,028,926) (72,953,124)
Additional shares in joint ventures and an associate(Notes 1 and 8) – (81,191,619) (2,338,207)
Proceeds from: Disposal of property and equipment (Notes 6 and 20) 9,018,966 901,825 6,478,250
Return of amount paid to Concessionaire (Note 1) – 12,500,000 –Interest received 3,133,709 4,102,297 5,638,814Dividends received 198,706 198,456 179,163Payments for concession rights (12,705,362) (13,481,693) (45,106,484)Increase in:
Other noncurrent assets (34,767,221) (9,340,496) (45,520,033)Advances to a joint venture (52,365,327) (24,995,718) (2,338,682)
Payment for pre-termination of lease agreement (Note 1) – (11,450,000) –Net cash flows used in investing activities (468,466,048) (432,380,540) (327,899,907)
(Forward)

- 2 -
*SGVFS033016*
Years Ended December 312016 2017 2018
CASH FLOWS FROM FINANCING ACTIVITIESProceeds from: Issuance of perpetual capital securities (Note 14) US$1,874,063 US$– US$392,273,910 Long-term borrowings (Note 15) 473,106,139 111,106,280 61,637,183 Short-term borrowings (Note 17) 71,233,855 66,119,186 41,807,933
Sale of treasury shares (Note 14) – 20,428,582 –Payments of: Long-term borrowings (Note 15) (207,128,087) (47,667,209) (208,758,152) Interest on borrowings and concession rights payable (99,397,410) (126,201,898) (132,749,685) Dividends (Note 14) (53,669,360) (112,503,197) (114,731,592) Short-term borrowings (Note 17) (35,697,231) (44,244,615) (64,419,585) Distributions on perpetual capital securities (Note 14) (34,160,584) (41,578,980) (60,313,702) Acquisition of perpetual capital securities (Note 14) (122,124,651) – –Acquisition of ICTSI common shares (Note 14) (11,590,540) (9,566,998) (45,329,627)Decrease in other noncurrent liabilities (4,124,707) (663,258) (1,970,908)Net cash flows used in financing activities (21,678,513) (184,772,107) (132,554,225)
EFFECT OF EXCHANGE RATE CHANGES ON CASH ANDCASH EQUIVALENTS (6,226,878) 7,509,505 (14,297,497)
NET INCREASE (DECREASE) IN CASHAND CASH EQUIVALENTS (29,423,221) (45,631,521) 167,652,254
CASH AND CASH EQUIVALENTSAT BEGINNING OF YEAR 354,481,813 325,058,592 279,427,071
CASH AND CASH EQUIVALENTSAT END OF YEAR (Note 11) US$325,058,592 US$279,427,071 US$447,079,325
See accompanying Notes to Consolidated Financial Statements.

*SGVFS033016*
INTERNATIONAL CONTAINER TERMINAL SERVICES, INC.AND SUBSIDIARIESNOTES TO CONSOLIDATED FINANCIAL STATEMENTS
1. Corporate Information
1.1 General
International Container Terminal Services, Inc. (ICTSI or the Parent Company) was incorporatedin the Philippines and registered with the Philippine Securities and Exchange Commission (SEC)on December 24, 1987. The registered office address of the Parent Company is ICTSIAdministration Building, Manila International Container Terminal South Access Road, Manila.ICTSI’s common shares are publicly traded in the Philippine Stock Exchange (PSE).
The consolidated financial statements were authorized for issue in accordance with a resolution ofthe Board of Directors (the Board) on March 5, 2019.
1.2 Port Operations
ICTSI and subsidiaries (collectively referred to as “the Group”) entered into various concessionsof port operations which include development, management, and operation of container terminalsand related facilities around the world. As at March 5, 2019, the Group is involved in 32 terminalconcessions and port development projects in 19 countries worldwide. There are 30 operatingterminals in nine key ports, including the acquisition of shares of stock in Manila North HarbourPort, Inc. (MNHPI) in 2018, a barge terminal and an inland container terminal in the Philippines,two each in Indonesia and in Papua New Guinea (PNG), one each in China, Ecuador, Brazil,Poland, Georgia, Madagascar, Croatia, Pakistan, Mexico, Honduras, Iraq, Argentina, Colombia,Democratic Republic (DR) of Congo, and Australia; an existing concession to construct andoperate a port in Tuxpan, Mexico; and the recently signed concession in Sudan.
Concessions for port operations entered into, acquired and terminated by ICTSI and subsidiariesfor the last three years are summarized below:
River Port, Matadi, Democratic Republic of Congo. On January 23, 2014, ICTSI, through itssubsidiary, ICTSI Cooperatief U.A. (ICTSI Cooperatief), forged a business partnership with LaSociete de Gestion Immobiliere Lengo (SIMOBILE) for the establishment and formation of ajoint venture company, ICTSI DR Congo S.A. (IDRC). IDRC, which is initially 60%-owned byICTSI Cooperatief, will build a new terminal along the river bank of the Congo River in Matadiand manage, develop and operate the same as a container terminal, as well as provide exclusivecontainer handling services and general cargo services therein. On May 19, 2015, ICTSI, throughits subsidiary, ICTSI Cooperatief, and its joint venture partner, SIMOBILE, transferred theirrespective 8% and 2% ownership interest in IDRC to Societe Commerciale Des Transports EtDes Ports S.A. (SCTP SA). SIMOBILE transferred to its subsidiary, La Societe d’Investissementet de Placement (SIP) Sprl, its 10% ownership in IDRC. Thereafter, IDRC is owned 52% byICTSI, 28% by SIMOBILE, 10% by SIP Sprl and 10% by SCTP SA.
Phase 1 of the facility consists of two berths that can handle 175,000 twenty-foot equivalent units(TEUs) and 350,000 metric tons. The capacity and berth length can, subject to demand, bedoubled in Phase 2. Phase 1 was completed in the fourth quarter of 2016. Initial operationsstarted in the third quarter of 2016 while commercial operations started in January 2017.

- 2 -
*SGVFS033016*
Umm Qasr, Iraq. ICTSI, through its wholly owned subsidiary, ICTSI (M.E.) DMCC [formerlyICTSI (M.E.) JLT] (ICTSI Dubai), and General Company for Ports of Iraq (GCPI) signed onApril 10, 2014 the Contract for the Construction and Operation of Three New Quays andManagement and Operation of Quay No. 20 (“Contract”) in the Port of Umm Qasr (“Port”) inIraq. The Contract grants ICTSI the rights to: (a) manage and operate the existing containerfacility at Berth 20 of the Port for a period of 10 years, (b) build in three phases, under abuild-operate-transfer (BOT) scheme, a new container and general cargo terminal in the Port for aconcession period of 26 years, and (c) provide container and general cargo terminal services inboth components. On March 1, 2016, an addendum to the Contract (“First Addendum”) wassigned by the parties granting ICTSI, through ICTSI Dubai, the right to manage and operate anadditional existing Quay No. 19 for a total of 13 years, with the first three years for thecompletion of rehabilitation works. Also, the First Addendum extended the original term for themanagement and operation of Quay No. 20 from 10 to 13 years. On March 26, 2017, a secondaddendum to the Contract (“Second Addendum”) was signed by the parties granting ICTSI,through ICTSI Dubai, the right to manage and operate Quay No. 21 co-terminus with theContract and the First Addendum. The Second Addendum extended the term for the managementand operation of Quay No. 19 and 20 from 13 to 21 years.
ICTSI commenced trial operations at Berth 20 in September 2014 and full-fledged commercialoperations in November 2014. ICTSI commenced commercial operations of Berth 19 inJune 2016. The rehabilitation works for Berth 21 are on-going and it has started operations in thethird quarter of 2018.
Phase 1 of the expansion project (Berth 27) under the BOT scheme has 250 meters of berth withan estimated capacity of 300,000 TEUs. The facility will have 600 meters of quay with anestimated capacity of 900,000 TEUs. Berth 27 was completed and fully operational in the firstquarter of 2017.
On October 22, 2017, ICTSI signed an agreement with GCPI for the Phase 2 of expansiondevelopment of the Port. The Phase 2 expansion project will involve development of two newberths, Berths 25 and 26, including a 20-hectare yard area. This expansion will increase the Port’scontainer handling capacity by 600,000 TEUs to 1,200,000 TEUs and its capability to handle largecontainer vessels of up to 10,000 TEUs. The development of this phase of the expansion project ison-going and is expected to be completed in the third quarter of 2019.
Port of Melbourne, Australia. On May 2, 2014, ICTSI, through its subsidiary in Australia,Victoria International Container Terminal Ltd. (VICT), signed a contract in Melbourne with Portof Melbourne Corporation (“POMC”) for the design, construction, commissioning, operation,maintaining and financing of the Webb Dock Container Terminal (Terminal) and EmptyContainer Park (ECP) at Webb Dock East (WDE) in the Port of Melbourne. The Contract grantsVICT the rights to: (a) design, build and commission the new Terminal at berths WDE 4 andWDE 5, (b) design, build and commission the new ECP at WDE, and (c) operate the Terminaland ECP until June 30, 2040. Initially, VICT was 90% owned by ICTSI through ICTSI Far EastPte. Ltd. (IFEL), a wholly owned subsidiary, and 10% by Anglo Ports Pty Limited (“AngloPorts”). On February 4, 2015, IFEL acquired the 10% non-controlling interest from Anglo Portsand became 100% owner of VICT. On January 7, 2016, IFEL’s ownership interest in VICT wastransferred to another subsidiary, ICTSI Oceania B.V. (IOBV), making IOBV the new 100%owner of VICT.
Phase 1 of the Terminal and the ECP with capacities of 350,000 TEUs and 250,000 TEUs,respectively, commenced commercial operations in the second quarter of 2017. Phase 2 of theTerminal commenced commercial operations in the first quarter of 2018 and has increased thecapacity to 1,000,000 TEUs.

- 3 -
*SGVFS033016*
Laguna Gateway Inland Container Terminal, Philippines. On March 2, 2015, Laguna GatewayInland Container Terminal, Inc. (LGICT) started operating the first one-stop inland containerterminal (ICT) located in Barangays Banlic and San Cristobal, Calamba City, Laguna. LGICT is60%-owned by IW Cargo Handlers, Inc. (IW Cargo) and 40%-owned by Nippon ContainerTerminals Co. Ltd., Transnational Diversified Corporation and NYK - Fil-Japan Shipping Corp.The ICT primarily operates as an extension of the seaport operations of the Parent Company. Inparticular, the said ICT is intended to function as a regional logistics hub, which will service andsupport the operations of exporters and importers, both within and outside the economic zones inthe LABARZON area. Only fifty-eight (58) kilometers from Metro Manila, the ICT is situatedon a twenty-one (21)-hectare property, strategically located near various economic export zoneswith an already existing adjacent railroad. Of the said twenty-one (21) hectares, twelve (12)hectares have already been developed and now being used for operations. Envisioned to be thefirst of its kind in magnitude and operations, the ICT is being developed as a 24/7 state-of-the-artfacility with cutting edge terminal systems and equipment.
Tuxpan, Mexico. On May 27, 2015, ICTSI, through its subsidiary, ICTSI Tuxpan B.V., acquiredfrom Grupo TMM S.A.B and Immobiliaria TMM S.A. de C.V 100% of the capital stock ofTerminal Maritima de Tuxpan, S.A de C.V (TMT) for US$54.5 million. TMT is a company dulyincorporated in accordance with the laws of Mexico with a concession to construct and operate amaritime container terminal in the Port of Tuxpan, Mexico and is the owner of the real estatewhere the maritime container terminal will be constructed. The concession agreement is validuntil May 25, 2021, subject to extension for another 20 years. The concession covers an area of29,109.68 square meters, which is adjacent to the 43 hectares of land owned by TMT. Under theconcession agreement, TMT is liable and committed to: (1) pay fixed fee of MXN23.24 plusvalue added tax (VAT), per square meter of assigned area, in twelve equal monthly installments;and (2) pay minimum guaranteed fee starting January 2018 ranging from MXN145.33 (US$9.51)per TEU to MXN340.60 (US$22.29) per TEU for containerized cargo and MXN3.37 (US$0.22)per TEU to MXN5.62 (US$0.37) per ton for general cargo, based on agreed minimum volume.As of March 5, 2019, management is currently working on a development plan on TMT.
Brunei, Darussalam. On May 21, 2009, ICTSI, through New Muara Container TerminalServices Sdn Bhd (NMCTS), entered into an Agreement with the government of BruneiDarussalam (“Government”) for the operation and maintenance of the Muara Container Terminalin Brunei Darussalam. The Agreement was valid for a period of four years from commencementdate or May 22, 2009. The term was extendible for a period of one year at a time, for a maximumof two years subject to the mutual agreement of the parties. Since 2012, the Agreement had beenextended yearly for a period of one year or until May 20, 2017 as an interim operator. TheAgreement with the Government was no longer renewed and ended effective February 21, 2017.
Davao, Philippines. On April 21, 2006, the Philippine Ports Authority (PPA) granted DavaoIntegrated Port and Stevedoring Services Corporation (DIPSSCOR) a ten-year contract for cargohandling services at Sasa Wharf, Port of Davao in the Philippines that expired onApril 20, 2016. Thereafter, the PPA granted DIPSSCOR a series of hold-over authority on atemporary basis over the cargo handling services at Sasa Wharf, Port of Davao. OnFebruary 22, 2018, the PPA issued Administrative order (AO) No. 04-2018 directing all PortManagers of the PPA to grant hold-over authorities to cargo handling service providers withcontracts due to expire in 2018, for six months, unless earlier terminated by the PPA or uponaward of a new terminal management contract in accordance with PPA AO No. 03-2016 entitled“Port Terminal Management Regulatory Framework”. On June 11, 2018, the hold-over authoritywas issued by the PPA with a validity of six months starting February 26, 2018 until the award ofa new contract by the PPA, whichever is earlier, unless cancelled or revoked for reason by thePPA during the validity of the hold-over authority. On November 12, 2018, the hold-over
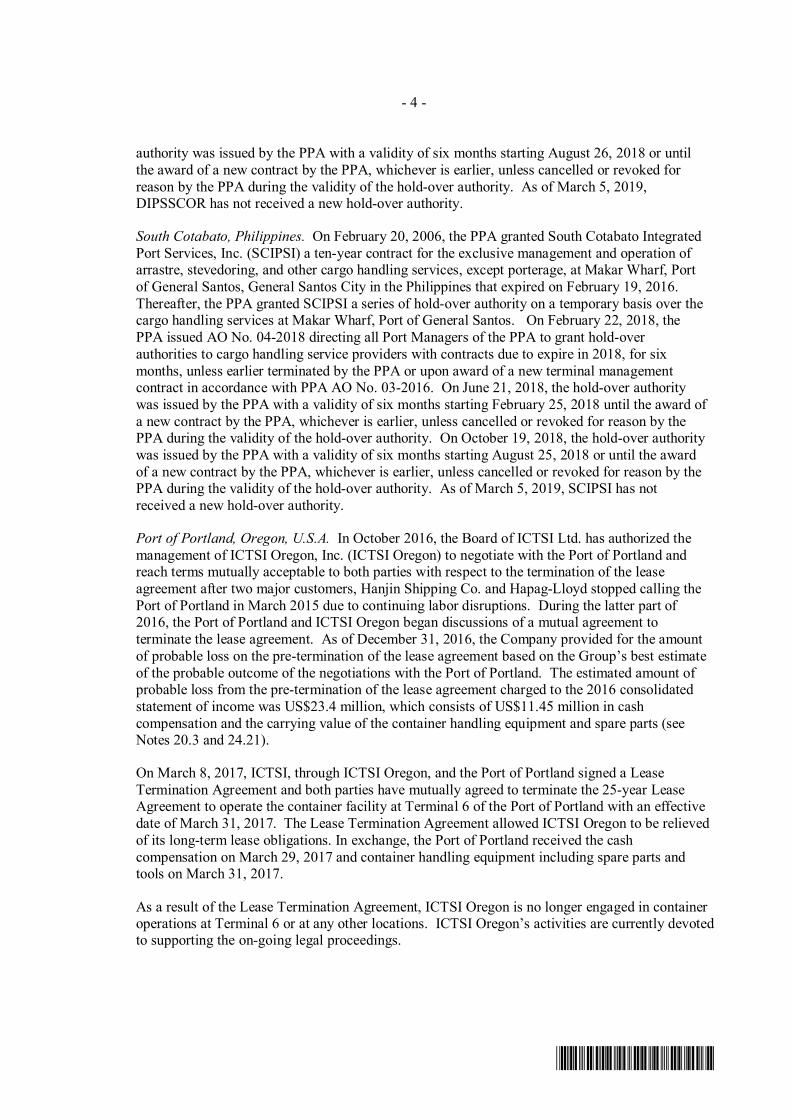
- 4 -
*SGVFS033016*
authority was issued by the PPA with a validity of six months starting August 26, 2018 or untilthe award of a new contract by the PPA, whichever is earlier, unless cancelled or revoked forreason by the PPA during the validity of the hold-over authority. As of March 5, 2019,DIPSSCOR has not received a new hold-over authority.
South Cotabato, Philippines. On February 20, 2006, the PPA granted South Cotabato IntegratedPort Services, Inc. (SCIPSI) a ten-year contract for the exclusive management and operation ofarrastre, stevedoring, and other cargo handling services, except porterage, at Makar Wharf, Portof General Santos, General Santos City in the Philippines that expired on February 19, 2016.Thereafter, the PPA granted SCIPSI a series of hold-over authority on a temporary basis over thecargo handling services at Makar Wharf, Port of General Santos. On February 22, 2018, thePPA issued AO No. 04-2018 directing all Port Managers of the PPA to grant hold-overauthorities to cargo handling service providers with contracts due to expire in 2018, for sixmonths, unless earlier terminated by the PPA or upon award of a new terminal managementcontract in accordance with PPA AO No. 03-2016. On June 21, 2018, the hold-over authoritywas issued by the PPA with a validity of six months starting February 25, 2018 until the award ofa new contract by the PPA, whichever is earlier, unless cancelled or revoked for reason by thePPA during the validity of the hold-over authority. On October 19, 2018, the hold-over authoritywas issued by the PPA with a validity of six months starting August 25, 2018 or until the awardof a new contract by the PPA, whichever is earlier, unless cancelled or revoked for reason by thePPA during the validity of the hold-over authority. As of March 5, 2019, SCIPSI has notreceived a new hold-over authority.
Port of Portland, Oregon, U.S.A. In October 2016, the Board of ICTSI Ltd. has authorized themanagement of ICTSI Oregon, Inc. (ICTSI Oregon) to negotiate with the Port of Portland andreach terms mutually acceptable to both parties with respect to the termination of the leaseagreement after two major customers, Hanjin Shipping Co. and Hapag-Lloyd stopped calling thePort of Portland in March 2015 due to continuing labor disruptions. During the latter part of2016, the Port of Portland and ICTSI Oregon began discussions of a mutual agreement toterminate the lease agreement. As of December 31, 2016, the Company provided for the amountof probable loss on the pre-termination of the lease agreement based on the Group’s best estimateof the probable outcome of the negotiations with the Port of Portland. The estimated amount ofprobable loss from the pre-termination of the lease agreement charged to the 2016 consolidatedstatement of income was US$23.4 million, which consists of US$11.45 million in cashcompensation and the carrying value of the container handling equipment and spare parts (seeNotes 20.3 and 24.21).
On March 8, 2017, ICTSI, through ICTSI Oregon, and the Port of Portland signed a LeaseTermination Agreement and both parties have mutually agreed to terminate the 25-year LeaseAgreement to operate the container facility at Terminal 6 of the Port of Portland with an effectivedate of March 31, 2017. The Lease Termination Agreement allowed ICTSI Oregon to be relievedof its long-term lease obligations. In exchange, the Port of Portland received the cashcompensation on March 29, 2017 and container handling equipment including spare parts andtools on March 31, 2017.
As a result of the Lease Termination Agreement, ICTSI Oregon is no longer engaged in containeroperations at Terminal 6 or at any other locations. ICTSI Oregon’s activities are currently devotedto supporting the on-going legal proceedings.

- 5 -
*SGVFS033016*
Cavite Gateway Terminal, Philippines. On April 21, 2017, ICTSI, through its wholly-ownedsubsidiary, Cavite Gateway Terminal (CGT), in partnership with the Philippine Department ofTransportation, project launched the country’s first container roll-on roll-off barge terminal inTanza, Cavite. CGT will facilitate off-the-roads seaborn transport of containers between Port ofManila and Cavite and service industrial locators in Cavite area. CGT’s barge terminal will havean annual capacity of 115,000 TEUs, which is equivalent to 140,000 fewer truck trips on cityroads each year. CGT formally commenced commercial operations in November 2018.
Lekki International Container Terminal Services LFTZ Enterprise, Nigeria. On August 10, 2012,ICTSI, through its wholly-owned subsidiary, Lekki International Container Terminal ServicesLFTZ Enterprise (LICTSLE), and Lekki Port LFTZ Enterprise (Lekki Port, the Concessionaire)signed the Sub-concession Agreement (Agreement) that grants LICTSLE, as asub-concessionaire, an exclusive right to develop and operate, and to provide handling equipmentand container terminal services at the container terminal within Lekki Port located at Ibeju Lekki,Lagos State, Federal Republic of Nigeria for a period of 21 years. On May 17, 2017, ICTSI andLekki Port mutually agreed to terminate the Agreement subject to a payment by Lekki Port of anagreed amount. On May 23, 2017, ICTSI received the agreed amounts of US$12.5 millionrepresenting the return of payments made to Lekki Port pursuant to the Agreement, andUS$7.5 million representing compensation of costs incurred by ICTSI in relation to the projectwhich was recognized as “Other income” in the 2017 consolidated statement of income (seeNotes 20.1 and 24.8). The termination of the Agreement was finalized and deemed effective onMay 24, 2017.
Motukea and Lae, Papua New Guinea. In September 2017, ICTSI received a notification fromPNG Ports Corporation Limited (PNGPCL), a PNG state-owned enterprise, of the confirmationby the Independent Consumer and Competition Commission in PNG with respect to the two25-year agreements signed by ICTSI’s PNG subsidiaries, Motukea International TerminalLimited (MITL) and South Pacific International Container Terminal Limited (SPICTL), withPNGPCL for the operation, management and development of the two international ports inMotukea and Lae in PNG. SPICTL and MITL were allowed by PNGPCL to take over the portfacilities and begin operations at the Port of Lae in February 2018 and at the Port of Motukea inMay 2018, respectively. The terminal operating agreements and other related contracts tookeffect on June 1, 2018 after all the parties have complied with the agreed conditions precedent.
Manila North Harbor, Philippines. On September 21, 2017, the Board of ICTSI granted theauthority to acquire shares in MNHPI. On the same date, ICTSI signed a Share PurchaseAgreement (SPA) with Petron Corporation for the acquisition of 10,449,000 MNHPI shares,representing 34.83% of the total issued and outstanding shares of MNHPI for a consideration ofPhp1.75 billion (US$33.8 million). The completion of the SPA was subject to several conditions,one of which was the approval of the acquisition by the Philippine Ports Authority which wasobtained on October 20, 2017. The SPA was completed on October 30, 2017. An additionalinvestment cost of Php2.45 billion (US$47.3 million) was incurred in relation to this acquisition.
On September 5, 2018, ICTSI has signed an SPA with Harbour Centre Port Terminal, Inc.(HCPTI) for the acquisition of 4,550,000 shares in MNHPI from HCPTI. The subject sharesrepresent 15.17% of the total issued and outstanding shares of MNHPI. The consideration isPhp910.0 million (US$16.8 million). As of March 5, 2019, the completion of the SPA remainssubject to a number of conditions precedent. Upon completion of this transaction, ICTSI'sshareholdings in MNHPI will increase from 34.83% to 50%. An additional investment cost willbe incurred in relation to this acquisition.

- 6 -
*SGVFS033016*
Port of Tanjung Priok, Indonesia. On November 2, 2017, PT ICTSI Jasa Prima Tbk (IJP), anICTSI subsidiary in Indonesia, signed a Conditional Share Purchase Agreement withPT Samudera Terminal Indonesia (STI) for the purchase of IJP’s interest in PT PerusahaanBongkar Muat Olah Jasa Andal (OJA), subject to certain conditions. As of March 5, 2019, theconditions precedent have not yet been fulfilled.
Port of Port Sudan, Sudan. On January 3, 2019, ICTSI, through its wholly-owned subsidiaryICTSI Middle East DMCC, signed a Concession Agreement with the Sea Ports Corporation ofSudan (SPC) to operate, manage and develop the South Port Container Terminal (SPCT) at PortSudan, Republic of the Sudan for 20 years. The port of Port Sudan is the only major modern portin the country and serves as the international gateway for more than 95% of Sudan’s cargo flows.In February 2019, ICTSI established Africa Gateway Terminal (AGT), a Sudanese entity, tooperate the container terminal. The Group is currently working with SPC for the handoverpreparations and is expecting to take over the container terminal in the first half of 2019.
1.3 Subsidiaries, Joint Ventures and Associates
Percentage of OwnershipPlace of Nature of Functional 2016 2017 2018Incorporation Business Currency Direct Indirect Direct Indirect Direct Indirect
Subsidiaries:
AsiaInternational Container Terminal
Holdings, Inc. (ICTHI)and Subsidiaries
Cayman Islands HoldingCompany
US Dollar
100.00 – 100.00 – 100.00 –ICTSI Ltd. Bermuda Holding
CompanyUS Dollar
– 100.00 – 100.00 – 100.00ICTSI Mauritius Ltd. Mauritius Holding
CompanyUS Dollar
– 100.00 – 100.00 – 100.00Aeolina Investments Limited British Virgin
IslandsHolding
CompanyUS Dollar
– 100.00 – 100.00 – 100.00Pakistan International Container
Terminal (PICT)Pakistan Port
ManagementPakistani
Rupee – 64.53 – 64.53 – 64.53IFEL Singapore Holding
CompanyUS Dollar
– 100.00 – 100.00 – 100.00NMCTS Brunei Port
ManagementBrunei Dollar
– 100.00 – 100.00 – 100.00IJP and Subsidiaries Indonesia Maritime
infrastructureand logistics
US Dollar
– 80.16 – 80.16 – 80.16OJA Indonesia Port
ManagementUS Dollar
– 80.16 – 80.16 – 80.16PT Makassar Terminal Services, Inc.
(MTS)Indonesia Port
ManagementIndonesian
Rupiah – 95.00 – 95.00 – 95.00PT Container Terminal Systems
Solutions IndonesiaIndonesia Software
DeveloperUS Dollar
– 100.00 – 100.00 – 100.00ICTSI (Hong Kong) Limited (IHKL) Hong Kong Holding
CompanyUS Dollar
– 100.00 – 100.00 – 100.00Yantai International Container
Terminals, Limited (YICT)China Port
ManagementRenminbi
– 51.00 – 51.00 – 51.00Pentland International Holdings, Ltd. British Virgin
IslandsHolding
CompanyUS Dollar
– 100.00 – 100.00 – 100.00ICTSI Georgia Corp. (IGC) Cayman Islands Holding
CompanyUS Dollar
– 100.00 – 100.00 – 100.00Global Procurement Ltd. (formerly
ICTSI Poland)Bermuda Holding
CompanyUS Dollar
– 100.00 – 100.00 – 100.00ICTSI Honduras Ltd. Bermuda Holding
CompanyUS Dollar
– 100.00 – 100.00 – 100.00ICTSI Ltd. Regional Headquarters Philippines Regional
HeadquartersPhilippine
Peso – 100.00 – 100.00 – 100.00(Forward)

- 7 -
*SGVFS033016*
Percentage of OwnershipPlace of Nature of Functional 2016 2017 2018Incorporation Business Currency Direct Indirect Direct Indirect Direct Indirect
International Container TerminalServices (India) Private Limited
India PortManagement
Indian Rupee– 100.00 – 100.00 – 100.00
Container Terminal de VenezuelaConterven CA (CTVCC)
Venezuela HoldingCompany
US Dollar– 95.00 – 95.00 – 95.00
ICTSI Africa (Pty) Ltd. (h) South Africa BusinessDevelopmentOffice (BDO)
SouthAfricanRand – 100.00 – – – –
Australian International ContainerTerminals Limited (AICTL) (a)
Australia PortManagement
AustralianDollar – 70.00 – 70.00 – 70.00
Mindanao International ContainerTerminal Services, Inc. (MICTSI)
Philippines PortManagement
PhilippinePeso 100.00 − 100.00 − 100.00 −
Abbotsford Holdings, Inc. Philippines HoldingCompany
PhilippinePeso 100.00 – 100.00 – 100.00 –
Hijo International Port Services, Inc.(HIPS)
Philippines PortManagement
PhilippinePeso – 65.00 – 65.00 – 65.00
DIPSSCOR Philippines PortManagement
PhilippinePeso – 96.95 – 96.95 – 96.95
IWI Container Terminal Holdings, Inc.(IWI CTHI, formerly ICTSIWarehousing, Inc.)
Philippines Warehousing PhilippinePeso
100.00 – 100.00 – 100.00 –IW Cargo Philippines Port Equipment
RentalUS Dollar
– 100.00 – 100.00 – 100.00Container Terminal Systems Solutions
Philippines, Inc.Philippines Software
DeveloperUS Dollar
– 100.00 – 100.00 – 100.00Bauan International Port, Inc. (BIPI) Philippines Port
ManagementPhilippine
Peso – 60.00 – 60.00 – 60.00Prime Staffers and Selection Bureau,
Inc. (a)Philippines Manpower
RecruitmentPhilippine
Peso 100.00 – 100.00 – 100.00 –ICTSI Subic, Inc. (ICTSI Subic) Philippines Port
ManagementUS Dollar
100.00 – 100.00 – 100.00 –Subic Bay International Terminal
Holdings, Inc. (SBITHI)Philippines Holding
CompanyUS Dollar
83.33 – 83.33 – 83.33 –Subic Bay International Terminal
Corporation (SBITC)Philippines Port
ManagementUS Dollar
– 83.33 – 83.33 – 83.33Cordilla Properties Holdings, Inc. Philippines Holding
CompanyPhilippine
Peso 100.00 − 100.00 − 100.00 −SCIPSI Philippines Port
ManagementPhilippine
Peso 35.70 14.38 35.70 14.38 35.70 14.38ICTSI Dubai United Arab
EmiratesBDO US Dollar
100.00 − 100.00 − 100.00 −ICTSI Capital B.V. (ICBV) The
NetherlandsHolding
CompanyUS Dollar
– 100.00 – 100.00 – 100.00Icon Logistiek B.V. The
NetherlandsHolding
CompanyUS Dollar
– 100.00 – 100.00 – 100.00Royal Capital B.V. (RCBV) The
NetherlandsHolding
CompanyUS Dollar
– 75.00 – 75.00 – 75.00ICTSI Cooperatief The
NetherlandsHolding
CompanyUS Dollar
1.00 99.00 1.00 99.00 1.00 99.00Global Container Capital, B.V. The
NetherlandsHolding
CompanyUS Dollar
– 100.00 – 100.00 – 100.00ICTSI Treasury B.V. (ITBV) The
NetherlandsHolding
CompanyUS Dollar
– 75.00 – 75.00 – 75.00ICTSI Americas B.V. The
NetherlandsHolding
CompanyUS Dollar
– 100.00 – 100.00 – 100.00ICTSI Africa B.V. The
NetherlandsHolding
CompanyUS Dollar
– 100.00 – 100.00 – 100.00ICTSI Sudan B.V. (formerly ICTSI
Cameroon B.V.)The
NetherlandsHolding
CompanyUS Dollar
– 100.00 – 100.00 – 100.00CMSA B.V. The
NetherlandsHolding
CompanyUS Dollar
– 100.00 – 100.00 – 100.00Tecplata B.V. The
NetherlandsHolding
CompanyUS Dollar
– 100.00 – 100.00 – 100.00SPIA Colombia B.V. The
NetherlandsHolding
CompanyUS Dollar
– 100.00 – 100.00 – 100.00TSSA B.V. The
NetherlandsHolding
CompanyUS Dollar
– 100.00 – 100.00 – 100.00CGSA B.V. The
NetherlandsHolding
CompanyUS Dollar
– 100.00 – 100.00 – 100.00SPIA Spain S.L. (c) Spain Holding
CompanyUS Dollar
– 100.00 – 100.00 – 100.00CGSA Transportadora S.L. (c) Spain Holding
CompanyUS Dollar
– 100.00 – 100.00 – 100.00Crixus Limited British Virgin
IslandsHolding
CompanyUS Dollar
– 100.00 – 100.00 – 100.00(Forward)

- 8 -
*SGVFS033016*
Percentage of OwnershipPlace of Nature of Functional 2016 2017 2018Incorporation Business Currency Direct Indirect Direct Indirect Direct Indirect
VICT Australia PortManagement
AustralianDollar – 100.00 – 100.00 – 100.00
Asia Pacific Port Holdings Private Ltd.(APPH) (h)
Singapore HoldingCompany
US Dollar– 50.50 – – – –
ICTSI Global Finance B.V. (IGFBV) TheNetherlands
HoldingCompany
US Dollar– 75.00 – 75.00 – 75.00
IOBV TheNetherlands
HoldingCompany
US Dollar– 100.00 – 100.00 – 100.00
ICTSI Tuxpan B.V. TheNetherlands
HoldingCompany
US Dollar– 100.00 – 100.00 – 100.00
ICTSI Asia Pacific Business Services,Inc. (APBS)
Philippines Business ProcessOutsourcing
US Dollar– 100.00 – 100.00 – 100.00
ICTSI Ltd. Regional OperatingHeadquarters (ROHQ)
Philippines RegionalOperatingHeadquarters
US Dollar
– 100.00 – 100.00 – 100.00ICTSI Project Delivery Services Co. Pte.
Ltd.Singapore Port Equipment
Sale andRental
US Dollar
– 100.00 – 100.00 – 100.00ICTSI QFC LLC Qatar Holding
CompanyUS Dollar
– 100.00 – 100.00 – 100.00ICTSI South Asia Pte. Ltd. Singapore Holding
CompanyUS Dollar
– 100.00 – 100.00 – 100.00LGICT Philippines Port
ManagementPhilippine
Peso – 60.00 – 60.00 – 60.00ICTSI Middle East DMCC United Arab
EmiratesHolding
CompanyUS Dollar
– 100.00 – 100.00 – 100.00ICTSI Global Cooperatief U.A. The
NetherlandsHolding
CompanyUS Dollar
99.00 1.00 99.00 1.00 99.00 1.00Consultports S.A. de C.V. (b) Mexico BDO Mexican
Peso – 100.00 – 100.00 – 100.00Asiastar Consultants Limited (g) Hong Kong Management
ServicesUS Dollar
– – – 100.00 – 100.00CGT (e) Philippines Port
ManagementPhilippine
Peso – 100.00 – 100.00 – 100.00Intermodal Terminal Holdings, Inc. (e) Philippines Holding
CompanyPhilippine
Peso 100.00 – 100.00 – 100.00 –ICTSI Americas B.V. (Multinational
Headquarters) (g)Panama BDO US Dollar
– – – 100.00 – 100.00ICTSI South Pacific Limited (g) Papua New
GuineaHolding
CompanyPapua New
GuineanKina – – – 100.00 – 100.00
MITL (g) Papua NewGuinea
PortManagement
Papua NewGuineanKina – – – 100.00 – 100.00
SPICTL (g) Papua NewGuinea
PortManagement
Papua NewGuineanKina – – – 100.00 – 100.00
Tungsten RE Ltd. (g) Bermuda InsuranceCompany
US Dollar– – – 100.00 – 100.00
Europe, Middle East and Africa(EMEA)
Tartous International ContainerTerminal, Inc. (TICT)
Syria PortManagement
US Dollar100.00 – 100.00 – 100.00 –
Madagascar International ContainerTerminal Services, Ltd. (MICTSL)
Madagascar PortManagement
Euro– 100.00 – 100.00 – 100.00
Baltic Container Terminal Ltd. (BCT) Poland PortManagement
US Dollar– 100.00 – 100.00 – 100.00
Adriatic Gate Container Terminal(AGCT)
Croatia PortManagement
Euro– 51.00 – 51.00 – 51.00
Batumi International Container TerminalLLC (BICTL)
Georgia PortManagement
US Dollar– 100.00 – 100.00 – 100.00
LICTSLE Nigeria PortManagement
US Dollar– 100.00 – 100.00 – 100.00
IDRC DR Congo PortManagement
US Dollar– 52.00 – 52.00 – 52.00
ICTSI (M.E.) DMCC Iraq Branch(ICTSI Iraq)
Iraq PortManagement
US Dollar– 100.00 – 100.00 – 100.00
AmericasContecon Guayaquil, S.A. (CGSA) (f) Ecuador Port
ManagementUS Dollar
51.00 49.00 51.00 49.00 51.00 49.00Contecon Manzanillo S.A. (CMSA) (d) Mexico Port
ManagementUS Dollar
1.00 99.00 1.00 99.00 1.00 99.00Tecon Suape, S.A. (TSSA) Brazil Port
ManagementBrazilian
Real – 100.00 – 100.00 – 100.00(Forward)

- 9 -
*SGVFS033016*
Percentage of OwnershipPlace of Nature of Functional 2016 2017 2018Incorporation Business Currency Direct Indirect Direct Indirect Direct Indirect
ICTSI Oregon U.S.A. PortManagement
US Dollar− 100.00 − 100.00 − 100.00
C. Ultramar, S.A. Panama HoldingCompany
US Dollar– 100.00 – 100.00 – 100.00
Future Water, S.A. Panama HoldingCompany
US Dollar– 100.00 – 100.00 – 100.00
Kinston Enterprise, Inc. Panama HoldingCompany
US Dollar– 100.00 – 100.00 – 100.00
International Ports of South Americaand Logistics SA
Uruguay HoldingCompany
US Dollar− 100.00 − 100.00 − 100.00
Tecplata S.A. (Tecplata) (a) Argentina PortManagement
US Dollar− 100.00 − 100.00 − 100.00
Nuevos Puertos S. A. (NPSA) Argentina HoldingCompany
US Dollar4.00 96.00 4.00 96.00 4.00 96.00
Operadora Portuaria Centroamericana, S.A. (OPC)
Honduras PortManagement
US Dollar30.00 70.00 30.00 70.00 30.00 70.00
TMT Mexico PortManagement
MexicanPeso – 100.00 – 100.00 – 100.00
CMSA Servicios PortuariosSA De CV (g)
Mexico ManpowerServices
MexicanPeso – – – 100.00 – 100.00
CMSA Servicios Profesionales Y DeEspecialistas SA De CV (g)
Mexico ManpowerServices
MexicanPeso – – – 100.00 – 100.00
Joint Ventures:Sociedad Puerto Industrial Aguadulce
SA (SPIA)Colombia Port
ManagementUS Dollar
– 46.30 – 46.30 – 46.30Falconer Aircraft Management,
Inc.(FAMI) (j)Philippines Aircraft
ManagementPhilippine
Peso – – – – – 49.0Associates:MNHPI (i) Philippines Port
ManagementPhilippine
Peso – – 34.83 – 34.83 –Asiaview Realty and Development
Corporation (ARDC)Philippines Realty Philippine
Peso – 49.0 – 49.0 – 49.0
(a) Has not yet started commercial operations as at December 31, 2018(b) Acquired in 2016 for US$60.0 thousand. This was not accounted for as a business combination due to immateriality of amount involved.(c) Changed its functional currency from Euro to US Dollar on April 1, 2016(d) Changed its functional currency from Mexican Peso to US Dollar on July 1, 2016(e) Established in 2016(f) In 2016, the Parent Company’s shareholdings was diluted to 51% as a result of internal restructuring.(g) Established in 2017(h) Deregistered in 2017(i) Acquired as an associate on October 30, 2017(j) Established in 2018 and has not yet started commercial operations as of March 5, 2019
2. Basis of Preparation and Consolidation and Statement of Compliance
2.1 Basis of Preparation
The consolidated financial statements have been prepared on a historical cost basis, except foravailable-for-sale (AFS) investments in 2016 and 2017, financial assets at FVOCI in 2018 andderivative financial instruments, which have been measured at fair value. The consolidatedfinancial statements are presented in United States dollars (US dollar, USD or US$), the ParentCompany’s functional and presentation currency. All values are rounded to the nearest US dollarunit, except when otherwise indicated.
2.2 Basis of Consolidation
The consolidated financial statements of the Group include the accounts of ICTSI and itssubsidiaries where the Parent Company has control. Control is achieved when the Group isexposed, or has rights, to variable returns from its involvement with the investee and has theability to affect those returns through its power over the investee.

- 10 -
*SGVFS033016*
Specifically, the Group controls an investee if and only if the Group has:∂ Power over the investee (i.e., existing rights that give it the current ability to direct the
relevant activities of the investee)∂ Exposure, or rights, to variable returns from its involvement with the investee, and∂ The ability to use its power over the investee to affect its returns
When the Group has less than a majority of the voting or similar rights of an investee, the Groupconsiders all relevant facts and circumstances in assessing whether it has power over an investee,including:∂ The contractual arrangement with the other vote holders of the investee∂ Rights arising from other contractual arrangements∂ The Group’s voting rights and potential voting rights
The Group re-assesses whether or not it controls an investee if facts and circumstances indicatethat there are changes to one or more of the three elements of control.
Subsidiaries. Subsidiaries are entities controlled by the Parent Company. Subsidiaries areconsolidated from the date of acquisition or incorporation, being the date on which the Groupobtains control, and continue to be consolidated until the date such control ceases.
Non-controlling Interests. Non-controlling interests represent the portion of profit or loss and netassets in PICT, MTS, AICTL, CTVCC, SBITC, SBITHI, BIPI, DIPSSCOR, YICT, SCIPSI,RCBV, AGCT, IJP, OJA, ITBV, HIPS, APPH (until December 2017), IGFBV, IDRC and LGICT,not held by the Group and are presented separately in the consolidated statement of income andthe consolidated statement of comprehensive income, and consolidated balance sheet separatefrom equity attributable to equity holders of the parent.
An acquisition, transfer or sale of a non-controlling interest is accounted for as an equitytransaction. No gain or loss is recognized in an acquisition of a non-controlling interest. Thedifference between the fair value of the consideration and book value of the share in the net assetsacquired is presented under “Excess of acquisition cost over the carrying value of non-controllinginterests” account within the equity section of the consolidated balance sheet. If the Group losescontrol over a subsidiary, it: (i) derecognizes the assets (including goodwill) and liabilities of thesubsidiary, the carrying amount of any non-controlling interest and the cumulative translationdifferences recorded in equity; (ii) recognizes the fair value of the consideration received, the fairvalue of any investment retained and any surplus or deficit in the consolidated statement ofincome; and (iii) reclassifies the Parent Company’s share of components previously recognized inother comprehensive income to the consolidated statement of income or retained earnings, asappropriate.
Transactions Eliminated on Consolidation. All intragroup transactions and balances includingincome and expenses, and unrealized gains and losses are eliminated in full.
Accounting Policies of Subsidiaries. The financial statements of subsidiaries are prepared for thesame reporting year using uniform accounting policies as those of the Parent Company.
Functional and Presentation Currency. The Group’s consolidated financial statements arepresented in US dollar, which is ICTSI’s functional and presentation currency. Each entity in theGroup determines its own functional currency, which is the currency that best reflects theeconomic substance of the underlying transactions, events and conditions relevant to that entity,and items included in the financial statements of each entity are measured using that functional

- 11 -
*SGVFS033016*
currency. When there is a change in those underlying transactions, events and conditions, theentity re-assesses its functional currency. When there is a change in functional currency, the entityaccounts for such change in accordance with the Group’s accounting policy on Change inFunctional Currency.
At the reporting date, the assets and liabilities of subsidiaries whose functional currency is not theUS dollar are translated into the presentation currency of ICTSI using the Bloomberg closing rateat balance sheet date and, their statements of income are translated at the Bloomberg weightedaverage daily exchange rates for the year. The exchange differences arising from the translationare taken directly and deferred to the consolidated statement of comprehensive income under the“Exchange differences on translation of foreign operations’ financial statements” account. Upondisposal of the foreign entity, the deferred cumulative translation amount recognized in theconsolidated statement of comprehensive income relating to that particular foreign operation isrecognized in the consolidated statement of income.
2.3 Statement of Compliance
The consolidated financial statements of the Group have been prepared in compliance with PFRS.PFRS includes Philippine Accounting Standards (PAS) and International Financial ReportingInterpretations Committee (IFRIC) interpretations issued by the Financial Reporting StandardsCouncil (FRSC).
3. Summary of Significant Accounting Policies, Significant Accounting Judgments, Estimatesand Assumptions
3.1 Changes in Accounting Policies
The accounting policies adopted are consistent with those of the previous financial year exceptthat the Group has adopted the following amended standards as at January 1, 2018:
ƒ Amendments to PFRS 2, Share-based Payment, Classification and Measurement of Share-based Payment TransactionsThe amendments to PFRS 2 address three main areas: the effects of vesting conditions on themeasurement of a cash-settled share-based payment transaction; the classification of a share-based payment transaction with net settlement features for withholding tax obligations; andthe accounting where a modification to the terms and conditions of a share-based paymenttransaction changes its classification from cash-settled to equity-settled. Entities are requiredto apply the amendments to: (1) share-based payment transactions that are unvested or vestedbut unexercised as of January 1, 2018, (2) share-based payment transactions granted on orafter January 1, 2018 and to (3) modifications of share-based payments that occurred on orafter January 1, 2018. Retrospective application is permitted if elected for all threeamendments and if it is possible to do so without hindsight.
The adoption of this amendment did not result in any impact on the consolidated financialstatements since the Group only has equity-settled share-based payment transactions.

- 12 -
*SGVFS033016*
ƒ PFRS 9, Financial InstrumentsPFRS 9 replaces PAS 39, Financial Instruments: Recognition and Measurement, and allprevious versions of PFRS 9. The standard introduces new requirements for classification andmeasurement, impairment and hedge accounting.
The Group chose not to restate comparative figures as permitted by the transitional provisionsof PFRS 9, thereby resulting in the following impact:∂ Comparative information for prior periods will not be restated. The classification and
measurement requirements previously applied in accordance with PAS 39 and disclosuresrequired in PFRS 7 will be retained for the comparative periods. Accordingly, theinformation presented for 2016 and 2017 does not reflect the requirements of PFRS 9.
∂ The Group will disclose the accounting policies for both the current period and thecomparative periods, one applying PFRS 9 beginning January 1, 2018 and one applyingPAS 39 as of December 31, 2017.
∂ The difference between the previous carrying amount and the carrying amount at thebeginning of the annual reporting period that includes the date of initial application will berecognized in the opening retained earnings or other component of equity, as appropriate.
∂ As comparative information is not restated, the third statement of financial positionpresented is not a result of the adoption of PFRS 9.
As of January 1, 2018, the Group has reviewed and assessed all of its existing financial assets.The table below illustrates the classification and measurement of financial assets and financialliabilities under PFRS 9 and PAS 39 at the date of initial application. The accounting policiesadopted by the Group in its evaluation of the classification and measurement categories underPFRS 9 are discussed in Note 3.
The following table reconciles the carrying amounts of financial assets, from their previousmeasurement category in accordance with PAS 39 to their new measurement categories upontransition to PFRS 9 on January 1, 2018:
PAS 39 PFRS 9Financial Assets Category Amount Reclassification ECL Amount CategoryCash and cash equivalents L&R US$276,400,772 US$– US$– US$276,400,772 AC
Cash in bank 209,766,005 – – 209,766,005Cash equivalents 66,634,767 – – 66,634,767
Receivables L&R 112,891,114 – (449,581) 112,441,533 ACTrade 100,218,745 – (449,581) 99,769,164Advances and nontrade 12,672,369 – – 12,672,369
Advances to a joint venture L&R 314,202,106 – – 314,202,106 AC
L&R US$703,493,992 US$– (US$449,581) US$703,044,411 AC
Investments in Equityinstruments (a) AFS US$13,348,132 US$– US$– US$13,348,132 FVOCI
Derivative assets FVTPL US$5,074,653 US$– US$– US$5,074,653 FVTPL(a) As of January 1, 2018, the Group have irrevocably designated all equity investments at available-for-sale investments as FVOCI as theseinvestments are strategic in nature.
The Group does not have financial assets and financial liabilities which had previously beendesignated at FVTPL to reduce an accounting mismatch in accordance with PAS 39 whichhad been reclassified to amortized cost or FVOCI upon transition to PFRS 9.
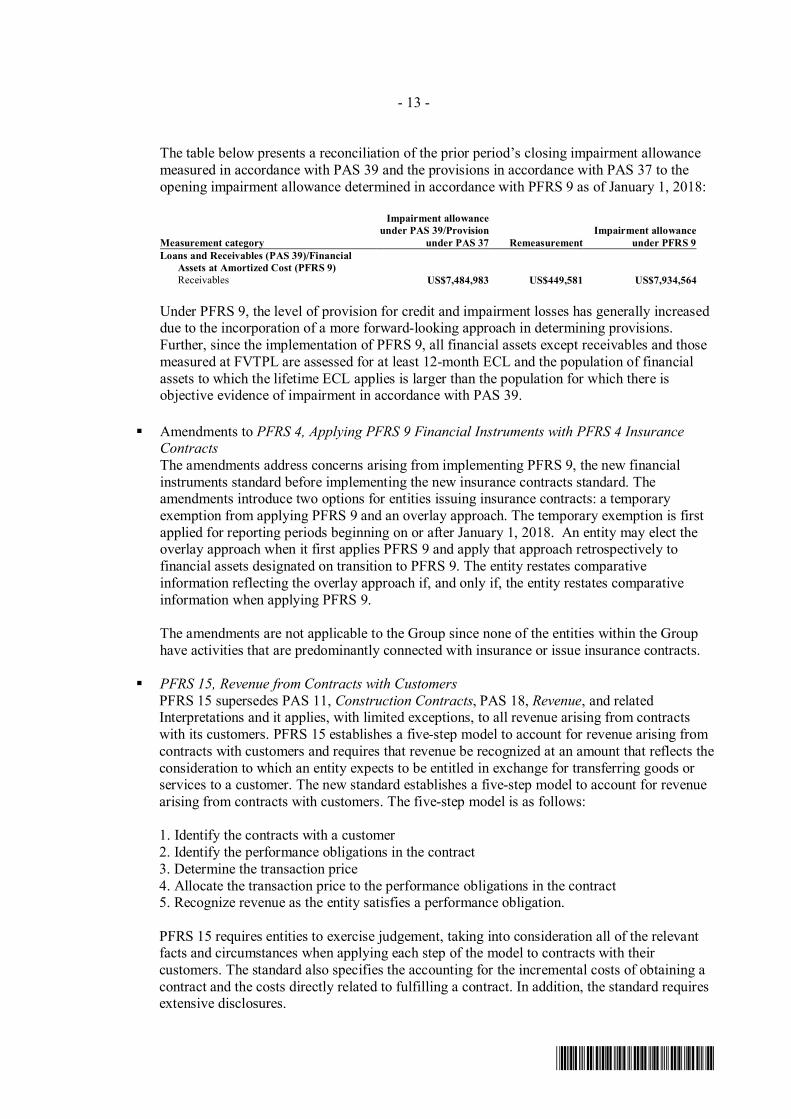
- 13 -
*SGVFS033016*
The table below presents a reconciliation of the prior period’s closing impairment allowancemeasured in accordance with PAS 39 and the provisions in accordance with PAS 37 to theopening impairment allowance determined in accordance with PFRS 9 as of January 1, 2018:
Measurement category
Impairment allowanceunder PAS 39/Provision
under PAS 37 RemeasurementImpairment allowance
under PFRS 9Loans and Receivables (PAS 39)/Financial
Assets at Amortized Cost (PFRS 9)Receivables US$7,484,983 US$449,581 US$7,934,564
Under PFRS 9, the level of provision for credit and impairment losses has generally increaseddue to the incorporation of a more forward-looking approach in determining provisions.Further, since the implementation of PFRS 9, all financial assets except receivables and thosemeasured at FVTPL are assessed for at least 12-month ECL and the population of financialassets to which the lifetime ECL applies is larger than the population for which there isobjective evidence of impairment in accordance with PAS 39.
ƒ Amendments to PFRS 4, Applying PFRS 9 Financial Instruments with PFRS 4 InsuranceContractsThe amendments address concerns arising from implementing PFRS 9, the new financialinstruments standard before implementing the new insurance contracts standard. Theamendments introduce two options for entities issuing insurance contracts: a temporaryexemption from applying PFRS 9 and an overlay approach. The temporary exemption is firstapplied for reporting periods beginning on or after January 1, 2018. An entity may elect theoverlay approach when it first applies PFRS 9 and apply that approach retrospectively tofinancial assets designated on transition to PFRS 9. The entity restates comparativeinformation reflecting the overlay approach if, and only if, the entity restates comparativeinformation when applying PFRS 9.
The amendments are not applicable to the Group since none of the entities within the Grouphave activities that are predominantly connected with insurance or issue insurance contracts.
ƒ PFRS 15, Revenue from Contracts with CustomersPFRS 15 supersedes PAS 11, Construction Contracts, PAS 18, Revenue, and relatedInterpretations and it applies, with limited exceptions, to all revenue arising from contractswith its customers. PFRS 15 establishes a five-step model to account for revenue arising fromcontracts with customers and requires that revenue be recognized at an amount that reflects theconsideration to which an entity expects to be entitled in exchange for transferring goods orservices to a customer. The new standard establishes a five-step model to account for revenuearising from contracts with customers. The five-step model is as follows:
1. Identify the contracts with a customer2. Identify the performance obligations in the contract3. Determine the transaction price4. Allocate the transaction price to the performance obligations in the contract5. Recognize revenue as the entity satisfies a performance obligation.
PFRS 15 requires entities to exercise judgement, taking into consideration all of the relevantfacts and circumstances when applying each step of the model to contracts with theircustomers. The standard also specifies the accounting for the incremental costs of obtaining acontract and the costs directly related to fulfilling a contract. In addition, the standard requiresextensive disclosures.

- 14 -
*SGVFS033016*
The Group adopted PFRS 15 using the modified retrospective method of adoption with thedate of initial application of January 1, 2018. Under this method, the standard can be appliedeither to all contracts at the date of initial application or only to contracts that are notcompleted at this date. The Group elected to apply the standard to all contracts as atJanuary 1, 2018. Therefore, the comparative information were not restated and were reportedunder PAS 11, PAS 18 and related Interpretations.
The Group has concluded that it is acting as principal in all of its revenue arrangementsbecause the Company is the primary obligor who is responsible for providing the services tothe customers and the Company bears the credit risk.
The adoption of PFRS 15 as at January 1, 2018 did not have a material impact on theconsolidated balance sheets, consolidated statements of income, consolidated statements ofcomprehensive income, consolidated statements of changes in equity and consolidatedstatements of cash flow.
ƒ Amendments to PAS 28, Investments in Associates and Joint Ventures, Measuring anAssociate or Joint Venture at Fair Value (Part of Annual Improvements to PFRSs 2014 - 2016Cycle)The amendments clarify that an entity that is a venture capital organization, or otherqualifying entity, may elect, at initial recognition on an investment-by-investment basis, tomeasure its investments in associates and joint ventures at fair value through profit or loss.They also clarify that if an entity that is not itself an investment entity has an interest in anassociate or joint venture that is an investment entity, the entity may, when applying the equitymethod, elect to retain the fair value measurement applied by that investment entity associateor joint venture to the investment entity associate’s or joint venture’s interests in subsidiaries.This election is made separately for each investment entity associate or joint venture, at thelater of the date on which (a) the investment entity associate or joint venture is initiallyrecognized; (b) the associate or joint venture becomes an investment entity; and (c) theinvestment entity associate or joint venture first becomes a parent. Retrospective applicationis required.
The amendments are not applicable to the Group since none of the entities within the Groupare considered as venture capital organization or other qualifying entities.
ƒ Amendments to PAS 40, Investment Property, Transfers of Investment PropertyThe amendments clarify when an entity should transfer property, including property underconstruction or development into, or out of investment property. The amendments state that achange in use occurs when the property meets, or ceases to meet, the definition of investmentproperty and there is evidence of the change in use. A mere change in management’sintentions for the use of a property does not provide evidence of a change in use.Retrospective application of the amendments is not required and is only permitted if this ispossible without the use of hindsight.
The adoption of these amendments did not result in any impact on the consolidated financialstatements.

- 15 -
*SGVFS033016*
ƒ Philippine Interpretation IFRIC-22, Foreign Currency Transactions and AdvanceConsiderationThe interpretation clarifies that, in determining the spot exchange rate to use on initialrecognition of the related asset, expense or income (or part of it) on the derecognition of anon-monetary asset or non-monetary liability relating to advance consideration, the date of thetransaction is the date on which an entity initially recognizes the nonmonetary asset or non-monetary liability arising from the advance consideration. If there are multiple payments orreceipts in advance, then the entity must determine the date of the transaction for eachpayment or receipt of advance consideration. Retrospective application of this interpretationis not required.
The adoption of this interpretation did not result in any impact on the consolidated financialstatements.
The Group has not early adopted any other standard, interpretation or amendment that has beenissued but is not yet effective.
3.2 Significant Accounting Judgments, Estimates and Assumptions
JudgmentsIn the process of applying the Group’s accounting policies, management has made the followingjudgments, in addition to those involving estimations, that can have significant effects on theamounts recognized in the consolidated financial statements:
Determination of Control or Joint Control over an Investee Company. Control is presumed toexist when an investor is exposed, or has rights, to variable returns from its involvement with theinvestee and has the ability to affect those returns through its power over the investee. On theother hand, joint control is presumed to exist when the investors contractually agreed sharing ofcontrol of an arrangement, which exists only when decisions about the relevant activities requirethe unanimous consent of the parties sharing control.
Determination of Significant Influence over an Investee Company. Significant influence existswhen an investor has the power to participate in the financial and operating policy decisions of theinvestee but is not control or joint control.
On October 30, 2017, after completion of the conditions under the SPA between the Group andPetron Corporation, the Group determined that the acquisition of 10,449,000 MNHPI sharesrepresenting 34.83% ownership enables the Group to exercise significant influence over MNHPI(Note 1.2).
Determination of Acquisition of Group of Assets as a Business in Accordance with PFRS 3.Management uses judgment in assessing if the group of assets and liabilities acquired wouldconstitute a business. In accordance with PFRS 3, business is defined as an integrated set ofactivities and assets that is capable of being conducted and managed for the purpose of providing areturn in the form of dividends, lower costs or other economic benefits directly to investors orother owners, members or participants.
Functional Currency. Management uses judgment in assessing the functional currency of theParent Company and its subsidiaries. Each entity in the Group determines its own functionalcurrency, which is the currency that best reflects the economic substance of the underlying eventsand circumstances relevant to that entity (see Note 1.3).
- 16 -
*SGVFS033016*
Service Concession Arrangements. The Group has determined that the concession contracts of theParent Company, SBITC, MICTSL, CGSA, Tecplata, AGCT, ICTSI Subic, LICTSLE (untilMay 24, 2017), PICT, OPC, ICTSI Iraq, SPICTL and MITL are within the scope of IFRIC 12,Service Concession Arrangements, accounted for under the intangible asset model. The intangibleassets pertaining to concession rights as at December 31, 2016, 2017 and 2018 are presented inNote 5 to the consolidated financial statements.
Gross versus Net Revenue Recognition. The Group assesses its revenue arrangements againstspecific criteria in order to determine if it is acting as principal or agent. The Group has concludedthat it is acting as principal in all of its revenue arrangements because the Group is the primaryobligor who is responsible for providing the services to the customers and the Group bears thecredit risk. The Group accounts and presents its revenues from port operations and the portauthorities’ share in revenues on a gross basis.
Revenue from contracts with customers (applicable starting January 1, 2018 upon the adoption ofPFRS 15)The Group applied the following judgements that significantly affect the determination of theamount and timing of revenue from contracts with customers:
ƒ Identifying performance obligationsThe Group provides port services, mainly cargo handling, to its customers. The Group hasdetermined that each of the services are capable of being distinct.
ƒ Determining the transaction priceThe Group determined that the transaction price is in accordance with the tariff rates publishedby port authorities in certain jurisdictions or agreed rates with the customers.
ƒ Determining the timing of satisfaction of port servicesThe Group concluded that the revenue for port operations is to be recognized when theservices are rendered.
Operating Lease. The evaluation of whether an arrangement is, or contains, a lease is based onthe substance of the arrangement at inception date. An arrangement is, or contains, a lease whenthe fulfillment of the arrangement depends on the use of a specific asset or assets and thearrangement conveys a right to use the asset.
Concession contracts outside the scope of IFRIC 12 and accounted by the Group in accordancewith IFRIC 4, Determining whether an Arrangement Contains a Lease, were determined asoperating leases.
The Group has also entered into operating lease agreements on property, office spaces and/orequipment as a lessor and as a lessee. The Group, as a lessee, has determined that the lessorretains all significant risks and rewards of ownership of these properties which are on operatinglease agreements. As a lessor, the Group retains substantially all the risks and benefits ofownership of the assets.
Deferred Tax Assets. Deferred tax assets are recognized for unused tax losses to the extent that itis probable that taxable profit will be available against which the losses can be utilized. Significantmanagement judgement is required to determine the amount of deferred tax assets that can berecognized, based upon the likely timing and the level of future taxable profits together with futuretax planning strategies.

- 17 -
*SGVFS033016*
Deferred tax assets recognized as at December 31, 2016, 2017 and 2018 are disclosed in Note 21to the consolidated financial statements. Unrecognized deferred tax assets on net operating losscarry-over (NOLCO) and other losses of certain subsidiaries amounted to US$3.3 million,US$3.0 million and US$3.3 million as at December 31, 2016, 2017 and 2018, respectively. Theselosses relate to subsidiaries that have a history of losses and may not be used to offset taxableincome elsewhere in the Group. The subsidiaries neither have any taxable temporary differencenor any tax planning opportunities available that could partly support the recognition of theselosses as deferred tax assets. On this basis, the Group has determined that it cannot recognizedeferred tax assets on the tax losses carried forward.
Contingencies. The Group is currently a party in a number of legal cases and negotiationsinvolving cargo, labor, tax, contracts and other issues. The Group’s estimate of the probable costsfor the resolution of these cases and negotiations has been developed in consultation with outsidecounsels handling the defense for these matters and is based upon an analysis of probable results.Management and its legal counsels believe that the Group has substantial legal and factual basesfor its position and is of the opinion that losses arising from these actions, if any, will not have amaterial adverse impact on the Group’s consolidated financial position and results of operations.It is possible, however, that future results of operations could be materially affected by changes inestimates or in the effectiveness of strategies relating to these proceedings. Provision for claimsand losses amounted to US$36.6 million, US$29.8 million and US$20.3 million as atDecember 31, 2016, 2017 and 2018, respectively (see Notes 18 and 25).
Estimates and AssumptionsThe key estimates and assumptions concerning the future and other key sources of estimationuncertainty at the balance sheet date that may have a significant risk of causing a materialadjustment to the carrying amounts of assets and liabilities within the next financial year arediscussed below.
Concession Rights. The determination of the cost of concession rights on service concessionarrangements requires management to make estimates and assumptions to determine the extent towhich the Group receives a right or license to charge users of the public service. Management isalso required to make estimates and assumptions in determining the fair value of concession rightsacquired through business combinations. In making those estimates, management is required todetermine a suitable discount rate to calculate the present value of these cash flows. While theGroup believes that the assumptions used are reasonable and appropriate, these estimates andassumptions can materially affect the consolidated financial statements. The carrying amounts ofconcession rights as at December 31, 2016, 2017 and 2018 are disclosed in Note 5 to theconsolidated financial statements.
Determination of Fair Values of Identifiable Assets and Liabilities. In the process of determiningthe embedded goodwill in relation to the Group’s acquisition of an associate, management usesestimates and assumptions in determining the fair value of identifiable assets and liabilities of theassociate. Management is required to use a suitable discount rate and determine the present ofvalue of cash flows. While the Group believes that the assumptions used are reasonable andappropriate, these estimates and assumptions can materially affect the consolidated financialstatements. The embedded goodwill and the share in the fair values of identifiable assets andliabilities of MNHPI are disclosed in Note 8 to the consolidated financial statements.
Construction Revenue and Cost Recognition. The Group’s revenue from construction services inrelation to its service concession arrangement is recognized using the input method and measuredby reference to the percentage of costs incurred to date to estimated total costs for each contract.

- 18 -
*SGVFS033016*
Expenditures to cover the work program for the development of the concession area or committedinvestments for each port development or project are provided in the concession agreement.When the costs incurred to date exceed the committed investments, an assessment is conducted todetermine the cause of the cost overrun. Cost overruns arising from uncontrollable factors such asoil price, wage increases and changes in technical work programs due to unforeseen economic,political and geological conditions are capitalized while all other cost overruns are treated asperiod costs.
Impairment of Nonfinancial Assets and Assets Not Yet Available for Use. PFRS requiresnonfinancial assets to be tested for impairment when certain impairment indicators are present andintangible asset that has not yet been brought into use to be tested for impairment annually,irrespective of whether there are any indications of impairment. Nonfinancial assets includeintangible assets already in use, except goodwill and intangible assets not yet available for use,property and equipment, investment properties, and investments in a joint venture and associates.
Management is required to make estimates and assumptions to determine the future cash flows tobe generated from the continued use and ultimate disposition of these assets in order to determinethe value of these assets. While the Group believes that the assumptions used are reasonable andappropriate, these estimates and assumptions can materially affect the consolidated financialstatements. Future adverse events may cause management to conclude that the affected assets areimpaired and may have a material impact on the financial condition and results of operations ofthe Group. The carrying amounts of intangible assets, including intangible assets not yet availablefor use, property and equipment, investment properties and investments in and advances to jointventures and associates are disclosed in Notes 5, 6, 7 and 8 to the consolidated financialstatements, respectively. There was no impairment loss recognized in 2016, 2017 and 2018.
Impairment of Goodwill. Purchase accounting requires extensive use of accounting estimates toallocate the purchase price to the fair market values of the acquiree’s identifiable assets andliabilities at the acquisition date. It also requires the acquirer to recognize goodwill. The Group’sbusiness acquisitions have resulted in goodwill which is subject to a periodic impairment test. TheGroup determines whether goodwill is impaired at least on an annual basis. This requires anestimation of the value-in-use of the cash-generating units to which goodwill is allocated.Estimating the value-in-use requires the Group to make an estimate of the expected future cashflows from the cash-generating unit and also to choose a suitable discount rate to calculate thepresent value of those cash flows.
The carrying amounts of goodwill as at December 31, 2016, 2017 and 2018 are disclosed inNote 5 to the consolidated financial statements. There are no impairment losses on goodwillrecognized in 2016 and 2017. Impairment loss on goodwill recognized in 2018 amounted toUS$5.8 million (see Notes 5 and 10).
Estimating Useful Lives. Management determines the estimated useful lives and the relateddepreciation and amortization charges for its concession rights, computer software, property andequipment, and investment properties based on the period over which these assets are expected toprovide economic benefits. Management’s estimation of the useful lives of concession rights,computer software, property and equipment, and investment properties is based on collectiveassessment of industry practice, internal technical evaluation, and experience with similar assets.These estimations are reviewed periodically and could change significantly due to physical wearand tear, technical or commercial obsolescence and legal or other limits on the use of these assets.Management will increase the depreciation and amortization charges where useful lives are lessthan what have previously been estimated.

- 19 -
*SGVFS033016*
A reduction in the estimated useful lives of intangible assets (including concession rights),property and equipment, and investment properties will increase recorded expenses and decreasenoncurrent assets. The carrying values of concession rights, property and equipment, andinvestment properties are disclosed in Notes 5, 6 and 7 to the consolidated financial statements,respectively.
Fair Value of Financial Instruments. When the fair values of financial assets and financialliabilities recorded in the consolidated balance sheet cannot be measured based on quoted prices inactive markets, their fair value is measured using valuation techniques including the discountedcash flow (DCF) model. The inputs to these models are taken from observable markets wherepossible, but where this is not feasible, a degree of judgment is required in establishing fair values.Judgments include considerations of inputs such as liquidity risk, credit risk and volatility.Changes in assumptions about these factors could affect the reported fair value of financialinstruments.
The fair values of financial assets and liabilities by category and the fair value hierarchy are setout in Note 26 to the consolidated financial statements.
Estimating Allowance for Doubtful Accounts (applicable until December 31, 2017 prior to theadoption of PFRS 9). Allowance for doubtful accounts is calculated using two methods, each ofthese methods are combined to determine the total amount of reserve. The first method is specificevaluation of information available that certain customers are unable to meet their financialobligations. In these cases, management uses judgment, based on the best available facts andcircumstances, including but not limited to, the length of relationship with customer and thecustomer’s current credit status based on third party credit reports and known market factors, torecord specific reserves for customers against amounts due and to reduce receivable amounts toexpected collection. These specific reserves are re-evaluated and adjusted as additionalinformation received affects the amounts estimated. Second, a provision is established as a certainpercentage of receivables not provided with specific reserves. This percentage is based on acollective assessment of historical collection, write-off experience, current economic trends, andchanges in customer payment terms and other factors that may affect the Group’s ability to collectpayments. Full allowance is provided for receivables with contested status.
The amounts and timing of recorded provision for doubtful accounts for any period would differ ifthe Group made different assumptions or utilized different estimates. An increase in the Group’sallowance for doubtful accounts would increase the recorded operating expenses and decrease itscurrent assets. The carrying values of receivables are disclosed in Note 12 to the consolidatedfinancial statements.
Estimating Net Realizable Value of Spare Parts and Supplies. The Group carries spare parts andsupplies at net realizable value when such value is lower than cost due to damage, physicaldeterioration, obsolescence, changes in price levels or other causes. The carrying amounts ofspare parts and supplies carried at net realizable value as at December 31, 2016, 2017 and 2018amounted to US$33.5 million, US$35.7 million and US$34.0 million, respectively.
The cost of these spare parts and supplies amounted to US$34.9 million, US$40.1 million andUS$38.3 million as at December 31, 2016, 2017 and 2018, respectively.
Write-downs of spare parts and supplies charged to the consolidated statements of incomeamounted to US$0.5 million in 2016, US$2.5 million in 2017 and US$0.4 million in 2018.

- 20 -
*SGVFS033016*
Pension Cost. The determination of the obligation and cost for pension benefits is dependent onthe selection of certain assumptions provided by the Group to its actuaries in calculating suchamounts. Those assumptions were described in Note 23 and included among others, discount rateand future salary increases. In accordance with PAS 19, Employee Benefits, actual results thatdiffer from the Group’s assumptions are included in other comprehensive income and are notreclassified to profit or loss in subsequent periods. While it is believed that the Group’sassumptions are reasonable and appropriate, significant differences in actual experience orsignificant changes in assumptions may materially affect the Group’s pension and other pensionobligations.
The carrying values of pension assets and pension liabilities as at December 31, 2016, 2017 and2018 are disclosed in Note 23 to the consolidated financial statements.
Definition of Default and Credit-impaired Financial Assets (applicable starting January 1, 2018upon the adoption of PFRS 9)The Group defines a financial instrument as in default, which is fully aligned with the definition ofcredit-impaired, when a customer is more than 120 days past due on its contractual obligations.However, in certain cases, the Group may also consider a financial asset to be in default wheninternal or external information indicates that the Group is unlikely to receive the outstandingcontractual amounts in full.
The criteria above have been applied to all financial instruments held by the Company and areconsistent with the definition of default used for internal credit risk management purposes. Thedefault definition has been applied consistently to calculate Company’s expected loss.
An instrument is considered to be no longer in default (i.e. to have cured) when it no longer meetsany of the default criteria.
Measurement of expected credit losses. ECLs are derived from unbiased and probability-weightedestimates of expected loss, and are based on the difference between the contractual cash flows duein accordance with the contract and all the cash flows that the Group expects to receive,discounted at the original effective interest rate, or an approximation thereof. The expected cashflows will include cash flows from the sale of collateral held or other credit enhancements that areintegral to the contractual terms.
Inputs, assumptions and estimation techniquesGeneral approach for debt financial assets measured at amortized cost other than tradereceivables. The ECL is measured on either a 12-month or lifetime basis depending on whether asignificant increase in credit risk has occurred since initial recognition or whether an asset isconsidered to be credit-impaired. Expected credit losses are the discounted product of theProbability of Default (PD), Loss Given Default (LGD), and Exposure at Default (EAD), definedas follows:
∂ Probability of default. The PD represents the likelihood of a debtor or customer defaultingon its financial obligation, either over the next 12 months, or over the remaining life of theobligation. PD estimates are estimates at a certain date, which are calculated based onavailable market data using rating tools tailored to the various categories of counterpartiesand exposures. If a counterparty or exposure migrates between rating classes, then this willlead to a change in the estimate of the associated PD. PDs are estimated considering thecontractual maturities of exposures.
The 12-months and lifetime PD represent the expected point-in-time probability of a defaultover the next 12 months and remaining lifetime of the financial instrument, respectively,

- 21 -
*SGVFS033016*
based on conditions existing at the balance sheet date and future economic conditions thataffect credit risk.
∂ Loss given default. Loss Given Default represents the Group’s expectation of the extent ofloss on a defaulted exposure, taking into account the mitigating effect of collateral, itsexpected value when realized and the time value of money. LGD varies by type ofcounterparty, type of seniority of claim and availability of collateral or other credit support.LGD is expressed as a percentage loss per unit of exposure at the time of default (EAD).
∂ Exposure at default. EAD is based on the amounts the Group expects to be owed at the timeof default, over the next 12 months or over the remaining lifetime.
Simplified approach for trade receivables. The Group uses a provision matrix to calculate ECLsfor trade receivables. The provision rates are based on days past due for groupings of variouscustomer segments that have similar loss patterns (i.e., by customer type and geography).
The provision matrix is initially based on the Group’s historical observed default rates. The Groupwill calibrate the matrices to adjust the historical credit loss experience with forward-lookinginformation. For instance, if forecast economic conditions (i.e., gross domestic product) areexpected to deteriorate over the next year which can lead to an increased number of defaults, thehistorical default rates are adjusted. At every reporting date, the historical observed default ratesare updated and changes in the forward-looking estimates are analyzed.
The assessment of the correlation between historical observed default rates, forecast economicconditions and ECLs is a significant estimate. The amount of ECLs is sensitive to changes incircumstances and of forecast economic conditions. The Group’s historical credit loss experienceand forecast of economic conditions may also not be representative of customer’s actual default inthe future.
There have been no significant changes in estimation techniques or significant assumptions madeduring the reporting period.
Incorporation of forward-looking information. The Group incorporates forward-lookinginformation into both its assessment of whether the credit risk of an instrument has increasedsignificantly since its initial recognition and its measurement of ECL.
To do this, the Group has considered a range of relevant forward-looking macro-economicassumptions for the determination of unbiased general industry adjustments and any relatedspecific industry adjustments that support the calculation of ECLs.
Based on the Group’s evaluation and assessment and after taking into consideration external actualand forecast information, the Group considers two or more economic scenarios and the relativeprobabilities of each outcome. External information includes economic data and forecastspublished by governmental bodies, monetary authorities and selected private-sector and academicinstitutions.
The Group has identified and documented key drivers of credit risk and credit losses of eachportfolio of financial instruments and, using an analysis of historical data, has estimatedrelationships between macro-economic variables and credit risk and credit losses. The Groupconsiders macro-economic factors such as GDP growth rates and inflation rates of selectedcountries in its analysis.
- 22 -
*SGVFS033016*
Predicted relationship between the key indicators and default and loss rates on portfolios offinancial assets have been developed based on analyzing historical data over the past 5 years. Themethodologies and assumptions including any forecasts of future economic conditions arereviewed regularly.
The Group has not identified any uncertain event that it has assessed to be relevant to the risk ofdefault occurring but where it is not able to estimate the impact on ECL due to lack of reasonableand supportable information.
Grouping of instruments for losses measured on collective basis. For expected credit lossprovisions modelled on a collective basis, a grouping of exposures is performed on the basis ofshared risk characteristics, such that risk exposures within a group are homogeneous. The Groupconsiders in its collective assessment the type of customers and its geographical location.
The appropriateness of groupings is monitored and reviewed on a periodic basis by Group. In2018, the total gross carrying amount of loans and receivables for which lifetime ECLs have beenmeasured on a collective basis amounted to US$573.8 million.
The carrying values of receivables and the related allowance for credit losses of the Group aredisclosed in Note 12.
3.3 Significant Accounting Policies
IntangiblesIntangible assets acquired separately are measured on initial recognition at cost. The cost ofintangible assets acquired in a business combination is recognized at fair value at acquisition date.Following initial recognition, intangible assets, except goodwill, are carried at cost less anyaccumulated amortization and any accumulated impairment losses. Internally generated intangibleassets are not capitalized and expenditure is reflected in the consolidated statement of income inthe year in which the expenditure is incurred. The Group accounts for goodwill following theaccounting policy on Business Combinations and Goodwill.
The useful lives of intangible assets are assessed to be either finite or indefinite.
Intangible assets with finite lives are amortized over their useful economic life and assessed forimpairment whenever there is an indication that intangible assets may be impaired. Theamortization period and method for an intangible asset with a finite useful life is reviewed at leastannually. Changes in expected useful life or the expected pattern of consumption of futureeconomic benefits embodied in the asset are accounted for by changing the amortization periodand method, as appropriate, and treated as changes in accounting estimates. The amortizationexpense on intangible assets with finite lives is recognized in the consolidated statement of incomeunder the “Depreciation and amortization” account, which is consistent with the function of theintangible assets.
Intangible assets with indefinite useful lives such as goodwill and intangible assets not yet broughtinto use are not amortized but tested for impairment annually, either individually or at thecash-generating unit level, irrespective of whether there is any indication of impairment. Theuseful life of an intangible asset with an indefinite life is reviewed annually to determine whetherthe indefinite life assessment continues to be supportable. If not, the change in the useful lifeassessment from indefinite to finite is made on a prospective basis.

- 23 -
*SGVFS033016*
The following intangibles are recognized and determined by the Group to have finite useful lives:
Concession Rights. Concession rights are either purchased or acquired through businesscombinations or recognized on service concession arrangements.
Concession rights purchased or acquired through business combinations are recognized at fairvalue at the date of acquisition and are categorized as upfront fees.
Concession rights on service concession arrangements are recognized when the Group effectivelyreceives a license or right to charge users for the public service it provides. Concession rightsconsist of:
a. Upfront fees payments on the concession contracts;
b. The cost of port infrastructure constructed (concession rights) and under construction (contractassets), including related borrowing costs, and port equipment purchased and committed inaccordance with the terms and conditions of the concession arrangements accounted for underIFRIC 12. These are not recognized as property and equipment of the Group but as anintangible asset; and
c. Future fixed fee considerations in exchange for the license or right for concessionarrangements accounted for under IFRIC 12. Fixed fees are recognized at present value usingthe discount rate at the inception date with a corresponding liability recognized. Interest onthe unwinding of discount of the liability and foreign exchange differences arising fromtranslations are recognized in the consolidated statement of income.
Subsequent costs and expenditures related to port infrastructure and equipment arising from theGroup’s commitments to the concession contracts, or that increase future revenue are recognizedas additions to the intangible asset and are stated at cost. Capital expenditures necessary tosupport the Group’s operation as a whole are recognized as property and equipment and accountedfor in accordance with the accounting policy on Property and Equipment. When the Group hascontractual obligations that it must fulfill as a condition of its license to: (i) maintain theinfrastructure to a specified level of serviceability or, (ii) to restore the infrastructure to a specifiedcondition before it is handed over to the grantor at the end of the service concession arrangement,it recognizes and measures these contractual obligations in accordance with the accounting policyon Provisions. Repairs and maintenance and other expenses that are routinary in nature areexpensed and recognized in the consolidated statement of income as incurred in accordance withthe accounting policy on Equipment and Facilities-related Expenses.
Concession rights are amortized using the straight-line method over the term of the concessionarrangements ranging from 4 to 37 years. Upfront fees are amortized upon the effectivity of theconcession agreement while port infrastructure and fixed fees are amortized when the terminal isready for use or upon start of commercial operations, whichever is earlier.
Computer Software Cost. Computer software cost, excluding those considered as integral part ofproperty and equipment, includes costs incurred in the development and acquisitions of computersoftware used in operations. Computer software is amortized when it is available for use on astraight-line method over five years.
Gains and losses arising from derecognition of an intangible asset are measured as the differencebetween the net disposal proceeds and the carrying amount of the asset and are recognized in theconsolidated statement of income when the asset is derecognized.

- 24 -
*SGVFS033016*
Contract Assets (applicable starting January 1, 2018 upon the adoption of PFRS 15)Contract assets, classified as part of concession rights, refer to on-going construction and upgradeservices on concession arrangements under the scope of IFRIC 12.
Business Combinations and GoodwillBusiness combinations are accounted for using the acquisition method.
Initial MeasurementThe cost of an acquisition is measured as the aggregate of the consideration transferred measuredat acquisition date fair value and the amount of any non-controlling interest in the acquiree. Foreach business combination, the Group elects to measure the non-controlling interest in theacquiree either at fair value or at the proportionate share of the acquiree’s identifiable net assets.Acquisition-related costs incurred such as finder’s fees; advisory, legal, accounting, valuation andother professional or consulting fees; and general administrative costs, including the costs ofmaintaining an internal acquisitions department or business development offices are expensed andincluded as part of “Administrative and other operating expenses” account in the consolidatedstatement of income.
When the Group acquires a business, it assesses the financial assets acquired and liabilitiesassumed for appropriate classification and designation in accordance with the contractual terms,economic circumstances and pertinent conditions as at the acquisition date. This includes theseparation of embedded derivatives in host contracts by the acquiree.
If the business combination is achieved in stages, the previously held equity interest in theacquiree is remeasured at its acquisition date fair value and any resulting gain or loss is recognizedin the consolidated statement of income.
Any contingent consideration to be transferred by the acquirer will be recognized at fair value atthe acquisition date. Contingent consideration classified as an asset or liability that is a financialinstrument and within the scope of PAS 39, Financial Instruments: Recognition andMeasurement, is measured at fair value with the changes in fair value recognized in theconsolidated statement of income. If the contingent consideration is not within the scope ofPAS 39, it is measured in accordance with appropriate PFRS. Contingent consideration that isclassified as equity is not remeasured until it is finally settled within equity.
Goodwill is initially measured at cost being the excess of the aggregate of the considerationtransferred and the amount recognized for non-controlling interest over the net fair value of theidentifiable assets acquired and liabilities assumed. If the fair value of the net assets acquired is inexcess of the aggregate consideration transferred, the Group re-assesses whether it has correctlyidentified all of the assets acquired and all of the liabilities assumed and reviews the proceduresused to measure the amounts to be recognized at the acquisition date. If the re-assessment stillresults in an excess of the fair value of net assets acquired over the aggregate considerationtransferred, then the gain is recognized in the consolidated statement of income.
If the initial accounting for business combination can be determined only provisionally by the endof the year during which the combination has occurred because either the fair values to beassigned to the acquiree’s identifiable assets, liabilities or contingent liabilities or the cost of thecombination can be determined only provisionally, the Group accounts for the combination usingprovisional values. Adjustments to these provisional values because of completing the initialaccounting shall be made within 12 months from the acquisition date. The carrying amount of anidentifiable asset, liability or contingent liability that is recognized as a result of completing theinitial accounting shall be calculated as if the asset, liability or contingent liability’s fair value atthe acquisition date had been recognized from that date. Goodwill or any gain recognized shallbe adjusted from the acquisition date by an amount equal to the adjustment to the fair value at the

- 25 -
*SGVFS033016*
acquisition date of the identifiable asset, liability or contingent liability being recognized oradjusted.
Subsequent MeasurementFollowing initial recognition, goodwill is measured at cost less any accumulated impairmentlosses. For purposes of impairment testing, goodwill acquired in a business combination is, fromthe acquisition date, allocated to each of the Group’s cash-generating units, or groups ofcash-generating units, that are expected to benefit from the synergies of the combination,irrespective of whether other assets or liabilities of the Group are assigned to those units or groupof units. Each unit or group of units to which the goodwill is allocated:
ƒ represents the lowest level within the Group at which the goodwill is monitored for internalmanagement purposes; and
ƒ is not larger than a segment based on the Group’s format determined in accordance withPFRS 8, Operating Segments.
Where goodwill forms part of a cash-generating unit (group of cash-generating units) and part ofthe operation within that unit is disposed of, the goodwill associated with the operation disposedof is included in the carrying amount of the operation when determining the gain or loss ondisposal of the operation. Goodwill disposed of in this circumstance is measured based on therelative values of the operation disposed of and the portion of the cash-generating unit retained.
When subsidiaries are sold, the difference between the selling price and the net assets pluscumulative translation differences and goodwill is recognized as gain or loss in the consolidatedstatement of income.
Goodwill is shown as part of “Intangibles” account in the consolidated balance sheet.
Acquisition of AssetsWhen assets are acquired, through corporate acquisitions or otherwise, management considers thesubstance of the assets and activities of the acquired entity in determining whether the acquisitionrepresents an acquisition of a business.
When such an acquisition is not judged to be an acquisition of a business, it is not treated as abusiness combination. Rather, the cost to acquire the entity is allocated between the identifiedassets and liabilities of the entity based on their relative fair values at the acquisition date.Accordingly, no goodwill or additional deferred tax arises.
Property and EquipmentProperty and equipment, except land, are stated at cost less accumulated depreciation,amortization and any impairment in value. Land is stated at cost less any impairment in value.
The initial cost of property and equipment comprises its purchase price and any directlyattributable costs of bringing the asset to its working condition and location for its intended use.Such cost also includes the cost of replacing part of the property and equipment and borrowingcosts for long-term construction projects if the recognition criteria are met, and any obligationrelated to the retirement of the asset. Expenditures incurred after the property and equipment havebeen put into operations, such as repairs and maintenance and overhaul costs, are generallyrecognized in the consolidated statement of income in accordance with the accounting policy onEquipment and Facilities-related Expenses. In situations where it can be clearly demonstrated thatthe expenditures have resulted in an increase in the future economic benefits expected to beobtained from the use of an item of property and equipment beyond its originally assessed

- 26 -
*SGVFS033016*
standard of performance, the expenditures are capitalized as additional costs of property andequipment. When significant parts of property and equipment are required to be replaced atintervals, the Group recognizes such parts as individual assets with specific useful lives anddepreciates them accordingly. When assets are sold or retired, their costs and accumulateddepreciation, amortization and impairment losses, if any, are eliminated from the accounts and anygain or loss resulting from their disposal is included in the consolidated statement of income ofsuch period.
Depreciation and amortization start when the property and equipment are available for use andcomputed using the straight-line method over the estimated useful lives of the assets or the termsof the operating contract with port authorities or concessions, whichever is shorter.
The estimated useful lives of property and equipment are as follows:
Land improvements 7-25 yearsLeasehold rights and improvements 5-48 years or terms of the operating contract
with port authorities or concessions,whichever is shorter
Port facilities and equipment 5-25 years or terms of the operating contractwith port authorities or concessions,whichever is shorter
Transportation equipment 3-5 yearsOffice equipment, furniture and fixtures 3-5 yearsMiscellaneous equipment 5 years
The useful lives, depreciation and amortization method, and any residual values are reviewedperiodically and adjusted prospectively, if appropriate, to ensure that the periods and method ofdepreciation and amortization are consistent with the expected pattern of economic benefits fromitems of property and equipment.
Fully depreciated assets are retained in the accounts until they are no longer in use and no furtherdepreciation and amortization is charged to current operations.
An item of property and equipment and any significant part initially recognized are derecognizedupon disposal or when no future economic benefits are expected from its use or disposal. Anygain or loss arising on derecognition of the asset (calculated as the difference between the netdisposal proceeds and the carrying amount of the property and equipment) is included in theconsolidated statement of income when the asset is derecognized.
Construction in progress represents structures under construction and is stated at cost. Thisincludes cost of construction and other direct costs. Construction in progress is not depreciateduntil such time the relevant assets are completed and available for operational use.
Port equipment spare parts represent major components or parts of port equipment such as quaycranes, which generally include insurance spares, that are critical for the continuous operations ofthe terminal equipment and facilities that have significantly different patterns of consumption ofeconomic benefits. Spare parts are classified as property and equipment if the expected time ofuse is more than twelve months and provided that the capitalization thresholds are met.
Borrowing CostsBorrowing costs that are directly attributable to the acquisition or construction of a qualifyingasset including intangibles and property and equipment while the qualifying asset is underconstruction are capitalized as part of the cost of that asset. Borrowing costs consist of interest

- 27 -
*SGVFS033016*
and other costs that an entity incurs in connection with the borrowing of funds. Capitalization ofborrowing cost should commence when: (i) expenditures for the asset and borrowing costs arebeing incurred; and (ii) activities that are necessary to prepare the asset for its intended use or saleare in progress. Capitalization ceases when the asset is substantially ready for its intended use orsale. If active development is interrupted for an extended period, capitalization is suspended.When construction occurs piecemeal and use of each part is possible as construction continues,capitalization of each part ceases upon substantial completion of that part. For borrowing of fundsassociated with a specific asset, the actual rate on that borrowing is used. Otherwise, a weightedaverage cost of borrowing is used.
All other borrowing costs are expensed as incurred.
However, if the carrying amount of the asset after capitalization of borrowing costs exceeds itsrecoverable amount, an impairment loss is recognized.
Investment PropertiesInvestment properties consisting mainly of land and improvements and buildings are initiallymeasured at cost including transaction costs. Subsequent to initial recognition, improvements andbuildings are stated at cost less depreciation and amortization, and any impairment in value.
Depreciation and amortization are computed using the straight-line method over the estimateduseful lives of the assets ranging from 15 to 25 years.
Investment properties are derecognized when either they have been disposed of or when they arepermanently withdrawn from use and no future economic benefit is expected from their disposal.Any gains or losses are measured as the difference between the net disposal proceeds and thecarrying amount of the asset and recognized in the consolidated statement of income uponretirement or disposal.
Transfers are made to or from investment property only when there is a change in use. For atransfer from investment property to owner-occupied property, the cost and the carrying amount ofthe property transferred do not change. If an owner-occupied property becomes an investmentproperty, the Group accounts for such property in accordance with the accounting policy onProperty and Equipment up to the date of change in use.
Investments in Joint Ventures and in AssociatesInvestment in associates in which the Group exercises significant influence and which is neither asubsidiary nor a joint venture of the Group is accounted for under the equity method ofaccounting.
A joint venture is a type of joint arrangement whereby the parties that have joint control of thearrangement have rights to the net assets of the joint venture. Joint control is the contractuallyagreed sharing of control of an arrangement, which exists only when decisions about the relevantactivities require unanimous consent of the parties sharing control. The Group’s investment in ajoint venture is accounted for using the equity method.
Under the equity method, the cost of investment in associates and joint ventures is carried in theconsolidated balance sheet at cost plus post acquisition changes in the Group’s share of net assetsof the associates and the joint ventures. Goodwill, if any, relating to associates or joint ventures isincluded in the carrying amount of the investment and is not amortized or separately tested forimpairment. The consolidated statement of income reflects the share of the results of operationsof the associates and joint ventures. Where there has been a change recognized directly in theequity of the associates and the joint ventures, the Group recognizes its share of any changes and

- 28 -
*SGVFS033016*
discloses this, when applicable, in the consolidated statement of changes in equity. Unrealizedprofits or losses resulting from transactions between the Group and the associates and jointventures are eliminated to the extent of the interest in the associates and joint ventures.
The reporting dates of the associates, the joint ventures and the Parent Company are identical andthe accounting policies of the associates and joint ventures conform to those used by the Group forlike transactions and events in similar circumstances.
After application of the equity method, the Group determines whether it is necessary to recognizean impairment loss on its investment in its associates or joint ventures. At each reporting date, theGroup determines whether there is objective evidence that the investment in the associates or jointventures is impaired. If there is such evidence, the Group calculates the amount of impairment asthe difference between the recoverable amount of the associates or joint ventures and its carryingvalue, and then recognizes the loss as “Equity in net loss of joint ventures and an associate” in theconsolidated statement of income.
Upon loss of joint control over the joint venture and loss of significant influence over theassociates, the Group measures and recognizes any retained investment at its fair value. Anydifference between the carrying amount of the joint venture and the associates upon loss of jointcontrol and significant influence, respectively, and the fair value of the retained investment andproceeds from disposal is recognized in the consolidated statement of income.
Impairment of Nonfinancial AssetsIntangibles, except intangibles not yet brought into use, property and equipment, investmentproperties, and investment in associates and joint ventures are reviewed for impairment wheneverevents or changes in circumstances indicate that the carrying amount of an asset may not berecoverable. Whenever the carrying amount of an asset exceeds its recoverable amount, animpairment loss is recognized in the consolidated statement of income. The recoverable amount isthe higher of an asset’s or cash-generating unit’s fair value less costs of disposal or value-in-use.Recoverable amounts are estimated for individual assets or, if it is not possible, for thecash-generating unit to which the asset belongs. Fair value less costs of disposal is the price thatwould be received to sell an asset or paid to transfer a liability in an orderly transaction betweenmarket participants at the measurement date less costs of disposal while value-in-use is the presentvalue of estimated future cash flows expected to arise from the continuing use of an asset or fromits disposal at the end of its useful life.
In assessing value-in-use, the estimated future cash flows are discounted to their present valueusing the pre-tax discount rate that reflects current market assessments of the time value of moneyand the risks specific to the asset. In determining fair value less costs of disposal, recent markettransactions are taken into account. If no such transactions can be identified, an appropriatevaluation model is used. These calculations are corroborated by valuation multiples, quoted pricesfor publicly traded companies or other available fair value indicators.
The Group bases its impairment calculation on detailed budgets and forecast calculations, whichare prepared separately for each of the Group’s cash generating unit to which the individual assetsare allocated. These budgets and forecast calculations generally cover a period of five years. Forlonger periods, a long-term growth rate is calculated and applied to project future cash flows afterthe fifth year.
Impairment losses of continuing operations, including impairment on spare parts and supplies, arerecognized in the consolidated statement of income in expense categories consistent with thefunction of the impaired asset.

- 29 -
*SGVFS033016*
For these nonfinancial assets excluding goodwill and intangibles not yet brought into use, anassessment is made at each reporting date as to whether there is any indication that previouslyrecognized impairment losses may no longer exist or may have decreased. If such indicationexists, the Group estimates the asset’s or cash-generating unit’s recoverable amount. A previouslyrecognized impairment loss is reversed only if there has been a change in the assumptions used todetermine the asset’s recoverable amount since the last impairment loss was recognized. In suchinstance, the carrying amount of the asset is increased to its recoverable amount. However, thatincreased amount cannot exceed the carrying amount that would have been determined, net ofdepreciation, had no impairment loss been recognized for the asset in prior years. Such reversal isrecognized in the consolidated statement of income.
Intangibles not yet brought into use are tested for impairment annually irrespective of whetherthere is any impairment indicator.
The following assets have specific characteristic for impairment testing:
Goodwill. Goodwill is reviewed for impairment, annually or more frequently, if events or changesin circumstances indicate that the carrying value may be impaired.
Impairment is determined for goodwill by assessing the recoverable amount of the cash-generatingunit, which is also the operating entity acquired through business combination and to which thegoodwill relates or has been allocated. When the recoverable amount of the cash-generating unitis less than its carrying amount, an impairment loss is recognized. Impairment losses relating togoodwill cannot be reversed in future periods.
The Group performs its annual impairment test for intangibles not yet brought into use andgoodwill at December 31.
Investments in Joint Ventures and in Associates. After application of the equity method, theGroup determines whether it is necessary to recognize additional impairment loss of the Group’sinvestment in its associates and joint ventures. The Group determines at each balance sheet datewhether there is any objective evidence that the investment in joint ventures and in associates isimpaired. If this is the case, the Group calculates the amount of impairment as being thedifference between the recoverable amount of the associates and joint ventures and the carryingamount of the investment, and recognizes the amount in the consolidated statement of income.The Group’s investment in ARDC has been fully provided with an allowance for probable loss(see Note 8).
Fair Value MeasurementThe Group measures financial instruments, such as, derivatives, at fair value at each balance sheetdate. Also, fair values of non-financial assets such as investment properties and financialinstruments measured at amortized cost are disclosed in Notes 7 and 26.1, respectively.
Fair value is the price that would be received to sell an asset or paid to transfer a liability in anorderly transaction between market participants at the measurement date. The fair valuemeasurement is based on the presumption that the transaction to sell the asset or transfer theliability takes place either:
• In the principal market for the asset or liability, or• In the absence of a principal market, in the most advantageous market for the asset or liability.
The principal or the most advantageous market must be accessible to the Group.

- 30 -
*SGVFS033016*
The fair value of an asset or a liability is measured using the assumptions that market participantswould use when pricing the asset or liability, assuming that market participants act in theireconomic best interest.
A fair value measurement of a non-financial asset takes into account a market participant's abilityto generate economic benefits by using the asset in its highest and best use or by selling it toanother market participant that would use the asset in its highest and best use.
The Group uses valuation techniques that are appropriate in the circumstances and for whichsufficient data are available to measure fair value, maximizing the use of relevant observableinputs and minimizing the use of unobservable inputs.
All assets and liabilities for which fair value is measured or disclosed in the consolidated financialstatements are categorized within the fair value hierarchy, described as follows, based on thelowest level input that is significant to the fair value measurement as a whole:
• Level 1 - Quoted (unadjusted) market prices in active markets for identical assets or liabilities• Level 2 - Valuation techniques for which the lowest level input that is significant to the fair
value measurement is directly or indirectly observable• Level 3 - Valuation techniques for which the lowest level input that is significant to the fair value measurement is unobservable
For assets and liabilities that are recognized in the consolidated financial statements on a recurringbasis, the Group determines whether transfers have occurred between Levels in the hierarchy byre-assessing categorization (based on the lowest level input that is significant to the fair valuemeasurement as a whole) at the end of each reporting period.
For the purpose of the fair value disclosures, the Group has determined classes of assets andliabilities on the basis of the nature, characteristics and risks of the asset or liability and the levelof the fair value hierarchy as explained above.
Financial Instruments – Classification and Measurement (applicable starting January 1, 2018upon the adoption of PFRS 9)Classification of financial assets. Financial assets are classified in their entirety based on thecontractual cash flows characteristics of the financial assets and the Group’s business model formanaging the financial assets. The Group classifies its financial assets into the followingmeasurement categories:∂ financial assets measured at amortized cost∂ financial assets measured at fair value through profit or loss∂ financial assets measured at fair value through other comprehensive income, where cumulative
gains or losses previously recognized are reclassified to profit or loss∂ financial assets measured at fair value through other comprehensive income, where cumulative
gains or losses previously recognized are not reclassified to profit or loss
Contractual cash flows characteristics. If the financial asset is held within a business modelwhose objective is to hold assets to collect contractual cash flows or within a business modelwhose objective is achieved by both collecting contractual cash flows and selling financial assets,the Group assesses whether the cash flows from the financial asset represent solely payments ofprincipal and interest (SPPI) on the principal amount outstanding.

- 31 -
*SGVFS033016*
In making this assessment, the Group determines whether the contractual cash flows are consistentwith a basic lending arrangement, i.e., interest includes consideration only for the time value ofmoney, credit risk and other basic lending risks and costs associated with holding the financialasset for a particular period of time. In addition, interest can include a profit margin that isconsistent with a basic lending arrangement. The assessment as to whether the cash flows meetthe test is made in the currency in which the financial asset is denominated. Any other contractualterms that introduce exposure to risks or volatility in the contractual cash flows that is unrelated toa basic lending arrangement, such as exposure to changes in equity prices or commodity prices, donot give rise to contractual cash flows that are solely payments of principal and interest on theprincipal amount outstanding.
Business model. The Group’s business model is determined at a level that reflects how groups offinancial assets are managed together to achieve a particular business objective. The Group’sbusiness model does not depend on management’s intentions for an individual instrument.
The Group’s business model refers to how it manages its financial assets in order to generate cashflows. The Group’s business model determines whether cash flows will result from collectingcontractual cash flows, selling financial assets or both. Relevant factors considered by the Groupin determining the business model for a group of financial assets include how the performance ofthe business model and the financial assets held within that business model are evaluated andreported to the Group’s key management personnel, the risks that affect the performance of thebusiness model (and the financial assets held within that business model) and how these risks aremanaged and how managers of the business are compensated.
Financial assets at amortized costA financial asset is measured at amortized cost if (i) it is held within a business model whoseobjective is to hold financial assets in order to collect contractual cash flows and (ii) thecontractual terms of the financial asset give rise on specified dates to cash flows that are solelypayments of principal and interest on the principal amount outstanding. Financial assets atamortized cost are subsequently measured using the effective interest (EIR) method and aresubject to impairment. Gains and losses are recognized in profit or loss when the asset isderecognized, modified or impaired.
The Group’s financial assets at amortized cost includes cash in banks (see Note 11), tradereceivables (see Note 12), and receivables from related parties (see Note 22).
Financial assets at fair value through other comprehensive income (FVOCI)Debt instruments. A debt financial asset is measured at FVOCI if (i) it is held within a businessmodel whose objective is achieved by both collecting contractual cash flows and selling financialassets and (ii) its contractual terms give rise on specified dates to cash flows that are solelypayments of principal and interest on the principal amount outstanding. These financial assets areinitially recognized at fair value plus directly attributable transaction costs and subsequentlymeasured at fair value. Gains and losses arising from changes in fair value are included in othercomprehensive income within a separate component of equity. Impairment losses or reversals,interest income and foreign exchange gains and losses are recognized in profit and loss until thefinancial asset is derecognized. Upon derecognition, the cumulative gain or loss previouslyrecognized in other comprehensive income is reclassified from equity to profit or loss. Thisreflects the gain or loss that would have been recognized in profit or loss upon derecognition if thefinancial asset had been measured at amortized cost. Impairment is measured based on theexpected credit loss (ECL) model.
As of December 31, 2018, the Group does not have debt instruments at FVOCI.
- 32 -
*SGVFS033016*
Equity instruments. The Group may also make an irrevocable election to measure at FVOCI oninitial recognition investments in equity instruments that are neither held for trading norcontingent consideration recognized in a business combination in accordance with PFRS 3.Amounts recognized in OCI are not subsequently transferred to profit or loss. However, theGroup may transfer the cumulative gain or loss within equity. Dividends on such investments arerecognized in profit or loss, unless the dividend clearly represents a recovery of part of the cost ofthe investment.
As of December 31, 2018, the Group elected to classify irrevocably all equity investments asfinancial asset at FVOCI (see Note 9).
Financial assets at fair value through profit or loss (FVTPL)Financial assets at FVTPL are measured as at unless these are measured at amortized cost or atFVOCI. Included in this classification are equity investments held for trading and debtinstruments with contractual terms that do not represent solely payments of principal and interest.Financial assets held at FVTPL are initially recognized at fair value, with transaction costsrecognized in the statement of income as incurred. Subsequently, they are measured at fair valueand any gains or losses are recognized in the parent company statements of income.
Additionally, even if the asset meets the amortized cost or the FVOCI criteria, the Group maychoose at initial recognition to designate the financial asset at FVTPL if doing so eliminates orsignificantly reduces a measurement or recognition inconsistency (an accounting mismatch) thatwould otherwise arise from measuring financial assets on a different basis.
Trading gains or losses are calculated based on the results arising from trading activities of theGroup, including all gains and losses from changes in fair value for financial assets and financialliabilities at FVTPL, and the gains or losses from disposal of financial investments.
The Group’s financial assets at FVTPL consists of derivative instruments not designated underhedge accounting (see Note 26).
Classification of financial liabilities
Financial liabilities are measured at amortized cost, except for the following:∂ financial liabilities measured at fair value through profit or loss;∂ financial liabilities that arise when a transfer of a financial asset does not qualify for
derecognition or when the Group retains continuing involvement;∂ financial guarantee contracts;∂ commitments to provide a loan at a below-market interest rate; and∂ contingent consideration recognized by an acquirer in accordance with PFRS 3.
A financial liability may be designated at fair value through profit or loss if it eliminates orsignificantly reduces a measurement or recognition inconsistency (an accounting mismatch) or:
∂ if a host contract contains one or more embedded derivatives; or∂ if a group of financial liabilities or financial assets and liabilities is managed and its
performance evaluated on a fair value basis in accordance with a documented riskmanagement or investment strategy.

- 33 -
*SGVFS033016*
Where a financial liability is designated at fair value through profit or loss, the movement in fairvalue attributable to changes in the Group’s own credit quality is calculated by determining thechanges in credit spreads above observable market interest rates and is presented separately inother comprehensive income.
Reclassifications of financial instruments (applicable starting January 1, 2018 upon the adoptionof PFRS 9)The Group reclassifies its financial assets when, and only when, there is a change in the businessmodel for managing the financial assets. Reclassifications shall be applied prospectively by theGroup and any previously recognized gains, losses or interest shall not be restated. The Groupdoes not reclassify its financial liabilities.
Impairment of Financial Assets (applicable starting January 1, 2018 upon the adoption ofPFRS 9)PFRS 9 introduces a single, forward-looking “expected loss” impairment model, replacing the“incurred loss” impairment model under PAS 39.
The Group recognizes expected credit losses (ECL) for the following financial assets that are notmeasured at FVTPL:
∂ debt instruments that are measured at amortized cost and FVOCI;∂ contract assets;∂ trade receivables;∂ loan commitments; and∂ financial guarantee contracts.
No ECL is recognized on equity investments.
ECLs are measured in a way that reflects the following:∂ an unbiased and probability-weighted amount that is determined by evaluating a range of
possible outcomes;∂ the time value of money; and∂ reasonable and supportable information that is available without undue cost or effort at the
reporting date about past events, current conditions and forecasts of future economicconditions.
Financial assets migrate through the following three stages based on the change in credit qualitysince initial recognition:
Stage 1: 12-month ECL. For credit exposures where there have not been significant increases incredit risk since initial recognition and that are not credit-impaired upon origination, the portion oflifetime ECLs that represent the ECLs that result from default events that are possible within the12-months after the reporting date are recognized.
Stage 2: Lifetime ECL – not credit-impaired. For credit exposures where there have beensignificant increases in credit risk since initial recognition on an individual or collective basis butare not credit-impaired, lifetime ECLs representing the ECLs that result from all possible defaultevents over the expected life of the financial asset are recognized.

- 34 -
*SGVFS033016*
Stage 3: Lifetime ECL – credit-impaired. Financial assets are credit-impaired when one or moreevents that have a detrimental impact on the estimated future cash flows of those financial assetshave occurred. For these credit exposures, lifetime ECLs are recognized and interest revenue iscalculated by applying the credit-adjusted effective interest rate to the amortized cost of thefinancial asset.
Loss allowanceFor trade receivables, the Group applies a simplified approach in calculating ECLs. Therefore, theGroup does not track changes in credit risk, but instead recognizes a loss allowance based onlifetime ECLs at each reporting date. The Group has established a provision matrix that is basedon its historical credit loss experience, adjusted for forward-looking factors specific to the debtorsand the economic environment.
For all debt financial assets other than trade receivables, ECLs are recognized using the generalapproach wherein the Group tracks changes in credit risk and recognizes a loss allowance basedon either a 12-month or lifetime ECLs at each reporting date.
Loss allowances are recognized based on 12-month ECL for debt investment securities that areassessed to have low credit risk at the reporting date. A financial asset is considered to have lowcredit risk if:
∂ the financial instrument has a low risk of default∂ the borrower has a strong capacity to meet its contractual cash flow obligations in the near
term∂ adverse changes in economic and business conditions in the longer term may, but will not
necessarily, reduce the ability of the borrower to fulfil its contractual cash flow obligations.
The Group considers certain debt investment securities to have low credit risk when its credit riskrating is equivalent to the globally understood definition of ‘investment grade’.
Determining the stage for impairment. At each reporting date, the Group assesses whether therehas been a significant increase in credit risk for financial assets since initial recognition bycomparing the risk of default occurring over the expected life between the reporting date and thedate of initial recognition. The Group considers reasonable and supportable information that isrelevant and available without undue cost or effort for this purpose. This includes quantitative andqualitative information and forward-looking analysis.
Exposures that have not deteriorated significantly since origination, or where the deteriorationremains within the Group’s investment grade criteria are considered to have a low credit risk. Theprovision for credit losses for these financial assets is based on a 12-month ECL. The low creditrisk exemption has been applied on debt investments that meet the investment grade criteria of theGroup from the time of origination.
An exposure will migrate through the ECL stages as asset quality deteriorates. If, in a subsequentperiod, asset quality improves and also reverses any previously assessed significant increase incredit risk since origination, then the loss allowance measurement reverts from lifetime ECL to12-months ECL.
Write-off policyThe Group writes-off a financial asset, in whole or in part, when the asset is considereduncollectible, it has exhausted all practical recovery efforts and has concluded that it has noreasonable expectations of recovering the financial asset in its entirety or a portion thereof.

- 35 -
*SGVFS033016*
Financial Instruments (applicable until December 31, 2017 prior to the adoption of PFRS 9)Financial Assets and Financial Liabilities. Financial assets and financial liabilities are recognizedinitially at fair value. Transaction costs are included in the initial measurement of all financialassets and liabilities, except for financial instruments measured at fair value through profit or loss(FVTPL).
The Group recognizes a financial asset or a financial liability in the consolidated balance sheetwhen it becomes a party to the contractual provisions of the instrument. In the case of a regularway purchase or sale of financial assets, recognition and derecognition, as applicable, is doneusing trade date accounting.
Financial instruments are classified as liabilities or equity in accordance with the substance of thecontractual arrangement. Interest, dividends, gains and losses relating to a financial instrument ora component that is a financial liability, are reported as expense or income. Distributions toholders of financial instruments classified as equity are charged directly to equity, net of anyrelated income tax benefits.
Financial assets are classified into the following categories: financial assets at FVTPL, loans andreceivables, held-to-maturity (HTM) investments, and AFS investments. Financial liabilities areclassified as either financial liabilities at FVTPL or as other financial liabilities. The Groupdetermines the classification at initial recognition and, where allowed and appropriate,re-evaluates this designation at every reporting date.
There were no reclassifications within the categories of the financial assets and liabilities in 2016and 2017.
Financial Assets and Financial Liabilities at FVTPL. These include financial assets and liabilitiesheld for trading and financial assets and liabilities designated upon initial recognition as atFVTPL. Financial assets and financial liabilities are classified as held for trading if they areacquired for the purpose of selling or repurchasing in the near term. Derivatives, includingseparated embedded derivatives, are also classified as held for trading unless they are designatedas effective hedging instruments or a financial guarantee contract.
Financial assets or financial liabilities may be designated by management at initial recognition asat FVTPL if any of the following criteria are met: (i) the designation eliminates or significantlyreduces the inconsistent treatment that would otherwise arise from measuring the assets orliabilities or recognizing gains or losses on them on a different basis; or (ii) the assets andliabilities are part of a group of financial assets, financial liabilities or both which are managed andtheir performance evaluated on a fair value basis, in accordance with a documented riskmanagement strategy; or (iii) the financial instrument contains an embedded derivative, unless theembedded derivative does not significantly modify the cash flows or it is clear, with little or noanalysis, that it would not be separately recorded.
Financial assets and financial liabilities at FVTPL are recorded in the consolidated balance sheetat fair value with gains or losses recognized in the consolidated statement of income.
This category includes derivative assets and liabilities (see Notes 9, 16 and 26).
Derivative Financial Instruments and HedgingDerivative financial instruments are initially recognized at fair value on the date in which aderivative transaction is entered into or bifurcated, and are subsequently re-measured andaccounted for in the consolidated balance sheet at fair value. The method of recognizing the

- 36 -
*SGVFS033016*
resulting gain or loss depends on whether the derivative is designated as a hedge of an identifiedrisk and qualifies for hedge accounting treatment or accounted for as derivative not designated forhedges.
The objective of hedge accounting is to match the impact of the hedged item and the hedginginstrument in the consolidated statement of income. To qualify for hedge accounting, the hedgingrelationship must comply with strict requirements such as the designation of the derivative as ahedge of an identified risk exposure, hedge documentation, probability of occurrence of theforecasted transaction in a cash flow hedge, assessment and measurement of hedge effectiveness,and reliability of the measurement bases of the derivative instruments.
At the inception of a hedge relationship, the Group formally designates and documents the hedgerelationship to which it wishes to apply hedge accounting and the risk management objective andstrategy for undertaking the hedge. The documentation includes identification of the hedginginstrument, the hedged item or transaction, the nature of the risk being hedged and how the entitywill assess the hedging instrument’s effectiveness in offsetting the exposure to changes in thehedged item’s fair value or cash flows attributable to the hedged risk. Such hedges are expected tobe highly effective in achieving offsetting changes in fair value or cash flows and are assessed onan on-going basis to determine that they actually have been highly effective throughout thefinancial reporting periods for which they were designated.
The Group’s derivative financial instruments are accounted for as either cash flow hedges ortransactions not designated as hedges.
Cash Flow Hedges. Cash flow hedges are hedges of the exposure to variability in cash flows thatis attributable to a particular risk associated with a recognized asset, liability or a highly probableforecast transaction and could affect the consolidated statement of income. Changes in the fairvalue of a hedging instrument that qualifies as a highly effective cash flow hedge are recognizedas “Net change in unrealized mark-to-market values of derivatives” in the consolidated statementof comprehensive income, whereas any hedge ineffectiveness is immediately recognized in theconsolidated statement of income.
Amounts taken to equity are transferred to the consolidated statement of income when the hedgedtransaction affects profit or loss, such as when the hedged financial income or financial expense isrecognized or when a forecast sale or purchase occurs. Where the hedged item is the cost of anon-financial asset or liability, the amounts taken to equity are reclassified to profit or loss as areclassification adjustment in the same period or periods during which the asset acquired orliability assumed affects profit or loss (such as in the periods that depreciation expense or cost ofsales is recognized). However, if an entity expects that all or a portion of a loss recognized inother comprehensive income will not be recovered in one or more future periods, it shall reclassifyfrom equity to profit or loss as a reclassification adjustment the amount that is not expected to berecovered.
Hedge accounting is discontinued prospectively when the hedge ceases to be highly effective.When hedge accounting is discontinued, the cumulative gains or losses on the hedging instrumentthat has been reported as “Net change in unrealized mark-to-market values of derivatives” isretained in the consolidated statement of comprehensive income until the hedged transactionimpacts the consolidated statement of income. When the forecasted transaction is no longerexpected to occur, any net cumulative gains or losses previously reported in the statement ofcomprehensive income is recognized immediately in the consolidated statement of income.Hedges of a net investment in a foreign operation, including a hedge of a monetary item that isaccounted for as part of the net investment, shall be accounted for similar to cash flow hedges.

- 37 -
*SGVFS033016*
Other Derivative Instruments not Accounted for as Hedges. Certain freestanding derivativeinstruments that provide economic hedges under the Group’s policies either do not qualify forhedge accounting or are not designated as accounting hedges. Changes in the fair values ofderivative instruments not designated as hedges are recognized immediately in the consolidatedstatement of income. Derivatives are carried as assets when the fair value is positive and asliabilities when the fair value is negative. For bifurcated embedded derivatives in financial andnon-financial contracts that are not designated or do not qualify as hedges, changes in the fairvalue of such transactions are recognized in the consolidated statement of income.
Embedded DerivativesAn embedded derivative is separated from the host contract and accounted for as a derivative if allof the following conditions are met: a) the economic characteristics and risks of the embeddedderivative are not closely related to the economic characteristics and risks of the host contract;b) a separate instrument with the same terms as the embedded derivative would meet the definitionof a derivative; and c) the hybrid or combined instrument is not recognized at FVTPL.
Subsequent re-assessment is prohibited unless there is a change in the terms of the contract thatsignificantly modifies the cash flows that otherwise would be required under the contract, in whichcase re-assessment is required. The Group determines whether a modification to cash flows issignificant by considering the extent to which the expected future cash flows associated with theembedded derivative, the host contract or both have changed and whether the change is significantrelative to the previously expected cash flow on the contract.
Loans and Receivables. Loans and receivables are non-derivative financial assets with fixed ordeterminable payments that are not quoted in an active market. After initial measurement, loansand receivables are subsequently carried at amortized cost using the effective interest rate (EIR)method less any allowance for impairment. Amortized cost is calculated by taking into accountany discount or premium on acquisition and includes fees that are integral part of the EIR andtransaction costs. Gains and losses are recognized in the consolidated statement of income whenthe loans and receivables are derecognized or impaired, as well as through the amortizationprocess. Loans and receivables are included in current assets if maturity is within 12 months fromthe balance sheet date otherwise; these are classified as noncurrent assets.
This category includes cash and cash equivalents and receivables (see Notes 11 and 12).
HTM Investments. HTM investments are quoted non-derivative financial assets with fixed ordeterminable payments and fixed maturities and which the Group has the positive intention andability to hold to maturity. After initial measurement, HTM investments are measured atamortized cost. This cost is computed as the amount initially recognized minus principalrepayments, plus or minus the cumulative amortization using the EIR method of any differencebetween the initially recognized amount and the maturity amount, less allowance for impairment.This calculation includes all fees and points paid or received between parties to the contract thatare an integral part of the effective interest rate, transaction costs and all other premiums anddiscounts. Gains and losses are recognized in the consolidated statement of income when theinvestments are derecognized or impaired, as well as through the amortization process. Assetsunder this category are classified as current assets if maturity is within 12 months from the balancesheet date otherwise these are classified as noncurrent assets.
The Group had no HTM investments.
AFS Investments. AFS investments are non-derivative financial assets that are designated as AFSor are not classified in any of the three preceding categories. They are purchased and heldindefinitely, and may be sold in response to liquidity requirements or changes in market

- 38 -
*SGVFS033016*
conditions. After initial measurement, AFS investments are measured at fair value with unrealizedgains or losses being recognized directly in other comprehensive income (OCI). When theinvestment is disposed of or is determined to be impaired, the cumulative gain or loss previouslyrecorded in the consolidated statement of comprehensive income is recognized in the consolidatedstatement of income. Interest earned on the investments is reported as interest income using theEIR method. Dividends earned on investments are recognized in the consolidated statement ofincome when the right of payment has been established. AFS investments are classified asnoncurrent assets unless the intention is to dispose such assets within 12 months from balancesheet date.
The fair value of investments that are actively traded in organized financial markets is determinedby reference to quoted market bid prices at the close of business on balance sheet date. Whencurrent prices are not available, the price of the most recent transaction provides evidence of thecurrent fair value as long as there has not been a significant change in economic circumstancessince the time of the transaction.
For investments where there is no active market, except investments in unquoted equity securities,fair value is determined using valuation techniques. Such techniques include using recentarm’s-length market transactions; reference to the current market value of another instrumentwhich is substantially the same; net present value techniques and other relevant valuation models.Investments in unquoted equity securities are carried at cost, net of accumulated impairmentlosses.
As of December 31, 2016 and 2017, AFS investments consist of the Group’s investments inquoted and unquoted equity shares (see Note 9).
Other Financial Liabilities (including Interest-bearing Loans and Borrowings)Other financial liabilities are initially recognized at the fair value of the consideration received lessdirectly attributable transaction costs. Financial liabilities are classified under this category if theyare not held for trading or not designated as FVTPL upon the inception of the liability.
After initial recognition, other financial liabilities are subsequently measured at amortized costusing the effective interest method. Amortized cost is calculated by taking into account any issuecosts, and any discount or premium on settlement.
Gains and losses are recognized in the consolidated statement of income when the liabilities arederecognized as well as through the amortization process.
The Group’s loans payable, accounts payable and other current liabilities, other noncurrentliabilities, concession rights payable and long-term debt are included under this classification.
Impairment of Financial AssetsThe Group assesses at each balance sheet date whether a financial asset or group of financialassets is impaired.
An impairment exists if one or more events that has occurred since the initial recognition of theasset (an incurred “loss event”), has an impact on the estimated future cash flows of the financialasset or the group of financial assets that can be reliably estimated. Evidence of impairment mayinclude indications that the debtors or a group of debtors is experiencing significant financialdifficulty, default or delinquency in interest or principal payments, the probability that they willenter bankruptcy or other financial reorganization and observable data indicating that there is a
- 39 -
*SGVFS033016*
measurable decrease in the estimated future cash flows, such as changes in arrears or economicconditions that correlate with defaults.
Assets Carried at Amortized Cost. If there is an objective evidence that an impairment loss onloans and receivables carried at amortized cost has been incurred, the amount of the loss ismeasured as the difference between the asset’s carrying amount and the present value of estimatedfuture cash flows (excluding future credit losses that have not been incurred) discounted at thefinancial asset’s original effective interest rate (i.e., the EIR computed at initial recognition). Thecarrying amount of the asset shall be reduced either directly or through use of an allowanceaccount. The amount of the loss shall be recognized in the consolidated statement of income.Receivables, together with the associated allowance accounts, are written off when there is norealistic prospect of future recovery.
The Group first assesses whether an objective evidence of impairment exists individually forfinancial assets that are individually significant, and individually or collectively for financialassets that are not individually significant. If it is determined that no objective evidence ofimpairment exists for an individually assessed financial asset, whether significant or not, the assetis included in the group of financial assets with similar credit risk characteristics and the group offinancial assets is collectively assessed for impairment. Assets that are individually assessed forimpairment and for which an impairment loss is or continues to be recognized are not included inthe collective assessment of impairment. The Group considers factors such as the age of thereceivable, payment status and collection experience in determining individually impairedfinancial assets. For the purpose of a collective evaluation of impairment, financial assets aregrouped on the basis of such credit risk characteristics as customer type, location and past duestatus.
If, in a subsequent period, the amount of the impairment loss decreases and the decrease can berelated objectively to an event occurring after the impairment was recognized, the previouslyrecognized impairment loss is reversed. Any subsequent reversal of an impairment loss isrecognized in the consolidated statement of income, to the extent that the carrying value of theasset does not exceed its amortized cost at the reversal date.
AFS Investments - Carried at Fair Value. If an AFS investment is impaired, an amountcomprising the difference between its cost (net of any principal payment and amortization) and itscurrent fair value, less any impairment loss previously recognized in the consolidated statement ofincome, is transferred from other comprehensive income to the consolidated statement of income.
An AFS investment is considered impaired if there is prolonged or significant decline in marketvalue against cost. “Significant” is to be evaluated against the original cost of the investment and“prolonged” against the period in which the fair value has been below its original cost.
AFS Investment - Carried at Cost. If there is an objective evidence that an impairment loss on anunquoted equity instrument that is not carried at fair value because its fair value cannot be reliablymeasured, or on a derivative asset that is linked to and must be settled by delivery of such anunquoted equity instrument, has been incurred, the amount of the loss is measured as thedifference between the asset’s carrying amount and the present value of the estimated future cashflows discounted at the current market rate of return for a similar financial asset.
Reversals of impairment losses in respect of equity instruments classified as AFS are notrecognized in the consolidated statement of income, increases in their fair value after impairmentare recognized directly in other comprehensive income. Reversals of impairment losses on debtinstruments are reversed through the consolidated statement of income; if the increase in fair value

- 40 -
*SGVFS033016*
of the instrument can be objectively related to an event occurring after the impairment loss wasrecognized in the consolidated statement of income.
Derecognition of Financial Assets and LiabilitiesFinancial Assets. A financial asset (or, where applicable, a part of a financial asset or part of agroup of similar financial assets) is derecognized when:
ƒ the rights to receive cash flows from the asset have expired; or
ƒ the Group has transferred its rights to receive cash flows from the asset or has assumed anobligation to pay the received cash flows in full without material delay to a third party under a“pass-through” arrangement; and either: a) has transferred substantially all the risks andrewards of ownership of the asset; or b) has neither transferred nor retained substantially allthe risks and rewards of ownership of the asset, but has transferred control of the asset.
When the Group has transferred its rights to receive cash flows from an asset or has entered into apass-through agreement, and has neither transferred nor retained substantially all the risks andrewards of ownership of the asset nor transferred control of the asset, the asset is recognized to theextent of the Group’s continuing involvement in the asset. In that case, the Group also recognizesan associated liability. The transferred asset and the associated liability are measured on a basisthat reflects the rights and obligations that the Group has retained.
Continuing involvement that takes the form of a guarantee over the transferred asset is measuredat the lower of the original carrying amount of the asset and the maximum amount ofconsideration that the Group could be required to repay.
Financial Liabilities. A financial liability is derecognized when the obligation under the liabilityis discharged or cancelled or has expired.
Where an existing financial liability is replaced by another from the same lender on substantiallydifferent terms, or the terms of an existing liability are substantially modified, such an exchange ormodification is treated as a derecognition of the original liability and the recognition of a newliability, and the difference in the respective carrying amount of a financial liability (or part of afinancial liability) extinguished or transferred to another party and the consideration paid,including any non-cash assets transferred or liabilities assumed, is recognized in the consolidatedstatement of income. Otherwise, where the net present value of the cash flows under the newterms discounted using the effective interest rate of the original debt is less than 10 percentdifferent from the discounted present value of the remaining cash flows of the original debtinstrument, the financial liability is not derecognized.
Day 1 DifferenceWhere the transaction price in a non-active market is different from the fair value of otherobservable current market transactions in the same instrument or based on a valuation techniquewhose variables include only data from observable market, the Group recognizes the differencebetween the transaction price and fair value (a Day 1 difference) in the consolidated statement ofincome unless it qualifies for recognition as some other type of asset. In case where data used arenot observable, the difference between the transaction price and model value is recognized in theconsolidated statement of income when the inputs become observable or when the instrument isderecognized. For each transaction, the Group determines the appropriate method of recognizingthe Day 1 difference.

- 41 -
*SGVFS033016*
Offsetting Financial InstrumentsFinancial assets and financial liabilities are offset and the net amount reported in the consolidatedbalance sheet if, and only if, there is a currently enforceable legal right to set off the recognizedamounts and there is an intention to settle on a net basis, or to realize the asset and settle theliability simultaneously. The Group has currently enforceable right when if the right is notcontingent on a future event, and is legally enforceable in the normal course of business, event ofdefault, and event of insolvency or bankruptcy of the Group and all of the counterparties.
Classification of Financial Instruments Between Debt and EquityA financial instrument is classified as debt, if it provides for a contractual obligation to:
∂ deliver cash or another financial asset to another entity; or∂ exchange financial assets or financial liabilities with another entity under conditions that are
potentially unfavorable to the Group; or∂ satisfy the obligation other than by the exchange of a fixed amount of cash or another financial
asset for a fixed number of own equity shares.
If the Group does not have an unconditional right to avoid delivering cash or another financialasset to settle its contractual obligation, the obligation meets the definition of a financial liability.
The components of issued financial instruments that contain both liability and equity elements areaccounted for separately, with the equity component being assigned the residual amount, afterdeducting from the instrument as a whole the amount separately determined as the fair value of theliability component on the date of issue.
Cash and Cash EquivalentsCash includes cash on hand and in banks. Cash equivalents are short-term, highly liquidinvestments that are readily convertible to known amounts of cash with original maturities of threemonths or less and that are subject to an insignificant risk of change in value.
Cash does not include restricted cash, which is classified in the consolidated balance sheet eitheras a current or noncurrent asset depending on the relationship to the asset for which the funds arerestricted. If cash is restricted for investments, the restricted portion is classified as noncurrent.
Spare Parts and SuppliesSpare parts and supplies inventories are valued at the lower of cost and net realizable value. Netrealizable value is the current replacement cost.
Cost is determined by using the first-in, first-out method. If the cost of spare parts and suppliesinventories exceeds its net realizable value, write-downs are made for the differences between thecost and the net realizable value.
PrepaymentsPrepayments are expenses paid in advance and recorded as asset before they are utilized. Thisaccount comprises the following:
Input Tax. Input tax is recognized when an entity in the Group purchases goods or services from aValue Added Tax (VAT)-registered supplier or vendor. This account is offset, on a per entitybasis, against any output tax previously recognized.
Prepaid Port Fees, Insurance, Bonds and Other Expenses, and Advance Rent and Deposits.Prepaid insurance, port fees, bonds and other expenses, and advance rent and non-refundabledeposits are apportioned over the period covered by the payment and charged to the appropriateaccount in the consolidated statement of income when incurred.

- 42 -
*SGVFS033016*
Creditable Withholding Tax. Creditable withholding tax is deducted from income tax payable onthe same year the revenue was recognized.
Tax Credits. Tax credits granted and tax credit certificates are issued by tax authorities in lieu oftax refunds, which can be used to offset against future tax liabilities and customs duties. In somejurisdictions, tax credit certificates can be sold or exchanged for cash and cash equivalents.
Advances to Suppliers and Contractors. Advances to suppliers and contractors are reclassified tothe proper asset or expense account and deducted from the contractors’ billings as specified in theprovisions of the contract.
Prepayments that are expected to be realized within 12 months from the balance sheet date areclassified as current assets. Otherwise, these are classified as noncurrent assets.
Capital Stock and Additional Paid-in CapitalCapital stock is measured at par value for all shares issued. When the Parent Company issuesmore than one class of stock, a separate account is maintained for each class of stock and thenumber of shares issued.
When the shares are sold at a premium, the difference between the proceeds and the par value iscredited to “Additional paid-in capital” account. When shares are issued for a consideration otherthan cash, the proceeds are measured by the fair value of the consideration received. In case theshares are issued to extinguish or settle the liability of the Parent Company, the shares shall bemeasured either at the fair value of the shares issued or fair value of the liability settled, whicheveris more reliably determinable.
Direct costs incurred related to equity issuance, such as underwriting, accounting and legal fees,printing costs and taxes are chargeable to “Additional paid-in capital” account. If additionalpaid-in capital is not sufficient, the excess is charged against the retained earnings.
Cost of Shares Held by SubsidiariesOwn equity instruments which are held by subsidiaries are treated as treasury shares andrecognized and deducted from equity at cost. No gain or loss is recognized in the consolidatedstatement of income on the purchase, sale, issue or cancellation of the Group’s own equityinstruments. Any difference between the carrying amount and the consideration is recognized asadditional paid-in capital.
Treasury SharesOwn equity instruments which are reacquired (treasury shares) are recognized at cost anddeducted from equity. No gain or loss is recognized in the consolidated statement of income onthe purchase, sale, issue or cancellation of the Parent Company’s own equity instruments. Anydifference between the carrying amount and the consideration, if reissued, is recognized asadditional paid-in capital. Voting rights related to treasury shares are nullified for the ParentCompany and no dividends are allocated to them respectively. Shares vested during the reportingperiod are satisfied with treasury shares.
Retained EarningsRetained earnings are the result of Group’s accumulated profits or losses, declaration of dividendsand the effects of retrospective application or retrospective restatement recognized in accordancewith PAS 8, Accounting Policies, Changes in Accounting Estimates and Errors.

- 43 -
*SGVFS033016*
Foreign Currency TransactionsTransactions in foreign currencies are initially recorded by each entity at its functional currencyruling at the date the transaction first qualifies for recognition. Monetary assets and liabilitiesdenominated in foreign currencies are retranslated at the entity’s functional currency rate ofexchange at the balance sheet date. All foreign currency differences are taken to the consolidatedstatement of income except exchange differences on foreign currency borrowings that provide ahedge against a net investment in a foreign operation. These foreign currency borrowings includelong-term receivables or loans to a foreign operation denominated in either the functional currencyof the parent or of the foreign operations. Related exchange differences arising from netinvestment in foreign operations are taken directly to equity until the disposal of the netinvestment, at which time they are recognized in the consolidated statement of income. Taxcharges and credits attributable to exchange differences on those borrowings are also dealt with inequity.
Nonmonetary items that are measured in terms of historical cost in a foreign currency aretranslated using the exchange rates as at the dates of the initial transactions. Nonmonetary itemsmeasured at fair value in a foreign currency are translated using the exchange rates at the datewhen the fair value was determined.
Any goodwill arising from the acquisition of a foreign operation and any fair value adjustmentsmade to the carrying amounts of assets and liabilities arising from the acquisition are treated asassets and liabilities of the foreign operations and translated at the closing exchange rate at thebalance sheet date.
Year-End Exchange RatesThe following rates of exchange have been adopted by the Group in translating foreign currencybalance sheet and statement of income items as at and for the years ended December 31:
2016 2017 2018Closing Average Closing Average Closing Average
Foreign currency to 1 unit ofUS dollar (USD or US$):
Argentine peso (AR$) 15.880 14.779 18.623 16.562 37.668 28.102 Australian dollar (AUD) 1.387 1.344 1.281 1.304 1.419 1.338 Brazilian real (BRL or R$) 3.255 3.481 3.313 3.193 3.881 3.657 Brunei dollar (BND or B$) 1.448 1.381 1.338 1.381 1.371 1.344 Chinese renminbi (RMB) 6.945 6.648 6.507 6.756 6.879 6.620 Colombian peso (COP) 3,002.000 3,051.900 2,985.780 2,952.400 3,254.250 2,955.553 Croatian kuna (HRK) 7.177 6.807 6.192 6.621 6.463 6.289 Euro (EUR or €) 0.951 0.903 0.833 0.885 0.872 0.847 Georgian lari (GEL) 2.658 2.366 2.596 2.508 2.675 2.535 Honduran lempira (HNL) 23.492 22.835 23.588 23.485 24.339 23.906 Hong Kong dollar (HKD) 7.756 7.763 7.814 7.792 7.832 7.838 Indian rupee (INR) 67.924 67.206 63.873 65.125 69.768 68.379 Indonesian rupiah (IDR or Rp) 13,473.000 13,305.000 13,555.000 13,382.000 14,390.000 14,243.000 Iraqi dinar (IQD) 1,197.155 1,194.412 1,176.526 1,186.463 1,192.682 1,188.468 Malagasy ariary (MGA) 3,364.500 3,181.032 3,242.950 3,137.360 3,496.770 3,349.826 Mexican peso (MXN) 20.727 18.689 19.659 18.920 19.650 19.233 Pakistani rupee (PKR or Rs) 104.370 104.715 110.700 105.347 139.800 121.785
Papua New Guinean kina(PGK) – – 3.218 3.187 3.369 3.292
Philippine peso (P=) 49.720 47.475 49.930 50.400 52.580 52.676 Polish zloty (PLN) 4.187 3.944 3.484 3.777 3.737 3.613 Singaporean dollar (SGD) 1.447 1.381 1.336 1.381 1.363 1.349 South African rand (ZAR) 13.740 14.694 12.383 13.310 14.347 13.253

- 44 -
*SGVFS033016*
In 2018, Argentina’s economy has been considered as hyperinflationary. Accordingly, companiesin Argentina whose functional currency is AR$ are required to apply PAS 29, Financial Reportingin Hyperinflationary Economies. As of December 31, 2018, the functional currency of Tecplataremains to be US$.
Determination of and Change in Functional CurrencyFunctional currency is the currency of the primary economic environment in which the entityoperates, which is normally the one in which it primarily generates and expends cash. The Groupconsiders the following factors in determining its functional currency:
a) the currency:a. that mainly influences sales prices for goods and services (this will often be the currency
in which sales prices for its goods and services are denominated and settled); andb. of the country whose competitive forces and regulations mainly determine the sales prices
of its goods and services.b) the currency that mainly influences labor, material and other costs of providing goods or
services (this will often be the currency in which such costs are denominated and settled).
When there is a change in an entity’s functional currency, the entity should apply the translationprocedures applicable to the new functional currency prospectively from the date of change. Anentity translates all items into the new functional currency using the exchange rate at the date ofthe change. The resulting translated amounts for nonmonetary items are treated as their historicalcost. Exchange differences arising from the translation at the date of change are recognized ascumulative translation adjustment reported under the consolidated statement of comprehensiveincome and presented in the equity section of the consolidated balance sheet. Exchangedifferences arising from translation of a foreign operation recognized in other comprehensiveincome are not reclassified from equity to the consolidated statement of income until the disposalof the foreign operation.
The comparative financial statements shall be presented into the new presentation currency inaccordance with the translation procedures described in PAS 21, The Effects of Changes inForeign Exchange Rates, as follows:
a. all assets and liabilities at the exchange rates prevailing at the balance sheet date;b. equity items at historical exchange rates;c. revenue and expense items at the approximate exchange rates prevailing at the time of
transactions; andd. all resulting exchange differences are recognized in cumulative translation adjustments
account, presented as part of the consolidated statement of comprehensive income.
Concession Rights PayableConcession rights payable is recognized at the date of inception as the present value of the fixedportion of port fees or rental fees to the port authorities if the arrangement qualifies underIFRIC 12, Service Concession Arrangements, or IFRIC 4, Determining whether an Agreementcontains a Lease, as a finance lease, respectively. This account is debited upon payment of portfees or rental fees to the port authorities. Such payments are apportioned between interestpayment and payment of the principal. Interest arising from the accretion of concession rightspayable is presented under “Interest expense on concession rights payable” account in theconsolidated statement of income.
Concession rights payable that are expected to be settled for no more than 12 months after thereporting period are classified as current liabilities presented as Current portion of concessionrights payable. Otherwise, these are classified as noncurrent liabilities.
- 45 -
*SGVFS033016*
Accounts Payable and Other Current LiabilitiesAccounts payable is part of the working capital used in the normal operating cycle of the Group.Other current liabilities are not settled as part of the Group’s normal operating cycle but are duefor settlement within 12 months after the balance sheet date. Accounts payable and other currentliabilities are recognized in the period when incurred. This account classification includes thefollowing:
Trade Payable. Trade payable represents payable to port authorities other than concession rightspertaining to upfront fees payable in installments and fixed fees, such as accrual of variableportion of port fees and those payable to suppliers and vendors of goods and services.
Accrued Expenses. Accrued expenses are comprised of accruals relating to interest, salaries andbenefits, and output and other taxes, among others.
Provisions for Claims and Losses. Provisions for claims and losses pertain to estimated probablelosses on cargo, labor-related and other claims from third parties. Provision for losses not settledat the balance sheet date is re-assessed and adjusted, if necessary.
Customers’ Deposits. Customers’ deposits represent advance payment of customers subject torefund or for future billing applications.
LeasesThe determination of whether an arrangement is, or contains, a lease is based on the substance ofthe arrangement at inception date, of whether the fulfillment of the arrangement is dependent onthe use of a specific asset or assets or the arrangement conveys a right to use the asset or assets,even if that right is not explicitly specified in an arrangement.
A re-assessment is made after inception of the lease only if one of the following applies:a. There is a change in contractual terms, other than a renewal or extension of the arrangement;
b. A renewal option is exercised or extension granted, unless the term of the renewal orextension was initially included in the lease term;
c. There is a change in the determination of whether fulfillment is dependent on a specifiedasset; or
d. There is substantial change in the asset.
Where a re-assessment is made, lease accounting shall commence or cease from the date when thechange in circumstances gives rise to the re-assessment for scenarios a, c, or d, and at the date ofrenewal or extension period for scenario b.
Group as Lessee. Finance leases which transfer to the Group substantially all the risks andbenefits incidental to ownership of the leased item, are capitalized at the commencement of thelease at the fair value of the leased property or, if lower, at the present value of the minimum leasepayments. Lease payments are apportioned between the finance charges and reduction of the leaseliability so as to achieve a constant rate of interest on the remaining balance of the liability.Finance charges are reflected in the consolidated statement of income.
A leased asset is depreciated over the useful life of the asset. However, if there is no reasonablecertainty that the Group will obtain ownership by the end of the lease term, the asset is depreciatedover the shorter of the estimated useful life of the asset and the lease term.
Operating lease payments are recognized as an operating expense in the consolidated statement ofincome on a straight-line basis over the lease term.

- 46 -
*SGVFS033016*
Group as Lessor. Leases where the Group does not transfer substantially all the risks and benefitsof ownership of the asset are classified as operating leases. Initial direct costs incurred innegotiating an operating lease are added to the carrying amount of the leased asset and recognizedover the lease term on the same bases as rental income. Contingent rents are recognized asrevenue in the period in which they are earned.
Pension BenefitsDefined Benefit Plans. The Parent Company, BCT, BIPI, DIPSSCOR, SBITC, ROHQ, MTS, IJP,OJA, SCIPSI, MICTSL, MICTSI, AGCT, CGSA, CMSA, CMSA Servicios Portuarios SA DeCV, CMSA Servicios Profesionales Y De Especialistas SA De CV, ICTSI Iraq and APBS haveseparate, noncontributory, defined benefit retirement plans covering substantially all of its regularemployees. The pension plans of the Parent Company, BIPI, DIPSSCOR, SBITC and SCIPSI arefunded.
The cost of providing benefits under the defined benefit plans is determined separately for eachplan using the projected unit credit actuarial valuation method. Projected unit credit methodreflects services rendered by employees to the date of valuation and incorporates assumptionsconcerning employees’ projected salaries.
Defined benefit costs comprise service cost, net interest on the net defined benefit liability or assetand remeasurements of net defined benefit liability or asset.
Service costs which include current service costs, past service costs and gains or losses on non-routine settlements are recognized as expense in profit or loss. Past service costs are recognizedwhen plan amendment or curtailment occurs. These amounts are calculated periodically byindependent qualified actuaries.
Net interest on the net defined benefit liability or asset is the change during the period in the netdefined benefit liability or asset that arises from the passage of time which is determined byapplying the discount rate based on government bonds to the net defined benefit liability or asset.Net interest on the net defined benefit liability or asset is recognized as expense or income inprofit or loss.
Remeasurements comprising actuarial gains and losses, difference between the return on planassets and interest income and any change in the effect of the asset ceiling (excluding net intereston defined benefit liability) are recognized immediately in other comprehensive income in theperiod in which they arise. Remeasurements are not reclassified to profit or loss in subsequentperiods.
Plan assets are assets that are held by a long-term employee benefit fund or qualifying insurancepolicies. Plan assets are not available to the creditors of the Group, nor can they be paid directly tothe Group. Fair value of plan assets is based on market price information. When no market priceis available, the fair value of plan assets is estimated by discounting expected future cash flowsusing a discount rate that reflects both the risk associated with the plan assets and the maturity orexpected disposal date of those assets (or, if they have no maturity, the expected period until thesettlement of the related obligations). If the fair value of the plan assets is higher than the presentvalue of the defined benefit obligation, the measurement of the resulting defined benefit asset islimited to the present value of economic benefits available in the form of refunds from the plan orreductions in future contributions to the plan.
Defined Contribution Plan. YICT, ICTSI Oregon and PICT have defined contribution plans undera state pension scheme. Contributions under the plan are recorded as expense in the consolidatedstatement of income. There are no further obligations beyond the contribution.

- 47 -
*SGVFS033016*
Share-based Payment TransactionsCertain qualified officers and employees of the Parent Company and subsidiaries receiveremuneration for their services in the form of equity shares of the Parent Company (“equity-settledtransactions”).
The cost of equity-settled transactions with officers and employees is measured by reference to thefair value of the stock at the date on which these are granted.
The cost of equity-settled transactions is recognized, together with a corresponding increase inequity, over the period in which the performance and/or service conditions are fulfilled, ending onthe date on which the relevant employees become fully entitled to the award (“the vesting date”).
Revenue Recognition (applicable starting January 1, 2018 upon the adoption of PFRS 15)Revenue is recognized to the extent that it is probable that the economic benefits will flow to theGroup and the revenue can be reliably measured, regardless of when payment is being made.Revenue is measured at the fair value of the consideration received or receivable, taking intoaccount contractually defined terms of payment, excluding incentives, output tax, and other salestaxes or duties. The Group assesses its revenue arrangements against specific criteria to determineif it is acting as principal or agent. The Group has concluded that it is acting as principal insubstantially all its revenue arrangements. The following specific recognition criteria must also bemet before revenue is recognized:
Revenue Contract with CustomerGross Revenues from Port Operations. Revenue, net of any incentives, is generally recognizedwhen the services are rendered. The performance obligations are satisfied and payment isgenerally due upon completion and billing of the services. In circumstances wherein thecollection is not certain, the Group makes an assessment of the probability of collecting theconsideration to which it will be entitled in exchange for the services that it performed. Inevaluating whether collectibility of an amount of consideration is probable, the Group considersthe customer's ability and intention to pay the amount of consideration when it becomes due.
Construction Revenue and Cost. When the Group provides construction or upgrade services onconcession arrangements accounted for within the scope of IFRIC 12, the consideration ismeasured at the fair value of the construction services provided.
Revenue Recognition (applicable until December 31, 2017 prior to the adoption of PFRS 15)Gross Revenues from Port Operations. Revenue is generally recognized when services arerendered.
Interest Income. Revenue is recognized as the interest accrues taking into account the effectiveyield of the asset.
Dividend Income. Revenue is recognized when the Group’s right to receive the payment isestablished, which is generally when the Board approve the dividend, and is included as part of“Other income” account in the consolidated statement income.
Rental Income. Rental income arising from operating leases on investment properties is accountedfor on a straight-line basis over the lease terms and is included as part of “Other income” accountin the consolidated statement of income.
Construction Revenue and Cost. When the Group provides construction or upgrade services onconcession arrangements accounted for within the scope of IFRIC 12, the consideration ismeasured at the fair value of the construction services provided. The Group recognizes revenue

- 48 -
*SGVFS033016*
and cost relating to construction or upgrade services by reference to the stage of completion of thecontract in accordance with PAS 11.
Government GrantsGovernment grants are recognized where there is reasonable assurance that the grant will bereceived and all attached conditions will be complied with. When the grant relates to an expenseitem, it is initially recognized as a liability in the consolidated balance sheet and recognized asincome on a systematic basis over the periods that the related costs, for which it is intended tocompensate, are expensed. When the grant relates to the acquisition or construction of a fixedasset, it is initially recognized as a liability in the consolidated balance sheet and recognized asincome in equal amounts over the period of depreciation of the related asset.
ExpensesExpenses are recognized as incurred. Expenses constitute the following:
Port Authorities’ Share in Gross Revenues. Port authorities’ share in gross revenues includesvariable fees paid to port authorities as stipulated in the concession agreements.
Manpower Costs. Manpower costs include remunerations and benefits provided by the Group toits officers and employees such as salaries, wages, allowances, and bonuses, among others.
Equipment and Facilities-related Expenses. Equipment and facilities-related expenses includefixed fees paid to port authorities as stipulated in the concession agreements that qualify as leasesunder IFRIC 4 and expenses incurred for general repairs and maintenance of the Group’s portfacilities and other equipment such as consumption of fuel, oil and lubricants, contracted services,power, light and water, and technology and systems development expenses.
Administrative and Other Operating Expenses. Administrative and other operating expensesnormally include costs of administering the business as incurred by administrative and corporatedepartments such as professional fees, transportation and travel, taxes and licenses, security andjanitorial services, insurance and bonds, representation, utilities and general office expenses. Thisaccount also includes costs of business development offices in relation to the acquisition of newterminals or projects under exploratory stage.
TaxesCurrent Tax. Income tax assets and liabilities for the current period are measured at the amountexpected to be recovered from or paid to the taxation authorities. The tax rates and tax laws usedto compute the amount are those that are enacted or substantively enacted at the balance sheet datein the countries where the Group operates and generates taxable income.
Current tax relating to items recognized directly in equity is recognized in equity and not in theconsolidated statement of income. Management periodically evaluates positions taken in the taxreturns with respect to situations in which applicable tax regulations are subject to interpretationand establishes provisions where appropriate.
Deferred Tax. Deferred tax is provided using the liability method on temporary differences at thebalance sheet date between the tax bases of assets and liabilities and their carrying amounts forfinancial reporting purposes.
Deferred tax liabilities are recognized for all taxable temporary differences, except:
ƒ where the deferred tax liability arises from the initial recognition of goodwill or of an asset orliability in a transaction that is not a business combination and, at the time of the transaction,affects neither the accounting income nor taxable income or loss; and

- 49 -
*SGVFS033016*
ƒ in respect of taxable temporary differences associated with investments in subsidiaries,associates and in joint ventures, when the timing of the reversal of the temporary differencescan be controlled and it is probable that the temporary differences will not reverse in theforeseeable future.
Deferred tax assets are recognized for all deductible temporary differences and carryforwardbenefits of unused tax credits and unused tax losses or NOLCO, to the extent that it is probablethat sufficient future taxable income will be available against which the deductible temporarydifferences, and the carryforward benefits of unused tax credits and NOLCO can be utilizedexcept:
ƒ where the deferred tax asset relating to the deductible temporary difference arises from theinitial recognition of an asset or liability in a transaction that is not a business combinationand, at the time of the transaction, affects neither the accounting income nor taxable income orloss; and
ƒ in respect of deductible temporary differences associated with investments in subsidiaries,associates and in joint ventures, deferred tax assets are recognized only to the extent that it isprobable that the temporary differences will reverse in the foreseeable future and taxableincome will be available against which the temporary differences can be utilized.
The carrying amount of deferred tax assets is reviewed at each balance sheet date and reduced tothe extent that it is no longer probable that sufficient taxable profit will be available to allow all orpart of the deferred tax asset to be utilized. Unrecognized deferred tax assets are re-assessed ateach balance sheet date and are recognized to the extent that it has become probable that futuretaxable income will allow the deferred tax asset to be recovered.
Deferred tax assets and liabilities are measured at the tax rates that are expected to apply in theyear when the asset is realized or the liability is settled, based on tax rates and tax laws that havebeen enacted or substantively enacted at the balance sheet date.
Deferred tax relating to items recognized outside the consolidated statement of income isrecognized outside of the consolidated statement of income. Deferred tax items are recognized incorrelation to the underlying transaction either in other comprehensive income or directly inequity.
Deferred tax assets and deferred tax liabilities are offset, if a legally enforceable right exists to setoff current income tax assets against current income tax liabilities and the deferred taxes relate tothe same taxable entity and the same taxation authority.
Tax benefits acquired as part of business combination, but not satisfying the criteria for separaterecognition at that date, are recognized subsequently if new information about facts andcircumstances change. The adjustment is treated as a reduction to goodwill (as long as it does notexceed goodwill) if it was incurred during the measurement period; otherwise, these shall berecognized in profit or loss.
Project Development CostsProject development costs that do not qualify for capitalization as port infrastructure recognized asconcession rights or property and equipment are expensed as incurred.
Preoperating ExpensesPreoperating expenses are expensed as incurred.

- 50 -
*SGVFS033016*
Earnings Per ShareBasic earnings per common share is computed by dividing the net income attributable to equityholders of the parent, adjusted by the effect of cumulative distributions on subordinated perpetualcapital securities classified as equity in accordance with PAS 32, Financial Instruments:Presentation, by the weighted average number of common shares outstanding during each yearafter giving retroactive effect to stock dividends declared during the year.
Diluted earnings per common share is computed in the same manner, adjusted for the effect of theshares issuable to qualified officers and employees under the Parent Company’s stock incentiveplan which are assumed to be exercised at the date of grant.
Where the effect of the vesting of stock under the stock incentive plan is anti-dilutive, basic anddiluted earnings per share are stated at the same amount.
Geographical SegmentsThe Group operates principally in one industry segment which is cargo handling and relatedservices. The Group’s operating business is organized and managed separately according tolocation, namely Asia, Europe, the Middle East and Africa (EMEA), and Americas. Financialinformation on geographical segments is presented in Note 4 to the consolidated financialstatements.
ProvisionsGeneral. Provisions are recognized when the Group has a present obligation (legal orconstructive) as a result of a past event, it is probable that an outflow of resources embodyingeconomic benefits will be required to settle the obligation and a reliable estimate can be made ofthe amount of the obligation. Where the Group expects some or all of a provision to bereimbursed, for example under an insurance contract, the reimbursement is recognized as aseparate asset but only when the reimbursement is virtually certain. The expense relating to anyprovision is presented in the consolidated statement of income, net of any reimbursement. If theeffect of the time value of money is material, provisions are discounted using a current pre-tax ratethat reflects, where appropriate, the risks specific to the liability. Where discounting is used, theincrease in the provision due to the passage of time is recognized as a borrowing cost.
Contingent Liabilities Recognized in a Business Combination. A contingent liability recognized ina business combination is initially measured at its fair value. Subsequently, it is measured at thehigher of the amount that would be recognized in accordance with the requirements for provisionsabove or the amount initially recognized less, when appropriate, cumulative amortizationrecognized in accordance with the requirements for revenue recognition.
ContingenciesContingent assets and liabilities are not recognized in the consolidated financial statements.Contingent assets are disclosed in the notes to consolidated financial statements when an inflow ofeconomic benefits is probable and recognized in the consolidated balance sheet and the relatedincome in the consolidated statement of income when an inflow of economic benefits is virtuallycertain. On the other hand, contingent liabilities are disclosed in the notes to consolidatedfinancial statements unless the possibility of an outflow of resources embodying economicbenefits is remote.
Events after the Balance Sheet DatePost year-end events that provide additional information about the Group’s position at the balancesheet date (adjusting events) are reflected in the consolidated financial statements. Post year-endevents that are not adjusting events are disclosed in the notes to consolidated financial statementswhen material.
- 51 -
*SGVFS033016*
3.4 Future Changes in Accounting Policies
Pronouncements Issued but Not yet EffectivePronouncements issued but not yet effective as at December 31, 2018 are listed below. The Groupintends to adopt the following pronouncements when they become effective.
Deferredƒ Amendments to PFRS 10, Consolidated Financial Statements, and PAS 28, Sale or
Contribution of Assets between an Investor and its Associate or Joint VentureOn January 13, 2016, the FSRC deferred the original effective date of January 1, 2016 of thesaid amendments until the International Accounting Standards Board (IASB) completes itsbroader review of the research project on equity accounting that may result in thesimplification of accounting for such transactions and of other aspects of accounting forassociates and joint ventures.
The amendments address the conflict between PFRS 10 and PAS 28 in dealing with the loss ofcontrol of a subsidiary that is sold or contributed to an associate or joint venture. Theamendments clarify that a full gain or loss is recognized when a transfer to an associate orjoint venture involves a business as defined in PFRS 3. Any gain or loss resulting from thesale or contribution of assets that does not constitute a business, however, is recognized onlyto the extent of unrelated investors’ interests in the associate or joint venture.
Effective January 1, 2019ƒ Amendments to PFRS 9, Prepayment Features with Negative Compensation
Under PFRS 9, a debt instrument can be measured at amortized cost or at fair value throughother comprehensive income, provided that the contractual cash flows are ‘solely payments ofprincipal and interest on the principal amount outstanding’ (the SPPI criterion) and theinstrument is held within the appropriate business model for that classification. Theamendments to PFRS 9 clarify that a financial asset passes the SPPI criterion regardless of theevent or circumstance that causes the early termination of the contract and irrespective ofwhich party pays or receives reasonable compensation for the early termination of thecontract. The amendments should be applied retrospectively and are effective fromJanuary 1, 2019, with earlier application permitted. The adoption of these amendments is notexpected to have any significant impact on the consolidated financial statements.
ƒ PFRS 16, LeasesPFRS 16 sets out the principles for the recognition, measurement, presentation and disclosureof leases and requires lessees to account for all leases under a single on-balance sheet modelsimilar to the accounting for finance leases under PAS 17, Leases. The standard includes tworecognition exemptions for lessees – leases of ’low-value’ assets (e.g., personal computers)and short-term leases (i.e., leases with a lease term of 12 months or less). At thecommencement date of a lease, a lessee will recognize a liability to make lease payments(i.e., the lease liability) and an asset representing the right to use the underlying asset duringthe lease term (i.e., the right-of-use asset). Lessees will be required to separately recognize theinterest expense on the lease liability and the depreciation expense on the right-of-use asset.
Lessees will be also required to remeasure the lease liability upon the occurrence of certainevents (e.g., a change in the lease term, a change in future lease payments resulting from achange in an index or rate used to determine those payments). The lessee will generallyrecognize the amount of the remeasurement of the lease liability as an adjustment to the right-of-use asset.

- 52 -
*SGVFS033016*
Lessor accounting under PFRS 16 is substantially unchanged from today’s accounting underPAS 17. Lessors will continue to classify all leases using the same classification principle asin PAS 17 and distinguish between two types of leases: operating and finance leases.
PFRS 16 also requires lessees and lessors to make more extensive disclosures than underPAS 17.
The Group will apply the standard using the full retrospective approach. The new standard’stransition provisions permit certain reliefs. The adoption of the standard will result in lowerequipment and facilities-related expenses, higher amortization expense and interest expense inthe consolidated statements of income and recognition of right-of-use asset and right-of-useliability in the consolidated balance sheets.
ƒ Amendments to PAS 19, Employee Benefits, Plan Amendment, Curtailment or SettlementThe amendments to PAS 19 address the accounting when a plan amendment, curtailment orsettlement occurs during a reporting period. The amendments specify that when a planamendment, curtailment or settlement occurs during the annual reporting period, an entity isrequired to:
o Determine current service cost for the remainder of the period after the plan amendment,curtailment or settlement, using the actuarial assumptions used to remeasure the netdefined benefit liability (asset) reflecting the benefits offered under the plan and the planassets after that event
o Determine net interest for the remainder of the period after the plan amendment,curtailment or settlement using: the net defined benefit liability (asset) reflecting thebenefits offered under the plan and the plan assets after that event; and the discount rateused to remeasure that net defined benefit liability (asset).
The amendments also clarify that an entity first determines any past service cost, or a gain orloss on settlement, without considering the effect of the asset ceiling. This amount isrecognized in profit or loss. An entity then determines the effect of the asset ceiling after theplan amendment, curtailment or settlement. Any change in that effect, excluding amountsincluded in the net interest, is recognized in other comprehensive income.
The amendments apply to plan amendments, curtailments, or settlements occurring on or afterthe beginning of the first annual reporting period that begins on or after January 1, 2019, withearly application permitted. The Group will adopt the amendments as it becomes applicableeffective January 1, 2019.
ƒ Amendments to PAS 28, Long-term Interests in Associates and Joint VenturesThe amendments clarify that an entity applies PFRS 9 to long-term interests in an associate orjoint venture to which the equity method is not applied but that, in substance, form part of thenet investment in the associate or joint venture (long-term interests). This clarification isrelevant because it implies that the expected credit loss model in PFRS 9 applies to suchlong-term interests.
The amendments also clarified that, in applying PFRS 9, an entity does not take account ofany losses of the associate or joint venture, or any impairment losses on the net investment,recognized as adjustments to the net investment in the associate or joint venture that arisefrom applying PAS 28, Investments in Associates and Joint Ventures.

- 53 -
*SGVFS033016*
The amendments should be applied retrospectively and are effective from January 1, 2019,with early application permitted. The Group does not expect that the amendments will have asignificant impact on its consolidated financial statements.
ƒ Philippine Interpretation IFRIC-23, Uncertainty over Income Tax TreatmentsThe interpretation addresses the accounting for income taxes when tax treatments involveuncertainty that affects the application of PAS 12, Income Taxes, and does not apply to taxesor levies outside the scope of PAS 12, nor does it specifically include requirements relating tointerest and penalties associated with uncertain tax treatments.
The interpretation specifically addresses the following:o Whether an entity considers uncertain tax treatments separatelyo The assumptions an entity makes about the examination of tax treatments by taxation
authoritieso How an entity determines taxable profit (tax loss), tax bases, unused tax losses,
unused tax credits and tax rateso How an entity considers changes in facts and circumstances
An entity must determine whether to consider each uncertain tax treatment separately ortogether with one or more other uncertain tax treatments. The approach that better predicts theresolution of the uncertainty should be followed.
The Group is currently assessing the impact of adopting this interpretation.
Annual Improvements to PFRSs 2015-2017 Cycleƒ Amendments to PFRS 3, Business Combinations, and PFRS 11, Joint Arrangements,
Previously Held Interest in a Joint OperationThe amendments clarify that, when an entity obtains control of a business that is a jointoperation, it applies the requirements for a business combination achieved in stages, includingremeasuring previously held interests in the assets and liabilities of the joint operation at fairvalue. In doing so, the acquirer remeasures its entire previously held interest in the jointoperation.
A party that participates in, but does not have joint control of, a joint operation might obtainjoint control of the joint operation in which the activity of the joint operation constitutes abusiness as defined in PFRS 3. The amendments clarify that the previously held interests inthat joint operation are not remeasured.
An entity applies those amendments to business combinations for which the acquisition date ison or after the beginning of the first annual reporting period beginning on or afterJanuary 1, 2019 and to transactions in which it obtains joint control on or after the beginningof the first annual reporting period beginning on or after January 1, 2019, with earlyapplication permitted. These amendments are currently not applicable to the Group but mayapply to future transactions.
- 54 -
*SGVFS033016*
ƒ Amendments to PAS 12, Income Tax Consequences of Payments on Financial InstrumentsClassified as EquityThe amendments clarify that the income tax consequences of dividends are linked moredirectly to past transactions or events that generated distributable profits than to distributionsto owners. Therefore, an entity recognizes the income tax consequences of dividends in profitor loss, other comprehensive income or equity according to where the entity originallyrecognized those past transactions or events.
An entity applies those amendments for annual reporting periods beginning on or afterJanuary 1, 2019, with early application is permitted. These amendments are not relevant to theGroup because dividends declared by the Group do not give rise to tax obligations under thecurrent tax laws.
ƒ Amendments to PAS 23, Borrowing Costs, Borrowing Costs Eligible for CapitalizationThe amendments clarify that an entity treats as part of general borrowings any borrowingoriginally made to develop a qualifying asset when substantially all of the activities necessaryto prepare that asset for its intended use or sale are complete.
An entity applies those amendments to borrowing costs incurred on or after the beginning ofthe annual reporting period in which the entity first applies those amendments. An entityapplies those amendments for annual reporting periods beginning on or after January 1, 2019,with early application permitted.
Since the Group’s current practice is in line with these amendments, the Group does notexpect any effect on its consolidated financial statements upon adoption.
Effective January 1, 2020ƒ Amendments to PFRS 3, Definition of a Business
The amendments to PFRS 3 clarify the minimum requirements to be a business, remove theassessment of a market participant’s ability to replace missing elements, and narrow thedefinition of outputs. The amendments also add guidance to assess whether an acquiredprocess is substantive and add illustrative examples. An optional fair value concentration testis introduced which permits a simplified assessment of whether an acquired set of activitiesand assets is not a business.
An entity applies those amendments prospectively for annual reporting periods beginning onor after January 1, 2020, with earlier application permitted.
These amendments will apply on future business combinations of the Group.
ƒ Amendments to PAS 1, Presentation of Financial Statements, and PAS 8, AccountingPolicies, Changes in Accounting Estimates and Errors, Definition of MaterialThe amendments refine the definition of material in PAS 1 and align the definitions usedacross PFRSs and other pronouncements. They are intended to improve the understanding ofthe existing requirements rather than to significantly impact an entity’s materialityjudgements.
An entity applies those amendments prospectively for annual reporting periods beginning onor after January 1, 2020, with earlier application permitted. The Group does not expect anysignificant impact of adopting these amendments.

- 55 -
*SGVFS033016*
Effective beginning on or after January 1, 2021ƒ PFRS 17, Insurance Contracts
PFRS 17 is a comprehensive new accounting standard for insurance contracts coveringrecognition and measurement, presentation and disclosure. Once effective, PFRS 17 willreplace PFRS 4, Insurance Contracts. This new standard on insurance contracts applies to alltypes of insurance contracts (i.e., life, non-life, direct insurance and re-insurance), regardlessof the type of entities that issue them, as well as to certain guarantees and financialinstruments with discretionary participation features. A few scope exceptions will apply.The overall objective of PFRS 17 is to provide an accounting model for insurance contractsthat is more useful and consistent for insurers. In contrast to the requirements in PFRS 4,which are largely based on grandfathering previous local accounting policies, PFRS 17provides a comprehensive model for insurance contracts, covering all relevant accountingaspects. The core of PFRS 17 is the general model, supplemented by:
o A specific adaptation for contracts with direct participation features (the variable feeapproach)
o A simplified approach (the premium allocation approach) mainly for short-durationcontracts
PFRS 17 is effective for reporting periods beginning on or after January 1, 2021, withcomparative figures required. Early application is permitted.
4. Segment Information
A segment is a distinguishable component of the Group that is engaged either in providing typesof services (business segment) or in providing the services within a particular economicenvironment (geographic segment).
The Group operates principally in one industry segment which is cargo handling and relatedservices. ICTSI has organized its cargo handling and related business into three geographicalsegments:
ƒ Asia - includes Manila International Container Terminal (MICT), BIPI, DIPSSCOR, SCIPSI,SBITC, ICTSI Subic, HIPS, MICTSI, LGICT, CGT and MNHPI in the Philippines; YICT inChina; OJA, IJP and MTS in Indonesia; VICT in Australia; NMCTS in Brunei; PICT inPakistan; MITL and SPICTL in PNG; and AICTL, ICTHI, ICTSI Ltd. and other holdingcompanies and those companies incorporated in The Netherlands for the purpose ofsupporting the funding requirements of the Group;
ƒ EMEA - includes BCT in Poland, BICTL in Georgia, AGCT in Croatia, MICTSL inMadagascar, LICTSLE in Nigeria, IDRC in DR Congo, ICTSI Iraq in Iraq and AGT in Sudan;and
ƒ Americas - includes TSSA in Brazil, CGSA in Ecuador, SPIA in Colombia, Tecplata inArgentina, CMSA and TMT in Mexico, OPC in Honduras and ICTSI Oregon in Oregon,U.S.A.
Management monitors the operating results of each operating unit separately for making decisionsabout resource allocation and performance assessment. The Group evaluates segmentperformance based on contributions to gross revenues, which is measured consistently with grossrevenues from port operations in the consolidated statement of income.

- 56 -
*SGVFS033016*
Financing is managed on a group basis and centralized at the Parent Company level or at theentities created solely for the purpose of obtaining funds for the Group. Funding requirements thatare secured through debt are recognized as liabilities of the Parent Company or of the entityissuing the debt instrument, classified under the geographical region of Asia and are not allocatedto other geographical segments where funds are eventually transferred and used.
The tables below present financial information on geographical segments as at and for the yearsended December 31:
2016Asia EMEA Americas Consolidated
Volume (a) 4,552,881 1,131,792 3,004,690 8,689,363
Gross revenues US$581,404,186 US$159,567,398 US$387,423,367 US$1,128,394,951
Capital expenditures (b) 226,927,004 88,288,382 76,668,281 391,883,667
Other information:Segment assets (c) 2,319,247,358 428,078,300 1,345,055,471 4,092,381,129Segment liabilities (d) 1,815,738,663 76,848,886 420,594,584 2,313,182,133
2017Asia EMEA Americas Consolidated
Volume (a) 4,815,905 1,481,973 2,855,580 9,153,458
Gross revenues US$591,246,219 US$251,809,694 US$401,382,294 US$1,244,438,207
Capital expenditures (b) 210,519,043 23,085,986 74,241,270 307,846,299
Other information:
Segment assets (c) 2,453,354,524 441,596,482 1,364,631,241 4,259,582,247
Segment liabilities (d) 1,853,420,361 90,034,899 444,635,820 2,388,091,080
2018Asia EMEA Americas Consolidated
Volume (a) 5,237,452 1,563,888 2,935,281 9,736,621
Gross revenues US$694,299,542 US$284,414,457 US$407,070,748 US$1,385,784,747
Capital expenditures (b) 110,892,716 70,068,704 84,718,126 265,679,546
Other information:
Segment assets (c) 2,787,877,377 484,849,277 1,271,918,749 4,544,645,403
Segment liabilities (d) 1,964,096,463 107,537,523 266,146,455 2,337,780,441
(a) Measured in TEUs.(b) Capital expenditures include amount disbursed for the acquisition of port facilities and equipment classified as intangibles
under IFRIC 12 and property and equipment as shown in the consolidated statements of cash flows.(c) Segment assets do not include deferred tax assets amounting to US$90.6 million, US$111.1 and US$158.3 million as at
December 31, 2016, 2017 and 2018, respectively.
(d) Segment liabilities do not include income tax payable amounting to US$32.3 million, US$29.5 million, and US$31.6 million,and deferred tax liabilities amounting to US$71.4 million, US$80.5 million and US$104.3 million as at December 31, 2016,2017 and 2018, respectively.

- 57 -
*SGVFS033016*
Moreover, management monitors the Group’s earnings before interest, taxes, depreciation andamortization (EBITDA) on a consolidated basis for decision-making purposes. The followingtable shows the computation of EBITDA as derived from the consolidated net income attributableto equity holders of the parent for the years ended December 31:
2016 2017 2018Net income attributable to equity
holders of the parent US$180,015,587 US$182,141,250 US$221,493,804Non-controlling interests 13,454,791 25,575,549 28,329,043Provision for income tax 63,571,100 40,546,823 59,031,803Income before income tax 257,041,478 248,263,622 308,854,650Add (deduct):
Depreciation and amortization 147,830,235 173,464,668 195,711,716Interest and other expenses (a) 155,910,280 206,790,082 193,611,567Interest and other income (b) (35,703,649) (50,506,815) (55,957,306)
EBITDA (c) US$525,078,344 US$578,011,557 US$642,220,627(a) Interest and other expenses include the following as shown in the consolidated statements of income: foreign exchange
loss; interest expense on concession rights payable; interest expense and financing charges on borrowings; impairmentloss on goodwill; equity in net loss of joint ventures and an associate; and other expenses.
(b) Interest and other income include the following as shown in the consolidated statements of income: foreign exchangegain; interest income; and other income.
(c) EBITDA is not a uniform or legally defined financial measure. EBITDA is presented because the Group believes it isan important measure of its performance and liquidity. EBITDA is also frequently used by securities analysts, investorsand other interested parties in the evaluation of companies in the industry.The Group EBITDA figures are not, however, readily comparable with other companies’ EBITDA figures as they arecalculated differently and thus must be read in conjunction with related additional explanations. EBITDA haslimitations as an analytical tool and should not be considered in isolation or as a substitute for analysis of the Group’sresults as reported under PFRS. Some of the limitations concerning EBITDA are:ƒ EBITDA does not reflect cash expenditures or future requirements for capital expenditures or contractual
commitments;ƒ EBITDA does not reflect changes in, or cash requirements for working capital needs;ƒ EBITDA does not reflect the interest expense, or cash requirements necessary to service interest or principal debt
payments;ƒ Although depreciation and amortization are non-cash charges, the assets being depreciated or amortized will often
have to be replaced in the future, and EBITDA does not reflect any cash requirements for such replacements; andƒ Other companies in the industry may calculate EBITDA differently, which may limit its usefulness as a comparative
measure.Because of these limitations, EBITDA should not be considered as a measure of discretionary cash available to theGroup to invest in the growth of the business. The Group compensates for these limitations by relying primarily onPFRS results and uses EBITDA only as supplementary information.
All segment revenues are from external customers. Gross revenues from port operations of ICTSIand other Philippine-based subsidiaries comprised 39.5 percent, 35.9 percent and 36.8 percent ofthe consolidated gross revenues from port operations for the years ended December 31, 2016,2017 and 2018, respectively. Gross revenues from port operations outside the Republic of thePhilippines comprised 60.5 percent, 64.1 percent and 63.2 percent of the consolidated grossrevenues from port operations for the years ended December 31 2016, 2017 and 2018,respectively.

- 58 -
*SGVFS033016*
5. Intangibles
This account consists of:
2016Concession Rights (see Note 24)
Upfront Fees Fixed FeesPort
Infrastructure SubtotalComputer Software Goodwill Total
CostBalance at beginning of year US$305,055,327 US$556,322,511 US$1,312,497,094 US$2,173,874,932 US$33,389,352 US$127,697,578 US$2,334,961,862Acquisitions or additions – – 104,094,895 104,094,895 1,704,547 – 105,799,442Disposals – – – – (1,325,380) – (1,325,380)Change in accounting estimate
(see Note 24.10) – (6,360,128) – (6,360,128) – – (6,360,128)Transfers from (to) other accounts
(see Note 6) – – (7,981,412) (7,981,412) 10,001,901 – 2,020,489Translation adjustments (6,244,578) (651,140) (581,211) (7,476,929) 1,089,175 (1,242,787) (7,630,541)Balance at end of year 298,810,749 549,311,243 1,408,029,366 2,256,151,358 44,859,595 126,454,791 2,427,465,744Accumulated Amortization
and Impairment LossesBalance at beginning of year 82,383,481 98,741,046 287,785,909 468,910,436 16,950,478 64,985,984 550,846,898Amortization for the year 11,361,724 22,909,765 49,585,489 83,856,978 6,315,539 – 90,172,517Disposals – – – – (1,305,672) – (1,305,672)Transfers from other accounts
(see Note 6) – – – – 16,314 – 16,314Translation adjustments (1,098,610) (305,265) (320,594) (1,724,469) 723,109 – (1,001,360)Balance at end of year 92,646,595 121,345,546 337,050,804 551,042,945 22,699,768 64,985,984 638,728,697Net Book Value US$206,164,154 US$427,965,697 US$1,070,978,562 US$1,705,108,413 US$22,159,827 US$61,468,807 US$1,788,737,047
2017Concession Rights (see Note 24)
Upfront Fees Fixed FeesPort
Infrastructure SubtotalComputer Software Goodwill Total
CostBalance at beginning of year US$298,810,749 US$549,311,243 US$1,408,029,366 US$2,256,151,358 US$44,859,595 US$126,454,791 US$2,427,465,744Acquisitions or additions 31,825 – 109,458,821 109,490,646 2,182,645 – 111,673,291Disposals – – – – (12,479) – (12,479)Termination of contracts (see Note 1.2) (16,738,959) – – (16,738,959) (489,789) – (17,228,748)Transfers from other accounts
(see Notes 6 and 9) – – 14,163,889 14,163,889 8,356,744 – 22,520,633Translation adjustments 6,294,649 2,868,427 556,186 9,719,262 3,551,071 1,375,267 14,645,600Balance at end of year 288,398,264 552,179,670 1,532,208,262 2,372,786,196 58,447,787 127,830,058 2,559,064,041Accumulated Amortization
and Impairment LossesBalance at beginning of year 92,646,595 121,345,546 337,050,804 551,042,945 22,699,768 64,985,984 638,728,697Amortization for the year 10,321,295 23,060,424 57,581,598 90,963,317 9,317,360 – 100,280,677Disposals – – – – (12,237) – (12,237)Termination of contracts (see Note 1.2) (988,389) – – (988,389) (489,789) – (1,478,178)Translation adjustments 1,066,800 789,201 1,925,894 3,781,895 2,050,763 – 5,832,658Balance at end of year 103,046,301 145,195,171 396,558,296 644,799,768 33,565,865 64,985,984 743,351,617Net Book Value US$185,351,963 US$406,984,499 US$1,135,649,966 US$1,727,986,428 US$24,881,922 US$62,844,074 US$1,815,712,424
2018Concession Rights (see Note 24)
Upfront Fees Fixed FeesPort
Infrastructure SubtotalComputer Software Goodwill Total
CostBalance at beginning of year US$288,398,264 US$552,179,670 US$1,532,208,262 US$2,372,786,196 US$58,447,787 US$127,830,058 US$2,559,064,041Acquisitions or additions 28,171,046 111,606,482 144,942,204 284,719,732 878,928 – 285,598,660Transfers from other accounts
(see Notes 6 and 9) – – (9,309,831) (9,309,831) 9,839,247 – 529,416Translation adjustments (12,320,425) (7,106,223) (14,088,363) (33,515,011) (1,879,895) (7,370,444) (42,765,350)Balance at end of year 304,248,885 656,679,929 1,653,752,272 2,614,681,086 67,286,067 120,459,614 2,802,426,767Accumulated Amortization
and Impairment LossesBalance at beginning of year 103,046,301 145,195,171 396,558,296 644,799,768 33,565,865 64,985,984 743,351,617Amortization for the year 10,333,719 25,463,710 62,985,189 98,782,618 8,570,392 – 107,353,010Impairment loss for the year
(see Notes 5 and 10) – – – – – 5,786,047 5,786,047Transfers to other accounts (see
Note 6) – – – – (3,699,777) – (3,699,777)Translation adjustments (4,064,759) (3,019,904) (7,886,586) (14,971,249) (1,050,376) 10,544 (16,011,081)Balance at end of year 109,315,261 167,638,977 451,656,899 728,611,137 37,386,104 70,782,575 836,779,816Net Book Value US$194,933,624 US$489,040,952 US$1,202,095,373 US$1,886,069,949 US$29,899,963 US$49,677,039 US$1,965,646,951

- 59 -
*SGVFS033016*
Concession RightsAdditions to concession rights under port infrastructure pertain to acquisitions of port equipmentand construction mainly in ICTSI Iraq, CGSA and MICT in 2016 and MICT, ICTSI Iraq and OPCin 2017. In 2018, additions to concession rights mainly pertain to acquisition of the terminaloperating agreements, including acquisition of port facilities and equipment in SPICTL and MITLand acquisition of port facilities and equipment in OPC, MICT and ICTSI Iraq. Additions toconcession rights under port infrastructure which are not yet available for use are not amortizedbut tested for impairment at December 31 in accordance with the Group’s accounting policy onImpairment Testing on Nonfinancial Assets (see Note 10).
The reduction in concession rights under upfront fees pertains to the termination of theSub-concession Agreement of LICTSLE and lease agreement of ICTSI Oregon amounting toUS$12.5 million and US$4.2 million in 2017, respectively (see Note 1.2).
Concession rights have remaining amortization periods ranging from 4 to 37 years.
Upon recognition of the fair value of fixed fee on concession contracts, the Group also recognizedthe corresponding concession rights payable. Maturities of concession rights payable arising fromthe capitalization of fixed and upfront fees as at December 31, 2018 are as follows:
Amount2019 US$10,603,4542020 17,647,9012021 19,102,4912022 20,681,0062023 onwards 473,234,560Total US$541,269,412
Interest expense on concession rights payable amounted to US$34.0 million in 2016,US$33.1 million in 2017 and US$37.5 million in 2018.
Capitalized borrowing costs amounted to US$3.1 million in 2016 at a capitalization rate of 6.42 to6.45 percent, US$0.5 million in 2017 at a capitalization rate of 2.40 to 2.80 percent andUS$1.8 million in 2018 at a capitalization rate of 3.50 to 7.00 percent. Unamortized borrowingcosts amounted to US$109.3 million, US$108.2 million and US$106.9 million as atDecember 31, 2016, 2017 and 2018, respectively.
Computer SoftwareComputer software have remaining amortization periods ranging from one to five years.
GoodwillGoodwill arises from the excess of acquisition costs over fair values of net assets at acquisitiondates of the following subsidiaries:
2016 2017 2018PICT US$29,128,210 US$27,462,533 US$21,746,214AGCT 15,295,983 17,728,394 16,986,890YICT 9,493,491 10,132,830 9,585,269DIPSSCOR (see Note 10) 6,130,027 6,104,243 –Others 1,421,096 1,416,074 1,358,666
US$61,468,807 US$62,844,074 US$49,677,039

- 60 -
*SGVFS033016*
Goodwill is not amortized but subject to an annual impairment testing as atDecember 31 (see Note 10).
Impairment of Goodwill
DIPSSCOR. In 2018, an impairment charge of US$5.8 million was recorded in respect of theGroup’s goodwill in DIPSSCOR based on value-in-use calculation using discounted cash flowsthroughout the estimated period of concession. The remaining carrying value of goodwill inDIPSSCOR after the impairment charge is nil. The reportable segment of DIPSSCOR is Asia.The impairment charge in DIPSSCOR was a result of lower projected cash flows as DIPSSCOR’sconcession contract ended in April 2016 and is currently operating on the basis of hold-overauthority granted by the PPA (see Note 3).
The discount rate used is the pre-tax rate that reflects current market assessments of the time valueof money and the risks specific to the asset. The Group used discount rates based on theindustry’s Weighted Average Cost of Capital (WACC). Management assumed a discount rate of10.34 percent for DIPSSCOR as at December 31, 2018. Management recognizes that unfavorableconditions can materially affect the assumptions used in the determination of value-in-use.

- 61 -
*SGVFS033016*
6. Property and Equipment
This account consists of:
2016
Land and LandImprovements
LeaseholdRights and
Improvements
Port Facilitiesand
EquipmentTransportation
Equipment
OfficeEquipment,
Furniture andFixtures
MiscellaneousEquipment
PortEquipmentSpare Parts
Constructionin Progress Total
CostBalance at beginning of year US$80,170,007 US$338,396,133 US$520,678,553 US$73,048,071 US$43,084,536 US$17,954,965 US$4,293,861 US$364,733,981 US$1,442,360,107Additions 14,555,500 596,602 73,011,203 1,235,665 1,647,193 10,250,970 759,318 238,207,447 340,263,898Disposals – (1,941) (1,455,499) (23,644,870) (531,524) (282,937) (76,668) – (25,993,439)Transfers from (to) other accounts (see Note 5) 11,660,540 (18,012,176) 22,676,895 661,837 3,735,583 (1,486,813) (161,177) (21,095,178) (2,020,489)Translation adjustments (9,434,928) (7,878,427) (574,647) 710,657 (169,306) 466,720 151,196 (24,596,145) (41,324,880)Balance at end of year 96,951,119 313,100,191 614,336,505 52,011,360 47,766,482 26,902,905 4,966,530 557,250,105 1,713,285,197Accumulated Depreciation, Amortization and Impairment LossesBalance at beginning of year – 65,560,364 142,448,725 43,980,351 32,011,663 8,040,117 1,462,773 – 293,503,993Depreciation and amortization for the year – 17,624,736 25,897,023 6,469,400 4,702,819 2,384,520 231,903 – 57,310,401Disposals – (1,941) (1,083,271) (16,656,174) (483,191) (233,109) – – (18,457,686)Transfers from (to) other accounts (Note 5) – (8,208,022) 8,139,547 467,191 1,020,020 (1,435,050) – – (16,314)Translation adjustments – 495,188 (109,481) (1,310,051) 12,520 302,629 70,917 – (538,278)Balance at end of year – 75,470,325 175,292,543 32,950,717 37,263,831 9,059,107 1,765,593 – 331,802,116Net Book Value US$96,951,119 US$237,629,866 US$439,043,962 US$19,060,643 US$10,502,651 US$17,843,798 US$3,200,937 US$557,250,105 US$1,381,483,081
2017
Land and LandImprovements
LeaseholdRights and
Improvements
Port Facilitiesand
EquipmentTransportation
Equipment
OfficeEquipment,
Furniture andFixtures
MiscellaneousEquipment
PortEquipmentSpare Parts
Constructionin Progress Total
CostBalance at beginning of year US$96,951,119 US$313,100,191 US$614,336,505 US$52,011,360 US$47,766,482 US$26,902,905 US$4,966,530 US$557,250,105 US$1,713,285,197Additions 8,965,269 3,461,476 11,654,116 2,326,541 1,475,136 2,116,693 130,601 78,271,801 108,401,633Disposals – (65,998) (3,595,352) (1,226,779) (439,928) (382,923) (306,129) – (6,017,109)Termination of contract (Note 1.2) – (372,517) (8,967,138) (470,687) (1,026,718) (388,616) – (31,975) (11,257,651)Transfers from (to) other accounts (see Notes 5 and 9) 816,135 326,795,051 133,094,682 494,547 1,566,153 (4,649,570) 241,629 (475,258,659) (16,900,032)Translation adjustments 1,994,289 17,339,377 12,140,270 184,174 254,288 723,745 37,458 33,099,835 65,773,436Balance at end of year 108,726,812 660,257,580 758,663,083 53,319,156 49,595,413 24,322,234 5,070,089 193,331,107 1,853,285,474Accumulated Depreciation, Amortization and Impairment LossesBalance at beginning of year – 75,470,325 175,292,543 32,950,717 37,263,831 9,059,107 1,765,593 – 331,802,116Depreciation and amortization for the year 1,389,254 25,937,532 33,371,797 4,127,746 4,740,157 3,091,669 178,907 – 72,837,062Disposals – (65,998) (2,936,474) (1,029,064) (386,182) (355,223) – – (4,772,941)Termination of contract (Note 1.2) – (66,713) (3,824,711) (468,380) (1,003,907) (266,283) – – (5,629,994)Transfers to other accounts (Note 5) – – – – – (2,312,000) – – (2,312,000)Translation adjustments 495,519 1,918,565 2,258,395 (34,562) 84,735 504,649 (57,710) – 5,169,591Balance at end of year 1,884,773 103,193,711 204,161,550 35,546,457 40,698,634 9,721,919 1,886,790 – 397,093,834Net Book Value US$106,842,039 US$557,063,869 US$554,501,533 US$17,772,699 US$8,896,779 US$14,600,315 US$3,183,299 US$193,331,107 US$1,456,191,640

- 62 -
*SGVFS033016*
2018
Land and LandImprovements
LeaseholdRights and
Improvements
Port Facilitiesand
EquipmentTransportation
Equipment
OfficeEquipment,
Furniture andFixtures
MiscellaneousEquipment
PortEquipment
Spare PartsConstruction
in Progress TotalCostBalance at beginning of year US$108,726,812 US$660,257,580 US$758,663,083 US$53,319,156 US$49,595,413 US$24,322,234 US$5,070,089 US$193,331,107 US$1,853,285,474Additions 864,344 2,485,386 24,690,098 3,712,932 2,325,115 2,397,457 281,358 63,128,867 99,885,557Disposals – (42,027) (8,617,701) (1,762,068) (387,310) (21,651) (135,368) (5,566,437) (16,532,562)Transfers from (to) other accounts (see Notes 5 and 9) 2,312,374 72,640,768 123,481,079 1,064,662 5,705,808 16,823,715 (543,121) (221,066,394) 418,891Translation adjustments (1,981,258) (51,707,555) (36,352,672) (959,173) (1,453,127) (625,172) (137,875) (6,922,708) (100,139,540)Balance at end of year 109,922,272 683,634,152 861,863,887 55,375,509 55,785,899 42,896,583 4,535,083 22,904,435 1,836,917,820Accumulated Depreciation, Amortization and Impairment LossesBalance at beginning of year 1,884,773 103,193,711 204,161,550 35,546,457 40,698,634 9,721,919 1,886,790 – 397,093,834Depreciation and amortization for the year 1,398,904 32,387,775 41,895,837 3,897,035 4,698,699 3,627,446 91,765 – 87,997,461Disposals – (31,254) (8,075,758) (1,239,106) (225,220) (50,831) – – (9,622,169)Transfers from other accounts (Note 5) – – – – 3,699,777 – – – 3,699,777Translation adjustments (48,420) (7,450,173) (10,230,851) (777,861) (1,135,473) (208,445) (448,406) – (20,299,629)Balance at end of year 3,235,257 128,100,059 227,750,778 37,426,525 47,736,417 13,090,089 1,530,149 – 458,869,274Net Book Value US$106,687,015 US$555,534,093 US$634,113,109 US$17,948,984 US$8,049,482 US$29,806,494 US$3,004,934 US$22,904,435 US$1,378,048,546

- 63 -
*SGVFS033016*
Capitalized borrowing costs amounted to US$21.2 million in 2016 at a capitalization rate of6.45 percent, US$9.9 million in 2017 at a capitalization rate of 5.65 to 6.73 percent andUS$2.5 million in 2018 at a capitalization rate of 3.76 to 6.47 percent. Unamortized borrowingcosts amounted to US$53.7 million, US$62.1 million and US$62.1 million as atDecember 31, 2016, 2017 and 2018, respectively.
Construction in progress is mainly composed of ongoing port development and expansion projectsin VICT and CMSA as of December 31, 2016; VICT and CGT as of December 31, 2017; andCMSA and MICT as of December 31, 2018 (see Note 1.2).
Fully depreciated property and equipment with cost amounting to US$98.0 million,US$153.3 million and US$185.7 million as at December 31, 2016, 2017 and 2018, respectively,are still being used in the Group’s operations.
Port equipment of BCT with a total carrying value of US$3.0 million and US$6.0 million as atDecember 31, 2017 and 2018, respectively, were pledged as collateral for its outstanding loansfrom its overdraft facility (see Note 17); port equipment of AGCT with a total carrying value ofHRK153.8 million (US$21.4 million), HRK148.3 million (US$24.0 million) andHRK141.3 million (US$21.9 million) were pledged as collateral for its outstanding foreigncurrency-denominated loan (see Note 15.2.4) as at December 31, 2016, 2017 and 2018,respectively; all present and future plant machinery, tools and equipment of PICT of up toRs.2.0 billion (US$19.2 million) were used to secure its long-term debt from a commercial bank inPakistan (see Note 15.2.4) as at December 31, 2016; certain property and equipment of YICT withtotal carrying value of RMB176.9 million (US$27.2 million) and RMB167.6 million(US$24.4 million) as at December 31, 2017 and 2018, respectively, were pledged as collateral forits outstanding foreign currency-denominated loan (see Note 15.2.4); certain port equipment ofCMSA with a total carrying value of US$31.1 million and US$42.7 million as atDecember 31, 2016 and 2017, respectively, were pledged as security for its long-term loans fromthe project finance facility (see Note 15.2.2); and all current and future assets of VICT, includingport equipment, with a total carrying value of AUD887.3 million (US$639.6 million),AUD813.0 million (US$639.6 million) and AUD837.1 million (US$590.7 million) as ofDecember 31, 2016, 2017 and 2018, respectively, were pledged as securities for its project financefacilities (see Note 15.2.4).
7. Investment Properties
The details of investment properties are as follows:
2016Land and
ImprovementsBuilding and
Others TotalCostBalance at beginning of year US$11,253,304 US$674,594 US$11,927,898Translation adjustments (234,791) (7,219) (242,010)Balance at end of year 11,018,513 667,375 11,685,888Accumulated Depreciation and AmortizationBalance at beginning of year 4,661,757 425,271 5,087,028Amortization during the year 340,629 6,688 347,317Translation adjustments – (3,761) (3,761)Balance at end of year 5,002,386 428,198 5,430,584Net Book Value US$6,016,127 US$239,177 US$6,255,304

- 64 -
*SGVFS033016*
2017Land and
ImprovementsBuilding and
Others TotalCostBalance at beginning of year US$11,018,513 US$667,375 US$11,685,888Additions 1,783,034 337,512 2,120,546Translation adjustments (17,472) (537) (18,009)Balance at end of year 12,784,075 1,004,350 13,788,425Accumulated Depreciation and AmortizationBalance at beginning of year 5,002,386 428,198 5,430,584Amortization during the year 340,629 6,300 346,929Translation adjustments – (225) (225)Balance at end of year 5,343,015 434,273 5,777,288Net Book Value US$7,441,060 US$570,077 US$8,011,137
2018Land and
ImprovementsBuilding and
Others TotalCostBalance at beginning of year US$12,784,075 US$1,004,350 US$13,788,425Translation adjustments (208,466) (6,410) (214,876)Balance at end of year 12,575,609 997,940 13,573,549Accumulated Depreciation and AmortizationBalance at beginning of year 5,343,015 434,273 5,777,288Amortization during the year 355,217 6,028 361,245Translation adjustments – (3,702) (3,702)Balance at end of year 5,698,232 436,599 6,134,831Net Book Value US$6,877,377 US$561,341 US$7,438,718
Land and improvements mainly include land held for capital appreciation and land improvementssubject to operating leases.
Investment properties of MICT and IWI CTHI located in Cabuyao, Laguna have a fair value ofP=872.6 million (US$16.6 million) as at February 7, 2018 based on a valuation performed by aqualified independent appraiser whose report was dated February 27, 2018.
Fair value of the investment properties was determined using the sales comparison approach. Thismeans that valuations performed by qualified independent appraisers are based on sales of similaror substitute properties, significantly adjusted for differences in the nature, location or condition ofthe specific property. This valuation approach is categorized as Level 3 in the fair value hierarchyas of December 31, 2016, 2017 and 2018. The significant unobservable input to the valuation isthe price per square meter which ranges from P=2,268 (US$43.1) to P=4,750 (US$90.3).
Significant increases or decreases in estimated price per square meter in isolation would result in asignificantly higher or lower fair value on a linear basis.
Rental income derived from rental-earning investment properties presented as part of“Other income” account in the consolidated statements of income amounted to US$0.4 millionboth in 2016 and 2017 and US$0.6 million in 2018 (see Note 20.1). There were no restrictions onrealizability of investment properties and no significant repairs and maintenance were made tomaintain the Group’s investment properties in 2016, 2017 and 2018. The rent agreement coveringrental-earning investment properties is renewable at the option of both parties yearly.
Operating expenses related to the investment property amounted to US$0.6 million in 2016 andUS$0.8 million both in 2017 and 2018, which pertains mainly to real property taxes.

- 65 -
*SGVFS033016*
8. Investments in and Advances to Joint Ventures and Associates
This account consists of:
2016 2017 2018Investment in and advances to joint ventures US$293,638,405 US$299,680,549 US$299,262,180Investment in associates 7,474,994 90,022,297 89,400,804
301,113,399 389,702,846 388,662,984Less allowance for probable losses 7,474,994 7,474,994 7,474,994
US$293,638,405 US$382,227,852 US$381,187,990
Investment in and Advances to Joint VenturesInvestment in joint ventures mainly pertains to the Group’s 46.30 percent ownership interest inSPIA as at December 31, 2018. The advances to SPIA mainly represent interest-bearing loansused by SPIA to finance the construction of its terminal and its start-up operations in Colombia(see Note 22.1). SPIA started commercial operations in the fourth quarter of 2016.
The Group has a 49 percent investment in FAMI. FAMI was established in March 2018 and hasnot yet started commercial operations as of March 5, 2019.
The movements and details of this account are as follows:
2016 2017 2018Investment in Joint Ventures:
Balance at beginning of year US$22,019,569 US$16,450,596 (US$14,521,557)Acquisition of shares in joint ventures – 47,619 2,338,207Conversion of advances to equity – 5,732,420 –Translation adjustments 3,024 – –Equity in net losses during the year (5,571,997) (36,752,192) (23,536,008)Balance at end of year 16,450,596 (14,521,557) (35,719,358)
Advances to a joint venture (see Note 22.1) 277,187,809 314,202,106 334,981,538US$293,638,405 US$299,680,549 US$299,262,180
The summarized financial information of SPIA as at and for the years ended December 31follows:
2016 2017 2018Current assets (a) US$7,181,633 US$11,703,748 US$15,124,799Noncurrent assets 627,306,201 618,971,579 604,996,288Current liabilities (b) 296,183,118 325,518,840 347,818,988Noncurrent liabilities (c) 301,819,841 336,484,536 354,254,325(a) Current assets include cash and cash equivalents amounting to US$3.0 million, US$4.8 million and US$2.5 million as at
December 31, 2016, 2017 and 2018, respectively.(b) Current liabilities include income tax payable amounting to US$101.3 thousand, US$150.8 thousand and nil as at
December 31, 2016, 2017 and 2018, respectively.(c) Noncurrent liabilities include deferred tax liabilities amounting to US$7.4 million, US$7.1 million and US$6.7 million as
at December 31, 2016, 2017 and 2018, respectively.

- 66 -
*SGVFS033016*
(d) Other income includes interest income amounting to US$51.3 thousand in 2016, US$149.2 thousand in 2017 andUS$104.1 thousand in 2018.
(e) Other expenses include interest expense on concession rights payable amounting to US$1.3 million in 2016, 2017 and2018 and interest expense on advances from ICBV and PSA amounting to nil in 2016, US$35.5 million in 2017 andUS$38.6 million in 2018.
The difference between the carrying value of investment in SPIA against the share in net assets ofSPIA represents the excess of fair value over the carrying value of the concession rights of SPIA.
Investments in AssociatesThe movements and details of this account are as follows:
2016 2017 2018Investments in Associates
Balance at beginning of year US$7,474,994 US$7,474,994 US$90,022,297Acquisition of shares in an associate (see Note 1.3) – 81,144,000 –Equity in net income during the year – 414,815 1,267,748Share in other comprehensive income (loss)
(see Note 14.7) – 988,488 (1,889,241)Balance at end of year 7,474,994 90,022,297 89,400,804Less allowance for probable losses 7,474,994 7,474,994 7,474,994
US$– US$82,547,303 US$81,925,810
The Group has a 49 percent investment in ARDC, an associate. ARDC had stopped commercialoperations. The investment in ARDC was covered with a full allowance for probable lossesamounting to US$7.5 million.
On September 21, 2017, ICTSI signed a SPA with Petron Corporation for the acquisition of10,449,000 MNHPI shares, representing 34.83 percent of the total issued and outstanding sharesof MNHPI for a consideration of Php1.75 billion (US$33.8 million). The completion of the SPAwas subject to several conditions, one of which was the approval of the acquisition by thePhilippine Ports Authority. The SPA was completed on October 30, 2017. An additionalinvestment cost of Php2.45 billion (US$47.3 million) was incurred in relation to this acquisition.
On September 5, 2018, ICTSI has signed an SPA with Harbour Centre Port Terminal, Inc.(HCPTI) for the acquisition of 4,550,000 shares in MNHPI from HCPTI. The subject sharesrepresent 15.17% of the total issued and outstanding shares of MNHPI. The consideration isPhp910.0 million (US$16.8 million). As of March 5, 2019, the completion of the SPA remainssubject to a number of conditions precedent. Upon completion of this transaction, ICTSI'sshareholdings in MNHPI will increase from 34.83 percent to 50 percent. An additionalinvestment cost will be incurred in relation to this acquisition.
2016 2017 2018Gross revenues from port operations US$1,037,994 US$14,535,018 US$41,445,905Operating expenses (8,732,070) (22,000,141) (25,666,482)Depreciation and amortization (343,175) (33,840,567) (36,121,362)Other income (d) 2,277,119 2,855,285 2,894,862Other expenses (e) (6,890,232) (43,954,592) (46,184,668)Benefit from income tax 615,813 3,026,612 13,007,569Net loss (US$12,034,551) (US$79,378,385) (US$50,624,176)

- 67 -
*SGVFS033016*
The finalized fair values of the identifiable assets and liabilities of MNHPI at the date ofacquisition were:
Share in the Fair ValueRecognized on Acquisition
AssetsProperty and equipment US$358,492Intangibles 140,322,295Deferred tax asset 1,504,712Other noncurrent assets 1,740,985Cash and cash equivalents 5,712,181Receivables 3,038,693Spare parts and supplies 1,767,810Prepaid expenses and other current assets 2,300,524
156,745,692LiabilitiesLoans payable (37,168,452)Accounts payable and other current liabilities (3,027,272)Long-term debt (9,286,109)Concession rights payable (20,073,115)Other noncurrent liabilities (1,166,435)Deferred tax liability (17,759,649)
(88,481,032)Total identifiable net assets at fair value 68,264,660Goodwill arising on acquisition 12,879,340Purchase consideration and additional investment cost
satisfied by cash US$81,144,000
The finalized fair values reflect the financial effects of adjustments on intangibles, concessionrignts payable and goodwill.
The summarized financial information of MNHPI as at and for the year ended December 31follows:
2017 2018Current assets (a) US$40,501,252 US$29,180,195Noncurrent assets 252,212,999 326,894,513Current liabilities 121,800,880 110,297,818Noncurrent liabilities (b) 78,042,108 75,399,475(a) Current assets include cash and cash equivalents amounting to US$16.7 million and US$9.5 million as at
December 31, 2017 and 2018, respectively.(b) Noncurrent liabilities include deferred tax liabilities amounting to nil and US$18.9 million as at
December 31, 2017 and 2018, respectively.
For the periodNovember 1, 2017
to December 31,2017 2018
Gross revenues from port operations US$12,093,570 US$72,668,167Operating expenses (7,515,542) (36,097,953)Depreciation and amortization (2,622,283) (19,019,400)Other income 913,185 845,881Other expenses (c) (1,677,959) (14,019,412)Provision from income tax – (737,477)Net income US$1,190,971 US$3,639,806(c) Other expenses include interest expense on concession rights payable amounting to US$0.8 million and US$3.7 million
and interest expense and financing charges on borrowings amounting to US$0.9 million and US$7.3 million in 2017 and2018, respectively.

- 68 -
*SGVFS033016*
As of December 31, 2018, the difference between the carrying value of investment in MNHPIagainst the share in net assets of MNHPI represents goodwill on MNHPI amounting toUS$12.9 million and excess of fair value over the carrying value of identifiable assets andliabilities of MNHPI amounting to US$39.0 million.
9. Other Noncurrent Assets
This account consists of:
2016 2017 2018Advances to suppliers, contractors and others (net of
allowance for probable losses of US$3.1 million,US$0.7 million and US$0.7 million as atDecember 31, 2016, 2017 and 2018, respectively)(see Note 20) US$54,921,826 US$54,038,658 US$91,145,589
Restricted cash (see Notes 15 and 25) 20,933,562 21,008,123 24,897,124AFS investments/ Financial assets at FVOCI
(see Notes 3 and 26) 13,103,435 13,348,132 13,722,125Input tax (see Note 13) 1,481,100 246,775 883,098Derivative assets (Note 26) 7,970,479 4,765,819 152,906Pension assets (see Note 23) 981 – 89,898Debt issuance costs (see Note 15.2.6) 3,666,403 – –Prepayments and others 4,229,373 4,956,162 7,993,150
US$106,307,159 US$98,363,669 US$138,883,890
Advances to Suppliers, Contractors and OthersAdvances to suppliers, contractors and others mainly pertain to advance payments for theacquisition of transportation equipment and construction of port facilities, advance payments forfuture rentals and deposits for acquisitions of properties and investments. As atDecember 31, 2016, 2017 and 2018, this account includes advances and deposits to suppliers andcontractors and for the acquisition of properties and investments amounting to US$48.9 million,US$47.4 million and US$81.0 million, respectively (see Notes 1.2 and 8).
Restricted CashRestricted cash pertained mainly to cash deposits placed by the Group as required by theconcession agreements for MICTSL, SCIPSI and DIPSSCOR. The garnished cash of TSSAarising from a civil suit filed by a former customer of TSSA is likewise included in this account(see Note 25). This account also included the US$13.0 million cash of CMSA placed in specialpurpose debt service and operating and maintenance reserve accounts in accordance with theproject finance loan documents in 2016 and 2017 and nil in 2018 due to termination of CMSAloan (see Note 15.2.2). In 2018, this account also included the US$17.3 million(AUD24.6 million) cash of VICT placed in a special purpose debt service reserve account inaccordance with the project finance loan documents (see Note 15.2.4).
Debt Issuance CostsOn July 24, 2014, the Board of ICTSI approved the establishment of a loan facility programmepursuant to which a subsidiary, IGFBV, may from time to time enter into one or more loanfacilities with one or more lenders under the said programme, to be guaranteed by ICTSI. Inconnection with the establishment of the said programme, the Board also approved the first loanfacility under the programme with IGFBV as the borrower and ICTSI as the guarantor. The loanfacility is a revolving credit facility with a principal amount of US$350.0 million and a tenor offive years from signing date, July 24, 2014. In 2015, IGFBV availed a total of US$100.0 millionfrom the US$350.0 million five-year revolving credit facility bearing interest ranging from 2.13 to2.14 percent per annum. In August 2015, IGFBV prepaid the US$100.0 million loan.

- 69 -
*SGVFS033016*
In April and June 2016, IGFBV availed of loans amounting to US$150.0 million andUS$10.0 million, respectively, from the US$350.0 million five-year revolving credit facilitybearing interest ranging from 2.39 to 2.71 percent per annum. In August, November andDecember 2016, IGFBV partially paid loans availed in April and June 2016 totalingUS$145.0 million. The remaining balance of US$15.0 million was fully paid on May 31, 2017.
The related debt issuance costs of the revolving facility amounting to US$7.1 million are beingamortized over five years (see Note 15.2.6). Commitment fees amounting to US$2.2 million andUS$1.2 million in 2016 and 2017, respectively, representing 0.78 percent per annum of theamount of the undrawn facility, is recorded as part of “Interest expense and financing charges onborrowings” account in the consolidated statements of income.
The revolving credit facility was cancelled on June 8, 2017. As a result of the cancellation, theunamortized portion of the costs of securing the loan facility amounting to US$3.0 million wascharged to profit or loss and recognized as “Other expenses” in the 2017 consolidated statement ofincome (see Note 20.3).
AFS Investments/ Financial Assets at FVOCIThe net movement in unrealized mark-to-market gain on AFS investments / financial assets atFVOCI is as follows:
2016 2017 2018Balance at beginning of year US$1,125,896 US$952,022 US$586,788Change in fair value of AFS investments/
financial assets at FVOCI (173,874) (365,234) 393,072Balance at end of year (see Note 14.7) US$952,022 US$586,788 US$979,860
Prepayments and OthersAs at December 31, 2018, this account includes the minimum presumed income tax of Tecplataamounting to US$3.9 million which is available to be offset against its future income tax payable(see Note 21).
10. Impairment Testing on Nonfinancial Assets
The Group reviews all assets annually or more frequently to look for any indication that an assetmay be impaired. These assets include property and equipment, intangible assets, investments injoint ventures and associates, intangible assets not yet available for use and goodwill. If any suchindication exists, or when the annual impairment testing for an asset is required, the Groupcalculates the asset’s recoverable amount. Irrespective of whether there is any indication ofimpairment, intangible assets not yet available for use and goodwill acquired in a businesscombination are tested for impairment annually. ICTSI and its subsidiaries used a discounted cashflow analysis to determine value-in-use. Value-in-use reflects an estimate of the future cash flowsthe Group expects to derive from the cash-generating unit, expectations about possible variationsin the amount or timing of those future cash flows, the time value of money, the price for bearingthe uncertainty inherent in the asset and other factors such as illiquidity that market participantswould reflect in pricing the future cash flows the Group expects to derive from the cash-generatingunit. The calculation of the value-in-use is based on reasonable and supportable assumptions, themost recent budgets and forecasts and extrapolation for periods beyond budgeted projections.These represent management’s best estimate of the economic conditions that will exist over theremaining useful life of the asset.

- 70 -
*SGVFS033016*
The recoverable amount of non-financial assets of the Group subject to impairment testing hasbeen determined based on value-in-use calculation using cash flow projections based on financialbudgets approved by senior management covering a five-year period or remaining concessionperiod. Projections beyond five years were used for the newly established terminals and/orgreenfield projects.
Key assumptions used to determine the value-in-use are discount rates including cost of debt andcost of capital, growth rates, EBITDA margins, working capital and capital expenditure.
Discount RatesThe discount rate used is the pre-tax rate that reflects current market assessments of the time valueof money and the risks specific to the asset. The Group used discount rates based on theindustry’s WACC. The rates used to discount the future cash flows are based on risk-free interestrates in the relevant markets where the subsidiaries are domiciled taking into consideration thedebt premium, market risk premium, gearing, corporate tax rate and asset betas of thesesubsidiaries. Management assumed discount rates of 7.10 percent to 10.72 percent in2016, 9.50 percent to 13.01 percent in 2017 and 10.02 percent to 16.21 percent in 2018.
Growth RatesAverage growth rates in revenues are based on ICTSI’s expectation of market developments andthe changes in the environment in which it operates. ICTSI uses revenue growth rates rangingfrom 3 percent to 7 percent, based on past historical performance as well as expectations on theresults of its strategies. On the other hand, the perpetual growth rate used to compute for theterminal value is based on the forecasted long-term growth of real gross domestic product (GDP)of the economy in which the business operates.
EBITDA MarginThe EBITDA margin represents the operating margin before depreciation and amortization and isestimated based on the margin achieved in the period immediately before the budget period and onestimated future development and growth in the industry and market. Committed operationalefficiency programs are taken into consideration. Changes in the outcome of these initiatives mayaffect future estimated EBITDA margin.
Capital ExpenditureIn computing the value-in-use, estimates of future cash flows include future cash outflowsnecessary to maintain the level of economic benefits expected to arise from the asset in its currentcondition. Capital expenditures that improve or enhance the asset’s performance therefore are notincluded. However, for the newly established terminals and/or greenfield projects, managementtakes into consideration the capital expenditures necessary to meet the expected growth in volumeand revenues. These expansionary capital expenditures of which the Group has incurred cashoutflows, for the newly established terminals are deducted from the future cash flows.

- 71 -
*SGVFS033016*
11. Cash and Cash Equivalents
This account consists of:
2016 2017 2018Cash on hand and in banks US$248,562,837 US$212,792,304 US$139,138,642Cash equivalents (see Note 26.4) 76,495,755 66,634,767 307,940,683
US$325,058,592 US$279,427,071 US$447,079,325
Cash in banks earns interest at the prevailing bank deposit rates. Cash equivalents are short-terminvestments, which are made for varying periods of up to three months depending on theimmediate cash requirements of the Group and earn interest at the prevailing short-terminvestment rates. The carrying value of cash and cash equivalents approximates their fair value asat the balance sheet date.
Interest income derived from interest-earning bank deposits and short-term investments amountedto US$3.1 million, US$4.1 million and US$4.8 million for the years ended December 31, 2016,2017 and 2018, respectively.
As of December 31, 2018, ICTSI designated EUR138.3 million (US$158.5 million) of its Eurodenominated cash equivalents as cash flow hedges (see Note 26.4).
12. Receivables
This account consists of:
2016 2017 2018Trade US$93,476,622 US$107,650,970 US$113,688,162Advances and nontrade 16,858,404 12,725,127 14,703,918
110,335,026 120,376,097 128,392,080Less allowance for doubtful accounts 7,404,589 7,484,983 7,968,303
US$102,930,437 US$112,891,114 US$120,423,777
Trade receivables are noninterest-bearing and are generally on 30-60 days’ credit terms.
Advances and nontrade receivables mainly include noninterest-bearing advances to suppliers andvendors that may be applied against payable or collectible within 12 months.
Movements in the allowance for doubtful accounts are summarized below:
2016
TradeAdvances
and Nontrade TotalBalance at beginning of year US$5,495,804 US$52,758 US$5,548,562Provision during the year 1,901,534 − 1,901,534Write-off (591,310) − (591,310)Translation adjustments 545,803 − 545,803Balance at end of year US$7,351,831 US$52,758 US$7,404,589

- 72 -
*SGVFS033016*
2017
TradeAdvances
and Nontrade TotalBalance at beginning of year US$7,351,831 US$52,758 US$7,404,589Provision during the year 848,788 − 848,788Write-off (744,270) − (744,270)Translation adjustments (24,124) − (24,124)Balance at end of year US$7,432,225 US$52,758 US$7,484,983
2018
TradeAdvances
and Nontrade TotalBalance at beginning of year US$7,432,225 US$52,758 US$7,484,983Effect of PFRS 9 (see Note 3) 449,581 − 449,581Balance at beginning of year, as restated 7,881,806 52,758 7,934,564Provision during the year 342,172 − 342,172Write-off (40,785) − (40,785)Translation adjustments (267,648) − (267,648)Balance at end of year US$7,915,545 US$52,758 US$7,968,303
13. Prepaid Expenses and Other Current Assets
This account consists of:
2016 2017 2018Input tax (see Note 9) US$25,850,876 US$29,378,322 US$38,946,312Prepaid port fees, insurance, bonds
and other expenses 12,572,638 17,189,416 18,574,479Creditable withholding taxes 8,894,553 14,576,148 6,550,338Tax credits 3,236,372 7,064,208 2,472,451Others 3,825,481 2,570,611 4,920,784
US$54,379,920 US$70,778,705 US$71,464,364
Input TaxThis account includes input tax recognized mainly by CMSA and ICTSI from the acquisition ofterminal equipment and payments of civil works in relation to the construction activities at theseterminals (see Notes 6 and 9) and expected to be applied against output tax within 12 months fromthe balance sheet date.
Tax CreditsTax credits consist of tax credits granted by the tax authorities and tax credit certificates issued toICTSI, TSSA, OPC and CGSA which can be applied against tax liabilities in the future.

- 73 -
*SGVFS033016*
14. Equity
The Group was listed with the PSE on March 23, 1992. In its initial public offering, the ParentCompany offered its common shares at a price of P=6.70. As at December 31, 2016, 2017 and2018, the Parent Company had 1,427, 1,399 and 1,383 shareholders on record, respectively.
14.1 Capital Stock and Treasury Shares
The Parent Company’s common shares are listed and traded in the PSE.
The details and movements of ICTSI’s capital stock and treasury shares as at December 31 wereas follows:
Number of SharesAuthorized Issued and Subscribed
2016 2017 2018 2016 2017 2018Preferred A Shares - nonvoting,
non-cumulative, P=1.00(US$0.048) par value 993,000,000 993,000,000 993,000,000 3,800,000 3,800,000 3,800,000
Preferred B Shares - voting,non-cumulative, P=0.01(US$0.0002) par value 700,000,000 700,000,000 700,000,000 700,000,000 700,000,000 700,000,000
Common Stock -P=1.00 (US$0.048) par value 4,227,397,381 4,227,397,381 4,227,397,381 2,045,177,671 2,045,177,671 2,045,177,671
Number of SharesIssued and Subscribed
2016 2017 2018
Treasury SharesBalance at beginning of year (10,469,155) (17,130,267) (10,982,205)Acquisitions during the year (8,175,510) (5,400,000) (25,039,790)Sale during the year – 10,000,000 –Issuance for share-based payments (see Note 19) 1,514,398 1,548,062 1,846,255Balance at end of year (17,130,267) (10,982,205) (34,175,740)
Amount Issued and Subscribed2016 2017 2018
Preferred Stock US$236,222 US$236,222 US$236,222
Common Stock US$67,781,529 US$67,781,529 US$67,781,529Subscription Receivable (451,341) (451,341) (451,341)
US$67,330,188 US$67,330,188 US$67,330,188Treasury SharesBalance at beginning of year (US$7,547,826) (US$17,904,401) (US$15,059,524)Issuance of treasury shares for share-based payments
(see Note 19) 1,233,965 1,342,692 2,277,081Sale during the year – 11,069,183 –Acquisitions during the year (11,590,540) (9,566,998) (45,329,627)Balance at end of year (US$17,904,401) (US$15,059,524) (US$58,112,070)
Preferred SharesThe Preferred A shares, which were subscribed by ICTHI, are nonvoting, entitled to dividend atrates to be fixed by the Board, non-cumulative, convertible to common shares under such terms tobe provided by the Board, redeemable at such price and terms determined by the Board and havepreference over common shares in the distribution of the assets of the Parent Company(see Note 14.3). As at March 5, 2019, the Board has not fixed the dividend rate and terms ofconversion of Preferred A shares.

- 74 -
*SGVFS033016*
The Preferred B shares were issued to Achillion Holdings, Inc. (Achillion). As at March 5, 2019,Preferred B shares have the following features: voting; issued only to Philippine Nationals; notconvertible into common shares; earn no dividend and redeemable at the option of the Board.
Achillion is a Philippine corporation owned and controlled by ICTSI’s Chairman and Presidentand controlling stockholder, Mr. Enrique K. Razon, Jr. The ICTSI contract with PPA on theoperation, management and development of the MICT requires the Razon Group to retain controlof ICTSI.
Treasury SharesTreasury shares came from the acquisition of ICTSI common shares or transfer of ICTSI commonshares held by subsidiaries. Part of the treasury shares are subsequently reissued upon vesting ofstock awards under the Stock Incentive Plan (SIP) (see Note 19).
On November 26, 2018, the Board of ICTSI approved and authorized the re-purchase from theopen market of up to 30 million ICTSI shares, in addition to the number of shares approved andratified by the BOD on September 16, 2015 initially at 10 million shares and onNovember 17, 2016 for an additional 20 million shares. The purpose of the said authorizations isto provide management the flexibility to acquire shares from the open market either for the SIP oras and when management deems the price of the shares to be undervalued. In 2016, 2017 and2018, the Company acquired 8,175,510 treasury shares totaling US$11.6 million, 5,400,000treasury shares totaling US$9.6 million and 25,039,790 treasury shares totaling US$45.3 million,respectively.
On September 8, 2017, the Board of ICTSI approved the sale of 10 million treasury shares. Theapproval of sale is in response to a reverse inquiry from an investor who expressed serious interestfor a sizable ownership of the Company. On the same date, ICTSI’s 10 million treasury shareswere sold at US$2.07 (Php105.10) per share with net proceeds amounting to US$20.4 million. Thesaid transaction resulted in the increase of US$9.3 million in additional paid-in capital and thereduction in treasury shares of US$11.1 million in 2017.
14.2 Additional Paid-in Capital
Additional paid-in capital is increased when ICTSI grants stock awards and these stock awardsvest under the SIP. Aggregate increase in additional paid-in capital amounted to US$1.4 million,US$2.3 million and US$1.5 million in 2016, 2017 and 2018, respectively, as a result of grantingand vesting of stock awards (see Note 19).
14.3 Cost of Shares Held by Subsidiaries
Details and movements in preferred and common shares held by subsidiaries as at December 31are as follows:
2016 2017 2018Number
of Shares AmountNumber
of Shares AmountNumber
of Shares Amount
Preferred Shares 3,800,000 US$72,492,481 3,800,000 US$72,492,481 3,800,000 US$72,492,481Common Shares 734,970 1,769,114 734,970 1,769,114 734,970 1,769,114
4,534,970 US$74,261,595 4,534,970 US$74,261,595 4,534,970 US$74,261,595

- 75 -
*SGVFS033016*
As at December 31, 2016, 2017 and 2018, cost of preferred shares held by a subsidiary pertains topreference A shares held by ICTHI and cost of common shares held by a subsidiary pertains tocommon shares held by IWI CTHI.
14.4 Non-controlling Interests
The dividends distributed to non-controlling shareholders are as follows:
14.5 Retained Earnings
The details of ICTSI’s declaration of cash dividends are as follows:
2016 2017 2018Date of Board approval April 21, 2016 April 20, 2017 April 19, 2018Cash dividends per share US$0.020 (P=0.91) US$0.05 (P=2.47) US$0.05 (P=2.50)Record date May 5, 2016 May 5, 2017 May 4, 2018Payment date May 18, 2016 May 17, 2017 May 11, 2018
Retained earnings were reduced by distributions paid out by RCBV to holders of Perpetual CapitalSecurities discussed in Note 14.6 below aggregating US$34.2 million in 2016, US$41.6 million in2017 and US$60.3 million in 2018.
Of the total retained earnings of US$779.4 million, US$819.7 million and US$882.8 million as atDecember 31, 2016, 2017 and 2018, respectively, undistributed cumulative earnings ofsubsidiaries in retained earnings position amounting to US$832.9 million, US$1,056.7 million andUS$1,211.1 million, as at December 31, 2016, 2017 and 2018, respectively, were not available fordividend distribution (see Note 21). As at December 31, 2018, the retained earnings is restrictedfor dividend declaration to the extent of the cost of treasury shares held amounting toUS$58.1 million.
On April 21, 2016, the Board of the Parent Company approved the release of US$90.0 millionfrom appropriated retained earnings. On December 29, 2017, the Board of the Parent Companyappropriated US$25.0 million for additional working capital requirements of its continuingdomestic and foreign expansion projects in 2018. On March 6, 2018, the Board of the ParentCompany approved the release of US$150.0 million from the appropriated retained earnings backto unappropriated retained earnings due to completion of the project in VICT in Australia. Theremaining appropriated retained earnings of the Parent Company as of March 5, 2019 amountingto US$212.1 million is intended for capital expenditures for new and existing projects in MICT inManila, OPC in Honduras, ICTSI Iraq in Iraq and CMSA in Mexico.
2016 2017 2018PICT US$11,164,344 US$8,764,022 US$6,335,029IDRC – – 2,858,291AGCT – 987,166 1,864,889YICT 618,740 – 1,841,962BIPI 846,489 799,936 1,142,966SCIPSI 1,281,148 1,481,089 615,898LGICT – – 151,872MTS – – 103,927DIPSSCOR 73,668 42,283 28,866
US$13,984,389 US$12,074,496 US$14,943,700

- 76 -
*SGVFS033016*
As at December 31, 2016, 2017 and 2018, total appropriated retained earnings of the ParentCompany amounted to US$337.1 million, US$362.1 million and US$212.1 million, respectively.
The unappropriated retained earnings of the Parent Company that is available for dividenddeclaration as of December 31, 2018 amounted to US$74.6 million.
14.6 Perpetual Capital Securities
On April 28, 2011, RCBV (the “Issuer”) and ICTSI (the “Guarantor”) signed a SubscriptionAgreement with The Hong Kong and Shanghai Banking Corporation Limited (HSBC) andCitigroup Global Markets Limited (Citi) for the issuance of US$200,000,000 8.375 percentSubordinated Guaranteed Perpetual Capital Securities (the “Original Securities”). The OriginalSecurities confer a right to receive a return on the Original Securities (the “Distribution”) everyDistribution Payment Date as described in the terms and conditions of the Original Securities.These distributions are payable semi-annually in arrears on the Distribution Payment Dates ofeach year. However, the Issuer may, at its sole and absolute discretion, prior to any DistributionPayment Date, resolve to defer payment of all or some of the Distribution which would otherwisebe payable on that Distribution Payment Date subject to exceptions enumerated in the terms andconditions of the Original Securities. The Original Securities are perpetual securities in respect ofwhich there is no fixed redemption date but the Issuer may, at its option change the status of theSecurities or redeem the same on instances defined under its terms and conditions.
On April 29, 2011, the Board approved the terms and conditions of the Original Securities, whichwere subsequently issued on May 5, 2011. The net proceeds from the issue of the OriginalSecurities amounting to US$193.4 million were used for the development of greenfield projects,potential acquisitions and general corporate purposes.
On January 9, 2012, ICTSI tapped a further US$150.0 million (the “Further Securities”) of theOriginal Securities discussed in the preceding paragraphs, increasing the size to US$350.0 million.The Further Securities were issued on January 17, 2012. The Original and Further Securities arecollectively referred to as the “Securities”. The Further Securities were issued at a price of98.375 percent (plus interest accrued on the Securities from and including November 5, 2011 tobut excluding January 17, 2012). The net proceeds from the issue of the Further Securitiesamounting to US$143.6 million were used for the same purpose as the Original Securities.
The Securities were not registered with the Philippine SEC. The Securities were offered inoffshore transactions outside the United States in accordance with Regulation S under theU.S. Securities Act of 1933, as amended, and, subject to certain exceptions, may not be offered orsold within the United States. The Securities are traded and listed in the Singapore StockExchange.
The Securities are treated as a liability in the financial statements of the Issuer or RCBV since ithas the obligation to pay the accumulated distributions should the Guarantor declare dividends toits common stockholders. On the other hand, the Securities are treated as part of equityattributable to equity holders of the parent in the consolidated financial statements of the Groupbecause nothing in the terms and conditions of the Securities gives rise to an obligation of theGroup to deliver cash or another financial asset in the future as defined by PAS 32. However,should the Issuer decide to exercise its option to redeem the Securities, the Securities shall betreated as a financial liability from the date the redemption option is exercised. Should the Issueralso opt to not defer payment of distributions on a Distribution Payment Date, all distributions inarrears as at that date will be recognized as a financial liability until payment is made.

- 77 -
*SGVFS033016*
On January 29, 2015, RCBV issued US$300.0 million 6.25 percent Senior Guaranteed PerpetualCapital Securities unconditionally and irrevocably guaranteed by ICTSI at a price of99.551 percent or US$298.7 million. The new issue was partly used to finance the tenderedUS$230.0 million 8.375 percent Subordinated Guaranteed Perpetual Capital Securities (“OriginalSecurities”) at a tender price of 107.625 or US$247.5 million. The cash proceeds received byRCBV amounted to US$46.7 million, net of debt issuance cost. Exchange premium andunamortized debt issuance cost of the Original Securities amounting to US$23.2 million, wasdirectly charged against retained earnings as a result of the transaction. The transaction did nothave an impact on the 2015 consolidated statement of income of the Company and was treated asan equity transaction since the perpetual capital securities are treated as part of equity in the2015 consolidated balance sheet.
On August 26, 2015, RCBV issued US$450.0 million 5.50 percent Senior Guaranteed PerpetualCapital Securities (“New Securities”) unconditionally and irrevocably guaranteed by ICTSI. Thecash proceeds received by RCBV amounted to US$436.3 million, net of debt issuance cost, willbe used for refinancing, funding capital expenditures and general corporate purposes.
In July and August 2015, RCBV redeemed and cancelled a total of US$11.3 million of theSubordinated Guaranteed Perpetual Capital Securities.
On May 5, 2016, RCBV redeemed the remaining US$108.3 million of the US$350 millionOriginal and Further Securities and paid the accrued distributions amounting to US$4.5 million.The difference amounting to US$7.6 million between the total of the redemption price and accrueddistributions of US$112.8 million and the carrying amount of the remaining Original and FurtherSecurities of US$105.2 million was directly charged against retained earnings.
On October 3, 2016, RCBV tendered its US$300.0 million 6.25 percent and US$450.0 million5.50 percent Senior Guaranteed Perpetual Capital Securities for redemption at a price of106.75 and 105.75, respectively. On October 20, 2016, RCBV redeemed a total ofUS$345.5 million of the tendered securities and paid the associated accrued distributions ofUS$9.3 million. Together with the redemption, RCBV issued US$375.0 million 4.875 percentSenior Guaranteed Perpetual Capital Securities unconditionally and irrevocably guaranteed byICTSI at a price of 99.225. The new issue was used to finance the redemption and payment ofaccrued distributions of the tendered securities. The difference amounting to US$41.2 millionbetween the redemption price of US$376.2 million, including accrued distributions ofUS$9.3 million, and the carrying value of the redeemed perpetual capital securities amounting toUS$335.0 million was directly charged to retained earnings. The amount equivalent to theproceeds from the new issue, net of debt issuance costs, was recognized as additional perpetualcapital securities.
On January 10, 2018, the Board approved the principal terms and conditions and issuance of theUS$350.0 million 5.875 percent fixed-for-life Senior Guaranteed Perpetual Capital Securities (the“New Securities”). The New Securities were unconditionally and irrevocably guaranteed byICTSI.
On January 11, 2018, the Board approved the issuance of additional Senior Guaranteed PerpetualCapital Securities amounting to US$50.0 million (“Additional Securities”) which wasconsolidated and formed a single series with the New Securities initially offered onJanuary 10, 2018. The Additional Securities were also unconditionally and irrevocablyguaranteed by ICTSI.

- 78 -
*SGVFS033016*
The cash proceeds received by RCBV from the issuance of the New and Additional Securitiesamounted to US$392.3 million, net of debt issuance costs, which shall be used for the financing ofacquisitions and capital expenditures and for general corporate purposes.
RCBV paid distributions totaling US$34.2 million, US$41.6 million and US$60.3 million to theholders of the Securities in 2016, 2017 and 2018, respectively (see Note 14.5). Interest expense onPerpetual Capital Securities, which represents cumulative distributions to holders of PerpetualCapital Securities, amounted US$46.3 million, US$41.6 million and US$63.9 million for the yearsended December 31, 2016, 2017 and 2018. However, the interest expense has not beenrecognized in the consolidated statements of income but instead directly charged against retainedearnings since the Perpetual Capital Securities are presented as equity attributable to equityholders of the parent. For purposes of computing for earnings per share, the cumulativedistributions to holders of Perpetual Capital Securities are deducted from net income attributableto equity holders of the parent.
14.7 Other Comprehensive Loss - Net
The details of other comprehensive net loss, net of applicable tax, as at December 31 are asfollows:
2016 2017 2018Cumulative translation adjustments* (see Note 3.3) (US$291,425,330) (US$259,625,939) (US$314,373,993)Unrealized mark-to-market gain (loss) on derivatives
(see Notes 26.4 and 26.6) 3,682,715 247,337 (1,534,126)Unrealized mark-to-market gain on AFS investments
(see Note 9) 952,022 586,788 979,860Business combination revaluation reserve 609,969 609,969 609,969Share of other comprehensive gain (loss) of associates
(see Note 8) – 988,488 (900,753)Actuarial gains on defined benefit plans (see Note 23) 735,260 570,928 466,220
(US$285,445,364) (US$256,622,429) (US$314,752,823)*Cumulative translation adjustments arise from the change in functional currency of the Parent Company and some of itssubsidiaries’ translation of foreign operations.
15. Long-term Debt
15.1 Outstanding Balances and Maturities
A summary of outstanding balance of long-term debt (net of debt issuance costs) as atDecember 31 is presented below:
2016 2017 2018US dollar-denominated notes (see Note 15.2.1) US$179,228,914 US$179,241,377 US$179,255,736US dollar-denominated term loans (see Note 15.2.2) 210,314,320 217,199,722 70,664,215Foreign currency-denominated loans (see Note 15.2.4) 190,719,874 282,423,146 263,513,330US dollar-denominated medium-term notes
(see Note 15.2.5) 749,502,820 753,553,631 757,902,011Revolving credit facility (see Note 15.2.6) 15,000,000 − −
1,344,765,928 1,432,417,876 1,271,335,292Less current portion 18,485,813 22,149,388 50,848,341
US$1,326,280,115 US$1,410,268,488 US$1,220,486,951

- 79 -
*SGVFS033016*
The balances of and movements in unamortized debt issuance costs, premium and discounts, netof the recognized fair value of prepayment option as at and for the years ended December 31 areshown below:
2016 2017 2018Balance at beginning of year US$57,110,867 US$64,810,450 US$58,729,772Debt issuance costs during the year 14,437,862 623,485 −Amortization during the year (6,344,213) (6,626,331) (6,366,709)Write-off due to prepayment of long-term
debt (see Notes 15.2.2 and 20.3) − − (7,034,590)Translation adjustments (394,066) (77,832) (961,137)Balance at end of year US$64,810,450 US$58,729,772 US$44,367,336
Amortization of debt issuance costs is presented as part of “Interest expense and financing chargeson borrowings” in the consolidated statements of income.
Principal maturities of long-term debt (gross of unamortized debt issuance cost) as atDecember 31, 2018 were as follows:
Amount2019 US$52,429,1142020 234,777,4492021 32,159,0492022 25,063,1362023 onwards 971,273,880
US$1,315,702,628
15.2 Details and Description
15.2.1 US Dollar-denominated Notes
On March 10, 2010, ICTSI signed a Subscription Agreement with HSBC and JP MorganSecurities, Ltd. for the issuance of ten-year senior notes (the “Original Notes”). The OriginalNotes were issued on March 17, 2010 with an aggregate principal amount of US$250.0 millionmaturing on March 17, 2020. The Original Notes bear interest at a fixed rate of 7.375 percent, netof applicable taxes, payable semi-annually in arrears.
On April 29, 2010, ICTSI tapped a further US$200.0 million (the “Further Notes”) of the OriginalNotes discussed in the preceding paragraph, increasing the size to US$450.0 million. The FurtherNotes were issued on May 6, 2010. The Original and Further Notes are collectively referred to asthe “Notes”. The Further Notes bear interest at the fixed rate of 7.375 percent, net of applicabletaxes, and was set at a price of 102.627 for an effective yield of 7.0 percent.
The net proceeds of the Notes amounting to US$448.1 million were used to fund ICTSI’sinvestments in existing and new terminal construction activities, refinance some of its existingdebt and for other general corporate purposes.
The Notes were not registered with the Philippine SEC. The Notes were offered in offshoretransactions outside the United States in reliance on Regulation S under the Securities Act of1933, as amended, and, subject to certain exceptions, may not be offered or sold within the UnitedStates. The Notes are traded and listed in the Singapore Stock Exchange.

- 80 -
*SGVFS033016*
On September 17, 2013, ITBV exchanged newly issued US$207.5 million 5.875 percent Notesdue 2025 for ICTSI’s US$178.9 million 7.375 percent Notes due 2020. The Notes due 2020 werethen reduced from US$450.0 million to US$271.1 million. The Notes due 2025 were issued byITBV under its US$1.0 billion Medium Term Note Programme (the “MTN Programme”), and areunconditionally and irrevocably guaranteed by ICTSI (see Note 15.2.5).
On January 29, 2015, a total of US$117.5 million 5.875 percent Notes due 2025 from the MTNProgramme were issued at a price of 102.625 and US$102.6 million of which was used toexchange with holders of US$91.8 million 7.375 percent Notes due 2020. The cash proceedsreceived by ITBV amounted to US$11.6 million, net of debt issuance cost. These new Notes wereconsolidated and formed a single series with the US$282.5 million 5.875 percent guaranteed Notesdue 2025 issued on September 17, 2013 and April 30, 2014 (see Note 15.2.5).
As at December 31, 2018, the outstanding balance of the Notes due 2020 amounted toUS$179.3 million, net of debt issuance costs.
15.2.2 US Dollar-denominated Term Loans
CMSA. On October 21, 2015, CMSA signed a US$260.0 million Project Finance Facility withInternational Finance Corporation (IFC) and Inter-American Development Bank (IADB), andparticipated by Standard Chartered Bank (SCB) and KfW Ipex Bank.
The CMSA Project (the Project) is for the development and operation of a Specialized Containerterminal at the Port of Manzanillo in Manzanillo, Mexico. The terminal will have a capacity of2.2 million TEUs when completely built. The development will be done in three phases with phaseone creating capacity of 750,000 TEUs. Phase two, which is expected to be completed by 2020,will increase the terminal’s capacity to 1.4 million TEUs.
The financing package, which has a tenor of 12 years and a long availability period of four years,will help CMSA finance the completion of phases one and two of the Project. Interest is payablesemi-annually based on floating interest rate computed at 6-month London Interbank Offered Rate(LIBOR) plus loan spread with a weighted average of 2.80 percent.
In accordance with the project finance loan documents, CMSA is required to maintain specialpurpose debt service and operating and maintenance reserve accounts to guarantee the debtpayments and project costs disbursements and to pledge certain major port equipment as security(see Notes 6 and 9).
On December 23, 2015, CMSA availed US$95.0 million from the US$260.0 million facility. OnNovember 15, 2016, CMSA availed an additional US$86.0 million from the same facility. In2017, CMSA paid US$6.8 million of the loans. Upon prepayment of the loan on May 15, 2018,the related outstanding debt issuance costs of US$7.0 million was written off and charged to profitand loss as “Other expenses” in the 2018 consolidated statement of income (see Notes 15.1and 20.3)
BCT. On October 27, 2011, BCT entered into a facilities agreement with Bank Polska KasaOpieki S.A. (“Bank Polska”) under which Bank Polska agreed to provide (i) term loan facility upto US$9.2 million, (ii) a capital expenditure facility up to US$36.3 million to finance or refinanceproject costs and fees, and (iii) an overdraft facility up to US$1.0 million to finance workingcapital requirements. Both the term loan and capital expenditure facility bear interest at2.65 percent over LIBOR. The utilization under the overdraft facility will bear interest at1.75 percent over LIBOR or Warsaw Interbank Offered Rate (WIBOR), as the case may be.

- 81 -
*SGVFS033016*
WIBOR is determined by the Financial Markets Association-ACI Polska for utilizations requestedin Polizh Zloty.
In 2012, BCT availed: (i) US$7.9 million from the term loan facility; and (ii) US$0.9 million fromthe capital expenditure facility with Bank Polska, as discussed in the preceding paragraph. In2013 and 2014, BCT availed US$2.0 million and US$10.4 million from the capital expenditurefacility, respectively.
The purpose of the term loan facility under the facilities agreement is to refinance all existingfinancial indebtedness under the 2004 loan agreement. The 2011 loan agreement provided forsubstantially the same security arrangement and restrictions on the payment of dividends to ICTSI,as provided for in the 2004 loan agreement. One of the conditions precedent to any borrowingunder the facilities agreement is for BCT to confirm the availability of the grant (the “EU Grant”)by the Centrum Unijnych Projektow Transportowych (CUPT), a Polish grant authority, in anamount not lower than PLN50.0 million (approximately equivalent to US$16.2 million) to partlyfinance the cost of BCT’s projected capital expenditure requirements.
On March 29, 2012, BCT and CUPT signed the EU Grant whereby CUPT would grant BCT asubsidy amounting to US$17.3 million (PLN53.9 million) and on October 21, 2013, BCT andCUPT signed a second EU Grant whereby CUPT would grant BCT a subsidy amounting toUS$4.8 million (PLN14.6 million). The confirmation of the availability of the EU Grant is acondition precedent to any borrowing under the facilities agreement with Bank Polska, asdiscussed above. In December 2015, BCT finalized capital expenditure projects supported by theEU Grant with an estimated total of US$19.5 million (see Note 16). In July 2014, BCT enteredinto a term loan facility agreement for US$36.0 million with HSBC to refinance its current loanwith Bank Polska and finalize capital expenditure projects supported by the EU Grant with anestimated total of US$20.0 million. The new term loan bore interest at 1.70 percent over LIBOR.In December 2015, BCT prepaid in full its outstanding HSBC loans totaling US$29.8 million andthe related debt issuance cost and commitment fees totaling US$0.4 million were derecognizedand charged to the 2015 consolidated statement of income.
CGSA. In 2014, CGSA availed of two-year unsecured term loans with local banks, namely,Banco Bolivariano and Banco De Guayaquil (“Local Banks in Ecuador”) totaling US$4.5 millionto finance capital expenditures and working capital requirements. The term loans with localbanks in Ecuador bear a fixed interest rate of 7.5 percent with the principal payable in monthlyinstallments. In September 2015, CGSA obtained two-year unsecured loans from Banco DelPacifico amounting to US$2.0 million at a fixed interest rate of 8.75 percent and BancoBolivariano amounting to US$2.0 million at a fixed interest rate of 8.83 percent. InOctober 2015, CGSA availed of a three-year unsecured term loan with BBP Bank, S.A.amounting to US$4.0 million at a fixed interest rate of 6.78 percent. In 2018, CGSA paidUS$0.9 million of the loans. The loan was fully paid in September 2018.
In January and February 2016, CGSA obtained two-year fixed-term loans with a total ofUS$0.6 million from Banco del Pacifico at an interest rate of 8.75% per annum. The loans werefully paid in April 2016.
On March 29, 2016, CGSA (as “Borrower”), Metropolitan Bank and Trust Company (as “Lender”or “MBTC”) and ICTSI (as “Surety”) signed a loan agreement which consists of two tranches ofUS$32.5 million (Tranche I) and US$7.5 million (Tranche II) with floating interest rates.Tranche I has a final maturity in March 2021 while Tranche II matures in May 2017. In 2016,CGSA availed of loans with a total amount of US$40.0 million. Portion of the proceeds of theseloans was used to refinance the unsecured term loans of CGSA amounting to US$9.2 million in

- 82 -
*SGVFS033016*
April 2016. In 2016 and 2017, CGSA paid a total amount of US$4.5 million and US$3.0 millionof the loan under Tranche II. In 2017 and 2018, CGSA has paid a total amount of US$7.6 millionand US$7.6 million of the loan under Tranche I, respectively. As at December 31, 2018, theoutstanding balance of the loan with MBTC amounted to US$17.2 million.
OPC. On July 11, 2017, OPC (as “Borrower”), Metropolitan Bank and Trust Company (as“Lender”) and ICTSI (as “Surety”) signed a loan agreement amounting to US$77.0 million withfloating interest rate and maturity date of July 2020. Proceeds of the loan was used to financecapital expenditures. OPC availed a total of US$24.5 million in 2017 and US$15.0 million in2018 from the term loan facility. On April 26, 2018, US$25.0 million of the loan facility wasvoluntarily cancelled, reducing such facility from US$77.0 million to US$52.0 million. OnJune 21, 2018 and September 11, 2018, the amount of the facility was further reduced toUS$47.0 million and US$39.5 million, respectively. OPC prepaid US$10.0 million onOctober 20, 2018. As at December 31, 2018, the outstanding balances of the loan amounted toUS$29.5 million. OPC prepaid US$10.0 million on January 20, 2019.
IDRC. On October 9, 2018, IDRC availed of a four-year term loan with Rawbank RDCamounting to US$25.0 million at a fixed interest rate of 8.00 percent per annum. In 2018, IDRChas paid US$1.0 million of the loan. As at December 31, 2018, the outstanding balance of theloan amounted to US$24.0 million.
15.2.3 US Dollar-denominated Securities
On September 23, 2011, CGSA engaged in a fiduciary contract as originator for a securitizationarrangement under which it transferred its receivables and future operating revenues from selectedcustomers such as shipping lines and banana exporters (the “securitized assets”) to a specialpurpose trust administered by Administradora de Fondos de Inversión y Fideicomisos FuturaFuturfid S.A. (formerly named Administradora de Fondos de Inversion Y Fideicomisos BG S.A.)as trustee and handling agent. On October 24, 2011, the special purpose trust was officiallyapproved to issue securities in three series against the securitized assets in the aggregate principalamount of US$60.0 million with each series to mature within five years from date of issue.Series A bears variable interest at the rate of 2.5 percent plus the reference interest rate for savingsposted by Central Bank of Ecuador subject to a readjustment every quarter, while Series B andSeries C bear interest at a fixed rate of 7.5 percent. Principal and interest are payable quarterly foreach series.
The proceeds of the securitization issue, which were remitted to CGSA as consideration for thesecuritized assets, were used to finance capital expenditures and expansion of port operations. Onthe other hand, regular cash flows from the securitized assets were used by the special purposetrust to pay principal and interest due to holders of the securities and other expenses. Any excessin the cash flows remaining with the special purpose trust, after all obligations to holders ofsecurities and relevant third parties are fully paid, will revert to CGSA as the originator. Thesecurities issued pursuant to the securitization agreement are currently registered with and tradedin the Ecuadorian stock market.
As at December 31, 2011, CGSA has received proceeds from the issuance and placement ofsecurities under the securitization agreement amounting to US$55.0 million, net of debt issuancecost of US$0.8 million. In February 2012, CGSA placed the balance of the US$60.0 millionsecurities, through a special purpose trust approved in 2011, amounting to US$4.2 million. CGSAhas paid US$12.8 million in 2015 and US$13.8 million in 2016 of the outstanding securities. Thesecurities were fully paid on 2016.

- 83 -
*SGVFS033016*
15.2.4 Foreign Currency-denominated Loans
PICT. On July 11, 2011, PICT signed a five-year Rs.2.5 billion (equivalent to US$29.1 million)Agreement for Financing on Mark-up Basis (Term Finance) with Faysal Bank Limited. The loancarries mark-up at the rate of six months Karachi Interbank Offered Rate (KIBOR) plus1.75 percent and is secured against all present and future plant machinery, tools and equipment(see Note 6). Principal is repayable in nine equal semi-annual installments commencing inJuly 2012. Proceeds of the loan were partially used to fully pay the loans with IFC andOrganization of the Petroleum Exporting Countries Fund for International Development (OFID)amounting to Rs.2.4 billion (US$27.9 million) on July 22, 2011, which were originally maturingin January 2018. The loan with remaining balance of Rs.1.5 billion was refinanced by HabibBank Limited. The new loan carries a mark-up at the rate of six months Karachi Interbank OfferedRate (KIBOR) plus 0.75 percent and is secured against all present and future plant machinery,tools and equipment (see Note 6). Principal is repayable in five equal semi-annual installmentscommencing in June 2015. The loans were fully paid on June 2, 2017.
AGCT. In March 2013, AGCT signed the first part of a ten-year loan agreement forUS$8.1 million (EUR6.2 million) with Raiffeisenbank Austria d.d. to partly finance the purchaseof port equipment intended for the Brajdica Container Terminal. The principal is repayable in112 monthly installments from January 31, 2014 up to April 30, 2023. Interest is payable monthlybased on floating interest rate computed at 1-month Euro Interbank Offered Rate plus a spread of4.2 percent. The loan is secured by AGCT’s port equipment (see Note 6).
On July 22, 2013, AGCT signed the second part of the same loan agreement for US$5.6 million(EUR4.4 million). Principal is repayable in 120 monthly installments from January 31, 2014 up toDecember 31, 2023. Interest is payable monthly based on floating interest rate computed at1-month Euro Interbank Offered Rate plus a spread of 4.2 percent. The loan is secured byAGCT’s port equipment (see Note 6). On July 1, 2016, the spread on the interest of AGCT’sloans was reduced from 4.2 percent to 3.4 percent. As at December 31, 2018, the total outstandingbalance of the loans amounted to US$5.8 million (EUR5.1 million).
On April 6, 2016, AGCT signed a loan agreement for US$1.1 million (EUR 0.95 million).Principal is repayable in 12 monthly installments from November 30, 2016 up toOctober 31, 2017. Interest is payable monthly based on fixed interest rate of 3.90%. AGCT fullypaid the loan on August 31, 2016.
On April 2018, AGCT signed a loan agreement for US$0.7 million (EUR0.6 million). Principal isrepayable in 15 installments starting August 31, 2018 up to October 31, 2019. Interest is payablemonthly based on fixed interest rate of 2.50%. In 2018, AGCT, paid US$0.3 million(EUR0.2 million) of the loans. As at December 31, 2018, the total outstanding balance of the loanamounted to US$0.4 million (EUR0.4 million).
YICT. The Company acquired, through the consolidation of YICT, the long-term loan withoutstanding balance US$35.8 million (RMB222.2 million) as at December 31, 2014. Thelong-term loan with Agricultural Bank of China (ABC), which was availed principally to financethe development project related to the construction of the container terminal, bears an interest rateof 6.15 percent per annum and matured on December 7, 2014. On December 4, 2014, YICTsigned a two-year loan agreement to refinance the loan bearing a lower interest rate of 6.0 percentper annum, which was repriced at 4.75 percent per annum in 2015.

- 84 -
*SGVFS033016*
Upon maturity of the loan from ABC in December 2016, YICT obtained a US$21.6 million(RMB150.0 million) short-term loan from YPH at an interest rate of 4.35 percent per annum and amaturity date of January 25, 2017. The loan was used to refinance YICT’s loan with ABC. OnJanuary 12 and March 1, 2017, YICT prepaid a total amount of US$3.0 million(RMB20.0 million) and the balance of US$18.9 million (RMB130.0 million) was renewed with aninterest rate of 4.50 percent per annum and matured on April 30, 2017 (see Note 17). OnApril 26, 2017, YICT obtained a US$21.8 million (RMB150.0 million) loan from ABC payable ininstallments with a final maturity on November 21, 2023 to refinance the maturing loan with YPH.Interest is based on the interest rate published by People's Bank of China (PBOC) less 5.00 percentof such base rate. The floating rate is subject to adjustment every twelve months. In 2017 and2018, YICT paid US$8.9 million (RMB60.0 million) and US$6.0 million (RMB40.0 million) ofthe loans. The outstanding balance of the loan amounted to US$7.3 million (RMB50.0 million) asat December 31, 2018.
VICT. On July 15, 2016, VICT signed the syndicated project finance facilities with internationaland regional banks, namely: Citibank N.A., KFW IPEX-Bank, Standard Chartered Bank asMandated Lead Arrangers and Bookrunners, Bank of China Limited, DBS Bank Ltd., InvestecBank PLC as Mandated Lead Arrangers, and Cathay United Bank as Lead Arranger, for principalamount of US$300.0 million (AUD398.0 million) with interest rates based on Australian BankBill Swap Reference Rate (bid) (BBSY) plus average margin of 3.1% per annum and maturitiesuntil 2023, 2026 and 2031. VICT is required to maintain a special purpose debt service account inaccordance with the project finance loan documents and the finance facilities are secured againstIOBV’s shares in VICT, all present assets of VICT, and will be secured against future assets ofVICT, among others (see Notes 6 and 9).
In 2016, 2017 and 2018, VICT availed of loans from the facilities amounting to US$196.9 million(AUD266.0 million), US$64.4 million (AUD84.0 million) and USD$20.9 million(AUD28.0 million), respectively. In 2018, VICT paid US$8.7 million (AUD11.6 million) of theloans. As at December 31, 2018, the total outstanding balance of the loans amounted toUS$250.0 million (AUD354.7 million), net of debt issuance costs.
ICTSI Middle East DMCC. On January 9, 2019, ICTSI Middle East DMCC, as borrower, andICTSI, as guarantor, signed a term loan facility agreement with Citigroup Global Markets AsiaLimited and Standard Chartered Bank, the original mandated lead arrangers and bookrunners, forthe principal amount of EUR260.0 million (US$297.6 million) with interest rate based on EuroInterbank Offer Rate (EURIBOR) plus an agreed margin and maturity on December 20, 2022.The term facility agreement was entered into pursuant to the Loan Facility Programme Agreementdated July 24, 2014 between ICTSI Global Finance B.V. as the borrower, ICTSI as the guarantor,and The Bank of New York Mellon, Singapore Branch as the trustee (“Loan Programme”). ICTSIMiddle East DMCC acceded to the Loan Programme as an additional borrower and an additionalobligor thereunder.
On January 10, 2019, ICTSI Middle East DMCC has fully availed the EUR260.0 million from thefacility.

- 85 -
*SGVFS033016*
15.2.5 US Dollar-denominated Medium Term Note Programme (the “MTN Programme”)
On January 9, 2013, ITBV, a majority owned subsidiary through ICTSI Ltd., established the MTNProgramme that would allow ITBV from time to time to issue medium term notes (MTN),unconditionally and irrevocably guaranteed by ICTSI. The aggregate nominal amount of theMTN outstanding will not at any time exceed US$750.0 million (or its equivalent in othercurrencies), subject to increase as described in the terms and conditions of the ProgrammeAgreement. This was increased to US$1.0 billion in August 2013.
Also, on January 9, 2013, ITBV and ICTSI signed a Subscription Agreement with HSBC andUBS AG, Hong Kong Branch, for the issuance of ten-year US$300.0 million guaranteed MTN(the “Original MTN”) under the MTN Programme. The Original MTN were issued onJanuary 16, 2013 to mature on January 16, 2023 at a fixed interest rate of 4.625 percent, net ofapplicable taxes, and were set at a price of 99.014 and payable semi-annually in arrears.
Moreover, on January 28, 2013, ITBV and ICTSI signed a Subscription Agreement with UBS AG,Hong Kong Branch, for the issuance of an additional ten-year US$100.0 million guaranteed MTNunder the MTN Programme (the “MTN Tap”) to form a single series with the Original MTN asdiscussed in the preceding paragraph. The MTN Tap were issued on February 4, 2013 to matureon January 16, 2023 at a fixed interest rate of 4.625 percent, net of applicable taxes, and were setat a price of 101.25 and payable semi-annually in arrears.
The aggregate net proceeds of the MTN amounting to US$393.8 million were used to refinancesome of ICTSI’s existing debt and for other general corporate purposes.
In June 2013, ICTSI purchased a total of US$6.0 million of ITBV’s US$400.0 million MTN atUS$5.7 million.
On April 25, 2014, the Board of ICTSI confirmed, ratified and approved the issuance of additionalnotes under the US$1.0 billion medium term note programme of ITBV, in the aggregate nominalamount of US$75.0 million. These new notes were consolidated and formed a single series withthe US$207.5 million, 5.875 percent guaranteed Notes due 2025 issued on September 17, 2013(see Note 15.2.1). The said notes were issued on April 30, 2014.
On January 29, 2015, a total of US$117.5 million 5.875 percent Notes due 2025 from the MTNProgramme were issued at a price of 102.625 and US$102.6 million of which was used toexchange with holders of US$91.8 million 7.375 percent Notes due 2020. The cash proceedsreceived by ITBV amounted to US$11.6 million, net of debt issuance cost. The 2025 Notes wereissued by ITBV under its US$1.0 billion MTN programme, and are unconditionally andirrevocably guaranteed by ICTSI. These new Notes were consolidated and formed a single serieswith the US$282.5 million 5.875 percent guaranteed Notes due 2025 issued onSeptember 17, 2013 and April 30, 2014.
As at December 31, 2018, outstanding notes under the programme amounted to US$757.9 million,which includes the US$207.5 million 5.875 percent Notes due 2025 and US$117.5 million5.875 percent Notes due 2025 discussed in Note 15.2.1.
The MTN were not registered with the Philippine SEC. The MTN were offered in offshoretransactions outside the United States in accordance with Regulation S under the Securities Act of1933, as amended, and, subject to certain exceptions, may not be offered or sold within the UnitedStates. The MTN are traded and listed in the Singapore Stock Exchange.

- 86 -
*SGVFS033016*
15.2.6 Revolving Credit Facility Programme
IGFBV. On July 24, 2014, the Board of ICTSI approved the establishment of a loan facilityprogramme pursuant to which IGFBV, may from time to time enter into one or more loan facilitieswith one or more lenders under the said programme, to be guaranteed by ICTSI. In connectionwith the establishment of the said programme, the Board also approved the first loan facility underthe programme with IGFBV as the borrower and ICTSI as the guarantor. The loan facility is arevolving credit facility with a principal amount of US$350.0 million and a tenor of five yearsfrom signing date, July 24, 2014. In 2015, IGFBV has availed a total of US$100.0 million fromthe US$350.0 million five-year revolving credit facility bearing interest ranging from 2.13 to2.14 percent per annum. In August 2015, IGFBV prepaid the US$100.0 million loan.
In April and June 2016, IGFBV availed of loans amounting to US$150.0 million andUS$10.0 million, respectively, from the US$350.0 million five-year revolving credit facilitybearing interest ranging from 2.39 to 2.71 percent per annum. In August, November andDecember 2016, IGFBV partially paid loans availed in 2016 totaling US$145.0 million. Theremaining balance of US$15.0 million was fully paid on May 31, 2017.
The related debt issuance cost of the revolving facility amounting to US$7.1 million was beingamortized over five years (see Note 9) until the revolving credit facility was cancelled onJune 8, 2017. As a result of the cancellation, the unamortized portion of the costs of securing theloan facility amounting to US$3.0 million was charged to profit or loss and recognized as “Otherexpenses” in the 2017 consolidated statement of income (see Note 20.3). Commitment feesamounting to US$2.2 million in 2016 and US$1.2 million in 2017, representing 0.78 percent perannum of the amount of undrawn facility, is recorded as part of “Interest expense and financingcharges on borrowings” account in the consolidated statements of income.
15.3 Loan Covenants and Capitalized Borrowing Costs
The loan agreements with banks impose certain restrictions with respect to corporatereorganization, disposition of all or a substantial portion of ICTSI’s and subsidiaries’ assets,acquisitions of futures or stocks, and extending loans to others, except in the ordinary course ofbusiness. ICTSI is also required to comply with a specified financial ratio relating to their debt toEBITDA up to 4 times when incurring additional debt.
There was no material change in the covenants related to the Group’s long-term debt. As atDecember 31, 2018, ICTSI and subsidiaries were in compliance with their loan covenants exceptfor VICT whose Debt Service Coverage Ratio requirement was not met but having beenirrevocably waived by the creditors, no event of default has occurred.
Interest expense, net of amount capitalized as intangible assets and property and equipment,presented as part of “Interest expense and financing charges on borrowings” account in theconsolidated statements of income, amounted to US$68.0 million in 2016, US$93.4 million in2017 and US$93.9 million in 2018 (see Notes 5 and 6).

- 87 -
*SGVFS033016*
16. Other Noncurrent Liabilities
This account consists of:2016 2017 2018
Accrued rental (see Note 18) US$64,575,728 US$100,323,772 US$147,173,229Government grant (see Note 15.2.2) 15,741,736 13,278,509 10,815,283Pension liabilities (see Note 23) 7,487,607 9,477,311 9,240,574Derivative liability (Note 26) 122,736 2,441,379 2,220,022Finance lease payable 146,843 725,060 893,521Accrued taxes and others (see Note 18) 2,893,477 9,559,077 9,179,182
US$90,968,127 US$135,805,108 US$179,521,811
Accrued RentalThe accrued rental of VICT amounted to US$149.6 million (AUD207.5 million),US$100.3 million (AUD128.5 million) and US$147.2 million (AUD208.8 million) as atDecember 31, 2016, 2017 and 2018, respectively, calculated using the straight-line method fromthe inception of the contract in June 2014. The current portion of the accrued rental of VICTclassified under “Accounts payable and other current liabilities” account amounting toUS$85.0 million (AUD117.9 million) as at December 31, 2016 and nil as of December 31, 2017and 2018 (see Note 18).
Government GrantOn March 29, 2012, BCT and CUPT, a Polish grant authority, signed the EU Grant wherebyCUPT would grant BCT a subsidy amounting to US$17.3 million (PLN53.9 million) and onOctober 21, 2013, BCT and CUPT signed a second EU Grant whereby CUPT would grant BCT asubsidy amounting to US$4.8 million (PLN14.6 million). The confirmation of the availability ofthe EU Grant was a condition precedent to any borrowing under the facility agreement of BCT. InDecember 2015, BCT finalized capital expenditure projects supported by the EU Grant with anestimated total of US$19.5 million (see Note 15.2.2). As at December 31, 2018, BCT has availeda total of US$19.5 million of the EU Grant. The EU Grant is treated as deferred income and isamortized over the duration of the existing concession agreement ending on May 31, 2023. Theunamortized deferred income from government grant amounted to US$15.7 million,US$13.3 million and US$10.8 million as at December 31, 2016, 2017 and 2018, respectively.Amortization of deferred income include under “Other income” amounted to US$2.5 million foreach of the years 2016, 2017 and 2018 (see Note 20.1).
Accrued Taxes and OthersAccrued taxes and others as at December 31, 2018 include the noncurrent portion of customsduties payable in relation to the importation of port equipment in CGSA amounting toUS$6.9 million. The current portion amounting to US$1.0 million as at December 31, 2018 isincluded in “Accounts payable and other current liabilities” account under accrued output andother taxes (see Note 18).

- 88 -
*SGVFS033016*
17. Loans Payable
Loans payable are unsecured loans obtained by ICTSI and several subsidiaries.
In April 2015, CGSA availed one-year loans from Banco Bolivariano and Banco Guayaquiltotaling US$6.0 million at fixed interest rate of 8.0 percent per annum. In February 2016, CGSAobtained short-term unsecured US$ loans with a total of US$3.5 million from Banco GuayaquilS.A., Citibank and Banco Bolivariano at annual fixed interest rates ranging from 8.89 percent to9.12 percent. The short-term loans were fully paid in 2016.
On May 17, 2016, ICTSI availed of a US$30.2 million (P=1.4 billion) short-term loan withMetropolitan Bank and Trust Company at an annual interest rate of 2.5 percent. On July 7, 2016and October 7, 2016, ICTSI fully paid the short-term loan.
On November 28, 2016, OPC availed of a US$15.0 million short-term loan from MetropolitanBank and Trust Company. The loan bears interest at prevailing market rate and matures onNovember 23, 2017. On July 26, 2017, OPC prepaid the US$15.0 million short-term loan.
On December 5, 2016, YICT obtained a US$21.6 million (RMB150.0 million) short-term loanfrom YPH at an interest rate of 4.35 percent per annum and a maturity date of January 25, 2017.The loan was used to refinance YICT’s maturing loan with ABC (see Note 15.2.4). OnJanuary 12, 2017 and March 1, 2017, YICT prepaid a total amount of US$3.0 million(RMB20.0 million) and the balance of US$18.9 million (RMB130.0 million) was renewed with aninterest rate of 4.50 percent per annum and matured on April 30, 2017. On April 26, 2017, YICTobtained a US$21.8 million (RMB150.0 million) loan from ABC payable in installments with afinal maturity on November 21, 2023 to refinance the maturing loan with YPH. Interest is basedon the interest rate published by PBOC less 5.00 percent of such base rate. The floating rate issubject to adjustment every twelve months (see Note 15.2.4).
In 2017, BCT availed loans from its overdraft facility with HSBC Bank Polska S.A with interestbased on prevailing market rate. In 2018, BCT paid a total amount of US$1.3 million of the loanfrom its overdraft facility and availed additional loans amounting to US$3.3 million. Theoutstanding balance of the loan amounted to US$4.0 million as at December 31, 2018.
On March 30, 2017, CGSA availed one-year loans from Citibank, Banco Bolivariano and BancoGuayaquil totaling to US$8.5 million at prevailing market rates. In 2017, CGSA paid a totalamount of US$6.4 million. The loans were fully paid in March 2018.
On May 15, 2017, ICTSI availed of short-term loans from The Bank of Tokyo-Mitsubishi UFJ,Ltd. (BTMU), Citibank N.A. (Citibank), HSBC, and SCB totaling to US$55.0 million withinterest based on prevailing market rate and maturity date of August 11, 2017. These loans wererenewed to mature on February 9, 2018. The loans from Citibank, HSBC and SCB were fullypaid on January 23, 2018 and the loan from BTMU was fully paid on February 9, 2018.
On April 10, 2018, CGSA availed of a short-term loan from Citibank N.A. Ecuador amounting toUS$6.0 million with interest based on prevailing market rate and maturity date of April 5, 2019.The loan was fully paid on May 30, 2018.
On April 13, 2018, SPICTL and MITL obtained a loan facility with Australia and New ZealandBanking Group (PNG) Limited amounting to US$31.1 million (PGK101.0 million) andUS$25.2 million (PGK82.0 million), respectively, with interest at prevailing market rate and amaturity date of six months from first drawdown date. In April 2018 and May 2018, SPICTL andMITL obtained loans amounting to US$18.3 million (PGK60.2 million) and US$14.2 million

- 89 -
*SGVFS033016*
(PGK46.7 million). On October 26, 2018, the loan facilities were extended for another six monthsat a reduced amount of US$22.3 million (PGK75.0 million) for SPICTL and US$16.4 million(PGK55.0 million) for MITL. The outstanding loans as at December 31, 2018 of US$17.9 million(PGK60.2 million) for SPICTL and US$13.9 million (PGK46.7 million) for MITL were alsoextended for another six months up to April 18, 2019.
Interest expense incurred related to these loans payable amounted to US$0.7 million in 2016,US$0.4 million in 2017 and US$1.1 million in 2018.
18. Accounts Payable and Other Current Liabilities
This account consists of:
2016 2017 2018Trade (see Notes 20.3 and 22.1) US$200,324,689 US$119,394,482 US$139,395,889Accrued expenses: Output and other taxes (see Note 16) 34,693,099 53,313,749 72,475,917 Salaries and benefits 21,413,326 22,790,520 25,596,903 Interest (see Notes 15 and 17) 22,905,888 23,497,213 22,767,344 Others 15,596,870 16,272,269 19,412,397Provisions for claims and losses
(see Notes 20, 24 and 25) 36,587,263 29,821,998 20,278,993Customers’ deposits 11,106,128 8,592,074 7,987,562Dividends payable 3,203,531 2,459,164 1,080,917Finance lease payable 738,489 180,898 270,516Others 1,139,803 244,052 53,611
US$347,709,086 US$276,566,419 US$309,320,049
Trade payables are noninterest-bearing and are generally settled on 30-60 day terms. Thisincludes the current portion of the accrued rental of VICT amounting to US$85.0 million(AUD117.9 million) as at December 31, 2016 and nil as of December 31, 2017 and 2018.
Provisions for claims and losses pertain to estimated probable losses in connection with legalcases and negotiations involving cargo, labor, contracts and other issues. The movements in thisaccount follow:
2016 2017 2018Balance at beginning of year US$13,322,197 US$36,587,263 US$29,821,998Provision during the year (see Note 24.21) 25,613,823 15,959,347 5,100,991Settlement and reversal during the year
(see Note 20.3) (3,434,325) (23,258,553) (13,597,144)Translation adjustment 1,085,568 533,941 (1,046,852)Balance at end of year US$36,587,263 US$29,821,998 US$20,278,993
19. Share-based Payment Plan
Certain officers and employees of the Group receive remuneration through share-based paymenttransactions, whereby officers and employees are given awards, in the form of ICTSI commonshares, in lieu of cash incentives and bonuses under the SIP (“equity-settled transactions”). TheSIP was approved by the stockholders of ICTSI on March 7, 2007, effective for a period of tenyears unless extended by the Board. On March 7, 2016, the Board approved for the extension ofthe SIP for a further 10 years until March 2027 and the amendment of vesting period of theSIP. The vesting period of the SIP was amended from two years where 50% is to vest on the first

- 90 -
*SGVFS033016*
anniversary date of the award and the other 50% to vest on the second anniversary date of theaward, to three years where 25% is to vest on the first anniversary date of the award, 25% to veston the second anniversary date of the award, and 50% to vest on the third anniversary date of theaward. Unless the Stock Incentive Committee determines otherwise, when dividends are declaredby the Company, the number of shares subject to an award shall be increased by the number equalin value to the dividends the awardee would have received in respect of an award had the sharesawarded to the awardee vested at the time of the dividend declaration. This is designated as theDividend Re-investment Plan (DRIP).
The shares covered by the SIP are held under treasury until they are awarded and issued to theofficers and employees as determined by the Stock Incentive Committee. As atDecember 31, 2018, there were 43,393,280 ICTSI common shares granted in aggregate under theSIP since it became effective in 2007. Also, as at December 31, 2018, there are 34,175,740 ICTSIcommon shares held under treasury, part of which are allotted for the SIP (see Note 14.1).
The grant of shares under the SIP does not require an exercise price to be paid by the awardee.Awardees who resign or are terminated will lose any right to unvested shares. In the event ofretirement of an awardee, the unvested shares shall automatically vest in full. In the event of deathor total disability of an awardee, the outstanding unvested shares shall vest in full and the shareswill be released to the designated heirs of the awardee. A change in control in ICTSI will triggerthe automatic vesting of unvested awarded shares. There are no cash settlement alternatives.
The SIP covers permanent and regular employees of ICTSI with at least one-year tenure; officersand directors of ICTSI, its subsidiaries or affiliates; or other persons who have contributed to thesuccess and profitability of ICTSI or its subsidiaries or affiliates.
Stock awards, including DRIP shares, granted by the Stock Incentive Committee to officers andemployees of ICTSI and ICTSI Ltd. for the past three years are shown below:
Grant DateNumber of Shares
GrantedFair Value per Share
at Grant DateMarch 14, 2016 2,567,763 US$1.39 (P=65.00)March 14, 2017 2,627,463 US$1.57 (P=79.20)May 17, 2017 113,673 US$2.00 (P=99.50)March 9, 2018 1,862,677 US$2.11 (P=109.90)May 11, 2018 152,059 US$1.60 (P=83.00)
Fair value per share was determined based on the quoted market price of stock at the date of grant.
Movements in the stock awards (number of shares) in 2016, 2017 and 2018 follow:
2016 2017 2018Balance at beginning of year 2,721,319 3,478,125 4,462,248Stock awards granted 2,567,763 2,741,136 2,014,736Stock awards vested, issued and cancelled (1,810,957) (1,757,013) (1,846,255)Balance at end of year 3,478,125 4,462,248 4,630,729
Total compensation expense recognized on the vesting of the fair value of stock awards andpresented as part of manpower costs in the consolidated statements of income amounted toUS$2.8 million in 2016, US$3.3 million in 2017 and US$3.9 million in 2018, respectively. Acorresponding increase in additional paid-in capital, net of applicable tax, was also recognized inthe consolidated statements of changes in equity (see Note 14.2).
- 91 -
*SGVFS033016*
20. Income and Expenses
20.1 Other Income
This account consists of:
2016 2017 2018Reversal of accrued taxes and other accruals
(see Notes 13 and 21) US$4,572,561 US$9,477,232 US$14,728,255Mark-to-market gain on derivatives - net
(see Note 26) − − 4,078,746Income from amortization of government grant
(see Note 16) 2,463,140 2,486,258 2,470,408Rental income (see Notes 6 and 7) 752,760 1,133,773 1,855,007Gain on disposal of property and equipment
(see Note 6) 1,682,668 249,185 248,527Dividend income (see Note 9) 198,706 198,456 179,163Gain on settlement of insurance and other claims 571,342 86,958 87,518Gain on termination of management contract
(see Note 1.2) − 7,500,000 −Others 3,152,389 2,474,003 4,643,859
US$13,393,566 US$23,605,865 US$28,291,483
20.2 Port Authorities’ Share in Gross Revenues
This account consists of port authorities’ share in gross revenues of the Group as stipulated inagreements with the port authorities where the Group operates (see Note 24). Port authorities’share in gross revenues includes variable fees aggregating US$183.7 million in 2016,US$190.5 million in 2017 and US$203.1 million in 2018 (see Note 24).
20.3 Other Expenses
2016 2017 2018Write-off of debt issuance costs and costs of
securing a revolving credit facility due tocancellation (see Notes 9, 15.1, 15.2.2and 15.2.6) US$– US$3,042,918 US$7,034,590
Restructuring and separation costs (see Note 18) – 18,028,269 3,406,717Pre-termination cost and other bank charges 2,257,130 3,515,738 3,222,533Management fees (see Note 22.1) 637,836 1,508,819 2,788,377Loss on disposal of property and equipment
(see Note 6) 181,375 591,529 582,212Wealth tax on equity of SPIA 929,543 372,318 –Loss on pre-termination of lease agreement (see
Notes 1.2 and 24.21) 23,432,184 – –Probable losses on non-trade advances and
receivables (see Note 9) 3,125,248 – –Solidarity contribution on equity of CGSA
(see Note 21) 1,455,876 – –Mark-to-market loss on derivatives - net 1,031,447 – –Others 3,300,621 4,988,383 4,451,638
US$36,351,260 US$32,047,974 US$21,486,067
Restructuring and Separation CostsRestructuring and separation costs pertain to costs incurred with respect to cost optimization andrationalization in response to market developments in certain terminals.

- 92 -
*SGVFS033016*
21. Income Tax
The components of recognized deferred tax assets and liabilities are as follows:2016 2017 2018
Deferred tax assets on: Unrealized foreign exchange losses US$57,424,745 US$69,500,560 US$83,525,994 NOLCO 12,353,824 17,640,422 49,300,731 Intangible assets and concession rights payable
under IFRIC 12 14,173,405 13,153,679 15,702,492 Accrued retirement cost and other expenses 1,435,954 1,344,660 1,714,591 Allowance for doubtful accounts and other provisions 1,076,888 547,690 855,787 Share-based payments 59,274 391,520 352,405 Allowance for obsolescence 139,508 572,259 252,072 Others 3,908,216 7,953,574 6,582,792
US$90,571,814 US$111,104,364 US$158,286,864
Deferred tax liabilities on: Difference in depreciation and amortization periods of
port infrastructure classified as concession rights US$12,745,917 US$16,418,860 US$22,733,941 Unrealized mark-to-market gain on derivatives 2,266,574 10,083,436 20,084,387 Excess of fair value over book value of net assets of
AGCT, BCT, Tecplata, YICT, PICT, OJA andTMT 21,486,453 20,121,374 17,953,292
Capitalized borrowing costs 18,373,108 18,734,817 17,649,551 Accelerated depreciation and translation difference
between functional and local currency 6,394,075 9,786,719 15,656,764 Nonmonetary assets 4,152,228 3,443,319 4,307,706 Unrealized foreign exchange gains 74,405 – 137,123 Others 5,884,045 1,897,937 5,822,770
US$71,376,805 US$80,486,462 US$104,345,534
Other deferred taxes mainly pertain to difference in tax and accounting bases for lease anddepreciation.
The Parent Company is subject to income tax based on its Philippine peso books even as itsfunctional currency is US dollars. As a result, the Parent Company’s US dollar-denominated netmonetary liabilities were translated to Philippine peso giving rise to the recognition of deferred taxasset on net unrealized foreign exchange losses. The deferred tax asset on net unrealized foreignexchange losses amounting to US$57.4 million, US$69.5 million and US$83.5 million as atDecember 31, 2016, 2017 and 2018, respectively, mainly pertains to Parent Company.
Deferred tax assets on NOLCO of certain subsidiaries amounting to US$3.3 million,US$3.0 million and US$3.3 million as at December 31, 2016, 2017 and 2018, respectively, werenot recognized, as management believes that these subsidiaries may not have sufficient futuretaxable profits against which the deferred tax assets can be utilized. Deferred tax assets arerecognized for subsidiaries when there is expectation of sufficient future taxable profits fromwhich these deferred tax assets can be utilized.
As at December 31, 2016, 2017 and 2018, deferred tax liability has not been recognized onundistributed cumulative earnings of subsidiaries in retained earnings position amounting toUS$832.9 million, US$1,056.7 million and US$1,211.1 million, respectively, because the ParentCompany has control over such earnings, which have been earmarked for reinvestment in foreignport projects and are not expected to reverse in the foreseeable future (see Note 14.5).

- 93 -
*SGVFS033016*
ICTSI recognized deferred tax asset amounting to US$0.1 million in 2016, US$0.4 million both in2017 and 2018, on the excess of the tax deduction (or estimated future deduction) on stock awardsover the related cumulative compensation expense (see Notes 14.2 and 19). The Grouprecognized deferred tax asset on actuarial loss amounting to US$0.2 million in 2016 andUS$0.1 million both in 2017 and 2018, respectively. The related deferred tax assets were taken toequity.
A reconciliation of income tax expense on income before income tax at the statutory tax rates toprovision for income tax for the years presented is as follows:
2016 2017 2018Income tax expense computed at statutory tax rates US$74,047,123 US$53,182,375 US$75,802,174Add (deduct): Income tax incentive (10,326,374) (13,876,313) (18,222,533) Nondeductible tax losses of subsidiaries - net 207,875 2,002,481 1,000,744 Interest income already subjected to final tax (588,979) (668,976) (930,483) Unallowable interest expense 90,339 73,710 81,642 Others - net 141,116 (166,454) 1,300,259Provision for income tax US$63,571,100 US$40,546,823 US$59,031,803
The statutory income tax rates applicable to each subsidiary are as follows:
Name of Company Tax Rate Tax RulesIDRC 35.0% The regular corporate income tax rate in DR Congo is 35 percent. The
minimum tax payable is the higher of 1 percent of revenue and CDF2.5million for large corporations. IDRC is entitled to an income tax holidayfor four years starting from 3rd quarter of 2016.
ICTSI Oregon 21.0% ICTSI Oregon is subject to federal tax rate of 21 percent. Based on the newtax law signed in December 2017, corporate tax rate was reduced to21 percent effective January 1, 2018. ICTSI Oregon is also subject to statetax of 6.6 to 7.6 percent and city/county tax of 3.65 percent based ontaxable income less federal tax. Under the federal and local state corporateincome tax systems, corporations that are not an exempt and smallcorporation are subject to an Alternative Minimum Tax (AMT) at a rate of20 percent. Corporations pay the minimum amount of tax subject tofederal and state regulations. There is no minimum tax on corporation in anet operating loss position. However, certain states require taxes to beremitted on a gross revenue basis. In accordance with the new tax law, theAMT is repealed effective January 1, 2018. Net operating losses (NOL)can be carried forward for 20 years and carried back for two years. Afterthe passage of the tax reform law, the NOL generated afterDecember 31, 2017 can no longer be carried back for two years but canstill be carried forward for 20 years. Further, the utilization of NOL shallbe limited to 80 percent of the taxable income for the year.
PICT 29.0% Corporate tax rate in Pakistan that applies to PICT is 29 percent. In 2014, anew provision [Section 113(c) of Income Tax Ordinance, 2001(Ordinance)] is added by which companies are required to pay AlternativeCorporate Tax (ACT) at 17 percent of accounting profits if the actual taxliability is less than ACT. The differential excess can be carried forwardfor ten years. The Government of Pakistan through Finance Act 2015 hasimposed a temporary super tax in 2015 and extended the application ofsuper tax up to the year 2018. The super tax has been levied at the rate of2 percent (2015 to 2017: 3 percent) on all taxpayers earning incomeamounting to PKR500.0 million or more in the previous year. PICTaccrued and paid super tax amounting to US$1.3 million(PKR123.4 million) in 2016, US$1.3 million (PKR136.0 million) in 2017and US$1.7 million (PKR208.8 million) in 2018.

- 94 -
*SGVFS033016*
Name of Company Tax Rate Tax RulesIn Pakistan, deductible depreciation is computed by applying the applicable
rates, as provided in the Third Schedule to the Ordinance, to the particularcategory of assets on a diminishing balance method. The rate of taxdepreciation ranges from 10 to 30 percent depending on the category ofthe assets. An initial depreciation allowance at the rate of 15 percent and25 percent, depending on the category of assets, is also available foreligible depreciable assets, in accordance with section 23 of the Ordinance.
ICTSI and otherPhilippinesubsidiaries(excluding SBITC,ICTSI Subic andAPBS), VICT,AICTL, Tecplata,CMSA and TMT
30.0% The corporate income tax rate of Philippine entities is 30 percent.On May 14, 2008, the Board of Investments (BOI) approved the registration
of ICTSI’s construction of Berth 6 of the MICT as “New Operator of PortInfrastructure (Berth 6)” on a Pioneer status under the OmnibusInvestment Code of 1987. From November 2011, Berth 6 is entitled,among others, to an income tax holiday for a period of six years. Berth 6was completed, inaugurated and started full commercial operations inJuly 2012. In 2016 and 2017, Berth 6 recognized gross revenues from portoperations amounting to US$70.0 million and US$70.8 million and availedof tax incentive arising from the income tax holiday of US$10.3 millionand US$10.9 million, respectively. On July 2, 2015, the BOI approved theregistration of ICTSI’s construction of Berth 7 of the MICT as “ExpandingOperator of Container Yard” on a Non-Pioneer status under the OmnibusInvestment Code of 1987. Starting July 2017, Berth 7 is entitled, amongothers, to an income tax holiday for a period of three years. In 2017 and2018, Berth 7 recognized gross revenues from port operations amountingto US$4.4 million and US$14.3 million and availed of tax incentive arisingfrom the income tax holiday of US$0.8 million and US$4.3 million,respectively.
On December 18, 2008, the Bureau of Internal Revenue issued RevenueRegulations No. 16-2008, which implemented the provisions of RepublicAct 9504 on Optional Standard Deductions (OSD). This regulation allowsboth individuals and corporate taxpayers to use OSD in computing fortaxable income. Corporations may elect a standard deduction equivalentto 40 percent of gross income, as provided by law, in lieu of the itemizedallowed deductions. For the years ended December 31, 2016, 2017 and2018, BIPI, MICTSI and SCIPSI have elected to use OSD in computingfor their taxable income. DIPSSCOR opted to use itemized deductionsmethod for the years ended December 31, 2016, 2017 and 2018 incomputing for its taxable income.
On March 3, 2014, HIPS was registered with the BOI as a new operator ofseaport and container yard/terminal on a non-pioneer status under theOmnibus Investment Code of 1987. HIPS is entitled, among others, to anincome tax holiday for four years from January 2016 or start ofcommercial operations, whichever is earlier. On September 26, 2016,HIPS has requested the BOI to cancel its registration in light ofdevelopments affecting the economics of the project. The saidcancellation was approved in 2017.
On March 28, 2016, LGICT was registered with the BOI as a new exportservices provider on a non-pioneer status under the Omnibus InvestmentCode of 1987. LGICT is entitled, among others, to an income tax holidayfor four years from March 2016.
VICT and AICTL are subject to corporate income tax rate of 30 percent. Taxlosses can be carried forward indefinitely, subject to same ownership andcontinuity of business tests.
Tecplata’s nominal tax rate is 30 percent. In accordance with the tax reformin 2017, the tax rate was reduced to 30 percent in 2018 and further reducedto 25 percent starting 2019. In addition to the profits tax, Tecplata issubject to annual minimum presumed income tax calculated as 1 percentof the fixed and current assets (see Note 9). However, should theminimum presumed income tax exceed income tax in the previous fiscalyear, such excess may be treated as payment on account of any income taxexcess over minimum presumed income tax that may occur in any of the

- 95 -
*SGVFS033016*
Name of Company Tax Rate Tax Rulesten subsequent fiscal years. Tecplata obtained an exemption from the taxauthority for the payment of the minimum presumed income tax starting inthe second half of 2016. Minimum presumed income tax will be repealedin 2019. Tax losses can be carried forward for five years.
Effective January 1, 2014, CMSA and TMT are subject to corporate incometax rate of 30 percent.
RCBV, ITBV and othersubsidiaries in TheNetherlands
25.0% The corporate income tax rate in the Netherlands is 20 percent on taxableincome of up to €200,000 and 25.0 percent on taxable income exceeding€200,000. Tax losses in Netherlands can be carried forward for nine years.
OPC 25.0% OPC’s corporate income tax rate is 25 percent. An additional socialcontribution is levied on OPC calculated as 5 percent of the surplus of thenet taxable income above HNL1.0 million. The net asset tax is levied to a1.0 percent tax rate applicable over the surplus of HNL3.0 million of thevalue of the total assets reflected on the balance sheet. A 5 percenttemporary social contribution is levied in addition to the corporate incometax applied to the excess of net taxable income above HNL1.0 million. AnAMT is levied on a taxpayer that has operating losses in two of the pastfive years and whose gross income in the past year is HNL100.0 million ormore. AMT is computed by applying the 1.0 percent rate to grossincome. OPC is exempt from AMT during its first five years ofoperations. A Minimum tax is levied on the 1.5 percent over the total grossincome greater or equal to HNL.10.0 million during the tax period, whenthe Corporate income tax resulting is lower than the 1.5 percent of thegross income declared. Companies are exempted from the application ofthis minimum tax during their first 2 years of establishment orpre-operational period.
On January 31, 2017, the Secretariat of Finance (SEFIN) issued a resolutionthrough which it grants the Company an exemption of Net Asset Tax,Temporary Solidarity Contribution, Advance of 1 percent in respect ofIncome Tax provided for in Decree No. 96-2012, (Law on Anti-EvasionMeasures on Income Tax) of the Income Tax modality corresponding to1.5 percent of Gross Income Declared set forth in Article 22-A of theIncome Tax Act, as well as from all those taxes related to income, for thelifetime of the project called "Design, Financing, Construction,Maintenance, Operation and Exploitation of Puerto Cortes’ Container andGeneral Cargo Terminal”, as of the date of commencement of operations,and it must be renewed annually until the end of the concession by SEFIN.It is stated in the official document that SEFIN will verify that OPCcomplies with the commitments and objectives stipulated in the concessioncontract, otherwise, the benefit of the tax exemption will be suspended.The tax authorities will verify that OPC is in compliance with itsobligations and, otherwise, the benefit will be suspended. Likewise, OPCshall update the registration of exempted payers annually.
MTS, IJP, OJA,PT CTSSI and YICT
25.0% Registered as a Sino-foreign joint venture in China, Berths 61 and 62 ofYICT are entitled to a full tax holiday in the first five years and 50 percentexemption in the subsequent five years starting 2008 and 2006,respectively. YICT’s tax exemption is until December 2015 and startingyear 2016, YICT is subjected to the 25 percent regular income tax rate.Tax losses can be carried forward for five years.
In January 2015, Berths 51 and 52 of YICT were granted a full tax holiday inthe first three years and 50 percent exemption in the subsequent threeyears.
MTS, IJP and OJA are subject to corporate income tax rate in Indonesia of 25percent.
CGSA 25.0% CGSA’s corporate income tax rate applicable starting 2018 is 25 percent.This tax is calculated after deducting 15 percent of social contribution onprofits for workers.
In 2016, the government of Ecuador passed a law with the purpose of raisingfunds in order to recover from the effects of the earthquake that occurredin April 2016. The law introduced the collection of solidarity

- 96 -
*SGVFS033016*
Name of Company Tax Rate Tax Rulescontributions from various sources, increase in value-added tax rate by 2percent, among others. CGSA paid solidarity contributions from profitsamounting to US$1.0 million while ICTSI, through CGSA, paid solidaritycontributions from equity amounting to US$1.5 million (see Note 20.3) in2016 and nil in 2017 and 2018.
MICTSL and SPIA 20.0% MICTSL is subject to statutory corporate income tax rate of 20 percent. Aminimum tax of MGA0.32 million plus 0.5 percent of the annual turnoveris levied if the company incurs a loss or if the corporate tax rate calculatedusing the 20 percent rate is less than the minimum tax.
SPIA is incorporated in Colombia and on June 26, 2012, the ColombianGovernment issued the formal resolution granting SPIA a Free Trade Zonestatus. Effective 2012, the income tax applicable to SPIA is 15 percentinstead of 33 percent general corporate income tax rate in force in 2012.Subsequently, a structural tax reform passed in December 2016 increasedthe income tax rate for Free Trade Zone users by 5 percent, from 15percent to 20 percent effective starting 2017.
BCT 19.0% BCT is subject to statutory corporate income tax rate of 19 percent.NMCTS 18.5% The first B$100,000 of chargeable income of NMCTS is taxed at a reduced
rate of one quarter of the full rate, while the next B$150,000 is taxed athalf the full rate.
AGCT 18.0% The statutory corporate income tax rate in Croatia for entities which operatein the free-trade zone is 15 percent from 2014 up to 2016 and 18 percentfrom 2017 onwards.
TSSA 15.25% TSSA’s nominal tax rate is 25.0 percent and was granted a tax rate reductionresulting to a tax rate of 15.25 percent. The tax incentive is applicable forthe years 2005 to 2022 on profits from port operating services in Suape,Pernambuco.
BICTL and ICTSI Iraq 15.0% BICTL is subject to statutory corporate income tax rate of 15 percent.Starting January 1, 2017, income tax is calculated based on distributedprofit.
ICTSI Iraq is subject to statutory corporate income tax rate of 15 percent.Tax losses can be carried forward up to five years provided that losses maynot offset more than half of the taxable income of each of the five yearsand the loss may offset only income from the same source from which theloss arose. Any carry-over losses is subject to discretion of the taxauthorities.
SBITC, ICTSI Subic,Inc. and APBS
5.0% SBITC and ICTSI Subic are registered with the Subic Bay MetropolitanAuthority as Subic Bay Free Port Zone Enterprises that are entitled tocertain tax incentives including a preferential income tax rate of5.0 percent percent based on gross revenues less allowable deductions.
APBS is registered with the Philippine Economic Zone Authority as anEcozone IT Enterprise that is entitled to certain tax incentives including apreferential income tax rate of 5.0 percent on gross income fromPhilippine Economic Zone Authority-registered activities, in lieu of allnational and local taxes. APBS is also entitled to an income tax holiday offour years from date of commercial operations on December 31, 2015.
LICTSLE 0.0% LICTSLE was located in a free trade zone governed by the Nigeria ExportProcessing Zones Authority. LICTSLE was exempt from all taxes,including corporate income tax.
SPICTL and MITL 30% The corporate tax rate for resident PNG companies is 30 percent. Tax lossescan be carried forward for a period of 20 years. Corporate income tax iscollected under a provisional tax system. Provisional tax is imposed byassessment issued by the Internal Revenue Commision based on the lastyear assessed with an 8 percent increase. Provisional tax is payable overthree equal instalments in April, July and October. In the event that noprior assessment exists, the Commissioner General has the right toestimate the amount of tax that he believes should be paid. Applicationscan be made to adjust (reduce or increase) the amount of provisional taxpayable. Under estimation of provisional taxes can result in a penalty of 25

- 97 -
*SGVFS033016*
Name of Company Tax Rate Tax Rulespercent. Overpaid taxes can be offset against other taxes payable (goodsand services tax, corporate income tax, etc.) by the lodgment of a CR1form. Overpaid taxes are refunded through the lodgment of an application(CR2) form.
22. Related Party Transactions
22.1 Transactions with the Shareholders and Affiliates
2016 2017 2018
Related Party Relationship Nature of Transaction Amount
OutstandingReceivable
(Payable)Balance Amount
OutstandingReceivable
(Payable)Balance Amount
OutstandingReceivable
(Payable)Balance
(In Millions)ICBVSPIA Joint venture Interest-bearing loans (see
Note 8) (i) US$52.00 US$249.20 US$25.40 US$269.48 US$2.80 US$–Interest income (converted
into interest-bearingloan) (see Note 8) (i) 12.45 19.98 15.52 35.50 13.35 –
Interest receivable (i) 14.58 7.43 17.75 9.05 14.35 –SPIA Spain S.L.SPIA Joint venture Interest-bearing loans (see
Note 8) (i) – – – – (1.29) 270.99Interest income (converted
into interest-bearingloan) (see Note 8) (i) – – – – 4.41 53.26
Interest receivable (i) – – – – 4.95 9.73YICTYPH Non-controlling
shareholderPort fees (ii)
1.77 – 1.59 – 0.32 0.15Trade transactions (iii) – – – – 0.87 (0.07)Interest-bearing loans (iv) 21.60 (21.60) 21.60 – – –Interests on loans (iv) 0.07 (0.03) 0.28 – – –
YPG Commonshareholder
Port fees (ii)
2.36 (0.14) 3.10 (0.17) 3.86 (0.90)Trade transactions (iii) 1.87 (0.02) 1.66 – 1.74 (0.20)
SCIPSIAsian Terminals,
Inc.Non-controlling
shareholderManagement fees
0.20 (0.03) 0.17 (0.02) 0.19 (0.02)AGCTLuka Rijeka D.D.
(Luka Rijeka)Non-controlling
shareholderProvision of services (v)
0.37 (0.02) 0.25 (0.04) 0.32 (0.03)
PICTPremier Mercantile
Services (Private)Limited
CommonShareholder
Stevedoring and storagecharges (vi)
5.17 (0.03) 5.50 (0.40) 2.09 (0.01)Premier Software
(Private) LimitedCommon
shareholderSoftware maintenance
charges 0.01 – – – – –Marine Services
(Private) Limited,PortlinkInternational(Private) Limited,and AMI Pakistan(Private) Limited
Commonshareholder
Container handlingrevenue (vii)
0.52 0.03 0.37 0.01 0.13 –LGICTNCT Transnational
Corp.Non-controlling
shareholderManagement fees
0.41 (0.04) 0.47 (0.04) 0.45 (0.03)Maintenance and repairs 0.09 (0.02) 0.14 (0.01) 0.13 (0.02)
BIPIAtlantic Gulf and
Pacific Co. ofManila, Inc.(AG&P)
Commonshareholder
Rent expense
0.05 (0.02) 0.06 (0.02) 0.09 (0.03)Utilities 0.03 – 0.03 – 0.03 (0.01)
IDRCLedya SARL Non-controlling
shareholderManagement fees
– – 0.85 (0.85) 1.43 (0.53)
Parent CompanyPrime Metro
BMDCorporation
Commonshareholder
Construction services (viii)
– – – – 4.73 5.73Dredging services (viii) – – – – 1.41 0.40Rental income (viii) – – – – 0.22 –
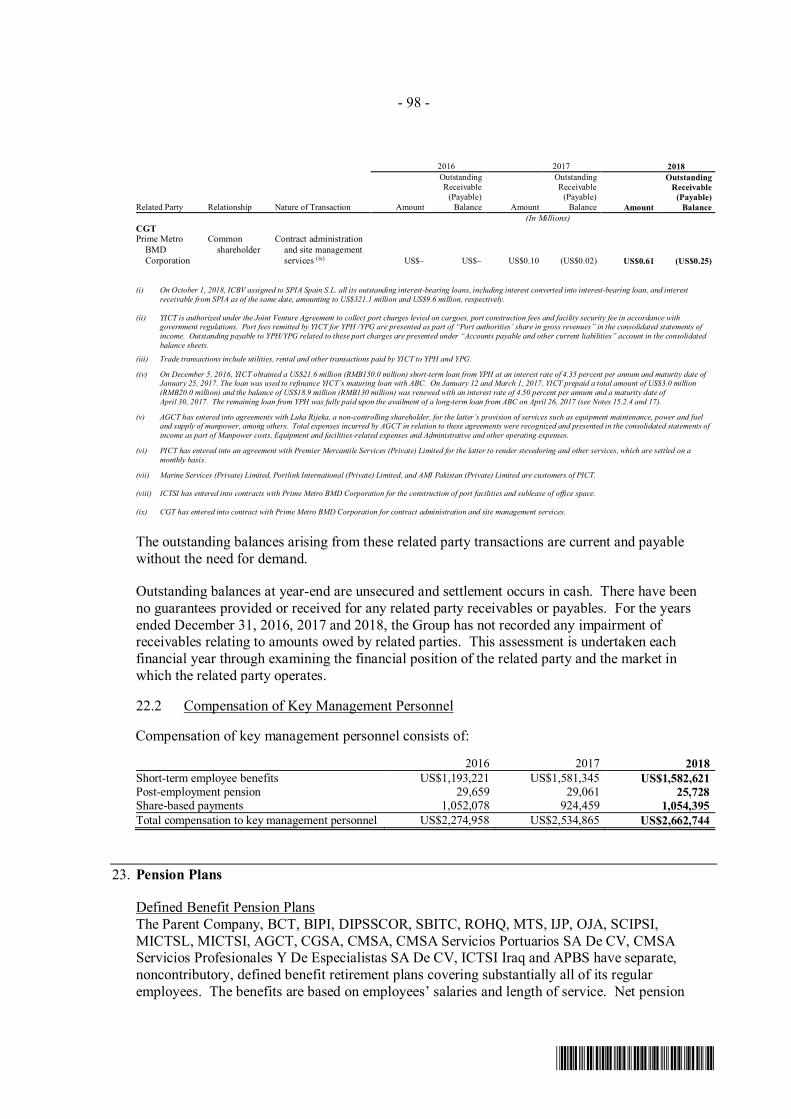
- 98 -
*SGVFS033016*
2016 2017 2018
Related Party Relationship Nature of Transaction Amount
OutstandingReceivable
(Payable)Balance Amount
OutstandingReceivable
(Payable)Balance Amount
OutstandingReceivable
(Payable)Balance
(In Millions)CGTPrime Metro
BMDCorporation
Commonshareholder
Contract administrationand site managementservices (ix) US$– US$– US$0.10 (US$0.02) US$0.61 (US$0.25)
(i) On October 1, 2018, ICBV assigned to SPIA Spain S.L. all its outstanding interest-bearing loans, including interest converted into interest-bearing loan, and interestreceivable from SPIA as of the same date, amounting to US$321.1 million and US$9.6 million, respectively.
(ii) YICT is authorized under the Joint Venture Agreement to collect port charges levied on cargoes, port construction fees and facility security fee in accordance withgovernment regulations. Port fees remitted by YICT for YPH /YPG are presented as part of “Port authorities’ share in gross revenues” in the consolidated statements ofincome. Outstanding payable to YPH/YPG related to these port charges are presented under “Accounts payable and other current liabilities” account in the consolidatedbalance sheets.
(iii) Trade transactions include utilities, rental and other transactions paid by YICT to YPH and YPG.
(iv) On December 5, 2016, YICT obtained a US$21.6 million (RMB150.0 million) short-term loan from YPH at an interest rate of 4.35 percent per annum and maturity date ofJanuary 25, 2017. The loan was used to refinance YICT’s maturing loan with ABC. On January 12 and March 1, 2017, YICT prepaid a total amount of US$3.0 million(RMB20.0 million) and the balance of US$18.9 million (RMB130 million) was renewed with an interest rate of 4.50 percent per annum and a maturity date ofApril 30, 2017. The remaining loan from YPH was fully paid upon the availment of a long-term loan from ABC on April 26, 2017 (see Notes 15.2.4 and 17).
(v) AGCT has entered into agreements with Luka Rijeka, a non-controlling shareholder, for the latter’s provision of services such as equipment maintenance, power and fueland supply of manpower, among others. Total expenses incurred by AGCT in relation to these agreements were recognized and presented in the consolidated statements ofincome as part of Manpower costs, Equipment and facilities-related expenses and Administrative and other operating expenses.
(vi) PICT has entered into an agreement with Premier Mercantile Services (Private) Limited for the latter to render stevedoring and other services, which are settled on amonthly basis.
(vii) Marine Services (Private) Limited, Portlink International (Private) Limited, and AMI Pakistan (Private) Limited are customers of PICT.
(viii) ICTSI has entered into contracts with Prime Metro BMD Corporation for the construction of port facilities and sublease of office space.
(ix) CGT has entered into contract with Prime Metro BMD Corporation for contract administration and site management services.
The outstanding balances arising from these related party transactions are current and payablewithout the need for demand.
Outstanding balances at year-end are unsecured and settlement occurs in cash. There have beenno guarantees provided or received for any related party receivables or payables. For the yearsended December 31, 2016, 2017 and 2018, the Group has not recorded any impairment ofreceivables relating to amounts owed by related parties. This assessment is undertaken eachfinancial year through examining the financial position of the related party and the market inwhich the related party operates.
22.2 Compensation of Key Management Personnel
Compensation of key management personnel consists of:
2016 2017 2018Short-term employee benefits US$1,193,221 US$1,581,345 US$1,582,621Post-employment pension 29,659 29,061 25,728Share-based payments 1,052,078 924,459 1,054,395Total compensation to key management personnel US$2,274,958 US$2,534,865 US$2,662,744
23. Pension Plans
Defined Benefit Pension PlansThe Parent Company, BCT, BIPI, DIPSSCOR, SBITC, ROHQ, MTS, IJP, OJA, SCIPSI,MICTSL, MICTSI, AGCT, CGSA, CMSA, CMSA Servicios Portuarios SA De CV, CMSAServicios Profesionales Y De Especialistas SA De CV, ICTSI Iraq and APBS have separate,noncontributory, defined benefit retirement plans covering substantially all of its regularemployees. The benefits are based on employees’ salaries and length of service. Net pension

- 99 -
*SGVFS033016*
expense charged to operations included as manpower costs amounted to US$1.9 million in 2016,US$3.1 million in 2017 and US$2.0 million in 2018.
Pension plans consist of:2016 2017 2018
Pension assets (presented as “Other noncurrent assets”) Asia US$981 US$– US$89,898
Pension liabilities (presented as“Other noncurrent liabilities”)
Asia US$3,407,307 US$3,902,514 US$3,506,518 EMEA 1,284,721 2,185,414 2,091,535 Americas 2,795,579 3,389,383 3,642,521
US$7,487,607 US$9,477,311 US$9,240,574
Pension Liabilities. The following tables summarize the components of the Group’s net pensionexpense recognized in the consolidated statements of income and the funded status and amountsrecognized in the consolidated balance sheets.
2016 2017 2018
Net pension expense: Current service cost US$1,546,120 US$3,621,890 US$1,479,640 Net interest cost 274,747 404,141 310,069 Past service cost 2,201 14,026 129,984 Effect of curtailments – (942,538) –
US$1,823,068 US$3,097,519 US$1,919,693
Pension liabilities: Present value of defined benefit obligation US$16,197,260 US$18,307,974 US$17,359,581 Fair value of plan assets (8,709,653) (8,830,663) (8,119,007)
US$7,487,607 US$9,477,311 US$9,240,574
Changes in the present value of the defined benefitobligation:
Balance at beginning of year US$6,780,186 US$16,197,260 US$18,307,974 Current service cost 1,546,120 3,621,890 1,479,640 Interest cost 763,864 820,113 736,123 Actuarial loss (gain) on obligations - net 350,441 (383,074) (239,853) Past service cost 2,201 14,026 129,984 Effect of curtailments – (942,538) – Benefits paid (2,662,704) (1,344,941) (1,788,019) Translation adjustment (672,113) (250,140) (591,584) Change in plan position 10,089,265 575,378 (674,684) Balance at end of year US$16,197,260 US$18,307,974 US$17,359,581
Changes in fair value of plan assets: Balance at beginning of year US$270,727 US$8,709,653 US$8,830,663 Interest income 489,117 415,972 426,054 Actuarial loss on plan assets (190,175) (88,308) (413,038) Benefits paid (2,312,809) (1,588,039) (844,130) Actual contributions 657,527 848,616 1,168,962 Translation adjustment (508,326) (43,590) (412,485) Change in plan position 10,303,592 576,359 (637,019) Balance at end of year US$8,709,653 US$8,830,663 US$8,119,007Actual return on plan assets US$298,942 US$327,664 US$13,016

- 100 -
*SGVFS033016*
Pension Assets. The following tables summarize the components of the Group’s net pensionexpense recognized in the consolidated statements of income and the funded status and amountsrecognized in the consolidated balance sheets.
2016 2017 2018
Net pension expense: Current service cost US$45,172 US$– US$46,171 Net interest income (2,034) – (619)
US$43,138 US$– US$45,552
Pension assets: Fair value of plan assets US$576,359 US$– US$665,762 Present value of defined benefit obligation (575,378) – (575,864)
US$981 US$– US$89,898
Changes in the present value of the defined benefitobligation:
Balance at beginning of year US$10,820,792 US$575,378 US$– Current service cost 45,172 – 46,171 Interest cost 28,795 – 34,825 Actuarial gain on obligations - net (44,295) – (117,784) Benefits paid (23,348) – (19,690) Translation adjustment (162,473) – (42,342) Change in plan position (10,089,265) (575,378) 674,684 Balance at end of year US$575,378 US$– US$575,864
Changes in fair value of plan assets: Balance at beginning of year US$10,946,740 US$576,359 US$– Interest income 30,829 – 35,444 Actuarial loss on plan assets (41,391) – (24,132) Benefits paid (23,348) – (19,690)
Actual contribution – – 69,116 Translation adjustment (32,879) – (31,995) Change in plan position (10,303,592) (576,359) 637,019 Balance at end of year US$576,359 US$– US$665,762Actual return (loss) on plan assets (US$10,562) US$– US$11,312
The Group does not expect significant contributions to the retirement plans of the Parent Companyand its subsidiaries in 2019.
The principal assumptions used in determining pension benefits obligation of the Parent Company,BIPI, SBITC, ROHQ, APBS, DIPSSCOR, MTS, OJA, IJP, SCIPSI, MICTSI, AGCT, BCT,MICTSL, ICTSI Iraq, CMSA, CMSA Servicios Portuarios SA De CV, CMSA ServiciosProfesionales Y De Especialistas SA De CV and CGSA are shown below (in percentage):
2016 2017 2018Discount rate
Asia 4.54% - 8.65% 5.21% - 7.40% 7.08% - 8.00%EMEA 3.50% - 10.46% 3.25% - 10.40% 1.50% - 8.79%Americas 7.46% - 8.13% 3.91% - 7.47% 4.25% - 7.97%
Future salary increasesAsia 4.00% - 10.00% 3.00% - 10.00% 4.00% - 10.00%EMEA 2.50% - 5.00% 2.50% - 5.00% 2.50% - 5.00%Americas 3.00% - 6.00% 1.50% - 5.04% 1.00% - 5.04%

- 101 -
*SGVFS033016*
A quantitative sensitivity analysis for significant assumptions as at December 31, 2018 is shownbelow (amounts in millions):
Discount rate Future salary increases
Sensitivity level1.0%increase
1.0%decrease
1.0%increase
1.0%decrease
Impact on the net defined benefit obligation (US$0.9) US$1.0 US$1.1 (US$1.0)
The sensitivity analyses above have been determined based on a method that extrapolates theimpact on net defined benefit obligation as a result of reasonable changes in key assumptionsoccurring at the end of the reporting period.
The following payments are expected to be made in the future years out of the defined benefit planobligation:
2016 2017 2018Within the next 12 months US$1,393,826 US$1,596,827 US$1,906,203Between 2 and 5 years 4,689,252 4,910,600 4,677,517Between 5 and 10 years 7,306,481 7,328,031 7,743,023Beyond 10 years 26,792,519 24,678,316 33,306,769Total expected payments US$40,182,078 US$38,513,774 US$47,633,512
The average duration of the defined benefit plan obligation as at December 31, 2018 is 15 years.
The amount of experience adjustments on pension obligations amounted to US$0.7 million both in2016 and 2017 and US$0.3 million in 2018. The amount of experience adjustments on plan assetsamounted to nil in 2016 and in 2017 and US$29.1 thousand in 2018.
The plan assets of Group are being held by various trustee banks. The investing decisions of theseplans are made by the respective trustees.
The following table presents the carrying amounts and fair values of the combined assets of theplans less liabilities:
2016 2017 2018Cash and cash equivalents US$3,794,515 US$2,489,501 US$2,317,648Investments in debt securities 1,074,112 954,661 1,004,346Investments in government securities 3,665,428 3,845,057 4,108,594Investments in equity securities 688,606 1,541,764 1,556,629Others 86,445 2,716 105,058
9,309,106 8,833,699 9,092,275Liabilities (23,094) (3,036) (307,506)
US$9,286,012 US$8,830,663 US$8,784,769
The plan assets’ carrying amount approximates its fair value since these are either short-term innature or stated at fair market values.

- 102 -
*SGVFS033016*
The plans’ assets and investments consist of the following:
ƒ Cash and cash equivalents, which includes regular savings and time deposits;
ƒ Investments in corporate debt instruments, consisting of both short-term and long-termcorporate loans, notes and bonds, which bear interest ranging from 3.92 percent to7.81 percent and have maturities from 2020 to 2027;
ƒ Investments in government securities, consisting of retail treasury bonds that bear interestranging from 3.5 percent to 11.137 percent and have maturities from 2020 to 2031; and
ƒ Investments in equity securities include investment in shares of stock of ICTSI amounting toUS$0.6 million, US$0.8 million and US$0.8 million as at December 31, 2016, 2017 and 2018,respectively. For years ended December 31, 2016, 2017 and 2018, mark-to-market gainarising from investment in ICTSI shares amounted to US$0.1 million, US$0.4 million andUS$0.3 million, respectively.
The carrying amounts of investments in equity securities also approximate their fair valuesgiven that they are stated at fair market values. The voting rights over these equity securitiesare exercised by the authorized officers of the respective subsidiary.
ƒ Other financial assets held by these plans are primarily accrued interest income on cashdeposits and debt securities held by the plan.
ƒ Liabilities of the plan pertain to trust fee payable and retirement benefits payable.
Defined Contribution Pension PlanThe employees of YICT are members of a state-managed retirement benefit scheme operated bythe local government. YICT is required to contribute a specified percentage of its payroll costs tothe retirement benefit scheme to fund the benefits. The only obligation of YICT with respect tothe retirement benefit scheme is to make the specified contributions.
PICT operates a recognized provident fund scheme for all its eligible employees. Equal monthlycontributions are made by PICT and the employees to the fund at a rate of 8.33 percent of thebasic salary.
In addition, ICTSI Oregon maintains a Safe Harbor 401k plan (401k plan), covering all of itsemployees, which became effective January 1, 2011. Participants who are eligible can contributeup to 100 percent of their eligible compensation and those who have reached the age of 21 yearsold are eligible to make contributions following six months of continuous service. All participantsin the 401k plan are eligible for matching contributions of 100 percent of each dollar contributedup to 6 percent of a participant’s earnings. Participant’s voluntary contributions and actualearnings thereon are immediately vested. ICTSI Oregon’s matching contributions to the 401kplan are immediately vested and cannot be forfeited.
Contributions made by YICT, ICTSI Oregon and PICT to the plans and recognized as expenseunder manpower costs totaled US$0.9 million both in 2016 and 2017 and US$0.8 million in 2018.

- 103 -
*SGVFS033016*
24. Significant Contracts and Agreements
The Group has entered into a number of contracts and agreements mainly related to the operation,development and management of ports and container terminals. As at December 31, 2018, ICTSIand its subsidiaries, joint venture and associate are in compliance with their concessionagreements.
Agreements within the Scope of IFRIC 12
A service concession agreement is within the scope of IFRIC 12 if: (a) the grantor regulates theservices, customers and the pricing of the services to be provided; and (b) the grantor controls anysignificant residual interest in the infrastructure at the end of the term of the arrangement.
24.1 Contract for the Management, Operation and Development of the MICT
The Parent Company has a contract with the PPA for the exclusive management, operation, anddevelopment of the MICT for a period of 25 years starting May 18, 1988, which was extended foranother 25 years until May 18, 2038.
Under the provisions of the contract, “Gross Revenues” shall include all income generated by theParent Company from the MICT from every source and on every account except interest income,whether collected or not, to include but not limited to harbor dues, berthing fees, wharfage, cargohandling revenues, cranage fees, stripping/stuffing charges, and all other revenues from ancillaryservices. Harbor dues, berthing fees, and wharfage included in gross revenues defined in theMICT contract amounted to US$17.1 million in 2016, US$17.2 million in 2017 andUS$17.3 million in 2018.
In addition, under the original contract, the Parent Company agreed to pay the PPA a fixed fee ofUS$313.8 million payable in advance in quarterly installments converted to Philippine peso usingthe closing Philippine Dealing System (PDS) rate of the day before payment is made (net ofharbor dues, berthing fees and wharfage allowed by PPA as deduction) and a variable fee based onpercentages of the Parent Company’s gross revenues ranging from 12 percent to 20 percent duringthe term of the contract. Under the renewal contract effective May 19, 2013, the Parent Companyagreed to pay the PPA a fixed fee of US$600.0 million payable in 100 advanced quarterlyinstallments and pay a variable fee of 20 percent of the gross revenues.
The total variable fees paid to the PPA, shown as part of “Port authorities’ share in grossrevenues” account in the consolidated statements of income, amounted to US$82.5 million in2016, US$82.3 million in 2017 and US$95.4 million in 2018. Fixed fees formed part of thecapitalized concession rights which are being amortized over the period of the concession.Related concession rights payable amounted to US$314.4 million, US$306.1 million andUS$296.4 million, as at December 31, 2016, 2017 and 2018, respectively. The current portionamounting to US$2.9 million, US$3.2 million and US$3.3 million is presented as “Current portionof concession rights payable” and the noncurrent portion amounting to US$311.5 million,US$302.8 million and US$293.1 million is presented as “Concession rights payable - net ofcurrent portion” in the consolidated balance sheets as at December 31, 2016, 2017 and 2018,respectively.
Both the original and renewal contracts contain commitments and restrictions which include,among others, prohibition on the change of Parent Company’s controlling ownership without priorconsent of the PPA and adherence to a container terminal equipment acquisition program anddeployment schedule. Moreover, upon expiration of the term of the contract or in the event of
- 104 -
*SGVFS033016*
pre-termination, all the structures, buildings, facilities and equipment of the Parent Companybeing used at the MICT shall automatically become the property of the PPA. The PPA has noobligation to reimburse the Parent Company for the equipment, except for those acquired duringthe last five years prior to the termination of the contract for which the PPA shall have the optionto purchase at book value or to pay rentals. Upon expiration of the original contract of MICT inMay 2013, the Parent Company executed a deed of absolute transfer to effect the transfer ofownership of the said structures, improvements, buildings, facilities and equipment, exceptequipment purchased during the last five years of the original contract. Berth 6 was included inthe said transfer. However, ICTSI shall continue to have possession, control and use of thetransferred assets for another 25 years in accordance with the terms of the renewal contract inconsideration for the upfront fee payment made by the Parent Company.
In 1997, the Parent Company signed a contract for leasehold rights over the storage facilities at theMICT. Under the contract, the Parent Company is committed to pay the PPA P=55.0 million(equivalent to US$1.0 million as at December 31, 2018) a year from January 16, 1997 up toJanuary 15, 2007 and a variable fee of 30 percent of revenues in excess of P=273.0 million(equivalent to US$5.2 million as at December 31, 2018) generated from the operation of thestorage facilities. This contract was renewed on June 11, 2008 and has been made co-terminuswith the MICT Management Contract, or up to May 18, 2038.
In 1998, the Parent Company also acquired a contract to handle non-containerized cargoes and theanchorage operations for a period of ten years starting January 1998. Such contract was renewedon June 11, 2008 and has been made co-terminus with the 1988 MICT Management Contract, orup to May 18, 2038. Under this contract, the Parent Company is required to pay a variable fee of14 percent of its gross revenues from anchorage operations and 20 percent of its gross revenuesfrom berthside operations for the first three years of the contract. Thereafter, the consideration tobe paid by the Parent Company shall be a fixed fee plus a variable fee of 7.5 percent of its grossrevenues from berthside operations or 20 percent of its gross revenues, whichever is higher. Thefixed fee shall be determined based on the highest annual government share by the ParentCompany for the handling of non-containerized cargoes at berthside for the first three years, plus10 percent thereof.
24.2 Contract with Subic Bay Metropolitan Authority (SBMA) andRoyal Port Services, Inc. (RPSI)
On February 20, 2007, SBITC was awarded by the SBMA the contract to operate the NewContainer Terminal 1 (NCT-1) at Cubi Point in Subic for a period of 25 years. The NCT-1 wasconstructed by SBMA in accordance with the SBMA Port Master Plan and the Subic Bay PortDevelopment Project. In consideration for the concession, SBITC shall pay: (i) base rent ofUS$0.70 per square meter per month with 6 percent escalation on the 5th year and every threeyears thereafter; (ii) fixed fee of US$500,000 every year except for the first two years of thecontract; and (iii) variable fee of 12 percent to 16 percent of SBITC’s gross revenue based on thevolume of containers handled at the terminal.
Total variable fees paid to SBMA, shown as part of “Port authorities’ share in gross revenues”account in the consolidated statements of income, amounted to US$1.4 million in 2016,US$1.0 million in 2017 and US$1.2 million in 2018. Fixed fees pertaining to the contract tooperate NCT-1 formed part of the capitalized concession rights which are being amortized overthe concession period. Related concession rights payable amounted to US$18.7 million,US$18.2 million and US$17.7 million as at December 31, 2016, 2017 and 2018, respectively. Thecurrent portion amounting to US$0.5 million, US$0.6 million and US$0.6 million is presented as“Current portion of concession rights payable” and the noncurrent portion amounting to

- 105 -
*SGVFS033016*
US$18.2 million, US$17.6 million and US$17.1 million is presented as “Concession rightspayable - net of current portion” in the consolidated balance sheets as at December 31, 2016, 2017and 2018, respectively.
24.3 Agreement for Public Concession with Societe de Gestiondu Port Autonome de Toamasina (SPAT)
On June 16, 2005, the Parent Company and SPAT signed a 20-year concession agreement for aPublic Service Concession for the operation of a container terminal in the Port of Toamasina.Under the agreement, the Parent Company, through MICTSL (a wholly owned subsidiary), willundertake container handling and related services in the Port of Toamasina. The Parent Companyagreed to pay SPAT an entry fee of €5.0 million (US$6.5 million) and fixed and variable feesconverted to MGA using the Euro/MGA weighted exchange rate published by the Central Bank ofMadagascar on the day payment is made. Fixed fees paid amounted to €1.0 million(US$1.3 million) per year for the years 2005 to 2007; €1.5 million (US$1.9 million) per year forthe years 2008 to 2010; €2.0 million (US$2.6 million) per year for years 2011 to 2015; and€2.5 million (US$3.2 million) per year for the years 2016 to 2025. The part of fixed feesattributable to year 2025 will be prorated up to the anniversary date of the concession handover.In addition, the Parent Company agreed to pay SPAT €5.0 million (US$6.5 million) for two quaycranes payable in three annual installments from the date of the agreement. Fixed and variablefees will be updated annually based on inflation rate of the Euro zone of the previous year.Annual fixed fee is payable in advance in semi-annual installments. The variable fee of€36.8 (US$47.7) per twenty-foot equivalents (TFE) is payable every 15th day of the followingmonth. However, variable fee will be reduced by 20 percent after 12 consecutive months ofoperations with container traffic of more than 200,000 TFEs.
The total variable fees paid to SPAT, shown as part of “Port authorities’ share in gross revenues”account in the consolidated statements of income, amounted to US$7.4 million (€6.7 million) in2016, US$8.0 million (€7.1 million) in 2017 and US$8.4 million (€7.1 million) in 2018. Fixedfees formed part of the capitalized concession rights which are being amortized over the period ofthe concession. Related concession rights payable amounted to US$14.8 million (€14.1 million),US$15.6 million (€13.0 million) and US$13.6 million (€11.9 million) as at December 31, 2016,2017 and 2018, respectively. The current portion amounting to US$1.1 million (€1.0 million),US$1.4 million (€1.2 million) and US$1.5 million (€1.3 million) is presented as “Current portionof concession rights payable” and the noncurrent portion amounting to US$13.7 million(€13.0 million), US$14.2 million (€11.9 million) and US$12.1 million (€10.6 million) is presentedas “Concession rights payable - net of current portion” in the consolidated balance sheets as atDecember 31, 2016, 2017 and 2018, respectively.
24.4 Concession Agreement with Autoridad Portuaria de Guayaquil (APG)
In May 2007, ICTSI, through CGSA, entered into a concession agreement with the Port Authorityof Guayaquil for the exclusive rendering of port services that includes the exploitation,construction, financing, operation, management and maintenance of container and multipurposeterminals in the Port of Guayaquil, Ecuador for a period of 20 years ending in 2027.
CGSA took over the terminal operations on August 1, 2007. The terminal handles containerizedand bulk cargo. ICTSI’s technical plan is to convert the port into a modern multipurpose terminal,comprehensive of two main facilities: a dedicated container terminal of about one millionTEUs capacity and a break bulk terminal of about three million tons (banana and other fruits arethe main cargo component in this field). ICTSI’s development plan covers a period of five toseven years for the terminal to reach the said capacities.

- 106 -
*SGVFS033016*
Under the concession agreement, CGSA undertook to pay APG the following: (i) upfront feetotaling US$30.0 million payable over five years; (ii) fixed fees of US$2.1 million payablequarterly; and (iii) variable fees of US$10.4 per TEU for containers handled and US$0.50 per tonfor noncontainerized general cargo handled payable monthly. Fixed fees and variable fees aresubject to annual increase according to index of adjustment factor calculated for the sum of0.50 consumer price index (CPI) of Ecuador and 0.50 CPI of United States of America. Theupfront fee, recorded as concession rights and concession rights payable at inception, is subject tointerest based on three-month LIBOR rate.
In October 2014, the Concession Agreement was amended in order to modify the formula ofcalculation of variable fee from November 2014 at 9.5% of total gross revenues.
The total variable port fees paid by CGSA to APG, shown as part of “Port authorities’ share ingross revenues” account in the consolidated statements of income, amounted to US$14.4 millionin 2016, US$11.2 million in 2017 and US$14.5 million in 2018. Fixed fees formed part of thecapitalized concession rights which are being amortized over the period of the concession.Related concession rights payable amounted to US$54.5 million, US$51.4 million andUS$48.0 million as at December 31, 2016, 2017 and 2018, respectively. The current portionamounting to US$3.1 million, US$3.4 million and US$3.7 million is presented as “Current portionof concession rights payable” and the noncurrent portion amounting to US$51.4 million,US$48.0 million and US$44.3 million is presented as “Concession rights payable - net of currentportion” in the consolidated balance sheets as at December 31, 2016, 2017 and 2018, respectively.
24.5 Concession Agreement with La Plata
ICTSI, through Tecplata, entered into a concession agreement with La Plata on October 16, 2008.The concession is for 30 years starting from taking bare possession of the terminal or until 2038and renewable for another 30 years with the following considerations: (i) fixed rent fee - payableon a monthly basis and in advance for AR$8.7755 (US$0.23) per square meter (sqm) per month(ii) variable royalty - payable monthly and based on annual traffic volume at the start ofcommercial operations; and (iii) assured royalty - payable annually once the terminal becomesoperative to cover fixed rent fee, variable royalty, tariff for the use of waterways and port andservice of containerized cargoes for the amount of US$4.0 million, which is to be adjustedaccording to the cost of dredging. The port of La Plata shall be operated by ICTSI throughTecplata. Tecplata took over bare possession of the terminal on November 10, 2008. OnJuly 17, 2014, an addendum to the concession agreement was signed which indicated that theterminal is considered in commercial operations for purposes of payment of US$4.0 millionassured royalty once the terminal accepts calls from post panamax vessels. The construction ofthe terminal was completed and Tecplata has obtained all the required permits since 2015 and isready to operate but still not considered in commercial operations.
In 2016, 2017 and 2018, Tecplata has paid La Plata fixed rent fee amounting to US$1.0 million,US$0.9 million and US$0.8 million, respectively.
The contract contains commitments and restrictions which include works and investments to becompleted at different stages of the concession, to wit:, among others: (i) First Stage - constructionof a dock with a length of 500 meters, a yard for handling and storage with an area of227,600 square meters, access pavements and parking lots for trucks, service facilities and internalparking lots, margins protection to avoid erosion, and a 600-meter secondary road for access to theterminal; (ii) Second Stage - extension of the main dock by 300 meters and expansion of the yardby 31,000 square meters; (iii) Third Stage - expansion of the yard for handling and storage by44,000 square meters and construction of Container Freight Station (CFS) facilities with an area of

- 107 -
*SGVFS033016*
10,000 square meters; and (iv) work completion and performance bonds amounting toUS$1.0 million and US$2.5 million, respectively. The First Stage was completed with a berth of600 meters which is 100 meters more than the required. The Second Stage and Third Stagebecome mandatory in 2028.
24.6 Agreement on Concession of Container and Ro-Ro Terminal Brajdica
In March 2011, ICTSI, through its wholly-owned subsidiary, ICBV, entered into a Share PurchaseAgreement (SPA) with Luka Rijeka, a Croatian company, to purchase a 51.0 percent interest inAGCT. AGCT operates the Brajdica Container Terminal in Rijeka, Croatia with a concessionperiod of 30 years until 2041. The concession agreement calls for a payment of fixed port fees inthe amount of US$0.60 per sqm of the occupied concession area until second quarter of 2013 andvariable port fees equivalent to 1.0 percent of annual gross revenues. After the delivery orhandover of the new area, port fees shall be as follows: fixed port fees of €4.0 (US$5.2) per sqm;and variable fees based on annual volume handled. Variable fees shall be calculated in thefollowing manner based on annual throughput: €6.4 (US$8.3) per TEU until 350,000 TEUs ofvolume handled; €4.8 (US$6.2) per TEU for annual throughput of 350,001 to 400,000 TEUs; and€3.2 (US$4.1) per TEU for volume handled above 400,000 TEUs.
Total variable fees paid by AGCT to the port authority, shown as part of “Port authorities’ share ingross revenues” account in consolidated statements of income, amounted to US$1.2 million(HRK8.4 million) in 2016, US$1.5 million (HRK10.0 million) in 2017 and US$1.7 million(HRK10.7 million) in 2018. Fixed fees formed part of the capitalized concession rights which arebeing amortized over the period of the concession. Related concession rights payable amounted toUS$12.1 million (HRK86.9 million), US$13.6 million (HRK84.3 million) and US$12.8 million(HRK82.6 million) as at December 31, 2016, 2017 and 2018, respectively. The current portionamounting to US$0.2 million (HRK1.3 million), US$0.2 million (HRK1.4 million) andUS$0.2 million (HRK1.5 million) is presented as “Current portion of concession rights payable”and the noncurrent portion amounting to US$11.9 million (HRK85.6 million), US$13.4 million(HRK82.9 million) and US$12.5 million (HRK81.1 million) is presented as “Concession rightspayable - net of current portion” in the consolidated balance sheets as at December 31, 2016, 2017and 2018, respectively.
24.7 Contract for the Operation and Managementon the New Container Terminal 2 (NCT-2 Contract)
On July 27, 2011, SBMA and ICTSI signed the concession agreement for the operation andmanagement of NCT-2 at Cubi Point in Subic, Philippines for 25 years. On August 19, 2011,SBMA approved the assignment of ICTSI’s rights, interests and obligations in the NCT-2 contractto ICTSI Subic, which was incorporated on May 31, 2011.
The NCT-2 was constructed by SBMA in accordance with the SBMA Port Master Plan and theSubic Bay Port Development Project. In consideration for the concession, ICTSI Subic shall pay:(i) base rent of US$1.005 per sqm per month with 6.0 percent escalation on the fifth year andevery three years thereafter; (ii) fixed fee of US$502,500 every year; and (iii) variable fee of 12.0percent to 17.0 percent of ICTSI Subic’s gross revenue depending on the volume of containershandled at the terminal. Under the NCT-2 Contract, ICTSI Subic shall manage and providecontainer handling and ancillary services to shipping lines and cargo owners at NCT-2. WhileSBMA shall provide the equipment at NCT-2, ICTSI Subic shall also provide additionalequipment and facilities it may deem necessary to efficiently manage NCT-2. Furthermore, ICTSISubic is committed to invest a total of P=658.0 million (approximately US$16.0 million) for theentire duration of the concession agreement.

- 108 -
*SGVFS033016*
On August 2, 2012, SBMA issued the Notice to Proceed with the operation and management ofthe NCT-2 to ICTSI Subic. Consequently, ICTSI Subic recognized the present value of fixed portfees as concession rights and concession rights payable both amounting to US$28.7 million(see Note 5).
Total variable fees paid by ICTSI Subic to SMBA, shown as part of “Port authorities’ share ingross revenues” account in consolidated statements of income, amounted to US$0.2 million in2016, US$0.6 million in 2017 and US$1.2 million in 2018. Fixed fees formed part of thecapitalized concession rights which are being amortized over the period of the concession.Related concession rights payable amounted to US$28.1 million, US$27.8 million andUS$27.4 million as at December 31, 2016, 2017 and 2018, respectively. The current portionamounting to US$0.3 million, US$0.4 million and US$0.4 million is presented as “Current portionof concession rights payable” and the noncurrent portion amounting to US$27.8 million,US$27.4 million and US$27.0 million is presented as “Concession rights payable - net of currentportion” in the consolidated balance sheets as at December 31, 2016, 2017 and 2018, respectively.
24.8 Sub-Concession Agreement (SCA) between ICTSI and Lekki Port
On August 10, 2012, ICTSI and Lekki Port signed the SCA, which grants ICTSI the exclusiveright to develop and operate the Deep Water Port in the LFTZ, and to provide certain handlingequipment and container terminal services for a period of 21 years from start of commercialoperation date. As considerations for the SCA, ICTSI shall: (i) pay royalties calculated as apercentage of Gross Revenue as defined in the SCA; (ii) pay sub-concession fee amounting toUS$25.0 million, payable in two equal tranches; (iii) pay infrastructure fee of aboutUS$37.2 million; and (iv) transfer certain equipment as specified in the SCA. The containerterminal will have a quay length of 1,200 meters, an initial draft of 14.5 meters with the potentialfor further dredging to 16 meters, and maximum handling capacity of 2.5 million TEUs. Withthese features, shipping lines will be able to call with the new regional standard large vessels,turning the port into a seminal destination for the West African region. On November 7, 2012,ICTSI through ICBV, established LICTSLE to operate the Deep Water Port in the LFTZ. In 2012,ICTSI paid US$12.5 million sub-concession fee to Lekki Port, which is recognized as ConcessionRights in the consolidated balance sheets (see Note 5). On January 26, 2014, ICBV executed aShare Purchase Agreement with CMA Terminals (CMAT), a member of CMA-CGM Group.Under the said Agreement, ICBV agreed to sell its 25 percent shareholdings in LICTSLE toCMAT, subject to certain conditions precedent to completion.
On May 17, 2017, ICTSI and Lekki Port mutually agreed to terminate the Agreement subject to apayment by Lekki Port of an agreed amount. On May 23, 2017, ICTSI received the agreedamounts of US$12.5 million representing the return of payments made to Lekki Port pursuant tothe Agreement and US$7.5 million representing compensation of costs incurred by ICTSI inrelation to the project which was recognized as “Other income” in the 2017 consolidated statementof income (see Notes 1.2 and 20.1). The termination of the Agreement was finalized and deemedeffective on May 24, 2017.
24.9 Implementation Agreement between Karachi Port Trust (KPT) andPremier Mercantile Services (PVT) Ltd. (PMS)
On June 18, 2002, KPT and PMS signed the Implementation Agreement for the exclusiveconstruction, development, operations and management of a common user container terminal atthe Karachi Port for a period of 21 years until 2023. PMS established PICT as the terminaloperating company to develop, operate and maintain the site and the terminal in accordance withthe Implementation Agreement. The Implementation Agreement sets forth the specific equipment

- 109 -
*SGVFS033016*
and construction works to be performed based on the terminal’s productivity level; calls for thepayment of fixed and variable fees; and requires the turnover of specific terminal assets at the endof the term of the Implementation Agreement. Fixed fees are in the form of Lease Payments orHandling, Marshalling and Storage charges (“HMS Charges”) at a unit rate of Rs.411 per sqm perannum in respect of the site occupied by PICT and subject to an escalation of 15 percent everythree years in accordance with the Lease Agreement between KPT and PICT, which is an integralpart of the of the Implementation Agreement. On the other hand, variable fees are in the form ofRoyalty payments at a rate of US$12.54 per Cross Berth revenue move, subject to an escalation of5 percent every three years.
Total variable fees paid to KPT, shown as part of “Port authorities’ share in gross revenues”account in the consolidated statements of income, amounted to US$8.3 million (Rs.866.4 million)in 2016, US$7.6 million (Rs.803.8 million) in 2017 and US$6.4 million (Rs.776.9 million) in2018. Fixed fees formed part of the capitalized concession rights which are being amortized overthe period of the concession. Related concession rights payable amounted to US$7.8 million(Rs.816.9 million), US$6.7 million (Rs.743.5 million) and US$4.7 million (Rs.656.5 million) as atDecember 31, 2016, 2017 and 2018, respectively. The current portion amounting toUS$0.7 million (Rs.73.4 million), US$0.8 million (Rs.87.0 million) and US$0.8 million(Rs.107.2 million) is presented as “Current portion of concession rights payable” and thenoncurrent portion amounting to US$7.1 million (Rs.743.5 million), US$5.9 million(Rs.656.5 million) and US$3.9 million (Rs.549.3 million) is presented as “Concession rightspayable - net of current portion” in the consolidated balance sheets as at December 31, 2016, 2017and 2018, respectively.
24.10 Agreement between OPC, the Republic of Honduras andBanco Financiera Commercial Hondurena, S.A
On February 1, 2013, ICTSI was awarded with a 29-year agreement by the Republic of Honduras,acting on behalf of the Commission for the Public-Private Alliance Promotion (COALIANZA),and Banco Financiera Comercial Hondurena, S.A. (FICOHSA Bank) for the design, financing,construction, maintenance, operation and development of the container terminal and general cargoof Puerto Cortés, Republic of Honduras (the “Agreement”). The Agreement was signed onMarch 21, 2013 and is valid until August 30, 2042. The Container and General Cargo Terminal ofPuerto Cortés (the “Terminal”) will have 1,100 meters of quay for containers and 400 meters ofquay for general cargo, 14 meters of dredge, 62.2 hectares of total surface area, nine ship-to-shorecranes, and a volume capacity of approximately 1.8 million TEUs.
Pursuant to the Agreement, OPC is obliged to pay certain contributions to the following:(a) Municipality of Puerto Cortés - 4% of the gross income without considering the tax over sales,payable monthly; (b) National Port Company - US$100,000 for each hectare occupied of theexisting surfaces, from the beginning of the development of the occupied spaces and the new builtsurfaces referring to the ENP Works known as OPC Works from the date of occupation, payableannually; US$75,000 for each hectare of the new built and/or earned to the sea surfaces referringto the On Demand Mandatory Works from the beginning of the operative exploitation of theoccupied surfaces, payable annually; a certain amount for each movement of the container ofimportation/exportation regardless if it is full or empty, with a right to reimbursement in anamount equivalent to 25% of the imposed amount; for the load not packed in containers -US$1 for each ton of fractioned load that is operated in the Terminal, US$5 for each unit of rollingload that is operated in the Terminal, US$1 for each passenger operated in the Terminal; Upfrontpayment of US$25.0 million; (c) COALIANZA - 2% of the total of the Reference Investment ofthe Project, paid on execution date of the Agreement; and (d) Trustee (FICOHSA Bank) - 0.37%of the annual gross income, payable monthly; and US$1,584,835 paid on execution date of the

- 110 -
*SGVFS033016*
Agreement. Total payments in relation to this Agreement aggregated US$34.9 million, which arepresented as part of “Intangibles” account in the consolidated balance sheets (see Note 5).
On October 29, 2015, the Agreement was amended to incorporate the following, among others:(a) OPC shall carry out the Works of the National Port Company relating to the construction anddevelopment of Berth 6 with a length of 550 meters out of the 1,100 meters of quay for containersunder the Agreement. OPC shall complete the second phase on June 30, 2023 at the latest; (b)10% reduction from the original variable and fixed rates related to the annual contribution paid tothe National Port Company as well as contributions per movement of container ofimportation/exportation, ton of load not packed in containers, unit of rolling load and terminalpassenger. The reduction in variable and fixed rates were effective upon the commencement of thefirst phase of berth construction subject to annual escalation based on inflation calculated asprescribed in the amended agreement; (c) reduction in the number of port equipment investmentcommitment; and (d) modification in the timing of committed investment in infrastructure andequipment.
The total variable port fees paid by OPC shown as part of “Port authorities’ share in grossrevenues” account in the consolidated statements of income amounted to US$10.9 million both in2016 and 2017 and US$11.5 million in 2018. Fixed fees formed part of the capitalized concessionrights which are being amortized over the period of the concession. Related concession rightspayable amounted to US$40.2 million, US$40.8 million and US$41.2 million as atDecember 31, 2016, 2017 and 2018, respectively, and is presented as “Concession rights payable -net of current portion” in the consolidated balance sheets.
24.11 Contract for the Construction and Operation of Three New Quays andManagement and Operation of Quay No. 20 in the Port of Umm Qasr in Iraq
ICTSI, through its wholly owned subsidiary, ICTSI Dubai and GCPI signed on April 10, 2014 theContract in the Port in Iraq. The Contract grants ICTSI the rights to: (a) manage and operate theexisting container facility at Berth 20 of the Port for a period of 10 years, (b) build in three phases,under a BOT scheme, a new container and general cargo terminal in the Port for a concessionperiod of 26 years, and (c) provide container and general cargo terminal services in bothcomponents. On March 1, 2016, the First Addendum was signed by the parties granting ICTSI,through ICTSI Dubai, the right to manage and operate an additional existing Quay No. 19 for atotal of 13 years, with the first three years for the completion of rehabilitation works. Also, theFirst Addendum extended the original term for the management and operation of Quay No. 20from 10 to 13 years. On March 26, 2017, the Second Addendum was signed by the partiesgranting ICTSI, through ICTSI Dubai, the right to manage and operate Quay No. 21 co-terminuswith the Contact and the First Addendum. The Second Addendum extended the term for themanagement and operation of Quay No. 19 and 20 from 13 to 21 years.
ICTSI commenced trial operations at Berth 20 in September 2014 and full-fledged commercialoperations in November 2014. ICTSI commenced commercial operations of Berth 19 inJune 2016. The rehabilitation works for Berth 21 are on-going and it has started operations in thethird quarter of 2018.
Phase 1 of the expansion project (Berth 27) under the BOT scheme has 250 meters of berth withan estimated capacity of 300,000 TEUs. The facility will have 600 meters of quay with anestimated capacity of 900,000 TEUs. Berth 27 was completed and fully operational in the firstquarter of 2017.

- 111 -
*SGVFS033016*
On October 22, 2017, ICTSI signed an agreement with GCPI for the Phase 2 of expansiondevelopment of the Port. The Phase 2 expansion project will involve development of two newberths, Berths 25 and 26, including a 20-hectare yard area. This expansion will increase the Port’scontainer handling capacity by 600,000 TEUs to 1,200,000 TEUs and its capability to handle largecontainer vessels of up to 10,000 TEUs. The development of this phase of the expansion project ison-going and is expected to be completed in the third quarter of 2019.
The total variable port fees paid by ICTSI Iraq computed as a percentage of revenues that variesby type of services and shown as part of “Port authorities’ share in gross revenues” account in theconsolidated statements of income amounted to US$18.1 million in 2016, US$18.9 million in2017 and US$17.6 million in 2018.
24.12 Terminal Operating Agreement and Subscription and Shareholders Agreement - Lae
Terminal Operating Agreement (TOA). In September 2017, ICTSI received a notification fromPNG Ports Corporation Limited (PNGPCL), a PNG state-owned enterprise, of the confirmation bythe Independent Consumer and Competition Commission in PNG with respect to the 25-yearagreement signed by ICTSI’s PNG subsidiary, SPICTL, with PNGPCL for the operation,management and development of the international port in Lae in PNG. SPICTL was allowed byPNGPCL to take over the port facilities and begin operations at the Port of Lae in February2018. The TOA and other related contracts took effect on June 1, 2018 after all the parties havecomplied with the agreed conditions precedent.
The initial annual rent amounted to PGK22.8 million (US$6.9 million) and is subject to periodicreview. The TOA also required the payment of advance rent amounting to PGK57.0 million(US$17.3 million) to be applied equally over the first 10 years of the term of the TOA.
Fixed fees formed part of the capitalized concession rights which are being amortized over theperiod of the concession. Related concession rights payable amounted to US$45.3 million(PGK152.7 million) as at December 31, 2018 and is presented as “Concession rights payable - netof current portion” in the consolidated balance sheets.
Subscription and Shareholders Agreement (SSA). ICTSI, through its subsidiaries, ISPL andSPICTL entered into a SSA with the impacted communities (IC) for the management andgovernance of and the further transfers and/or issues of shares of SPICTL. The SSA becameeffective upon the effectivity of the TOA for Lae on June 1, 2018. Within one year from theeffectivity date of the SSA and upon the required written notification by ICTSI, through ISPL, theICs have the right to subscribe up to 30% of the total initial shares of SPICTL. Pre-emptive rightson additional subscriptions are available to all shareholders. As of December 31, 2018, the ICshave not exercised their right to subscribe pending the finalization of the capital structure ofSPICTL.
24.13 Terminal Operating Agreement and Subscription and Shareholders Agreement - Motukea
Terminal Operating Agreement (TOA). In September 2017, ICTSI received a notification fromPNGPCL, a PNG state-owned enterprise, of the confirmation by the Independent Consumer andCompetition Commission in PNG with respect to the 25-year agreement signed by ICTSI’s PNGsubsidiary, MITL, with PNGPCL for the operation, management and development of theinternational port in Motukea in PNG. MITL was allowed by PNGPCL to take over the portfacilities and begin operations at the Port of Motukea in May 2018. The TOA and other relatedcontracts took effect on June 1, 2018 after all the parties have complied with the agreed conditionsprecedent.

- 112 -
*SGVFS033016*
The initial annual rent amounted to PGK16.2 million (US$5.2 million) and is subject to periodicreview. The TOA also required the payment of advance rent amounting to PGK43.0 million(US$13.1 million) to be applied equally over the first 10 years of the term of the TOA.
Fixed fees formed part of the capitalized concession rights which are being amortized over theperiod of the concession. Related concession rights payable amounted to US$34.2 million(PGK115.2 million) as at December 31, 2018 and is presented as “Concession rights payable - netof current portion” in the consolidated balance sheets.
Subscription and Shareholders Agreement (SSA). ICTSI, through its subsidiaries, ISPL and MITLentered into a SSA with the impacted communities (IC) for the management and governance ofand the further transfers and/or issues of shares of MITL. The SSA became effective upon theeffectivity of the TOA for MITL on June 1, 2018. Within one year from the effectivity date of theSSA and upon the required written notification by ICTSI, through ISPL, the ICs have the right tosubscribe up to 30% of the total initial shares of MITL. Pre-emptive rights on additionalsubscriptions are available to all shareholders. As of December 31, 2018, the ICs have notexercised their right to subscribe pending the finalization of the capital structure of MITL.
24.14 Concession Agreement between Sea PortsCorporation of Sudan and ICTSI Middle East DMCC
On January 3, 2019, ICTSI, through its wholly-owned subsidiary ICTSI Middle East DMCC,signed a Concession Agreement with the SPC to operate, manage and develop the SPCT at the portof Port Sudan, Republic of the Sudan for 20 years. Pursuant to the concession agreement, ICTSI isrequired to pay: (a) an upfront fee of €530.0 million in installments of €410.0 million(US$467.2 million) and five other installments each in the amount of €24.0 million(US$27.3 million) from the third to the seventh operation year; (b) fixed monthly fee of€1.0 million in the first 72 months of the concession term and €1.5 million, subject to adjustments,for the remainder of the term; and (c) royalty fee of 14% of gross revenue during the first sixoperating years of the concession and 16% of gross revenue starting the seventh operating year.
The port of Port Sudan is the only major modern port in the country and serves as the internationalgateway for more than 95% of Sudan’s cargo flows. In February 2019, ICTSI established AGT, aSudanese entity, to operate the container terminal. The Group is currently working with SPC forthe handover preparations and is expecting to take over the container terminal in the first half of2019. In January 2019, ICTSI paid the initial installment of upfront fee of €410.0 million(US$467.2 million).
Agreements outside the Scope of IFRIC 12and Accounted by the Group in Accordance with IFRIC 4
Agreements outside the scope of IFRIC 12 are assessed in accordance with IFRIC 4. Anarrangement is within the scope of IFRIC 4 if: (a) the fulfillment of the arrangement is dependenton the use of a specific asset or assets (the asset); and (b) the arrangement conveys a right to usethe asset.
24.15 Lease Agreement for the Installation and Exploitation of a Container Terminal for Mixed Private Use of the Port of Suape-Complexo Industrial Portuario (Suape)
On July 2, 2001, TSSA entered into a lease agreement with Suape for the operation anddevelopment of a container terminal in a port in Suape, Brazil for a period of 30 years startingfrom the date of agreement. In consideration for the lease, TSSA shall pay Suape a fee in

- 113 -
*SGVFS033016*
Brazilian Reais (R$) consisting of three components: (i) R$8.2 million, payable within 30 daysfrom the date of agreement; (ii) R$3.1 million, payable in quarterly installments; and (iii) anamount ranging from R$15 to R$50 (depending on the type of container and traffic, i.e., full,empty/ removal and transshipment) handled for each container, payable quarterly. For the thirdcomponent of the fee (which rates per container increase by 100 percent every ten years), if thetotal amount paid for containers handled in the four quarters of the year is less than the assuredminimum amount for such component indicated in the agreement, TSSA will pay the difference toSuape based on a certain formula. The lease fee is subject to readjustment annually, unless thereis a change in legislation, which allows a reduction in the frequency of readjustment, based on acertain formula contained in the agreement.
Under the lease agreement, TSSA undertakes to make the investment in works, equipment,systems and others necessary to develop and operate the Suape port within the agreed time frame.
Upon the expiration of the term of the contract or in the event of pre-termination, the building andother structures constructed in the port by TSSA shall become the property of Suape in addition toassets originally leased by Suape to TSSA. TSSA may remove movable goods from the containerterminal, unless the parties agree otherwise.
Total variable fees paid to Suape, shown as part of “Port authorities’ share in gross revenues”account in the consolidated statements of income, amounted to US$16.3 million (R$56.9 million)in 2016, US$21.3 million (R$68.2 million) in 2017 and US$21.6 million (R$79.0 million) in 2018.Total fixed fees paid to Suape, shown as part of “Equipment and facilities-related expenses”account in the consolidated statements of income, amounted to US$3.7 million (R$12.9 million) in2016, US$4.2 million (R$13.6 million) in 2017 and US$3.8 million (R$14.0 million) in 2018.
Minimum lease payments relating to this agreement are as follows: due in 2019 amounted toUS$7.4 million (R$28.6 million); due starting 2020 up to 2023 totaled US$59.1 million(R$229.3 million); and due starting 2024 onwards totaled US$124.6 million (R$483.4 million).
24.16 Contracts with Gdynia Port Authority (the “Harbour”)
On May 30, 2003, the Parent Company and the Harbour signed three Agreements, namelyAgreement on Commercial Cooperation, Lease Contract and Contract for Sale of Shares, whichmarked the completion of the privatization of BCT. BCT owns the terminal handling assets andan exclusive lease contract to operate the Gdynia container terminal for 20 years until 2023,extendable for another specified or unspecified period, depending on the agreement.
Under the Agreement on Commercial Cooperation, US$78.0 million is the estimated investmentfor terminal improvements over the life of the concession, of which €20.0 million is necessarywithin the first eight-year period. As at December 31, 2018, BCT invested US$110.5 million(€89.0 million), thus exceeding the minimum investment level required.
In the original Lease Contract signed between the Harbour and the original owners of BCT, theHarbour shall lease to BCT its land, buildings and facilities for a period of 20 years for aconsideration of Polish zloty (PLN) equivalent of US$0.62 million per month to be paid inadvance. Subsequently, twenty-two amendments in the contract were made reducing the monthlyrental to US$0.61 million and US$0.55 million in May 2004 and October 2013, respectively.Under the revised Agreement with BCT, the Harbour further reduced the rental fee byUS$0.9 million (PLN2.8 million) annually effective January 1, 2005. This amount has beentranslated into US dollar using the average exchange rate of US dollar effective in the NationalBank of Poland as at December 31, 2004, and deducted from the existing rental rate in US dollar.
- 114 -
*SGVFS033016*
Total fees paid to the Harbour pertaining to the Lease Contract, shown as part of “Equipment andfacilities-related expenses” account in the consolidated statements of income, amounted toUS$6.6 million both in 2016 and 2017 and US$6.7 million in 2018.
Minimum lease payments relating to this agreement are as follows: due in 2019 amounted toUS$6.6 million; and due starting 2020 up to 2023 totaled US$22.8 million.
24.17 Concession Agreement with Batumi Port Holdings Limited (BPHL)
In September 2007, IGC obtained the concession from BPHL to develop and operate a containerterminal and a ferry and dry bulk handling facility in the Port of Batumi in Georgia. BPHL has theexclusive management right over the State-owned shares in Batumi Sea Port Limited (BSP). IGCestablished BICTL to operate the concession.
In relation to the concession, BICTL, through IGC, entered into a lease and operating agreementwith BSP for a 48-year lease over a total area of 13.6 hectares of land in Batumi Port, consisting ofBerths 4 and 5 for a container terminal, and Berth 6 as ferry terminal and for dry bulk generalcargo. The lease and operating agreement will expire on June 30, 2055. IGC paid BPHLUS$31.0 million, shown as “Intangible assets” account in the consolidated balance sheets andamortized up to year 2055, in consideration of the procurement for the lease between BICTL andBSP. Under the lease and operating agreement between BICTL and BPHL, BICTL shall pay BSPan annual rent of US$0.1 million from November 2, 2007 to 2008, US$0.2 million fromNovember 2, 2008 to 2009, US$0.5 million from November 2, 2009 to 2011 and US$0.8 millionfrom November 2, 2011 to expiration date of the contract as stipulated in the agreement.
Minimum lease payments relating to this agreement are as follows: due in 2019 amounted toUS$0.6 million; due starting 2020 up to 2023 totaled US$2.9 million; and due starting 2024onwards totaled US$25.7 million.
Total fixed fees paid to BSP, shown as part of “Equipment and facilities-related expenses” accountin the consolidated statements of income, amounted to US$0.6 million in 2016, US$0.7 millionboth in 2017 and 2018.
24.18 Concession Contract for the Management and Operation of the MCT
On April 25, 2008, Phividec Industrial Authority (PIA) awarded the management and operation ofMCT in Misamis Oriental, in the Philippines to ICTSI. The concession contract is for a period of25 years starting from the date of the agreement. ICTSI established MICTSI to operate theconcession. Under the contract, MICTSI shall be responsible for planning, supervising andproviding full terminal operations for ships, container yards and cargo handling. MICTSI shallalso be responsible for the maintenance of the port infrastructure, facilities and equipment set forthin the contract and shall procure any additional equipment that it may deem necessary for theimprovement of MCT’s operations. In consideration for the contract, MICTSI shall pay PIA fixedfee of P=2,230.0 million (US$46.9 million) payable in advance in quarterly installments andvariable fees based on percentages of MICTSI’s gross revenue ranging from15 to 18 percent during the term of the contract. The said fixed fees will be subject torenegotiation by both parties after five years and every five years thereafter, taking intoconsideration variances between the projected and actual cargo volumes. The total variable feespaid to PIA, shown as part of “Port authorities’ share in gross revenues” account in theconsolidated statements of income, amounted to US$2.0 million (P=96.4 million) in 2016,US$2.0 million (P=102.6 million) in 2017 and US$2.2 million (P=114.5 million) in 2018. Totalfixed fees paid to PIA, shown as part of “Equipment and facilities-related expenses” account in the

- 115 -
*SGVFS033016*
consolidated statements of income amounted to US$1.3 million (P=60.0 million) in 2016,US$1.2 million (P=60.0million) in 2017 and US$1.6 million (P=85.0 million) in 2018.
Minimum lease payments relating to this agreement are as follows: due in 2019 amounted toUS$1.8 million (P=95.0 million); due starting 2020 up to 2023 totaled US$8.9 million(P=470.0 million); and due starting 2024 onwards totaled US$20.5 million (P=1.1 billion).
24.19 Deed of Usufruct between Tecplata and Compañia Fluvial del Sud, S.A.
In 2008, Tecplata entered into an operating lease agreement with Compañia Fluvial del Sud, S.A.for the use of land and real property in relation to Tecplata’s contract to operate the port of LaPlata in Argentina. The lease agreement is for 20 years, starting in 2010, subject to renewal foranother 20 years at the option of Tecplata. This agreement is accounted for as an operating lease.Consequently, Tecplata capitalized the related rental expense as part of the cost of port facilitiesand recognized under “Intangibles” account in the consolidated balance sheet during the period ofconstruction until such time that the port facilities will be available for use. OnDecember 20, 2010, Tecplata and Compañia Fluvial del Sud, S.A. executed an amendment to thelease agreement which provided that: (i) in 2010, Tecplata should not have to make any paymentsin connection with the lease; (ii) from January 2011, Tecplata shall pay a monthly lease ofUS$17,500 (approximately AR$87,500); and (iii) from the month following the commencement ofoperations in the terminal, monthly payments shall be US$35,000 (approximately AR$175,000),which was the amount originally agreed upon by both parties. In addition, the accumulateddiscount as a result of the amendment in 2010 relating to lease payments in 2011, 2012 and 2013with respect to the original values of the lease amounting approximately US$0.5 million (as atDecember 31, 2013) would be paid in 36 installments once Tecplata starts operations (thementioned discount was paid in 2014). Tecplata paid US$0.4 million each in 2016, 2017 and2018 to Compañia Fluvial del Sud, S.A. included as part of “Equipment and facilities-relatedexpenses” in the consolidated statements of income.
Minimum lease payments relating to this agreement are as follows: due in 2019 amounted toUS$0.4 million; due starting 2020 up to 2023 totaled US$1.7 million; and due starting 2024onwards totaled US$6.3 million.
24.20 Contract Granting Partial Rights and Obligations to Contecon Manzanillo, S.A. de C.V.
In November 2009, ICTSI was declared by the Administracion Portuaria Integral de Manzanillo,S.A., de C.V. (API) the winner of a 34-year concession for the development and operation of thesecond Specialized Container Terminal (TEC-II) at the Port of Manzanillo. ICTSI establishedCMSA on January 6, 2010 to operate the Port of Manzanillo. The concession agreement wassigned on June 3, 2010. CMSA paid upfront fees of MXN50.0 million (US$4.0 million) to API intwo installments: MXN25.0 million (US$2.0 million) on June 3, 2010, the date of signing of thecontract; and another MXN25.0 million (US$2.0 million) on September 17, 2010.
Under the terms of the contract granting partial rights and obligations, CMSA will build, equip,operate and develop the terminal that will specialize in the handling and servicing of containerizedcargo. Investments in the Port of Manzanillo include maritime works, dredging, quay (includingcrossbeams and fenders), maneuver yards, storage installations, land access and signals, as well asall those works necessary to fulfill the productivity indexes contained in the contract.
The port facilities will be turned over by API to CMSA in three phases: (a) Phase I, North Area,Position 18: 379,534.217 sqm of the federal land area and 18,000 sqm of the maritime area; (b)Phase II, Centre Area Position 19: 158,329.294 sqm of the federal land area and 18,000 sqm of the

- 116 -
*SGVFS033016*
maritime area; and (c) Phase III, South Area (Position 20): 186,355.22 sqm of the federal land areaand 18,000 sqm of the maritime area. On November 30, 2010, the first phase of the ceded areawas formally delivered to CMSA while a portion of the second phase of the ceded area equivalentto 42,000 sqm of the federal land area and 18,000 sqm of the maritime area were delivered inadvance to CMSA. The remaining portion of the second phase of the ceded area equivalent to116,329.294 sqm was delivered to CMSA on June 30, 2017. CMSA will formally request for thedelivery of the third phase of the ceded area not later than January 1, 2020.
CMSA shall pay annual fixed fees of MXN163.0 million (US$12.9 million), MXN75.5 million(US$6.0 million) and MXN 83.8 million (US$6.6 million) for the first, second and third phases ofthe ceded area, respectively. The annual fixed fees shall be paid and adjusted based on CPI on amonthly basis. Further, CMSA shall pay monthly variable fees of US$10.40 (MXN200) per TEU,up to a maximum volume of 1,500,000 TEUs per year. The contract requires the payment of aminimum variable fee calculated based on a certain minimum guaranteed volume per year startingon the sixth year of the contract until the end of the concession.
CMSA started commercial operations in November 2013. The total variable fees paid by CMSA,shown as part of “Port authorities’ share in gross revenues” account in the consolidated statementsof income amounted to US$12.0 million in 2016, US$15.6 million in 2017 and US$15.1 million in2018. Total fixed fees paid by CMSA, shown as part of “Equipment and facilities-relatedexpenses” account in the consolidated statements of income, amounted to US$10.6 million in2016, US$13.9 million in 2017 and US$14.2 million in 2018.
Minimum lease payments relating to this agreement are as follows: due in 2019 amounted toUS$16.8 million, due starting 2020 up to 2023 totaled US$98.4 million; and due starting 2024onwards totaled US$679.3 million.
24.21 Lease Agreement between the Port of Portland and ICTSI Oregon
On May 12, 2010, ICTSI Oregon signed a 25-year lease with the Port of Portland for thecontainer/break bulk facility at Terminal 6. Under the terms of the agreement, ICTSI Oregon andICTSI paid the Port of Portland US$8.0 million (US$2.0 million on May 12, 2010 as a signingdeposit; and the remaining US$6.0 million on August 12, 2010) in addition to an annual rentpayment of US$4.5 million, subject to any increases in the consumer price index. As terminalvolume increases over time, ICTSI will pay the Port of Portland additional incremental revenueper container moved. Furthermore, the Port of Portland shall; (a) demise and lease the terminalland, the improvements, cranes, and all appurtenances pertaining thereto or arising in connectiontherewith to ICTSI, for and during the term of the lease; (b) grant an exclusive right to conductstevedoring services at the terminal and to operate, manage, maintain and rehabilitate the portinfrastructure, as well as to provide terminal services and collect and retain user fees; and (c) granta non-exclusive right during the term of the lease to use the common areas in connection withpermitted uses of the terminal.
The US$8.0 million upfront fee was allocated to concession rights and property and equipmentamounting to US$4.2 million and US$3.8 million, respectively. ICTSI Oregon took over theoperations of the Terminal 6 of the Port of Portland on February 12, 2011.
Total fees paid to the Port of Portland pertaining to the lease agreement, shown as part of“Equipment and facilities-related expenses” account in the consolidated statements of income,amounted to US$4.8 million in 2016 and US$59.1 thousand in 2017.
- 117 -
*SGVFS033016*
In October 2016, the Board of ICTSI Ltd. has authorized the management of ICTSI Oregon tonegotiate with the Port of Portland and reach terms mutually acceptable to both parties withrespect to the termination of the lease agreement after two major customers, Hanjin Shipping Co.and Hapag-Lloyd, stopped calling the Port of Portland in March 2015 due to continuing labordisruptions. During the latter part of 2016, the Port of Portland and ICTSI Oregon begandiscussions of a mutual agreement to terminate the lease agreement. As of December 31, 2016,the Company provided for the amount of probable loss on the pre-termination of the leaseagreement based on the Group’s best estimate of the probable outcome of the negotiations with thePort of Portland. The estimated amount of probable loss from the pre-termination of the leaseagreement charged to the 2016 consolidated statement of income was US$23.4 million, whichincludes the carrying value of the container handling equipment and spare parts (see Notes 1.2, 9and 20.3).
On March 8, 2017, ICTSI, through ICTSI Oregon, and the Port of Portland signed a LeaseTermination Agreement and both parties have mutually agreed to terminate the 25-year LeaseAgreement to operate the container facility at Terminal 6 of the Port of Portland with an effectivedate of March 31, 2017. The Lease Termination Agreement allowed ICTSI Oregon to be relievedof its long-term lease obligations. In exchange, the Port of Portland received US$11.45 million incash compensation on March 29, 2017 and container handling equipment, including spare partsand tools on March 31, 2017.
As a result of the Lease Termination Agreement, ICTSI Oregon is no longer engaged in containeroperations at Terminal 6 or at any other locations. ICTSI Oregon’s activities are currently devotedto supporting the on-going legal proceedings.
24.22 Development Agreement between VICT and POMC
On May 2, 2014, ICTSI, through its subsidiary in Australia, VICT, signed a contract in Melbournewith POMC for the design, construction, commissioning, operation, maintaining and financing ofthe Webb Dock Container Terminal (Terminal) and Empty Container Park (ECP) at Webb DockEast (WDE) in the Port of Melbourne. The Contract grants VICT the rights to: (a) design, buildand commission the new Terminal at berths WDE 4 and WDE 5; (b) design, build andcommission the new ECP at WDE; and (c) operate the Terminal and ECP until June 30, 2040.
Phase 1 of the Terminal and the ECP with capacities of 350,000 TEUs and 250,000 TEUs,respectively, commenced commercial operations in the second quarter of 2017. Phase 2 of theTerminal commenced commercial operations in the first quarter of 2018 and has increased thecapacity to 1,000,000 TEUs.
Total fixed fees paid by VICT, shown as part of “Equipment and facilities-related expenses”account in the consolidated statements of income, amounted to US$34.2 million(AUD44.6 million) in 2017 and US$60.0 million (AUD80.3 million) in 2018.
Minimum lease payments relating to this agreement are as follows: due in 2019 amounted toUS$56.6 million (AUD80.3 million); due starting 2020 up to 2023 totaled US$226.5 million(AUD321.3 million); and due starting 2024 onwards totaled US$1.1 billion (AUD1.6 billion).Accrued rent amounted to US$149.6 million (AUD207.5 million), US$100.3 million(AUD128.5 million) and US$147.2 million (AUD208.8 million) as at December 31, 2016, 2017and 2018, respectively, calculated using the straight-line method from the inception of the contactin June 2014. The noncurrent portion of the accrued rent was included as part of “Othernoncurrent liabilities” account while the current portion was included as part of “Accounts payableand other current liabilities” account in the consolidated balance sheets. The current portion of the

- 118 -
*SGVFS033016*
accrued rental of VICT amounting to US$85.0 million (AUD117.9 million) as atDecember 31, 2016 and nil as of December 31, 2017 and 2018 (see Notes 16 and 18).
24.23 Concession to Construct and Operate aMaritime Container Terminal in the Port of Tuxpan
On May 27, 2015, ICTSI, through its subsidiary, ICTSI Tuxpan B.V., acquired from Grupo TMMS.A.B and Immobiliaria TMM S.A. de C.V 100 percent of the capital stock of TMT forUS$54.5 million. TMT is a company duly incorporated in accordance with the laws of Mexicowith a concession to construct and operate a maritime container terminal in the Port of Tuxpan,Mexico and is the owner of the real estate where the maritime container terminal will beconstructed. The concession agreement is valid until May 25, 2021, subject to extension foranother 20 years. The concession covers an area of 29,109.68 square meters, which is adjacent tothe 43 hectares land owned by TMT. Under the concession agreement, TMT is liable andcommitted to: (1) pay fixed fee of MXN23.24 plus VAT, per square meter of assigned area; and(2) pay minimum guaranteed fee starting January 2018 ranging from MXN145.33 (US$9.51) perTEU to MXN340.60 (US$22.29) per TEU for containerized cargo and MXN3.37 (US$0.22) perton to MXN5.62 (US$0.37) per ton for general cargo, based on agreed minimum volume. As ofMarch 5, 2019, management is currently working on a development plan on TMT.
The total variable fees paid by TMT, shown as part of “Port authorities’ share in gross revenues”account in the consolidated statement of income, amounted to US$0.3 million (MXN5.1 million)in 2018. Total fixed fees paid by TMT pertaining to the concession agreement, shown as part of“Equipment and facilities-related expenses” account in the consolidated statements of income,amounted to US$0.4 million (MXN8.3 million) in 2016, US$0.5 million (MXN8.6 million) in2017 and US$0.5 million (MXN9.1 million) in 2018.
Minimum lease payments relating to this agreement are as follows: due in 2019 amounted toUS$1.0 million (MXN20.0 million) and due in 2020 totaled US$1.0 million (MXN20.0 million).
Agreements outside the Scope of IFRIC 12 and IFRIC 4
24.24 Shareholders’ Agreement (Agreement) with AG&P
On September 30, 1997, IWI CTHI entered into an Agreement with AG&P forming BIPI. BIPIdeveloped the property acquired from AG&P at Bauan, Batangas into an international commercialport duly licensed as a private commercial port by the PPA.
Simultaneous with the execution of the Agreement, AG&P executed a Deed of Conditional Sale infavor of IWI CTHI conveying to the latter a parcel of land for a total purchase price ofP=632.0 million (equivalent to US$12.0 million as at December 31, 2018). The said land wastransferred by IWI CTHI to BIPI under a tax-free exchange of asset for shares of stock.
24.25 Cooperation Agreement for the Procurement, Installation and Operationof Container Handling Equipment under a Revenue Sharing Schemeat the Makassar Container Terminal Port of Makassar, South Sulawesi, Indonesia
MTS has an existing agreement with PT Pelabuhan Indonesia IV (Pelindo), the Indonesiangovernment-owned corporation that owns and operates the Makassar Container Terminal, for theprocurement, installation and operation of Container Handling Equipment (CHE) at the MakassarContainer Terminal under a revenue sharing scheme for ten years until 2013, renewable foranother 10 years by mutual agreement. In December 2012, MTS extended the joint operation

- 119 -
*SGVFS033016*
contract, which will originally expire on September 30, 2013, until February 1, 2023. Under theagreement, MTS provides and operates CHE at the Port of Makassar. For the services provided,MTS is paid by Pelindo 60 percent of the gross revenue based on the published tariff for theoperation of CHE owned by MTS. MTS’ share in gross revenues included under “Gross revenuesfrom port operations” account in the consolidated statements of income amounted toUS$2.7 million (IDR35.7 billion) in 2016, US$3.0 million (IDR40.0 billion) in 2017 andUS$3.2 million (IDR45.6 billion) in 2018.
24.26 Long-term Contract for the Operations of Cargo Handling Services at Makar Wharf
On February 20, 2006, the PPA granted SCIPSI a ten-year contract for the exclusive managementand operation of arrastre, stevedoring, and other cargo handling services, except porterage, atMakar Wharf, Port of General Santos, General Santos City in the Philippines that expired onFebruary 19, 2016. Thereafter, the PPA granted SCIPSI a series of hold-over authority on atemporary basis over the cargo handling services at Makar Wharf, Port of General Santos. OnFebruary 22, 2018, the PPA issued AO No. 04-2018 directing all Port Managers of the PPA togrant hold-over authorities to cargo handling service providers with contracts due to expire in2018, for six months, unless earlier terminated by the PPA or upon award of a new terminalmanagement contract in accordance with PPA AO No. 03-2016. On June 21, 2018, the hold-overauthority was issued by the PPA with a validity of six months starting February 25, 2018 until theaward of a new contract by the PPA, whichever is earlier, unless cancelled or revoked for reasonby the PPA during the validity of the hold-over authority. On October 19, 2018, the hold-overauthority was issued by the PPA with a validity of six months starting August 25, 2018 or until theaward of a new contract by the PPA, whichever is earlier, unless cancelled or revoked for reasonby the PPA during the validity of the hold-over authority. As of March 5, 2019, SCIPSI has notreceived a new hold-over authority.
The total variable fees paid by SCIPSI to PPA computed as a percentage of revenues and shown aspart of “Port authorities’ share in gross revenues” account in the consolidated statements ofincome amounted to US$1.3 million (P=61.5 million) in 2016, US$1.3 million (P=63.9 million) in2017 and US$1.4 million (P=75.0 million) in 2018.
24.27 Long-term Contract for the Operations of Cargo Handling Services at Sasa Wharf
On April 21, 2006, the PPA granted DIPSSCOR a ten-year contract for cargo handling services atSasa Wharf, Port of Davao in the Philippines that expired on April 20, 2016. Thereafter, the PPAgranted DIPSSCOR a series of hold-over authority on a temporary basis over the cargo handlingservices at Sasa Wharf, Port of Davao. On February 22, 2018, the PPA issued AO No. 04-2018directing all Port Managers of the PPA to grant hold-over authorities to cargo handling serviceproviders with contracts due to expire in 2018, for six months, unless earlier terminated by thePPA or upon award of a new terminal management contract in accordance withPPA AO No. 03-2016 entitled “Port Terminal Management Regulatory Framework”. OnJune 11, 2018, the hold-over authority was issued by the PPA with a validity of six monthsstarting February 26, 2018 until the award of a new contract by the PPA, whichever is earlier,unless cancelled or revoked for reason by the PPA during the validity of the hold-over authority.On November 12, 2018, the hold-over authority was issued by the PPA with a validity of sixmonths starting August 26, 2018 or until the award of a new contract by the PPA, whichever isearlier, unless cancelled or revoked for reason by the PPA during the validity of the hold-overauthority. As of March 5, 2019, DIPSSCOR has not received a new hold-over authority.

- 120 -
*SGVFS033016*
The total variable fees paid by DIPSSCOR to PPA computed as a percentage of revenues andshown as part of “Port authorities’ share in gross revenues” account in the consolidated statementsof income amounted to US$1.4 million (P=66.3 million) in 2016, US$1.4 million (P=71.6 million) in2017 and US$1.5 million (P=80.1 million) in 2018.
24.28 Joint Venture Contract on Yantai Rising Dragon InternationalContainer Terminal, Ltd. (YRDICTL) and YICT
In January 2007, the Group (through IHKL) entered into a joint venture contract with YPG andSDIC Communications, Co. on YRDICTL to operate and manage the Yantai port in ShandongProvince, China. The registered capital of YRDICTL is RMB600.0 million (equivalent toUS$99.1 million as at December 31, 2013) and the term of the joint venture is 30 years, and maybe extended upon agreement of all parties. The joint venture became effective onFebruary 28, 2007.
In 2010, YPG and SDIC invested its 40 percent stock holdings in YRDICTL into YPH. As such,the non-controlling shareholder of the Company was changed from YPG and SDIC to YPH.
Pursuant to a joint venture agreement, the Board of YRDICTL shall be comprised of fivemembers, three of which the Group has the right to elect. The land operated by YRDICTL wascontributed as an in-kind capital contribution by YPG for a period of 30 years.
On July 1, 2014, the Group, through its subsidiary IHKL, acquired 51 percent of the total equityinterest of YICT and the Group sold its 60 percent ownership interest in YRDICTL to YPH. TheGroup entered into a joint venture agreement on YICT with DP World and YPH for a period of29 years until September 29, 2043, and may be extended upon agreement of all parties. Theobjective of these transactions is to consolidate and optimize the overall port operations within theZhifu Bay Port Area in Yantai, China. YICT became the only foreign container terminal withinthe Zhifu Bay Port Area. DP World China (Yantai) and YPH owns 12.5 percent and 36.5 percentownership interest in YICT, respectively, with ICTSI as the majority shareholder.
Pursuant to the said joint venture agreement, the Board of YICT shall be comprised of sixmembers, three of which the Group has the right to elect. The Chairman of the Board shall beappointed by the Group and the said Chairman shall be entitled to a casting vote in the event ofequality of votes. The Group is also entitled to appoint the General Manager and FinancialController. The land operated by YICT was contributed by YPH and is valid untilAugust 28, 2043.
YICT is authorized by YPH to collect, on its behalf, the port charges (including port chargeslevied on cargoes and facilities security fees) in accordance with the state regulations and shall,after retaining 50% of the port charges levied on cargoes (as the fees for maintaining the facilitieswithin the port owned by YICT) and 80% of the facilities security fees (as the fees for maintainingand improving the security facilities within the terminal owned by YICT) collected, pay to YPHthe remaining parts no later than the fifteenth (15th) day of the following month.
The total variable fees paid by YICT to YPH, shown as part of “Port authorities’ share in grossrevenues” account in the consolidated statements of income, amounted to US$2.1 million(RMB13.7 million) in 2016, US$2.1 million (RMB14.2 million) in 2017 and US$2.2 million(RMB14.8 million) in 2018.

- 121 -
*SGVFS033016*
24.29 Cooperation Agreement for Operation of Terminal Area III of the Tanjung Priok Port atJakarta, Indonesia between PT Pelabuhan Indonesia II (Pelindo) and OJA
OJA has existing cooperation agreements with Pelindo under a revenue sharing scheme coveringthe terminal operations of berths 300, 301, 302 and 303 located in Terminal Area III (referred to as“Cooperation Area”) of the Tanjung Priok Port, Jakarta, Indonesia. OJA and Pelindo share a fixedpercentage based on various activities or services with container handling equipment and otherfacilities provided and operated by OJA in the Cooperation Area including stevedoring, lift-on/liftoff, reefer container plugging and monitoring, trucking, and container customs inspection. Thecooperation agreement was signed on March 7, 2011 and expired on March 7, 2013. OnJune 5, 2013, OJA signed a 15-year Cooperation Agreement with Pelindo for internationalcontainer stevedoring services wherein the parties will share a fixed percentage of revenues.Pending the fulfillment of certain conditions, the 15-year term of the Cooperation Agreement hasnot yet commenced as of March 5, 2019. The refrigerated container plugging and monitoring andinspection of container customs are being renewed yearly.
OJA’s share in gross revenues included under “Gross revenues from port operations” account inthe consolidated statements of income amounted to US$8.4 million (IDR112.4 billion) in 2016,US$9.7 million (IDR129.7 billion) in 2017 and US$7.8 million (IDR111.6 billion) in 2018.
24.30 Shareholders’ Agreement on IDRC
On January 23, 2014, the Group, through its subsidiary, ICTSI Cooperatief, forged a businesspartnership with SIMOBILE for the establishment and formation of a joint venture company,IDRC. IDRC, which is then 60 percent-owned by ICTSI Cooperatief, will build a new terminalalong the river bank of the Congo River in Matadi and manage, develop and operate the same as acontainer terminal, as well as provide exclusive container handling services and general cargoservices therein.
At incorporation, the share capital of IDRC amounted to US$12.5 million represented by12,500 ordinary voting shares. IDRC was incorporated for an initial term of 99 years, subject toearly dissolution or prorogation. ICTSI contributed US$2.0 million cash upon incorporation andthe US$5.5 million cash in tranches while SIMOBILE contributed land valued at US$5.0 million.On May 19, 2015, ICTSI, through its subsidiary, ICTSI Cooperatief, and its joint venture partner,SIMOBILE, transferred their respective 8% and 2% ownership interest in IDRC to SCTP SA inexchange for the latter’s contribution of technical knowledge, skills and substantial experience inthe port and port system in DRC and operation of railroad system and undertaking to facilitate theactivities of IDRC and to assist in its relations with the public authorities. SIMOBILE transferredto its subsidiary, SIP Sprl, its 10% ownership in IDRC. Thereafter, IDRC is owned 52% byICTSI, 28% by SIMOBILE, 10% by SIP Sprl and 10% by SCTP SA.
Pursuant to the shareholders’ agreement, the Board of IDRC shall be comprised of six members,four of which will be appointed by the Group.
Phase 1 of the facility consists of two berths that can handle 175,000 TEUs and 350,000 metrictons. The capacity and berth length can, subject to demand, be doubled in Phase 2. Phase 1 wascompleted in the fourth quarter of 2016. Initial operations started in the third quarter of 2016while commercial operations started in January 2017.

- 122 -
*SGVFS033016*
Other Contracts and Agreements
24.31 Services Agreement (“Agreement”) with the Government ofHis Majesty the Sultan and Yang Di-Pertuan of Brunei Darussalam (the Government)
On May 21, 2009, ICTSI entered into an Agreement with the Government for the operation andmaintenance of the Muara Container Terminal in Brunei Darussalam. The Agreement was validfor a period of four years from commencement date or May 22, 2009. The term was extendiblefor a period of one year at a time, for a maximum of two years subject to the mutual agreement ofthe parties. In consideration for the services, the Government paid the operator US$7.0 million forthe first year, US$6.9 million for the second year, US$7.3 million for the third year, andUS$7.7 million for the fourth year. On the optional fifth and sixth years, the operation fees wereUS$8.1 million and US$8.5 million, respectively. The operation fees for each year were paid in12 equal monthly installments. Since 2012, the Agreement had been extended yearly for a periodof one year or until May 20, 2017 as an interim operator. However, as part of the Government'songoing overall restructuring, state-owned enterprise Darusalam Assets Sdn Bhd will take over theMuara Container Terminal operations from the Brunei Ports Department effectiveFebruary 21, 2017. The future plans for Muara Container Terminal contemplate its integrationwith the development of a Special Economic Zone, which is not ICTSI’s core competency andwill require huge investments on the part of NMCTS. As part of ICTSI's efforts at rationalising itsportfolio to achieve the best possible sources of long-term growth and return for its shareholders,ICTSI, through NMCTS, is no longer interested in signing a new contract with the state-ownedenterprise Darusalam Assets Sdn Bhd. Thus, the Agreement was pre-terminated effectiveFebruary 21, 2017.
The Agreement contained commitments and restrictions which included, among others,accomplishment of service levels consisting of crane productivity, haulage turnaround time,equipment availability, reefer services and submission of calculation and documents for billing, aswell as penalties for failure to meet the service level requirements.
The existing contracts and agreements entered into by the Group contain commitments andrestrictions which include, among others, the prohibition of the change in subsidiaries’shareholders without the prior consent of the port authority, maintenance of minimumcapitalization and certain financial ratios, investment in the works stipulated in the investmentprogram, provisions for insurance, submission of performance bonds, non-compete arrangements,productivity targets and other related matters.
25. Contingencies and Contingent Liabilities
Due to the nature of the Group’s business, it is involved in various legal proceedings, both asplaintiff and defendant, from time to time. The majority of outstanding litigation involvessubrogation claims under which insurance companies have brought claims against the operator,shipping lines and/or brokerage firms for reimbursement of their payment of insurance claims fordamaged equipment, facilities and cargoes. ICTSI is not engaged in any legal or arbitrationproceedings (either as plaintiff or defendant), including those which are pending or known to becontemplated and its Board has no knowledge of any proceedings pending or threatened againstthe Group or any facts likely to give rise to any litigation, claims or proceedings which mightmaterially affect its financial position or business. Management and its legal counsels believe thatthe Group has substantial legal and factual bases for its position and is of the opinion that lossesarising from these legal actions and proceedings, if any, will not have a material adverse impact onthe Group’s consolidated financial position and results of operations.

- 123 -
*SGVFS033016*
MICTThe MICT Berth 6 Project is a port development project being undertaken by the Company withthe approval of the PPA and in compliance with the Company’s commitment under its concessioncontract with the PPA. The City Council of Manila issued Resolution No. 141 dated September23, 2010, adopting the Committee Report of the ad hoc committee that investigated thereclamation done in Isla Puting Bato in Manila, which stated that the project should have had priorconsultation with the City of Manila, approval and ordinance from the City of Manila, and consentfrom the City Mayor. The Company and its legal counsels’ position is that Resolution No. 141 ofthe City Council of Manila is purely recommendatory and is not the final word on the issuewhether the MICT Berth 6 Project is validly undertaken or not.
On November 26, 2010, the PPA, through the Office of the Solicitor General, filed a petition forcertiorari and prohibition with application for the issuance of a temporary restraining order and/orwrit of preliminary injunction assailing City Council Resolution No. 141 before the SupremeCourt. The Supreme Court granted a temporary restraining order (“TRO”) enjoining the Mayor ofManila and the City Council of Manila from stopping or suspending the implementation of theMICT Berth 6 Project of the PPA. The TRO is still valid and continuing until further orders fromthe Supreme Court. The Supreme Court also granted the Company’s motion to intervene in thecase of PPA vs. City of Manila and City Council of Manila. The parties filed their respectivecomments and replies before the Supreme Court. As of March 5, 2019, the parties still await theSupreme Court’s resolution on this case.
Notwithstanding the foregoing legal proceedings, the MICT Berth 6 Project was completed andinaugurated by the President of the Republic of the Philippines in July 2012.
In 2013, a case was filed by Malayan Insurance Co., Inc. (MICO) against ICTSI before theRegional Trial Court of Manila, Branch 55, for damages allegedly sustained by the assured cargoof Philippine Long Distance Telephone Company (PLDT) consisting of telecommunicationsequipment. The amount of claim is P=223.8 million (approximately US$4.5 million) plus legalinterest and attorney's fees of P=1.0 million (US$20.1 thousand).
PLDT initially filed a claim against ICTSI, claiming that the cargo had been dropped while insidea container at the terminal of ICTSI and holding the latter responsible for the value of theequipment. ICTSI did not pay the claim, arguing that there is no evidence that the cargo had beendamaged. ICTSI further argued that the containerized equipment was never dropped to the groundbut was merely wedged in between containers while being moved in the container yard. The caseis currently on trial.
PICTIn 2007, the Trustees of the Port of Karachi (KPT) filed a civil suit against the PICT in theHonorable High Court of Sindh (HCS) claiming a sum of approximately US$2.2 million alongwith the interest, as default payment of wharfage and penalty thereon, for the allegedmis-declaration of the category of goods on the import of Ship to Shore Cranes and Rubber TyreGantry Cranes in 2004. The HCS has rendered a judgement and decree in favor of PICT andordered that KPT is not entitled to the amount of wharfage charges claimed by it. In June 2017,KPT filed an appeal against the aforesaid judgment before the Divisional Bench of HCS. Uponadvice of PICT’s legal advisor, management believes that there is no merit in this claim.
Also in 2007, PICT has filed an interpleader civil suit before HCS against the Deputy DistrictOfficer, Excise and Taxation (DDO) and the Trustees of KPT in respect of demand raised by theDDO on PICT to pay property tax out of the Handling, Marshalling and Storage (HMS) Charges

- 124 -
*SGVFS033016*
payable to KPT amounting to approximately US$0.2 million for the period from 2003 to 2007. Incompliance with the Order of HCS, PICT deposited the amount with Nazir of HCS, out of amountwithheld by PICT from HMS charges billed by KPT. In 2014, another demand was made byDDO amounting to approximately US$0.7 million for the period from 2008 to 2014. On anapplication filed by PICT for directions, HCS ordered for deposit of the aforementioned amountout of HMS charges billed by KPT and PICT subsequently complied with the order of HCS. In2015, HCS issued further orders directing PICT to deposit the remaining HMS charges due andpayable with Nazir of HCS in quarterly installments and PICT complied accordingly. The decisionof the suit is still pending, and PICT's legal advisor believes that there may be no adverseimplication for depositing the payments with Nazir of HCS due to KPT in view of complying withthe HCS’s order.
While completing the tax audit proceedings for the tax year 2013, the Deputy CommissionerInland Revenue (DCIR) modified the deemed assessment of PICT and made certaindisallowances/additions on the taxable income and raised an income tax demand of approximatelyUS$0.9 million. PICT filed an appeal before the Commissioner Inland Revenue - Appeals (CIR-A) who partially decided the appeal in favor of PICT. Consequently, PICT made the payment ofapproximately US$0.71 million, in respect of issues confirmed by the CIR(A), and filed a secondappeal before the Appellate Tribunal Inland Revenue, which is now pending for adjudication.Upon advice of PICT’s tax advisor, management believes that the issues involved in the appeal isexpected to be decided in favor of PICT.
In 2017, the Assistant Commissioner Sindh Revenue Board (AC-SRB) under Sindh Sales Tax onServices Act, 2011 raised a demand of approximately US$3.7 million along with penalty and defaultsurcharge, for the tax periods January 2013 to December 2014 on exempt services provided byPICT. PICT filed an Appeal with Commissioner Appeals - SRB which is pending for hearing. Thetax advisor of PICT is of the view that PICT has strong defense and appeal will be decided in favorof PICT.
In 2017, the Additional Commissioner Inland Revenue (ACIR) modified the deemed assessment ofPICT for the tax year 2016 by passing an order under section 122(5A) of the Income Tax Ordinance,2001 and made certain additions/disallowances to the taxable income and tax credits claimed byPICT and raised an income tax demand of approximately US$1.59 million. PICT filed an appealbefore the Commissioner Inland Revenue - Appeals (CIR-A) who had decided the appeal partly infavor of PICT. Being aggrieved by the decision of CIR-A, PICT as well as the tax department filedthe appeals before Appellate Tribunal Inland Revenue (ATIR) which are pending for adjudication.PICT has also sought stay from HCS against the demand created by ACIR after appeal effectproceedings. HCS vide its final order directed the ACIR not to take any coercive recovery measuresuntil the finalization of appeal before the ATIR which is pending adjudication. The tax advisor ofPICT is of the view that the issues involved in the appeal will be decided in favor of PICT.
TSSAIn 2008, a civil suit was filed by former customer Interfood Comercio (Interfood) against TSSAfor damages to perishable cargo amounting to BRL7.0 million (approximately US$3.0 million).Interfood’s cargo (garlic and birdseed) was declared improper for human and animal consumptiondue to long storage period at TSSA before it was claimed and such cargo was destroyed byBrazilian customs authorities. The lower court and Court of Appeals ruled in favor of Interfood.The case has been pending in the Supreme Court. An amount of BRL12.0 million (approximatelyUS$3.1 million) in TSSA’s bank account has been garnished by the lower court. The provisionaggregating BRL13.8 million (US$4.2 million), BRL13.8 million (US$4.2 million) andBRL13.8 million (US$3.6 million) were recognized as part of “Accounts payable and other

- 125 -
*SGVFS033016*
current liabilities” account in the consolidated balance sheets as at December 31, 2016, 2017 and2018, respectively. In July 2016, the State Court rendered a decision against TSSA. The saidjudgment, however, is still subject to a last appeal with the Supreme Court in Brasilia.
TICTOn December 28, 2012, TICT filed a Notice of Termination of its 10-year Investment Agreementwith Tartous Port General Company (TPGC) on the grounds of “unforeseen change ofcircumstances” and “Force Majeure”. In early 2013, TPGC submitted to arbitration TICT’stermination notice. On April 1, 2014, the arbitration panel decided in favor of TPGC. While theaward has become executory on April 20, 2015, management and its legal counsels believe thatTPGC will not be able to successfully enforce the award outside of Syria.
BICTLIn 2015, BICTL filed a case against Revenue Service with the Tbilisi City Court for thecancellation of the tax assessment in the amount of US$860.7 thousand (GEL2.3 million). Thecase involves Value-Added Tax on fees collected by BICTL for services rendered in relation tothe export of scrap materials. The Revenue Service alleged that such fees are subject to VATwhile BICTL believes that it has good legal basis to treat the services as a VAT zero-rated sale ofservices. In March 2016, the Tbilisi City Court rendered a decision in favor of Revenue Service.BICTL has appealed the said decision with the appellate court. The Tbilisi Court of Appealsconsidered BICTL’s arguments and position. On May 16, 2018, the said court partially satisfiedBICTL’s claim and major part of the penalty was cancelled.
ICTSI OregonDue to the labor disruption caused by the International Longshore and Warehouse Union (ILWU)in Portland commencing in June 2012, ICTSI Oregon has filed two separate counter-claims infederal court against the ILWU seeking monetary damages. The first is a claim for damagescaused by the ILWU's unlawful secondary activity under the National Labor Relations Act. Thesecond is an antitrust claim brought against the ILWU and the Pacific Maritime Association(PMA). The antitrust claim was initially dismissed by the federal court. The judge granted ICTSIOregon permission to appeal the dismissal to the United States Court of Appeals for the NinthCircuit. In July 2017, the Ninth Circuit upheld the dismissal of the claim. ICTSI Oregon filed apetition for writ of certiorari with the United States Supreme Court seeking to reverse the NinthCircuit’s decision. This petition was denied. Accordingly, the antitrust claim has been finallydisposed of.
ICTSI Oregon’s second counterclaim against ILWU is a claim for money damages caused by theILWU's unlawful secondary activity under the National Labor Relations Act. In connection withthat claim, the National Labor Relations Board (NLRB) sought and obtained two federal courtinjunctions against the ILWU, prohibiting illegal work stoppages as well as a finding of contemptof court against the union for injunction violations. The federal district court initially stayedICTSI Oregon's damage claim for unlawful secondary activity pending completion ofadministrative proceedings before the NLRB. The NLRB’s administrative proceedings werecompleted in a manner favorable to ICTSI Oregon in 2015. However, the ILWU appealed to theUnited States Court of Appeals for the District of Columbia Circuit in Washington D.C. OnNovember 6, 2017, the US Court of Appeals rejected the ILWU’s appeals and upheld two NLRBdecisions declaring that the ILWU engaged in deliberate work stoppages and slowdowns, madefalse safety claims, and engaged in other illegal coercive conduct against ICTSI Oregon and itscustomers.

- 126 -
*SGVFS033016*
As a result of the US Court of Appeals decisions, the federal district court in Oregon lifted the stayand has scheduled a trial of ICTSI Oregon’s damage claim commencing in the latter part of 2019.This is a substantial claim, seeking a multi-million dollar judgment against the ILWU.
ICTSI also had brought a breach of fiduciary duty claim against the PMA in federal court. Basedon a settlement between ICTSI and PMA, that claim was voluntarily dismissed in 2018.
SPIAIn February 2018, Conalvias Construcciones S.A.S., (Conalvias) filed an arbitration case at theArbitration Center of the Chamber of Commerce of Bogota against SPIA for the unlawfultermination of the Construction of Paving Works and Utilities contract (“the Contract”), and forseveral breaches committed by SPIA under the Contract. The arbitration case is on-going andSPIA has filed a counterclaim against Conalvias for damages incurred as a result of contractualbreaches committed by Conalvias. The counterclaim filed by SPIA will be amended to indicate theamount of damages once the full assessment of the claim is completed.
26. Financial Instruments
26.1 Fair Values
Set out below is a comparison of carrying amounts and fair values of the Group’s financialinstruments by category whose fair value is different from its carrying amount as at December 31:
2016 2017 2018Carrying Amount Fair Value
Carrying Amount Fair Value
Carrying Amount Fair Value
Financial LiabilitiesOther financial liabilities: Long-term debt US$1,344,765,928 US$1,429,709,827 US$1,432,417,876 US$1,547,607,808 US$1,271,335,292 US$1,318,503,380 Concession rights payable 490,461,436 548,769,262 480,181,116 510,902,353 541,269,412 556,134,127
US$1,835,227,364 US$1,978,479,089 US$1,912,598,992 US$2,058,510,161 US$1,812,604,704 US$1,874,637,507
Carrying values of cash and cash equivalents, receivables, accounts payable and other currentliabilities and loans payable approximate their fair values due to the short-term nature of thetransactions.
The fair values of the US dollar-denominated notes and US dollar-denominated medium termnotes are based on quoted prices. The fair value of other fixed interest-bearing loans andconcession rights payable were estimated at the present value of all future cash flows discountedusing the applicable rates for similar types of loans ranging from 1.23 percent to 12.63 percent in2016, 1.43 percent to 12.23 percent in 2017 and 1.26 percent to 12.90 percent in 2018.
For variable interest-bearing loans repriced monthly or quarterly, the carrying amountapproximates the fair value due to the regular repricing of interest rates.
The fair values of derivative assets and liabilities, specifically forward contracts and prepaymentoptions, are calculated using valuation techniques with inputs and assumptions that are based onmarket observable data and conditions. For cross-currency swap, interest rate swaps, currencyforwards and other structured derivatives, fair values are based on counterparty bank valuation.

- 127 -
*SGVFS033016*
26.2 Fair Value Hierarchy
The following tables below present the fair value hierarchy of the Group’s financial instruments asof December 31:
2016
Amount
Quoted prices inactive market
(Level 1)
Significantobservable
inputs(Level 2)
Significantunobservable
inputs(Level 3)
Assets Measured at Fair Value: Derivative assets US$8,036,235 US$− US$8,036,235 US$−
Derivative liabilities 2,802,017 − 2,802,017 − AFS investments 12,392,769 12,392,769 − −
Liabilities for which Fair Values areDisclosed:
Other financial liabilities: Long-term debt 1,429,709,827 1,018,581,996 − 411,127,831 Concession rights payable 548,769,262 − − 548,769,262
2017
Amount
Quoted prices inactive market
(Level 1)
Significantobservable
inputs(Level 2)
Significantunobservable
inputs(Level 3)
Assets Measured at Fair Value: Derivative assets US$5,074,653 US$− US$5,074,653 US$−
Derivative liabilities 4,374,838 − 4,374,838 − AFS investments 12,639,082 12,639,082 − −
Liabilities for which Fair Values areDisclosed:
Other financial liabilities: Long-term debt 1,547,607,808 1,047,984,942 − 499,622,866 Concession rights payable 510,902,353 − − 510,902,353
2018
Amount
Quoted prices inactive market
(Level 1)
Significantobservable
inputs(Level 2)
Significantunobservable
inputs(Level 3)
Assets Measured at Fair Value: Derivative assets US$579,321 US$− US$579,321 US$−
Derivative liabilities 2,835,502 − 2,835,502 − Financial assets at FVOCI 13,032,349 13,032,349 − −
Liabilities for which Fair Values areDisclosed:
Other financial liabilities: Long-term debt 1,318,503,380 984,325,835 − 334,177,545 Concession rights payable 556,134,127 − − 556,134,127
In 2016, 2017 and 2018, there were no transfers between Level 1 and Level 2 fair valuemeasurements and no transfers into and out of Level 3 fair value measurements.

- 128 -
*SGVFS033016*
26.3 Derivative Financial Instruments
ICTSI enters into derivative transactions as economic hedges of certain underlying exposuresarising from its foreign currency-denominated loans, revenues and expenses. Such derivatives,which include interest rate swaps and currency forwards, are accounted for either as cash flowhedges or transactions not designated as hedges.
26.4 Derivative Instruments Accounted for as Cash Flow Hedges
Interest Rate Swap. In 2014, AGCT entered into an interest rate swap transaction to hedge theinterest rate exposure on its floating rate Euro-denominated loan maturing in 2023. A notionalamount of EUR5.1 million (US$6.2 million) and EUR3.8 million (US$4.6 million) out of the totalEUR10.6 million (US$12.8 million) floating rate loan was swapped to fixed rate. Under theinterest rate swap, AGCT pays fixed interest of 6.19 percent for EUR5.1 million and 5.55 percentfor EUR3.8 million and receives floating rate of one-month EURIBOR plus 4.20 bps on thenotional amount. Starting July 2016, the fixed interest for EUR5.1 million and EUR3.8 millionwas reduced to 5.39 percent and 4.75 percent, respectively, and AGCT receives floating rate ofone-month EURIBOR plus 3.40 bps on the notional amount. The market valuation loss on theoutstanding interest rate swap amounted to EUR0.5 million (US$0.5 million), EUR0.3 million(US$0.4 million), EUR0.2 million (US$0.3 million) as at December 31, 2016, 2017 and 2018.The effective portion of the change in the fair value of the interest rate swap amounting toEUR0.4 million (US$0.4 million), net of EUR0.1 million (US$0.1 million) deferred tax,EUR0.2 million (US$0.3 million), net of EUR0.1 million (US$0.1 million) deferred tax andEUR0.2 million (US$0.2 million), net of EUR40.1 thousand (US$46.0 thousand) deferred tax, forthe years ended December 31, 2016, 2017 and 2018, respectively, was taken to equity under othercomprehensive loss (see Note 14.7).
In August 2016, VICT entered into interest rate swap transactions to hedge the interest rateexposures on its floating rate AUD-denominated loans maturing in 2023, 2026 and 2031. A totalnotional amount of AUD320.4 million floating rate loan was swapped to fixed rate. Under theinterest rate swap arrangements, VICT pays annual fixed interest of a range of 2.10 to2.5875 percent and receives floating rate of six-month Bank Bill Swap Bid Rate (BBSY) basispoints on the notional amount. In March 2017, VICT entered into additional interest rate swaptransactions to hedge an additional AUD5.5 million and AUD12.4 million of its AUD-denominated loans maturing in 2026 and 2031, respectively. VICT pays an annual fixed interest of2.885 to 2.9730 percent for the loans maturing in 2026 and 2031, respectively. The marketvaluation gain on the outstanding interest rate swaps amounted to AUD9.8 million(US$7.1 million) and AUD4.6 million (US$3.6 million) as of December 31, 2016 and 2017,respectively, and the market valuation loss on the outstanding interest rate swaps amounted toAUD1.5 million (US$1.1 million) as of December 31, 2018. The effective portion of the changein the fair value of the interest rate swap amounting to AUD6.9 million (US$5.1 million), net ofAUD2.9 million (US$2.0 million), AUD3.2 million (US$2.3 million), net of AUD1.4 million(US$1.3 million) and AUD1.0 million (US$0.9 million), net of AUD0.5 million (US$0.2 million)deferred tax for the years ended December 31, 2016, 2017 and 2018, respectively, was taken toequity under other comprehensive loss (see Note 14.7).
In January 2016, CMSA entered into interest rate swap transactions to hedge the interest rateexposure on its floating rate US$-denominated floating rate loan maturing in 2027. A totalnotional amount of US$181.0 million floating rate loan was swapped to fixed rate. Under theinterest rate swap arrangements, CMSA pays annual fixed interest of an average 2.44 percent andreceives floating rate of six-month LIBOR on the notional amount. In May 2018, ICTSI enteredinto offsetting interest rate swaps in order to manage the changes in and lock the fair values on the

- 129 -
*SGVFS033016*
planned pre-termination of CMSA’s outstanding interest rate swaps in anticipation of theprepayment of the underlying loan.
On May 14, 2018, CMSA and ICTSI terminated all outstanding interest rate swaps due to theprepayment of the underlying US$-denominated floating rate loan. The amount deferred in equityrepresenting the effective portion of the change in fair value of the swap amounting toUS$3.9 million at the time of prepayment was transferred to the profit and loss and recognizedunder “Other income” account in the 2018 consolidated statement of income.
In November 2016, ICTSI entered into an interest rate swap transaction to hedge the interest rateexposures of the CGSA’s floating rate US$-denominated floating rate loan maturing in 2021. Atotal notional amount of US$32.5 million floating rate loan was swapped to fixed rate. Under theinterest rate swap arrangements, ICTSI pays annual fixed interest of 3.045 percent and receivesfloating rate of six-month LIBOR plus 160 basis points on the notional amount. As ofDecember 31, 2016, 2017 and 2018, the market valuation gain on the outstanding interest rateswaps amounted to US$0.1 million, US$0.3 million and US$0.3 million, respectively. Theeffective portion of the change in the fair value of the interest rate swap amounting toUS$78.5 thousand, net of US$33.6 thousand deferred tax, US$0.2 million, net of US$0.1 milliondeferred tax and US$0.2 million, net of US$0.1 million deferred tax for the years endedDecember 31, 2016, 2017 and 2018, respectively, was taken to equity under other comprehensiveloss (see Note 14.7).
Net Investment Hedging. In March 2017, ICTSI entered into a cross currency swap that convertsthe US dollar bond with a coupon of 7.375 percent maturing on March 17, 2020 to a Euro liabilitythat has a coupon of 5.05 percent with the same maturity. The EUR15.0 million cross currencyswap was designated as a net investment hedge to offset the movement of the Group’s Euro netinvestment in its subsidiary in Madagascar, MICTSL. As of December 31, 2017 and 2018, themarket valuation loss on the outstanding cross currency swap amounted to EUR1.8 million(US$2.2 million) and EUR1.1 million (US$1.2 million). The effective portion of the fair value ofthe cross currency swap amounting EUR1.3 million (US$1.5 million), net of EUR0.5 million(US$0.7 million) deferred tax and EUR0.7 million (US$0.8 million), net of EUR0.4 million(US$0.4 million) deferred tax for the years ended December 31, 2017 and 2018, respectively, wastaken to equity under other comprehensive loss (see Note 14.7).
Translation Hedging. As of December 31, 2018, ICTSI designated EUR138.3 million(US$158.5 million) of its Euro-denominated cash equivalents as cash flow hedges to hedge thevariability of an upcoming Euro-denominated transaction that would arise as a result of changes inthe EUR:USD exchange rate.
The related foreign currency translation loss on the Euro-denominated cash equivalents designatedas cash flow hedges aggregating to US$10.2 million was taken to equity under othercomprehensive loss. No ineffectiveness was recognized in the consolidated statements of incomefor the year ended December 31, 2018.
On January 8, 2019, the Euro-denominated cash equivalents were terminated for settlement of theinitial up-front fee payable to SPC (see Note 24.14). The related foreign currency loss ofUS$10.6 million remains in equity under other comprehensive income.
26.5 Other Derivative Instruments Not Designated as Hedges
Currency Forwards. In 2017, ICTSI entered into USDPHP forwards to hedge Philippine Pesodisbursements. As of December 2018, there were no outstanding USDPHP forward contracts.

- 130 -
*SGVFS033016*
26.6 Fair Value Changes on Derivatives
The net movements in fair value changes of ICTSI’s derivative instruments are as follows:
2016 2017 2018Balance at beginning of year (US$223,063) US$5,234,218 US$699,815Net changes in fair value of derivatives: Designated as accounting hedges 6,133,973 (4,534,403) (2,955,996) Not designated as accounting hedges (331,154) − −
5,579,756 699,815 (2,256,181)Less fair value of settled instruments 345,538 − −Balance at end of year US$5,234,218 US$699,815 (US$2,256,181)
The net movement in fair value changes of freestanding derivative instruments designated as cashflow hedges are presented in the consolidated statements of comprehensive income as follows:
2016 2017 2018Balance at beginning of year (US$494,308) US$3,682,715 US$247,337Changes in fair value of cash flow hedges of
designated derivatives 6,133,973 (4,534,403) (2,955,996)Transferred to construction in-progress (345,539) − −Tax effects (1,611,411) 1,099,025 1,174,533Balance at end of year (see Note 14.7) US$3,682,715 US$247,337 (US$1,534,126)
The net changes in fair value of the derivatives not designated as accounting hedges and thechange in fair value of cash flow hedges transferred to profit or loss are presented in theconsolidated statements of income under “Other expense” account amounting to US$0.3 millionin 2016.
Fair value changes on freestanding derivatives as at December 31 are presented as follows:
2016 2017 2018Derivative assets (see Note 9) US$8,036,235 US$5,074,653 US$579,321Derivative liabilities (see Note 16) (2,802,017) (4,374,838) (2,835,502)Total US$5,234,218 US$699,815 (US$2,256,181)
27. Financial Risk Management Objectives and Policies
The principal financial instruments of the Group comprise mainly of bank loans and cash and cashequivalents. The main purpose of these financial instruments is to raise working capital and majorcapital investment financing for the Group’s port operations. The Group has various otherfinancial assets and liabilities such as trade receivables and trade payables, which arise directlyfrom its operations.
ICTSI has port operations and development projects in 19 countries as at December 31, 2018.Short-term treasury activities are carried out at the subsidiary level, however, overall policydecisions concerning the Group’s financial risks are centralized at the Parent Company in Manila.The Board reviews and approves the Group’s policies for managing each of these risks, assummarized below, as well as authority limits. Treasury operations are regularly reviewedannually by Internal Audit to ensure compliance with the Group’s policies.
ICTSI finances its business activities through a mix of cash flows from operations and long-termloans from banks. It is the Group’s policy to minimize the use of short-term loans. The Group’sborrowings are in US Dollar, Philippine Peso, Euro, Chinese Renminbi, Pakistani Rupee and
- 131 -
*SGVFS033016*
Australian Dollar at fixed and floating rates of interest. The Group minimizes its currencyexposure by matching its currency of borrowing to the currency of operations and functionalcurrency at the relevant business unit whenever possible. It is, and has been throughout the yearunder review, the Group’s policy that no trading in financial instruments shall be undertaken.
In the context of PFRS 7, the main risks arising from the normal course of the Group’s businessare interest rate risk, liquidity risk, foreign currency risk and credit risk.
Working Capital ManagementThe Parent Company has minimal working capital requirements due to the short cash collectioncycle of its business. Working capital requirements are well within the credit facilities establishedwhich are adequate and available to the Parent Company to meet day-to-day liquidity and workingcapital requirements. The credit facilities are regularly reviewed by the Treasury Group to ensurethat they meet the objectives of the Group. Most of the foreign operating subsidiaries currently donot access short-term credit facilities as their respective cash flows are sufficient to meet workingcapital needs.
Interest Rate RiskThe Group’s exposure to market risk for changes in interest rates relates primarily to the Group’sbank loans and is addressed by a periodic review of the Group’s debt mix with the objective ofreducing interest cost and maximizing available loan terms.

- 132 -
*SGVFS033016*
The following table sets out the carrying amount, by maturity, of the Group’s liabilities that are exposed to interest rate risk as atDecember 31:
2016Less than 1 Year
to 2 years>2 Yearsto 3 years
>3 Yearsto 4 years
>4 Yearsto 5 years Over 5 Years Total Net Debt*
(In Original Currency) (In US Dollar)LiabilitiesLong-term DebtFloating Rate:
US$ Loan – – 15,000,000 – – 15,000,000 US$15,000,000 US$15,000,000Interest rate LIBOR + 1.95% spreadUS$ Loan 3,000,000.00 – – – – 3,000,000 3,000,000 3,000,000Interest rate LIBOR + 1.60% spreadPKR loan 298,755,468 – – – – 298,755,468 2,862,465 2,862,465Interest rate KIBOR+0.75% spread
2017Less than 1 Year
to 2 years>2 Yearsto 3 years
>3 Yearsto 4 years
>4 Yearsto 5 years Over 5 Years Total Net Debt*
(In Original Currency) (In US Dollar)LiabilitiesLong-term DebtFloating Rate:
US$ Loan 3,920,000 20,580,000 – – – 24,500,000 US$24,500,000 US$24,500,000Interest rate LIBOR + 1.15% spreadRMB Loan 10,000,000 20,000,000 20,000,000 20,000,000 20,000,000 90,000,000 13,831,684 13,831,684Interest rate PBOC standard rate less 5%
*Net of Debt Issuance Costs
2018Less than 1 Year
to 2 years>2 Years
to 3 years>3 Years
to 4 years>4 Years
to 5 years Over 5 Years Total Net Debt*
(In Original Currency) (In US Dollar)LiabilitiesLong-term DebtFloating Rate:
US$ Loan 29,500,000 – – – – 29,500,000 US$29,500,000 US$29,500,000Interest rate LIBOR + 1.15% spreadRMB Loan – 10,000,000 20,000,000 20,000,000 – 50,000,000 7,269,027 7,269,027Interest rate PBOC standard rate less 5%

- 133 -
*SGVFS033016*
Re-pricing of floating rate financial instruments is mostly done monthly, quarterly orsemi-annually. Interest on fixed rate financial instruments is fixed until maturity of theinstrument. Financial instruments not included in the above tables are either noninterest-bearing,therefore not subject to interest rate risk or has minimal interest rate exposure due to theshort-term nature of the account (i.e., cash equivalents).
The sensitivity to a reasonably possible change in interest rates, with all other variables heldconstant, of ICTSI’s income before income tax (through the impact on unhedged floating rateborrowings), at December 31 are as follows (amounts in millions unless otherwise indicated):
Effect on Profit Before TaxIncrease/Decrease in
Interest Rates (%) 2016 2017 2018Loans +1.0 (US$0.2) (US$0.3) (US$0.4)
-1.0 0.2 0.3 0.4
Liquidity RiskThe Group monitors and maintains a certain level of cash and cash equivalents and bank creditfacilities deemed adequate by management to finance the Group’s operations, ensure continuity offunding and to mitigate the effects of fluctuations in cash flows. The Group’s policy is that notmore than 25 percent of borrowings should mature in any 12-month period. Five percent, fivepercent and four percent of the Group’s total borrowings, gross of debt issuance costs as atDecember 31, 2016, 2017 and 2018, respectively, will mature in the ensuing 12 months. TheGroup is re-assessing its policy in mitigating liquidity risk in line with the current developmentsand demands of its rapidly growing business.
The tables below summarize the maturity profile of the Group’s financial liabilities as atDecember 31 based on contractual undiscounted payments (amounts in millions unless otherwiseindicated).
2016Less than3 Months
3 to 6 Months
>6 to 12 Months
>1 to5 Years
More than5 Years Total
Long-term debt US$34.4 US$7.5 US$47.2 US$666.5 US$1,178.8 US$1,934.4Accounts payable and other current
liabilities* 245.0 11.4 8.9 − − 265.3Other noncurrent liabilities* − − − 76.7 6.7 83.4Loans payable 21.6 − 15.0 − − 36.6Derivative liabilities 0.3 − 2.4 0.1 − 2.8Concession rights payable 11.4 12.2 22.7 235.0 627.2 908.5Total US$312.7 US$31.1 US$96.2 US$978.3 US$1,812.7 US$3,231.0*Excludes statutory liabilities, noncurrent potion of derivative liabilities and provisions for claims and losses
2017Less than3 Months
3 to 6 Months
>6 to 12 Months
>1 to5 Years
More than5 Years Total
Long-term debt US$37.8 US$8.7 US$52.4 US$1,077.4 US$777.9 US$1,954.2Accounts payable and other current
liabilities* 130.3 40.6 13.9 − − 184.8Other noncurrent liabilities* − − − 58.6 58.3 116.9Loans payable 61.2 − − − − 61.2Derivative liabilities 1.9 − − 2.5 − 4.4Concession rights payable 11.4 12.4 23.1 236.2 725.0 1,008.1Total US$242.6 US$61.7 US$89.4 US$1,374.7 US$1,561.2 US$3,329.6*Excludes statutory liabilities, noncurrent potion of derivative liabilities and provisions for claims and losses

- 134 -
*SGVFS033016*
2018Less than3 Months
3 to 6 Months
>6 to 12 Months
>1 to5 Years
More than5 Years Total
Long-term debt US$6.0 US$19.9 US$31.5 US$679.8 US$578.5 US$1,315.7Concession rights payable 11.3 12.3 22.8 187.2 579.1 812.7Accounts payable and other current
liabilities* 170.8 22.9 20.9 − − 214.6Other noncurrent liabilities* − − − 56.5 104.7 161.2Loans payable 4.0 31.7 − − − 35.7Derivative liabilities − − − 1.5 1.3 2.8Total US$192.1 US$86.8 US$75.2 US$925.0 US$1,263.6 US$2,542.7*Excludes statutory liabilities, noncurrent potion of derivative liabilities and provisions for claims and losses
The financial liabilities in the above tables are gross undiscounted cash flows. However, thoseamounts may be settled using cash on hand and in banks, aggregating US$248.6 million,US$212.8 million and US$139.1 million as at December 31, 2016, 2017 and 2018, respectively.Furthermore, cash equivalents, amounting to US$76.5 million, US$66.6 million andUS$307.9 million as at December 31, 2016, 2017 and 2018, respectively, may also be used tomanage liquidity.
Changes in liabilities arising from financing activities
December 31, 2016 Cash flows
Foreignexchange
movementTranslationAdjustment
Changes in fairvalues Others* December 31, 2017
Long-term debt US$1,409,576,378 US$63,439,071 (US$317,909) US$18,450,108 US$– US$– US$1,491,147,648Loans payable 36,598,275 21,874,571 – 605,205 – 2,109,051 61,187,102Concession rights
payable 490,461,436 (13,481,693) (180,975) 3,502,723 – (120,375) 480,181,116Dividends payable 3,203,531 (112,503,197) – 12,632 – 111,746,198 2,459,164Derivative liability – – – – 4,374,838 – 4,374,838Accrued interest 22,905,888 (93,095,820) (279,785) 179,839 – 93,787,091 23,497,213Total liabilities from
financingactivities US$1,962,745,508 (US$133,767,068) (US$778,669) US$22,750,507 US$4,374,838 US$207,521,965 US$2,062,847,081
* Others includes reclassifications, accrual of dividends and accrual of interest from interest-bearing loans.
December 31, 2017 Cash flows
Foreignexchange
movementTranslationAdjustment
Changes infair values Others* December 31, 2018
Long-term debt US$1,491,147,648 (US$147,120,969) (US$78,215) (US$28,245,836) US$– US$– US$1,315,702,628Loans payable 61,187,102 (22,611,652) – (748,001) – (2,109,052) 35,718,397Concession rights
payable 480,181,116 (45,106,484) (661,779) (4,403,103) – 111,259,662 541,269,412Dividends payable 2,459,164 (114,731,592) – (281,331) – 113,634,676 1,080,917Derivative liability 4,374,838 – – (118,482) 2,793,953 (4,214,807) 2,835,502Accrued interest 23,497,213 (95,204,244) 44 (468,603) – 94,942,933 22,767,343Total liabilities from
financingactivities US$2,062,847,081 (US$424,774,941) (US$739,950) (US$34,265,356) US$2,793,953 US$313,513,412 US$1,919,374,199
* Others includes capitalization of fixed fees under IFRIC 12, reclassifications, accrual of dividends and accrual of interest frominterest-bearing loans.
Foreign Currency RiskAs a result of operations in subsidiaries whose functional currency is not the US dollar, theGroup’s consolidated balance sheets can be affected significantly by movements in thesubsidiaries’ functional currency and US dollar exchange rates (see Note 1.3).
In respect of financial assets and liabilities held in currencies other than the functional currenciesof the Parent Company and the operating subsidiaries, the net exposure is kept to an acceptablelevel by buying or selling foreign currencies at spot/forward rates where necessary to addressshort-term imbalances.

- 135 -
*SGVFS033016*
The Group recognized in the consolidated statements of income net foreign exchange lossamounting to US$0.2 million in 2016 and US$1.6 million in 2018 and net foreign exchange gainamounting to US$0.2 million in 2017 arising from net foreign currency-denominated financialassets and liabilities as at December 31, 2016, 2017 and 2018, respectively, which resulted mainlyfrom the movements of Philippine peso, Brazilian real, Mexican peso and Colombian peso againstthe US dollar and Malagasy ariary against Euro.
The following table shows the Group’s significant foreign currency-denominated financial assetsand liabilities and their US Dollar equivalents at December 31:
2016 2017 2018Foreign
Currency US DollarForeign
Currency US DollarForeign
Currency US DollarCurrent Financial Assets
Cash and cash equivalents: EUR 16,463,959 US$17,315,145 12,293,881 US$14,758,804 213,954,993 US$245,342,191 Philippine peso 950,897,686 19,125,054 1,148,871,876 23,009,651 3,093,628,295 58,836,597 AUD 140,817,070 101,500,944 15,772,555 12,316,788 13,119,603 9,248,008 RMB 23,469,361 3,379,318 22,448,497 3,450,006 54,956,682 7,989,632 MXN 3,470,302 167,427 17,650,885 897,853 156,636,561 7,971,164
PGK – – – – 26,833,063 7,964,224 MGA 6,058,886 1,801 7,809,848 2,408 23,753,405,826 6,792,956 PKR 462,705,166 4,433,316 162,816,359 1,470,789 424,947,479 3,039,682 IDR 21,387,090,632 1,587,404 27,069,628,442 1,997,022 24,704,560,188 1,716,787 BRL 4,745,355 1,457,777 4,136,316 1,248,699 3,670,933 945,824 HRK 2,552,159 355,607 2,823,546 455,984 3,169,459 490,438 PLN 454,107 108,449 525,125 150,720 2,092,191 559,828 ARS 678,162 42,705 185,893 9,982 9,329,237 247,671 BND 4,610,355 3,183,727 130,273 97,400 – –Receivable: Philippine peso 201,463,663 4,051,964 240,006,619 4,806,862 614,488,899 11,686,742 BRL 32,383,802 9,948,329 35,469,070 10,707,644 38,053,710 9,804,625 PKR 608,022,824 5,825,647 883,443,443 7,980,519 1,101,583,695 7,879,712
AUD 10,754,822 7,581,074 RMB 32,554,261 4,687,439 37,828,954 5,813,757 39,307,057 5,714,481 IDR 4,194,324,435 311,313 3,493,435,916 257,723 71,522,854,562 4,970,317
PGK 14,766,769 4,382,871 MXN 4,543,855 219,222 5,812,506 295,666 73,765,812 3,753,909 EUR 9,186,168 9,661,093 11,333,654 13,606,052 1,774,644 2,034,984 MGA 2,116,720 629 3,164,275 976 6,367,904,259 1,821,082 PLN 736,070 175,786 1,087,604 312,162 4,086,074 1,093,352 HRK 1,095,441 152,634 1,643,263 265,376 1,611,405 249,347 BND 2,658,675 1,835,975 – – – –
191,518,750 109,094,465 565,800,627Current Financial
LiabilitiesAccounts payable and other
current liabilities: Philippine peso 212,639,689 US$4,276,744 175,501,430 US$3,514,950 7,277,391,689 US$138,406,080 MXN 18,162,594 876,269 27,643,794 1,406,165 989,382,822 50,349,246 AUD 142,570,858 102,765,075 18,632,861 14,550,401 21,082,301 14,860,914 BRL 21,786,975 6,692,976 23,658,372 7,142,150 51,571,721 13,287,571 PKR 1,133,443,198 10,859,856 1,146,856,805 10,360,043 1,635,347,661 11,697,766 MGA 5,910,849 1,757 7,463,117 2,301 24,879,751,965 7,115,067
IQD – – – – 6,536,932,513 5,480,868 PLN 2,506,764 598,659 3,315,168 951,513 16,807,113 4,497,247 GEL 411,392 154,804 3,481,585 1,340,979 11,379,902 4,254,169PGK – – – – 10,995,059 3,263,404 RMB 14,883,954 2,143,118 22,285,923 3,425,020 18,190,558 2,644,553
HRK 4,842,152 674,686 6,619,636 1,069,028 11,160,234 1,726,922 IDR 3,222,902,552 239,212 4,684,475,982 345,590 11,578,983,459 804,655 EUR 9,827,499 10,335,580 1,043,706 1,252,969 403,130 462,269 BND 620,532 428,515 – – – –

- 136 -
*SGVFS033016*
2016 2017 2018Foreign
Currency US DollarForeign
Currency US DollarForeign
Currency US DollarNoncurrent Financial
LiabilitiesOther noncurrent liabilities: AUD 89,588,968 US$64,575,728 128,525,531 US$100,365,587 209,923,421 US$147,975,019 USD – – – – 15,809,627 15,809,627 PLN 16,728,916 3,995,156 14,651,405 4,205,219 44,503,147 11,908,152 Philippine peso 9,712,524 195,344 12,950,585 259,375 51,226,640 974,261 MXN 372,892 17,990 689,659 35,081 13,104,784 666,897 IDR 3,568,854,267 264,889 698,049 51 8,727,320,178 606,485 EUR 94,281 99,156 86,144 103,416 331,576 380,219 MGA 217,212 65 193,616 60 700,568,053 200,347Long-term debt
AUD 249,856,742 180,096,739 336,143,728 262,494,638 354,714,813 250,038,472 RMB – – 90,000,000 13,831,684 50,000,000 7,269,027 EUR 7,379,167 7,760,670 5,078,571 6,096,825 5,411,905 6,205,831 PKR 298,755,468 2,862,465 – – – –
Concession rights payable EUR 14,063,368 14,790,444 13,018,930 15,629,226 11,861,501 13,601,583
HRK 86,896,574 12,107,812 84,270,397 13,609,121 82,604,968 12,782,202 PKR 816,915,915 7,827,116 743,524,014 6,716,550 656,513,953 4,696,110
PGK – – – – 267,847,531 79,498,861441,446,954 455,850,127 811,463,824
Net foreign currency-denominated financialliabilities (US$249,928,204) (US$346,656,504) (US$245,663,197)
In translating the foreign currency-denominated monetary assets and liabilities into US dollaramounts, the Group used the exchange rates as shown in the table of exchange rates(see Note 3.3).
The following tables present the impact on the Group’s income before income tax (due to changein the fair value of foreign currency-denominated financial assets and liabilities) and equity (dueto translation hedging), of changes in the exchange rate between the foreign currencies and theUS dollar (holding all other variables held constant) as at December 31 (amounts in millionsunless otherwise indicated):
2016Effect on Profit
Before TaxEffect
on EquityChange in US dollar to other foreign currency exchange rates: 5% appreciation US$0.9 (US$0.8) 5% depreciation (1.0) 0.9
2017Effect on Profit
Before TaxEffect
on EquityChange in US dollar to other foreign currency exchange rates: 5% appreciation US$2.1 (US$1.3) 5% depreciation (2.3) 1.4
2018Effect on Profit
Before TaxEffect
on EquityChange in US dollar to other foreign currency exchange rates: 5% appreciation US$0.6 (US$0.6) 5% depreciation (0.6) 0.7

- 137 -
*SGVFS033016*
The sensitivity analyses have been prepared on the basis that the amount of net debt, the ratio offixed to float interest rates of the debt and derivatives and the proportion of the financialinstruments in foreign currencies are all constant and on the basis of hedge designation in place ateach balance sheet date.
Credit RiskThe Group trades only with recognized, creditworthy third parties and the exposure to credit riskis monitored on an ongoing basis with the result that the Group’s exposure to bad debts is notsignificant. Since the Group trades only with recognized third parties, collateral is not required inrespect of financial assets. Moreover, counterparty credit limits are reviewed by management onan annual basis. The limits are set to minimize the concentration of risks and mitigate financiallosses through potential counterparty failure.
With respect to credit risk arising from the other financial assets of the Group, which comprise ofcash and cash equivalents, and available-for-sale investments, the Group’s exposure to credit riskarises from default of the counterparty, with a maximum exposure equal to the carrying amount ofthese instruments.
As at December 31, 2016, 2017 and 2018, about 32 percent, 45 percent and 75 percent,respectively, of cash and cash equivalents of the Group is with Philippine local banks.Investments of funds are made only with counterparties approved by the Board. The maximumexposure to credit risk is represented by the carrying amount of each financial asset in theconsolidated balance sheets.
At December 31, the following tables provide credit information and maximum exposure ofICTSI’s financial assets (amounts in millions unless otherwise indicated):
2016Neither Past Due
nor ImpairedPast Due but
Not Impaired Impaired TotalLoans and ReceivablesCash and cash equivalents: Cash in banks US$247.1 US$– US$– US$247.1 Cash equivalents 76.5 – – 76.5Receivables Trade 46.8 36.6 10.1 93.5 Advances and nontrade 9.3 7.2 0.4 16.9AFS Investments 13.1 – – 13.1Derivative Assets 8.0 – – 8.0
US$400.8 US$43.8 US$10.5 US$455.1
2017Neither Past Due
nor ImpairedPast Due but
Not Impaired Impaired TotalLoans and ReceivablesCash and cash equivalents: Cash in banks US$209.8 US$– US$– US$209.8 Cash equivalents 66.6 – – 66.6Receivables Trade 66.0 34.7 7.0 107.7 Advances and nontrade 8.5 3.7 0.5 12.7AFS Investments 13.3 – – 13.3Derivative Assets 5.1 – – 5.1
US$369.3 US$38.4 US$7.5 US$415.2

- 138 -
*SGVFS033016*
2018Neither Past Due
nor ImpairedPast Due but
Not Impaired Impaired TotalLoans and ReceivablesCash and cash equivalents: Cash in banks US$137.5 US$– US$– US$137.5 Cash equivalents 307.9 – – 307.9Receivables Trade 71.4 34.8 7.5 113.7 Advances and nontrade 10.4 3.8 0.5 14.7Financial Assets at FVOCI 13.7 – – 13.7Derivative Assets 0.6 – – 0.6
US$541.5 US$38.6 US$8.0 US$588.1
At December 31, the credit quality per class of financial assets that were neither past due norimpaired follow (amounts in millions unless otherwise indicated):
2016Neither Past Due nor Impaired
Grade A Grade B Grade C TotalLoans and ReceivablesCash and cash equivalents: Cash in banks US$247.1 US$– US$– US$247.1 Cash equivalents 76.5 – – 76.5Receivables: Trade 36.3 5.5 5.0 46.8 Advances and nontrade 9.2 0.1 – 9.3AFS Investments 13.1 – – 13.1Derivative Assets 8.0 – – 8.0
US$390.2 US$5.6 US$5.0 US$400.8
2017Neither Past Due nor Impaired
Grade A Grade B Grade C TotalLoans and ReceivablesCash and cash equivalents: Cash in banks US$209.8 US$– US$– US$209.8 Cash equivalents 66.6 – – 66.6Receivables: Trade 35.0 24.3 6.7 66.0 Advances and nontrade 5.5 3.0 – 8.5AFS Investments 13.3 – – 13.3Derivative Assets 5.1 – – 5.1
US$335.3 US$27.3 US$6.7 US$369.3
2018Neither Past Due nor Impaired
Grade A Grade B Grade C TotalLoans and ReceivablesCash and cash equivalents: Cash in banks US$137.5 US$– US$– US$137.5 Cash equivalents 307.9 – – 307.9Receivables: Trade 51.0 16.8 3.6 71.4 Advances and nontrade 7.3 3.1 – 10.4Financial Assets at FVOCI 13.7 – – 13.7Derivative Assets 0.6 – – 0.6
US$518.0 US$19.9 US$3.6 US$541.5

- 139 -
*SGVFS033016*
The credit quality of the financial assets was determined as follows:
Cash and cash equivalents, derivative financial assets and AFS Investments - based on the creditstanding of the counterparty.
Receivables - Grade A receivables pertain to those receivables from clients or customers thatalways pay on time or even before the maturity date. Grade B includes receivables that arecollected on their due dates provided that they were reminded or followed up by the Group. Thosereceivables which are collected consistently beyond their due dates and require persistent effortfrom the Group are included under Grade C.
At December 31, the aging analyses of the receivables that were past due but not impaired follow(amounts in millions unless otherwise indicated):
2016Past Due but Not Impaired
1 to 30Days
31 to 60Days
61 to 120Days
More than120 Days Total
Trade US$29.4 US$4.4 US$2.8 US$– US$36.6Advances and nontrade 6.5 – 0.4 0.3 7.2
US$35.9 US$4.4 US$3.2 US$0.3 US$43.8
2017Past Due but Not Impaired
1 to 30Days
31 to 60Days
61 to 120Days
More than120 Days Total
Trade US$20.7 US$6.6 US$7.4 US$– US$34.7Advances and nontrade 2.5 0.2 0.3 0.7 3.7
US$23.2 US$6.8 US$7.7 US$0.7 US$38.4
2018Past Due but Not Impaired
1 to 30Days
31 to 60Days
61 to 120Days
More than120 Days Total
Trade US$23.4 US$5.2 US$4.2 US$2.0 US$34.8Advances and nontrade – 1.5 0.2 2.1 3.8
US$23.4 US$6.7 US$4.4 US$4.1 US$38.6
Capital ManagementThe primary objective of the Group’s management is to ensure that it maintains a strong creditrating and healthy capital ratios in order to support its business and maximize shareholder value.
The Group considers the total equity and debt as its capital. The Group manages its capitalstructure and makes adjustments to it, in light of changes in economic conditions. To maintain oradjust the capital structure, the Group may adjust the dividend payment to shareholders, returncapital to shareholders or issue new shares and raise additional debt through either the bond orloan markets or prepay existing debt. No changes were made in the objectives, policies orprocesses during the years ended December 31, 2016, 2017 and 2018.
The Group monitors capital using gearing ratio. Gearing ratio is total debt over net worth (totalequity) where total debt includes long-term debt and loans payable. Some creditor banks computegearing ratio as total debt less cash and cash equivalents over net worth for the computation of theGroup’s financial covenants.

- 140 -
*SGVFS033016*
The Group’s policy is to keep the gearing ratio within two times.
2016 2017 2018Long-term debt US$1,344,765,928 US$1,432,417,876 US$1,271,335,292Loans payable 36,598,275 61,187,102 35,718,397
Total debt (a) 1,381,364,203 1,493,604,978 1,307,053,689
Net worth or total equity (b) 1,766,079,998 1,872,567,958 2,229,199,586
Gearing ratio (a/b) 0.78 times 0.80 times 0.59 times
28. Earnings Per Share Computation
The following table presents information necessary to calculate earnings per share:
2016 2017 2018Net income attributable to equity holders of the
parent US$180,015,587 US$182,141,250 US$221,493,804Adjustment for the effect of cumulative distribution
on subordinated perpetual capital securities(see Note 14.6) (46,276,661) (41,578,980) (63,903,980)
Net income attributable to equity holdersof the parent, as adjusted (a) US$133,738,926 US$140,562,270 US$157,589,824
Common shares outstanding at beginning of year 2,045,177,671 2,045,177,671 2,045,177,671Weighted shares held by subsidiaries (734,970) (734,970) (734,970)Weighted treasury shares (11,998,887) (17,612,022) (12,705,706)Weighted average shares outstanding (b) 2,032,443,814 2,026,830,679 2,031,736,995Effect of dilutive stock grants 17,130,267 10,982,205 4,630,729Weighted average shares outstanding adjusted
for potential common shares (c) 2,049,574,081 2,037,812,884 2,036,367,724
Basic earnings per share (a/b) US$0.066 US$0.069 US$0.078
Diluted earnings per share (a/c) US$0.065 US$0.069 US$0.077
*SGVFS033016*
INDEPENDENT AUDITOR’S REPORTON SUPPLEMENTARY SCHEDULES
The Stockholders and the Board of DirectorsInternational Container Terminal Services, Inc. and SubsidiariesICTSI Administration BuildingMICT South Access Road, Manila
We have audited in accordance with Philippine Standards on Auditing, the consolidated financialstatements of International Container Terminal Services, Inc. (the Company) and Subsidiaries as atDecember 31, 2016, 2017 and 2018 and for each of the three years in the period then ended, included inthis Form 17-A and have issued our report thereon dated March 5, 2019. Our audits were made for thepurpose of forming an opinion on the basic financial statements taken as a whole. The schedules listed inthe Index to Consolidated Financial Statements and Supplementary Schedules are the responsibility of theCompany’s management. These schedules are presented for purposes of complying with SecuritiesRegulation Code Rule 68, As Amended (2011) and are not part of the basic financial statements. Theseschedules have been subjected to the auditing procedures applied in the audit of the basic financialstatements and, in our opinion, fairly state, in all material respects, the information required to be set forththerein in relation to the basic financial statements taken as a whole.
SYCIP GORRES VELAYO & CO.
Arnel F. De JesusPartnerCPA Certificate No. 43285SEC Accreditation No. 0075-AR-4 (Group A), May 1, 2016, valid until May 1, 2019Tax Identification No. 152-884-385BIR Accreditation No. 08-001998-15-2018, March 14, 2018, valid until March 13, 2021PTR No. 7332542, January 3, 2019, Makati City
March 5, 2019
SyCip Gorres Velayo & Co.6760 Ayala Avenue1226 Makati CityPhilippines
Tel: (632) 891 0307Fax: (632) 819 0872ey.com/ph
BOA/PRC Reg. No. 0001, October 4, 2018, valid until August 24, 2021SEC Accreditation No. 0012-FR-5 (Group A), November 6, 2018, valid until November 5, 2021
A member firm of Ernst & Young Global Limited

S2
INTERNATIONAL CONTAINER TERMINAL SERVICES, INC. AND SUBSIDIARIESSchedule A. Financial Assets
December 31, 2018
Financial Assets
Name of Issuing Entityand Association
of Each Issue
Number of Shares orPrincipal Amount of
Bonds and Notes
AmountShown in the
Balance Sheet
Valued Based onMarket Quotation at
End ofReporting Period
Income Receivedand Accrued
Financial Assets at FVPLFreestanding Derivatives N/A N/A US$579,322 N/A US$–
Loans and ReceivablesCash and Cash Equivalents N/A N/A 447,079,325 N/A 4,368,706Receivables N/A N/A 124,403,784 N/A –
AFS investmentsQuoted Equity Shares N/A N/A 13,032,348 US$13,032,348 4,011Unquoted Equity Shares N/A N/A 689,776 N/A –
US$585,784,555 US$4,372,717

S3
INTERNATIONAL CONTAINER TERMINAL SERVICES, INC. AND SUBSIDIARIESSchedule B. Amounts Receivable from Directors, Officers, Employees, Related Parties and Principal Stockholders (Other than Related Parties)
December 31, 2018
Deductions
Name and Designation of Debtor
Balance atBeginning of
Period AdditionsAmountsCollected
AmountsWritten Off Current Not Current
Balance atEnd of Period
NOT APPLICABLE

S4-1
INTERNATIONAL CONTAINER TERMINAL SERVICES, INC. AND SUBSIDIARIESSchedule C. Amounts Receivable from Related Parties which are Eliminated during the Consolidation of Financial Statements
December 31, 2018
Name and Designation of DebtorBalance at
Beginning ofPeriod
AdditionsDeductions
Current Not currentBalance at End
of PeriodAmountscollected
AmountsWritten Off
Others
Cavite Gateway Terminal, Inc. US$10,741,001 US$17,018,722 (sUS$1,709,359) US$– US$(460,433) US$– US$25,589,931 US$25,589,931ICTSI Warehousing, Inc. 22,456,386 – (595,316) – (1,136,106) – 20,724,964 20,724,964Abbotsford Holdings, Inc. 11,913,382 22,396 – – (711,687) – 11,224,091 11,224,091ICTSI Ltd. 10,935,814 581,528 (1,509,323) – (508,124) – 9,499,895 9,499,895ICTSI Capital B.V. 7,644,443 964,644 – – (76,928) – 8,532,159 8,532,159IW Cargo Handlers, Inc. 2,091,071 302,552 – – (116,353) – 2,277,270 2,277,270ICTSI South Pacific Limited 21,791 1,328,843 – – (13,436) – 1,337,198 1,337,198ICTSI Asia Pacific Business Services,
Inc. 687,166 147,207 – – (68,780) – 765,593 765,593Victoria International Container
Terminal Limited 684,597 57,243 (1,584) – (36,283) – 703,973 703,973Laguna Gateway Inland Container
Terminal, Inc. 285,294 1,062,731 (802,397) – 2,908 – 548,536 548,536TecPlata S.A. 382,020 12,017 – – (16,943) – 377,094 377,094ICTSI Ltd. RHQ 363,035 52,814 – – (71,110) – 344,739 344,739Manila North Harbour Port, Inc. 8,218 336,146 (35,786) – 11,545 – 320,123 320,123Intermodal Terminal Holdings, Inc. 315,696 – – – (15,919) – 299,777 299,777Contecon Manzanillo S.A. 300,890 27,323 – – (39,056) – 289,157 289,157Mindanao International Container
Terminal Services, Inc. 319,950 105,001 (139,568) – (28,278) – 257,105 257,105Subic Bay International Terminal
Holdings, Inc. 5,692 128,509 – – 5,319 – 139,520 139,520PT PBM Olah Jasa Andal 97,782 1,661 – – (1,897) – 97,546 97,546Operadora Portuaria Centroamericana,
S.A. de C.V. 94,295 4,688 – – (6,674) – 92,309 92,309Pakistan International Container
Terminal Limited 65,455 6,023 – – (5,824) – 65,654 65,654Cordilla Properties Holdings, Inc. 310,574 – (277,546) – 16,454 – 49,482 49,482PT Makassar Terminal Services 42,866 143 – – (204) – 42,805 42,805Hijo International Port Services, Inc. 25,051 482 – – 16 – 25,549 25,549
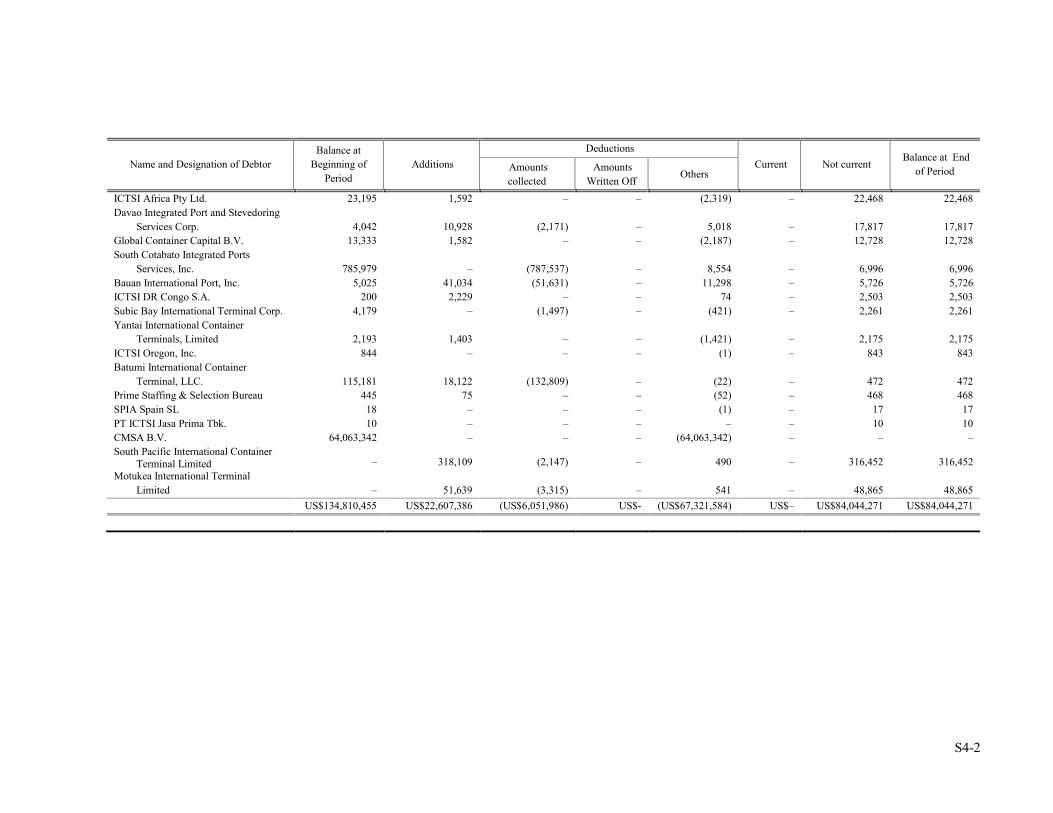
S4-2
Name and Designation of DebtorBalance at
Beginning ofPeriod
AdditionsDeductions
Current Not currentBalance at End
of PeriodAmountscollected
AmountsWritten Off
Others
ICTSI Africa Pty Ltd. 23,195 1,592 – – (2,319) – 22,468 22,468Davao Integrated Port and Stevedoring
Services Corp. 4,042 10,928 (2,171) – 5,018 – 17,817 17,817Global Container Capital B.V. 13,333 1,582 – – (2,187) – 12,728 12,728South Cotabato Integrated Ports
Services, Inc. 785,979 – (787,537) – 8,554 – 6,996 6,996Bauan International Port, Inc. 5,025 41,034 (51,631) – 11,298 – 5,726 5,726ICTSI DR Congo S.A. 200 2,229 – – 74 – 2,503 2,503Subic Bay International Terminal Corp. 4,179 – (1,497) – (421) – 2,261 2,261Yantai International Container
Terminals, Limited 2,193 1,403 – – (1,421) – 2,175 2,175ICTSI Oregon, Inc. 844 – – – (1) – 843 843Batumi International Container
Terminal, LLC. 115,181 18,122 (132,809) – (22) – 472 472Prime Staffing & Selection Bureau 445 75 – – (52) – 468 468SPIA Spain SL 18 – – – (1) – 17 17PT ICTSI Jasa Prima Tbk. 10 – – – – – 10 10CMSA B.V. 64,063,342 – – – (64,063,342) – – –South Pacific International Container
Terminal Limited – 318,109 (2,147) – 490 – 316,452 316,452Motukea International Terminal
Limited – 51,639 (3,315) – 541 – 48,865 48,865US$134,810,455 US$22,607,386 (US$6,051,986) US$- (US$67,321,584) US$– US$84,044,271 US$84,044,271

S5
INTERNATIONAL CONTAINER TERMINAL SERVICES, INC. AND SUBSIDIARIESSchedule D. Intangible Assets – Other Assets
December 31, 2018
Description BeginningBalance
Additionsat Cost
Charged toCost andExpenses
Charged toOther Accounts
Other ChangesAdditions
(Deductions)Ending
Balance
See Notes 5 and 9 to theAudited ConsolidatedFinancial Statements

S6
INTERNATIONAL CONTAINER TERMINAL SERVICES, INC. AND SUBSIDIARIESSchedule E. Long-term Debt
December 31, 2018
Title of Issue and Type of Obligation AmountAuthorized byIndenture
Amount Shown UnderCaption “Current Portionof Long-term Debt” inRelated Balance Sheet
Amount Shown UnderCaption “Noncurrent Portionof Long-term Debt” inRelated Balance Sheet
Remarks
ITBV - US dollar-denominated medium-term note US$– US$757,902,011ICTSI - US dollar-denominated notes – 179,255,736OPC - US dollar-denominated loan 16,320,000 13,180,000CGSA - US dollar-denominated loan 7,647,059 9,558,823IDRC - Secured USD term Loan 6,770,833 17,187,500VICT - Secured AUD term Loan 18,461,930 231,576,542YICT - Secured RMB term loan – 7,269,025AGCT - Secured Euro term loan 1,648,519 4,557,314
US$50,848,341 US$1,220,486,951
See Notes 15 to theAudited ConsolidatedFinancial Statements

S7
INTERNATIONAL CONTAINER TERMINAL SERVICES, INC. AND SUBSIDIARIESSchedule F. Indebtedness to Related Parties (Long-term Loans from Related Companies)
December 31, 2018
Name of Related PartyBalance at
Beginning of PeriodBalance at
End of Period
NONE

S8
INTERNATIONAL CONTAINER TERMINAL SERVICES, INC. AND SUBSIDIARIESSchedule G. Guarantees of Securities of Other Issuers
December 31, 2018
Name of Issuing Entity of Securities Guaranteed by the Companyfor which this Statement is Filed
Title of Issue of EachClass of Securities
Guaranteed
Total AmountGuaranteed and
Outstanding
Amount Owned byPerson for which
this Statement is Filed Nature of Guarantee
NONE

S9
INTERNATIONAL CONTAINER TERMINAL SERVICES, INC. AND SUBSIDIARIESSchedule H. Capital Stock
December 31, 2018
Number ofShares
Numberof Shares
Number ofShares Number of Shares Held By
AuthorizedIssued and
OutstandingReserved for
Options,
Title of IssueAs Shown Under
RelatedWarrants,
Conversion, SubsidiariesDirectors,
Officers and OthersBalance Sheet
Captionand Other
Rights EmployeesPreferred SharesPreferred A Shares 993,000,000 3,800,000 – 3,800,000 – –Preferred B Shares 700,000,000 700,000,000 – – 700,000,000 –
Common Shares 4,227,397,381 2,011,001,931 34,175,740 734,970 992,207,034 1,018,059,927

S10
INTERNATIONAL CONTAINER TERMINAL SERVICES, INC. AND SUBSIDIARIESSchedule I. Amounts Payable to Related Parties which are Eliminated during the Consolidation of Financial Statements
December 31, 2018
Name and Designation of CreditorBalance at
Beginning ofPeriod
AdditionsDeductions
Current Not currentBalance at End of
PeriodAmounts paid Others
Royal Capital B.V. US$716,772,938 US$109,496,506 (US$102,878,727) US$100,000,122 US$8,573,716 US$814,817,123 US$823,390,839ICTSI Treasury B.V. 801,544,432 92,364,141 (91,143,050) – 4,168,225 798,597,298 802,765,523ICTSI Global Finance B.V. 172,089,827 8,667,598 (8,436,264) – 9,837,833 162,483,328 172,321,161International Container Terminal Holdings, Inc. 9,319,206 1,218,816 – 80,131 – 10,618,153 10,618,153ICTSI Ltd. Regional Operating
Headquarters 1,221,963 – (125,711) (102,228) – 994,024 994,024Adriatic Gate Container Terminal Terminal
Services, Ltd. 363,556 – – 1,301 – 364,857 364,857Tecon Suape, S.A. 185,009 – – 2,414 – 187,423 187,423Madagascar International Container Terminal
Services, Ltd. 127,279 452 – 7,052 – 134,783 134,783Baltic Container Terminal Ltd. 58,719 – – 1,435 – 60,154 60,154Contecon Guayaquil S.A. 43,430 – – 413 – 43,843 43,843ICTSI (M.E.) DMCC 44,295 – (24,050) 6,492 – 26,737 26,737Sociedad Puerto Industrial Aguadulce, S.A. 867 – – 80 – 947 947Basra Gateway Terminal – 9,788 (9,066) – – 722 722Container Terminal Systems Solutions, Inc – 73 – (7) – 66 66ICTSI Global Cooperatief U.A. (668,000) 3,000,000 (2,154) 8 – 2,329,854 2,329,854ICTSI Project Delivery Services Co. Pte. Ltd. (713) (938) 2,493 – – 842 842
US$1,701,102,808 US$214,756,436 (US$202,616,529) US$99,997,213 US$22,579,774 US$1,790,660,154 US$1,813,239,928

S11
INTERNATIONAL CONTAINER TERMINAL SERVICES, INC. AND SUBSIDIARIESSchedule J. Parent Company Retained Earnings Available for Dividend Declaration
December 31, 2018
AmountUnappropriated parent company retained earnings, beginning US$110,384,508
Reconciliation:
Add (Less):Unrealized foreign exchange gain - net (1,353,374)Deferred tax assets (48,385,715)Mark-to-market gain on derivatives (29,696,793)Treasury shares (14,124,743)Effect to retained earnings of adoption of PAS 19R (156,917)
Unappropriated parent company retained earnings, as adjusted, beginning 16,666,966
Parent company net income actually earned/realized during the period 100,291,086
Less: Non-actual/unrealized income net of tax:Mark-to-market gain on derivatives (39,488,184)
Parent company net income actually earned/realized during the period 60,802,902
Add (Less):Dividend declaration during the period (97,584,250)Reversal of appropriated retained earnings 150,000,000Decrease in deferred tax assets (excluded those recognized in OCI) (12,242,272)Purchase of treasury shares (45,329,627)Issuance of treasury shares 2,277,081
Unappropriated parent company retained earnings ,as adjusted, ending US$74,590,800
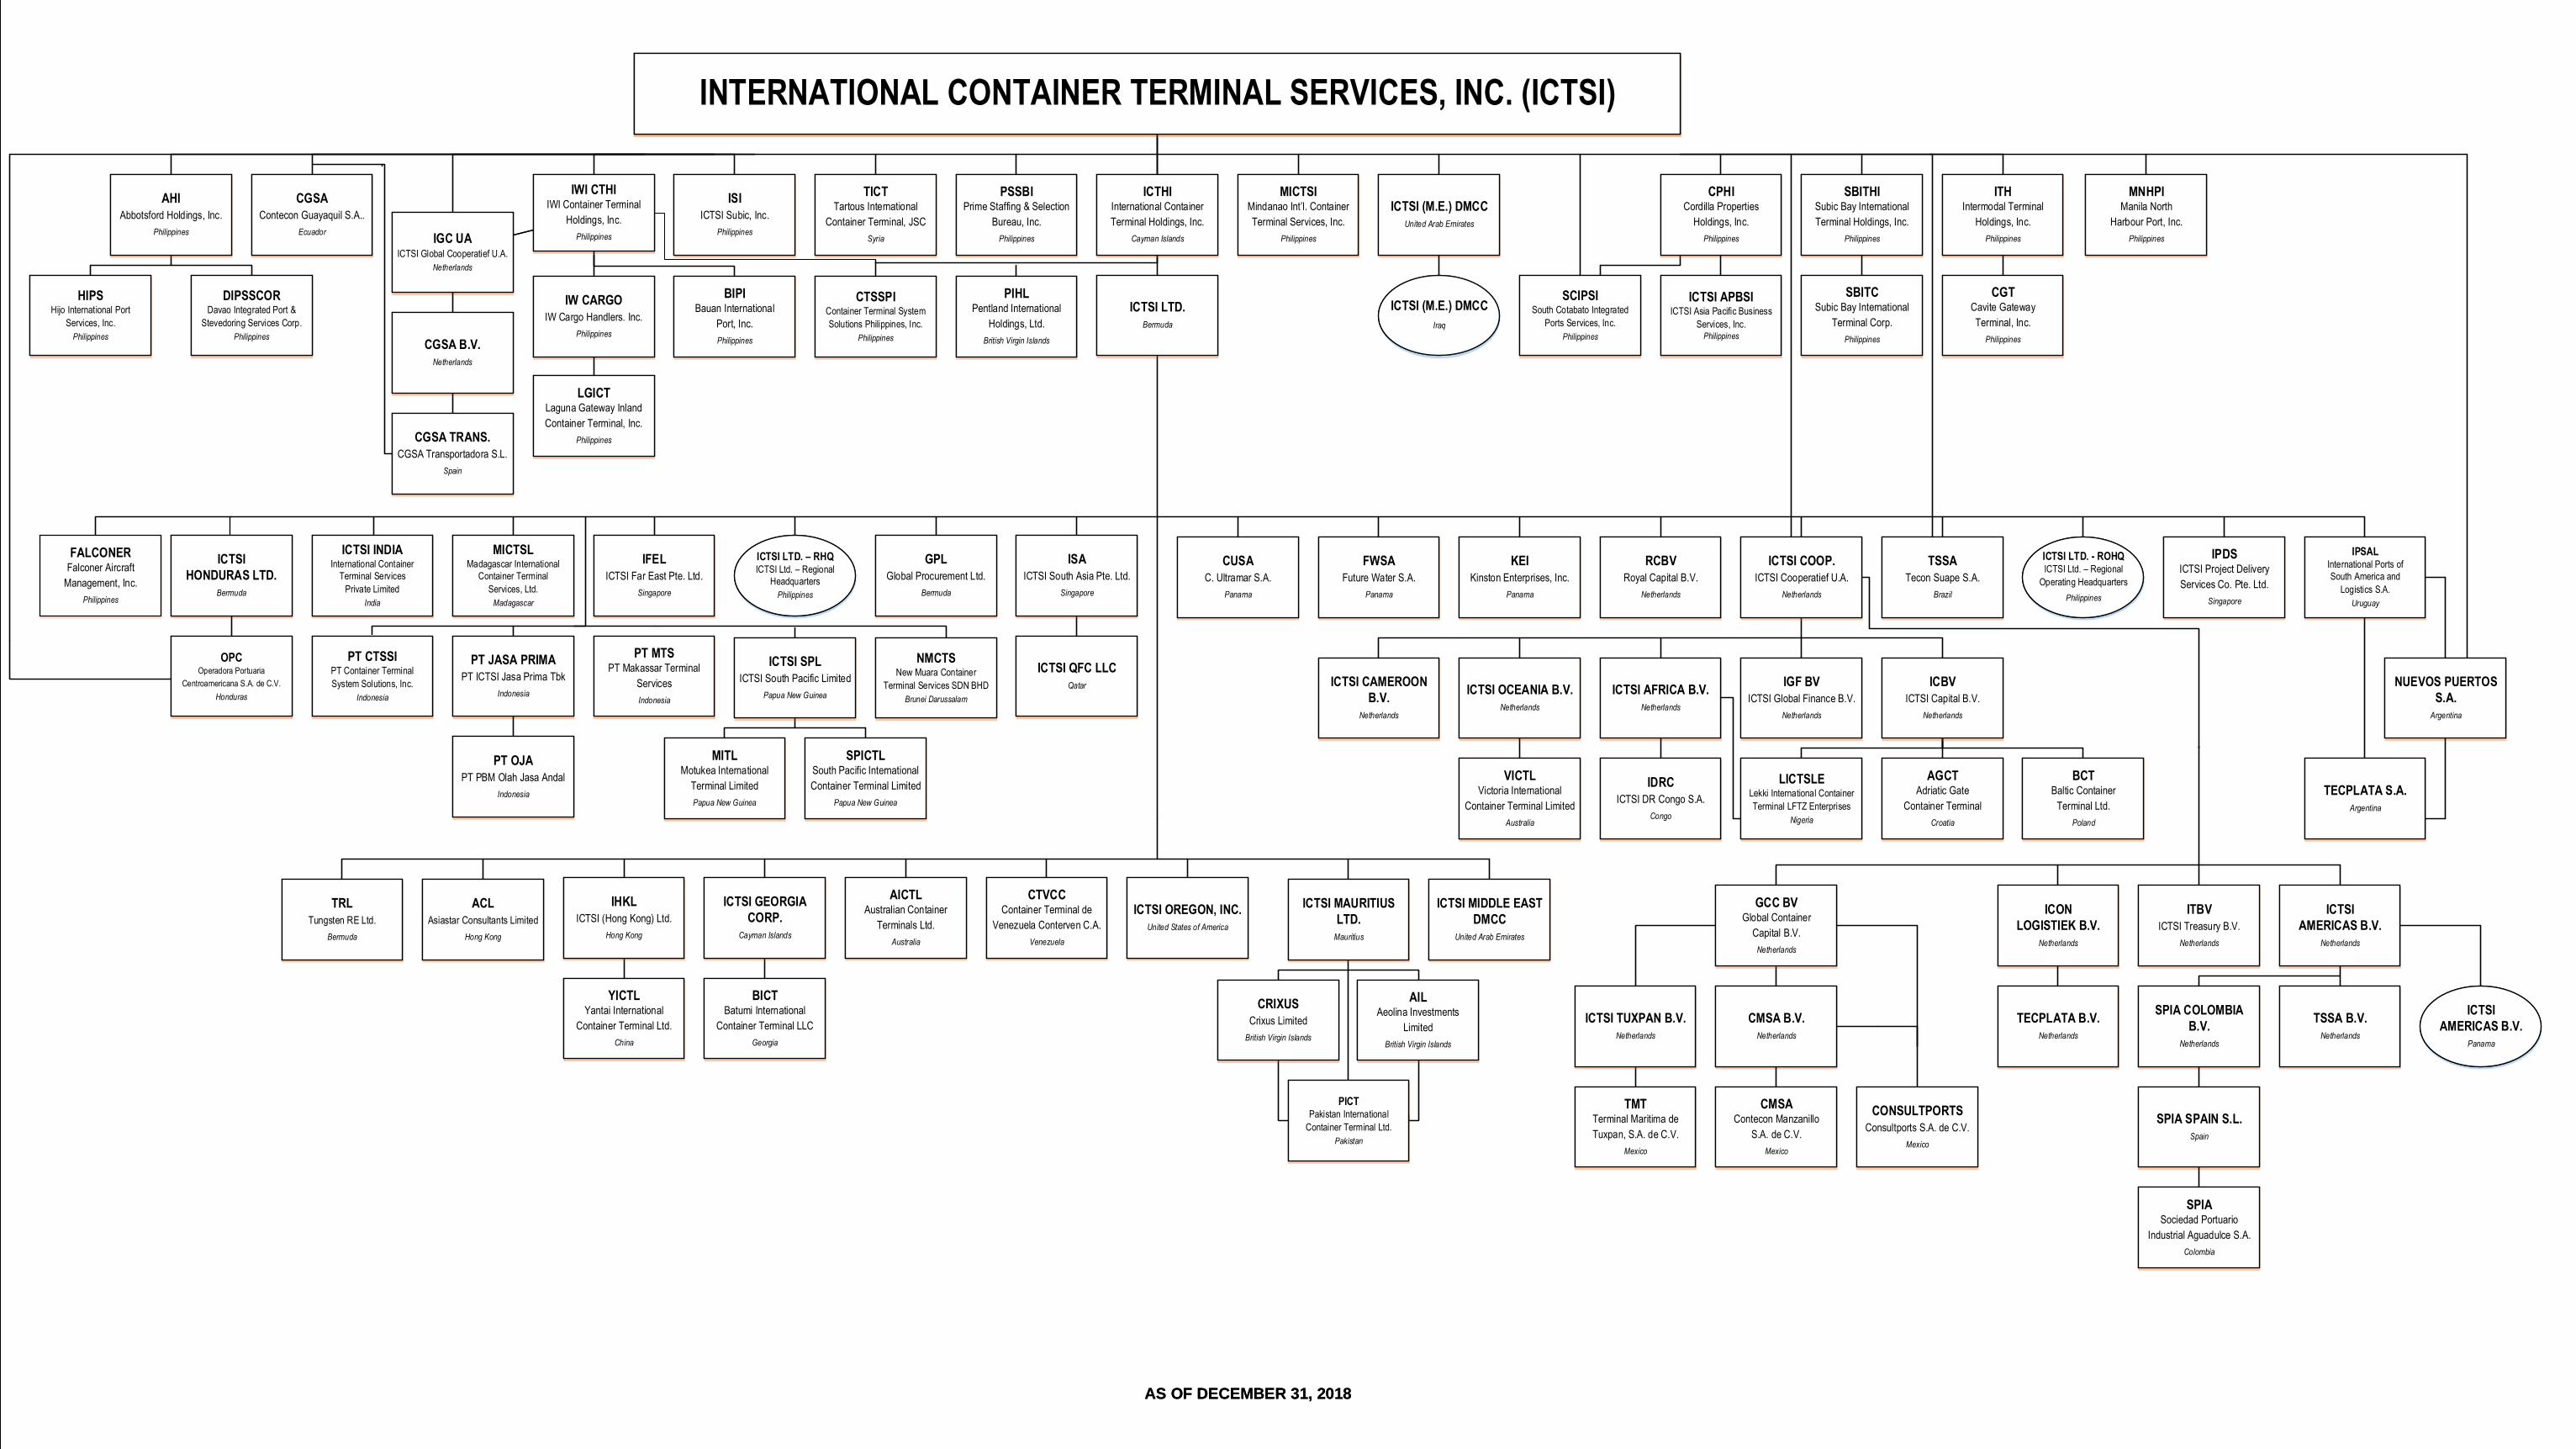
ICTHIInternational Container
Terminal Holdings, Inc.
Cayman Islands
ICTSI LTD.
Bermuda
PSSBIPrime Staffing & Selection
Bureau, Inc.
Philippines
TICTTartous International
Container Terminal, JSC
Syria
ISI
ICTSI Subic, Inc.
Philippines
IWI CTHIIWI Container Terminal
Holdings, Inc.
PhilippinesIGC UAICTSI Global Cooperatief U.A.
Netherlands
AHI
Abbotsford Holdings, Inc.
Philippines
CGSA
Contecon Guayaquil S.A..
Ecuador
MICTSIMindanao Int’l. Container
Terminal Services, Inc.
Philippines
ICTSI (M.E.) DMCC
United Arab Emirates
CPHICordilla Properties
Holdings, Inc.
Philippines
SBITHISubic Bay International
Terminal Holdings, Inc.
Philippines
ITHIntermodal Terminal
Holdings, Inc.
Philippines
LGICTLaguna Gateway Inland
Container Terminal, Inc.
Philippines
ICTSI
HONDURAS LTD.
Bermuda
CUSA
C. Ultramar S.A.
Panama
FWSA
Future Water S.A.
Panama
KEI
Kinston Enterprises, Inc.
Panama
RCBV
Royal Capital B.V.
Netherlands
TSSA
Tecon Suape S.A.
Brazil
IPDSICTSI Project Delivery
Services Co. Pte. Ltd.
Singapore
IPSALInternational Ports of
South America and
Logistics S.A.
Uruguay
OPCOperadora Portuaria
Centroamericana S.A. de C.V.
Honduras
PT CTSSI PT Container Terminal
System Solutions, Inc.
Indonesia
PT MTSPT Makassar Terminal
Services
Indonesia
ICTSI QFC LLC
Qatar NUEVOS PUERTOS
S.A.
Argentina
ICTSI AFRICA B.V.
Netherlands
ICTSI OCEANIA B.V.
Netherlands
ICTSI CAMEROON
B.V.
Netherlands
TECPLATA S.A.
Argentina
AGCTAdriatic Gate
Container Terminal
Croatia
LICTSLELekki International Container
Terminal LFTZ Enterprises
Nigeria
IDRC
ICTSI DR Congo S.A.
Congo
VICTLVictoria International
Container Terminal Limited
Australia
BICTBatumi International
Container Terminal LLC
Georgia
YICTLYantai International
Container Terminal Ltd.
China
PT OJA
PT PBM Olah Jasa Andal
Indonesia
ICTSI MIDDLE EAST
DMCC
United Arab Emirates
ICTSI
AMERICAS B.V.
Netherlands
ICON
LOGISTIEK B.V.
Netherlands
ITBV
ICTSI Treasury B.V.
Netherlands
SPIA COLOMBIA
B.V.
Netherlands
TECPLATA B.V.
Netherlands
SPIA SPAIN S.L.
Spain
SPIASociedad Portuario
Industrial Aguadulce S.A.
Colombia
CMSAContecon Manzanillo
S.A. de C.V.
Mexico
TMTTerminal Maritima de
Tuxpan, S.A. de C.V.
Mexico
CMSA B.V.
Netherlands
PIHLPentland International
Holdings, Ltd.
British Virgin Islands
IW CARGO
IW Cargo Handlers. Inc.
Philippines
CGSA B.V.
Netherlands
CGSA TRANS.
CGSA Transportadora S.L.
Spain
ICTSI MAURITIUS
LTD.
Mauritius
SCIPSISouth Cotabato Integrated
Ports Services, Inc.
Philippines
ICTSI APBSIICTSI Asia Pacific Business
Services, Inc.Philippines
SBITCSubic Bay International
Terminal Corp.
Philippines
CGTCavite Gateway
Terminal, Inc.
Philippines
BIPIBauan International
Port, Inc.
Philippines
ICTSI (M.E.) DMCC
Iraq
ICTSI LTD. - ROHQICTSI Ltd. – Regional
Operating Headquarters
Philippines
PT JASA PRIMA
PT ICTSI Jasa Prima Tbk
Indonesia
TSSA B.V.
Netherlands
ICTSI TUXPAN B.V.
Netherlands
CONSULTPORTS
Consultports S.A. de C.V.
Mexico
ISA
ICTSI South Asia Pte. Ltd.
Singapore
GPL
Global Procurement Ltd.
Bermuda
IFEL
ICTSI Far East Pte. Ltd.
Singapore
MICTSLMadagascar International
Container Terminal
Services, Ltd.
Madagascar
ICTSI INDIAInternational Container
Terminal Services
Private Limited
India
ICTSI LTD. – RHQICTSI Ltd. – Regional
Headquarters
Philippines
AILAeolina Investments
Limited
British Virgin Islands
CRIXUS
Crixus Limited
British Virgin Islands
PICTPakistan International
Container Terminal Ltd.
Pakistan
ICBV
ICTSI Capital B.V.
Netherlands
BCTBaltic Container
Terminal Ltd.
Poland
GCC BVGlobal Container
Capital B.V.
Netherlands
HIPSHijo International Port
Services, Inc.
Philippines
DIPSSCORDavao Integrated Port &
Stevedoring Services Corp.
Philippines
ICTSI
AMERICAS B.V.
Panama
CTSSPIContainer Terminal System
Solutions Philippines, Inc.
Philippines
NMCTSNew Muara Container
Terminal Services SDN BHD
Brunei Darussalam
SPICTLSouth Pacific International
Container Terminal Limited
Papua New Guinea
MITLMotukea International
Terminal Limited
Papua New Guinea
ICTSI SPL
ICTSI South Pacific Limited
Papua New Guinea
ACL
Asiastar Consultants Limited
Hong Kong
ICTSI OREGON, INC.
United States of America
CTVCCContainer Terminal de
Venezuela Conterven C.A.
Venezuela
AICTLAustralian Container
Terminals Ltd.
Australia
ICTSI GEORGIA
CORP.
Cayman Islands
IHKL
ICTSI (Hong Kong) Ltd.
Hong Kong
IGF BV
ICTSI Global Finance B.V.
Netherlands
MNHPIManila North
Harbour Port, Inc.
Philippines
ICTSI COOP.
ICTSI Cooperatief U.A.
Netherlands
TRL
Tungsten RE Ltd.
Bermuda
INTERNATIONAL CONTAINER TERMINAL SERVICES, INC. (ICTSI)INTERNATIONAL CONTAINER TERMINAL SERVICES, INC. (ICTSI)
AS OF DECEMBER 31, 2018
ICTHIInternational Container
Terminal Holdings, Inc.
Cayman Islands
ICTSI LTD.
Bermuda
PSSBIPrime Staffing & Selection
Bureau, Inc.
Philippines
TICTTartous International
Container Terminal, JSC
Syria
ISI
ICTSI Subic, Inc.
Philippines
IWI CTHIIWI Container Terminal
Holdings, Inc.
PhilippinesIGC UAICTSI Global Cooperatief U.A.
Netherlands
AHI
Abbotsford Holdings, Inc.
Philippines
CGSA
Contecon Guayaquil S.A..
Ecuador
MICTSIMindanao Int’l. Container
Terminal Services, Inc.
Philippines
ICTSI (M.E.) DMCC
United Arab Emirates
CPHICordilla Properties
Holdings, Inc.
Philippines
SBITHISubic Bay International
Terminal Holdings, Inc.
Philippines
ITHIntermodal Terminal
Holdings, Inc.
Philippines
LGICTLaguna Gateway Inland
Container Terminal, Inc.
Philippines
ICTSI
HONDURAS LTD.
Bermuda
CUSA
C. Ultramar S.A.
Panama
FWSA
Future Water S.A.
Panama
KEI
Kinston Enterprises, Inc.
Panama
RCBV
Royal Capital B.V.
Netherlands
TSSA
Tecon Suape S.A.
Brazil
IPDSICTSI Project Delivery
Services Co. Pte. Ltd.
Singapore
IPSALInternational Ports of
South America and
Logistics S.A.
Uruguay
OPCOperadora Portuaria
Centroamericana S.A. de C.V.
Honduras
PT CTSSI PT Container Terminal
System Solutions, Inc.
Indonesia
PT MTSPT Makassar Terminal
Services
Indonesia
ICTSI QFC LLC
Qatar NUEVOS PUERTOS
S.A.
Argentina
ICTSI AFRICA B.V.
Netherlands
ICTSI OCEANIA B.V.
Netherlands
ICTSI CAMEROON
B.V.
Netherlands
TECPLATA S.A.
Argentina
AGCTAdriatic Gate
Container Terminal
Croatia
LICTSLELekki International Container
Terminal LFTZ Enterprises
Nigeria
IDRC
ICTSI DR Congo S.A.
Congo
VICTLVictoria International
Container Terminal Limited
Australia
BICTBatumi International
Container Terminal LLC
Georgia
YICTLYantai International
Container Terminal Ltd.
China
PT OJA
PT PBM Olah Jasa Andal
Indonesia
ICTSI MIDDLE EAST
DMCC
United Arab Emirates
ICTSI
AMERICAS B.V.
Netherlands
ICON
LOGISTIEK B.V.
Netherlands
ITBV
ICTSI Treasury B.V.
Netherlands
SPIA COLOMBIA
B.V.
Netherlands
TECPLATA B.V.
Netherlands
SPIA SPAIN S.L.
Spain
SPIASociedad Portuario
Industrial Aguadulce S.A.
Colombia
CMSAContecon Manzanillo
S.A. de C.V.
Mexico
TMTTerminal Maritima de
Tuxpan, S.A. de C.V.
Mexico
CMSA B.V.
Netherlands
PIHLPentland International
Holdings, Ltd.
British Virgin Islands
IW CARGO
IW Cargo Handlers. Inc.
Philippines
CGSA B.V.
Netherlands
CGSA TRANS.
CGSA Transportadora S.L.
Spain
ICTSI MAURITIUS
LTD.
Mauritius
SCIPSISouth Cotabato Integrated
Ports Services, Inc.
Philippines
ICTSI APBSIICTSI Asia Pacific Business
Services, Inc.Philippines
SBITCSubic Bay International
Terminal Corp.
Philippines
CGTCavite Gateway
Terminal, Inc.
Philippines
BIPIBauan International
Port, Inc.
Philippines
ICTSI (M.E.) DMCC
Iraq
ICTSI LTD. - ROHQICTSI Ltd. – Regional
Operating Headquarters
Philippines
PT JASA PRIMA
PT ICTSI Jasa Prima Tbk
Indonesia
TSSA B.V.
Netherlands
ICTSI TUXPAN B.V.
Netherlands
CONSULTPORTS
Consultports S.A. de C.V.
Mexico
ISA
ICTSI South Asia Pte. Ltd.
Singapore
GPL
Global Procurement Ltd.
Bermuda
IFEL
ICTSI Far East Pte. Ltd.
Singapore
MICTSLMadagascar International
Container Terminal
Services, Ltd.
Madagascar
ICTSI INDIAInternational Container
Terminal Services
Private Limited
India
ICTSI LTD. – RHQICTSI Ltd. – Regional
Headquarters
Philippines
AILAeolina Investments
Limited
British Virgin Islands
CRIXUS
Crixus Limited
British Virgin Islands
PICTPakistan International
Container Terminal Ltd.
Pakistan
ICBV
ICTSI Capital B.V.
Netherlands
BCTBaltic Container
Terminal Ltd.
Poland
GCC BVGlobal Container
Capital B.V.
Netherlands
HIPSHijo International Port
Services, Inc.
Philippines
DIPSSCORDavao Integrated Port &
Stevedoring Services Corp.
Philippines
ICTSI
AMERICAS B.V.
Panama
CTSSPIContainer Terminal System
Solutions Philippines, Inc.
Philippines
NMCTSNew Muara Container
Terminal Services SDN BHD
Brunei Darussalam
SPICTLSouth Pacific International
Container Terminal Limited
Papua New Guinea
MITLMotukea International
Terminal Limited
Papua New Guinea
ICTSI SPL
ICTSI South Pacific Limited
Papua New Guinea
ACL
Asiastar Consultants Limited
Hong Kong
ICTSI OREGON, INC.
United States of America
CTVCCContainer Terminal de
Venezuela Conterven C.A.
Venezuela
AICTLAustralian Container
Terminals Ltd.
Australia
ICTSI GEORGIA
CORP.
Cayman Islands
IHKL
ICTSI (Hong Kong) Ltd.
Hong Kong
IGF BV
ICTSI Global Finance B.V.
Netherlands
MNHPIManila North
Harbour Port, Inc.
Philippines
ICTSI COOP.
ICTSI Cooperatief U.A.
Netherlands
TRL
Tungsten RE Ltd.
Bermuda
INTERNATIONAL CONTAINER TERMINAL SERVICES, INC. (ICTSI)
AS OF DECEMBER 31, 2018
FALCONERFalconer Aircraft
Management, Inc.
Philippines

S13-1
INTERNATIONAL CONTAINER TERMINAL SERVICES, INC. AND SUBSIDIARIESSchedule L. List of Effective Standards and Interpretations as of December 31, 2018
PHILIPPINE FINANCIAL REPORTING STANDARDSAND INTERPRETATIONSEffective as at December 31, 2018
Adopted Not Adopted NotApplicable
Framework for the Preparation and Presentation ofFinancial StatementsConceptual Framework Phase A: Objectives and qualitativecharacteristics
PFRSs Practice Statement Management Commentary
Philippine Financial Reporting Standards
PFRS 1(Revised)
First-time Adoption of Philippine FinancialReporting Standards
Amendments to PFRS 1 and PAS 27: Cost of anInvestment in a Subsidiary, Jointly ControlledEntity or Associate
Amendments to PFRS 1: Additional Exemptions forFirst-time Adopters
Amendment to PFRS 1: Limited Exemption fromComparative PFRS 7 Disclosures for First-timeAdopters
Amendments to PFRS 1: Severe Hyperinflation andRemoval of Fixed Date for First-time Adopters
Amendments to PFRS 1: Government Loans
Amendments to PFRS 1: Borrowing Costs
Amendments to PFRS 1: Meaning of EffectivePFRS
Amendments to PFRS 1: Deletion of short-termexemptions for first-time adopters
PFRS 2 Share-based Payment
Amendments to PFRS 2: Vesting Conditions andCancellations
Amendments to PFRS 2: Group Cash-settled Share-based Payment Transactions
Amendments to PFRS 2: Definition of VestingConditions
Amendment to PFRS 2: Share-based Payment,Classification and Measurement of Share-basedPayment Transactions
PFRS 3(Revised)
Business Combinations
Amendments to PFRS 3: Accounting forContingent Consideration in a BusinessCombination
Amendments to PFRS 3: Scope Exceptions forJoint Arrangements
Amendments to PFRS 3, Definition of a Business
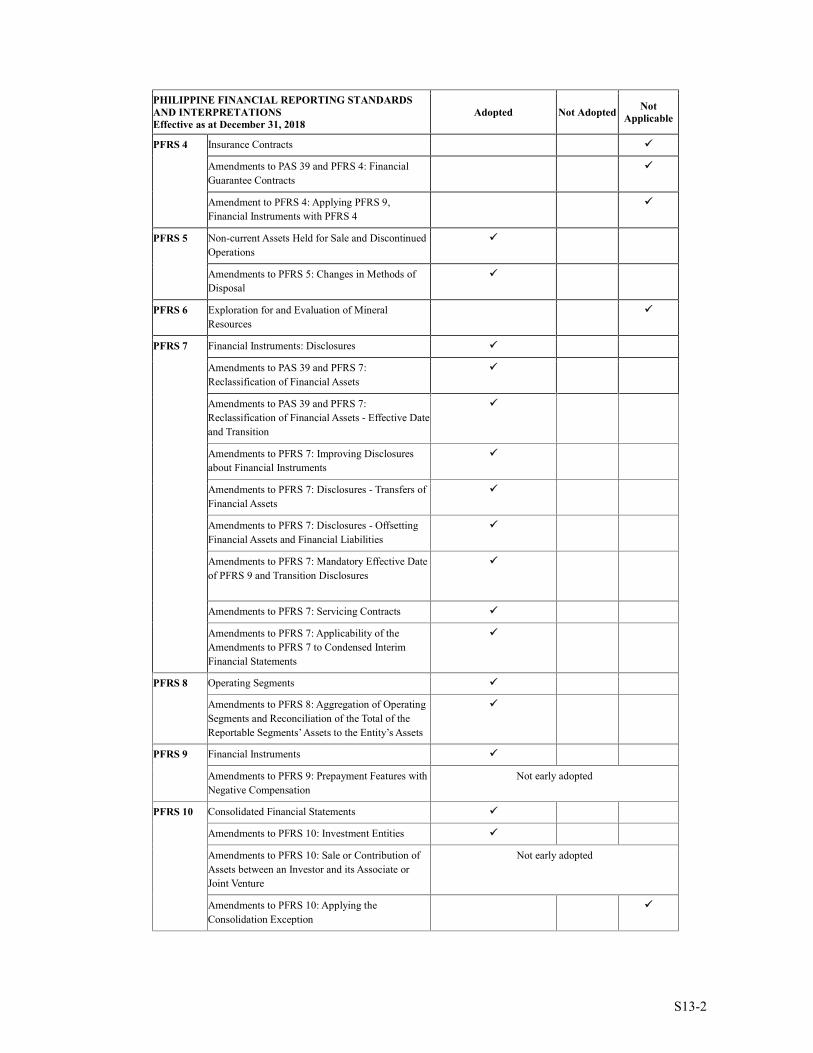
S13-2
PHILIPPINE FINANCIAL REPORTING STANDARDSAND INTERPRETATIONSEffective as at December 31, 2018
Adopted Not Adopted NotApplicable
PFRS 4 Insurance Contracts
Amendments to PAS 39 and PFRS 4: FinancialGuarantee Contracts
Amendment to PFRS 4: Applying PFRS 9,Financial Instruments with PFRS 4
PFRS 5 Non-current Assets Held for Sale and DiscontinuedOperations
Amendments to PFRS 5: Changes in Methods ofDisposal
PFRS 6 Exploration for and Evaluation of MineralResources
PFRS 7 Financial Instruments: Disclosures
Amendments to PAS 39 and PFRS 7:Reclassification of Financial Assets
Amendments to PAS 39 and PFRS 7:Reclassification of Financial Assets - Effective Dateand Transition
Amendments to PFRS 7: Improving Disclosuresabout Financial Instruments
Amendments to PFRS 7: Disclosures - Transfers ofFinancial Assets
Amendments to PFRS 7: Disclosures - OffsettingFinancial Assets and Financial Liabilities
Amendments to PFRS 7: Mandatory Effective Dateof PFRS 9 and Transition Disclosures
Amendments to PFRS 7: Servicing Contracts
Amendments to PFRS 7: Applicability of theAmendments to PFRS 7 to Condensed InterimFinancial Statements
PFRS 8 Operating Segments
Amendments to PFRS 8: Aggregation of OperatingSegments and Reconciliation of the Total of theReportable Segments’ Assets to the Entity’s Assets
PFRS 9 Financial Instruments
Amendments to PFRS 9: Prepayment Features withNegative Compensation
Not early adopted
PFRS 10 Consolidated Financial Statements
Amendments to PFRS 10: Investment Entities
Amendments to PFRS 10: Sale or Contribution ofAssets between an Investor and its Associate orJoint Venture
Not early adopted
Amendments to PFRS 10: Applying theConsolidation Exception

S13-3
PHILIPPINE FINANCIAL REPORTING STANDARDSAND INTERPRETATIONSEffective as at December 31, 2018
Adopted Not Adopted NotApplicable
PFRS 11 Joint Arrangements
Amendments to PFRS 11: Accounting forAcquisitions of Interests in Joint Operations
PFRS 12 Disclosure of Interests in Other Entities
Amendments to PFRS 12: Investment Entities
Amendments to PFRS 12: Applying theConsolidation Exception
Amendments to PFRS 12 – Clarification of theScope of the Standard
PFRS 13 Fair Value Measurement (2013 Version)
Amendments to PFRS 13: Short-term Receivablesand Payables
Amendments to PFRS 13: Portfolio Exception
PFRS 14 Regulatory Deferral Accounts
PFRS 15 Revenue from Contracts with Customers
PFRS 16 Leases Not early adopted
PFRS 17 Insurance Contracts Not early adopted
Philippine Accounting Standards
PAS 1(Revised)
Presentation of Financial Statements
Amendment to PAS 1: Capital Disclosures
Amendments to PAS 32 and PAS 1: PuttableFinancial Instruments and Obligations Arising onLiquidation
Amendments to PAS 1: Presentation of Items ofOther Comprehensive Income
Amendments to PAS 1: Clarification of theRequirements for Comparative Presentation
PAS 2 Inventories
PAS 7 Statement of Cash Flows
Amendment to PAS 7: Disclosure Initiative
PAS 8 Accounting Policies, Changes in AccountingEstimates and Errors, Definition of Material
PAS 10 Events after the Reporting Period
PAS 12 Income Taxes
Amendment to PAS 12 - Deferred Tax: Recovery ofUnderlying Assets
Amendment to PAS 12 – Recognition of DeferredTax Assets for Unrealized Losses
Amendments to PAS 12, Income Tax Consequencesof Payments on Financial Instruments Classified asEquity
Not early adopted

S13-4
PHILIPPINE FINANCIAL REPORTING STANDARDSAND INTERPRETATIONSEffective as at December 31, 2018
Adopted Not Adopted NotApplicable
PAS 16 Property, Plant and Equipment
Amendment to PAS 16: Classification of ServicingEquipment
Amendment to PAS 16: Revaluation Method -Proportionate Restatement of AccumulatedDepreciation
Amendment to PAS 16: Clarification of AcceptableMethods of Depreciation
Amendment to PAS 16: Bearer Plants
PAS 17 Leases
PAS 19(Amended)
Employee Benefits
Amendments to PAS 19: Defined Benefit Plans:Employee Contributions
Amendments to PAS 19: Regional market issueregarding discount rate
Amendments to PAS 19: Plan Amendment,Curtailment or Settlement
Not early adopted
PAS 20 Accounting for Government Grants and Disclosureof Government Assistance
PAS 21 The Effects of Changes in Foreign Exchange Rates
Amendment: Net Investment in a ForeignOperation
PAS 23(Revised)
Borrowing Costs
Amendments to Borrowing Costs Eligible forCapitalization
Not early adopted
PAS 24(Revised)
Related Party Disclosures
Amendments to PAS 24: Key ManagementPersonnel
PAS 26 Accounting and Reporting by Retirement BenefitPlans
PAS 27(Amended)
Separate Financial Statements
Amendments to PAS 27: Investment Entities
Amendments to PAS 27: Equity Method SeparateFinancial Statements
PAS 28(Amended)
Investments in Associates and Joint Ventures
Amendments to PAS 28: Sale or Contribution ofAssets between an Investor and its Associate orJoint Venture
Not early adopted
Amendments to PAS 28: Long-term Interests inJoint Ventures and Associates
Not early adopted

S13-5
PHILIPPINE FINANCIAL REPORTING STANDARDSAND INTERPRETATIONSEffective as at December 31, 2018
Adopted Not Adopted NotApplicable
Amendments to PAS 28: Applying theConsolidation Exception
Amendment to PAS 28: Measuring an Associate orJoint Venture at Fair Value (Part of AnnualImprovements to PFRSs 2014 - 2016 Cycle)
PAS 29 Financial Reporting in HyperinflationaryEconomies
PAS 32 Financial Instruments: Disclosure and Presentation
Amendments to PAS 32 and PAS 1: PuttableFinancial Instruments and Obligations Arising onLiquidation
Amendment to PAS 32: Classification of RightsIssues
Amendment to PAS 32: Tax Effect of Distributionto Holders of Equity Instruments
Amendments to PAS 32: Offsetting FinancialAssets and Financial Liabilities
PAS 33 Earnings per Share
PAS 34 Interim Financial Reporting
Amendment to PAS 34: Interim Financial Reportingand Segment Information for Total Assets andLiabilities
Amendment to PAS 34: Disclosure of information‘Elsewhere in the Interim Financial Report’
PAS 36 Impairment of Assets
Amendments to PAS 36: Recoverable AmountDisclosures for Non-Financial Assets
PAS 37 Provisions, Contingent Liabilities and ContingentAssets
PAS 38 Intangible Assets
Amendments to PAS 38: Revaluation Method -Proportionate Restatement of AccumulatedAmortization
Amendments to PAS 38: Clarification ofAcceptable Methods of Amortization
PAS 40 Investment Property
Amendment to PAS 40: Investment Property
Amendment to PAS 40: Transfers of InvestmentProperty
PAS 41 Agriculture
Amendment to PAS 41: Bearer Plants
Philippine Interpretations
IFRIC 1 Changes in Existing Decommissioning, Restorationand Similar Liabilities

S13-6
PHILIPPINE FINANCIAL REPORTING STANDARDSAND INTERPRETATIONSEffective as at December 31, 2018
Adopted Not Adopted NotApplicable
IFRIC 2 Members' Share in Co-operative Entities andSimilar Instruments
IFRIC 4 Determining Whether an Arrangement Contains aLease
IFRIC 5 Rights to Interests arising from Decommissioning,Restoration and Environmental RehabilitationFunds
IFRIC 6 Liabilities arising from Participating in a SpecificMarket - Waste Electrical and ElectronicEquipment
IFRIC 7 Applying the Restatement Approach under PAS 29Financial Reporting in HyperinflationaryEconomies
IFRIC 8 Scope of PFRS 2
IFRIC 9 Reassessment of Embedded Derivatives
Amendments to Philippine Interpretation IFRIC-9and PAS 39: Embedded Derivatives
IFRIC 10 Interim Financial Reporting and Impairment
IFRIC 11 PFRS 2- Group and Treasury Share Transactions
IFRIC 12 Service Concession Arrangements
IFRIC 13 Customer Loyalty Programmes
IFRIC 14 The Limit on a Defined Benefit Asset, MinimumFunding Requirements and their Interaction
Amendments to Philippine Interpretations IFRIC-14, Prepayments of a Minimum FundingRequirement
IFRIC 15 Agreements for Construction of Real Estate
IFRIC 16 Hedges of a Net Investment in a Foreign Operation
IFRIC 17 Distributions of Non-cash Assets to Owners
IFRIC 18 Transfers of Assets from Customers
IFRIC 19 Extinguishing Financial Liabilities with EquityInstruments
IFRIC 20 Stripping Costs in the Production Phase of aSurface Mine
IFRIC 21 Levies
IFRIC 22 Foreign Currency Transactions and Considerationand Advance Consideration
IFRIC 23 Uncertainty Over Income Tax Treatments Not early adopted
SIC-7 Introduction of the Euro
SIC-10 Government Assistance - No Specific Relation toOperating Activities
SIC-12 Consolidation - Special Purpose Entities
Amendment to SIC - 12: Scope of SIC 12

S13-7
PHILIPPINE FINANCIAL REPORTING STANDARDSAND INTERPRETATIONSEffective as at December 31, 2018
Adopted Not Adopted NotApplicable
SIC-13 Jointly Controlled Entities - Non-MonetaryContributions by Venturers
SIC-15 Operating Leases - Incentives
SIC-25 Income Taxes - Changes in the Tax Status of anEntity or its Shareholders
SIC-27 Evaluating the Substance of Transactions Involvingthe Legal Form of a Lease
SIC-29 Service Concession Arrangements: Disclosures.
SIC-31 Revenue - Barter Transactions InvolvingAdvertising Services
SIC-32 Intangible Assets - Web Site Costs

S14
INTERNATIONAL CONTAINER TERMINAL SERVICES, INC. AND SUBSIDIARIESFinancial Soundness Indicators
As of and for the Year Ended December 31
2017 2018Liquidity ratios
Current ratio(a) 1.24 1.54Interest rate coverage ratio(b) 5.76 6.34
Solvency ratiosDebt to equity ratio(c) 0.80 0.59Asset to equity ratio(d) 2.33 2.11
Profitability ratioEBITDA margin(e) 46.4% 46.3%
(a) Current assets over current liabilities(b) EBITDA over interest expense and financing charges on borrowings(c) Interest-bearing debt over total equity(d) Total assets over total equity(e) EBITDA over gross revenues from port operations