c ost and p erformance r eport - frtr · c ost and p erformance r eport ... act of 1986 (sara)...
TRANSCRIPT

COST ANDPERFORMANCE
REPORT
Pump and Treat of Contaminated Groundwater at theCity Industries Superfund Site
Orlando, Florida
September 1998
EPAPrepared by:
U.S. Environmental Protection AgencyOffice of Solid Waste and Emergency ResponseTechnology Innovation Office

City Industries Superfund Site
EPAU.S. Environmental Protection Agency
Office of Solid Waste and Emergency ResponseTechnology Innovation Office
TIO3.WP6\0319-04.stf60
SITE INFORMATION
Identifying Information: Treatment Application:
City Industries Superfund siteOrlando, Florida
CERCLIS #: FLD055945653
ROD Date: March 29, 1990
Type of Action: Remedial
Period of operation: 05/94 - Ongoing (Datacollected through May 1997)
Quantity of groundwater treated duringapplication: 151.7 million gallons
Background
Historical Activity that GeneratedContamination at the Site: Hazardous wastehandling
Corresponding SIC Code: 4953 (HazardousWaste Material Disposal Sites)
Waste Management Practice ThatContributed to Contamination: Improperdisposal practices and unauthorized dumping
Location: Orlando, Florida
Facility Operations [1,2,3]:C The City Industries site operated as a
hazardous waste Treatment, Storage, andDisposal (TSD) facility from 1971 until 1983. From 1981 through 1983, U.S. EPA andOrange County officials cited the facility formultiple RCRA violations. In July 1983,EPA, the Florida Department ofEnvironmental Protection (FDEP), andOrange County ordered the business toclose under Resource Conservation andRecovery Act (RCRA) authority.
C In 1983, the owner of the site abandonedthe facility. That same year, EPA andFDEP performed source control activities,including the FDEP removing 41 tons ofwaste drums, sludge, and liquid hazardouswaste. EPA also thermally treated 1,670tons of contaminated soil off site, andreturned the clean soil to the site as fill. EPA removing 10 tons of highlycontaminated soil and transported it to anoff-site hazardous waste landfill. As a resultof these activities, the only remaining mediaof concern at the site was the groundwater.
C In 1984, EPA issued an AdministrativeOrder to City Industries requiring cleanup;however, the company ignored the order. InDecember 1985, the facility owner was
found guilty on 17 counts of hazardouswaste handling violations and other criminalcharges.
C FDEP completed a multiphased RemedialInvestigation (RI) in May 1986.
C In 1988, FDEP and the City Industriessteering committee entered into anagreement to develop viable cleanupoptions. The Feasibility Study (FS) wasconducted by the Potentially ResponsibleParties (PRPs) under a consent agreementbetween the PRPs and FDEP and wascompleted in December 1989.
C In March 1989, the site was listed on theNational Priorities List (NPL), and EPAassumed oversight responsibility fromFDEP. A Record of Decision (ROD) for thesite was signed on March 29, 1990.
C In 1991, EPA negotiated a consent decreewith the PRPs to fund the necessaryactivities to clean up the site.
Regulatory Context:C The ROD for the site was signed in 1990.
C An Explanation of Significant Differences(ESD) was signed in February 1994 torevise the selected remedy and to identifytwo new contaminants. The ROD called forsecondary treatment of effluent to meetPOTW pretreatment standards; however,the POTW refused to accept the discharge. The ESD revised the remedy to include airstripping with no secondary treatment anddischarge to surface water under an NPDESpermit.
SITE INFORMATION (CONT.)
City Industries Superfund Site
EPAU.S. Environmental Protection Agency
Office of Solid Waste and Emergency ResponseTechnology Innovation Office
TIO3.WP6\0319-04.stf61
Background (Cont.)
C Site activities are conducted under provisionsof the Comprehensive EnvironmentalResponse, Compensation, and Liability Act of1980 (CERCLA), as amended by theSuperfund Amendments and ReauthorizationAct of 1986 (SARA) §121, and the NationalContingency Plan (NCP), 40 CFR 300.
Groundwater Remedy Selection: The selectedgroundwater remedy for the site is pumping andtreating the contaminated groundwater through airstripping with discharge to surface water, asspecified in the ROD and modified in the ESD.
Site Logistics/Contacts
Site Lead: PRP Treatment System Vendor:
Oversight: EPA
Remedial Project Manager:Pam Scully*U.S. EPA Region IV345 Courtland Street, N.E.Atlanta, GA 30365(404) 562-8898
State Contact:Don HarrisFlorida Department of Environmental ProtectionTwin Towers Office Building2600 Blair Stone RoadTallahassee, FL 32301(904) 488-0190
Jerry PetersPEER Consultants P.C. (Design)12300 Twinbrook Parkway, Suite 410Rockville, MD 20852(301) 816-0700
Stuart Bills*ERM-EnviroClean, Inc. (Construction &Operation/Maintenance)250 Phillips Blvd. #280Ewing, NJ 08618(609) 895-0050
* Indicates primary contacts
MATRIX DESCRIPTION
Matrix Identification
Type of Matrix Processed Through theTreatment System: Groundwater
Contaminant Characterization [1,2,3,10]
Primary Contaminant Groups: Halogenatedand nonhalogenated volatile organic compounds(VOCs).
C The initial 14 contaminants of concern at thesite were acetone, benzene, 1,1-dichloroethane (1,1-DCA), 1,1-dichloroethylene (1,1-DCE), trans-1,2-dichloroethylene (trans-1,2-DCE),
ethylbenzene, methylene chloride, methylethyl ketone (MEK), methyl isobutyl ketone(MIBK), tetrachloroethylene (PCE), toluene,1,1,1-trichloroethane (1,1,1-TCA),trichloroethylene (TCE), and total phthalates. During construction of the treatment systemin 1994, two additional contaminants ofconcern were identified and added to the listin the ESD: cis-1,2-DCE and vinyl chloride.

MATRIX DESCRIPTION (CONT.)
City Industries Superfund Site
EPAU.S. Environmental Protection Agency
Office of Solid Waste and Emergency ResponseTechnology Innovation Office
TIO3.WP6\0319-04.stf62
Contaminant Characterization (Cont.)
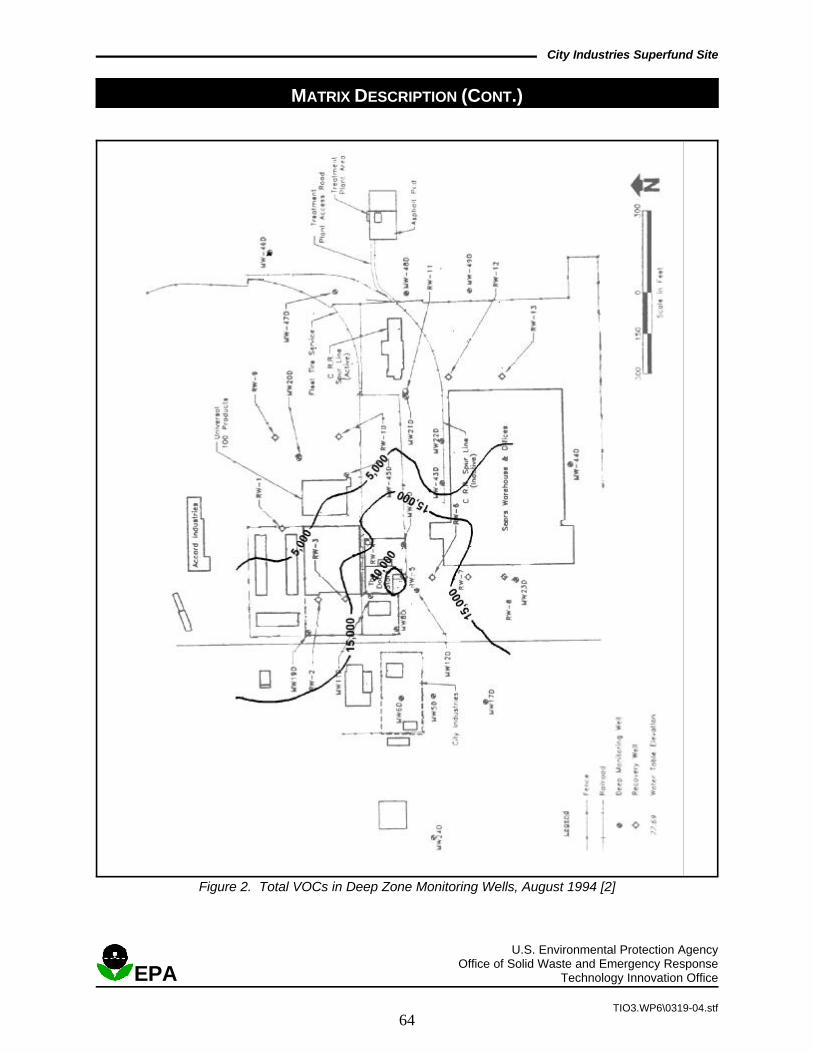
C The maximum concentrations of C Contamination has been detected in thecontaminants detected during a 1988 FS upper aquifer (the Surficial Aquifer). sampling event were acetone (146,000 Figures 1 and 2 illustrate plume distributionµg/L), benzene (100 µg/L), 1,1-DCA (500 in the Surficial Aquifer in August 1994. µg/L), 1,1-DCE (6,000 µg/L), methylene Figure 1 depicts concentration contourschloride (165,000 µg/L), MEK (20,000 µg/L), detected in intermediate zone wells; FigureMIBK (78,000 µg/L), toluene (9,000 µg/L), 2 depicts concentration contours detected inTCE (27,000 µg/L), 1,2-DCE (24,000 µg/L), deep zone wells. Intermediate and deep1,1,1-TCA (430 µg/L), ethylbenzene (2,100 monitoring wells are screened in the top 40µg/L), and PCE (380 µg/L). The maximum feet and lower 20 to 30 feet of the Surficialconcentrations of vinyl chloride and cis-1,2- Aquifer, respectively.DCE detected during 1994 were 2,400 µg/Land 38,000 µg/L, respectively.
C Based on 1986 RI data, site engineersestimated the initial plume coveredapproximately eight acres extending fromthe City Industries site toward the drainagecanal east of the site. Based on an area ofeight acres, a plume thickness ofapproximately 50 feet, and a porosity of 0.3,the initial plume volume was estimated forthis report to be approximately 39 milliongallons.
C Figures 1 and 2 reveal that the majority ofthe contamination is in the top 40 feet of theSurficial Aquifer. The plume in the top 40feet (Figure 1) is more concentrated thanthe plume in the lower 20 to 30 feet (Figure2). The plume has migrated east of CityIndustries, concurrent with groundwater flowdirection.
Matrix Characteristics Affecting Treatment Costs or Performance
Hydrogeology: [4]
Two distinct hydrogeologic units have been identified beneath this site.
Unit 1 Surficial Aquifer Unconfined aquifer of fine to medium-grained quartz sand withlimestone, gravel, chert, and coarse-grained sand.
Unit 2 Floridan Aquifer Interlayered clayey gravel, clayey sand, clay, and limestone.
The hydrogeology at the site consists of two units separated by a 140-foot thick aquitard. Groundwaterflows in an easterly direction across the site through the 60- to 70-foot thick Surficial Aquifer. Thisaquifer is not used as a potable source in the vicinity of the site. Groundwater in the Floridan Aquifer hasnot been characterized because it is not contaminated at the site; however, the City of Winter Park drawsits water from a well supply field in the Floridan Aquifer 1,900 feet west of the site. The Surficial andFloridan Aquifers are not hydraulically connected. Tables 1 and 2 present technical aquifer informationand well data, respectively.
Table 1. Technical Aquifer Information
Unit Name (ft) (ft/day) (ft/day) DirectionThickness Conductivity Average Velocity Flow
Surficial Aquifer 60-70 6.3936 0.064 East
Floridan Aquifer 100 NA NA NANA - indicates not characterizedSource: [4]

MATRIX DESCRIPTION (CONT.)
City Industries Superfund Site
EPAU.S. Environmental Protection Agency
Office of Solid Waste and Emergency ResponseTechnology Innovation Office
TIO3.WP6\0319-04.stf63
Figure 1. Total VOCs in Intermediate Zone Monitoring Wells, August 1994 [2]
MATRIX DESCRIPTION (CONT.)
City Industries Superfund Site
EPAU.S. Environmental Protection Agency
Office of Solid Waste and Emergency ResponseTechnology Innovation Office
TIO3.WP6\0319-04.stf64
Figure 2. Total VOCs in Deep Zone Monitoring Wells, August 1994 [2]

City Industries Superfund Site
EPAU.S. Environmental Protection Agency
Office of Solid Waste and Emergency ResponseTechnology Innovation Office
TIO3.WP6\0319-04.stf65
TREATMENT SYSTEM DESCRIPTION
Primary Treatment Technology Supplemental Treatment Technology
Pump and treat (P&T) with air stripping Equalization/neutralization prior to air stripping
System Description and Operation
Table 2. Extraction Well Data
Well Name Unit Name Depth (ft) Yield (gpm)Design
RW-1 through RW-8 Surficial Aquifer 25-70 10
RW-9 through RW-13 Surficial Aquifer 25-70 5
Source: [2]
System Description [2]C The groundwater extraction system consists
of 13 recovery wells (RW-1 through RW-13)located on five adjacent properties east ofthe original site, as listed in Table 2. Therecovery wells are divided into two groups,which are installed across the width of theinitial contaminant plume. The wellplacement is designed to intercept theplume and to achieve hydraulic containmentof the plume as it flows east. The firstgroup consists of eight recovery wells (RW- C Quantity of groundwater pumped from the1 through RW-8) which are located just aquifer in gallons:downgradient from the site, perpendicular tothe plume centerline, where most of thecontamination has been found. The secondgroup consists of the remaining fiverecovery wells (RW-9 through RW-13). These wells are located furtherdowngradient, perpendicular to thecenterline and are estimated to be at theleading edge of the contaminant plume.
C The treatment system constructed in 1994consists of an equalization/neutralizationtank followed by an air stripping tower. The1,500-gallon equalization tank serves tosettle aggregates and equalize flow to thetower. The air stripper has been designedfor a 97% treatment efficiency.
C Treated water from the air stripper istransported via a gravity pipelineapproximately 2,250 feet east to a county-maintained drainage canal (Crane Strand)where it is discharged in accordance withNPDES permit limits.
C A network of 41 monitoring wells and 13recovery wells is used to measure quarterlychanges in groundwater levels andconcentrations. Twenty additionalmonitoring wells are sampled on an annualbasis. The monitoring wells are screened atvarious depths and some are in a series ofclusters of shallow, intermediate, and/ordeep wells.
System Operation [2,10]
Year Volume Pumped (gal)
5/94-4/95 48,430,000
5/95-4/96 47,750,000
5/96-5/97 51,524,849
6/97 3,990,000
C System operations began on May 19, 1994. As of June 1997, the P&T system has beenoperational approximately 90% of the time.
C A primary operational concern is biologicalgrowth on pumps in the wells, in theequalization tank, and in the air strippingtower. Biological growth degrades systemperformance below design and permitrequirements. In June 1996, the systemwas shut down for 24 hours and the pumpsand treatment system were shocked with ahigh dose of chlorine, which alleviated abiological growth problem.
TREATMENT SYSTEM DESCRIPTION (CONT.)
City Industries Superfund Site
EPAU.S. Environmental Protection Agency
Office of Solid Waste and Emergency ResponseTechnology Innovation Office
TIO3.WP6\0319-04.stf66
System Description and Operation (Cont.)
C The air stripping tower packing continues to pumping from wells located along therequire cleaning approximately every six upgradient edge of the plume andmonths. The air stripping media has been increasing pumping from those at theremoved and washed with a weak acid leading edge of the plume. The followingsolution four times to remove scaling: recommended changes were incorporatedAugust 1994, March 1995, November 1995, in June 1997: increased pumping in threeand April 1996. Discharges (liquid and wells at the leading edge of the plume fromsolid) from the cleaning operations are 5 to 10 gpm and decreased pumping intested and disposed of according to three other wells at the upgradient edgeapplicable regulations. from 10 to 5 gpm.
C The extraction system has pumped an C Quarterly sampling data indicates thataverage of 105 gpm from May 1994 through several recovery wells are showing noJune 1997, which meets the design contamination now. Wells with increasedrequirement for plume containment. rates are drawing in more contaminants, but
C EPA Region 4 completed an optimization stagnant zones are moving.study in December 1996 to maximize plumecapture during pumping. The study C In March 1998, four wells were shut downexamined what pumping rates from all the and the rates in the other wells wereexisting wells were best to maximize zones increased to try to increase recovery. of influence and to minimize stagnation Sampling was reduced to semi-annual. zones. Pumping options were limited in that When results are available the EPA willthe total treatment capacity remained at 115 determine if the plume is still contained or ifgpm; however, the study found that zones wells need to be restarted.of influence would increase by decreasing
data are being analyzed to determine if

TREATMENT SYSTEM DESCRIPTION (CONT.)
City Industries Superfund Site
EPAU.S. Environmental Protection Agency
Office of Solid Waste and Emergency ResponseTechnology Innovation Office
TIO3.WP6\0319-04.stf67
Operating Parameters Affecting Treatment Cost or Performance
The major operating parameter affecting cost or performance for this technology is the extraction rate. Table 3 presents the design value for this and other performance parameters.
Table 3. Performance ParametersParameter Value
Design Pump Rate 115 gpm (actual average = 105 gpm*)
Performance Standards Acetone 88,000 µg/L(Effluent) Benzene 53 µg/L
1,1,-Dichloroethane 1160 µg/L1,1-Dichloroethene 303 µg/Lc-1,2-Dichloroethene 1160 µg/Ltrans-1,2-DichloroetheneEthyl BenzeneMethylene ChlorideMethyl Ethyl KetoneMethyl Isobutyl KetoneTetrachloroethyleneToluene1,1,1-TrichloroethaneTrichloroethyleneVinyl ChlorideXylenes, total
1160 µg/L453 µg/L
1100 µg/L56,400 µg/L42,800 µg/L
84 µg/L175 µg/L530 µg/L
4,500 µg/L525 µg/L260 µg/L
Remedial Goals Acetone 700 µg/L(Florida MCLs) Benzene 1 µg/L
1,1,-Dichloroethane 5 µg/L1,1-Dichloroethene 7 µg/Lc-1,2-Dichloroethene 70 µg/Lt-1,2-Dichloroethene 70 µg/LEthyl Benzene 700 µg/LMethylene Chloride 5 µg/LMethyl Ethyl Ketone 200 µg/LMethyl Isobutyl Ketone 350 µg/LTetrachloroethylene 3 µg/LToluene 2,000 µg/L1,1,1-Trichloroethane 200 µg/LTrichloroethylene 3 µg/LTotal Phthalates 3 µg/LVinyl Chloride 1 µg/L
Source: [1, 2] *The average of 105 gpm was provided in the Interim Long-Term Response Action Report.

TREATMENT SYSTEM DESCRIPTION (CONT.)
City Industries Superfund Site
EPAU.S. Environmental Protection Agency
Office of Solid Waste and Emergency ResponseTechnology Innovation Office
TIO3.WP6\0319-04.stf68
Timeline
Table 4 presents a timeline for this remedial project.
Table 4. Project Timeline
Start Date End Date Activity
3/90 -- ROD issued
1992 -- Final remedial design completed
2/94 -- ESD issued
5/94 --- Construction of the treatment system and extraction wells completed
5/94 ongoing System operation begun
Source: [2]
TREATMENT SYSTEM PERFORMANCE
Cleanup Goals/Standards [1, 2]
Cleanup goals are to remediate groundwater tolevels set by the Florida Primary Drinking WaterStandards (which for this site are the same asMaximum Containment Levels (MCLs) set bythe Federal Primary Drinking Water Standards). These standards are listed in Table 3 and areapplied throughout the aquifer.
Treatment Performance Goals [1, 2]
C The primary performance goal of the P&T C The performance goal of the treatmentsystem is to achieve hydraulic containment system is to reduce effluent contaminantof the plume. concentrations to meet NPDES permit
requirements listed in Table 3.
Performance Data Assessment [2, 5, 6, 9, 10]
For the purposes of this report, total VOCs C Although concentrations have been reducedconsist of acetone, benzene, 1,1-DCA, 1,1-DCE,cis-1,2-DCE, trans-1,2-DCE, ethylbenzenemethylene chloride, MEK, MIBK, PCE, toluene,1,1,1-TCA, TCE, total phthalates, and vinylchloride.
C Figure 3 illustrates the trend of average totalVOC concentrations from May 1994 throughMay 1997. Total concentrations ofcontaminants have been reduced 86%during this period, from 3,121 µg/L to 444µg/L. However, concentrations of all VOCsremain above cleanup goals.
significantly, three of the VOCs showpersistently elevated concentrations: acetone, 1,1-DCE, and MIBK. Nonetheless,maximum levels of acetone have decreased84%, from 146,000 µg/L to 23,000 µg/L. Maximum levels of 1,1-DCE have declined52% from 6,000 µg/L to 2,900 µg/L. Maximum levels of MIBK have declined93% from 78,000 µg/L to 5,000 µg/L.

0
500
1,000
1,500
2,000
2,500
3,000
3,500
Mar-94 Sep-94 Apr-95 Oct-95 May-96 Dec-96 Jun-97
DATE
Co
nce
ntr
atio
n (
ug
/L)
Average Concentrat ion of Tota l VOCs
TREATMENT SYSTEM PERFORMANCE (CONT.)
City Industries Superfund Site
EPAU.S. Environmental Protection Agency
Office of Solid Waste and Emergency ResponseTechnology Innovation Office
TIO3.WP6\0319-04.stf69
Figure 3. Average of Total VOCs in all Monitoring Wells from May 1994 through May 1997 [2,5,6,9]
Performance Data Assessment (continued) [2, 5, 6, 9, 10]
C Figures 4 and 5 illustrate contours of total C Figure 6 illustrates total VOC concentrationsVOCs detected during August 1996 in wells MW-13D, MW-43I, and MW-22I,sampling events in intermediate and deep where contamination is concentrated. monitoring wells, respectively. Compared Concentrations have decreasedto the plume of total VOCs detected in exponentially since operations began. InAugust 1994 (illustrated in Figures 1 and 2), February 1996, an increase was seen in allthe volume of total VOCs in the plume three wells; however, concentrations havedetected in August 1996 has decreased. continued to decrease since 1996.The 55,000 µg/L contour in the intermediatewells has decreased in size from 1994 to C Effluent standards for the treatment system1996. In addition, the level of maximum have been met during system operation.VOCs has decreased in the deep wells from40,000 µg/L in August 1994 to 8,000 µg/L in C From June 1994 through May 1997, theAugust 1996. P&T system removed approximately
C No contaminants have been detected in groundwater. Figure 7 shows mass flux ratedowngradient monitoring wells since the and total contaminant removal from Junebeginning of remedial operations, and the 1994 through May 1997. The mass flux rateplume has been contained. In addition, spiked in April 1996, but the spike ismonitoring done since 1997 has shown that attributed to a high concentration of acetonethe plume has reduced in size. No plume detected during that sampling event.map was available to demonstrate thechange in size.
2,700 pounds of contaminant mass from the

TREATMENT SYSTEM PERFORMANCE (CONT.)
City Industries Superfund Site
EPAU.S. Environmental Protection Agency
Office of Solid Waste and Emergency ResponseTechnology Innovation Office
TIO3.WP6\0319-04.stf70
Figure 4. Total VOCs in Intermediate Zone Monitoring Wells, August 1996 [2]

TREATMENT SYSTEM PERFORMANCE (CONT.)
City Industries Superfund Site
EPAU.S. Environmental Protection Agency
Office of Solid Waste and Emergency ResponseTechnology Innovation Office
TIO3.WP6\0319-04.stf71
Figure 5. Total VOCs in Deep Zone Monitoring Wells, August 1996 [2]

0.00
1.00
2.00
3.00
4.00
5.00
6.00
May-94 Nov-94 May-95 Nov-95 May-96 Nov-96 May-97
Date
Mas
s F
lux
(lb
s/d
ay)
0
500
1,000
1,500
2,000
2,500
3,000
Cu
mu
lati
ve M
ass
Rem
ove
d (
lbs)
Mass Flux (lbs /day) C u m . Mas s R e m . (lbs )
Date
100
10,000
1,000,000
Mar-94 Sep-94 Apr-95 Oct-95 May-96 Dec-96 Jun-97
Co
nce
ntr
atio
n (
ug
/L)
MW - 43I MW - 22I MW - 13D
TREATMENT SYSTEM PERFORMANCE (CONT.)
City Industries Superfund Site
EPAU.S. Environmental Protection Agency
Office of Solid Waste and Emergency ResponseTechnology Innovation Office
TIO3.WP6\0319-04.stf72
Figure 7. Mass Flux and Cumulative Mass Removal, June 1994 through May 1997 [2,6,9]
Figure 6. Total VOCs Concentrations in Highly Contaminated Wells, May 1994 through May 1997[2,5,6,9]

TREATMENT SYSTEM PERFORMANCE (CONT.)
City Industries Superfund Site
EPAU.S. Environmental Protection Agency
Office of Solid Waste and Emergency ResponseTechnology Innovation Office
TIO3.WP6\0319-04.stf73
Performance Data Completeness
C Monthly data for contaminant C For Figure 3 analyses, the averageconcentrations in monitoring and recovery concentration of total VOCs was calculatedwells are available for June 1994 through using a geometric mean of contaminantMay 1996 in the Interim Long-Term concentrations in wells within the initialRemedial Action Report. Quarterly data for contaminant plume. A geometric mean wascontaminant concentrations in monitoring used to show the trend of contaminantand recovery wells are available in monthly levels across the site. Where contaminantreports from the site operators for levels were below detection limits, half ofSeptember 1996 through September 1997. the detection limit was used.At the time of preparation of this report, thesite contact (the EPA RPM) had not C Monthly data regarding contaminantreceived reports past May 1997. For the removal through the treatment system areanalyses in this report, including the available for June 1994 through May 1997average concentrations of total VOCs in the Monthly Operations and Maintenanceshown in Figures 3 and 6, quarterly data Reports. For the mass removal analyses inwere used from June 1994 through May Figure 7 of this report, quarterly data were1996 and annual data were used from May used from June 1994 through May 1997.1996 through May 1997.
Performance Data Quality
The QA/QC program used throughout the remedial action met the EPA and the State of Floridarequirements. All monitoring was performed using EPA-approved methods, and the site contact did notnote any exceptions to the QA/QC protocols.
TREATMENT SYSTEM COST
Procurement Process
EPA contracted with Peer Consultants, P.C. to design the groundwater extraction and treatment system. EPA awarded the construction, startup and O&M (2-year base period) contract to ERM-EnviroClean, Inc. FDEP was the lead agency until 1989, at which time EPA took over the lead and maintainedresponsibility for operation and maintenance of the treatment system.
Cost Analysis
All costs incurred for remedial activities at this site were borne by Potentially Responsible Parties(PRPs).

TREATMENT SYSTEM COST (CONT.)
City Industries Superfund Site
EPAU.S. Environmental Protection Agency
Office of Solid Waste and Emergency ResponseTechnology Innovation Office
TIO3.WP6\0319-04.stf74
Capital Costs [4] Operating and Maintenance Costs [4,5]Remedial Construction 5/94 - 4/95 $186,250
Mobilization and Preparatory $174,700 5/95-4/96 $186,250Work
Site Work $68,100
Well Installation, Instrumentation, $559,140and Piping
Install Well Manholes $13,700
Air Stripper $202,060
Effluent Pipeline $27,100
Demobilization $50,000
Total Construction $1,094,800
5/96-5/97 $133,295
Total O&M $505,795
Other Costs [4]Remedial Design
Remedial Design $190,234
Preparatory Work $90,494
Tank Removal $74,377
Field Data Development $147,922
Treatability Studies $38,979
Closeout $5,619
Remedial Oversight $34,913
Total Design $582,538
EPA Personnel $99,675
Cost Data Quality
Capital and operations and maintenance cost data were supplied in a 1994 Cost Study of the site,originated from the treatment vendor, and were updated by the RPM.
OBSERVATIONS AND LESSONS LEARNED
C Approximate costs for the P&T system at pure phase, or nonaqueous phase liquidthis site were $1,674,800, consisting of (NAPL), has been detected at the site [5].$1,094,800 in capital costs and $580,000 incumulative operating and maintenance C Given the matrix of contaminants at thiscosts through May 1997, which corresponds site, there is potential for cometabolicto $590 per pound of contaminants removed degradation. Cometabolic degradation of and $10.60 per 1,000 gallons of TCE, DCE, and vinyl chloride is supportedgroundwater treated. in the presence of aromatic compounds,
C Total concentrations of VOCs have declined86% at this site, but remain above cleanup C Based on conversations with the RPM forgoals. the site, contaminant levels in late 1997 and
C The mass flux rate illustrated in Figure 6 is 1997 monitoring data.more constant over time than at many P&Tsites. The hydrogeology at the site isrelatively simple and hydraulic conductivityis relatively high compared to typicalhydraulic conductivities [7]. In addition, no
such as toluene [8].
1998 at the site are lower than the May

OBSERVATIONS AND LESSONS LEARNED (CONT.)
City Industries Superfund Site
EPAU.S. Environmental Protection Agency
Office of Solid Waste and Emergency ResponseTechnology Innovation Office
TIO3.WP6\0319-04.stf75
C The site contractor did not anticipate C The RPM also indicated that the P&Tbiofouling in the air stripper in the design. system has lowered contaminantAccording to the contractor, design concentrations in extracted water to levelsspecifications assumed a different below effluent NPDES requirements. Thus,temperature and alkalinity for the in the near future, the extracted water maygroundwater from actual conditions. be discharged directly to the POTW andChlorine treatment was found to alleviate treatment will not be necessary.biofouling and the system has beenoperational 90% of the time.
REFERENCES
1. Record of Decision, City Industries 6. Monthly Operation and MaintenanceSuperfund Site, U.S. EPA Region 4, March Reports, June 1996 - May 1997. ERM-9, 1990. EnviroClean, Inc.
2. Interim Long-Term Response Action Report, 7. Groundwater Regions of the United States. City Industries Superfund Site, U.S. EPA Heath, Ralph. U.S. Geological SurveyRegion 4, Undated. Water Supply Paper 2242, 1984.
3. Explanation of Significant Differences, U.S. 8. Biofilm Reactor for Chlorinated GasEPA Region 4, February 1994. Treatment, Remediation Technologies, Inc.
4. Cost and Performance Profile, City complete/remediat.htm, May 21, 1998.Industries Superfund Site, U.S. EPAHazardous Site Control Division Remedial 9. Twelfth Quarterly Groundwater SamplingOperations and Guidance Branch, Results; City Industries Superfundunpublished. Remediation Project, ERM EnviroClean,
5. Correspondence with Pam Scully, EPARPM. April, May, and December 1997, 10. Comments on draft report provided by PamFebruary, March, and April 1998. Scully, Region 4 Remedial Project Manager,
Internet publication, http://clu-in.com/site/
Inc., September 19, 1997.
July 1998.
Analysis Preparation
This case study was prepared for the U.S. Environmental Protection Agency's Office of Solid Waste andEmergency Response, Technology Innovation Office. Assistance was provided by Tetra Tech EM Inc.and Eastern Research Group, Inc. under EPA Contract No. 68-W4-0004.

76
This Page Intentionally Left Blank