c ountry report - cpmaicpmaindia.com/pdf/apic_countrypaper2011_korea.pdf · c ountry report from ko...
TRANSCRIPT

C o u n try R e p o rt
F ro m
K O R EA
Korea Petrochemical Industry Association(KPIA)
Asia Petrochemical Industry Conference 2011
May 26~27, 2011
Japan

CONTENTS
. Country ReportⅠ ··································································3
; The Petrochemical Industry In Korea
II. For Committee Meeting ··············································19
1. General Matters & Raw Materials Committee ··············19
2. Polyolefins Committee ······························································28
3. Styrenics Committee ··································································33
4. PVC Committee ············································································37
5. Synthetic Rubber Committee ················································40
6. Synthetic Fiber Raw Materials Committee ······················43
7. Chemicals Committee ·······························································49

. Country Report

2011 Asia Petrochemical Industry Conference - Korea
The Petrochemical Industry in Korea
1. The Korean Economy: Present Status and Outlook
Korea's economy is expected to grow 4% in 2011 just as the world
economy. Though the manufacturing sector will lead economic growth thanks
to an increase in export and equipment investment, the domestic demand will
remain weak. Especially, private consumption will grow slowly due to low
buying power resulted from price rising.
While aggravated trade conditions limit consumption recovery, investment
in construction will be weak as the construction industry undergoes
restructuring. This year's consumer price rise will slow down after the 2nd
quarter as raw material prices are stabilized, and will remain at the latter half
of 3%.
<Table 1> The forecast of Korean domestic economy
(Unit : %/yr)
2010
2011
1Q 2Q 3Q 4Q Y
S1) H2) S H S H S H S H
GDP(%) 6.2 4.1 3.1 3.4 3.5 4.2 4.0 5.3 5.8 4.3 4.1Private
Consumption(%) 4.1 3.6 2.9 3.7 3.0 3.5 3.1 4.2 4.8 3.7 3.5
ConstructionInvestment(%) -1.4 -6.9 0.3 -0.7 3.1 2.3 0.1 3.4 0.0 -0.1 0.9
EquipmentInvestment(%) 25.0 13.0 4.5 6.1 1.5 4.2 2.8 10.2 7.0 8.2 3.9
Note : 1) SERI (Samsung Economy Research Institute), Forecast for 2011 World
Economy and Korea's Economy (April 2011)
2) HANAIF (Hana Institute of Finance), Forecast for 2011 Finance and
Economy(November 2010)

Country Report
2. Petrochemical Industry Overviews
[2010 Situations]
Despite of no new line addition and decrease in export to China,
production of 2010 (based on three major areas) grew 1.0% to mark
21,201,000 tons compared to the previous year thanks to improvement in the
operating rate driven by domestic demand recovery.
The domestic market grew 6.0% to mark 10,232,000 tons compared to
the previous year thanks to recovery of frontline industries such as automobile,
home appliance and chemical fiber, and the export market fell 2.4% to
11,822,000 tons compared to the previous year due to insufficient export
capacity as resources were channeled to meet the growing domestic demand.
<Figure 1> The trend of Growth rate of Domestic demand for Petrochemicals
The domestic demand, especially for synthetic resin and materials, has
stalled or fallen since 2002. The demand for synthetic resin was weakened as
2011 Asia Petrochemical Industry Conference - Korea
the home appliance industry became streamlined and transferred facilities to
other countries, and the demand for synthetic materials was reduced as
Korea's chemical fiber facilities were moved to other countries and
uncompetitive facilities were scrapped.
A big rise in 2009 compared to 2008 should be understood as a base
effect but could not be seen as an expansion of the domestic market.
Continuous growth in 2010 resulted from the global competitiveness
improvement of frontline industries such as automobile and home appliance.
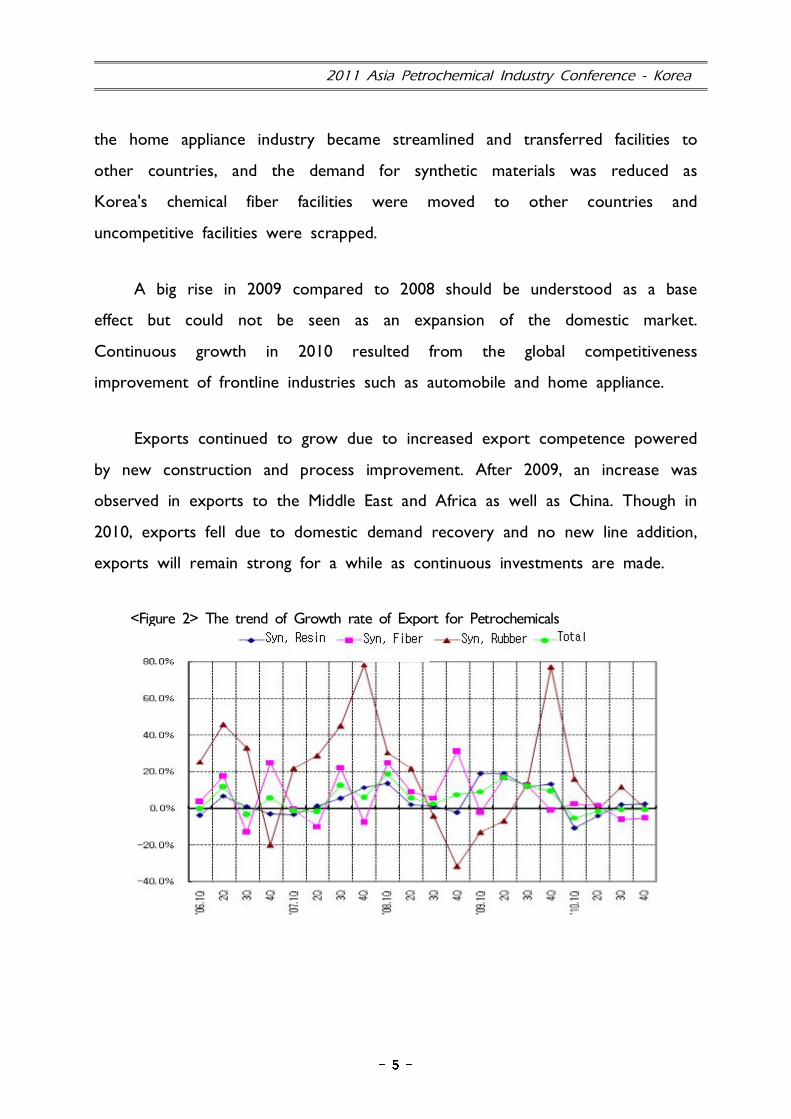
Exports continued to grow due to increased export competence powered
by new construction and process improvement. After 2009, an increase was
observed in exports to the Middle East and Africa as well as China. Though in
2010, exports fell due to domestic demand recovery and no new line addition,
exports will remain strong for a while as continuous investments are made.
<Figure 2> The trend of Growth rate of Export for Petrochemicals

Country Report
[2011 Forecast]
Though large-scale investment is not planned for 2011, debottlenecking and
improved operation in some lines will enable production to grow 1.4% to mark
21,507,000 tons. As the frontline industry slows down, the domestic demand will
grow 2.9% to mark 10,525,000 tons and exports will rise 0.2%.
<Table 2> Supply and Demand for Major Petrochemicals
(Unit : 1,000MT, %/yr)
20092010
2011(P)1H 2H Y
G·R G·R G·R G·R G·R
Synth.
Resin
Prod. (-0.5) (1.1)
Exp. (2.1) (-3.7) (0.1)
Imp. (8.8) (40.7) (4.2)
Dem. (2.5) (5.6) (2.6)
Synth.
Fiber
Prod. (-0.8) (2.6) (0.8)
Exp. (-2.8) (-1.3) (-2.0)
Imp. (16.5) (1.9) (1.2)
Dem. (3.0) (6.2) (3.3)
Synth.
Rubber
Prod. (4.4) (5.8) (12.9)
Exp. (4.4) (5.3) (18.3)
Imp. (2.9) (14.5) (-4.2)
Dem. (4.6) (8.2) (1.8)
Total
Prod. (1.1) (1.0) (1.4)
Exp. (0.4) (-2.4) (0.2)
Imp. (13.5) (9.7) (1.3)
Dem. (2.9) (6.0) (2.9)
2011 Asia Petrochemical Industry Conference - Korea
(1) Supply and demand by sector
Synthetic Resins
[2010 Situations]
Production fell 0.5% to mark 11,738,000 tons as there was no new line addition
and low operation rate in some products (HDPE). The domestic demand grew 5.6%
to mark 4,970,000 tons thanks to a boost in the frontline industry.
Based on accumulated data from January to October, the demand for
LDPE/HDPE for wire sheathes, PS/ABS for home appliances, and PP for impact,
random and compound grew significantly. Also, LDPE replaced LLDPE on the market
actively.
Exports fell 3.7% compared to the previous year due to insufficient export
capacity as resources were channeled to meet the growing domestic demand. Though
exports to China plunged, exports to India, Vietnam, Japan, Russia and Turkey
increased.
[2011 Forecast]
Production in 2011 will grow only 1.1% to mark 11,865,000 tons due to an
increase in regular maintenance though new lines are added for some products
(LDPE). The domestic demand in 2011 will grow 2.6% to mark 5,097,000 tons as
frontline industries grow slowly.
Thanks to efforts to diversify overseas markets, exports will grow 0.1%
compared to 2010.

Country Report
<Table 3> The trend of Supply and Demand for Synthetic Resins1)
(Unit : 1,000MT, %/yr)
20092010
2011(P)1H 2H Y
G·R G·R G·R G·R G·R
LDPE
Prod.Exp.
Imp.Dem.
HDPE
Prod.Exp.
Imp.
Dem.
PP
Prod.
Exp.Imp.
Dem.
PVC
Prod.Exp.
Imp.Dem.
P S
Prod.Exp.
Imp.
Dem.
PS
Prod.
Exp.Imp.
Dem.
EPS
Prod.Exp.
Imp.Dem.
ABS
Prod.Exp.
Imp.
Dem.
Total
Prod.
Exp.Imp.
Dem.
(NOTE) 1) Based on PE, PP, PS, ABS, PVC

2011 Asia Petrochemical Industry Conference - Korea
Synthectic Fiber Raw Materials
[2010 Situations]
Production in 2010 grew 2.6% to mark 8,586,000 tons thanks to a rise in
frontline industry's demand though there was no investment.
The domestic demand in 2010 grew 6.2% to mark 4,864,000 tons thanks to a
rise in demand for polyester and nylon(8.6% increase, 1,463,000 tons).
Exports in 2010 fell 1.3% to mark 4,312,000 due to insufficient export capacity
as resources were channeled to meet the growing domestic demand. Though exports
to China went down, exports to India, Thailand, Japan, Taiwan, Russia and Brazil
soared significantly.
[2011 Forecast]
In spite of new line addition (TPA), production in 2011 will grow only 0.8% to
mark 8,652,000 tons compared to 2010 as new lines will be completed in the fourth
quarter.
Thanks to line addition (Daehan Synthetic Fiber, Hyosung, Kum Kang), the
domestic demand will grow 3.3% to mark 5,023,000 tons compared to 2010.
In spite of efforts to diversify global markets, exports in 2011 will drop 2.0%
compared to 2010 due to insufficient export capacity.

Country Report
<Table 4> The trend of Supply and Demand for Synthetic Fiber Raw Materials1)
(Unit : 1,000MT, %/yr)
20092010
2011(P)1H 2H Y
G.R G.R G.R G.R G.R
TPA
Prod.
Exp.
Imp.
Dem.
DMT
Prod.
Exp.
Imp.
Dem.
EG
Prod.
Exp.
Imp.
Dem.
AN
Prod.
Exp.
Imp.
Dem.
CPLM
Prod.
Exp.
Imp.
Dem.
Total
Prod.
Exp.
Imp.
Dem.
(NOTE) 1) Based on AN, CPLM, DMT, EG, TPA

2011 Asia Petrochemical Industry Conference - Korea
Synthectic Rubbers
[2010 Situation]
Production in 2010 grew 5.8% to mark 877,000 tons thanks to increased
production capacity powered by continuous line addition.
The domestic demand grew 8.2% to mark 398,000 tons thanks to a boom in
the tire industry supported by the automobile industry's growth (tire production grew
26.3% to mark 95,322,000 tires), and exports grew 5.3% to mark 552,000 tons.
[2011 Forecast]
Production in 2011 will grow 12.9% thanks to increased production capacity
powered by continuous line addition compared to 2010.
The domestic demand in 2011 will grow 1.8% thanks to frontline industry
growth and higher demand for local exports, and exports will grow 18.3% thanks to
increased export capacity.
<Table 5> The trend of Supply and Demand for Synthetic Rubbers1)
(Unit : 1,000MT, %/yr)
20092010
2011(P)1H 2H Y
G.R G.R G.R G.R G.R
SBR
Prod.
Exp.
Imp.Dem.
BR
Prod.Exp.
Imp.Dem.
Total
Prod.
Exp.Imp.
Dem.
(NOTE) 1) Based on SBR, BR

Country Report
Basic Petrochemicals Ethylene
[2010 Situation]
Production in 2010 fell 0.2% to mark 7,362,000 tons due to regular maintenance
of a number of facilities and accidents in some facilities. The domestic demand grew
only 1.8% to mark 7,003,000 tons due to a decrease in PE and EG.
[2011 Forecast]
Production in 2011 will grow 2.7% to mark 7,560,000 tons thanks to new line
addition and reoperation, and the domestic demand will drop 0.1% to mark 6,995,000
tons due to no new line addition.
<Table 6> The trend of Supply and Demand for Basic Petrochemicals(Ethylene)
(Unit : 1,000MT, %/yr)
20092010
2011(P)1H 2H Y
G.R G.R G.R G.R G.R
Ethylene
Prod. (3.9)
Exp.
Imp.
Dem.

2011 Asia Petrochemical Industry Conference - Korea
<Table 7> Turnaround Schedule of NCC
(Unit : 1,000MT, %/yr)
Capacity Regular Maintenance Line Addition
K o r e a
P e t r o ch em i c a l
Ind. Co., Ltd.
470 April N/A
Samsung Total
Petrochemica ls
Co., Ltd.
900 April 26 ~ Early June (+)120,000 tons
YEOCHUN NCC
Co., Ltd.#1, 857 #1, April 5 ~ May 4 N/A
LG Chem, Ltd.Daesan,
760Daesan, March 17 ~ April 20 (+)100,000 tons
Honam Petrochemical
Corp.
Daesan,
1,000April N/A
Yeosu, 750 October N/A
SK Global
Chemical Co., Ltd.760 N/A N/A
(4) Environment/Health & Safty
As the environmental regulations are getting stricter around the world, Korea's
petrochemical industry is making proactive efforts to meet such global requirements.
As well as enhanced activities related to climate change and environmental safety,
increased efforts of interested parties and compliance with relevant regulations,
Korea's petrochemical companies are taking proactive measures such as responsible
care programs.
Regarding the Climatic Change Convention, the Korean government enforced
Basic Act for Low Carbon Green Growth to provide various policies. Thus, Korea's
petrochemical industry centralized its efforts with its association, requesting proper
climate change policies to create the environment for spontaneous green management
and improving its capability to respond to climate change.
For environment conservation, pertrochemical plants are monitoring contaminants
at major outlets in real time, and making efforts to reduce discharged chemicals by

Country Report
signing the chemical reduction agreement with the Ministry of Environment in 2004.
Also, since May 2008, they have begun to release information on discharged
hazardous chemicals to locals and interested parties for a better understanding.
To improve the petrochemical industry's image and regain trust, the responsible
care program is in place to protect environments and people's health over all
production processes and enhance environment/safety/health levels continuously.
Raising awareness of environment, safety and health as well, the responsible care
program started in 2003 to help children to understand the petrochemical industry.
Also, the chemistry frontier festival is held for high school students to motivate them,
and various seminars are held to share information.
3. Major Outstanding Issues
(1) Advancement of the Petrochemical Industry and Enhancement of
Competitiveness
Due to new players rising from Middle East, high oil prices and stricter
regulations on greenhouse gases, the growth fundamental is weakening fast. Thus,
major companies are increasing the gap with their advanced technology and new
players are trying to close the gap with large investments.
Especially, severe environmental regulations have a great impact on the
petrochemical industry as it consumes energy and emits greenhouse gases significantly.
To secure fundamental competitiveness and reduce greenhous gas emissions, the
pertrochemial complex is being converted into green facilities. This will contribute to
better energy efficiency of the petrochemical industry and national energy savings,
resulting in enhanced competitiveness.
2011 Asia Petrochemical Industry Conference - Korea
(2) Increased Attention to the Future Growth Business
To cope with structural oversupply and maintain sustainable growth momentum,
the pertrochemical industry has felt the needs for future growth businesses.
Thus, for a brighter future of the petrochemical industry, Korea's pertrochemical
companies endeavor to develop polysilicon, monosilane, flims, solar energy materials
and secondary batteries as well as add new lines.
(3) Climate Change Convention
The international community is discussing how to control greenhouse gas
emissions when the Kyoto Protocol expires in 2012. Korea will be obliged to reduce
greenhouse gas emissions from the 2nd commitment period 2013.
Thus, the Korean government enforced Basic Act for Low Carbon Green
Growth to prepare for greenhouse gas reduction obligation. In November 2009, the
national greenhouse gas reduction target was set to be 30% against BAU by 2020.
And detailed greenhouse reduction targets will be decided for each business sector.
Therefore, to enable Korea's petrochemical industry to remain as Korea's core
industry in the future while maintaining its current scale, there should be the
greenhouse gas policy based on the industry's international competitiveness. Korea's
petrochemical industry is preparing the plan to comply with greenhouse reduction
regulations by combining their resources through its association.

Country Report
<Table 8> New Construction and expansion
Company ProductProduction
CapacityNew Line Location
Operation Start
Period
Kumho PolychemCo., Ltd.
EPDM 95 60 Yeosu Q4, 2013.
Tong SuhPe t ro ch em i c a lCorp., Ltd.
AN 300 245 Ulsan #4 Q4, 2012
S a m s u n gPe t ro ch em i c a lCo., Ltd.
TPA 1,800 200 Ulsan Sep. 2011
Samsung TotalPetrochemical sCo., Ltd.
Ethylene 850 120
Daesan
Nov. 2011Propylene 680 100
Butadiene 105 15
Benzene 680 120Sep. 2012
PX 600 100
YEOCHUN NCCCo., Ltd. Ethylene 1,910 300 Yeosu 2012
H a n w h aC h e m i c a lCorporation
EVA 86 40 Ulsan Dec. 2012
H o n a mPe t ro ch em i c a lCorp.
Ethylene 750 250
Yeosu 2012HDPE 380 250
PP 400 200
Ebonic Carbon BlackKorea
C a r b o n
Black230 40 Yeosu 2nd Half, 2012
HC PetrochemBenzene 120 115
Daesan Sep. 2013PX 380 800

2011 Asia Petrochemical Industry Conference - Korea
<Table 9> Major Development Related to Petrochemical Industry Restructuring
Merger
- Tonsg Suh Petchem. transferred its all the stake, 100% to Asahi Kasei ’98. 5
- Hyosung T&C, Hyosung Corporation, Hyosung LivingIndustry and Hyosung Industries consolidated into HyosungCorporation
’98.11
- Korea BASF Urethane, Korea BASF Styrenic, BASF Koreaconsolidated into BASF Korea
’99.1
- Kohap, Kohap Chemical, Kohap Petrochemical consolidatedinto Kohap
’99.3
- Korea Steel Petrochemical transferred to Oriental chemicalindustry
’00. 3
- Kumho Chemical transferred to Kumho Petrochemical ’01. 1
- SK Evertec transferred to SKC ’01.11
- Samsung General Chemicals transferred the stake, 50% to
Atofina’03.8
- KP Chemical transferred to Honam Petrochemical ’04.11
- LG Daesan Petrochemical transferred to LG chemicals ’06. 1
- CCC transferred to DCC ’06. 3
- Kolon Chemical transferred to Kolon ’07. 6
- LG Petrochemical transferred to LG Chemical ’07.11
- Honam Petrochemical bought Titan Chemicals of Malaysia. '10
- LG Chemical bought LG Polycarbonate. '11.4
Business
Integration
- Daelim Industrial and Hanwha Chemical established YeochunNCC
’99.10
- Daelim Industrial : PP, HDPE- Hanwha Chemical : LDPE, LLDPE
’99.10
- SK Chemical and Samyang established Hubis runningpolyester businsess
’00.10
- LG Chemical divided into 3 companies, LGCI, LG chemical,LG House hold and Health care
’00.12
- Kohap divided into KP chemical(TPA, PET Chip, PA) andKohap(Chemical fiber)
’01.12
- Kolon established Kolon Plastic integrating Its plasticdepartment and KTP
’08.6
- LG Chemical diveded into 2 companies, LG chemical, LGHausys
’09.4
- Hyundai Oil Bank founded HC Petrochem to produce and sell BTX(Hyundai Oil Bank: Cosmo Oil = 50:50)
'09.11
- SK Total Chemical was separated from SK Innovation. '11

Country Report
Business
transfer
- Dainong Petrochemical Industry transferred the stake toYongsan Chemicals
’97. 5
- Hanyang Chemical transferred the stake, 50% to BASF- Change the name to Hanwha BASF Urethane
’97.12
- Hyosung transferred the stake, 50% to BASF- Change the name to Hyosung BASF Styrenenics
’98. 3
- Hanwha Chemical transferred H2O2 to Kemira(Finland) ’98. 7
- Hanwha Chemical transferred PMMA to ElfAtochem(France)
’98.10
- LG Chemical transferred Carbon black toDegussa(German)
’98.11
- Dongsung Chemical transferred Polyol to BASF(German) ’98.12
- Hyosung transferred Polyacetal Rodia(France) ’99.1
- Kumho Chemical transferred Carbon black to CICC ’99.2
- Daelim and Phillips(USA) established Joint venture,K-Resin Copolymer
’00.2
- Daelim and Montell established Joint venture, Polymirae ’00.9
- Hyundai Petrochemical transferred PVC to LG Chemical ’00.11
- Samsung General Chemicals transferred TPA to SamsungPetrochemical
’00.12
- SK Evertec transferred SM #2 to BASF Korea ’01.7
- Korea PTG transferred the stake 54.8% to Yongsan
Chemicals’02.12
- Hyundai Petrochemical transferred its all the stake to the
consortium of Honam Petrochemical and LG Chemicals’03.6
- Inchon Oilbank transferred to SK ’05.12
- SK Chemical transferred Petrochemical Business to SKPetrochemical
’05.12
- OCI transferred PA/DOP to Hanwha Chemical ’08.6
- Korea Basf transferred SM to SK Energy ’08.8
- Kolon transferred SAP to LG Chemicals ’08.9
. For Committee Meeting
1. General Matters & Raw Materials
Committee

General Matters & Raw Materials Committee
General Matters & Raw Materials Committee
1. Olefins (Ethylene, Propylene, Butadiene)
ITEM : Ethylene
1) The 2010 Results
The domestic ethylene production was decreased by 0.2% compare to previous
year to be 7,396 thousand tons. Total ethylene demand was increased by 0.2%
compare to previous year to be 7,557 thousand tons. The export was decreased by
16% compare to previous year to be 554 thousand tons due to new expansion in
China.
2) The 2011 Forecast
In 2011, total ethylene demand is expected to grow up about 2-3% to be 7,760
thousand tons due to increase export in India and Southeast Asia.
The domestic ethylene production will increase about 2.2% to be 7,560 thousand tons
caused by small amount of expansion from LG Chem.
ITEM : Propylene
1) The 2010 Results
The balance of supply/demand was tight because the domestic propylene market
showed a good condition due to strong demand of downstream products. Korean
total supply of propylene was grown by 2.2% compare to previous year to be 5,982
thousand tons and total demand of propylene was grown by 1.9% compare to
previous year to be 5,948 thousand tons.

2011 Asia Petrochemical Industry Conference - Korea
2) The 2011 Forecast
It is expected that supply of propylene will be short due to the Japan
earthquake and annual turnaround of Taiwan in 1H of 2011. As Korean maker’s
annual turnaround will be converged on March and April, so supply/demand balance
will be tight temporarily. However Hyundai Oil bank RFCC(150~300thousand tons)
will be newly started up in the middle of May then tight balance will be soften
somewhat.
ITEM : Butadiene
1) The 2010 Results
With recovery of Automobile market, downstream demand was steadily
increased.
The domestic production was grown by 4.6% compare to previous year to be 1,144
thousand tons due to increase synthetic rubber’s alternative demand effect, which is
caused by rising price of natural rubber.
Total demand was grown by 4.9% compare to previous year to be 1,456 thousand
tons due to strong demand of domestic market.
2) The 2011 Forecast
There is no large scale of new capacity expansion and butadiene demand will be
increased by highly using BR and ABS due to the continued growing demand in the
home electronics and tire.
Honam petrochemical increased additional Butadiene 150 thousand tons at the end of
last year and KPC(BR 120 thousand tons) will be started up in 2011.

General Matters & Raw Materials Committee
(Unit : 1,000MT)
2009 20102011
(Prospect)
Ethylene
Supply
Production 7,380 7,396 7,560
Import 160 196 200
Total 7,540 7,592 7,760
Demand
Domestic 6,882 7,003 6,995
Export 659 554 765
Total 7540 7,557 7,760
Year-end Capacity 7,440 7,610 7,770
Propylene
SupplyProduction 5,642 5,702 5,690Import 249 280 250Total 5,891 5,982 6,040
DemandDomestic 4,003 5,389 5,308Export 665 559 655Total 4,668 5,948 5,963
Year-end Capacity 5,641 5,726 5,801
Butadiene
SupplyProduction 869 1,144 1,180Import 291 318 383Total 1,160 1,462 1,563
DemandDomestic 1,160 1,224 1,318Export 228 232 262Total 1,388 1,456 1,580
Year-end Capacity 1,107 1,107 1,257

2011 Asia Petrochemical Industry Conference - Korea
2. Aromatics(Benzene, Toluene, Xylene)
ITEM : Benzene
(Unit : 1,000MT)
2009 2010 2011 (Prospect)
Production 4,175 4,388 4,400
Demand 3,132 3,248 3,380
Balance +1,043 +1,140 +1,020
1) The 2010 Results
In 2010 Production in Korea was 4,388 thousand tons, which is 5% increase
from 2009. The Domestic Demand was 3,248 thousand tons, which is slightly
increased from 2009.
Export volume to US in 2010 was approximately 537 thousand tons, which
contributed towards healthier benzene Supply/Demand Balance in Asia.
2) The 2011 Forecast
Korean production in 2011 is forecasted to be 4,400 thousand tons, which is
very similar to 2010 production even though new addition of huge paraxylene
capacity, which carry large scale co-product benzene suppply. It is mainly caused by
heavy scheduled maintenance of naptha crackers and aromatics plants.
Demand in 2011 is expected to increase due to the demand of derivatives such
as SM, Phenol, however Korea will continue to have a large surplus and will remain a
major net exporter.
Based on the supply/demand forecast of 2011, it is anticipated that benzene price may
pass by the peak during the early 3rd Quarter and shall be weak through the 4th Quarter.

General Matters & Raw Materials Committee
ITEM : Toluene
(Unit : 1,000MT)
2009 2010 2011 (Prospect)
Supply
Production 2,022 2,058 2,090
Import 209 272 330
Total 2,231 2,330 2,420
Demand
Domestic 1,328 1,492 1,620
Export 903 837 800
Total 2,231 2,329 2,420
1) The 2010 Results
In 2010 Production in Korea was 2,058 thousand tons, which is similar to 2009.
The Domestic Demand was 1,492 thousand tons, which is 10% increase from 2009.
Export volume in 2010 was approximately 837 thousand tons with a 7%
decrease from previous year (903 thousand tons in 2009). Import in 2010 was 272
thousand tons with a 30% increase from previous year (209 thousand tons in 2009).
2) The 2011 Forecast
Korean production in 2011 will be pretty similar compared to last year so that
there would not be any expansion plan.
Toluene Supply/Demand balance of Korea was forecasted as pretty long balace
due to China's mixed aromitics import and GS Caltex's MTPX Turn-around. But from
Japan's earthquake Toluene Market is very tight because of gasoline demand of Japan
and healthy demand of TDP. Furthermore as US toluene Price has been very strong,
the arbitrage is opened from Asia to US.
In spite of GSC's MTPX turn-around toluene balance might be healthy till 3rd
Quarter.

2011 Asia Petrochemical Industry Conference - Korea
ITEM : Mixed Xylene
(Unit : 1,000MT)
2009 2010 2011 (Prospect)
Production 5,636 5,898 6,228
Demand 5,608 6,094 6,458
Balance 28 -196 -230
(NOTE) Sourced by CMAI
1) The 2010 Results
In 2010 Production in Korea was around 5,898 thousand tons with 4.5% annual
growth rate from previous year (5,636 thousand tons in 2009). The Domestic
Demand was 6,094 thousand tons, which is 9% increase from 2009 due to PX
demand.
Export volume in 2010 was approximately 12% decrease compared to 2009, on
the other hand, Import volume in 2010 was approximately 10% increase compared to
2009.
2) The 2011 Forecast
Korean production in 2011 will be sharply increase compare to last year and
Domestic Demand will be increased about 5% as well.
Based on the supply/demand forecast of 2011, MX price will maintain a fairly
stable level throughout the year, however due to the Japan earthquake in March, the
recent price is thought to be its peak around and with the addition of PX Capacity,
MX-PX Spread in 2nd Half is expected to shrink compared to 1st Quarter"

General Matters & Raw Materials Committee
ITEM : Para Xylene
(Unit : 1,000MT)
2009 2010 2011 (Prospect)
Production 4,240 4,509 4,800
Demand 4,217 4,332 4,450
Balance 23 177 350
1) The 2010 Results
"In 2010 Production in Korea was 4,019 thousand tons, which is 5% decrease
from 2009. Whereas, China's PX consumption grew at 14.3% in 2010. (Global
consumption growth for 2010 is 10.4%)
In 2010 1st Half, PX Price was downward trend because of the increased
Supply by new PX plants in China. Whereas, there were PX plant troubles in China
and Middle East and the cotton crops were in bad condition through 4th Quarter.
For this reason, 2nd Half PX Price turned bullish.
2) The 2011 Forecast
"In 1st Quarter, Increased PTA Operation due to the recovery of Asia
Economy led to increase demand for PX and due to the Japan earthquake, PX Price
of March was higher than $1,800/MT around.
Even though S-Oil & Urumqi remains on target for 2011 1st Half starting up of
its new plant, Demand growth remains close to trend due to some plants T/A and
the increase of new PTA plants in China. It means that PX markets appear to have
slightly stronger prospects.
2011 Asia Petrochemical Industry Conference - Korea
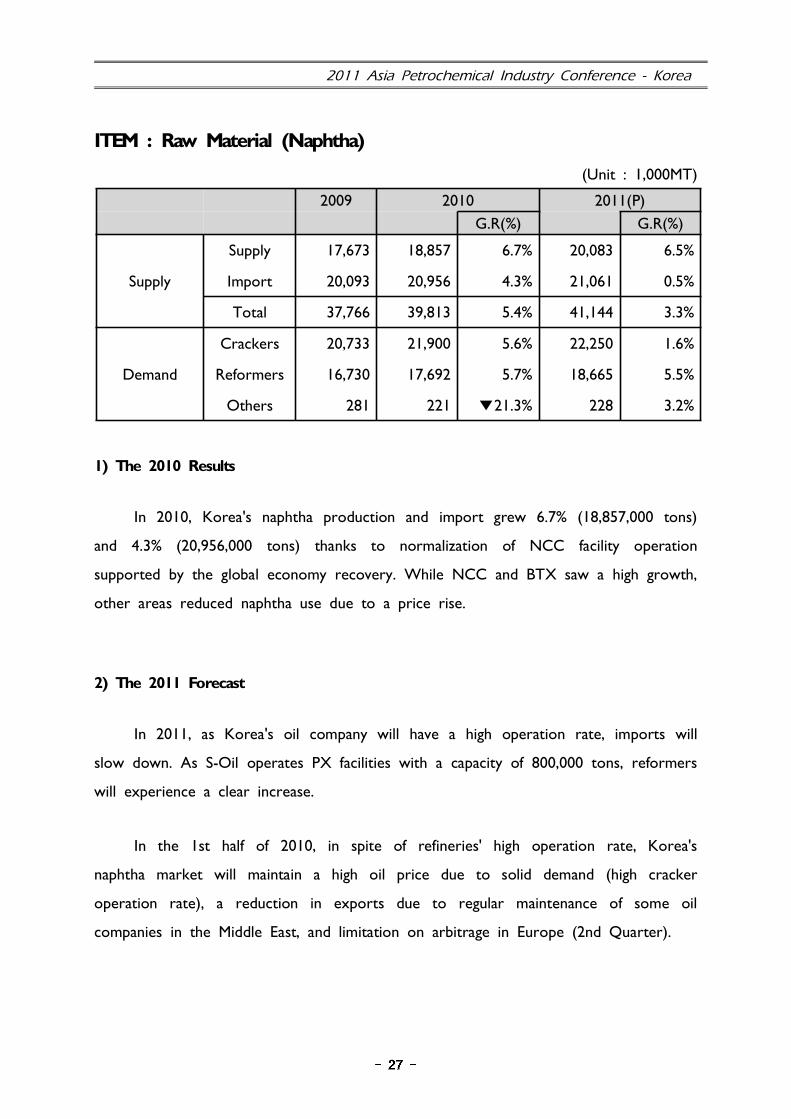
ITEM : Raw Material (Naphtha)
(Unit : 1,000MT)
2009 2010 2011(P)
G.R(%) G.R(%)
Supply 17,673 18,857 6.7% 20,083 6.5%
Supply Import 20,093 20,956 4.3% 21,061 0.5%
Total 37,766 39,813 5.4% 41,144 3.3%
Crackers 20,733 21,900 5.6% 22,250 1.6%
Demand Reformers 16,730 17,692 5.7% 18,665 5.5%
Others 281 221 21.3%▼ 228 3.2%
1) The 2010 Results
In 2010, Korea's naphtha production and import grew 6.7% (18,857,000 tons)
and 4.3% (20,956,000 tons) thanks to normalization of NCC facility operation
supported by the global economy recovery. While NCC and BTX saw a high growth,
other areas reduced naphtha use due to a price rise.
2) The 2011 Forecast
In 2011, as Korea's oil company will have a high operation rate, imports will
slow down. As S-Oil operates PX facilities with a capacity of 800,000 tons, reformers
will experience a clear increase.
In the 1st half of 2010, in spite of refineries' high operation rate, Korea's
naphtha market will maintain a high oil price due to solid demand (high cracker
operation rate), a reduction in exports due to regular maintenance of some oil
companies in the Middle East, and limitation on arbitrage in Europe (2nd Quarter).

2. Polyolefins Committee
2011 Asia Petrochemical Industry Conference - Korea
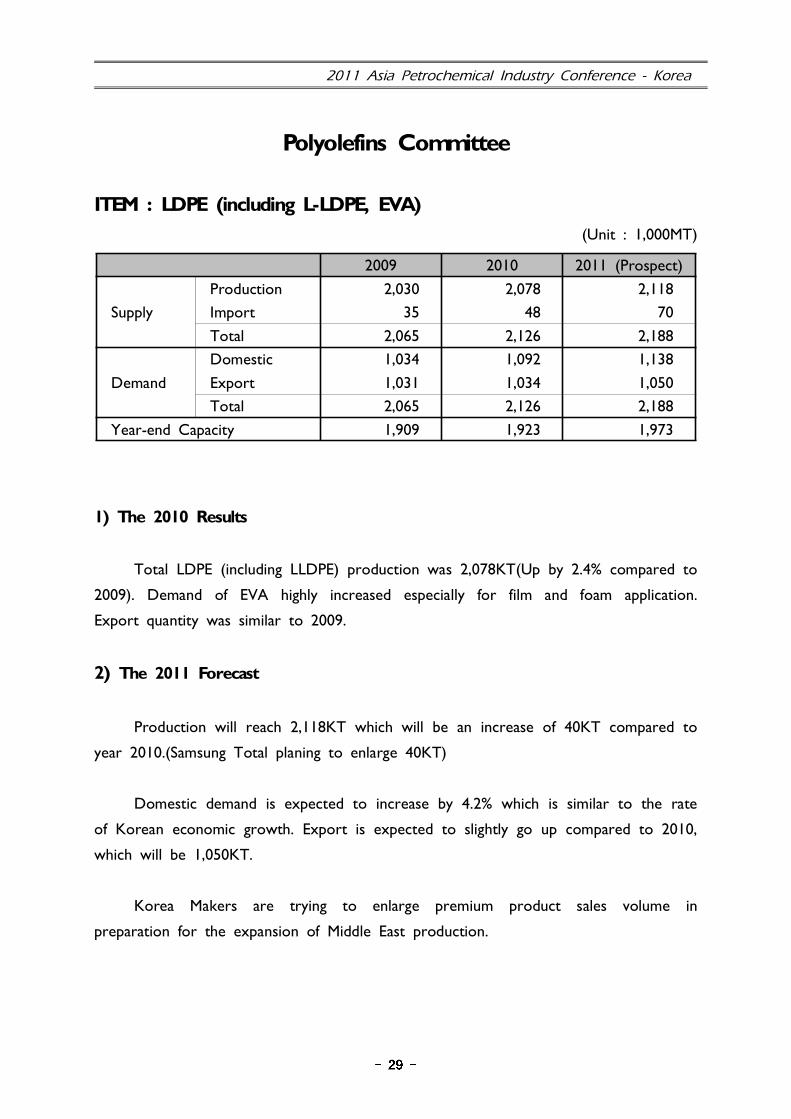
Polyolefins Committee
ITEM : LDPE (including L-LDPE, EVA)
(Unit : 1,000MT)
2009 2010 2011 (Prospect)
Supply
Production 2,030 2,078 2,118
Import 35 48 70
Total 2,065 2,126 2,188
Demand
Domestic 1,034 1,092 1,138
Export 1,031 1,034 1,050
Total 2,065 2,126 2,188
Year-end Capacity 1,909 1,923 1,973
1) The 2010 Results
Total LDPE (including LLDPE) production was 2,078KT(Up by 2.4% compared to
2009). Demand of EVA highly increased especially for film and foam application.
Export quantity was similar to 2009.
2) The 2011 Forecast
Production will reach 2,118KT which will be an increase of 40KT compared to
year 2010.(Samsung Total planing to enlarge 40KT)
Domestic demand is expected to increase by 4.2% which is similar to the rate
of Korean economic growth. Export is expected to slightly go up compared to 2010,
which will be 1,050KT.
Korea Makers are trying to enlarge premium product sales volume in
preparation for the expansion of Middle East production.
Polyolefins Committee
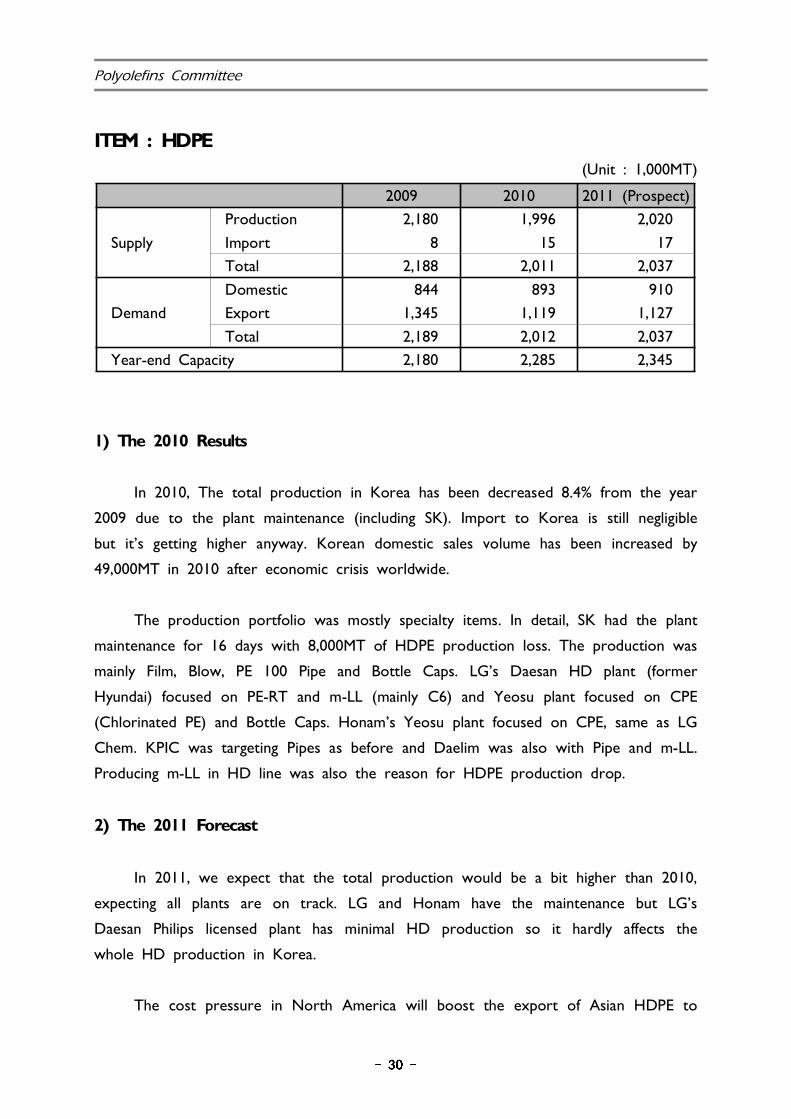
ITEM : HDPE
(Unit : 1,000MT)
2009 2010 2011 (Prospect)
Supply
Production 2,180 1,996 2,020
Import 8 15 17
Total 2,188 2,011 2,037
Demand
Domestic 844 893 910
Export 1,345 1,119 1,127
Total 2,189 2,012 2,037
Year-end Capacity 2,180 2,285 2,345
1) The 2010 Results
In 2010, The total production in Korea has been decreased 8.4% from the year
2009 due to the plant maintenance (including SK). Import to Korea is still negligible
but it’s getting higher anyway. Korean domestic sales volume has been increased by
49,000MT in 2010 after economic crisis worldwide.
The production portfolio was mostly specialty items. In detail, SK had the plant
maintenance for 16 days with 8,000MT of HDPE production loss. The production was
mainly Film, Blow, PE 100 Pipe and Bottle Caps. LG’s Daesan HD plant (former
Hyundai) focused on PE-RT and m-LL (mainly C6) and Yeosu plant focused on CPE
(Chlorinated PE) and Bottle Caps. Honam’s Yeosu plant focused on CPE, same as LG
Chem. KPIC was targeting Pipes as before and Daelim was also with Pipe and m-LL.
Producing m-LL in HD line was also the reason for HDPE production drop.
2) The 2011 Forecast
In 2011, we expect that the total production would be a bit higher than 2010,
expecting all plants are on track. LG and Honam have the maintenance but LG’s
Daesan Philips licensed plant has minimal HD production so it hardly affects the
whole HD production in Korea.
The cost pressure in North America will boost the export of Asian HDPE to

2011 Asia Petrochemical Industry Conference - Korea
Latin America and other area. The price gap between China and non-China is huge
now but we expect that it will be synchronized from 2nd half of the year.
Korean producers are still targeting specialty items but in commodity side, looks
like it also has the merit in this year. As a whole, the year 2011 will be another
good year for producers in HDPE aspects.
ITEM : P P
(Unit : 1,000MT)
2009 2010 2011 (Prospect)
Supply
Production 3,677 3,806 3,790
Import 21 22 22
Total 3,698 3,828 3,812
Demand
Domestic 1,353 1,497 1,540
Export 2,376 2,308 2,272
Total 3,729 3,805 3,812
Year-end Capacity 3,748 3,818 3,958
1) The 2010 Results
In 2010, production and sales volume were 3,806 thousand tons, 3,805 thousand
tons each. It is increased 129 thousand tons and 76 thousand tons respectively from
the previous year. In 2009, production was 3,677 thousand tons and domestic and
export sales was 3,709 thousand ton.
The domestic sales volume of 2010 recorded 1,497 thousand tons, rising 12.3%
comparing with previous year's 1,333 thousand tons. Especially Co-polymer sales of
domestic reached 815 thousand ton, increasing by 24% from previous year's 659
thousand ton due to the growth automotive and electric and electronics.
The export volume in 2010 reached 2,308 thousand tons, falling 2.9% from the
previous year's 2,376 thousand tons.

Polyolefins Committee
2) The 2011 Forecast
In 2011, production volume will be 3,790 thousand tons, falling 0.4% from the
previous year's 3,806 thousand tons due to the turnaround. It will be historically a
large number of plant turnaround, including Honam Petrochemical, LG Chemical,
Samsung Total, etc.
It is expected that the growth of downstream industry (Automotive, Home
appliance etc) will be slowed down in 2011. It will cause the domestic sales growth
slowdown, from 12% in 2010 to 3% in 2011.
In 2011, STC and LG Chemical is planning to expand PP plant capacity. Hence,
the year-end capacity will be increased by 3,963 thousand tons. It is nearly 4%
increase compare to the previous year.

3. Styrenics Committee
Styrenics Committee
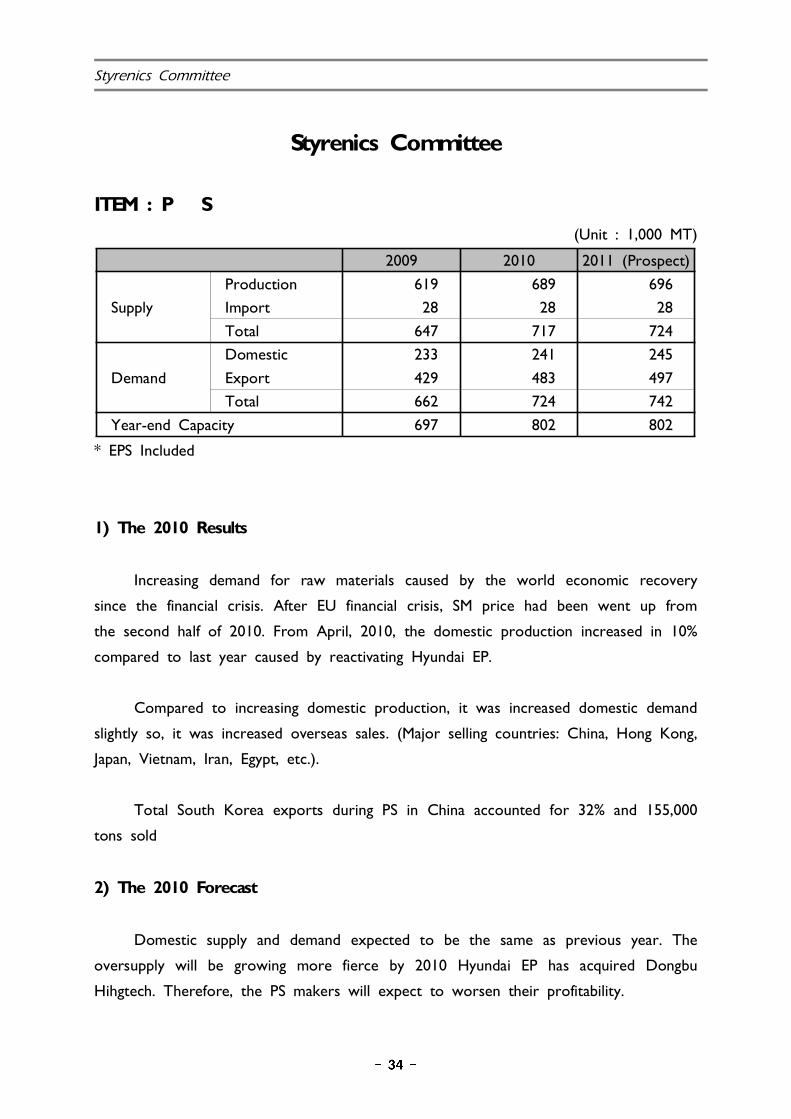
Styrenics Committee
ITEM : P S
(Unit : 1,000 MT)
2009 2010 2011 (Prospect)
Supply
Production 619 689 696
Import 28 28 28
Total 647 717 724
Demand
Domestic 233 241 245
Export 429 483 497
Total 662 724 742
Year-end Capacity 697 802 802
* EPS Included
1) The 2010 Results
Increasing demand for raw materials caused by the world economic recovery
since the financial crisis. After EU financial crisis, SM price had been went up from
the second half of 2010. From April, 2010, the domestic production increased in 10%
compared to last year caused by reactivating Hyundai EP.
Compared to increasing domestic production, it was increased domestic demand
slightly so, it was increased overseas sales. (Major selling countries: China, Hong Kong,
Japan, Vietnam, Iran, Egypt, etc.).
Total South Korea exports during PS in China accounted for 32% and 155,000
tons sold
2) The 2010 Forecast
Domestic supply and demand expected to be the same as previous year. The
oversupply will be growing more fierce by 2010 Hyundai EP has acquired Dongbu
Hihgtech. Therefore, the PS makers will expect to worsen their profitability.

2009 Asia Petrochemical Industry Conference - Korea
As the world economy to survive, PS demand will be solved a little bit because
of consumer demand increased and extending China's domestic stimulus. The domestic
PS makers switch to HIPS, ABS with a high value. (LG Chemical: Some PS line switch
to ABS line / Cheil: only produce HIPS) In particular, the domestic PS makers seek a
high value product through HIPS rather than the general GP.
ITEM : A B S
(Unit : 1,000 MT)
2009 2010 2011 (Prospect)
Supply
Production 1,404 1,493 1,500
Import 6 7 7
Total 1,410 1,500 1,507
Demand
Domestic 160 216 230
Export 1,250 1,284 1,277
Total 1,410 1,500 1,507
Year-end Capacity 1,520 1,520 1,596
1) The 2010 Results
The production was 1,493 thousand tons, 6.4 % higher than that in 2009
resulted from enhancement of operation rate. There has been no additional
investment in Korea.
The demand was 216 thousand tons, 35% higher than last year mainly with high
growth of household appliances like refrigerator and washing machine and flat TV.
Demand for health care appliance like water purifier, videt, humidifier etc. was also
increased in 2010.
2) The 2011 Forecast
The production will be slightly increased comparing to the last year with the
increase of domestic demand.

Styrenics Committee
Domestic demand is expected to increase by 6.5% comparing to that of 2010
with the expectation of increase in demand from E/E applications.
ITEM : S M
(Unit : 1,000 MT)
2009 2010 2011 (Prospect)
Supply
Production 2,767 2,810 2,791
Import 759 755 800
Total 3,526 3,565 3,591
Demand
Domestic 2,221 2,255 2,261
Export 1,305 1,310 1,330
Total 3,526 3,565 3,591
Year-end Capacity 3,383 3,383 3,383
1) The 2010 Results
The SM production and capacity in Korea was almost similar to that of 2009.
Import and export wasn’t changed compare to that of 2009.
2) The 2011 Forecast
Capacity growth in Korea will be minimal in the near future. Honam will
increase their Daesan plant by 9% in 2011(80kta).
Production of SM in 2011 is expected to be 2791 thousand tons cause of there
will be turn around.

4. PVC Committee

PVC Committee
ITEM : P V C
(Unit : 1,000MT)
2009 2010 2011 (Prospect)
Supply
Production 1,439 1,404 1,410
Import 31 55 50
Total 1,470 1,459 1,460
Demand
Domestic 775 787 793
Export 685 630 642
Total 1,460 1,417 1,435
Year-end Capacity 1,380 1,380 1,380
1) The 2010 Results (Unit: 1,000MT)

2011 Asia Petrochemical Industry Conference - Korea

5. Synthetic Rubber Committee

2011 Asia Petrochemical Industry Conference - Korea
Synthetic Rubber Committee
(Unit : 1,000 MT)
2009 2010 2011 (Prospect)
SBR
Supply
Production 525 571 596
Import 39 49 46
Total 564 620 642
Demand
Domestic 164 203 212
Export 408 416 429
Total 572 619 641
Year-end Capacity 616 616 616
BR
SupplyProduction 306 323 432Import 23 22 24Total 329 345 456
DemandProduction 94 111 122Import 231 229 337Total 325 340 459
Year-end Capacity 322 322 522
* SBR / BR (SBR : E-SBR+S-SBR, BR : HBR + LBR)
* Production : based on Shipment
* Capacity : excluding S-SBR
1) The 2010 Results
a. Due to the global economic recovery, Korean auto and tire production grew.
As a result, both demand and production increased.
b. In 2010, Korean tire makers produced 94,200 k unit compared to 75,467 k
unit in 2009. The growth rate of 2009-2010 was 25% which was the highest record
for last 10 years.
c. After US imposed a tariff on tires from China in Sep. 2009, (35 % in the
first year, 30% in the second year and 25% in the third year), 2010 was the first
year which this decision started to take effect. This move accelerated the export of
Korean tire to US and resulted in the increase of tire production.

Synthetic Rubber Committee
d. The demand of S-SBR especially grew over the world because of Green Tire
trend which favors the eco-friendly tire with low rolling resistance. The domestic
demand of S-SBR increased as well.
2) The 2011 Forecast
a. In 2010, the operation rate was almost 100% for both SBR and BR.
Therefore, it looks difficult for SBR production to be increased more in 2011. In case
of BR, the domestic production will increase 38% due to the expansion of production
capacity in Korea.
b. As Chinese and Indian Auto & Tire industries continue to grow annually
based on motorization, the global demand of SBR and BR will show steady growth in
2011, especially in Asia.
c. Natural rubber price remains high due to tight supply and it will especially
affect the growth of demand for BR which can replace natural rubber.

6. Synthetic Fiber Raw Materials
Committee

Synthetic Fiber Raw Materials Committee
Synthetic Fiber Raw Materials Committee
ITEM : A N
(Unit : 1,000MT)
2009 2010 2011 (Prospect)
Supply
Production 532 595 582
Import 82 88 95
Total 614 683 677
Demand
Domestic 450 490 520
Export 172 183 157
Total 622 673 677
Year-end Capacity 550 550 565
1) The 2010 Results
AN total demand was increased by 8%, comparing with 2009. AN demand
from acrylic fibre was 50KT, the same as the last year and operation rate was 100%.
That is because shortly balanced and highly priced cottons have been triggering
increased acrylic fiber demand.
Additionally, AN demand from ABS resin sector was increased by 8% thanks to
booming electrics and chemical industries wide.
In the mean time, AN supply has been improved by 11% to cover up the
increased demand. TSPC issued no T/A in 2010 which helped to increase total
production by 12%.
2) The 2011 Forecast
Basically, there seems to be no capacity change in Acrylic Fibre. On the
contrary, capacity increases and D/Ns from major ABS makers will lead 6% of AN
demand increase in domestic.
However, AN export volume will be decreased by 13% due to shortage caused

2011 Asia Petrochemical Industry Conference - Korea
by TSPC's annual T/A.
As a result, total demand will be expanded slightly to reach 677KT. Domestic
production will be decreased by 2% and reached at 582KT reflecting turnarounds
from both of TK and TSPC in March and May, respectively. To compensate domestic
production, import will be expected to be increased by 7KT and touched at 95KT.
Accordingly, total supply would be decreased by 1% whereas a D/N helped to ramp
up year-end capacity by 3%.
ITEM : Caprolactam(Unit : 1,000MT)
2009 2010 2011 (Prospect)
Supply
Production 258 275 276
Import 28 47 52
Total 286 322 328
Demand
Domestic 254 303 317
Export 32 19 11
Total 286 322 328
Year-end Capacity 270 270 270
1) The 2010 Results
Production of CPL was increased by 6.6% from previous year thanks to global
economy recovery and booming exports.
Export of CPL was decreased by 40.6% from previous year due to good
domestic demand and CPL shortage.
Import quantity of CPL was increased by 67.9%.
CPL demand from Textile, Engineering Plastic, Film was good. CPL demand in
Korea made a plus growth for two years in a row.

Synthetic Fiber Raw Materials Committee
2) The 2011 Forecast
Production of CPL is expected to increase by 0.4% from 2010 year.
Domestic CPL consumption for 2011 year is expected to increase by 4.6%
thanks to global economy recovery and booming exports.
CPL demand from textile and engineering plastics is expected to be strong.
CPL export quantity will be reduced due to increasing domestic sales.
ITEM : E G
(Unit : 1,000MT)
2009 2010 2011 (Prospect)
Supply
Production 1,177 1,153 1,067
Import 466 445 460
Total 1,643 1,598 1,527
Demand
Domestic 1,117 1,137 1,260
Export 526 461 267
Total 1,643 1,598 1,527
Year-end Capacity 1,340 1,340 1,352
1) The 2010 Results
MEG demand in Korea was about 1,137 thousand tons in 2010, slightly
increased by 2% compared with previous year’s 1,117 thousand tons. The improved
polyester margins compare to previous year was main reason behind the strong global
growth for polyester fiber, partially due to cotton supply constraints
The existing 3 MEG supplier produced about 1,153 thousand tons, similar to
last year.
2011 Asia Petrochemical Industry Conference - Korea
The total MEG import figures were decreased to 445 thousand tons, 4% lower
compared with previous year.
To cope with demand increase in domestic, MEG producers have decided to
increase domestic supply at the expense of reducing export volume. The total MEG
export figures were decreased to 461 thousand tons, which was 11% lower figures
compared to the year of 2009.
2) The 2011 Forecast
On the demand side, restarts at two polyester units and an expected increase
in operating rates of existing polyester facilities would in turn drive up domestic MEG
demand.
At the same time, severe competition along with numerous polyester capacity
expansion in both China and Korean domestic, cast gloom over the outlook of
demand growth.
On the Production side, MEG production will be decreased by 86 thousand
tons, mainly due to MEG rationalization plans including the conversion of glycols
capacity into HPEO and downstream HPEO derivatives.
As per price outlook, MEG prices staged downward correction in the past
weeks because of delayed turnaround schedule at major plants and China’s tightening
monetary policy. In the long run, however, MEG prices are expected to trend up,
because of no additional expansion plans until 2013 and steady demand growth in
polyester industry.

Synthetic Fiber Raw Materials Committee
ITEM : T P A
(Unit : 1,000MT)
2009 2010 2011 (Prospect)
Supply
Production 6,305 6,535 6,535
Import 0 0 0
Total 6,305 6,535 6,535
Demand
Domestic 2,708 2,885 2,885
Export 3,618 3,651 3,651
Total 6,326 6,536 6,536
Year-end Capacity 6,380 6,390 6,390
1) The 2010 Results
In the first half of 2010, the PTA price fell due to a price recession caused by
the PIGS Europe finance crisis. Spread was still strong and the anti-dumping issue was
a big issue for the Korea PTA maker, so they tried to make BIZ by exporting to
other countries such as India. As a result, China's import of Taiwan PTA has
increased rapidly.
In second half of 2010, Korea PTA export to China normalized due to the
most recent anti-dumping issue decision. The increased demand of downstream made
the PTA Spread very strong, as Polyester purchase increased as a result of high
priced raw cotton.
2) The 2011 Forecast
In the first half of 2011, the end of 2010's atmosphere will be maintained
because of increased Polyester demand. The China market will increasingly prefer
imported PTA, as a result of the currency exchange rate.
In the second half of 2011, PET demand will be stabilized as predicted by raw
cotton price, so PTA spread also will be steadily maintained.

7. Chemicals Committee

Chemicals Committee
Chemicals Committee
ITEM : 2-Ethyl Hexanol
(Unit : 1,000MT)
2009 2010 2011 (Prospect)
Supply
Production 416 404 410
Import 5 14 10
Total 421 418 420
Demand
Domestic 304 319 320
Export 117 99 100
Total 421 418 420
Year-end Capacity 400 400 400
1) The 2010 Results
Demand of 2-EH in Asia had gradually increased on 2010 as Global economy
recession had been slowly recovered since 2008.
Domestic demand(including self-consumption) also had increased to over 319KT which
is 5% higher than 2009.
The Profitability of 2-EH had improved its return on 2010 by widening the gap with
the feedstock(C3) to $522/mt from $200/mt on 2009.
The main reason of the bullish Domestic demand and bearish export trend was
increased self-consumption for Acrylic products such as 2EHA
And the demand of Plasticizers in Asia was continuous weak.
2) The 2011 Forecast
Plasticizers Demand in 2011 is still expected to be bearish, but Domestic
Demand of 2EH is expected, a slight increase, 325KT which is higher than 2009 due

2011 Asia Petrochemical Industry Conference - Korea
to Acrylic family of products' (2EHA) booming domestic demand for self-consumption,
while Export volume of 2EH is expected, a slight decrease, 95KT which is lower than
2009.
Intensive Shut-down in the first half of 2011 in Asia and Japan earthquake affected the
strength to maintain international current 2EH, but China's tightening policy and
authentic appearance from newly-organized facilities in Asia in the second half will
affect the relative ease of international supply, which will lead to switch weakness.
The gap between 2EH and the feedstock(C3) is expected under 2010's level($522/mt).
ITEM : Phenol
(Unit : 1,000MT)
2009 2010 2011 (Prospect)
Supply
Production 608 620 660
Import 48 96 90
Total 656 716 750
Demand
Domestic 533 575 601
Export 127 132 150
Total 660 707 751
Year-end Capacity 595 595 620
Chemicals Committee
1) The 2010 Results
Recovery to the healthy global market from economy crisis & bad market
demand in 2009. Due to US / EU manufaturer's unexpected troubles, reducing the
operating rates of producers caused to suffer from lack of supply
Some major supplier in Asia faced against the unplanned S/D, even twice.
(Mar~Apr, Aug~Sep) Delaying new Phenol projects to escalate tight supply situation.
(Sinopec-Tainjin : 1Q -> 2Q, SABIC : 3Q -> End of year)
Improvement in main end user applications such as construction and automotive,
taking place with a good global growth, such as BPA and Phenolic resins.
2) The 2011 Forecast
Generally, keeping out for high price amid a bullish outlook.
Phenol price remains bullish, in tandem with escalating feedstock, upstream
Benzene and Propylene valuses and T/A at regional facilities. Tight regional supply that
is getting more serious, after a deadly earthquake and tsunami struck Japan.
In US / EU phenol's case, the restricted availability of Cumene continues to
dictate the operating rates of US phenol producers, to supply very limited volume to
Asian market.
As one of main downstreams, BPA, new players (PTT, Sinopec-MCC) start the
new operating of plants. (Keeping strong and healthy demand)
Continuance to escalate upstream values, coupled with the volatility in crude
futures amid political turmoil in the Middle East, contribute to a positive outlook in
the rest of this year.

2011 Asia Petrochemical Industry Conference - Korea
ITEM : Phthalic Anhydride
(Unit : 1,000MT)
2009 2010 2011 (Prospect)
Supply
Production 330 330 330
Import 2 1 1
Total 332 331 331
Demand
Domestic 36 30 29~31
Export 160 160 160
Total 196 190 189~191
Year-end Capacity 340 340 340
1) The 2010 Results
Due to the sluggish construction industry, UPR and Paint parts entered the
phase of stagnation. So PA local demand showed no increase even some decline. The
imported cargo also slowed down due to the growing competition between
manufacturers
UPR: volatile demand by each product line.
Paints: Alkyd demand was encroached by Water based paints demand increase.
The industry definitely depends on the local market because the export is not easy,
and its demand usually comes from the renovation instead of new construction.
2) The 2011 Forecast
The recovery of construction industry along with the real estate market will be
one of the key factors for the market demand. It is very hard to expect the
short-term improve of the local construction market, but the reposition of local
products portfolio and the industry reorganizing are expected to follow and
strengthen the local competitiveness at last.
The imported cargo is expected to stay stable and more competition for new
application development for using PA will come out.

Chemicals Committee
ITEM : Acetic Acid
(Unit : 1,000MT)
2009 2010 2011 (Prospect)
Supply
Production 464 500 488
Import 51 48 71
Total 515 548 559
Demand
Domestic 450 480 500
Export 67 71 57
Total 517 551 557
Year-end Capacity 470 490 570
1) The 2010 Results
Domestic demand of acetic acid was 480,300 tons, larger than 2009. Demand
from all the derivatives of AA eg. PTA, VAM, EA & Solvents improved.
Supply was 547,600 tons which is increased by 33,200 tons in line with demand
increase & D/B of SSBP
2) The 2011 Forecast
Domestic demand from PTA, VAM, & EA/BA are stable to firm. PTA maintained
full operation with high margin in 1Q. SBP supply will be tight throughout the year
due to TAR from Sep. thru Oct.