c r rao aimscs lecture notes series · tics in finance” by david ruppert, springer (2004) and...
TRANSCRIPT

C R RAO Advanced Institute of Mathematics, Statistics and Computer Science (AIMSCS)
Author (s): B.L.S. PRAKASA RAO
Title of the Notes: INTRODUCTION TO STATISTICS IN FINANCE
Lecture Notes No.: LN2013-01
Date: July 10, 2013
Prof. C R Rao Road, University of Hyderabad Campus, Gachibowli, Hyderabad-500046, INDIA.
www.crraoaimscs.org
C R RAO AIMSCS Lecture Notes Series

1
LECTURE NOTES
INTRODUCTION TO STATISTICS IN FINANCE
B.L.S. PRAKASA RAO
C R Rao AIMSCS, Hyderabad, INDIA
July 10, 2013

2
PREFACE
This lecture notes is an introduction to statistics in finance. It can be covered in a semester
course meeting three times in a week. The course is based on the excellent books on “Statis-
tics in Finance” by David Ruppert, Springer (2004) and “An elementary Introduction to
Mathematical Finance: Options and Other Topics”, Second Edition, by Sheldon M. Ross,
Cambrdige University Press (2003). Students taking this course should have some basic ideas
of distribution theory, statistical inference and stochastic processes. I have taught this course
in the 4th semester of M.Sc. Students in Statistics at the University of Hyderabad for the last
five years and this lecture notes is a culmination of those efforts. There is no new material
in these notes but we try to give some basic ideas in finance involving statistical concepts.
Students taking this course are expected to analyze data on shares of different stocks to get
ideas on options and portfolio optimization. These notes are for private circulation only.
I would like to thank Dr. P. Manimaran, C R Rao AIMSCS for his help in preparing the
figures for tex files.
B.L.S. Prakasa Rao
Hyderabad
July 10, 2013

Contents
1 Introduction 7
2 PRESENT VALUE ANALYSIS 15
2.1 Present Value . . . . . . . . . . . . . . . . . . . . . . . . . . . . . . . . . . . . 15
2.2 Continuous compounding with varying interest rate . . . . . . . . . . . . . . 20
2.3 Returns . . . . . . . . . . . . . . . . . . . . . . . . . . . . . . . . . . . . . . . 21
2.4 Log-normal Distribution . . . . . . . . . . . . . . . . . . . . . . . . . . . . . . 27
2.5 Random walk . . . . . . . . . . . . . . . . . . . . . . . . . . . . . . . . . . . . 29
3 OPTION PRICING AND BINOMIAL TREE MODEL 33
3.1 Inroduction . . . . . . . . . . . . . . . . . . . . . . . . . . . . . . . . . . . . . 33
3.2 One-step Binomial Model . . . . . . . . . . . . . . . . . . . . . . . . . . . . . 37
3.3 Two-step Binomial Model . . . . . . . . . . . . . . . . . . . . . . . . . . . . . 45
3.4 General Binomial Tree Model . . . . . . . . . . . . . . . . . . . . . . . . . . . 52
4 GEOMETRIC BROWNIAN MOTION AND BLACK-SCHOLES FOR-
MULA 61
4.1 Inroduction . . . . . . . . . . . . . . . . . . . . . . . . . . . . . . . . . . . . . 61
3

4
4.2 Geometric Brownian Motion . . . . . . . . . . . . . . . . . . . . . . . . . . . . 62
4.3 Black-Scholes formula . . . . . . . . . . . . . . . . . . . . . . . . . . . . . . . 67
4.4 Implied Volatility . . . . . . . . . . . . . . . . . . . . . . . . . . . . . . . . . . 69
4.5 Properties of the European Call Option Price Given by the Black-Scholes
Formula . . . . . . . . . . . . . . . . . . . . . . . . . . . . . . . . . . . . . . . 69
4.6 Properties of the European Call Option Price under General Price Process . 75
4.7 Put Options . . . . . . . . . . . . . . . . . . . . . . . . . . . . . . . . . . . . . 80
5 PORTFOLIO OPTIMIZATION 87
5.1 Introduction . . . . . . . . . . . . . . . . . . . . . . . . . . . . . . . . . . . . . 87
5.2 Efficient frontier and Tangency portfolio . . . . . . . . . . . . . . . . . . . . . 88
5.3 Efficient portfolio with N risky assets and one risk-free asset . . . . . . . . . 98
6 ESTIMATION OF VOLATILITY AND VALUE-at-RISK 105
6.1 Introduction . . . . . . . . . . . . . . . . . . . . . . . . . . . . . . . . . . . . . 105
6.2 General Method of Estimation of Volatility : . . . . . . . . . . . . . . . . . . . 106
6.3 Estimation of Value-at-Risk (VaR) . . . . . . . . . . . . . . . . . . . . . . . . 110
6.4 Conditional Value-at-Risk (CVaR) . . . . . . . . . . . . . . . . . . . . . . . . 112
6.5 Remarks : . . . . . . . . . . . . . . . . . . . . . . . . . . . . . . . . . . . . . . 113
7 CAPITAL ASSET PRICING MODEL 115
7.1 Introduction . . . . . . . . . . . . . . . . . . . . . . . . . . . . . . . . . . . . . 115
7.2 Capital Market Line (CML) . . . . . . . . . . . . . . . . . . . . . . . . . . . . 116
7.3 Security Market Line (SML) . . . . . . . . . . . . . . . . . . . . . . . . . . . . 120

5
7.4 Security Characteristic Line (SCL) . . . . . . . . . . . . . . . . . . . . . . . . 122
7.5 Testing for CAPM . . . . . . . . . . . . . . . . . . . . . . . . . . . . . . . . . 125
8 OPTION PRICING WHEN STOCK PRICES ARE LIKELY TO JUMP 127
8.1 Introduction . . . . . . . . . . . . . . . . . . . . . . . . . . . . . . . . . . . . . 127
8.2 Geometric Brownian Motion with Superimposed Jumps . . . . . . . . . . . . 128
9 OPTION PRICING USING AUTOREGRESSIVE MODELS FOR STOCK
PRICE PROCESS 133
9.1 Autoregressive models . . . . . . . . . . . . . . . . . . . . . . . . . . . . . . . 133
10 A SHORT INTRODUCTION TO STOCHASTIC DIFFERENTIAL EQUA-
TIONS 137
10.1 Introduction . . . . . . . . . . . . . . . . . . . . . . . . . . . . . . . . . . . . . 137
10.2 Brownian Motion . . . . . . . . . . . . . . . . . . . . . . . . . . . . . . . . . . 137
10.3 Stochastic integral . . . . . . . . . . . . . . . . . . . . . . . . . . . . . . . . . 140
10.4 Properties of an Ito Stochastic Integral . . . . . . . . . . . . . . . . . . . . . . 141
10.5 Stochastic Differential Equations . . . . . . . . . . . . . . . . . . . . . . . . . 143
11 STOCHASTIC MODELS IN FINANCE 149
11.1 Introduction . . . . . . . . . . . . . . . . . . . . . . . . . . . . . . . . . . . . . 149
11.2 Stochastic Interest Rate Models . . . . . . . . . . . . . . . . . . . . . . . . . . 150
11.3 Mean Reversion . . . . . . . . . . . . . . . . . . . . . . . . . . . . . . . . . . . 152
11.4 Black-Scholes Model: . . . . . . . . . . . . . . . . . . . . . . . . . . . . . . . . 154

6

Chapter 1
Introduction
Risk is an important concept in the modern theory of finance. Every decision taken or
transaction made by a company can be considered as the the buying or selling of risk. The
success of a company is determined by how much profit it can make for a fixed amount of
risk. Assets of an individual can be thought to be of two types; those which are risky and
those which are risk-less. Shares owned by a person in a company can be viewed as an
example of a risky asset as their total value fluctuates from one day to another depending
whether the price of the share moves up or down. Term deposits in a bank or government
bonds are examples of risk-less assets in general as their future value depends on the interest
to be earned which is known at the time of investment as a term deposit. A risk-less asset is
an asset which has a clearly and precisely determined future value. A risky asset is an asset
which is not risk-less. Risk can be considered as another way of looking at uncertainty in the
decision making or in performing transaction. Note that almost any financial transaction is
risky except for a risk-less government bond or a term deposit in a bank. Another example
of a risky asset is the amount of foreign exchange you are holding at a time point, say, in
euros or in U.S. dollars. The future value in rupees of this holding in euros or dollars will
depend on the fluctuations in the exchange rate between euros and rupees or dollars and
rupees respectively. One important point to remember is that the investor in a company
does not bother or worry about the riskiness of an asset if the cost of possible future value of
the asset is more than its present value. The question is how to determine the present value
of an asset. What do we mean by the value of an asset? Remember that, unless there is no
inflation, an amount of thousand rupees a year from now will buy less than what we can buy
with thousand rupees today; that is, the purchasing power in economic terms might go down
7

8
as the time progresses. Value of an asset is what it can buy. The price of an asset depends
on the risk taken in producing such an asset. In a free market or market driven economy, not
controlled by government regulations, all the available information about an asset is already
included in the price of an asset; hence there is no such thing as a good buy; the value of
an asset depends on how much you and I are willing to pay to purchase the asset. The only
value of an asset is its market value.
Consider two people, one a professor in finance and the other an ordinary person, go on a
walk and the ordinary person sees a currency note worth rupees one thousand on the street;
when the person tries to pick up the note, the professor in finance says ” Don‘t try to do
that; it is absolutely impossible that there is a thousand rupee note lying on the street; for,
if it were there, then some one else who passed through that way would have picked it up
earlier”. In other words, there is no free lunch.
One of the basic assumptions in formulating models in the theory of finance is the concept
of ”no arbitrage”. It essentially means that ” no risk no profit”. Everybody has to take risk
if he or she wants to make a profit. Another way to put is it is that ”there is no free lunch”!!
Consider the trading of U.S. Dollars $ versus Euros ϵ which takes place simultaneously at
two stock exchanges, say, in New York in USA and Frankfurt in Germany. Suppose, for
simplicity, that in New York, the $ − ϵ rate is 1:1. Then it is obvious that the exchange
rate, at the same moment of time, in Frankfurt should also be 1:1. Suppose, on the contrary,
That you can buy one U.S. dollar in Frankfurt for Euro 0.999 euros. Then it is profitable
to quickly buy U.S. dollars in Frankfurt and simultaneously sell the same amount of dollars
for euros in New York and there by make a profit. This can be done on as large a scale as
possible to increase profit. Such an opportunity is called an arbitrage opportunity. In such a
case, the financial market cannot be in equilibrium or stable and the market forces triggered
will make the dollars rise in Frankfurt and fall in New York. The arbitrage possibility will
disappear when the two prices become equal in the sense that, even for arbitrageurs with very
low transaction costs, the above scheme will not be profitable (Delbaen and Schachermayer
(Notices of Amer. Math. Soc. 51 (2004) 526-528). An arbitrage opportunity is the possibility
to make a profit in a financial market without risk and without net investment of capital.
The principle of no arbitrage states that a mathematical model of financial market should
not allow for arbitrage opportunities.
In real financial markets, arbitrage opportunities can and do exist. But they will be present
9
only for a short amount of time and disappear quickly as some one will always be ready to
use whenever they appear. In Mathematical theory of finance, it is therefore always assumed
that the market is functioning under no arbitrage or in other words there are no arbitrage
opportunities. The job of a statistician is to develop methods to study market behaviour
under an arbitrage free market.
Assuming that all the assets are correctly priced by the market, the question is how to
differentiate one asset from the other to decide which one to buy or which one to sell. An
important component a market has is its information on the riskiness of an asset . This
information is reflected in the pricing of an asset. Increased risk means greater returns on
the average which also means possible greater losses. An asset’s price reflects the value it is
likely to have in the future taking into account its riskiness.
It is not possible to predict the future price of an asset from past data in general. Past
information on an asset is already included in its present price. The purpose of modelling
in stochastic finance is not for prediction of the prices of several types of assets but to
correlate the movements of the price of one asset to that of another. The price movements
are considered to be driven by the information arriving/available about an asset in the
market and this information is unknown and can be considered as random. The main issue
in mathematical finance is to construct a portfolio, that is, a combination of the market
instruments which are risky and risk-less affected by the same information, to reduce or
remove or cancel randomness. This process is known as hedging. The objective is to develop
some methods to hedge and to understand its consequences.
Let us now look at two types of assets available in the market one of which is risky and the
other risk-less. Consider a government bond issued by the Reserve bank of India for instance.
The government bond is a bond, say, for 5 or 7 years or more in term, and which pays either
every year an interest on the bond and gives the investor his or her original deposit invested
at the end of the term or pays the total interest accumulated over the bond period along with
the principal at the end of the maturity of the bond. This type of investment is a risk-less
investment as the future value of the investment is known at the time of initial investment.
In contrast to this type of investment, suppose you bought a share or stock in a company.
Future value of the stock or share depends on the market behaviour. It might be more or
less than its present value. Such an investment is an example of a risky investment. There
are other types of market instruments which we will come across later in this book.

10
Let us look at the investment such as stocks or shares in a company in more detail. Companies
traded on a stock exchange such as the Bombay stock Exchange (BSE) or the National Stock
Exchange (NSE) usually have the ending ”Limited” at the end of their name indicating that
they are public limited companies. Here ”Public” means that any one can buy shares in those
companies. The holder of a share of a company owns a part or a fraction of the company.
The word ” Limited” in the name of the company signifies that the share holder has limited
liability. Another asset commonly traded in the market is a company bond or a corporate
bond. Riskiness for such a bond is generally higher than that associated with a government
bond but lower than the risk associated with a stock or a share of a company. A company
which needs a a loan for raising its capital might issue bonds in market by paying interest.
The rate of interest is generally higher than that of a risk-less bond issued by the government.
The investor’s risk is that the company may default in its payment of interest. However the
holder of the company bond has higher claim on the company’s assets than the share holders
and hence the riskiness for the share holders is lower. Companies also issue bonds at times
known as the debentures which may be convertible indicating that they can be converted
into the shares of the company after the maturity of the bonds depending on the share value
at the time of convertibility.
All the type of assets discussed above such as government bonds or corporate or company
bonds are similar in the sense that the value addition to them after maturity is either positive
or zero. However there are other assets which might lead to negative values or losses to the
values of assets. We will discuss more about such assets later. There is another market
instrument known as option which is being traded in the market. In order to explain what
an option is, let us consider the following scenario. Every country is dependent on its energy
resources, such as oil, in particular, petroleum. For instance, India is a vast country of 1.2
billion people and the demand for oil is increasing everyday. India does have its own resources
but the output from them is not sufficient for its needs. India has to import oil from other
countries by paying in foreign exchange. The price per barrel of crude oil is decided by
the Organization of Petroleum Exporting Countries (OPEC). India has to make plans well
ahead, at least an year in advance, to estimate its production and to estimate the amount of
oil it needs to import. If it does spot buying, then it may have to pay an exorbitant rate per
barrel. However if it buys an option to buy, say, one million barrels at a specified rate at a
specified time, then it can control its expenses. This is the idea behind options. Let us now
look at this in more detail. Given that risk is inherent in all decision making processes either
by a bank or by a company or by a government of a country, it is important to see whether
11
such a risk can be managed. A bank or a company may buy any one or more of several
market or financial instruments which are likely to decrease its risk. Option is one such an
instrument. It can be used to reduce the risk but if is misused , then it might increase the
risk. Diversification is another way of reducing the risk by a company. Consider a contract
that pays 1000 Rupees if a fair coin is tossed and if it results in a head and pays nothing
otherwise. Suppose there is a second contract that pays 1000 Rupees if a fair coin is tossed
and if it results in a tail and pays nothing otherwise. By buying only one of these contracts,
there is always a positive chance of loosing money. However, if one buys both the contracts,
then winning one of the games is certain and hence there is no loss of money. This is the key
idea in diversification of risk. As the saying goes ”Do not place all the eggs in one basket”.
For if you do and the basket is dropped, then you will loose all of your investment. In recent
times, companies, such as those involved in manufacture of tobacco products, have started
diversification of their products such as into manufacture of biscuits or into manufacture
of writing or packing paper or administration of big hotels to minimize the risk, as they
have noticed that consumption of tobacco products is declining among the public leading to
reduction in profits for the companies.
What is an option? An option is an instrument which gives the holder the right to buy or
sell the quantity of some fixed asset during a specified time period, called strike period, at a
price fixed today, called the ”strike price” or the ”exercise price”. If the holder is planning to
buy an option, it is called a ”call option”; if he is trying to sell an option, it is called a ”put
option”. The holder of the option has the right but not obligation to buy or sell depending
on the type of option. An option is called an ”European Option” if the holder of the option
can exercise his option only at the specific time known as the ”exercise time” or ”strike time”
and not before. It is called an ”American option” if the holder of the option can exercise his
option only at any time before or at the specific time known as the ”exercise time” or ”strike
time”. There are other type of options which we will not discuss in this course. The value
of an option is sensitive to market fluctuations and hence the amount to be gained or lost
by exercising an option are large. The purpose of an option is to allow the buyer or seller of
the option to guard against certain unforeseen events which might be catastrophic and thus
reduce the risk. The difference in buying a call option by a holder of a stock or buying the
stock is that if the stock price goes the wrong way, the option will have no value for the buyer
as it will not be exercised and if the stock price moves goes the right way, the option will be
exercised and the holder will make a positive profit. How to price such an option? This will
be one of the main topics of this book. We will describe some methods for valuing options.

12
Participants in markets activities can be classified into different categories. Some are ”hedgers”.
These use market instruments to reduce risks. For instance, they might choose a portfolio, a
combination of risky assets such investments in stocks, options on stocks and term deposits
in banks or government bonds which are generally risk-less, to minimize the risk. The second
group may be termed as ”speculators.” They use market instruments to increase their profits
by preparing to take large risks if necessary and in the process might incur heavy losses. The
third group come under the category of ”arbitrageurs”. This group tries to find discrepancies
in the pricing of risks and adjust their portfolio to make profit without risks. Companies are
hedgers; banking institutions are a combination of speculators and arbitrageurs and private
investors are generally speculators.
Let us look at some possible methods for determining the price of a European call option.
Suppose the price of a stock (share price) today is Rupees 95 and we are interested in buying
a European call option on the stock with a ”strike price” of Rupees 200 and ”strike time”
5 years from today. How much should I pay today for purchasing this option? Suppose the
stock price will be Rupees 300 five years from today. If the option price today is fixed at a
price, say Rupees 150, more than the stock price today, then the seller of the option can buy
the stock from the market at a lower price of Rupees 95 and sell the option at 150 Rupees
and make a profit of Rupees 55 without any risk to him or her. It is clear that there is an
arbitrage opportunity for the seller if the option price today exceeds the stock price today
irrespective the price of the stock five years from today. Since we consider only those models
without arbitrage opportunities, it follows that option price should never exceed the stock
price on the day of purchase of option as otherwise there will be arbitrage opportunities.
There might be other reasons for an option seller to fix the option price at a particular level.
The person may want to have a good return on the average or bound the total amount that
might be lost or minimize the riskiness of the outcome or invest that much of an amount
today that will cover the cost of option payoff on the strike date or avoid mis-specifying the
risk. Any one of these actions might dictate the decision in fixing the option price for the
option seller. The first objective is that of a speculator while the others are those of hedgers
and arbitrageurs. The main aim of statisticians in finance is to find possible prices of options
and other market instruments in order to achieve the last four objectives as much as possible
under no arbitrage opportunity.
In order to build mathematical models for finance, we assume the following.
(i) Actions such as buying or selling of a stock do not affect the market price, that is, any

13
one can buy or sell any amount of a particular stock. This assumption in toto might not hold
in a free market since the demand and supply are closely related. If the demand increases,
then the price increases encouraging production and if the demand decreases, then the price
decreases discouraging production. Thus the action of buying or selling can affect the market
price. However, if the trading is in small quantities, the effect will be negligible.
(ii) We assume that there is enough liquidity in the market in the sense that one can buy or
sell at any time as much as we wish at the market price. This assumption is not fully valid,
for instance, in the foreign exchange market in India at the present time. Indian currency
is partly convertible at the present time. However the assumption holds in some commodity
markets. Buying and Selling by speculators and other traders increases the liquidity in the
market.
(iii) We assume that one can trade, that is , buy or sell, fractional quantities of assets. This
might not be possible for individual traders dealing in shares in small quantities but for
traders such as banks involved in foreign exchange transactions in millions of units, such an
assumption is valid.
(iv) We assume that there are no trading costs, that is, one can buy or sell without any
transaction cost. This is not true in any market as transactions do involve costs. Our
assumption simplifies the models.
(v) It is also assumed that ”shorting” is possible, that is one can have negative amount
of assets by selling assets which one does not hold (some times called ”go short”) at will.
Similarly buying an asset is called ”going long”. This is not possible in some countries.
These are the basic assumptions, in addition to the ”no arbitrage assumption”, under which
we will discuss methods of modelling in finance.

14

Chapter 2
PRESENT VALUE ANALYSIS
2.1 Present Value
What is meant by the value of an asset? It is obvious that if you have Rupees 1000 now,
then this amount, one year from now, will buy less than what it does today unless there is
no inflation, that is unless there is no price rise. The cost of an apartment today might be
much less than what it would cost next year because of a possible price rise in components
such as steel and cement for construction. Cars today will cost more in future than what
they cost today. The value of an asset depends at what time you are inquiring about it. If
the present value of a bond is Rupees 10,000, a year from now its value increases due to the
interest earned on Rupees 10,000 over a period of one year. The interest received on the bond
might be a simple or it might be compounded monthly or quarterly. We will now discuss
such concepts in this chapter.
Suppose I have an amount of P Rupees, called Principal here after and I will deposit in a
bank for a term period of T years. Suppose the bank pays me a simple interest at the rate
of r% per year. What would be the value of my term deposit (TD) at the end of one year?
It is obvious at the end of the first year, the value of the TD will be the principal plus the
interest accrued over a period of one year, that is, P + Pr = P (1 + r) Rupees. At the end
of the first year, we note that the value of the TD is P (1 + r) which will act as the principal
amount. At the end of the second year, the value of TD will be P (1 + r)(1 + r) = P (1 + r)2
15

16
Rupees. Proceeding in this way, we can show that the value of the term deposit at the end
of T years will be P (1 + r)T Rupees. Hence the value of an investment of Rupees P now is
P (1 + r)T Rupees at the end of T years if the rate of interest is simple and is r% per year.
Let us now look at the problem in another way. Suppose I want to invest in a term deposit
which pays me P Rupees at the end of one year if the rate of simple interest is r% per year.
How much money should I invest now in my term deposit? If I invest x Rupees now, then
its value will be x(1+ r) Rupees at the end of one year and this has to be equal to P Rupees
. Hence x = P1+r . In general, if the value of TD at the end of T years is to be P rupees when
the rate of simple interest is r% per year, then the initial investment x has to be P(1+r)T
and
this is called its present value.
Suppose we borrow an amount of P Rupees from a bank and it has to be repaid to the bank
after one year along with the interest due but the interest is calculated at the rate of r% per
year compounded half-yearly (also called semi-annually). Note that the interest rate for six
months or a half-year period is r2 . At the end of six months, the total amount to be paid is
P + P.r.12 = P (1 + r2) Rupees. This amount will be the principal for the amount to be paid
for the next six month period. Hence, at the end of one year, the total amount to be paid
will be P (1 + r2)(1 +
r2) = P (1 + r
2)2 Rupees. If the interest rate is compounded quarterly,
then the total amount to be paid at the end of one year is P (1 + r4)
4 Rupees as the year
consists of 4 quarters. If the interest rate is compounded monthly, then the total amount to
be paid is P (1 + r12)
12 Rupees.
Many credit card companies charge interest at a monthly rate of 1.5% or 2% on the unpaid
amount, that is at the rate of 18% or 24% per year compounded monthly. Suppose that the
rate is 18% per year compounded monthly. If the amount P is the unpaid amount at the
beginning of the year, then the amount to be paid to the credit card company at the end of
one year will be
P (1 +18
12
1
100)12 = (1.1956)P
rupees if no payment is made to the company during the year. If the rate of interest were
simple, then the total amount to be paid would have been (1.18)P rupees. Observe that,
if the interest rate r is compounded, then the amount of interest to be paid is greater than
the amount to be paid if the rate r was simple. In such case, we call the rate r the nominal

17
interest rate and we define the effective interest rate r by
r =Amount to be paid at the end of one year− P
P.
Note that the effective interest charged by the credit card company is 19.56% which was
much higher than 18% quoted by the company.
Let us again suppose that we have borrowed P rupees from a bank which has to be returned
to the bank at the end of one year. Suppose the bank charges an interest rate of r% per year
compounded at n equal intervals of time during the year. Following the same arguments as
given earlier, it is obvious that the total amount to be repaid will be
P (1 +r
n)n.
Let n→ ∞. In such a case, we say that the interest rate is compounded continuously. If the
interest rate is compounded continuously, then the total amount to be paid to the bank will
be limn→∞ P (1+ rn)n = Per. If the amount is to be paid along with the interest compounded
continuously at the end of T years, then the total amount to be paid will be PerT rupees.
From the discussion given above, If P rupees is the value of a TD at the end of T years
and the interest rate r is compounded continuously, then its present value is Pe−rT . If the
interest rate is compounded yearly, then its present value is P (1 + r)−T .
Example 2.1 : Suppose we have invested P rupees in a term deposit in a bank and the
rate of interest is r per year compounded yearly. For how many years , we should keep the
deposit in order that the maturity value of the deposit is thrice its present value?
Suppose T is the number of years needed for the maturity value of the TD to be 3P rupees.
Hence
3P = P (1 + r)T
Hence
T =log 3
log(1 + r).
Suppose that we can borrow as well as loan money at a nominal interest rate r% per year
compounded yearly. We would like to know what is the present value of an amount that will

18
give a payoff of P rupees at the end of n years. From the earlier discussions, it should be
P (1 + r)−n rupees.
Example 2.2 : Suppose that we have to receive payments in thousands of rupees at the
end of each of the next five years from three Banks A, B and C as given below. Suppose the
banks pay the same interest rate r% compounded yearly. Suppose the the possible interest
rates are 10%, 15% and 20%. Which of the payment sequence is preferable?
A : 13, 15, 17, 19, 20
B : 15, 15, 16, 16, 16
C : 19, 15, 13, 11, 10
If x1, x2, x3, x4, x5 is the sequence of payments by a company over the 5 year period, then
the present value of the sequence is
x11 + r
+x2
(1 + r)2+
x3(1 + r)3
+x4
(1 + r)4+
x5(1 + r)5
.
It is clear that we prefer that sequence of payments for which the present value is highest.
PRESENT VALUES OF PAYMENT SEQUENCES
r A B C
.10 62.38 58.92 53.16
.15 54.63 52.01 47.67
.20 48.29 46.32 43.10
From the table shown above, the sequence of payments given by Bank A should be preferred
in all the three cases.
Example 2.3 : Suppose a company would like to deposit an amount in a bank so that one
of its retired employees will get a pension of ai rupees at the end of the year i for the next
n years. How much money should the company deposit now? Obviously, this will depend
on the interest rate paid by the bank and the terms of interest rate payment. Suppose the

19
interest rate is compounded yearly. The sequence of payments is a = (a1, . . . , an). It can be
checked that the present value of the sequence a of payments is
PV (a) =a1
1 + r+
a2(1 + r)2
+ . . .+an
(1 + r)n
and the company has to deposit this amount PV (a) today, that is at time zero, in the bank.
This can be seen by the following reasoning. At the end of the first year, the total amount
with the bank will be
PV (a)(1 + r) = [a1
1 + r+
a2(1 + r)2
+ . . .+an
(1 + r)n](1 + r)
= a1 +a2
1 + r+ . . .+
an(1 + r)n−1
.
After the bank pays a pension of a1 rupees at the end of the first year, it will be left with an
amount ofa2
1 + r+
a2(1 + r)2
+ . . .+an
(1 + r)n−1
as deposit by the company at the end of first year. Repeating this process till the end of the
year n − 1, the bank will have a deposit an1+r of the company at the end of (n − 1)-th year.
At the end of n-th year, the employee will get a pension of an rupees from the company and
there will be no additional funds left for payment.
Example 2.4 : Suppose a person is interested in systematically depositing an amount of
X rupees in a bank at the beginning of every month for the the next 10 years. He or she
has decided to withdraw 10,000 Rupees at the beginning of each of the month for following
20 years. Suppose the bank pays a yearly interest rate of 12% compounded monthly. What
should be the value of X?
Note that the monthly interest rate paid by the bank is r = .1212 = .01. The present value of
all of the deposits made over 120 months is
X +X
1 + r+
X
(1 + r)2+ . . .+
X
(1 + r)119
= X +Xγ +Xγ2 + . . .+Xγ119
= X(1 + γ + γ2 + . . .+ γ119)
= X(1− γ120)
1− γ

20
where γ = (1+r)−1. Let Y be the amount withdrawn at the beginning of every month during
the following 20 years. Then the present value of all the withdrawals is
Y
(1 + r)120+
Y
(1 + r)121+ . . .+
Y
(1 + r)359
= Y (γ120 + γ121 + . . .+ γ359)
= Y γ120(1 + γ + . . .+ γ239)
= Y γ120(1− γ240)
1− γ.
Since there should be no funds for withdrawals from the account after 240 months of with-
drawals, it follows that
X(1− γ120)
1− γ= Y γ120
(1− γ240)
1− γ. (2.1. 1)
Since Y = 10, 000 and r = .01, we can find X from the above equation (FIND THE VALUE
OF X.) Thus a deposit of X rupees per month systematically in a bank for 120 months will
enable the person to withdraw Y rupees per moth for the following 240 months.
Example 2.5 : Suppose that (b1, b2, . . . , bn) and (c1, c2, . . . , cn) are possible cash flows from
two companies B and C respectively at the end of years 1 to n and the rate of interest is r
compounded yearly. Show that a sufficient condition for the present value of the cash flow
from the company B to be at least as large as that from the company C is bi ≥ ci, i = 1, . . . , n.
2.2 Continuous compounding with varying interest rate
We have looked at the present value analysis in case when the interest rate is simple or
compounded yearly or compounded continuously. In all these situations, we assumed that
the interest rate is constant over time. Suppose the interest rate is continuously compounded
with a rate that is changing over time. Let us denote the time now to be t = 0. and let r(t)
be the rate at time t. If x is the deposit in the account with the bank at time s, then the
total amount with the bank at time s+h is x+x.r(s).h for small time period h. The function
r(s) is called the spot rate at time s. Let D(t) be the amount in the account at the time t for
an initial deposit x = 1 made at time t = 0. Then, for h small,
D(s+ h) ≃ D(s) +D(s).r(s).h
= D(s)(1 + r(s)h)

21
HenceD(s+ h)−D(s)
h≃ D(s) r(s)
for h small. Let h→ 0. Then we have
D′(s) = D(s) r(s), D(0) = 1
where the function D′(s) is the derivative of the function D(s) with respect to s. Solving this
differential equation, it follows that
D(t) = e∫ t0 r(s)ds.
Suppose P (t) denotes the present value (that is at time t = 0) of an amount equal to one
rupee to be received at time t. Since a deposit of 1D(t) at time t = 0 will be worth 1 rupee at
time t, it follows that
P (t) =1
D(t)= e−
∫ t0 r(s)ds. (2.2. 1)
Let r(t) denote the average of the spot interest rate up to time t, that is,
r(t) =1
t
∫ t
0r(s)ds. (2.2. 2)
The function r(t) is called the yield curve. The function P (t) is called the present value
function. Note that, if r(t) = r for all t, then r(t) = r for all t.
2.3 Returns
Let us consider an investment of Rupees x > 0 in a company A which fetches a return of y
Rupees after one period, say, an year. Then the rate of return r of the investment is defined
to be that value r such that the present value of the return y after one year is equal to x the
amount invested now, that is, y1+r = x or equivalently x(1 + r) = y. Therefore
r =y − x
x.
If the return y ≥ 0, then the rate of return r ≥ −1. Let us now look at the returns from the
company A at the end of n consecutive time periods, say, at the end of over n years. Let yi
be the return at the end of i-th year. The flow of returns is y = (y1, . . . , yn) over n years.
Suppose r is the rate of interest compounded yearly. Then the present value of the cash flow
y of returns is
PV ((y) =y1
1 + r+ . . .+
yn(1 + r)n
.

22
and the return P (r) at the end of n years is
P (r) =y1
1 + r+ . . .+
yn(1 + r)n
− x.
The effective or internal rate of return over n time periods, that is, over n years here,
is defined to be that value of r∗ such that P (r∗) = 0. Note that x > 0. Assuming that
yi ≥ 0, 1 ≤ i ≤ n − 1 and yn > 0, it can be checked that the function P (r) is a strictly
decreasing convex function in r. Furthermore
P (r) → ∞ as r → −1 (2.3. 1)
and
P (r) → −x < 0 as r → ∞. (2.3. 2)
Hence there exists a unique value r∗ such that P (r∗) = 0. Note that
P (0) = y1 + . . .+ yn − x. (2.3. 3)
It is easy to see that r∗ > 0 if P (0) > 0, that is, y1+ . . .+ yn > x. Hence the effective rate of
return is positive if the total cash flow over the n years is more than the initial investment.
If P (0) < 0, that is, y1+ . . .+ yn < x, then r∗ < 0. Since the function P (r) is decreasing as a
function of r, the cash flow sequence (y1, . . . , yn) will have a present value if the interest rate
r is less than r∗, and a negative present value if the interest rate r is greater than r∗.

23
r* r
P(r)
Figure: 2.2.1: Graph of the function P(r) versus r for the case P(0) > 0

24
r* r
P(r)
Figure: 2.2.2 : Graph of the function P(r) versus r for the case P(0) < 0

25
Note that the return on an asset such as a stock, during a specified holding period, is the
ratio of change in prices to the initial price during the period, that is, if Pt is the price of a
stock at time t, and the stock was held during the time t− 1 to time t, then the return is
Rt =Pt − Pt−1
Pt−1
assuming that no dividend was paid by the company during the period [t−1, t]. It is obvious
that Rt may take negative values but Rt ≥ −1 since Pt is nonnegative for all t ≥ 0. The
function Rt is also called ”net return” of the stock at time t and the function
PtPt−1
= 1 +Rt
is called ”gross return” of the stock at time t. Returns at the time t are independent of the
units of measurement such as rupees or any other unit used for pricing the stocks but they
depend on the time t of measurement. Let
rt = logPtPt−1
= log(1 +Rt).
This function is called the ”log return” of the stock at the the time t. If Rt is small, then the
net return Rt and the log return rt are almost the same.
Let us now look at the net return Rt(k) of a stock at the time t, starting from k units of
time before the time t, defined by
Rt(k) =Pt − Pt−kPt−k
.
Then, for t ≥ k,
1 +Rt(k) =PtPt−1
.Pt−1
Pt−2. . . . .
Pt−k+1
Pt−k
= (1 +Rt)(1 +Rt−1) . . . (1 +Rt−k+1)
and hence
log(1 +Rt(k)) = log(1 +Rt) + log(1 +Rt−1) + . . .+ log(1 +Rt−k+1).
Let rt(k) = log(1 + Rt(k)) be the ”log return” of a stock at time t, starting from k units of
time before time t. From the elementary property of the logarithmic function, check that
rt(k) = rt + rt−1 + . . .+ rt−k+1.

26
Hence the log return over k periods before time t, that is over the time period [t− k, t] is the
sum of log returns over the periods [t− k, t− k + 1], [t− k + 1, t− k + 2], . . . , [t− 1, t]. This
shows the ”additivity” property of the function ”log returns”.
If a dividend Dt is paid by thee company at time t, then the definition of net return Rt is
changed to
Rt =Pt +Dt − Pt−1
Pt−1
to make an adjustment for the dividend payout. Similar changes are made over the definition
of return Rt(k) over k periods:
1 +Rt(k) =Pt +Dt
Pt−1.Pt−1 +Dt−1
Pt−2. . . . .
Pt−k+1 +Dt−k+1
Pt−k.
For simplicity in modelling, we assume hereafter that there is no dividend payout at any time
during the holding period of the stock.
An important problem is to model the probability distribution of the sequence of returns
R1, R2, . . . of a stock over consecutive equal periods of time. From our earlier discussion,
these are random variables possibly neither independent nor identically distributed and they
take values in the interval [−1,∞). Hence they cannot be modelled by Gaussian random
variables. However the log returns r1, r2, . . . take values in the real line and they satisfy the
additivity property as we mentioned earlier. As the support of a Gaussian distribution is the
real line and the sum of independent Gaussian random variables is also a Gaussian random
variable, we can suppose that the log returns are independent and identically distributed
(i.i.d) Gaussian random variables with some mean µ and some variance σ2.
Suppose that log returns r1, r2, . . . are i.i.d. Gaussian random variables with mean µ and
variance σ2. Hereafter we denote such a probability distribution as N(0, σ2). Then the log
return rt(k) over the period [t− k, t] is given by
rt(k) = rt + rt−1 + . . .+ rt−k+1.
As the term on the right side of the above equation is the sum of k i.i.d. Gaussian random
variables with mean µ and variance σ2, it follows that the probability distribution of rt(k) is
N(kµ, kσ2). Hence, for any x > 0,
P (1 +Rt(k) ≤ x) = P (rt(k) ≤ log x)

27
= P (rt(k)− kµ√
kσ≤ log x− kµ√
kσ)
= P (Z ≤ c)
where Z is the standard Gaussian random variable and
c =log x− kµ√
kσ.
2.4 Log-normal Distribution
A positive random variable X is said to have the log-normal distribution if the random
variable Y = logX has the normal distribution. Suppose the random variable Y has a
normal distribution with mean µ and variance σ2. We now discuss some properties of the
log-normal distribution. Observe that
µX ≡ E(X) = E(eY ) = eµ+12σ2
from the fact that the moment generating function MY (t) of a random variable with distri-
bution N(µ, σ2) is given by
MY (t) = E[etY ] = etµ+12t2σ2
.
Furthermore
σ2X ≡ var(X) = E(X2)− [E(X)]2 = E(e2Y )− [E(eY )]2
= MY (2)− [MY (1)]2
= e2µ+2σ2 − (eµ+12σ2)2
= e2µ+2σ2 − e2µ+σ2
= e2µ+σ2[eσ
2 − 1].
It is known that the log-normal distribution is a heavy tailed distribution and is asymmetric.
A measure of skewness of a random variable X is
E(X −E(X))3
[V ar(X)]3/2
whenever it exists. The skewness does not depend on the location or scale parameter.If
the distribution is symmetric, then the skewness is zero. If the skewness is positive, then

28
it indicates that the distribution has a heavy right tail as compared to the left tail and
if the skewness is negative, then the distribution has a heavy left tail as compared to the
right tail. The left tail of a distribution is the region (−∞, µX − 2σX) and the right tail
is the region (µX + 2σX ,+∞). Distributions with high tail probabilities compared to the
Gaussian distribution with the same mean and variance are called heavy tailed. Heavy-tailed
distributions are suitable for modelling in finance as the stock return distributions have been
observed to have heavy tails. We leave it to the reader to check that the skewness of the
log-normal distribution with parameters µ and σ2 is
(eσ2+ 2)(eσ
2 − 1)1/2.
From the representation of the random variable log(1 + Rt(k)) which is the log-return over
over k consecutive periods, we get that log(1+Rt(k)) has the normal distribution with mean
kµ and variance kσ2. Hence the skewness of the return Rt(k)(or equivalently of 1+Rt(k)) is
[ekσ2+ 2](ekσ
2 − 1)1/2.
which is positive and increases to infinity rapidly as k → ∞. Hence if the log returns over
one period are normally distributed, then the distribution of returns, when the stock is held
over a long period, is highly skewed.
There are different methods to check whether a log-normal distribution is a good-fit for the
distribution of the log-returns. One method is to look at the corresponding normal probability
plot. The normal probability plot is a graph of the sample quantiles against the quantiles
of the standard normal distribution. If the plot ia almost a straight line, then it indicates
that the sample of log-returns is likely to be from a normal distribution. Another way to
check normality is by computing the skewness and kurtosis of the log-returns. Recall that
the kurtosis of any random variable X is
E(X − E(X))4
[V ar(X)]2.
For a normal distribution, skewness is equal to zero and kurtosis is equal to three. We might
caution that the skewness and the kurtosis of a distribution are very sensitive to outliers
if any in the data. Other tests such as Kolmogorov-Smirnov test or Chi-square test for
goodness-of-fit can be used to test normality of the distribution of log-returns.

29
2.5 Random walk
We have seen in the last section that a suitable model for the distribution of the log-returns
is the log-normal distribution and the log-returns over consecutive k-periods is the sum of
the log-returns over the individual periods. This is an example of random walk model.
Suppose Zi, i ≥ 1 are independent and identically distributed (i.i.d.) random variables with
mean µ and variance σ2. Let S0 be another random variable independent of the sequence
Zi, i ≥ 1. Let
Sn = S0 + Z1 + . . .+ Zn, n ≥ 1.
The stochastic process Sn, n ≥ 1 is called a random walk. It is easy to see that
E(Sn|S0) = S0 + E[Z1|S0] + . . .+ E[Zn|S0]
= S0 + E[Z1] + . . .+E[Zn]
= S0 + nµ.
The second equality follows from the fact the sequence Zi, i ≥ 1 is independent of the
random variable S0. Similarly
var(Sk|S0) = var(S0 + Z1 + . . .+ Zn|S0)
= var(Z1 + . . . Zn|S0)
= var(Z1 + . . .+ Zn)
= nσ2.
The sequence Sn, n ≥ 0 may be interpreted as the the sequence of stock prices or share
prices with Sk as the price at time k with S0 as the i price. The parameter µ is called the
drift which indicates the trend in the stock prices and the parameter σ is called the volatility
indicating the fluctuations from the average price. Volatility is a measure of how much the
random walk fluctuates from the drift or trend µ. For a stock broker, the drift µ of a stock
price is not the main issue as he is or she is aware of the same from the past information
but the volatility σ is. If the volatility is high, there is a likelihood of heavy gains or heavy
losses due to large fluctuations in the stock prices. Suppose the drift µ and the volatility σ
are known or can be estimated.

30
If the sequence Zn, n ≥ 1 is an i.i.d. N(µ, σ2) sequence of random variables, then
P (S0 + nµ−√nσ ≤ Sn ≤ S0 + nµ+
√nσ) = P (−
√nσ ≤ Sn − (S0 + nµ) ≤ +
√nσ)
= P (−1 ≤ Sn − (S0 + nµ)√nσ
≤ 1)
= P (−1 ≤ Z ≤ 1) (say)
= 0.6826
as the random variable Z has the standard normal distribution under the model. This
indicates the probability that the stock price at time n lies between S0 + nµ −√nσ and
S0+nµ+√nσ is about 69%. The important and basic problem is to obtain ”good” estimators
of the volatility parameter.
Recall that the log-return over k consecutive periods before time t is
rt(k) = rt + rt−1 + . . .+ rt−k+1
where rt, rt−1, . . . , rt−k+1 can possibly be considered as i.i.d. random variables. Let Pt denote
the stock price at time t. Then the return over consecutive k periods before time t, is
Rt(k) =Pt − Pt−kPt−k
=PtPt−k
− 1
and
PtPt−k
= 1 +Rt(k)
= ert(k)
= ert+...+rt−k+1 .
Let k = t. The relation derived above shows that
PtP0
= ert+...+r1
or
logPt = logP0 + rt + . . .+ r1.
This shows that the process logPt, t ≥ 0 can be considered as a random walk. Then the
process Pt, t ≥ 0 is called a geometric random walk. Under this model, the changes in the
stock prices in future are independent of the past and hence not predictable.

31
Let us assume that the distribution of the log-returns is N(µ, σ2) independent of the initial
price P0. Under this model, let us compute the mean and variance of the stock price Pt given
that the initial price of the stock is P0. Then
E(Pt|P0) = E(P0er1+...+rt |P0)
= P0 E(er1+...+rt |P0)
= P0 E(er1+...+rt)
= P0 E(er1) . . . E(ert)
= P0 [eµ+ 1
2σ2]t
= P0 [etµ+ 1
2tσ2
]
and
var(Pt|P0) = var(P0er1+...+rt |P0)
= P 20 var(e
r1+...+rt |P0).
The last term can be computed from the properties of the log-normal distribution. Check that
the conditional distribution of the random variable Pt given P0 is log-normal with parameters
logP0 and tσ2. Under this model, check that the median price of the stock at the end of t
periods is P0 etµ and the mean price is P0 e
tµ+tσ2
2 .

32

Chapter 3
OPTION PRICING AND
BINOMIAL TREE MODEL
3.1 Inroduction
Let us look at the energy needs of India. India can take care of its energy needs partially
from its own oil resources but still needs to import oil to take care of all of the essential
requirements such as transport and power generation. Since the country might be possibly
dependent on external sources which are not in its control, it should make decisions or
planning well in advance for such needs. The price of oil at a point of time depends on the
demands from several countries which need it and would like to purchase and the production
by the countries which can supply the oil. It is obvious that as the demand for oil increases
so does the price per barrel of oil; the higher the need for oil, the larger the payment to be
made for the same to the country which supplies the oil. If India can find a method or option
to control its expenditure on import of oil, then it is an advantageous position as far as the
energy requirements are concerned. This leads to the idea of options.
There are several types of option mechanisms or products available for purchase. An option
gives one the right, but not obligation, to buy or sell a specified number of shares of a stock
at a special price called the exercise price or the strike price on or before a specified future
date called the date of maturity or strike date or expiration date or exercise date. The option
33

34
is called a call option if the option is to buy a stock and it is called a put option if the option
is to sell a stock.
A European call option gives a person the right, but not obligation, to purchase a specified
number of shares of a stock at a specified rate called the strike price on a specified date called
the date of maturity. It is called a European put option if it gives a person the right, but not
obligation, to sell a specified number of shares of a stock at a specified rate called the strike
price on a specified date called the date of maturity. There are other types of options such
as an American call option and an American put option. An American call option gives a
person the right, but not obligation, to purchase a specified number of shares of a stock at a
specified rate called the strike price on or before a specified date called the date of maturity.
It is called a American put option if it gives a person the right, but not obligation, to sell a
specified number of shares of a stock at a specified rate called the strike price on or before a
specified date called the date of maturity. We will concentrate on ideas connecting European
call and put options in this book. We will explain the differences between the two types of
options later in this chapter. In order to purchase such options, a price has to be paid called
the option price. How do we determine, for instance, the price of an European call option,
given the strike price and strike date?
Let us consider the following scenario. Suppose that we have purchased a European call
option for 100 shares of stock A with an exercise price of Rupees 80 per share and the expiry
date six months or one half year from today. On the expiration date, suppose the stock is
selling at Rupees 85 per share. The option allows us to purchase 100 shares for Rupees 80
each on the date of expiry and immediately sell them on the same day for Rupees 85 each
at the market price and there by make a gross profit of Rupees 5 per share for 100 shares,
that is, a profit of Rupees 500. Since we have to pay a price or a premium for purchasing
the option, the net profit on the date of expiry of option is not Rupees 500. If we have
paid Rupees 3 per share for purchasing the option, then the cost of purchase of option to
buy 100 shares will be Rupees 300. Suppose the interest rate is 10% per year compounded
continuously. The interest rate will be 5% for a period of 6 months compounded continuously
and the present value (today’s value) of the net profit will be
e−.05(500)− 300

35
and its value on the date of expiry of the option is
500− (300)e.05.
Note that a call option is never exercised if the strike price is larger than the stock price on
the date of expiry. This is obvious since exercising the option leads to purchase of the stock
at a price higher than the strike price and the option holder will incur loss. If a call is not
exercised, then the option holder might still loose some money due to the cost involved in the
purchase of the option. It is possible that one can still loose money on an option even if it is
exercised since the amount gained by exercising the option might be less than the premium
or the price paid for purchasing the option.
Let St be the stock price or share price of a stock at the time t. Let K be the exercise price
and T be the expiry time for a European call option. If ST ≥ K, the we exercise our option
and buy the stock at a price of K per share and then sell the stock immediately on the same
day to make a gross profit of ST − K per share. If ST < K, then we do not exercise the
option and no profit is made. Let x+ = x if x ≥ 0 and x+ = 0 if x < 0. Note that
(ST −K)+ = ST −K if ST ≥ K
= 0 if St < K.
and the profit to be made on the date of expiry is (ST − K)+. If r is the interest rate
compounded continuously, then the present value of the profit (ST −K)+ is
e−rT (ST −K)+.
Since we do not wish to incur loss by purchasing the option, the cost of the option or the
option price C should be E[e−rT (ST −K)+] and hence
C = E[e−rT (ST −K)+]
where the expectation is computed with respect to a suitable probability measure under the
no arbitrage assumption and assuming that the trading plan is self-financing.

36
A trading plan or strategy is said to be self-financing if it requires no investment from
outside sources other than the initial investment and if it allows no withdrawals. After the
initial investment, additional purchase of assets are made from the sales of other assets or
by borrowing and the proceeds of any sale of an asset is always reinvested. Recall that an
arbitrage opportunity indicates that one can make a guaranteed risk-free profit by trading
in the market. We call the price of a market instrument, such as an option, as the arbitrage
price of the option if it is the price which guarantees no arbitrage opportunities under the
self-financing plan.
We assume that our trading is self-financing with no arbitrage opportunities. This leads to
an important law known as the law of one price.
The law of one price: If two financial instruments have the same payoffs, then they
should have the same price.
The law of one price will be used to find the option prices. To find the value of an option, we
will construct a portfolio or self-financing plan with a known price that has exactly the same
payoff as the option. Then, by the law of one price, the price of the option should be the
same as the price of the portfolio under the self-financing plan with no arbitrage opportunity.
Suppose that one share of company is selling at Rupees 100 today and we want to buy a
future contract which allows us to buy one share of the company at a price p after one year.
Suppose the interest rate of borrowing from a bank is 10% compounded annually. The value
of the share after one year will be Rupees 110. Unlike an option, the sale must take place at
the end of the year under a future contract and the profit or loss will be p− 110. If p = 110,
then there is an arbitrage opportunity either for the seller or for the buyer and there is risk-
free profit for one of them. Since we assumed that there are no arbitrage opportunities, it
follows that p = 110.

37
3.2 One-step Binomial Model
In order to illustrate the ideas behind fixing the option price, let us consider the following
model. Suppose that a stock is selling today for Rupees 80 and at the end of one year from
now, the stock price either moves up to Rupees 100 or goes down to Rupees 60. What should
be the price of an European call option if the strike price for one share is Rupees 80 and the
strike date is one year from now?

38
80
(t = 0)
100
(t = 1)
60
(t = 1)
Figure 3.2.1 : Stock prices

39
? (t = 0)
20
(t = 1)
0
(t = 1)
Figure 3.2.2 : Option payoffs
40
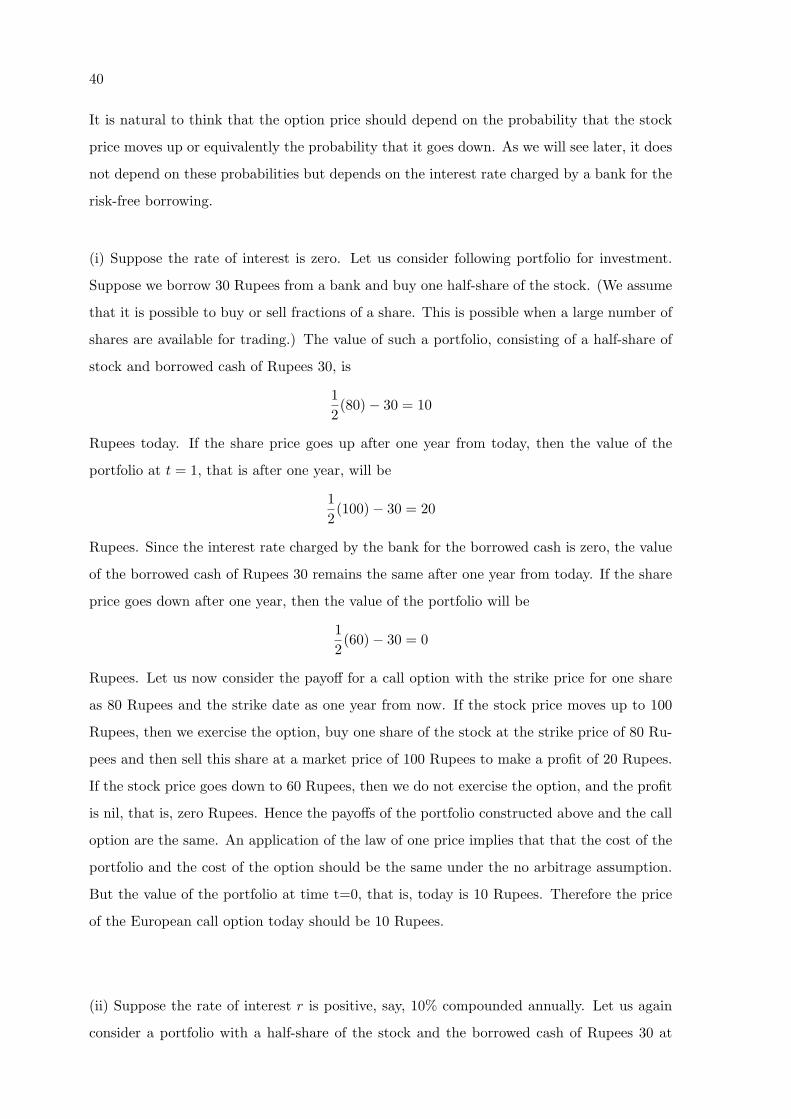
It is natural to think that the option price should depend on the probability that the stock
price moves up or equivalently the probability that it goes down. As we will see later, it does
not depend on these probabilities but depends on the interest rate charged by a bank for the
risk-free borrowing.
(i) Suppose the rate of interest is zero. Let us consider following portfolio for investment.
Suppose we borrow 30 Rupees from a bank and buy one half-share of the stock. (We assume
that it is possible to buy or sell fractions of a share. This is possible when a large number of
shares are available for trading.) The value of such a portfolio, consisting of a half-share of
stock and borrowed cash of Rupees 30, is
1
2(80)− 30 = 10
Rupees today. If the share price goes up after one year from today, then the value of the
portfolio at t = 1, that is after one year, will be
1
2(100)− 30 = 20
Rupees. Since the interest rate charged by the bank for the borrowed cash is zero, the value
of the borrowed cash of Rupees 30 remains the same after one year from today. If the share
price goes down after one year, then the value of the portfolio will be
1
2(60)− 30 = 0
Rupees. Let us now consider the payoff for a call option with the strike price for one share
as 80 Rupees and the strike date as one year from now. If the stock price moves up to 100
Rupees, then we exercise the option, buy one share of the stock at the strike price of 80 Ru-
pees and then sell this share at a market price of 100 Rupees to make a profit of 20 Rupees.
If the stock price goes down to 60 Rupees, then we do not exercise the option, and the profit
is nil, that is, zero Rupees. Hence the payoffs of the portfolio constructed above and the call
option are the same. An application of the law of one price implies that that the cost of the
portfolio and the cost of the option should be the same under the no arbitrage assumption.
But the value of the portfolio at time t=0, that is, today is 10 Rupees. Therefore the price
of the European call option today should be 10 Rupees.
(ii) Suppose the rate of interest r is positive, say, 10% compounded annually. Let us again
consider a portfolio with a half-share of the stock and the borrowed cash of Rupees 30 at

41
time t = 1 , that is at the end of one year. The value of this portfolio at time t = 1 is Rupees
1
2(100)− 30 = 20
if the stock price goes up and it is
1
2(60)− 30 = 0
if the stock price goes down. Since the payoff of this portfolio and the value of the option at
time t = 1 are the same, it follows the option price at time t = 0 should be the same as the
value of the portfolio at time t = 0. Since the present value, the value at time t = 0, of 30
Rupees available at t = 1, is Rupees
30
1 + r=
30
1 + (0.1)= 27.27,
the value of the portfolio consisting of half-share of stock and borrowed cash worth Rupees
27.27, is1
2(80)− 27.27 = 12.73.
Hence the option price for an European call option today should be Rupees 12.73 in this
example.
Observe that the option price is higher when the interest rate is positive than when the
interest rate is zero.
Let us look at the way we have constructed the portfolio described above. We have con-
structed the portfolio so that the volatility in the value of the option is the same as the
volatility in the value of the stock prices. The value of the option is 20 Rupees if the stock
price goes up and it is zero if the stock price goes down. Hence the volatility in the option is
20 Rupees. The stock price is 100 Rupees if it goes up and it is 60 Rupees if it goes down and
hence the volatility in the stock price is 40 Rupees. The ratio of the volatility in the option
and the volatility in the stock is called hedge ratio and it is equal to 12 in this example. If
this is the number of shares in the stock (fractional shares are allowed), then the volatilities
of the stock and the option match. If the stock price goes down, then the portfolio is worth
Rupees 12(60) minus the amount borrowed at t = 1, and the value of the option at t = 1 is
zero. Since these two should match, the amount borrowed should be 30 Rupees at t = 1.
In order to compute the option price under no arbitrage assumption, we must consider a
portfolio with the number of shares equal to hedge ratio and the cash to be borrowed is

42
obtained by equating the value of the portfolio when the stock price goes down to the value
of the option when the stock price goes down.
Let us now look at how to price one-step binomial option in the general case. Suppose the
initial price of the stock is s1 and the price either goes up to s3 in one year from now or goes
down to s2 in one year from now. Suppose further we are interested in pricing the European
call option for which the exercise price is K and time of maturity is one year from now.
Further suppose that the risk-free interest rate is r per cent compounded continuously. It is
clear that s2 < s3. If K ≤ s2 < s3, then the option will always be exercised and it is not
an option but a future contract and the profit or the value of the European call option at
t = 1 will be either s2 −K or s3 −K depending on whether the stock price goes up or goes
down respectively. If s2 < s3 ≤ K, then the option will never be exercised and it is worthless
and the value of the option at t = 1 will always be zero. Hence the only interesting case for
pricing the European call option is when s2 < K < s3.

43
s1 (t = 0)
s3 (t = 1)
s2 (t = 1)
Figure 3.2.3 : Stock prices

44
? (t = 0)
S3 - K (t = 1)
0
(t = 1)
Figure 3.2.4 : Option payoffs

45
In this case, volatility of the stock is s3− s2 and the volatility of the option is (s3−K)− 0 =
s3 −K. In order that these volatilities match, the hedge ratio δ should be given by
δ =s3 −K
s3 − s2.
Let us consider a portfolio with δ shares and borrowed amount δs21+r at time t = 0. The value
of this portfolio at time t = 1, is
δs3 −δs21 + r
(1 + r) = s3 −K
if the stock price goes up to s3 and it is
δs2 −δs21 + r
(1 + r) = 0
if the stock price goes down to s2. These payoffs match with the payoffs from the European
call option since the value of the option at the time of maturity t = 1 is s3 −K if the stock
price goes up and it is zero if the stock price goes down to s2. Hence, by the law of one price,
the European call option price at t = 0 should be the same as the value of the portfolio at
time t = 0 which is
δs1 −δs21 + r
= δ(s1 −s2
1 + r)
=s3 −K
s3 − s2[s1 −
s21 + r
].
Suppose the interest rate r is compounded continuously and the strike time is T. If s3 is the
stock price at time T if the stock price goes up and if it is s2 if the price goes down at time
T, then a similar analysis shows that the European call option price at time t = 0 should be
s3 −K
s3 − s2[s1 −
s2erT
].
3.3 Two-step Binomial Model
A one-step Binomial model for movement of stock prices is not a realistic model for modelling
stock prices which fluctuate or move up and down often in a short time. It is a useful model
for understanding the problem and for studying those stocks with stock prices with shorter
maturities. For those with longer maturities, we should look at multi-step Binomial model.

46
Let us again first look at a two-step Binomial model by analyzing the individual steps going
backwards in time.
Let us consider a two-step Binomial model. Consider a European call option which matures
say after two steps (say two years). Suppose the initial price of the stock is 80 Rupees, that
is, the stock price at time t = 0. Suppose that, at the end of each step (say one year), the
stock price either goes up by 10 Rupees or goes down by 10 Rupees. Further suppose that
the rate of interest r = 0. Let us consider a European call option with exercise price K = 80
rupees and exercise time T at the end of two steps (two years) from now. We would like to
find the option price for such a European call option.

47
80
(t = 0)
100
(t = 2)
60
(t = 2)
Figure 3.3.1 : Stock prices
90
(t = 1)
70
(t = 1)
80
(t = 2)

48
?
(t = 0)
20
( D )
(t = 2)
0
( F )
(t = 2)
Figure 3.3.2 : Option payoffs
(t = 1)
(t = 1)
0
( E )
(t = 2) ( A )
( B )
( C )

49
( A )
(t = 0)
20
( D )
0
( F )
Figure 3.3.3 : Portfolio values
(10)
( 0 )
0
( E )
( B )
( C )

50
In order that the volatilities of the option and the volatilities in stock match at the exercise
time of two years from now, it is necessary that the hedge ratio δ at the node (B) in the
graph in Figure 3.3.2. should be given by
δ =20− 0
100− 80= 1.
Hence, if we own a portfolio with one share and borrow an amount equal to
δs21 + r
=(1)(80)
1 + 0= 80
Rupees, then the values of the portfolio at the nodes (D) and (E) match with the values of
the option of 20 Rupees at the node (D) and zero Rupees at the node (E) respectively. At
the node (B), the net worth of portfolio with one share of stock and borrowed amount of 80
Rupees is
90− 80 = 10
Rupees. Hence, by the law of one price, the option cost at the node (B) should be 10 Rupees.
Similarly, check that the hedge ratio at the node (C) should be zero and hence we should
have no shares in stock and no borrowing. Hence the portfolio at the node (C) is worth nil
and its values at the nodes (E) and (F) is zero matching with the values of the option. Hence,
by the law of one price, the cost of the option at the node (C) should be zero. Hence, at the
end of the first step, the option is worth 10 Rupees if the stock price goes up (at the node
(B)) and it should be zero Rupees if the stock price goes down (at node (C)). Note that the
stock price is 90 Rupees at the node (B) if the price goes up and it is 70 Rupees at the node
(C) if it goes down. Hence the volatility of the option is
10− 0 = 10
and the volatility of the stock is
90− 70 = 20.
These again will match with the values of the option at t = 1, if we have a portfolio initially
with δ shares where δ is the hedge ratio
δ =10− 0
90− 70=
1
2
and borrowed cash equal toδs21 + r
==12(70)
1 + 0= 35
Rupees. Such a portfolio is worth1
2(80)− 35 = 5

51
Rupees. Hence, by the law of one price, the price of the option at time t = 0 should be
Rupees 5. Note that the trading plans we adopted are self-financing.
The graph in Figure 3.3.1. is a recombinant graph as the price fluctuations are equal when
the stock price goes up or when it goes down at any step. If these are not equal, then the
corresponding graph will have many more nodes and it is not recombinant.
From the above discussion, we note that the price of an option is determined by the require-
ment that the market is arbitrage-free and the trading is self-financing. It does not depend
on the probability for the stock to go up or for the probability to come down. The main point
we have noted is that the option payoff must be of the same value as that of the portfolio we
constructed. However it can be proved that there exist probabilities of the stock going up
or coming down such that the price of the option is equal to the discounted expected value
of the option according to these probabilities. Discounting is done according to the interest
charged for risk-free asset. These probabilities are not the “true” probabilities of the stock
going up or coming down but they are useful for computation of the option price. Such a
probability measure will be called risk-neutral probability measure.
Let us again consider the one-step Binomial model discussed earlier when the interest rate
is r. Lat us denote the present time, that is now, as t = 0 and one-step ahead time as t = 1.
if the value of an asset is m Rupees at time t = 1, then its present value, that is, value now,
that is at time t = 0, is m1+r . Consider a European call option with the date of maturity as
t = 1 and the exercise price K. Suppose the share price is s1 at time t = 0, and it moves up
to s3 or moves down to s2 at time t = 1. Note that the value of the European call option
at exercise time t = 1, is f(3) = s3 − K if the stock price moves up and it is f(2) = 0 if
the stock price goes down. Let q be the “risk- neutral probability” that the present value of
the option is f(3)1+r if the stock price goes up and 1 − q will be the “risk-neutral probability”
that the present value of the option is f(2)1+r if the stock price goes down. Hence the present
value of the expected payoff of the option at time t = 1 under the “risk-neutral probability
measure” is
qf(3)
1 + r+ (1− q)
f(2)
1 + r.
In order to calculate q, we equate the above expression to the option price derived earlier in

52
the one-step binomial model. Hence
qf(3)
1 + r+ (1− q)
f(2)
1 + r=s3 −K
s3 − s2[s1 −
s21 + r
].
Observing that f(2) = 0 and f(3) = s3 −K, we get that
q =(1 + r)s1 − s2
s3 − s2.
Note that the risk-neutral probability q does not depend on the strike price K and it is
between 0 and 1 if and only if s2 ≤ (1+r)s1 ≤ s3. This condition is implied by the assumption
that we are dealing with arbitrage-free market behaviour.
3.4 General Binomial Tree Model
Let us now consider a multi-step Binomial model also termed as General Binomial tree model.
Let the time elapsed between one step and the next step be denoted by ∆t. At each step,
the stock price either goes up or comes down.

53
S1
Figure 3.4.1 : Stock prices
S3
S2
S4
S5
S6
S7

54
1
f (1)
Figure 3.4.2 : Option payoffs
3
f (3)
2
f (2)
4
f (4)
5
f (5)
6
f (6)
7
f (7)
q1
1- q1
q3
q2
1- q3
1- q2

55
Suppose the interest rate r is compounded continuously. Let us denote the node at the second
step if the stock price goes down by (2) and if it goes up (3). At the third step, denote the
nodes by (4),(5), (6) and (7) as in the Figure 3.4.2. Note that the nodes (5) and (6) need not
coincide as the tree could be nonrecombinant tree. Suppose that at the j-th node, the stock
is worth sj and the option is worth f(j). Observe that, at the j-th node, the stock either
goes up leading to 2j + 1-th node or the stock price goes down leading to 2j-th node after
one step (one time unit or tick denote by ∆t.) Let qj be the risk-neutral probability at the
node j that the stock moves up to the node 2j + 1. The expected value of the option under
risk-neutral probabilities qj and 1− qj is
qjf(2j + 1) + (1− qj)f(2j)
and the discounted value of this amount at node j is
f(j) = e−r∆t[qjf(2j + 1) + (1− qj)f(2j)].
From the earlier computations,
qj =er∆tsj − s2js2j+1 − s2j
. (3.4. 1)
For the payoffs of the option and of the portfolio to match, it is necessary that the number
of shares to hold at j-th node or the hedge ratio at the j-th node should be
ϕj =f(2j + 1)− f(2j)
s2j+1 − s2j
and the amount to hold in the risk-free asset should be ψj (say) to be chosen later appropri-
ately. Note that ψj ≤ 0 as it is a borrowed amount. Since the portfolio at the node j and
the option at the node j should have the same value by the law of one price, it follows that
f(j) = sjϕj + ψj
which implies that
ψj = f(j)− sjϕj .
Note that the value of the amount ψj after one step of time unit ∆t is
er∆t(fj − sjϕj).
Let Pt denote the stock price at the end of t-th step. Then the present value or the discounted
price corresponding to the stock price Pt at time t is
P ∗t = e−rt∆tPt.

56
Let us now compute the expected value of Pt+1 given that Pt = sj under the risk-neutral
probabilities qj , j ≥ 1. Then
E(Pt+1|Pt = sj) = qjs2j+1 + (1− qj)s2j
= s2j + qj(s2j+1 − s2j)
= s2j + (er∆tsj − s2j) (by (4.1))
= er∆tsj .
Hence
E(Pt+1|Pt) = er∆tPt
which implies that
E(P ∗t+1|P ∗
t ) = P ∗t .
This shows that the discounted process P ∗t , t ≥ 1 is a martingale under the risk-neutral
probabilities qi, i ≥ 1. The measure qi, i ≥ 1 is also called the martingale measure, the
risk-neutral measure or the pricing measure.
We have discussed Binomial one-step and two-step models to explain the concepts of self-
financing strategy, hedging and arbitrage pricing. However these models do not represent
the stock market behaviour as the stock prices change continuously quite often in a literal
sense not necessarily in mathematical sense. There could be jumps in their behaviour. In
order study models for such a phenomenon, we should build Binomial models with increasing
number of steps such that the step size shrinks. In order to explain these ideas, let us now
consider a three-step Binomial tree.
Three-step Binomial tree:

57
100
( t = 0)
90
( t = 1)
110
( t = 1)
120
( t = 2)
100
( t = 2)
80
( t = 2)
130
( t = 3)
110
( t = 3)
90
( t = 3)
70
( t = 3)
Figure : 3.4.3 : Stock prices

58
Suppose the initial price of a stock, that is at t = 0, is 100 Rupees and further suppose that,
at each step, say one unit, the stock price either goes up by 10 Rupees or goes down by 10
Rupees independent of the stock price behaviour in the earlier steps. Further suppose that
the risk-free interest rate r is zero. From the earlier discussions, the risk-neutral probabilities
are given by
qj =er∆tsj − s2js2j+1 − s2j
and hence
q1 =e0.1100− 90
110− 90=
1
2.
It is easy to check that the risk neutral probability for the stock price to go up is 12 and
the stock price to come down is 12 at each stage. Let Pt be the stock price at time t for
t = 0, 1, 2, 3. Then, for any t = 0, 1, 2,
Pt+1 = Pt ± 10 = Pt + [2Vt − 1]
where P0 = 100 and Vt is a random variable with P (Vt = 1) = 12 = P (Vt = 0). The finite
sequence P0, P1, P2, P3 forms a random walk and check that
Pt = P0 + 10[2(V1 + . . .+ Vt)− t]
where V1, V2, V3 are independent and identically distributed random variables with P (Vt =
1) = 12 = P (Vt = 0), t = 1, 2, 3. Let us now find the price of a European call option at t = 0
with strike price K = 80 and strike time t = 3. Since the value of the option at time t = 3 is
(P3 −K)+, and the interest rare r = 0, its discounted value at time t = 0 is also (P3 −K)+.
From our earlier discussions, it follows that the option price should be E[(P3 −K)+] where
the expectation is computed with respect to the risk-neutral probabilities computed above.
Observe that
P3 = P0 + 10[2(V1 + V2 + V3)− 3]
and the random variable V1 + V2 + V3 has the Binomial distribution with number of trials
n = 3 and the probability of success p = 12 . Note that
P (V1 + V2 + V3 = 0) =1
8= P (V1 + V2 + V3 = 3)
and
P (V1 + V2 + V3 = 1) =3
8= P (V1 + V2 + V3 = 2).
Therefore
E[(P3 −K)+] =1
8[(P0 − 30−K + (20)(0))+]

59
+3
8[(P0 − 30−K + (20)(1))+]
+3
8[(P0 − 30−K + (20)(2))+]
+1
8[(P0 − 30−K + (20)(3))+].
Since P0 = 100 and K = 80, , check that E[(P3 −K)+] = 21.25 and this is the price for a
European call option at time t = 0 when the strike price K = 80 and the strike time t = 3
given the initial stock price is P0 = 100 and the interest rate r = 0.
Multi-step Binomial tree:
Let us now consider a European call option with maturity at time t = 1. Suppose the stock
price initially is P0 at time t = 0. Let us divide the unit interval [0,1] into n steps of length
1n . Suppose the stock price either goes up or down by an amount σ√
nat each step. The
parameter σ is the volatility in the stock and we will study estimation of σ later in this book.
Let Pt be the stock price after m steps, that is, the stock price at time t = mn . From the
calculations indicated above, it is easy to see that
Pt = Pmn= P0 +
σ√n[2(V1 + . . .+ Vm)−m]
where V1 + . . . + Vm has the Binomial distribution with parameters m and 12 . From the
properties of the Binomial distribution, it follows that
E[V1 + . . .+ Vm] =m
2
and
V ar[V1 + . . .+ Vm] =m
4.
Hence
E(Pt|P0] = P0
and
V ar(Pt|P0) = (4σ2
n)(m
4) =
m
nσ2 = tσ2.
Therefore
E(P1|P0) = P0
and
V ar(P1|P0) = σ2.

60
An application of the central limit theorem shows that the price P1 at time t = 1 converges
in distribution to Normal distribution with mean P0 and variance σ2. Let us now find the
option price for a European call option when the strike price is K and the strike time is
t = 1. Suppose the interest rate r = 0. Then the option price is E[(P1 − K)+] and the
expectation is computed with respect to the risk-neutral probability measure. The price
process Pt, t = 0, 1n , . . . ,nn is a discrete time process and it is a random walk in the model
described above. As n → ∞, that is, as the time between steps shrinks to zero, the discrete
time process converges to to a continuous time process called the Brownian motion or the
Wiener process. The main drawback of this model is that it is possible for the price Pt to be
negative under this model which is not possible as the stock price can never be negative.

Chapter 4
GEOMETRIC BROWNIAN
MOTION AND
BLACK-SCHOLES FORMULA
4.1 Inroduction
Let (Ω,F , P ) be a probability space. A stochastic process Bt, t ≥ 0 defined on the prob-
ability space (Ω,F , P ) is called a standard Brownian motion or standard Wiener process if
(i) P (B0 = 0) = 1 (ii) the random variable Bt+h − Bt has the Gaussian distribution with
mean zero and variance |h| and (iii) if 0 < t1 < t2 ≤ t3 ≤ t4 < ∞, then the random vari-
able Bt4 − Bt3 is independent of the random variable Bt2 − Bt1 . In other words, a standard
Brownian motion is a Gaussian process starting at zero with stationary independent incre-
ments. From the general theory of stochastic processes, it can be shown that there always
exists a version of the Wiener process such that the sample paths of a Wiener process are
continuous with probability one but nowhere differentiable with probability one. Here after
we will assume that we are dealing only with such a version of the Wiener process. Since
the random variable Bt has the Gaussian distribution with mean zero and variance t, it can
assume positive as well as negative values with positive probability and hence the process
Bt, t ≥ 0 is not a suitable model for modelling the stock price process.
61

62
4.2 Geometric Brownian Motion
Recall that a discrete time stochastic process Pt, t = 0, 1, 2, . . . is called a geometric random
walk if it can be represented in the form
Pt = P0eW1+...+Wt
where Wt, t ≥ 1 are independent identically distributed (i.i.d.) random variables. Let us
now consider a two-step Binomial tree for the evolution of the stock prices but model it now
as a geometric random walk. From the definition of the process Pt, t ≥ 0, it is obvious
that it can never assume negative values. Let us consider the time interval [0, 1] and divide
it into n sub intervals. We consider the evolution of the stock price process at the times
t = 0, t = 1n , . . . , t =
mn , . . . , t =
nn = 1 which are at equal spacing. If the stock price is s now,
suppose that, the stock price at the next step either goes up to
sup = seµn+ σ√
n
or the stock price goes down to
sdown = seµn− σ√
n .
Therefore
log(sup) = log s+µ
n+
σ√n
and
log(sdown) = log s+µ
n− σ√
n.
Notice that the logarithm of the stock price process is a random walk but the stock price pro-
cess is a geometric random walk under this model. Suppose the interest rate r is compounded
continuously.

63
Current
price
n nup
S se
n ndown
S se
Figure: 4.2.1: Stock prices
S

64
From the discussion in Chapter 3, the risk-neutral probability for the stock price to go up
(for the up jump) is
q =ser/n − sdownsup − sdown
(4.2. 1)
=ser/n − se
µn− σ√
n
seµn+ σ√
n − seµn− σ√
n
=er/n − e
µn− σ√
n
eµn+ σ√
n − eµn− σ√
n
=J1J2
(say).
Notice that the risk-neutral probability does not depend on the current stock price s in this
model. We will see later that the trend parameter of the stock price or the drift parameter
µ, which could be positive or negative, has also no influence on the pricing of an option in
this model. Let us now obtain an approximation for the risk-neutral probability q specified
by the equation (2.1). Note that
J1 ≃ 1 +r
n− [1 + (
µ
n− σ√
n) +
1
2(µ
n− σ√
n)2]
=r
n− µ
n+
σ√n− 1
2[µ2
n2+σ2
n− 2µσ
n3/2]
=r − µ− σ2
2
n+
σ√n+O(
1
n3/2)
and
J2 ≃ [1 + (µ
n+
σ√n) +
1
2(µ
n+
σ√n)2]
−[1 + (µ
n− σ√
n) +
1
2(µ
n− σ√
n)2]
=2σ√n+
1
2
4µσ
n3/2
=2σ√n+O(
1
n3/2).
Therefore
q ≃ J1J2
≃r−µ−σ2
2n + σ√
n
2σ√n

65
=
√n
2σ[r − µ− σ2
2
n+
σ√n]
=1
2[r − µ− σ2
2
σ√n
+ 1]
=1
2[1−
µ− r + σ2
2
σ√n
].
Under the geometric random walk model for the stock price model described above, the stock
price P1/n at time 1n is given by
P1/n = P0eµn± σ√
n
or equivalently
logP1/n = logP0 +µ
n± σ√
n.
Similarly
logP2/n = logP1/n +µ
n± σ√
n.
In general, for t = mn ,m = 1, . . . , n,
logPt = logPm/n = logP(m−1)/n +µ
n± σ√
n.
Therefore, the stock price, at time t = mn , is given by
Pt = Pm/n = P0eµm
n+ σ√
n
∑mi=1(2Wi−1)
where Wi = 1 if the stock price goes up at the (i− 1)-th step and Wi = 0 if the stock price
goes down at the (i − 1)-th step. Note that 2Wi − 1 = −1 if Wi = 0 and 2Wi − 1 = 1 if
Wi = 1. Under the risk-neutral probability measure, P (Wi = 1) = q and P (Wi = 0) = 1− q.
Since the random variables Wi, i = 1, . . . ,m are i.i.d. Bernoulli random variables, it is easy
to see that E(Wi) = q and V ar(Wi) = q(1 − q) under the risk-neutral probability measure.
For t = mn ,
E[σ√n
m∑i=1
(2Wi − 1)] =σ√nm(2q − 1)
≃ σ√nmr − µ− σ2
2
σ√n
=m
n[r − µ− σ2
2]
and
var[σ√n
m∑i=1
(2Wi − 1)] =σ2
nm(4 var(W1))

66
=σ2
nm(4q(1− q))
≃ m
nσ2
since q → 12 as n→ ∞. Therefore, by the central limit theorem, it follows that
Pt ≃ P0e(r−σ2
2)t+σWt
for 0 ≤ t ≤ 1 where Wt, 0 ≤ t ≤ 1 is the standard Brownian motion. Observe that the
price Pt at time t does not depend on the parameter µ under the risk-neutral probability
measure but it depends on the interest rate r and volatility σ. If K is the exercise price and
T is the exercise time for a European call option , then the value of the option at maturity
time T is
[PT −K]+ = [P0e(r−σ2
2)T+σWT −K]+
under the risk-neutral probability measure under the model discussed in this section. The
random variable WT has the Gaussian distribution with mean zero and variance T. Define
Z = WT√T. Then the random variable Z has the standard normal distribution and the present
value of the European call option is
e−rT [PT −K]+ = e−rT [P0e(r−σ2
2)T+σWT −K]+ (4.2. 2)
= e−rT [P0e(r−σ2
2)T+σ
√TZ −K]+
= [P0e−σ2
2T+σ
√TZ − e−rTK]+.
Note that the option price at time t = 0 for the European call option with exercise price K
and exercise time T is the risk-neutral expectation of the discounted value of the option at
the expiration time T. Hence the option price C should be
E([P0e−σ2
2T+σ
√TZ − e−rTK]+) (4.2. 3)
where the expectation is with respect to the standard normal distribution. Therefore
C =
∫ ∞
−∞[P0e
−σ2
2T+σ
√TZ − e−rTK]+ϕ(z)dz (4.2. 4)
where ϕ(.) is the standard normal density function. Let Φ(.) denote the standard normal
distribution function. Define
d1 =log(P0
K ) + (r + σ2
2 )T
σ√T
(4.2. 5)
and
d2 = d1 − σ√T . (4.2. 6)

67
We will show that
C = Φ(d1)P0 − Φ(d2)Ke−rT (4.2. 7)
which is the option price for a European call option under the geometric Brownian motion
model for the stock price subject to the assumption of no arbitrage opportunity. The formula
described by the above equation is called Black-Scholes formula. Note that the option price is
function of the initial price P0, strike price K, strike time T, interest rate r and the volatility
σ. It is clear that the parameters P0,K, T are known in advance by choice and the interest
rate r is fixed by the going rate in the market. However the volatility σ is unknown and it
needs to be estimated to estimate the option price using the Black-Scholes formula. We will
come to the discussion on estimation of σ later in this book. We will now give a derivation
of the Black-Scholes formula.
4.3 Black-Scholes formula
Recall that the option price for a European call option is given by
C = e−rTE[(PT −K)+]
where the Expectation is computed with respect to the risk-neutral probability measure. Let
I denote the indicator function of the event [PT > K]. Hence
C = e−rTE[(PT −K)+] (4.3. 1)
= e−rTE[I(PT −K)]
= e−rTE[IPT ]−Ke−rTE[I].
Since
PT = P0e(r−σ2
2)T+σ
√TZ
where Z has the standard normal distribution under the no arbitrage assumption, it follows
that PT > K if and only if
P0e(r−σ2
2)T+σ
√TZ > K
which in turn holds if and only if
Z >log(KP0
)− (r − σ2
2 )T
σ√T
.

68
The last inequality holds if and only if
Z > σ√T − d1
by the definition of d1 given in (4.2.5). Hence
(4.3. 2)
E(I) = P (PT > K)
= P (Z > σ√T − d1)
= P (Z < d1 − σ√T ) (by the symmetry of the standard normal density function)
= Φ(d1 − σ√T ).
Let us now compute E(IPT ). Note that
E[IPT ] =
∫ ∞
−∞IP0e
(r−σ2
2)T+σ
√Tzϕ(z)dz (4.3. 3)
=
∫[PT>K]
P0e(r−σ2
2)T+σ
√Tzϕ(z)dz
=
∫ ∞
σ√T−d1
P0e(r−σ2
2)T+σ
√Tzϕ(z)dz
=
∫ ∞
σ√T−d1
P0e(r−σ2
2)T+σ
√Tz 1√
2πe−
z2
2 dz
=1√2πP0e
(r−σ2
2)T
∫ ∞
σ√T−d1
e−z2
2+σ
√Tzdz
=1√2πP0e
rT
∫ ∞
σ√T−d1
e−12(z−σ
√T )2dz
=1√2πP0e
rT
∫ ∞
−d1e−
12y2dy
(by applying the transformation y = z − σ√T )
= P0erTP (Z > −d1)
= P0erTP (Z < d1)
= P0erTΦ(d1).
Combining the equations (4.3.1), (4.3.2) and (4.3.3), we get that
C = P0Φ(d1)−Ke−rTΦ(d2) (4.3. 4)
which is known as the Black-Scholes formula for the option price.

69
4.4 Implied Volatility
As we have mentioned earlier, the option price given by the Black-Scholes formula depends on
the volatility parameter σ of the stock which is unknown. Methods to estimate the parameter
σ will be discussed later in this book. Given the exercise price K, maturity or exercise time
T , interest rate r, and the current market price of the option, there is some value of σ which
makes the option price obtained using the Black-Scholes formula equal to the current market
price of the option. This value of σ is called the implied volatility. We can think of the implied
volatility as the amount of volatility in the stock reflected by the current market. We can
draw a plot of implied volatility against the exercise price keeping all the other parameters
such as the maturity time, the interest rate and the initial price of the stock fixed. Such a
plot is generally bowl-shaped with volatility highest at the lowest and the highest exercise
prices. Such a behaviour of the volatility is called the volatility smile. We can estimate the
volatility smile by modelling the implied volatility as a function of both the exercise price
and the maturity time using the bivariate polynomial regression
Vi = β0 + β1(K∗i ) + β2(K
∗i )
2 + β3(T∗i ) + β4(T
∗i )
2 + β5K∗i T
∗i + ϵi
where, for the i-th option, Vi is the implied volatility, K∗i is the centered exercise price, that
is the exercise price minus its mean K and T ∗i is the centered maturity time and ϵ is the
error. We can check whether the strike price K has any influence on the implied volatility of
the stock by testing the hypothesis that β1 = β2 = 0.
4.5 Properties of the European Call Option Price Given by
the Black-Scholes Formula
We have derived the Black-Scholes formula for the European call option price in the previous
section. It is given by
C(s, t,K, σ, r) = e−rtE[(Pt −K)+] = sΦ(d1)−Ke−rtΦ(d2)
where s is the initial price of the stock, r is the interest rate compounded continuously, K
is the strike price, t is the exercise time and σ is the volatility. Here the stock price Pt is
modelled by the process
Pt = se(r−σ2
2)t+σBt , t ≥ 0

70
with P0 = s where Bt, t ≥ 0 is the standard Wiener process under the risk-neutral proba-
bility or equivalently under the no arbitrage assumption. For any fixed t, the random variable
Pt can also be represented as
Pt = se(r−σ2
2)t+σ
√tZ
where Z has the standard normal distribution. We would now like to study the behaviour
of the function C(s, t,K, σ, r) with respect to the variables s, t,K, σ and r when one of them
changes with the others fixed. Let I be the indicator of the event [Pt > K]. We have seen
earlier that
E[I] = P (Pt > K) = Φ(d1 − σ√t) = Φ(d2)
and
E[IPt] = sertΦ(d1).
Here d1 and d2 are as defined in the earlier sections. We will assume that differentiation
under the expectation sign is allowed in the following computations. Let x be any one of the
variables s, t,K, σ and r. Then
∂C
∂x=
∂
∂xE[e−rtI(Pt −K)] (4.5. 1)
= E[∂
∂x(e−rtI(Pt −K))]
= E[∂I
∂xert(Pt −K) + I
∂
∂x(e−rt(Pt −K))]
= E[I∂
∂x(e−rt(Pt −K))]
since ∂I∂x = 0 whatever might be the variable x. Note that I = 1 or I = 0 and Pr(Pt = K) = 0
under the model assumed above.
(i) Suppose x is the variable K which is the strike price. Check that
∂
∂K[e−rt(Pt −K)] = −e−rt
and
∂C
∂K= E[−Ie−rt]
= −e−rtE[I]
= −e−rtΦ(d2)
≤ 0.

71
Hence the European call option price C is a non-increasing function of the strike price K.
(ii) Suppose x is the variable s which is the initial price of the stock. Then
∂
∂s[e−rt(Pt −K)] = e−rt
∂Pt∂s
.
Since
Pt = se(r−σ2
2)t+σ
√tZ ,
it follows that∂Pt∂s
= e(r−σ2
2)t+σ
√tZ =
Pts
and hence∂
∂s[e−rt(Pt −K)] = e−rt
Pts.
Therefore
∂C
∂s= E(I
∂
∂s[e−rt(Pt −K)])
=e−rt
sE[IPt]
=e−rt
sertsΦ(d1)
= Φ(d1) ≥ 0.
Hence the European call option price C is a nondecreasing function of the initial stock price
s. The partial derivative ∂C∂s is called Delta. It gives the rate of change in the value of the call
option with respect to the change in the initial price of the underlying stock. This parameter
is denoted by ∆. For the Black-Scholes option price C, the parameter ∆ = ∂C∂s = Φ(d1).
(iii) Suppose x is the variable r which is the rate of interest compounded continuously. Then
∂
∂r[e−rt(Pt −K)] = −te−rt(Pt −K) + e−rt
∂Pt∂r
= −te−rt(Pt −K) + e−rttPt
(since Pt = se(r−σ2
2)t+σ
√tZ)
= Kte−rt.
Hence∂C
∂r= Kte−rtE[I] = Kte−rtΦ(d2) ≥ 0.

72
Therefore the European call option price C is a nondecreasing function of the interest rate r.
Under the no arbitrage geometric Brownian motion model, if the interest rate goes up, then
it reduces the present value of the amount to be paid if the option is exercised at the strike
time which in turn increases the value of the option.
(iv) Suppose x is the variable σ which is the volatility of the stock. Then
∂
∂s[e−rt(Pt −K)] = e−rtPt(−tσ +
√tZ).
Hence
∂C
∂σ= E[Ie−rtPt(−tσ +
√tZ)]
= −tσe−rtE[IPt] +√te−rtE[IPtZ]
= −tσs Φ(d1) + s√t [ϕ(d1) + σ
√t Φ(d1)]
= s√t ϕ(d1) ≥ 0.
Hence the European call option price C is a nondecreasing function of the volatility σ. Note
that if the volatility in the stock is high, then the option holder will get benefit by exercising
his option and hence the cost of the option price is likely to go up. Here we have used the
identity
E[IPtZ] = erts(ϕ(d1) + σ√tΦ(d1)). (4.5. 2)
We will now check this identity. Note that
E[IPtZ] =
∫ ∞
σ√t−d1
zse(r−σ2
2)t+σ
√tz 1√
2πe−
z2
2 dz
=1√2πse(r−
σ2
2)t
∫ ∞
σ√t−d1
ze−z2
2+σ
√tz dz
=1√2πsert
∫ ∞
σ√t−d1
ze−12(z−σ
√t)2 dz
=1√2πsert
∫ ∞
−d1(y + σ
√t)e−
12y2 dy
(by applying the transformation y = z − σ√t)
= sert[
∫ ∞
−d1
1√2πye−
12y2 dy + σ
√t
1√2π
∫ ∞
−d1e−
12y2 dy]
= sert[1√2πe−
12d21 + σ
√t Φ(d1)]
= sert[ϕ(d1) + σ√t Φ(d1)].

73
(v) Suppose x is the variable t which is the strike time or the exercise time. Then
∂
∂t[e−rt(Pt −K)] = e−rt
∂Pt∂t
− re−rtPt +Kre−rt
= e−rtPt[(r −1
2σ2)
σ
2√tZ]− re−rtPt +Kre−rt
= e−rtPt[−1
2σ2 +
σ
2√tZ] +Kre−rt.
Hence
∂C
∂t= −e−rtE[IPt]
σ2
2+ e−rtE[IZPt]
σ
2√t+Kre−rtE[I]
= −s Φ(d1)σ2
2+
σ
2√ts [ϕ(d1) + σ
√t Φ(d1)]
+Kre−rtΦ(d1 − σ√t)
=σ
2√ts ϕ(d1) +Kre−rtΦ(d2) ≥ 0.
Hence the European call option price C is a nondecreasing function of the strike time t. The
function −∂C∂t is called Theta and is denoted by Θ.
Check from the above computations that the European call option price C(s, t,K, σ, r) is
non-increasing and convex in the strike price K, and it is nondecreasing and convex in the
initial stock price s. We have seen that C is non-decreasing in the volatility σ as well in the
interest rate r. All these properties hold under the geometric Brownian motion model for the
price process with volatility parameter σ assuming that no arbitrage opportunity holds.
Note that the price of the option changes as time progresses due to changes in the stock
prices and the decreasing amount of time until expiration time or strike time of the option.
Let 0 ≤ t < T. Let the stock price at time t be St and the strike time be T. If Ct is the
European call option price at time t given by the Black-Scholes formula, then
Ct = St Φ(d1)−Ke−r(T−t) Φ(d2)
with
d1 =log(St
K ) + (r + σ2
2 )(T − t)√T − t
and
d2 = d1 − σ√T − t.

74
Since the option price changes over time, one can define the return on an option in the same
way as the return form a stock. The return on option depends on the changes in the the
volatility σ, the price St of the stock, the change in the interest rate r, and the change in
time to maturity T − t. We have noted earlier that the option price is sensitive to change in
the stock price.
Greeks :
Let C(S, T, t,K, σ, r) be the price of a European call option when the stock price at the
current time t is S, the expiration time for the option is T, the exercise price is K, the
volatility of the stock is σ and the risk-free interest rate is r. The partial derivatives of the
function C with respect to the variables S, t, σ, r measure the sensitivity of the option price
C to changes in these variables or parameters. Let
∆ =∂
∂SC(S, T, t,K, σ, r),
Θ = − ∂
∂tC(S, T, t,K, σ, r).
ρ =∂
∂rC(S, T, t,K, σ, r),
and
ν =∂
∂σC(S, T, t,K, σ, r).
We assume that the exercise price K and the exercise time T are fixed. The function ∆
(Delta) is the sensitivity of the option price to the changes in the stock price S. Option
price depends on the stock price and it is very sensitive to changes in the stock price. This
is called leverage. The function Θ (Theta) is the negative of the sensitivity of the option
price to changes in the current time t. The function ρ (Rho) measures the sensitivity of the
option price to changes in the interest rate r, and ν (Vega) measures the sensitivity of the
option price to change in volatility σ of the stock. These parameters are called the Greeks
corresponding to the stock.
Let St(option) be the option price at time t and St be the stock price at time t. Then
St(option)− St−1(option) ≃ ∆(St − St−1))
and henceSt(option)− St−1(option)
St−1(option)≃ ∆
St−1
St−1(option)
St − St−1
St−1.

75
Let
L = ∆St−1
St−1(option).
Then L is a measure of the leverage of the stock. Observe that the return on the option is L
times the return on the stock.
4.6 Properties of the European Call Option Price under Gen-
eral Price Process
Before we discuss properties of the European call option price under a general price structure,
we will discuss the ”General law of one price”.
General law of one price : Consider two investments. Suppose the first investment costs
C1 and the second investment costs C2. If C1 < C2 and the present value of the return or
payoff from the first investment is at least as large as the return or payoff from the second
investment, then there is an arbitrage opportunity.
We assume that there is no arbitrage opportunity for the investor. Following the general
law of one price, it follows that if the present value of the return from the first investment
is larger than that from the second investment, then the cost of the first investment should
be greater than that of the second investment. As an application of this general law, we will
now discuss properties of a European call option under general price process assuming that
no arbitrage opportunity exists.
Let C(K, t) be the option price for a European call option on a stock with strike price K
and exercise time t. We will call such a call option as (K, t) call option. Then, for any fixed
t, the function C(K, t) is a non-increasing and convex function of K.

76
0
C (K,t)
K
Figure: 4.6.1

77
This can be proved by the following arguments using the general law of one price stated
earlier. Let St denote the price of a stock at time t. The payoff of a (K, t) call option is
St−K if St ≥ K and is zero if St < K. Hence the payoff is (St−K)+. Recall that x+ is x if
x ≥ 0 and x+ = 0 if x < 0 and the function (St −K)+ is a convex function of K for fixed t.

78
0
S(t)
K
Figure: 4.6.2
(S(t) K)+

79
Let K = λK1 + (1 − λ)K2 and consider two investments of the following type: (i) buy one
(K, t) European call option ;(ii) buy λ of (K1, t) European call options and (1−λ) of (K2, t)
call options. The payoff from the first investment is (St−K)+ and the payoff from the second
investment is λ(St − K1)+ + (1 − λ)(St − K2)+. Since the function (St − K)+ is a convex
function of K, it follows that
λ(St −K1)+ + (1− λ)(St −K2)+ ≥ (St − (λK1 + (1− λ)K2))+
= (St −K)+.
Hence, by the general law of one price, the cost of the second investment should be larger
or equal to that of the first investment or there is an arbitrage opportunity. Since our basic
assumption is that there are no arbitrage opportunities, it follows that
C(K, t) ≤ λC(K1, t) + (1− λ)C(K2, t)
which shows that the function C(K, t) is convex in K for any fixed t. Suppose K1 < K2. It
is easy to check that
(St −K1)+ ≥ (St −K2)+
which implies that
C(K1, t) ≥ C(K2, t)
by the general law of one price under no arbitrage opportunity. Since we assume that no
arbitrage opportunity is allowed, it follows that the function C(K, t) is non-increasing in K
for any fixed t.
We will now discuss another application of the general law of one price.
Let us consider a collection or mixture of stocks with possibly different weightage. Such
a collection is called a portfolio of stocks. A weighted sum of the prices of a collection of
specified stocks is called an index. Let us compare the European call option price on an index
with the cost of European call options on the individual stocks constituting the portfolio.
We will show that the cost of call option on an index is less expensive than the cost of
options on the individual stocks using the general law of one price when there is no arbitrage
opportunity.
80
Let us consider a collection of n stocks. Let Sj(t) be the the price of the stock j at time t.
Suppose the portfolio consists of wj shares of stock j for j = 1, 2, . . . , n. Then
I(t) =
n∑j=1
wjSj(t)
is the market value of the portfolio at time t. Consider a (Kj , t) European call option on
stock j, that is, a European call option with strike time t and strike price Kj . Let Cj denote
the cost of such a call option. Let C be the cost of a European call option on the index I
with the strike price∑n
j=1wjKj and the strike time t. Then the payoff of the European call
option on the index I at time t is
(I(t)−n∑j=1
wjKj)+ = (n∑j=1
wjSj(t)−n∑j=1
wjKj)+
= (n∑j=1
wj(Sj(t)−Kj))+
≤ (
n∑j=1
(wj(Sj(t)−Kj))+)+ (since x ≤ x+)
=
n∑j=1
wj(Sj(t)−Kj)+
and the last term is equal to
n∑j=1
wj (Payoff from an European (Kj , t) call option).
Hence the payoff of the European call option on the index is always less than or equal to
the sum of the payoffs from buying wj of (Kj , t) European call options on the stock j for
j = 1, . . . , n. Therefore, by the general law of one price, it follows that
C ≤n∑j=1
wjCj
or there is an arbitrage opportunity.
4.7 Put Options
Recall that a European put option gives the holder of the option the right to sell a stock
at a specified price at a specified time. A put option increases in value as the stock price
decreases where as a call option increases in value as the stock price increases.

81
Consider a two-step Binomial tree where the stock price starts at Rupees 100 and increases
or decreases by 20% at each step (say one year). Suppose the interest rate is 5% compounded
continuously, the exercise price K of the put option is 110 Rupees and the exercise time is
at the end of two steps (two years).

82
100
(1)
144
(6)
64
(4)
Figure 4.7.1 : Stock prices
120
(3)
80
(2)
96
(5)

83
?
(1)
0
(6)
46
(4)
Figure 4.7.2 : Option pay offs
? (3)
? (2)
14
(5)

84
The risk-neutral probability q is given by
q =e(0.05)(1)(100)− 80
120− 80
= 0.6282.
The value of the put option at the end of second step is (K −S)+ where S is the stock price
at the end of two years. Check that the put option is worth 46 Rupees, 14 Rupees and Zero
Rupees at the nodes (4), (5) and (6) respectively as in Figure 7.2. The value of the put
option at the node (3) is
e−(0.05)(1)[q(0) + (1− q)(14)] = e−(0.05)(1)[(0.6282)(0) + (0.3718)(14)] = 4.91.
Similarly the value of the put option at the node (2) is
e−(0.05)(1)[q(14) + (1− q)(46)] = 24.63.
Therefore the value of the put option at the node (1) is
e−(0.05)(1)[q(4.91) + (1− q)(24.63) = 11.65.
Note that the risk-neutral probability is the same at each node. Hence the put option price
should be 11.65 rupees.
This method of computing the price of the put option can be done for a multi-step Binomial
tree. However an alternate approach is through the Put-Call option parity formula which we
will now discuss.
Put-Call option parity formula:
Let P be the price of a European put option and C be the price of a European call option
with the same exercise price K and the same expiration time T. Let S0 be the price of the
stock at time t = 0 and r be the risk-free interest rate compounded continuously. Then
P = C +Ke−rT − S0.
This equation is called put-call option parity formula.
85
We will now derive this formula using the law of one price under the no arbitrage assumption.
Let us consider two portfolios. Suppose the first portfolio holds one European call option
and an amount of Ke−rT Rupees in a risk-free asset. The payoff from this portfolio at the
time T is
erTKe−rT + (ST −K)+
Rupees where St denotes the stock price at the time t. Hence the payoff from this portfolio
is either K Rupees if ST ≤ K or K+(ST −K) = ST Rupees if ST > K. Therefore the payoff
from this portfolio is either K or ST Rupees whichever is higher.
Let us consider another portfolio holding a European put option and one share of the stock.
The payoff from this portfolio at the time T is ST if the stock price ST ≥ K so that the put
option is not exercised (but the share of the stock is sold at the prevalent stock price) and,
if ST < K, then the put option will be exercised at time T and the stock is sold to get an
amount K. Hence the payoff from the second portfolio is again either K or ST whichever is
higher.
Since the payoffs from both the portfolios at time T are the same, the current cost of the
portfolios should be the same by the law of one price as otherwise there will be arbitrage
opportunity. The initial cost of the first portfolio is C + e−rTK and the initial cost of the
second portfolio is P + S0. Hence
C + e−rTK = P + S0
or equivalently
P = C + (e−rTK − S0).
Hence the price of the put option is equal to the price of the call option plus e−rTK −S0. We
have assumed that the stock pays no dividend in the above discussion.
American option:
Recall that a European call (or put) option gives the holder the right but not obligation to
buy (or sell) a stock at a specified price known as the strike price and at a specified time
known as the exercise time. This option cannot be exercised at any time prior to the date
of expiry. An American option, either call or put, allows the holder to exercise the option
at any time prior to the expiration time or strike time. Even though it looks like that an

86
American option has more choice, we will show that it is not optimal profit wise to exercise
an American call option prior to the expiration time.
Suppose the current price of the stock is S Rupees and we have an American call option to
buy one share of the stock at a strike price of K Rupees and the option expires at a time
t from now. If we exercise the option now, then we will have a profit of (S −K)+ Rupees
immediately. Suppose we consider an alternate procedure as follows: instead of exercising
the American call option now, we sell the stock short now (and earn a profit of S Rupees)
and then purchase the stock at the expiration time t either by buying at the market price St
at that time or by exercising the call option and paying K Rupees for the share whichever is
less expensive. Under this strategy, we will receive initially S Rupees and then we will have
to pay min(St,K) Rupees at the time t. Hence the profit under this strategy is S−min(St,K)
Rupees which is larger than (S −K)+ Rupees. Hence it is always profitable for a holder of
an American call option to wait till the end of expiration time of the option. This shows that
profitability of an American call option or an European call option are the same when the
strike price and strike times are the same.
However, the situation is different in the case of American put option and the European put
option. It may be profitable to exercise an American put option well before its expiry time
and the American put option might be worth more than the European put option with the
same strike price K and the same strike time T. Recall that an American put option allows
the holder to put the stock up for sale, that is exercise the option, at any time before the
expiration time. The payoff of the put option at time T is (K−ST )+. However, it is possible
that (K − St)+ > (K − ST )+ for some 0 ≤ t < T.

Chapter 5
PORTFOLIO OPTIMIZATION
5.1 Introduction
By a portfolio in finance, we mean a basket or a collection of risky assets such as stocks and
options and risk-less assets such as term deposits from banks and government bonds. One
of the important aspects of statistical finance is to develop methods to distribute a given
wealth or invest the given wealth in a portfolio of risky as well as risk-less instruments so
as to maximize the expected profits or expected returns and minimize the risk. The risk
in a financial instrument may be measured in several ways. We measure it as the standard
deviation of the return on the investment. It is generally believed that the higher the risk in
an investment the better the expected return. The difference between the expected return
of a risky asset and the risk-free rate of return is called the risk premium. Investors will
invest their wealth in risky assets only when the expected return on their risky investments
are higher than the rate from risk-free investments. We will now discuss methods of how to
maximize the expected return subject to an upper bound on the risk or how to minimize the
risk subject to a lower bound on the expected return. An important idea for reducing risk is
to diversify the portfolio of assets.
87

88
5.2 Efficient frontier and Tangency portfolio
Let first consider the case of a portfolio with one risky asset and one risk-free asset. Suppose
the expected return from the risky asset is 10% during a holding period, say,one year and the
standard deviation of the return is 15%. Further suppose that the rate of interest on the risk-
free asset such as a term deposit is 5% per year. Suppose we are interested in constructing
a portfolio with a fraction of w of our wealth in the risky asset and the remaining in the
risk-free asset. Let R be the return from the portfolio at the end of one holding period, say
, one year. Then
E(R) = w(0.10) + (1− w)(0.05) = 0.05 + 0.05w (5.2. 1)
and
var(R) = σ2R = w2(0.15)2. (5.2. 2)
Note that the standard deviation corresponding to the return from term deposit from the
risk-free asset, such as a term deposit, is zero. Hence
σR = (0.15)w. (5.2. 3)
If we fix the expected return E(R), then w can be calculated from the equation (5.2.1), which
in turn will determine the standard deviation of the return from the equation (5.2.3). If we
fix the standard deviation of the return or the risk we can take, then the equation (5.2.3) will
determine w and this in turn will indicate the expected return from the equation (5.2.1).
Suppose that a company is interested in investing 20 lakh rupees and has a capital that could
cover a loss of 2 lakhs but no more. Suppose the company wants to be certain that, if there is
a loss, it is not more than 10%. In other words the company wants R > −0.10 with certainty.
This can be guaranteed with probability one only if the entire asset is invested in a risk-free
asset and the rate of interest on the risk-free asset is large enough to cover the possible loss of
2 lakhs. It is obvious that this will not be of interest to the company. Suppose the company
would like the Pr(R < −0.10) to be small, say 1% and it invests a fraction w of its assets in
risky assets and the fraction (1− w) in risk-free assets. Then
P (R < −0.10) = P (R− E(R)
σR<
−0.10− E(R)
σR) (5.2. 4)
= P (R− E(R)
σR<
−(0.10)− (.05 + .05w)
(0.15)w)
= Φ(−(0.10)− (.05 + .05w)
(0.15)w)
= 0.01

89
if−(0.10)− (.05 + .05w)
(0.15)w= Φ−1(0.01) (5.2. 5)
Solving this equation, we get w. In financial circles, the amount of Rupees 2 lakhs which the
company is holding as a capital is called the Value-at-Risk (VaR) and the company wants that
the Pr(R < −0.10) = 0.01 which is called the confidence. With the choice of w satisfying the
equation (5.2.5), the company can construct portfolio that maximizes the expected return
subject to having a VaR of Rupees 2 lakhs with confidence 99%.
Suppose the expected return on the risky asset R1 is µ1 and the standard deviation is σ1.
Further suppose that the return on the risk-free asset is µf and the portfolio consists of
a fraction w of the risky asset R1 and a fraction (1 − w) of the risk-free asset. Then the
expected return of this portfolio is
wµ1 + (1− w)µf
and the standard deviation of the portfolio is
wσ1.
Suppose there are more than one risky asset and one risk-free asset. An optimal combi-
nation of these assets or a portfolio of these assets can be constructed by first finding the
optimal portfolio of the risky assets which is called the tangency portfolio and then finding
an appropriate mixture of the tangency portfolio and the risk-free asset.
We have seen earlier that the optimum fraction w for mixing a risky asset and a risk-free
asset depends on the expected return E(R) and the standard deviation σR of the portfolio.
Since these quantities are not known in general, they need to be estimated from the past
data on returns. If the time series of returns can be considered as a stationary time series,
then the mean E(R) and the standard deviation σR can be estimated by the sample mean
and the sample standard deviation respectively. Quality of these estimators depend on the
number of observations or the length of the time series of returns available. The assumption
of stationarity might not be justified if the the length is too long.
Suppose we have two risky assets. We will now discuss how to mix these assets optimally or
how to find the tangency portfolio corresponding to these risky assets. Let R1 and R2 be the
returns from the risky asset 1 and risky asset 2 respectively. Suppose we consider a policy

90
with fraction w of the risky asset 1 and fraction (1−w) of the risky asset 2 where 0 ≤ w ≤ 1.
Then the return R from this portfolio is
R = wR1 + (1− w)R2.
Let µi, i = 1, 2 be the expected means and σi, i = 1, 2 be the standard deviations of the
returns Ri, i = 1, 2. Furthermore let ρ12 be the correlation between R1 and R2. Then
E(R) = wµ1 + (1− w)µ2
and
σ2R = w2σ21 + (1− w)2σ22 + 2w(1− w)ρ12σ1σ2.
If we would like to find an optimum portfolio with a given expected return µ, in the sense of
minimizing the risk, then we minimize the function
g(w) = w2σ21 + (1− w)2σ22 + 2w(1− w)ρ12σ1σ2
subject to the condition
wµ1 + (1− w)µ2 = µ.
This can be done by applying the method of Lagrange multipliers. We will come back to
this discussion later in this chapter. Observe that the optimum w depends on the quantities
µ1, µ2, σ1, σ2 and ρ12. These need to be estimated from the past data available on the returns
R1 and R2 of the two risky assets.
Suppose Rij , j = 1, . . . , n are the time series of returns from the risky asset i for i = 1, 2.
Then an estimator of E(Ri) = µi is the sample mean
Ri =1
n
n∑j=1
Rij
and an estimator of σ2i is the sample variance s2i given by
s2i =1
n
n∑j=1
(Rij − Ri)2.
The correlation ρ12 can be estimated
ρ12 =σ12s1s2
where
σ12 =1
n
n∑j=1
(R1j − R1)(R2j − R2).

91
Observe that σ12 is an estimator of the covariance between the returns R1 and R2.
The functions E(R) and σR are functions of the variable w. Consider the graph determined
by the points
(σr, E(R)) : 0 ≤ w ≤ 1.
This is a parabola. See the Figure 5.2.1 given below.

92
(The above figure adapted from ”Statistics and Finance: An Introduction”,David Ruppert,
Springer International edition (2006)).

93
The fraction w corresponding to the left most point of the graph corresponds to the optimum
portfolio with the minimum value of the risk σR and the corresponding expected return E(R).
Such a portfolio is called theminimum variance portfolio corresponding to the two risky assets
with the returns R1 and R2. Let us consider those portfolios for which the expected return
is larger than the expected return from the minimum variance portfolio. Such portfolios are
called efficient portfolios and the points on the graph corresponding to the efficient portfolios
is said to form the efficient frontier. Note that the returns R1 and R2 correspond to the
portfolios with w = 1 and w = 0 respectively.
Let us now look at the problem of choosing an optimum combination of the two risky assets
and a risk-free asset. Consider the graph of the points (σR, E(R)) for 0 ≤ w ≤ 1. (See
Figure 5.2.1. Note that each point on the efficient frontier in Figure 5.2.1 corresponds to
some value of w between 0 and 1. The point (σR1 , E(R1)) corresponds to the case w = 0 and
the (σR2 , E(R2)) corresponds to the case w = 1. If we fix w, then a portfolio of the two risky
assets with returns R1, R2 with w1 of R1 and 1 − w of R2. Suppose we consider a portfolio
with a risk-free asset alone. Then the point corresponding to the portfolio is denoted by F
in the graph. Note the abcissa or the x-coordinate of F is zero as the standard deviation
of the return for a risk-free asset RF is zero where as the ordinate or the y-coordinate of F
is µF which is the return based on the interest rate prevailing in the market. Let us choose
a point (σR, E(R)) on the efficient frontier and join it with the point F. All the points on
this line correspond to portfolios with mixtures of the risk-free asset and a mixture of risky
assets R1 and R2. The line joining F with the point (σR1 , E(R1)) correspond to points for the
portfolios with a mixture of the risky asset R1 and the risk-free asset RF . Similarly the line
joining F with the point (σR2 , E(R2)) correspond to points for the portfolios with a mixture
of the risky asset R2 and the risk-free asset with return µf . Let us now draw a tangent from
the point F to the efficient frontier. Suppose the tangent touches the efficient frontier at the
point T. The tangent from the point F touching the curve at the point T lies above the line
connecting F to any other point on the efficient frontier. Hence, for any value of σR, the
line connecting F with the point T gives a portfolio with higher expected return than any
other portfolio R from the efficient frontier with risk σR and return E(R). The slope of each
such line is called the Sharpe ratio. See Figure 5.2.2. It is the ratio of excess expected return
to the risk, that is µR−µFσR
. Here µr denotes E(R), the expected return from the portfolio
with return R = wR1 + (1− w)R2 and µF denotes the risk-free return. The point T on the
curve corresponds to the portfolio with the highest Sharpe ratio. This portfolio is called the

94
tangency portfolio since the line joining the point T with the point F is a tangent to the
efficient frontier part of the parabola. As a consequence of the above discussion, we note the
following.
The optimal portfolio or efficient portfolio mixes the tangency portfolio of the two risky
assets with the risk-free asset. Each efficient portfolio has the property that it has the higher
expected return than any other portfolio with the same or smaller risk and it has smaller
risk than any other portfolio with the same or larger expected return.

95
(The above figure adapted from ”Statistics and Finance: An Introduction”,David Ruppert,
Springer International edition (2006)).

96
All the efficient portfolios use the same mixture of two risky assets, that is the tangency port-
folio. The proportion of investment allocated to the tangency portfolio and the proportion
allocated to the risk-free asset change.
Example 5.2.1 : Let R1 and R2 be the returns from two risky assets. Suppose we consider
a portfolio with a mixture giving a return of w of R1 and 1− w of R2. Let R be the return
from this portfolio. Suppose the returns R1 and R2 are correlated with correlation ρ. Let
µi = E(Ri), i = 1, 2 and σ2i = V ar(Ri), i = 1, 2. Then
E(R) = wµ1 + (1− w)µ2
and
V ar(R) = σ2R = w2σ21 + (1− w)2σ22 + 2w(1− w)ρσ1σ2.
If the parameters σ1, σ2 and ρ are known, then we can choose w to minimize V ar(R) to
obtain the minimum variance portfolio and compute the corresponding expected return. For
instance, suppose that µ1 = 0.28, µ2 = 0.16, σ1 = 0.1, σ2 = 0.2 and ρ = 0. Then
σ2r = w2(0.1)2 + (1− w)2(0.2)2
and it is minimum when
w =0.04
0.05= 0.8
and the corresponding expected return is
E(R) = (0.8)(0.28) + (0.2)(0.16) = 0.256.
How to find the tangency portfolio corresponding to two risky assets and one risk-free asset?
We will give a formula leading to a solution to this problem now and discuss the more general
case later in this chapter. Let µ1, µ2 and µf be the expected returns on the two risky asset
and one risk-free asset. Let σ1, σ2 be the risks or the standard deviations of the returns of
the two risky assets. Let ρ be the correlation between R1 and R2. Suppose the parameters
µ1, µ2, σ1, σ2 and ρ are known. If they are not known, let us estimate them from the past
information. Define
Vi = µi − µf , i = 1, 2.
Then V1 and V2 are called the excess returns. They represent the excess return gained by
investing in the risky asset instead of the risk-less asset. It is possible that the excess returns

97
could be negative indicating a loss due to investment in the risky asset instead of investment
in the risk-free asset. We will show that the tangency portfolio in this case consists of wT
proportion of the first risky asset corresponding to R1 and (1−wT ) proportion of the second
risky asset corresponding to R2 where
wT =V1σ
21 − V2ρσ1σ2
V1σ22 + V2σ21 − (V1 + V2)ρσ1σ2. (5.2. 6)
Let RT be the return from this tangency portfolio. Then the expected return from this
tangency portfolio is
E(RT ) = wTµ1 + (1− wT )µ2
and
V ar(RT ) = σ2T = w2Tσ
21 + (1− wT )
2σ22 + 2wT (1− wT )ρσ1σ2.
Example 5.2.2 : (Continuation of Example 5.2.1) In addition to the information given in
Example 1, suppose that the return from the risk-free asset µf = 0.12. Then
V1 = µ1 − µf = 0.28− 0.12 = 0.16
and
V2 = µ2 − µf = 0.16− 0.12 = 0.04
As an application of the formula given by (5.2.6), we get that the tangency portfolio is
determined by
wT =(0.16)(0.2)2
(0.16)(0.2)2 + (0.04)(0.1)2.
We leave it to the reader to compute the expected return E(RT ) and the risk σT for this
tangency portfolio.
Suppose we have determined the tangency portfolio with return RT . Let the return from the
risk-free asset be µf . Consider a portfolio with a fraction w of the investment in the tangency
portfolio and the remaining (1−w) invested in the risk-free asset. Let R be the return from
such a portfolio. Then
R = wRT + (1− w)µf = µf + w(RT − µf ),
E(R) = µf + w(E(RT )− µf ),
and
σ2R = w2σ2T .

98
If we specify σR, then w can be determined from the above equation using the value of σT
of the tangency portfolio.
5.3 Efficient portfolio with N risky assets and one risk-free
asset
Suppose that we have N risky assets with returns R1, . . . , RN . Let R denote the column
vector
R1
.
.
.
RN
of returns. Let µ be the column vector of expected returns, that is,
µ1
.
.
.
µN
.
Let Ωij denote the covariance between the returns Ri and Rj and let Ω denote the matrix
Ω11 . . . Ω1N
. . . . .
. . . . .
. . . . .
ΩN1 . . . ΩNN
.
Let σi =√Ωii be the standard deviation of the return Ri corresponding to the i-the asset.
Let w denote
w1
.
.
.
wN

99
which is the vector of portfolio weights, that is a portfolio with the fraction wi of the i-th
risky asset. Observe that w1 + . . .+wN = 1. We assume that the weights wi, 1 ≤ i ≤ N can
be positive, negative or zero subject to the condition w1 + . . . + wN = 1. For any column
vector α, let α′ denote its transpose. For convenience, we denote the column vector
1
.
.
.
1
by 1. Note that the expected return from the portfolio with weight w is
E(
N∑i=1
wiRi) = w′µ
where the vector w satisfies the condition
w1 + . . .+ wN = 1′w = 1.
If we are interested in constructing a portfolio P with the expected return µP , then it follows
that µP = w1µ1 + . . . + wNµN where 1′w = 1. If N = 2, then this equation can be solved
uniquely for w1. Observe that w2 = 1− w1. However if N > 3, then there will be an infinite
number of portfolios whose expected returns are equal to µP . The portfolio with the smallest
variance is called theminimum variance efficient portfolio.. We would like to find this efficient
portfolio. Note that variance of the return R for any portfolio with the vector of weights w
is given by
var(R) = var(
N∑i=1
wiRi)
=N∑i=1
N∑j=1
wiwjΩij
= w′Ωw.
The minimum variance efficient portfolio is obtained by minimizing w′Ωw subject to the
conditions w′µ = µP and w′1 = 1. This can be done by the method of Lagrange multipliers.
Let
L(w, δ1, δ2) = w′Ωw+ δ1(µP −w′µ) + δ2(1−w′ 1)
where δ1 and δ2 are the Lagrange multipliers corresponding to the conditions w′µ = µP and
w′1 = 1 respectively. Differentiating the function L with respect to the vector w and with

100
respect to the variables δ1 and δ2, and equating the derivatives to zero, we get the system of
equations
∂L
∂w= 2Ωw − δ1µ− δ21 = 0, (5.3. 1)
∂L
∂δ1= 0,
∂L
∂δ2= 0
where ∂L∂w denotes the vector
∂L∂w1
.
.
.
∂L∂wN
.
Here we used the result∂(x′Ax)
∂x= (A+A′)x
for any square matrix A.
Suppose that the square matrix Ω is non-singular. Solving the system of equations given by
(3.1), we get that the minimum variance efficient portfolio is determined by the vector
wµP =1
2Ω−1(δ1µ+ δ21) = Ω−1(λ1µ+ λ21)(say). (5.3. 2)
Observe that
µP = µ′wµP = λ1µ′Ω−1µ+ λ2µ
′Ω−11 (5.3. 3)
1 = 1′wµP = λ11′Ω−1µ+ λ21
′Ω−11.
Let A = µ′Ω−11, B = µ′Ω−1µ and C = 1′Ω−11. Then the above system of equations can be
written in the form
µP = Bλ1 +Aλ2, (5.3. 4)
1 = Aλ1 + Cλ2.
Suppose that the D = BC −A2 = 0. Solving the above equations, we get that
λ1 =−A+ C µP
D

101
and
λ2 =B −A µP
D
and
wµP = g + µPh
where
g =1
D(BΩ−11−AΩ−1µ)
and
h =1
D(CΩ−1µ−AΩ−11).
It is necessary to check that the optimum weight wµP is actually a minimizer. We leave it
to the reader to check the same.
The vectors g and h depend only on the mean vector µ of expected returns and on the covari-
ance matrix Ω of the returns but not on the target value µP of the portfolio P. Furthermore
the quantities A,B,C and D also depend on µ and Ω only. The target µp can vary between
min1≤i≤N µi and max1≤i≤N µi.As µp takes values over the interval [min1≤i≤N µi,max1≤i≤N µi],
we obtain a locus of the points (σµP , µp) corresponding to wµP .
The efficient frontier can be obtained by the following method: Let µP take values over the in-
terval [min1≤i≤N µi,max1≤i≤N µi]. For each µP in this interval, compute σµP =√
w′µP
ΩwµP .
Plot the points (µP , σµP ). The set of points (σµP , µp) with µP ≥ min1≤i≤N µi is called the
efficient frontier. The other points (σµP , µp) correspond to inefficient portfolios.
While applying the Lagrange multiplier technique for obtaining the optimum wµP subject
to the condition w′ 1, we have assumed that the proportional allocation wi for the i-th risky
asset could take positive, negative or zero values. In other words, short selling is allowed in
these computations.
Suppose we are interested in finding the minimum variance portfolio among all the efficient
portfolios with µp ranging over the interval [min1≤i≤N µi,max1≤i≤N µi]. Note that the vari-
ance of the efficient portfolio with µP as the target value is
var(w′µP
R) = w′µP
ΩwµP (5.3. 5)

102
= (g + µPh)′Ω(g + µPh)
= g′Ωg + 2µPg′Ωh+ µ2ph
′Ωh.
Minimizing the above function over µP , it follows that the derivative of V ar(w′µP
R) with
respect to µp should be zero at the optimum value. Hence
d
dµP[var(w′
µPR)] = 2g′Ωh+ 2µph
′Ωh = 0 (5.3. 6)
or equivalently µmin, the expected return for the minimum variance portfolio, is given by
µmin = −g′Ωh
h′Ωh. (5.3. 7)
It can be checked that µmin is a minimizer of the variance V ar(w′µP
R). and the corresponding
variance is
var(w′µmin
R) = g′Ωg − (g′Ωh)2
h′Ωh. (5.3. 8)
Remarks : If short selling is not allowed, then we have to impose the condition wi ≥ 0, 1 ≤
i ≤ N and minimization of the portfolio risk is subject to the condition w′µ = µp,w′1 = 1
and wi ≥ 0, 1 ≤ i ≤ N. This is a quadratic programming problem and the Lagrange multiplier
technique will not apply for minimization purposes.
Tangency portfolio when there are N risky assets and one risk-free asset:
Suppose that we have one risk-free asset and N risky assets. We would like to construct
a portfolio P which is a mixture of the risk-free asset and the risky assets with returns
Ri, i = 1, . . . , N. Let wi denote the fraction of the investment in the i-th risky asset. Note
that it is not necessary that w′1 = 1. Suppose we invest the remaining amount 1 −w′1 in
the risk-free asset. The expected return for this portfolio P is
w′µ+ (1−w′1)µf
where µf denotes the return from the risk-free asset. Suppose we have a target µP for the
expected return from the portfolio P. The variance of the return from this portfolio P is
w′Ωw
where Ω is the covariance matrix of the vector R of the returns from the N risky assets.

103
We get the optimum portfolio with the expected return µP the sense of minimum variance
if we choose w minimizing
w′Ωw
subject to the condition
w′µ+ (1−w′1)µf = µP .
Note that we have not imposed the condition wi ≥ 0, i = 1, . . . , N. Let
L(w, δ) = w′Ωw + δ(µP −w′µ− (1−w′1)µf )
where δ is the Lagrange multiplier. Differentiating the function L(w, δ) with respect to w
and δ, and equating the derivatives to zero, we get the equations
∂L
∂w= 2Ωw + δ(−µ+ µf1) = 0, (5.3. 9)
∂L
∂δ= µP −w′µ− (1−w′1)µf = 0.
Hence the optimum portfolio P is given by
wµP =1
2δΩ−1(µ− µf1) (5.3. 10)
= λΩ−1(µ− µf1) (say).
To find λ, we use the restriction that the target for the expected return from the portfolio
should be µP . Hence
w′µPµ+ (1−w′
µP1)µf = µP
or equivalently
w′µP
(µ− µf1) = µp − µf .
Therefore
λ(µ− µf1)′Ω−1(µ− µf1) = µp − µf
which implies that
λ =µP − µf
(µ− µf1)′Ω−1(µ− µf1).
Let
cP =µP − µf
(µ− µf1)′Ω−1(µ− µf1)

104
and
wµP = cPΩ−1(µ− µf1)
= cP w (say).
Then wµP is the optimum vector of the weightage for the investments in the tangency port-
folio of the N risky assets and 1−w′µP
1 is the weightage for the investment in the risk-free
asset for a portfolio P with target expected return µP . The vector µ − µf1 is the vector of
excess returns. The excess return measures the excess return from the market for assuming
the risk by investing in the N risky assets as compared to the risk-free asset. Note that the
vector w does not depend on µp. Note that all investors should invest in the same mixture of
low, moderate and high risk stocks given by the tangency portfolio. Any individual investor
should determine only his own allocation between the tangency portfolio and the risk-free
asset. We leave it to the reader to compute the matrix Ω−1 and the vector wµP for the
case N = 2. In order to use these results in practice, it is necessary to estimate the vector
µ and the matrix Ω. This can be done possibly using the recent data on returns from the
risky assets. Computation of Ω−1 is difficult in general if N is large and hence the theory of
portfolio optimization can be used if the number of risky assets N is small.

Chapter 6
ESTIMATION OF VOLATILITY
AND VALUE-at-RISK
6.1 Introduction
As we have noticed in the earlier chapters, it is necessary to estimate the volatility parameter
of a stock if we are interested in the computation of the option prices for a stock through the
Black-Scholes option price formula. Under the no arbitrage assumption, the call option price
depends on the volatility of the stock but not on the trend or the average price. Estimation
of any parameter depends on the data available to estimate it. We will now discuss different
methods of estimation of the volatility parameter of a stock. Volatility parameter of a stock
is likely to change over long periods of time but fluctuations in volatility will be small if the
time series of stock prices is observed over short periods. The time series over a long period
of time is likely to be non-stationary but, for short periods, it is more likely to be stationary.
Let us look at some elementary properties of a random sample from a Gaussian distribution.
Suppose X1, X2, . . . , Xn is a random sample from the Gaussian distribution with mean µ and
variance σ2. Suppose we do not know the mean µ and the variance σ2.We assume that n ≥ 2.
Let X = 1n
∑ni=1Xi denote the sample mean. It is well known, from elementary results in
statistical inference, that the sample variance s2 defined by
s2 =1
n− 1
n−1∑i=1
(Xi − X)2
105

106
is an unbiased estimator for σ2, that is,
E(s2) = σ2
and
var(s2) =2σ4
n− 1.
These properties are consequences of the fact that the random variable
(n− 1)s2
σ2=
∑n−1i=1 (Xi − X)2
σ2
has the Chi-square distribution with (n− 1) degrees of freedom which has mean (n− 1) and
variance 2(n−1). As the sample size n increases , the variance of s2 decreases and it tends to
zero as n→ ∞. Furthermore it is unbiased. It can be shown that s2 is a consistent estimator
of σ2, that is, as the sample size increases s2 tends to be closer to σ2 in probability. We
will use these remarks to discuss different methods for the estimation of the the volatility
parameter.
6.2 General Method of Estimation of Volatility :
Suppose we assume that the stock price S(t) at time t follows a geometric Brownian motion,
that is,
S(t) = S(0)eµt+σBT , t ≥ 0
where the process Bt, t ≥ 0 denotes the standard Brownian motion. Let t = nℓ be the
present time and suppose we have observed the process at times ti = iℓ, i = 0, 1, . . . n. We
are interested in estimating the volatility parameter σ based on the observed data S(iℓ), i =
0, 1, . . . , n. Typically ℓ can be chosen as one trading day and S(iℓ) denotes the opening
price, or the closing price or the price at 12.00 noon or the price recorded at some specified
time chosen on the ıℓ-th trading day. Let
Xi = logS(iℓ)
S((i− 1)ℓ), i = 1, . . . , n.
Then the random variables Xi, i = 1, . . . , n are independent and identically distributed (i.i.d.)
random variables with the Gaussian distribution with mean ℓµ and variance ℓσ2. From the
remarks made earlier, an estimator for σ2 is
σ2 =1
ℓ
1
n− 1
n−1∑i=1
(Xi − X)2.

107
Furthermore, the variance of this estimator is given by
V ar(σ2) =1
ℓ22(ℓσ2)2
n− 1.
The assumption that the stock price follow a geometric Brownian motion is more reasonable
for the sequence S(iℓ), i = 0, 1, . . . , n where the time interval ℓ between observations is one
day rather than one hour. Stock prices at successive times which are close to each other are
unlikely to follow the geometric Brownian motion.
Estimation of volatility parameter by using the opening and the closing prices:
Suppose there are N trading days in an year and let Ci denote the closing price of a stock on
i-th trading day, that is, the price just before the trading of the stock closes. Let Di denote
the opening price of the stock, that is the stock price soon after the opening for trading in
the i-th day. Typically, Ci−1 = Di as there is likely to be no trading from the closing hours
on (i−1)-th day to the opening hours on the i-th trading day. Suppose the stock prices form
a geometric Brownian motion. Then the random variable
logCiCi−1
will have the Gaussian distribution with mean µN and variance σ2
N . If the number of trading
days is large, we can assume that µN is approximately zero. Hence
logCiCi−1
≃ N(0,σ2
N).
(For convenience, we write Y ≃ F if the random variable has the distribution F.) Note that
log(CiCi−1
) = log(CiDi
Di
Ci−1)
= log(CiDi
) + log(Di
Ci−1).
Suppose we assume that the random variables CiDi
and DiCi−1
are uncorrelated for i = 1, . . . , n.
We are assuming that the ratio price change between the opening price and closing price
during a trading day, say, today is uncorrelated with the ratio price change between today’s
opening price and yesterday’s closing price. Observe that the market for trading is closed
between the closing time of yesterday’s trading and the opening time of today’s trading.

108
Then
var(log(CiCi−1
)) = var(log(CiDi
)) + var(log(Di
Ci−1))
= var(C∗i −D∗
i ) + var(D∗i − C∗
i−1)
where Ci∗ = logCi and D∗i = logDi. The random variables C∗
i − D∗i and D∗
i − C∗i−1 have
mean zero approximately. We can estimate
V ar(log(CiCi−1
)) =σ2
N
by1
n
n∑i=1
(C∗i −D∗
i )2 +
1
n
n∑i=1
(D∗i − C∗
i−1)2
by the remarks made earlier. This leads to the estimator
σ2 =N
n[
n∑i=1
(C∗i −D∗
i )2 +
n∑i=1
(D∗i − C∗
i−1)2]
as an estimator for the parameter σ2.
Estimation of volatility parameter by using the opening prices, closing prices,
high prices and the low prices :
Suppose the stock price process follows a geometric Brownian motion with drift zero and
volatility σ2. We now describe a method of estimation of the volatility parameter of the
stock using the high price and the low price of the stock on each day along with the closing
and the opening prices of the stock on those days. Let H(t) be the highest price and L(t) be
the lowest price in an interval of length t, that is,
H(t) = sup0≤y≤t
S(y)
and
L(t) = inf0≤y≤t
S(y)
. Let x∗ = log x for any x > 0. It can be shown that
E[(H∗(t)− L∗(t))2] = (2.773) var(log(S(t)
S(0))).
(cf. L.C.G. Rogers and S.E. Satchell (1991) Estimating variance from high, low and closing
prices, Ann. Appl. Prob., 1, 504-512.)

109
Let Hi and Li denote the high and low prices on the i-th trading day. Applying the result
stated above, we get that
E[(H∗i − L∗
i )2] = (2.773)var(log(
CiDi
)).
Hence an estimator of var(log(CiDi
)) is
α1 =1
2.773
1
n
n∑i=1
(H∗i − L∗
i )2
=0.361
n
n∑i=1
(H∗i − L∗
i )2.
Another estimator of var(log(CiDi
)) = V ar(C∗i −D∗
i ) is
α2 =1
n
n∑i=1
(C∗i −D∗
i )2.
Any linear combination γα1 + (1 − γ)α2 of α1 and α2 can be used as an estimator of
var(log(CiDi
)). It can be shown that the best estimator, in the sense of minimum variance, is
obtained by choosing γ = 0.50.361 = 1.39. Hence the best estimator of V ar(log(Ci
Di)) is
δ = 1.39α1 − 0.39α2
=1
n
n∑i=1
[(0.5)(H∗i − L∗
i )2 − (0.39)(C∗
i −D∗i )
2].
We can estimate V ar(log( DiCi−1
)) = V ar(D∗i − C∗
i−1) by
τ =1
n
n∑i=1
(D∗i − C∗
i−1)2.
Hence an estimator of
V ar(log(CiCi−1
)) = V ar(log(CiDi
)) + V ar(log(Di
Ci−1))
is δ + τ. Recall that
V ar(log(CiCi−1
)) =σ2
N.
Hence another estimator for σ2 is
σ2 =N
n
n∑i=1
[(0.5)(H∗i − L∗
i )2 − (0.39)(C∗
i −D∗i )
2 + (D∗i − C∗
i−1)2].
Remarks : We have given some methods of estimation of volatility parameter σ using the
past or historical data. However, suppose we find a value of the parameter σ along with the

110
other parameters such as the initial price s, strike time t, strike price K, and continuously
compounding interest rate r of the option, which make the Black-Scholes European call
option price equal to the actual market price of the option. Such a value of the parameter σ
is called the implied volatility. Note that different options on the same stock with different
strike prices and different strike times give different implied volatility estimates for σ.
6.3 Estimation of Value-at-Risk (VaR)
There are different types of risks which an investor encounters in investing in a stock or
more generally in making an investment in a business venture. Market risk is the risk due
to changes in prices. Credit risk is the risk that the vendors do not meet the contractual
obligations or the companies which rased bonds do not pay the interest or repay the principal
invested in the bond. Liquidity risk is the risk involved in liquidating business when there
are no buyers for the product. There are various other types of risks involved in starting a
business or investing in stocks or in purchasing bonds floated by companies or due to other
unforeseen problems. Value-at-Risk (VaR) can be applied to all types of risks of stocks or
portfolios of different types of stocks. VaR uses two parameters for its definition; one is the
horizon T and the other is the confidence level (1− α) where 0 ≤ α ≤ 1. Given the horizon
T and the value α, the VaR is a value v such that the chance or probability that the loss in
the business during the horizon T or the time period T is less than v is 1− α. For example,
if the horizon T is one week and α = 0.05 and VaR is Rupees 5 lakhs, then there is only a
5% chance of loss exceeding Rupees 5 lakhs in the next one week.
Let C be the initial payment in an investment and X be the return from the investment after
one period, say, after one year. Suppose the interest rate r is simple. Then the present value
gain from the investment is
G =X
1 + r− C.
The VaR of the investment is the value v such that the probability that the loss from the
investment over one year period exceeds v is α, that is
P (−G > v) = α
or equivalently
P (−G ≤ v) = 1− α.

111
Note that −G represents the loss due to investment.
Parametric estimation of VaR :
Suppose the present value gain G from the investment has the Gaussian distribution with
mean µ and variance σ2. Then the random variable −G has the Gaussian distribution with
mean −µ and variance σ2. Hence
P (−G > v) = P (−G+ µ
σ>v + µ
σ)
= P (Z >v + µ
σ)
where Z has the standard normal distribution. Hence P (−G > v) = .05 only if
P (Z >v + µ
σ) = 0.05.
Thereforev + µ
σ= 1.64
and
v = −µ+ (1.64)σ.
Note that V aR = v depends on the expected gain µ and the variance σ2. These parameters
are unknown in general.
Suppose the log returns follow the Gaussian distribution with mean µ and variance σ2. Then
the α-th quantile is µ+Φ−1(α)σ where Φ(.) is the standard normal distribution function. Let
V aR(α) denote VaR with confidence coefficient (1− α). Suppose S is the initial investment.
Then
V aR(α) = −S(µ+Φ−1(α)σ)
and it can be estimated by
ˆV aR(α) = −S(x+Φ−1(α)s)
where x is the sample mean of the log returns and s is the sample standard deviation of the
log returns.
We now describe a nonparametric method for estimating the VaR.

112
Nonparametric estimation of VaR :
Suppose we have invested Rupees 2 lakhs in a portfolio of stocks such as the Sensex and we
would like to know the Value-at-Risk (VaR) of this investment over a time horizon of one
day with a confidence coefficient 95%. Further suppose that we have the data on the daily
returns over a period of 1000 days on the Sensex. Since 5% of 1000 is 50, an estimate of
VaR is the 50-th smallest daily return. Suppose this is equal to -0.0115. In other words, a
daily return of -0.0115 or less has occurred only 5% of the time in the past or historical data.
Hence we estimate that there is a 5% probability of a return of that size or less occurring. A
return of -0.0115 on an investment of Rupees 2 lakhs gives a loss of Rupees 2230. Hence an
estimate of VaR with the horizon T= one day and α=0.05 is Rupees 2230. Note that VaR
is a measure of the loss and hence it is negative of the revenue.
Suppose we want to estimate Var with a given horizon T and a given confidence coefficient
1 − α. Then we estimate the α-quantile of the distribution of returns over the horizon T
by the α-quantile of a sample of historical returns over the horizon T. The revenue on the
investment is the initial investment multiplied by the return. Hence we estimate VaR by the
product of the initial investment and the sample α-th quantile.
Suppose there are n log-returns R1, . . . , Rn from the past or historic data. Let k = [nα]
denote the integral part of nα. The α-th quantile of the sample R, . . . , Rn is the k-th smallest
return, that is, the k-th order statistic R(k) of the sample R1, . . . , Rn. If S is the initial
investment, then
V aR = −SR(k)
with confidence 1 − α. Note that the minus sign in the in the above equation indicates
indicates conversion of revenue into loss. This method of estimation of VaR is useful when
there is large size historical data of returns.
6.4 Conditional Value-at-Risk (CVaR)
Another idea for evaluating the risk from an investment is the concept of conditional Value-
at-Risk (CVaR). Instead of choosing an investment with the smallest VaR, for a given horizon

113
and confidence coefficient, it is suggested that one should consider the conditional expected
loss given that the loss exceeds VaR and choose that investment with the smallest CVaR.
Suppose the gain G has the Gaussian distribution with mean µ and Variance σ2. Suppose
we are interested in computing CVaR when the confidence coefficient 1− α = 0.95. Then
CV aR = E[−G| −G > V aR]
= E[−G| −G > µ+ 1.64σ]
= σE[−G+ µ
σ|−G+ µ
σ> 1.64]− µ
= σE[Z|Z > 1.64]− µ
where the random variable Z has the standard Gaussian distribution. Note that
E[Z|Z > a] =1
P (Z > a)
1√2πe−a
2/2.
Hence
CV aR = σ1√2π
e−(1.64)2/2
P (Z > 1.64)− µ
and we should choose an investment which minimizes this CVaR over µ and σ.
6.5 Remarks :
We have discussed the concept of Value-at-Risk (VaR) when a single asset or stock is present.
We can also extend this idea for a portfolio of assets. When VaR is to be estimated for a
portfolio of assets rather than a single asset, parametric estimation based on the assumption
of normally distributed log returns is convenient. Note that the portfolio theory uses the
standard deviation of the return distribution to measure the risk where as VaR uses the
quantiles of the distribution.

114

Chapter 7
CAPITAL ASSET PRICING
MODEL
7.1 Introduction
We have discussed methods of optimization in allocating investments efficiently in risky and
risk-less assets. Capital asset pricing model (CAPM) provides a justification for the practice
of investing known as indexing. Indexing means holding a diversified portfolio in which
stocks are held in the same relative proportions as in a broad market index such as Sensex.
Individual investors can do this by holding shares in an index fund. CAPM assumes that
the following conditions hold: (i) Market prices are in ”equilibrium” in the sense that, for
each asset, supply equals demand; (ii) Every investor has the same prediction of expected
return from a stock or the risk involved in trading that stock; (iii) All investors choose
portfolios optimally according to the method of efficient portfolios discussed earlier, that
is, every investor holds the same proportions in the mixture of tangency portfolio of risky
assets and the risk-free asset and only the amount invested in the mix might vary between
individuals depending on their funds for investments; (iv) The market rewards investors for
taking unavoidable risks when they are investing but there is no reward for taking risks by
choosing inefficient portfolios. Hence the risk premium on a stock is not due to its stand
alone status but due to its contribution to the risk of the tangency portfolio.
115

116
Let Rj be one period rate of return from a specified stock j and RM be the one period rate of
return from the market portfolio, that is, the tangency portfolio from the complete market as
measured through an index of stocks. Let µf be the risk-free interest rate. Then the Capital
Asset Pricing Model (CAPM) can be described by the model
Rj = µf + βj(RM − µf ) + ϵj (7.1. 1)
where βj is a constant called the beta of the stock j and the noise or error ϵj is assumed to
be independent of RM and has the Gaussian distribution with mean zero and variance σ2j .
Let µj = E[Rj ] and µM = E[RM ]. Then
µi = µf + βj(RM − µf ) (7.1. 2)
from (7.1.1). Furthermore it follows, from (7.1.1), that
Cov(Rj , RM ) = βjV ar(RM ) + Cov(ϵj , RM ) (7.1. 3)
= βjV ar(RM )
since the random variables ϵj and RM are independent by assumption. Hence
βj =Cov(Rj , RM )
V ar(RM ). (7.1. 4)
Let v2j = V ar(Rj), and v2M = V ar(RM ). Then
v2j = β2j v2M + σ2j (7.1. 5)
Hence the risk from the stock j is the systematic risk due to a combination of the beta of
the stock j and the inherent risk in the market M plus the non-systematic risk from the j
under the CAPM model.
7.2 Capital Market Line (CML)
Capital market line (CML) connects the excess expected return from an efficient portfolio
to its risk. Excess expected return means the amount by which the expected return from
the portfolio exceeds the risk-free rate of return. It is also called the risk premium. Let
µR denote the expected return from an efficient portfolio with return R and µM denote the
expected return from the market portfolio M which is the tangency portfolio of risky assets.
Let µf denote the return from the risk-free asset. Let σR denote the standard deviation

117
of the efficient portfolio R and σM denote the standard deviation of the market portfolio
M. Note that µf , µM and σM are constant but the parameters µR and σR depend on the
choice of efficient portfolio with return R. Observe that the quantity µR−µf denotes the risk
premium of R and the quantity µM − µf is the risk premium corresponding to the market
portfolio M. The capital market line is given by the equation
µR = µf +µM − µfσM
σR. (7.2. 1)
Observe that the slope of CML isµM − µfσM
and it is the ratio of the risk premium of the market portfolio M to the standard deviation
of the market portfolio M. This the Sharpe’s ”rewards-to-risk” ratio. The equation (7.2.1)
can be written in the formµR − µfσR
=µM − µfσM
which implies that the rewards-to-risk ratio for any efficient portfolio is equal to that of the
market portfolio M.

118
(The above figure adapted from ”Statistics and Finance: An Introduction”,David Ruppert,
Springer International edition (2006)).

119
Note that the rewards-to-risk ratio or the Sharpe ratio is the same for all efficient portfolios
including the market portfolio. Suppose w denotes the fraction of the total investment in
the market portfolio M and (1−w) denotes the fraction invested in the risk-free investment.
Let R denote the return from such a portfolio. Then
R = wRM + (1− w)µf (7.2. 2)
Taking expectations on both sides of the equation (7.2.2), we get that
µR = wµM + (1− w)µf .
Therefore
µR = µf + w(µM − µf ). (7.2. 3)
Note that
V ar(R) = w2 V ar(RM )
from the equation (7.2.2) and hence
σR = wσM
which implies that
w =σRσM
. (7.2. 4)
Combining the equations (7.2.3) and (7.2.4), we get that
µr = µf +σRσM
(µM − µf ). (7.2. 5)
which is the CML. It is easy to see that
w =σRσM
=µR − µfµM − µf
.
CAPM indicates the best or optimal way to invest in an index fund. (i) Suppose we decide
on the risk σR we are prepared to take. Suppose that 0 ≤ σR ≤ σM . Note that w = σRσM
and hence 0 ≤ w ≤ 1. We invest w fraction of our investment in the index fund which is the
market portfolio/tangency portfolio that tracks the market and invest the rest 1−w fraction
of the investment in the risk-free asset. (ii) On the other hand, suppose we fix the reward or
risk premium µr − µf which we want from the portfolio. If we require µf ≤ µR ≤ µM , then
we have the constraint 0 ≤ w ≤ 1. If we allow the investor to buy assets on margin, that is,
borrowing money to buy the market portfolio, then w will be greater than 1 and 1− w will
be negative. We calculate w =µR−µfµM−µf and follow the procedure described in (i).

120
The fraction w = σRσM
can be interpreted as an index of the risk aversion of the investor. The
smaller the value of w the more the investor is risk averse. If w = 0, then the investor will
be investing in risk-free asset completely. If w = 1, then he or she will be investing in the
tangency portfolio of risky assets completely.
7.3 Security Market Line (SML)
Security Market Line (SML) connects the excess return on an asset to the slope of its regres-
sion on the market portfolio. Observe that SML deals with all stocks where as CML applies
only to efficient portfolios. Suppose there are stocks indexed by j = 1, . . . , k. Let σjM denote
the covariance between the return Rj of the stock j and the return RM from the market
portfolio M. Let
βj =σjMσ2M
. (7.3. 1)
Suppose we consider the linear regression of Rj on RM . Then βj is the slope of the best linear
predictor Rj of Rj on the variable RM as the predictor variable. The best linear predictor
of Rj based on RM is
Rj = β0j + βjRM
where βj is as defined in (3.1). Suppose we have a bivariate time series (Rjt, RMt), t = 1, . . . , n
of the returns on the j-th stock and the market portfolio M. Then the estimate of the slope
of the linear regression of Rj on RM is
βj =
∑nt=1(Rjt − Rj)(RMt − RM )∑n
t=1(RMt − RM )2
and it is an estimator of βj . Here Rj is the sample mean of Rjt, t = 1, . . . , n and RM is the
sample mean of RMt, t = 1, . . . , n. Let µj be the expected return from the stock j and µM
be the expected return from the market portfolio M. Note that µj − µf is the risk premium
corresponding to the stock j. We will show later in this section that
µj − µf = βj(µM − µf ). (7.3. 2)
This equation is called security market line (SML) for the stock j. Equation (3.2) indicates
that the risk premium µj −µf from the stock j is the product of its βj and the risk premium
µM − µf from the market portfolio. The parameter βj measures the riskiness of the stock
j and it is called the beta of the stock. It measures also the reward associated with this

121
riskiness. The beta of the market portfolio βM = 1. If βj > 1, then the stock j can be termed
as aggressive. If βj = 1, then the stock j can be termed as of average risk. If βj < 1, then
the stock j can be termed as not aggressive.
Derivation of SML using portfolio theory:
Let us consider a portfolio P with weight wi corresponding to the j-th risky asset such as a
stock and weight (1 − wj) to the market portfolio M. Then the return RPt at time t from
this portfolio P is
RPt = wjRjt + (1− wj)RMt (7.3. 3)
where Rjt is the return from the asset j at time t and RMt is the return from the market
portfolio at time t. Let µP = E[RPt], µj = E[Rjt], µM = E[RMt], σ2j = V ar[Rjt], σ
2P =
V ar[RPt], σ2M = V ar[RMt] and σjM = Cov(Rjt, RMt). Then
µP = E(RPt) = wjµj + (1− wj)µM (7.3. 4)
and
σ2P = w2jσ
2j + (1− wj)
2σ2M + 2wj(1− wj)σjM . (7.3. 5)
Differentiating on both sides equation the equation (3.4) with respect to wj , we get that
dµPdwj
= µj − µM (7.3. 6)
and differentiating on both sides equation the equation (3.5) with respect to wj , we get that
dσPdwj
=1
2σ−1P [2wjσ
2j − 2(1− wj)σ
2M + 2(1− 2wj)σjM ].
Hence
dµPdσP
=
dµPdwj
dσPdwj
=(µj − µM )σP
wjσ2j − (1− wj)σ2M + (1− 2wj)σjM.
Therefore
[dµPdσP
]wj=0 =(µj − µM )σPσjM − σ2M
Recall that if wj = 0, then the portfolio P is the same as the market portfolio or the tangency
portfolio which implies that
[dµPdσP
]wj=0

122
should be equal to the slope of CML which is equal to
µM − µfσM
where µf is the return from the risk-free asset. Therefore
(µj − µM )σMσjM − σ2M
=µM − µfσM
(7.3. 7)
which implies that
µj − µf =σjMσ2M
(µM − µf ) = βjM (µM − µf ) (7.3. 8)
which in turn is the SML.
7.4 Security Characteristic Line (SCL)
Let Rjt be the return on the stock j at the time t. Let RMt be the return from the market
portfolio M at time t and µft be the risk-free return at time t. The security characteristic
line (SCL) also termed as the characteristic line is the linear regression model given by
Rjt = µft + βj(RMt − µft) + ϵjt. (7.4. 1)
We assume that the random variable ϵjt has the Gaussian distribution with mean zero and
variance σ2ϵj . Furthermore we assume that the random variables ϵjt and ϵkt are uncorrelated
if j = k for any fixed t and for any fixed j, ϵjt are i.i.d. for different times t. Let µjt = E(Rjt)
and µMt = E(RMt). Taking expectations on both sides of the equation (4.1), we get that
µjt = µft + βj(µMt − µft)
which is called the security market line (SML). The SML gives information on the expected
returns and the SCL gives the relation for computation of the variances of the returns. The
characteristic line gives a probability model for the returns from stock j. Following the relation
(7.4.1) given by the SCL, we note that
σ2j = β2j σ2M + σ2ϵj ,
σjk = βjβkσ2M , j = k,
and
σjM = βjσ2M .

123
The risk for the stock j is
σj = [β2j σ2M + σ2ϵj ]
1/2.
Note that the risk from the stock j has two components. The component β2j σ2M is called the
market risk or the systematic component of the risk of the stock j and the component σ2ϵj is
called the non-market risk or the unsystematic component of the risk of the stock j. .
Let us now consider ways by which one can reduce the non-market risk of stock j. This is
done by diversification.
Reducing non-market risk by diversification :
Suppose that there are N stocks with returns R1t, . . . , RNt at time t. Let P be a portfolio
with fraction wi of the investment in the i-th stock with w1 + . . .+wN = 1. Then the return
from the portfolio is RPt =∑N
i=1wiRit. Assume that the characteristic line model (SCL)
holds for the returns Rjt, j = 1, . . . , N. Then
Rjt = µft + βj(RMt − µft) + ϵjt, j = 1, . . . , N
and hence
RPt =
N∑j=1
wjRjt
=N∑j=1
wj [µft + βj(RMt − µft) + ϵjt]
= µft + (
N∑j=1
βjwj)(RMt − µft) +
N∑j=1
wjϵjt.
Hence the beta of the portfolio beta βP is given by
βP =
N∑j=1
wjβj
and the error ”epsilon” ϵPt for the portfolio P is given by
ϵPt =
N∑j=1
wjϵjt.
Since the random variables ϵjt, j = 1, . . . , N are uncorrelated by assumption, we get that
σ2ϵP =
N∑j=1
w2jσ
2ϵj .

124
Suppose that w1 = . . . = wN = 1N , that is, we invest equal amount in all the N stocks. Then
βP =∑N
j=1 βj and
σ2ϵP =1
N2
N∑j=1
σ2ϵj .
If σ2ϵj is the same, say σ2ϵ , for all the N stocks, then
σ2ϵP =1
Nσ2ϵ
and the last term tends to zero as N → ∞.
Contribution of a stock to the risk of the market portfolio :
Suppose that the market portfolio M consists of N risky assets and that the weight of the
j-th asset is wjM , j = 1, . . . , N. Then the return RMt from the market portfolio M at the
time t is given by
RMt =
N∑j=1
wjMRjt
where Rjt is the return from the j-th asset at time t. Hence
σjM = cov(Rjt, RMt) (7.4. 2)
= cov(Rjt,
N∑i=1
wiMRit)
=
N∑i=1
wiMcov(Rjt, Rit)
=N∑i=1
wiMσij
and
σ2M =N∑i=1
N∑j=1
wiMwjMσij (7.4. 3)
=
N∑j=1
wjMσjM
from (4.2). Equation (4.3) shows that the contribution of the asset j to the risk of the market
portfolio M is wjMσjM where wjM is the weight of the j-th asset in the market portfolio
and σjM is the covariance between the the return on the j-th asset and the return from the
market portfolio M.

125
7.5 Testing for CAPM
Note that the security characteristic line corresponding to the stock j gives the relation
between excess return from the stock j at the time t to the excess return from the market
portfolio M at time t and it is modelled by the linear model
Rjt = µft + βj(RMt − µft) + ϵjt. (7.5. 1)
Here µft is the return from the risk-free asset at time t. Let R∗jt = Rjt − µft and R∗
Mt =
RMt − µft. Then
R∗jt = βjR
∗MT + ϵjt. (7.5. 2)
This can be interpreted as a linear regression model without the intercept, under the CAPM,
between R∗jt, the excess return from stock j over the risk-free return µft and R
∗Mt, the excess
return from the market portfolio M over the risk-free return µft. A more general model is
R∗jt = αj + βjR
∗MT + ϵjt. (7.5. 3)
interpreting that αj = 0 indicates that the stock j is mispriced in the market.
On the basis of the observed bivariate data (Rjt, RMt), t = 1, . . . , n, we can calculateR∗jt, R
∗Mt, t =
1, . . . , n and find the linear regression of R∗jt on RMt to estimate αj , βj and σ2ϵj . Testing of
the hypothesis H0 : αj = 0 is equivalent to testing whether the stock j is mispriced in the
market according to CAPM. While fitting any of the above models, one should use daily
data if available than weakly or monthly data as the betas for the stocks might change over
longer periods.

126

Chapter 8
OPTION PRICING WHEN
STOCK PRICES ARE LIKELY
TO JUMP
8.1 Introduction
We have discussed methods of computing option prices under the no arbitrage opportunity
assumption when the stock price process evolves following a geometric Brownian motion. A
problem with the assumption using the geometric Brownian motion for the evolution of stock
prices is that it does not allow discontinuities in prices as the sample paths of a geometric
Brownian motion are continuous with probability one. It is obvious that jumps in prices
of a stock , either upward or downward, do occur in practice due to several factors such
as economic, political or natural happenings. It is therefore necessary to consider models
for price processes which take care of this issue. We now consider one such model for price
process of a stock that superimposes random jumps on a geometric Brownian motion and
compute the option price for such a stock under this model.
127

128
8.2 Geometric Brownian Motion with Superimposed Jumps
Let N(0) = 0 and let N(t) denote the number of jumps that occur by time t for t > 0.
Suppose that the process N(t), t ≥ 0 is a Poisson process with mean λt. Note that Poisson
process is a process with stationary independent increments. Under such a process, the
probability that there is a jump in a time interval of length h is approximately λh for h small
and the probability of more than one jump in a time interval of length his almost zero for h
small. Furthermore the probability that there is a jump in an interval does not depend on
the information about the earlier jumps.
Suppose that, when the i-th jump occurs, the price of a stock is multiplied by an amount
Ji and the random sequence Ji, i ≥ 1 form an independent and identically distributed
(i.I.d) sequence of random variables. Further assume that the random sequence Ji, i ≥ 1
is independent of the times at which jumps occur.
Let S(t) denote the price of a stock at time t. Suppose
S(t) = S∗(t)ΠN(t)i=1 Ji, t ≥ 0
where S∗(t), t ≥ 0 is a geometric Brownian motion with drift parameter µ and volatility
parameter σ which is independent of the random sequence Ji, i ≥ 1 and of the times at
which jumps occur. Note that, if there is a jump in the price process at time t , then the
jump is of size Ji at the i-th jump. Let
J(t) = ΠN(t)i=1 Ji, t ≥ 0
and we define ΠN(t)i=1 Ji = 1 if N(t) = 0. Note that
logS∗(t)
S∗(0)≃ N(µt, σ2t).
Note that S(0) = S∗(0) is the initial stock price and we assume that it is non-random. Let
us compute E[S(t)]. Note that
E[S(t)] (8.2. 1)
= E[S∗(t)J(t)]
= E[S∗(t)]E[J(t)] (by the independence S∗(t) and J(t))
= S∗(0)eµt+12σ2tE[J(t)]

129
from the properties of the Gaussian distribution. We will now compute E[J(t)] and V ar[J(t)].
For any integer m ≥ 1,
E[Jm(t)|N(t) = n] = E[ΠN(t)i=1 J
mi |N(t) = n]
= E[Πni=1Jmi |N(t) = n]
= E[Πni=1Jmi ] (by the independence of Ji, 1 ≤ i ≤ n and N(t))
= (E[Jm1 ])n (since the sequence Ji, i ≥ 1 are i.i.d.).
Hence
E[Jm(t)] = E(E[Jm(t)|N(t)])
=∞∑n=0
E[Jm(t)|N(t) = n]P (N(t) = n)
=∞∑n=0
(E[Jm1 ])ne−λt(λt)n
n!
=∞∑n=0
e−λt(λtE[Jm1 ])n
n!
= e−λteλtE[Jm1 ]
= e−λt(1−E[Jm1 ])
for any integer m ≥ 1. Therefore
E[J(t)] = e−λt(1−E[J1])
and
var[J(t)] = E[J2(t)]− (E[J(t)])2
= e−λt(1−E[J21 ]) − e−2λt(1−E[J1]).
In particular, the equation (2.1) implies that
E[S(t)] = S∗(0)eµt+12σ2te−λt(1−E[J1]). (8.2. 2)
Suppose the interest rate r is compounded continuously. Then the future value of the initial
stock price S(0), after time t, should be S(0)ert. Under the no arbitrage assumption, we
should have
S∗(0)eµt+12σ2te−λt(1−E[J1]) = S(0)ert.

130
Since S(0) = S∗(0), it follows that there will be no arbitrage opportunity or equivalently,
under the risk-neutral probability, the stock price process should satisfy the relation
µ+1
2σ2 − λ(1−E[J1]) = r
which implies that
µ = r − 1
2σ2 + λ(1− E[J1]) (8.2. 3)
under the no arbitrage assumption. The price for an European call option with the strike
price K and the strike time t is equal to
E[e−rt(S(t)−K)+]
where the expectation is compute with respect to the Gaussian distribution with mean [r −12σ
2 + λ(1 − E[J1])]t and variance σ2t. Let W be a Gaussian random variable with mean
[r − 12σ
2 + λ(1− E[J1])]t and variance σ2t. Note that the option price for an European call
option under this model is
E[e−rt(S(t)−K)+] = e−rtE[(J(t)S∗(t)−K)+]
= e−rtE[(J(t)S∗(0)eW −K)+]
where S∗(0) = S(0) is the initial price of the stock.
Special case :
Let us consider a special case of the model for the stock price process discussed above.
Suppose that the jumps Ji, i ≥ 1 are i.i.d. log-normal with parameters µ1 and σ21. It is easy
to check that
E[J1] = eµ1+12σ21 .
Let Xi = log Ji, i ≥ 1. Then the random variables Xi, i ≥ 1 are i.i.d. with Gaussian distribu-
tion with mean µ1 and variance σ21. Observe that
J(t) = ΠN(t)i=1 Ji = Π
N(t)i=1 e
Xi = e∑N(t)
i=1 Xi .
Hence the option price for the European call option under the no arbitrage assumption is
equal to
e−rtE[(S∗(0)eW+∑N(t)
i=1 Xi −K)+]. (8.2. 4)

131
We will now compute this expectation. Under the condition N(t) = n, the random variable
W +∑N(t)
i=1 Xi has the Gaussian distribution with mean ((r− 12σ
2+λ(1−E[J1])t+nµ1) and
variance (tσ2 + nσ21). Let
σ2(n) = σ2 +nσ21t
and
r(n) = (r − 1
2σ2 + λ(1− E[J1]) +
nµ1t
+σ2(n)
2
= r + λ− λE[J1] +n
t(µ1 +
σ212)
= r + λ− λE[J1] +n
tlogE[J1].
Hence, given that N(t) = n, the random variableW+∑N(t)
i=1 Xi has the Gaussian distribution
with mean (r(n)− 12σ
2(n))t and variance σ2(n)t. Let S(0) = S∗(0) = s. Under the condition
N(t) = n, we can interpret r(n) as the interest rate and compute the European call option
price with strike price K and strike time t when the volatility is σ(n). Then the European
call option price is given by
e−r(n)tE[(seW+∑N(t)
i=1 Xi −K)+|N(t) = n] = C(s, t,K, σ(n), r(n))
following the notation used earlier. Therefore
e−rtE[(seW+∑N(t)
i=1 Xi −K)+|N(t) = n] = e(r(n)−r)tC(s, t,K, σ(n), r(n)).
Hence the European call option price under this model, given by the equation (2.4), is equal
to
∞∑n=0
e(r(n)−r)tC(s, t,K, σ(n), r(n))P (N(t) = n)
=
∞∑n=0
e(r(n)−r)tC(s, t,K, σ(n), r(n))e−λt(λt)n
n!
=
∞∑n=0
e−λtE[J1] (λt)n(E[J1])
n
n!C(s, t,K, σ(n), r(n))
(by the definition of r(n))
=∞∑n=0
e−λtE[J1] (λtE[J1])n
n!C(s, t,K, σ(n), r(n)).
General case:

132
Suppose the distribution of the jumps Ji is some general distribution. Then the European
call option price under the no arbitrage condition is
e−rtE[(J(t)S∗(0)eW −K)+]
where the random variable W has the Gaussian distribution with the mean (r − 12σ
2 + λ −
λE[J1])t and the variance σ2t. Let
W ∗ =W − λt(1− E[J1])
and
st = S∗(0)eλt(1−E[J1]) =S∗(0)
E[J(t)].
Then the option price of a European call option, under this general model, can be written in
the form
E[e−rt(stJ(t)eW ∗ −K)+]
where
W ∗ ≃ N((r − 1
2σ2)t, σ2t).
Therefore the option price of a European call option, under this model, is given by
E[C(stJ(t), t,K, σ, r)].
Since the function C(s, t,K, σ, r) is a convex function in s, it follows that
E[C(stJ(t), t,K, σ, r)] ≥ C(E[stJ(t)], t,K, σ, r)]
by the Jensen’s inequality. This implies that the European call option price when there are
jumps in the stock price process is greater than the European call option price when there
are no jumps in the stock price process or the stock price process is continuous.

Chapter 9
OPTION PRICING USING
AUTOREGRESSIVE MODELS
FOR STOCK PRICE PROCESS
9.1 Autoregressive models
We have discussed methods for computing option prices when the stock price process is
modelled according to a geometric Brownian motion or a geometric Brownian motion super-
imposed with jumps occurring according to a Poisson process under no arbitrage assumption.
We will now discuss autoregressive models for the evolution of stock prices and compute op-
tion prices under such models.
Let S(n) be the stock price on a stock at the end of n-th trading day and let
L(n) = logS(n).
If we assume the geometric Brownian motion model for the stock price process, then
L(n) = a+ L(n− 1) + e(n)
where e(n), n ≥ 1 is a sequence of independent and identically distributed (i.i.d.) Gaussian
random variables with mean zero and variance σ2N and a = µN . Here N is the number of
trading days, µ is the drift parameter for the geometric Brownian motion and σ is the
133

134
volatility parameter for the geometric Brownian motion. We now consider a more general
model. Suppose
L(n) = a+ b L(n− 1) + e(n), n ≥ 1
where the random sequence e(n), n ≥ 1 is a sequence of i.i.d. Gaussian random variables
with mean zero and variance σ2N and a and b are are constants. The parameters a and b
can be estimated by the method of least squares using the the data L(1), . . . , L(k) based on
the closing prices on k successive trading days, that is, we estimate a, b and σ by minimizing
the sum of squaresk∑i=1
(L(i)− a− b L(i− 1))2.
Note that
L(n) = e(n) + a+ b L(n− 1)
= e(n) + a+ b(e(n− 1) + a+ b L(n− 2))
Proceeding in this way, we get that
L(n) =
r∑i=0
bie(n− i) + a
r∑i=0
bi + br+1L(n− r − 1) (9.1. 1)
for any 0 ≤ r < n. Choosing r = n− 1, we get that
L(n) =
n−1∑i=0
bie(n− i) + a
n−1∑i=0
bi + bnL(0).
Observe that the random variable∑n−1
i=0 bie(n− i) is Gaussian with mean zero and variance
n−1∑i=0
b2iσ2
N=σ2(1− b2n)
N(1− b2)
assuming that b = 1. Note that if b = 1 then the problem reduces to the geometric Brownian
motion case discussed earlier. Suppose L(0) = logS(0) = h. Then the random variable L(n)
is Gaussian with mean
m(n) =a(1− bn)
1− b+ bnh
and variance
v(n) =σ2(1− b2n)
N(1− b2).
Furthermore the price of the European call option with the strike price K and the strike time
at the end of the n-th trading day, is
E[e−r.nN (S(n)−K)+] = E[e−r
nN (eL(n) −K)+]

135
where r is the interest rate compounded continuously. Since the random variable L(n) has
the Gaussian distribution with mean m(n) and variance v(n), check that
E[e−rnN (eL(n) −K)+] = e−r
nN [em(n)+ 1
2v(n)Φ(
√v(n)− g)−KΦ(−g)] (9.1. 2)
where
g =logK −m(n)√
v(n).
This can be seen from the computations made in the chapter on option pricing.

136

Chapter 10
A SHORT INTRODUCTION TO
STOCHASTIC DIFFERENTIAL
EQUATIONS
10.1 Introduction
Many models in financial economics such as the option pricing models discussed in the earlier
chapters, interest rate models and other types of asset pricing models have been developed
using the ideas from stochastic differential equations in their formulation. Our interest in this
chapter is to introduce basic ideas the theory of stochastic differential equations. A detailed
study is outside the scope of these lectures.
10.2 Brownian Motion
We have used the ideas of a Brownian motion and a geometric Brownian motion the earlier
chapters. We now define this process more formally.
Let (Ω,F , P ) be a probability space and the collection Ft, t ≥ 0 be a family of sub-σ-
algebras contained in F such that Ft ⊂ Fs if 0 ≤ t ≤ s <∞. The family Ft, t ≥ 0 is called
a filtration. Let X= Xt, t ≥ 0 be a stochastic process defined on the probability space
137

138
(Ω,F , P ) with the following properties:
(i) the random variable Xt is Ft-measurable and E|Xt| <∞; and
(ii) E(Xs|Ft) = Xt a.s. [P ], 0 ≤ t ≤ s <∞.
Such a process is called a martingale. The term E(Xs|Ft) is called the conditional expecta-
tion of the random variable Xs given the σ-algebra Ft. A formal definition of a conditional
expectation of a random variable given a sigma-algebra is beyond the scope of these lectures.
Suppose the sub-σ-algebra Ft is generated by the random variables Xs, 0 ≤ s ≤ t, that is,
it is the smallest σ-algebra with respect to which the random variables Xs, 0 ≤ s ≤ t are
measurable. Then we can interpret Ft as the history of the process X up to time t or the
information from the process up to time t.
A stochastic process W = Wt,Ft, t ≥ 0 is called a standard Wiener process relative to the
filtration Ft, t ≥ 0 if
(i) the trajectories Wt(ω), t ≥ 0 are continuous in t a.s. [P ];
(ii) the process W = Wt,Ft, t ≥ 0 is a square integrable martingale with W0 = 0; and
(iii)E[(Wt −Ws)2|Fs] = t− s, 0 ≤ s ≤ t <∞.
Let the process Bt, t ≥ 0 be a stochastic process defined on the probability
space (Ω,F , P ) with the following properties:
(i)B0 = 0 a..s.[P ];
(ii) the process Bt, t ≥ 0 has stationary and independent increments, that is, for any
t, h ≥ 0, the distribution of the random variable Bt+h − Bt is the same as the distri-
bution of Bh − B0 and for any 0 ≤ t1 < t2 ≤ t3 < t4 < ∞, the increment Bt4 − Bt3 is
independent of the increment Bt2 −Bt1 ; and

139
(iii) for any 0 ≤ t, s < ∞, the random variable Bt −Bs has the Gaussian distribution with
mean zero and variance N(0, |t− s|).
Such a process is called the standard Brownian motion. It can be shown that a process is
a Wiener process if and only if it is a Brownian motion. Here after we do not distinguish
between these processes.
There always exists a version of the standard Wiener process Wt, t ≥ 0 satisfying the
following properties.
(i) The sample paths of the process Wt, t ≥ 0 are continuous with probability one;
(ii) The sample paths of the process are of unbounded variation with probability one;
(iii) The sample paths of the process are nowhere differentiable with probability one.
Let Ft be the σ-algebra generated by the random variables Ws, 0 ≤ s ≤ t. It can be checked
that Wt,Ft, t ≥ 0 is a martingale. Furthermore
E[(Wt −Ws)2|Fs] = t− s, t ≥ s ≥ 0.
Let 0 = t0n < t1n < . . . < tnn = T be a subdivision of the interval [0, T ] such that
maxi
|ti+1,n − tin| → 0
as n→ ∞. It is known that
limn→∞
n−1∑i=0
[Wti+1,n −Wtin ]2 = T a.s. [P ].
Let the process f(t), t ≥ 0 be a stochastic process defined on the probability space (Ω,F , P )
with an associated filtration Ft, t ≥ 0. The process f(t), t ≥ 0 is called non-anticipative
with respect to the filtration Ft, t ≥ 0 if, for each t, the random variable ft is Ft-measurable.

140
10.3 Stochastic integral
We will now define stochastic integral with respect to a Wiener process W (t),Ft, t ≥ 0 for
a class of non-anticipative stochastic processes ft, t ≥ 0. Note that the classical method of
Riemann or Lebesgue-Stieltjes integration cannot be extended to define a stochastic integral,
with respect to the Wiener process as the integrator,since the sample paths of Wiener process
are of unbounded variation with probability one.
A stochastic process f(t), t ≥ 0 is said to be simple non-anticipative if there exists a finite
subdivision 0 = t0 < t1 < . . . , tn = T of the interval [0, T ] where
f(t) = α0 for t = t0 = 0
= αi for ti < t < ti+1, 1 ≤ i ≤ n− 1
where α0 is F0-measurable and αi is Fti-measurable.
If a process f is simple non-anticipative, we define the stochastic integral IT (f) of the process
f with respect to the Wiener process over the interval [0, T ] by the equation
IT (f) ≡∫ T
0f(t)dW (t) =
n−1∑i=0
αi[W (ti+1)−W (ti)]. (10.3. 1)
Lemma 3.1 : Let f be a non-anticipative process such that∫ T0 E[f2t ]dt <∞ and MT denote
the class of all such processes defined on the probability space (Ω,F , P ) with the filtration
Ft, t ≥ 0. Then there exists a sequence fn of simple non-anticipative processes such that∫ T
0E[f(t)− fn(t)]
2dt→ 0 as n→ ∞.
For f ∈ MT , we define
IT (f) = l.i.mn→∞IT (fn). (10.3. 2)
Here l.i.m. denotes the limit in quadratic mean. A sequence of random variables Xn is said
to converge to X in quadratic mean (l.i.m.) if E[(Xn −X)2] → 0 as n→ ∞.

141
Let PT be the class of non-anticipative processes defined on the probability space (Ω,F , P )
with the filtration Ft, t ≥ 0 such that
P (
∫ T
0f2(t)dt <∞) = 1.
Lemma 3.2 : Let f ∈ PT . Then there exists a sequence fn ∈ MT , such that∫ T
0[fn(t)− f(t)]2dt→ 0 in probability as n→ ∞.
For f ∈ MT , define
IT (f) =
∫ T
0f(t)dW (t) = lim
n→∞IT (fn) (10.3. 3)
where the limit is in the sense of convergence in probability. It can be shown that the limit
IT (f) does not depend on the choice of the sequence fn in Lemma 3.2. This integral is
called the Ito integral of the process f with respect to the Wiener process over the interval
[0, T ]. We will omit the proofs of Lemmas 3.1 and 3.2.
10.4 Properties of an Ito Stochastic Integral
The following properties hold for the Ito stochastic integrals. We do not discuss the proofs
of these results.
(i) If f ∈ MT , then
E[
∫ T
0f(t)dW (t)] = 0,
and
E[
∫ t
0f(t)dW (t)]2 = E[
∫ t
0f2(t)dt].
(ii) If f1 ∈ MT and f2 ∈ MT , then
E[
∫ T
0f1(t)dW (t)
∫ T
0f2(t)dW (t)] =
∫ T
0E[f1(t)f2(t)]dt.
The following inequality is an inequality of the Chebyshev type.

142
(iii) If f ∈ PT , then, for any ϵ > 0, and δ > 0,
P (|∫ T
0f(t)dW (t)| > ϵ) ≤ P (
∫ T
0f2(t)dt > δ) +
δ
ϵ2.
It can be checked that ∫ T
0W (t)dW (t) =
W 2(T )− T
2
which shows that stochastic calculus for the Ito integrals is different from the ordinary calculus
using the Riemann integrals. Let us look at some additional properties of the Ito integrals.
For any f ∈ PT , let
It(f) =
∫ t
0f(t)dW (t), 0 ≤ t ≤ T.
It can be shown that the process It(f),Ft, t ≥ 0 is a martingale. Suppose τ is a stopping
time with respect to the filtration Ft, t ≥ 0, that is, the random variable τ is F-measurable
and the set [ω : τ(ω) ≤ t] ∈ Ft for every t ≥ 0. Then the random variable
Iτ (f) ≡∫ τ
0f(t)dW (t)
denotes the process IT (f), t ≥ 0 stopped at time τ. If τ1 and τ2 are stopping times such
that τ1 ≤ τ2 a.s ,then∫ τ2
τ1
f(t)dW (t) =
∫ τ2
0f(t)dW (t)−
∫ τ1
0f(t)dW (t).
Suppose f ∈ MT and τ1 ≤ τ2 ≤ T a.s. Then
(i) E[∫ τ2τ1f(t)dW (t)] = 0;
ii) E[∫ τ2τ1f(t)dW (t)]2 = E[
∫ τ2τ1f2(t)dt];
(iii) E[∫ τ2τ1f(t)dW (t)|Fτ1 ] = 0 a.s. [P ], and
(iv) E([∫ τ2τ1f(t)dW (t))2|Fτ1) = E[
∫ τ2τ1f2(t)dt|Fτ1 ] a.s. [P ].
Typical examples of stopping times are the first passage times
ζ1 = inft ≥ 0 :W (t) ≥ a
and
ζ2 = inft ≥ 0 :
∫ t
0f(s)dW (s) ≥ a

143
for some non-anticipative random process f(t) ∈ Mt for every t ≥ 0 and a ∈ R. The following
central limit theorem holds for the Ito stochastic integrals.
Theorem 4.1: Suppose f ∈ PT for every T > 0 and
1
T
∫ T
0f2(t)dt→ σ2 in probability as T → ∞.
Then1√T
∫ T
0f(t)dW (t)
L→ N(0, σ2) as T → ∞.
10.5 Stochastic Differential Equations
Consider the stochastic differential equation
dX(t) = a(t,X(t))dt+ σ(t,X(t))dW (t), 0 ≤ t ≤ T,X(0) = X0 (10.5. 1)
where the random variable X(0) is independent of the process W (t), t ≥ 0. The equation
(5.1) is to be interpreted as the stochastic integral equation
X(T )−X(0) =
∫ T
0a(t,X(t))dt+
∫ T
0σ(t,X(t))dW (t)
where the first integral is a Lebesgue-Stieltjes integral and the second integral is a stochastic
integral with respect to the Wiener process defined above.
A stochastic process X(t), 0 ≤ t ≤ T is called a solution of the stochastic differential
equation (5.1) if it satisfies the following conditions.
(i) Let Ft denote the smallest σ-algebra generated by the random variables X(s), 0 ≤ s ≤
t;W (s), 0 ≤ s ≤ t. Then the increment W (t+ s)−W (t) is independent of Ft for any s > 0;
(ii) Let H2[0, T ] denote the space of the measurable random functions ϕ(t) such that, for
each t ∈ [0, T ], the function ϕ(t) is Ft-measurable and∫ T
0ϕ2(t)dt <∞ a.s.[P ].

144
Suppose that the processes |a(t,X(t))|1/2, 0 ≤ t ≤ T and σ(t,X(t)), 0 ≤ t ≤ T belong to
H2[0, T ].
(iii) Suppose the process X(t), 0 ≤ t ≤ T on [0, T ] satisfies the stochastic differential
equation
dX(t) = a(t)dt+ σ(t)dW (t), 0 ≤ t ≤ T,
where a(t) = a(t,X(t)) a.s. [P ] and σ(t) = σ(t,X(t)) a.s. [P ], in the sense that
X(t) = X(0) +
∫ t
0a(s,X(s))ds+
∫ t
0σ(s,X(s))dW (s), 0 ≤ t ≤ T. (10.5. 2)
Theorem 5.1: Suppose there exists positive constants K,L such that, for every 0 ≤ t ≤ T
and x, y ∈ R,
|a(t, x)− a(t, y)|+ |σ(t, x)− σ(t, y)| ≤ K|x− y|
and
|a(t, x)|2 + |σ(t, x)|2 ≤ L(1 + |x|2)
and the random variable X(0) is independent of the Wiener process W (t), t ≥ 0 with
E[X(0)]2 < ∞. Then there exists a solution X(t), 0 ≤ t ≤ T of the stochastic differential
equation (5.1) satisfying the following conditions:
(i)the process has continuous paths with probability one;
(ii) sup0≤t≤T E[X2(t)] <∞; and
(iii) if the processes X1(t), 0 ≤ t ≤ T and X2(t), 0 ≤ t ≤ T are two solutions of the
stochastic differential equation (5.1) satisfying the conditions (i) and (ii), then they are the
same in the sense that
P [ sup0≤t≤T
|X1(t)−X2(t)| = 0] = 1.
We do not go into proofs of these results.
A process X(t), 0 ≤ t ≤ T satisfying the equation (5.1) is called a diffusion process. The
coefficient a(t,X(t)) is called the drift coefficient of the diffusion process and the coefficient
σ(t,X(t)) is called the diffusion coefficient of the diffusion process.

145
Suppose a diffusion process X(t), 0 ≤ t ≤ T has the stochastic differential
dX(t) = a(t,X(t))dt+ σ(t,X(t))dW (t), 0 ≤ t ≤ T.
Let F (t, x) be a function continuous on [0, T ]×R. The following lemma, known as the Ito’s
lemma, gives the stochastic differential for the process F (t,X(t)) under some conditions.
Lemma 5.1 : Let F (t, x) be a continuous function on [0, T ] × R, with continuous first
partial derivatives Ft(t, x), Fx(t, x) with respect to t and x respectively and a second partial
derivative Fxx(t, x) with respect to x. Suppose the diffusion process X = X(t), 0 ≤ t ≤ T
satisfies the the stochastic differential equation
dX(t) = a(t,X(t))dt+ σ(t,X(t))dW (t), X(0), 0 ≤ t ≤ T.
Then the process Z(t) = F (t,X(t)), t ≥ 0 is a diffusion process with the stochastic differ-
ential
dZ(t) = [Ft(t,X(t)) + Fx(t,X(t))a(t,X(t)) +1
2Fxx(t,X(t))σ2(t,X(t))]dt
+Fx(t,X(t))σ(t,X(t))dW (t), 0 ≤ t ≤ T
with Z(0) = F (0, X(0)).
We do not discuss the proof of this important lemma known as the Ito’s lemma. We now
discuss some examples to illustrate the applicability of this lemma.
Example 10.5.1: Consider the stochastic differential equation
dX(t) = dW (t), 0 ≤ t ≤ T,W (0) = 0. (10.5. 3)
Let the function F (t, x) = x2. Then Ft(t, x) = 0, Fx(t, x) = 2x and Fxx(t, x) = 2. Note that
the functions a(t, x) = 0 and σ(t, x) = 1 in this example. Hence, by the Ito’s lemma, it
follows that
dX2(t) = dt+ 2X(t)dW (t), 0 ≤ t ≤ T.
Note that the process X is the same as the process W from the equation (5.3). Hence
dW 2(t) = dt+ 2W (t)dW (t), 0 ≤ t ≤ T.

146
Therefore ∫ T
0dW 2(t) =
∫ T
0dt+
∫ T
02W (t)dW (t)
which implies that
W 2(T ) = T + 2
∫ T
0W (t)dW (t)
or equivalently ∫ T
0W (t)dW (t) =
W 2(T )− T
2.
Example 10.5.2: Consider the stochastic differential equation
dX(t) = dW (t), 0 ≤ t ≤ T,W (0) = 0. (10.5. 4)
Suppose the function F (t, x) = ex. Then Ft(t, x) = 0, Fx(t, x) = ex and Fxx(t, x) = ex. Hence,
by the Ito’s lemma, it follows that
deW (t) =1
2eW (t)dt+ eW (t)dW (t), 0 ≤ t ≤ T.
Hence
eW (T ) − 1 =1
2
∫ T
0eW (t)dt+
∫ T
0eW (t)dW (t).
Example 10.5.3: Suppose the stock price process S(t), 0 ≤ t ≤ T is a geometric Brownian
motion, that is, the process satisfies the stochastic differential equation
dS(t) = µS(t)dt+ σS(t)dW (t), 0 ≤ t ≤ T (10.5. 5)
where µ and σ are constants. The parameter µ is the drift of the stock and the parameter σ
is the volatility of the stock. This differential equation can be written formally in the form
1
S(t)dS(t) = µdt+ σdW (t), 0 ≤ t ≤ T. (10.5. 6)
Let F (t, x) = log x. Then Ft(t, x) = 0, Fx(t, x) =1x and Fxx(t, x) = − 1
x2. Hence by the Ito’s
lemma, it follows that
dF (t, S(t)) = d(logS(t))
= [1
S(t)µS(t)− 1
2
1
S2(t)σ2S2(t)]dt+
1
S(t)σS(t)dW (t)
= (µ− 1
2σ2)dt+ σdW (t).

147
Hence the process X(t) = logS(t), 0 ≤ t ≤ T satisfies the stochastic differential equation
dX(t) = (µ− 1
2σ2)dt+ σdW (t), 0 ≤ t ≤ T
which is again a Brownian motion with drift µ− 12σ
2 and volatility σ. Solving this stochastic
differential equation, we get that
X(t)−X(0) = (µ− 1
2σ2)t+ σW (t), 0 ≤ t ≤ T.
Since S(t) = eX(t), it follows that
S(t) = S(0)e(µ−12σ2)t+σW (t) (10.5. 7)
where W (t), t ≥ 0 is the standard Brownian motion.
Example 10.5.4: Consider the stochastic differential equation
dX(t) = µ[X(t)]αdt+ σ[X(t)]βdW (t), 0 ≤ t ≤ T (10.5. 8)
where β = 0 and β = 1. Let F (t, x) = f(x) for some function f which is twice differentiable.
Then Ft(t, x) = 0, Fx(t, x) = f ′(x), and Fxx(t, x) = f ′′(x). Applying the Ito’s lemma, we get
that
d(f(X(t)) = (f ′(X(t))µ[X(t)]α+1
2f ′′(X(t))σ2[X(t)]2β)dt+f ′(X(t))σ[X(t)]βdW (t), 0 ≤ t ≤ T.
(10.5. 9)
Suppose we choose the function f such that
f ′(x)xβ = 1.
Then it follows that
f ′(x) = x−β.
If we choose
f(x) =x1−β
1− β,
then
f ′(x) = x−β and f ′′(x) = −βx−β−1
and the stochastic differential equation (5.9) reduces to
d(f(X(t)) = [(X(t))α−βµ− β
2(X(t))β−1σ2]dt+ σdW (t), 0 ≤ t ≤ T. (10.5. 10)
Note that, by applying the transformation f, we have transformed the process X(t), 0 ≤
t ≤ T satisfying the stochastic differential equation (5.8) with volatility depending on the
process X(t), 0 ≤ t ≤ T to a process f(X(t)), 0 ≤ t ≤ T satisfying the stochastic
differential equation (5.10) with a constant volatility coefficient in a financial context.

148

Chapter 11
STOCHASTIC MODELS IN
FINANCE
11.1 Introduction
Term structure or interest rate models are applied to model the development of bond returns
chronologically with respect to time to maturity. The need for modelling term structure is
to identify factors which are believed to determine or influence the term structure.
Suppose the price of a bond with a value of Rupee 1 at time T is PT (t) at time t for 0 ≤ t ≤ T.
We are assuming that there is no dividend payment and that the bond pays exactly one rupee
at the maturity time T. Let the log-return of the bond at time t be given by YT (t). Suppose
the interest is compounded continuously. The process YT (t), 0 ≤ t ≤ T is called the yield
to maturity. Note that
PT (t) = e−YT (t)(T−t).
Define
r(t) = limT↓t
YT (t).
The function r(t) is called the short rate. The short rate is the spot rate, that is, the interest
rate for the shortest possible movement. Given the function PT (t),
PT (t+∆t)− PT (t) = r(t)PT (t)d∆t
149

150
for ∆t small and hencedPT (t)
dt= r(t)PT (t).
Hence
PT (t) = e−∫ Tt r(s)ds.
11.2 Stochastic Interest Rate Models
Many models in financial economics such as option pricing models, discount bond pricing
models and other types of asset pricing models have been developed using the stochastic
differential equations. In most of these models, it is assumed that the drift function is linear.
Some examples of such models are listed below:
(i)dX(t) = αdt+ σdW (t) (Merton (1971));
(ii)dX(t) = X(t)σdW (t) (Dothan (1978));
(iii)dX(t) = βX(t)dt+ σX(t)dW (t) (Black-Scholes model)(Geometric Brownian motion);
(iv)dX(t) = (α+ βX(t))dt+ σdW (t) (Vasicek (1977);
(v)dX(t) = (α+ βX(t))dt+ σ√X(t)dW (t) (Cox-Ingersoll-Ross (1985));
(vi)dX(t) = (α+ βX(t))dt+ σX(t)dW (t) (Brennan and Schwartz (1979));
(vii)dX(t) = (α+ βX(t))dt+ σ[X(t)]γdW (t)
(viii)dX(t) = a(X(t))dt+ σ[X(t)]γdW (t), a(x) =∑m
j=1 αjxj (Shoji (1995)).
Due to the uncertainty associated with the interest rate r(t) at time t, the interest rate is
modelled as a stochastic process. A general model that is used for the process r(t), t ≥ 0
is
dr(t) = µ(r(t), t)dt+ σ(r(t), t)dW (t) (11.2. 1)
where W = W (t), t ≥ 0 is the standard Wiener process.
Three of the most used models for interest rates are given by the stochastic differential equa-
tion (2.1) where
(i) µ(r(t), t) = a(b− r(t)), σ(r(t), t) = σ; a, b, σ are constants (Vasicek (1977));
(ii) µ(r(t), t) = a(b− r(t)), σ(r(t), t) = σ; a, σ√r are constants (Cox-Ingersoll-Ross (1985));

151
(iii) µ(r(t), t) = δ(t)− a r(t)), σ(r(t), t) = σ; a, b, σ are constants (Hull and White ).
The function δ(t) in (iii) is chosen depending on the market data considerations. The models
described above are proposed to deal with the interest rate structures within a country. These
models do not take into account the interaction or influence of the interest rates between the
countries and within different parts of a country. In an open economy and free market and
in the presence of globalization of the world trade, the risk and fall of interest rates in one
country affects the same in another country.
Suppose there is an economically independent Country A with a strong influence on the
economy of another Country B, Suppose the factors determining the interest rates in Country
A depend on its own economic conditions where as that of the Country B depend on its own
as well as that of those in the Country A. Let rA(t) and rB(t) be the short-term interest
rates at time t of the Countries A and B respectively. Let s(t) = rB(t)−rA(t) be the interest
rate differential. Further suppose that the processes st), t ≥ 0 and rA(t), t ≥ 0 satisfy
the stochastic differential equations
ds(t) = α(β − s(t))dt+ γdW (1)s (t), t ≥ 0
drA(t) = k(θ − rA(t))dt+ σdW (2)rA
(t), t ≥ 0
where the processes W 1s and W
(2)rA are the standard Brownian motions with the quadratic
covariation
d[W (1)s ,W (2)
s ] = ρdt
(for the definition of quadratic covariation, see Prakasa Rao (1999) or Elliott(1982)). Here
α, β, γ, k, θ and σ are constants. Then the the interest rate process rB satisfies the stochastic
differential equation
drB(t) = [k(θ − rA(t)) + α(β − s(t))] + σdW (2)rA
(t) + γdW (1)s (t).
The parameters k, θ, α, β, σ and γ can be estimated by the maximum likelihood method based
on the observations Yti , 1 ≤ i ≤ N where Yti is the i-th observation on either the process
rA or the process s at time ti and N is the number of observations. Note that the likelihood
function can be explicitly computed in this model since the processes rA and s are Gaussian
processes.

152
11.3 Mean Reversion
It is sometimes believed that the prices of some stocks tend to revert to some fixed values,
that is, if the present price of the stock is less than this fixed value, then the price tends to
increase and if it is greater than the fixed value, then it tends to decrease. This phenomenon
is called mean reversion. It can be explained by an autoregressive model in discrete time and
by the Cox-Ingersoll-Ross model in the continuous time under some conditions. We will now
discuss these results.
Autoregressive model :
Let S(n) be the price of a stock at the end of n-th trading day and let L(n) = logS(n).
Suppose the process L(n), n ≥ 1 follows the autoregressive model of order one
L(n) = a+ b L(n− 1) + ϵ(n), n ≥ 1
which is a linear regression model. The log-price on the n-th trading day is expressed in
terms of the log-price on the (n − 1)-th trading day subject to a noise component ϵ(n) .
Suppose the noise component ϵ(n) is independent of the sequence S(i), 1 ≤ i ≤ n− 1 and
is Gaussian with mean zero and variance σ2. The parameters a and b can be estimated from
the past data, say, L(i), i = 0, 1, . . . , r by the method of least squares. Note that
S(n) = [S(n− 1)]bea+ϵ(n), n ≥ 1.
Suppose that S(n− 1) = s at the end of the (n− 1)-th trading day. Then
E[S(n)|S(n− 1) = s] = sbE[ea+ϵ(n)|S(n− 1) = s]
= sbE[ea+ϵ(n)] (by the independence of ϵ(n) and S(n− 1))
= sbea+σ2
2 .
Suppose that 0 < b < 1. Let
s∗ = e(a+σ2
2 )
(1−b) .
If S(n−1) = s on the (n−1)-th trading day, we will now show that the expected price at the
end of the n-th trading day is between s and s∗ which indicates mean reversion as explained
earlier. Suppose that s < s∗. Then
s < s∗ = e(a+σ2
2 )
(1−b)

153
which holds if and only if
s1−b < ea+σ2
2
or equivalently
s < ea+σ2
2 sb = E[S(n)|S(n− 1) = s]. (11.3. 1)
This inequality in turn implies that
sb < eb(a+σ2
2 )
(1−b)
or equivalently
sb < e(a+σ2
2 )
(1−b) e−(a+σ2
2).
This inequality holds if and only if
E[S(n)|S(n− 1) = s] = ea+σ2
2 sb < e(a+σ2
2 )
(1−b) = s∗. (11.3. 2)
Combining equations (11.3.1)-(11.3.2), we get that, if S(n− 1) = s < s∗, then
s < E[S(n)|S(n− 1) = s] < s∗.
Similarly, it can be shown that, if S(n− 1) = s > s∗, then
s∗ < E[S(n)|S(n− 1) = s] < s.
Hence, if 0 < b < 1, then there is a mean reversion of the stock price process to the price s∗.
This phenomenon of mean reversion can not be explained by the geometric Brownian model
for the stock price process.
Cox-Ingersoll-Ross (CIR) Model :
Cox-Ingersoll-Ross model (CIR model) specifies the dynamics in short interest rate or spot
rate r(t) as a process satisfying the stochastic differential equation
dr(t) = a[b− r(t)]dt+ σ√r(t)dW (t), t ≥ 0.
This process has the mean reversion behaviour, that is, once the deviation from the stationary
mean b occurs, the process moves back to the mean through a positive constant a. The
volatility σ√r(t) is larger whenever the interest level is higher. Let
PT (t) = E[e−∫ Tt r(s)ds|Ft]

154
where Ft is the information up to time t. Let PT (t) = V (r(t), t) with PT (T ) = 1. Applying
the Ito’s lemma, it can be shown that
V (r(t), t) = eA(T−t)+B(T−t)r(t)
where
A(τ) =2ab
σ2log[
2ψe(a+ψ)τ/2
g(τ)],
B(τ) =2(1− eψτ )
g(τ),
ψ =√a2 + 2σ2,
and
g(τ) = 2ψ + (a+ ψ)(eψτ − 1).
11.4 Black-Scholes Model:
We have seen earlier that a standard model for the evolution of a stock price S(t) is the
geometric Brownian motion satisfying the stochastic differential equation
dS(t) = µS(t)dt+ σS(t)dW (t), t ≥ 0.
The basic point here is that we expect that the movements in the share price of a stock should
be proportional to its current value as it is the percentage movement that should matter and
not the actual value. For instance, if a share has a value Rupees 1000 and it is loosing 10
Rupees, then we do not consider it as a big loss but if the share value is Rupees 20 and the
loss is 10 Rupees, then it is a big loss. Recall that µ is the drift of the stock which indicates
the trend of the movements in stock prices and σ is the volatility of the stock which expresses
how much the stock price goes up or down. We can regard the term dW (t) as modelling the
arrival of information which may be good or bad and in turn drives the stock price up or
down.
Suppose the risk-free asset Yt follows the process
dY (t) = rY (t)dt,

155
that is
Y (t) = Y (0)ert
where r is the interest rate compounded continuously. The difference µ − r measures the
size of the risk premium. It is the amount of extra return investors demand to compensate
for the extra risk introduced by the Brownian motion W for investing in a stock. Since we
expect the risk premium to increase with volatility, the ratio
λ =µ− r
σ
is called the market price of the risk. As an application of the Ito’s lemma, we have seen that
S(t) = S(0)e(µ−12σ2)t+σW (t),
where W (t), t ≥ 0 is the standard Brownian motion , in the sense that the terms on
both sides have the same probability distributions. An option on a stock will be driven
by the same information which influences the movement in the corresponding stock prices.
Hence, it should be possible to eliminate randomness or uncertainty by choosing a portfolio
combining the option and the stock carefully. This observation leads to the Black-Scholes
option price formula. We will now give an informal derivation of the Black-Scholes formula
for the European call option price.
Suppose we want to find the price of a European call option C on a stock with strike price
K and time of expiry or strike time T. Suppose the stock price S(t) follows a geometric
Brownian motion with drift µ and volatility σ. Note that the option price C at time t depends
on t, S(t), σ,K and T for t < T. Let us fix K,σ and T. Then C ≡ C(S(t), t) is a function of
that the stock price process S(t), t ≥ 0 satisfies the stochastic differential equation
dS(t) = µS(t)dt+ σS(t)dW (t), 0 ≤ t ≤ T.
Applying the Ito’s lemma, we get that
dC(S(t), t) = [∂C
∂t+∂C
∂SµS(t) +
1
2σ2S2(t)
∂2C
∂S2]dt
+σS(t)∂C
∂SdW (t).
Hence
d(C(S(t), t) + αS(t)) = [∂C
∂t+∂C
∂SµS(t) +
1
2σ2S2(t)
∂2C
∂S2+ αµS(t)]dt
+σS(t)[∂C
∂S+ α]dW (t).

156
Let
α = −∂C∂S
. (11.4. 1)
Then, we get that
d(C(S(t), t) + αSt) = [∂C
∂t+
1
2σ2S2(t)
∂2C
∂S2]dt.
Since the risk-free portfolio must grow at the risk-free rate under no arbitrage assumption,
the drift of the process C +αS(t) must be equal to r(C +αS(t)) where r is the interest rate
compounded continuously. Hence
∂C
∂t+
1
2σ2S2(t)
∂2C
∂S2= r(C + αS(t)) = r(C − S(t)
∂C
∂S)
from (11.4.1). Therefore
∂C
∂t+ rS(t)
∂C
∂S+
1
2σ2S2(t)
∂2C
∂S2= rC.
This partial differential equation is called the Black-Scholes equation. We can rewrite this
equation as∂C
∂t+ (r − 1
2σ2)S(t)
∂C
∂S+
1
2σ2(S(t)
∂
∂S)2C = rC. (11.4. 2)
Let S(t) = eZ(t). Then Z(t) = logS(t) and the equation (11.4.2) reduces to
∂C
∂t+ (r − 1
2σ2)
∂C
∂Z+
1
2σ2∂2C
∂Z2= rC. (11.4. 3)
Let τ = T − t and D = erτC. Then the equation (11.4.3) can be written in the form
∂D
∂τ− (r − 1
2σ2)
∂D
∂Z− 1
2σ2∂2D
∂Z2= 0. (11.4. 4)
Let y = Z + (r − 12σ
2)τ. Then, we have
∂D
∂τ=
1
2σ2∂2D
∂y2. (11.4. 5)
After solving this heat equation, we get that
C(S(t), t) = S(t)Φ(d1)−Ke−r(T−t)Φ(d2) (11.4. 6)
which is the Black-Scholes formula for the European call option price where
d1 =log(S(t)K ) + (r + 1
2σ2)(T − t)
σ√T − t
(11.4. 7)
and
d2 =log(S(t)K ) + (r − 1
2σ2)(T − t)
σ√T − t
. (11.4. 8)