c-realconvergenc enp femise4210partc revised
TRANSCRIPT

With Contributions by:
Javier Ordonez, University Jaume I (Spain)Mona Said, American University in Cairo (Egypt)
March 2018
Ce rapport a été réalisé avec le soutien financier de l’Union Européenne dans le contexte du projet UE-FEMISE sur: "Support to economic research, studies and dialogue of the Euro-Mediterranean Partnership”. Le contenu du rapport relève de la seule responsabilité des auteurs et ne peut en aucun cas être considéré comme reflétant l’opinion de l’Union Européenne.
This document has been produced with the financial assistance of the European Union within the context of the EU-FEMISE project “Support to economic research, studies and dialogue of the Euro-Mediterranean Partnership”.. The contents of this document are the sole responsibility of the authors and can under no circumstances be regarded as reflecting the position of the European Union.
FEM42-10
FEMISE RESEARCH PAPERS
"Inequality and inclusive growth in the South Mediterranean region: Are education and innovation activi-
ties favoring firm performance and citizens’ wellbeing?"
C. Real convergence between ENP and southern European countries: a cluster analysis
Directed by: Inmaculada Martinez-Zarzoso (University Jaume I and University of Goettingen)

FEM42-10,“InequalityandinclusivegrowthintheSouthMediterraneanregion:Areeducationandinnovationactivitiesfavoringfirmperformanceandcitizens’wellbeing?”
1
Real convergence between ENP and southern
European countries: a cluster analysis
InmaculadaMartinez-Zarzoso,UniversityJaumeIandUniversityofGoettingen
JavierOrdonez,UniversityJaumeI
MonaSaid,AmericanUniversityinCairo
Abstract
This paper analyses the convergence pattern of GDP per capita, productivity, inequality and
unemployment in both ENP and southern European (SE) countries. It follows the methodology
proposed by Phillips and Sul (2007, 2009) in which different convergence paths can be
distinguished among heterogeneous economies involved in a convergence process. This
heterogeneity is modelled through a nonlinear time varying factor model, which provides
flexibility in studying idiosyncratic behaviours over time and across section. The main results from
the convergence analysis show that whereas there is convergence in unemployment, GDP per
capita and productivity between EU and ENP countries, no convergence is found for inequality.
Among the challenges of an evolving neighbourhood, inclusive economic development should be
included in the new ENP approach.
Keywords: convergence; inequality; unemployment; productivity; ENP.
JEL classification: C32, C33, O47

FEM42-10,“InequalityandinclusivegrowthintheSouthMediterraneanregion:Areeducationandinnovationactivitiesfavoringfirmperformanceandcitizens’wellbeing?”
2
1. Introduction
European Neighbourhood Policy (ENP) countries are involved in deep
structural reforms and further economic integration to improve growth. The effect
of this transition process on growth, productivity, unemployment and inequality
are uncertain: in order to be sustainable, this growth needs to be based on
productivity improvements but it also needs to be inclusive and create job
opportunities.
The link between inequality and growth has been long studied in both the
theoretical and the empirical literature with controversial results. On the one hand,
several authors suggest that high inequality might be good for growth if it
provides the incentives to work harder and invest to take advantage of high rates
of returns (Mirrlees, 1971, Lazear and Rosen, 1981); also if higher inequality
fosters aggregate savings and capital accumulation (Kaldor, 1955, Bourguignon,
1981). On the other hand, greater inequality may reduce growth if higher taxation
and regulation implemented to reduce inequality reduce in turn the incentives to
invest (Bertola, 1993, Alesina y Rodrick, 1994, Perotti, 1996), if inequality
implies under-investment by the poor in the presence of financial market
imperfections (Galor and Zeira, 1993) or in the presence of skilled-biased
technical change (Murphy, 1989, Krueger, 2012). It is possible then to conclude
that the causal relationship between growth, inequality and unemployment is, at
least, controversial.
One of the causes suggested in the literature to explain inequality is the
fostering of globalization and economic integration, which is of special
importance in ENP countries. The empirical findings in the related literature are
mixed. Whereas some authors conclude that globalization increases inequality

FEM42-10,“InequalityandinclusivegrowthintheSouthMediterraneanregion:Areeducationandinnovationactivitiesfavoringfirmperformanceandcitizens’wellbeing?”
3
(Firebaugh, 2003; Wade, 2004), others suggest that economic integration has
played an important role in closing the inequality gap (Dollar and Kraay, 2002).
Despite the conflicting results, it seems clear that economic growth,
productivity and convergence on the one hand and inequality on the other are
related, although the direction of causation is far from being clear. To gain
insights on the role of economic integration and growth on inequality we propose
to analyse the convergence pattern of GDP per capita, productivity, inequality and
unemployment in both ENP and southern European (SE) countries.
The neoclassical growth models originally set out by Solow (1956) and
Swan (1956) predict conditional income convergence. In this theoretical
framework, convergence occurs when the growth rate of an economy is positively
related to the distance between said economy’s level of income and its own steady
state. Bénabou (1996) pointed out that the neoclassical growth model predicts
convergence in income per capita not just in the first moment, the mean, but also
in higher moments. According to this author,
"Once augmented with idiosyncratic shocks, most versions of the
neoclassical growth model imply convergence in distribution: countries
with the same fundamentals should tend towards the same invariant
distribution of wealth and pretax income." (Bénabou, 1996, p. 51).
This means that the neoclassical growth models predict convergence not
only in income per capita but also convergence in income distribution1. However,
the literature on inequality convergence is scarce. Among the related studies, 1We acknowledge that in this paper do not test for convergence in income distribution butconvergence inGini indexes.Althoughclosely related theyarenot strictly the same thing, andthe theoreticalbases for incomedistributionconvergencemaynothold for theGini.However,convergenceininequalityisstillanempiricalissue.Bearingthisinmind,weletthe“dataspeaksfirst”.

FEM42-10,“InequalityandinclusivegrowthintheSouthMediterraneanregion:Areeducationandinnovationactivitiesfavoringfirmperformanceandcitizens’wellbeing?”
4
Quah (1996) explores the link between convergence in income per capita and
income distribution, showing that economic convergence is not only about the
aggregate level of income but it also related to how income is distributed across
countries or regions. According to this author, what matters for convergence is the
relative performance of poor and rich economies or, in other words, how
economic progress occurs differently in poorer economies than in richer ones. The
traditional question about convergence between rich and poor countries (or
regions) needs therefore to be re-specified in terms of convergence between
poorer, high-inequality economies and richer, low-inequality ones.
In this paper, we test for the predictions of the neoclassical growth model
by examining convergence in GDP per capita, productivity as well as
unemployment and inequality for the ENP and SE countries. The main question to
answer is whether such transition has had an effect on the evolution over time of
these variables.
To evaluate the existence of convergence, we follow the methodology
proposed by Phillips and Sul (2007, 2009) in which different convergence paths
can be distinguished among heterogeneous economies involved in a convergence
process. This heterogeneity is modelled through a nonlinear time varying factor
model, which provides flexibility in studying idiosyncratic behaviours over time
and across section.
The main results from the convergence analysis show that whereas there is
convergence in unemployment, GDP per capita and productivity between EU and
ENP countries, no convergence is found for inequality.

FEM42-10,“InequalityandinclusivegrowthintheSouthMediterraneanregion:Areeducationandinnovationactivitiesfavoringfirmperformanceandcitizens’wellbeing?”
5
The remainder of this paper is organized as follows. Section 1 presents the
clustering methodology. Section 3 shows the results and the final section
concludes.
2. Methodology: convergence and cluster tests
The time series approach to study convergence can be found in the seminal
papers by Carlino and Mills (1993) and Bernard and Durlauf (1995, 1996). These
authors have developed the concept of stochastic convergence, based upon the
stationarity properties of the variables under analysis. Thus, two non-stationary
variables converge if there is a cointegrating relationship between them. In other
words, two non-stationary series convergence if they share the same stochastic
trend.
This definition of convergence can be empirically tested by means of time
series econometric techniques. However, as pointed out by Phillips and Sul
(2009), traditional convergence tests are inadequate when technology is
heterogeneous across countries and the speed of convergence is time-varying. To
account for temporal transitional heterogeneity, Phillips and Sul (2007) and
(2009) introduced cross-sectional and time series heterogeneity in the parameters
of a neoclassical growth model. The starting point of the test is the following time
varying representation:
𝑋!" = 𝛿!"𝜇! (1)
where
€
δ it is a time-varying factor-loading which captures convergence to a
common factor
€
µt. The simple econometric representation in (1) can be used to
analyse convergence by testing whether the factor loadings
€
δ it converge. Phillips

FEM42-10,“InequalityandinclusivegrowthintheSouthMediterraneanregion:Areeducationandinnovationactivitiesfavoringfirmperformanceandcitizens’wellbeing?”
6
and Sul (2007) proposed to model the transition elements
€
δ it through the
construction of a relative measure of the transition coefficients:
€
hit =Xit
1N
Xiti=1
N
∑=
δ it1N
δ iti=1
N
∑ (2)
where the loading coefficient,
€
δ it , is measured in relation to the panel. The
variable
€
hit is called the relative transition path, and traces out an individual
trajectory for each i relative to the panel average.
To formulate a null hypothesis of convergence, the authors proposed a
semiparametric model for the time-varying behaviour of
€
δ it as follows:
𝛿!" = 𝛿! + 𝛿!𝜀!"𝐿(𝑡)!!𝑡!! (3)
where
€
δ i is fixed,
€
σ i > 0, εit is i.i.d (0,1) across i but weakly dependent on t, and
L(t) is a slowly varying function for which L(t) tends to infinity as t also goes to
infinity. Following Phillips and Sul (2007), the L(t) function is assumed to be log
t;
€
ξit introduces time-varying and country-specific components to the model; and
the size of determines the behaviour (convergence or divergence) of
€
δ it . The
null hypothesis of convergence can be written as:
€
H0 :δ it = δ and α ≥ 0 (4)
and the alternative:
€
HA :δ it = δ for all i with α < 0 (5)
or
€
HA :δ it ≠δ for some i with α ≥ 0, or α < 0 (6)
€
α

FEM42-10,“InequalityandinclusivegrowthintheSouthMediterraneanregion:Areeducationandinnovationactivitiesfavoringfirmperformanceandcitizens’wellbeing?”
7
The alternative hypothesis includes divergence, as in (5) and (6), but can also
consider club convergence. For example, if there are two convergent clubs, the
alternative is:
€
HA :δ it →δ1 and α ≥ 0, if i∈G1δ2 and α ≥ 0, if i∈G2
⎧ ⎨ ⎩ , (7)
where G stands for an specific club.
Phillips and Sul (2007) show that these hypotheses can be statistically tested
by means of the following ‘log t’ regression model:
(8)
for t=[rT], [rT]+1,…, T with some r > 0 and is tHH1 the cross-sectional
variance ratio.
The convergence patterns within groups (that is, the existence of club
convergence and then clustering) can be examined using log t regressions. The so-
called ‘core group’, kG , is chosen by maximizing kt over k individuals according
to the criterion:
€
k* = argmax{tk}, subject to
€
min{tk} > −1.65
The convergence approach by Phillips and Sul (2007) presents clear
advantages. First, it is a test for relative convergence, as it measures convergence
to some cross-sectional average, in contrast to the concept of level convergence
analysed by Bernard and Durlauf (1996). Second, this approach outperforms the
standard panel unit root tests since in the latter case
€
Xit − X jt may retain
nonstationary characteristics even though the convergence condition holds. In
other words, panel unit root tests may classify the difference between gradually
converging series as non-stationary. As a further problem, a mixture of stationary
tt utbatHH ++=− log))log(log(2)log( 1

FEM42-10,“InequalityandinclusivegrowthintheSouthMediterraneanregion:Areeducationandinnovationactivitiesfavoringfirmperformanceandcitizens’wellbeing?”
8
and non-stationary series in the panel may bias the results of unit root tests.
Finally, sometimes these test results are not particularly robust. This is in contrast
to the Phillips and Sul (2007) test, which does not depend on any particular
assumption concerning trend stationarity or stochastic non-stationarity of the
variables to be tested.
3. Data and empirical results
3.1 Data
In this paper we use GDP per capita, productivity, unemployment and
income inequality to test for real convergence within the following countries:
Albania, Algeria, Armenia, Azerbaijan, Belarus, Cyprus, Egypt, Georgia, Greece,
Israel, Italy, Jordan, Lebanon, Moldova, Morocco, Portugal, Spain, Tunisia and
Ukraine. Data on GDP per capita, productivity and unemployment are taken from
the World Development Indicators database from the World Bank. GDP per
capita corresponds to real GDP (constant 2010 US dollars) divided by midyear
population and covers 1990 to 2015. Productivity is obtained as real GDP divided
by total employment in the economy and runs from 1991 to 2016. Finally,
unemployment is calculated as a percentage total labour force, ILO estimate, with
a sample from 1991 to 2016. Inequality is measured using the Gini net, that is,
income inequality post-taxes and post-transfers. Data on Gini coefficients are
taken from the Standardized World Income Inequality Database (SWIID)
developed by Solt (2009, 2014). We use annual data on inequality from 1985 to
2010.
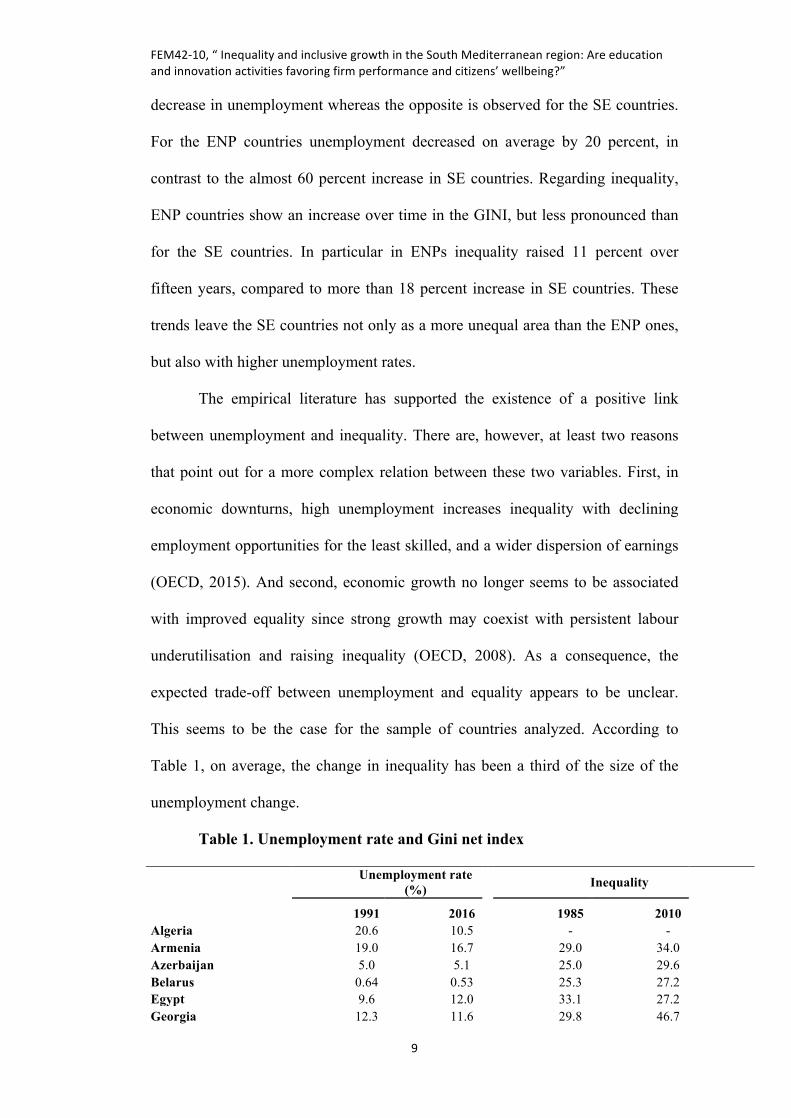
Table 1 shows the change in unemployment and inequality between the
beginning and the end of the sample. The countries are split between ENP and SE
countries. On average, the first group of countries has been favoured for a
FEM42-10,“InequalityandinclusivegrowthintheSouthMediterraneanregion:Areeducationandinnovationactivitiesfavoringfirmperformanceandcitizens’wellbeing?”
9
decrease in unemployment whereas the opposite is observed for the SE countries.
For the ENP countries unemployment decreased on average by 20 percent, in
contrast to the almost 60 percent increase in SE countries. Regarding inequality,
ENP countries show an increase over time in the GINI, but less pronounced than
for the SE countries. In particular in ENPs inequality raised 11 percent over
fifteen years, compared to more than 18 percent increase in SE countries. These
trends leave the SE countries not only as a more unequal area than the ENP ones,
but also with higher unemployment rates.
The empirical literature has supported the existence of a positive link
between unemployment and inequality. There are, however, at least two reasons
that point out for a more complex relation between these two variables. First, in
economic downturns, high unemployment increases inequality with declining
employment opportunities for the least skilled, and a wider dispersion of earnings
(OECD, 2015). And second, economic growth no longer seems to be associated
with improved equality since strong growth may coexist with persistent labour
underutilisation and raising inequality (OECD, 2008). As a consequence, the
expected trade-off between unemployment and equality appears to be unclear.
This seems to be the case for the sample of countries analyzed. According to
Table 1, on average, the change in inequality has been a third of the size of the
unemployment change.
Table 1. Unemployment rate and Gini net index
Unemployment rate
(%) Inequality
1991 2016 1985 2010 Algeria 20.6 10.5 - - Armenia 19.0 16.7 29.0 34.0 Azerbaijan 5.0 5.1 25.0 29.6 Belarus 0.64 0.53 25.3 27.2 Egypt 9.6 12.0 33.1 27.2 Georgia 12.3 11.6 29.8 46.7

FEM42-10,“InequalityandinclusivegrowthintheSouthMediterraneanregion:Areeducationandinnovationactivitiesfavoringfirmperformanceandcitizens’wellbeing?”
10
Israel 13.4 5.6 47.9 50.2 Jordan 15.4 13.2 37.3 36.6 Lebanon 8.53 6.8 - - Moldova 7.3 5.0 22.5 36.0 Morocco 17.3 10.0 41.8 43.2 Tunisia 14.4 14.8 41.4 40.6 Ukraine 7.6 8.9 28.7 29.6
ENP countries average 11.6 9.3 33.3 37.1
Albania 9.1 16.3 - - Cyprus 7.9 11.7 36.8 45.8 Greece 7.6 23.9 48.3 51.3 Italy 10.1 11.5 43.4 49.1 Malta 7.6 5.3 - - Portugal 3.9 11.1 45.7 52.5 Spain 15.9 19.4 36.9 51.1
South European countries average 8.9 14.2 42.2 50.0
Table 2 presents the change in GDP per capita and productivity between the
beginning and the end of the sample. Similarly to Table 1, the countries are split
between ENP and SE countries. The average figures show increases in GDP per
capita and productivity in both groups of countries. However, some ENP
countries have experimented decreases in productivity, as Algeria, Lebanon and
Ukraine.
Table 2. GDP per capita and productivity.
GDP per capita Productivity
1990 2015 1991 2016 Algeria 3550 4784 51043 50782 Armenia 1793 3796 9821 18877 Azerbaijan 3118 6117 21618 33241 Belarus 2995 6174 15634 32111 Egypt 1588 2707 23237 35954 Georgia 3529 3969 13158 17707 Israel 20469 33117 59911 76566 Jordan 2586 3976 34262 45844 Lebanon 4230 7045 40119 38389 Moldova - - 10265 12460 Morocco 1715 3239 15675 23288 Tunisia 2227 4272 21861 34710 Ukraine 3965 2825 21281 15844
ENP countries average 4313 6835 25991 33521

FEM42-10,“InequalityandinclusivegrowthintheSouthMediterraneanregion:Areeducationandinnovationactivitiesfavoringfirmperformanceandcitizens’wellbeing?”
11
Albania 1879 4543 8017 31256 Cyprus 21156 27587 45753 47532 Greece 19385 22579 58254 72584 Italy 30841 33889 81311 93232 Malta 12026 24320 48541 78109 Portugal 16688 21969 45514 60609 Spain 22466 30465 70713 85273
South European countries average 17777 23621 51157 66942
The simple correlations between the target variables is shown in Table 3,
and indicates positive and significant correlations between GDP per capita and
inequality, GDP per capita and productivity, inequality and productivity and
inequality and unemployment, whereas GDP per capita and unemployment and
productivity and unemployment show negative correlations, but the latter is not
statistically significant.
Table 3. Pairwise correlation
GDP per capita Inequality Productivity Unemployment
GDP per capita 1.0000
Inequality 0.6129 (0.0000)
1.0000
Productivity 0.8955 (0.0000)
0.5815 (0.000)
1.0000
Unemployment -0.2141 (0.000)
0.2576 (0.000)
-0.0208 (0.6790)
1.0000
Note: Significant levels in parentheses.

FEM42-10,“InequalityandinclusivegrowthintheSouthMediterraneanregion:Areeducationandinnovationactivitiesfavoringfirmperformanceandcitizens’wellbeing?”
12
In order to show graphically the relationships between pair of target variables,
country-averages of the unemployment rates and Gini coefficients are used to
draw scatter plots. Figure 1 illustrates the simple correlation between inequality
and unemployment and a regression line showing a linear and positive
relationship between the two variables. In particular, Tunisia and Morocco are
close to Georgia and Spain in the graph, whereas Egypt figures are closer to
countries such as Moldova or Azerbaijan. The cluster analysis will reveal whether
the analyzed countries present similar convergence patterns in these two variables.
Figure 1: Unemployment-inequality patterns (1991-2010).
Note: The vertical axis depicts the average Gini net value in 1991-2010; the horizontal axis shows the average unemployment rate in 1991-2010.
Figure 2 shows the scatter plot for GDP per capita and inequality and the
corresponding regression line. A positive linear relationship is observed, with
three clearly separated groups of countries. The first group is comprised by SE

FEM42-10,“InequalityandinclusivegrowthintheSouthMediterraneanregion:Areeducationandinnovationactivitiesfavoringfirmperformanceandcitizens’wellbeing?”
13
countries and Israel, all with higher levels of inequality and higher levels of GDP
per capita. In the second group, with low GDP per capita and low inequality we
find mainly Eastern and Central Europe countries and Egypt and the third group
contains Tunisia, Morocco, Jordan and Georgia, all with GINI levels higher than
40 and low GDP per capita levels. Basically, the positive cross-country
correlation would not hold if we exclude SE countries from the sample.
Figure 2: GDP per capita-inequality patterns (1991-2010).
Note: The vertical axis depicts the average Gini net value in 1991-2010; the horizontal axis shows the average GDP per capita in 1991-2010.
Finally, Figure 3 shows the scatter plot using productivity and inequality average
figures over the period 1991 to 2010. In this case, there is a clear positive
correlation, with most countries close to the regression line, with the exception of

FEM42-10,“InequalityandinclusivegrowthintheSouthMediterraneanregion:Areeducationandinnovationactivitiesfavoringfirmperformanceandcitizens’wellbeing?”
14
Belarus and Ukraine. The first country business cycle is more connected to Russia
than to Europe and Ukraine suffer from the war with Russia and its consequences.
Figure 3: Productivity-inequality patterns (1991-2010).
Note: The vertical axis depicts the average Gini net value in 1991-2010; the horizontal axis shows the average productivity in 1991-2010.
Figure 3 will support the view that there is a trade-off between increases in
efficiency, measured as productivity, and decreasing inequality, given that the
most productive countries seem to be on average the most economically unequal
ones.
3.2 Empirical results
The results from the cluster analysis are shown in Tables 4 to 7 for
unemployment, inequality, GDP per capita and productivity, respectively.
Table 4 shows that Tunisia is the only MENA country in cluster 1, together
with SE countries (Cyprus, Greece, Portugal and Spain) and some ENP in Europe

FEM42-10,“InequalityandinclusivegrowthintheSouthMediterraneanregion:Areeducationandinnovationactivitiesfavoringfirmperformanceandcitizens’wellbeing?”
15
and Central Asia. Most MENA countries are grouped in cluster 2, together with
Italy, Malta and Ukraine and finally, cluster 3 only contains 3 remaining countries
and Belarus remains an outlier.
Table 4: Unemploment cluster analysis (1991-2016)
1st cluster b coefficient t statistic
log t 1.515 6.244 Members: Albania, Armenia, Cyprus, Georgia, Greece, Portugal, Spain, and Tunisia
2nd cluster b coefficient t statistic
log t -0.132 -1.244 Members: Algeria, Egypt, Italy, Jordan, Lebanon, Malta, Morocco, and Ukraine
3rd cluster b coefficient t statistic
log t 0.682 4.566
Members: Azerbaijan, Israel, and Moldova Divergent economy: Belarus
Note: MENA countries in bold.
Table 5 shows the clusters for inequality, measured with the GINI net
coefficient. In this case, the first cluster contains only countries in the European
continent, whereas cluster 2 contains three of the four MENA countries for which
comparable inequality data are available, together with Armenia and Moldova,
both ENP European countries. Egypt is however member of the third cluster
together with countries in Central Asia.
Table 5: Inequality cluster analysis (1985-2010)
1st cluster b coefficient t statistic
log t 1.220 4.988

FEM42-10,“InequalityandinclusivegrowthintheSouthMediterraneanregion:Areeducationandinnovationactivitiesfavoringfirmperformanceandcitizens’wellbeing?”
16
Members: Cyprus, Georgia, Greece, Israel, Italy, Portugal, and Spain
2nd cluster
b coefficient t statistic log t 0.380 2.078
Members: Armenia, Jordan, Moldova, Morocco, and Tunisia
3rd cluster
b coefficient t statistic log t -0.122 -0.274
Members: Azerbaijan, Belarus, Egypt, and Ukraine
Note: MENA countries in bold.
Table 6 show the countries included in each cluster for the GDP per capita.
In this case there are four clusters, the first two formed by EU countries and
Israel. In the third cluster four MENA countries join the group with five ENP
European countries and the fourth cluster comprises Egypt and Morocco together
with Ukraine. The result for this variable indicates that MENA countries still
present very different patterns in terms of development paths in comparison to EU
countries.
Table 6: GDP per capita cluster analysis (1990-2015)
1st cluster
b coefficient t statistic log t 0.185 1.125
Members: Cyprus, Israel, Italy, and Spain
2nd cluster
b coefficient t statistic log t 0.513 3.378
Members: Greece, Malta, and Portugal
3rd cluster
b coefficient t statistic log t 0.103 0.552

FEM42-10,“InequalityandinclusivegrowthintheSouthMediterraneanregion:Areeducationandinnovationactivitiesfavoringfirmperformanceandcitizens’wellbeing?”
17
Members: Albania, Algeria, Armenia, Azerbaijan, Belarus, Georgia, Jordan, Lebanon, and Tunisia
4rd cluster
b coefficient t statistic log t 0.210 1.482
Members: Egypt, Morocco, and Ukraine
Note: MENA countries in bold.
Table 7 list the countries for each cluster obtained when analysing
productivity. With this variable only two clusters result. The first contain most
MENA countries with the exception of Morocco and together with SE countries.
This result indicate that whereas Algeria, Egypt, Jordan, Lebanon and Tunisia
seem to converge in relative terms to similar productivity levels as SE countries,
the path for Morocco is more similar to non-EU EPN European countries.
Table 7: Productivity cluster analysis (1991-2016)
1st cluster b coefficient t statistic
log t -0.360 -1.627 Members: Albania, Algeria, Azerbaijan, Belarus, Cyprus, Egypt, Greece, Israel, Jordan, Lebanon, Malta, Spain, and Tunisia
2nd cluster
b coefficient t statistic log t 0.269 0.859
Members: Armenia, Georgia, Morocco, and Ukraine Divergent economies: Italy, Moldova, and Portugal
Note: MENA countries in bold.
Finally, figures 4 to 7 show the transition paths corresponding to the each of
the analyzed variables. To interpret these graphs consider, for example, panel (a)

FEM42-10,“InequalityandinclusivegrowthintheSouthMediterraneanregion:Areeducationandinnovationactivitiesfavoringfirmperformanceandcitizens’wellbeing?”
18
in Figure 4 where the time path behaviour of unemployment is shown for a
specific country relative to the whole panel, with the whole panel average
represented by the unit horizontal line. These transition paths are depicted
separately for each of the countries in the panel. A decrease in the transition path
of unemployment for a given country cannot be interpreted as a decrease in
absolute unemployment, but rather as a decrease in unemployment relative to the
behaviour of the whole panel. Therefore, the graphs are useful to gauge the degree
of convergence among countries and to determine when and for how long this
convergence has taken place.
Panel (b) in Figures 4 to 7 present the transition functions for the EU
countries and ENP countries as a group using Spain as a benchmark. In this way it
could be seen whether there is convergence or divergence for the ENP countries
with respect to the corresponding figures in EU countries. Convergence between
EU and non-EU countries is observed only for unemployment. This can be
the result of the sharp increase in unemployment experienced by some EU
economies - namely Portugal, Greece and Spain - as a consequence of the
recent economic crisis. Convergence in inequality is observed only until 1998,
whereas convergence in GDP per capita and productivity is weak. Overall,
the results point to a lack of convergence between the EU and the non-EU
countries.

FEM42-10,“InequalityandinclusivegrowthintheSouthMediterraneanregion:Areeducationandinnovationactivitiesfavoringfirmperformanceandcitizens’wellbeing?”
19
Figure 4: Unemployment transition functions (1991-2016)
(a) Transition function per country
(b) Transition function per group

FEM42-10,“InequalityandinclusivegrowthintheSouthMediterraneanregion:Areeducationandinnovationactivitiesfavoringfirmperformanceandcitizens’wellbeing?”
20
Figure 5: Inequality transition functions (1985-2010)
(a) Transition function per country
(b) Transition function per group

FEM42-10,“InequalityandinclusivegrowthintheSouthMediterraneanregion:Areeducationandinnovationactivitiesfavoringfirmperformanceandcitizens’wellbeing?”
21
Figure 6: GDP per capita transition functions (1990-2015)
(a) Transition function per country
(b) Transition function per group

FEM42-10,“InequalityandinclusivegrowthintheSouthMediterraneanregion:Areeducationandinnovationactivitiesfavoringfirmperformanceandcitizens’wellbeing?”
22
Figure 7: Productivity transition functions
(a) Transition function per country
(b) Transition function per group
FEM42-10,“InequalityandinclusivegrowthintheSouthMediterraneanregion:Areeducationandinnovationactivitiesfavoringfirmperformanceandcitizens’wellbeing?”
23
4. Conclusions
To gain insights into the role of economic integration in growth and
inequality, this paper analyses the convergence pattern of GDP per capita,
productivity, inequality and unemployment in both ENP and southern
European (SE) countries. A convergence analysis helps to identify which
countries have performed better and which are lagging behind. It should thus
be understood as a necessary starting point to address the effects and
consequences of economic integration. The fact that countries belong to
different clusters implies that they have different steady states and require
different policies to promote sustainable and inclusive growth.
In this paper, we use the methodology proposed by Phillips and Sul (2007, 2009),
through which different convergence paths can be distinguished among
heterogeneous economies involved in a convergence process. This heterogeneity
is modelled through a nonlinear time-varying factor model, which provides
flexibility in studying idiosyncratic behaviours over time and across sections.
The main results of the convergence analysis show that convergence between
EU and non-EU countries is only found in unemployment. This is most likely
the result of the sharp increase in unemployment experienced by some EU
economies—namely Portugal, Greece and Spain—as a consequence of the
recent economic crisis. Therefore, despite the implementation of the ENP
policies, it is hard to find convergence among these two groups of countries.
The composition of each cluster provides further interesting insights. First, in
terms of inequality and GDP per capita, there is a sharp distinction between
SE and ENP countries. In other words, these two groups of countries are

FEM42-10,“InequalityandinclusivegrowthintheSouthMediterraneanregion:Areeducationandinnovationactivitiesfavoringfirmperformanceandcitizens’wellbeing?”
24
converging to their own steady states. Given this clustering, economic growth
theory would suggest that improving growth and income distribution in ENP
countries will require deep economic reforms to allow them to catch-up with
the most advanced economies in the region. The ENP policy should therefore
help to promote these reforms. Second, and despite the lack of convergence in
growth and inequality, some MENA countries (Algeria, Egypt, Jordan,
Lebanon and Tunisia) and some other ENP countries (Azerbaijan, Belarus
and Israel) have converged in terms of productivity with Spain and Greece.
Although the latter are not the best-performing EU countries in terms of
productivity, this result offers reason for optimism in terms of future
catching-up.
Concerning the policy implications of this paper, it is worth mentioning that
through the ENP policy, the EU has been continuously supporting reforms in four
priority areas: good governance, democracy, rule of law and human rights.
Notwithstanding the importance of these areas, inclusive and sustainable growth
should also be at the heart of EU efforts to achieve resilience in the ENP
countries. The main policy recommendation is that, in order to address the
challenges of an evolving neighbourhood, inclusive economic development
should be central to the new ENP approach.
References
Bénabou, R. (1996): “Inequality and Growth”, in Bernanke, B.S., Rotemberg, J.J.
(eds.) NBER Macroeconomics Annual, pp. 11–74. MIT, Cambridge.
Bernard, A.B. and Durlauf, S.N. (1995) Convergence in international outputs.

FEM42-10,“InequalityandinclusivegrowthintheSouthMediterraneanregion:Areeducationandinnovationactivitiesfavoringfirmperformanceandcitizens’wellbeing?”
25
Journal of Applied Econometrics 10:97–108.
Bernard, A.B. and Durlauf, S.N. (1996) Interpreting tests of convergence
hypothesis. Journal of Econometrics 71:161–173.
Carlino, G. and Mills, L. (1993) Are US incomes converging? A time series
analysis. Journal of Monetary Economics 32: 335–346.
OECD (2008): Growing Unequal? Income Distribution and Poverty in OECD
Countries, OECD Publishing, Paris.
OECD (2015): In It Together: Why Less Inequality Benefits All, OECD
Publishing, Paris.
Phillips, P.C.B. and D. Sul (2007). Transition Modeling and Econometric
Convergence Tests. Econometrica 75 (6), 1771—1855.
Phillips, P.C.B. and Sul, D. (2009). Economic Transition and Growth. Journal of
Applied Econometrics 24, pp. 1153—1185.
Quah, D. (1996): “Twin Peaks: Growth and Convergence in Models of
Distributional Dynamics”, Economic Journal, Vol. 106, pp. 1045-1055.
Solow, R. (1956). ‘A contribution to the theory of economic growth’, The
Quarterly Journal of Economics, Vol. 70, pp. 65-94.
Solt, F. (2009) ‘Standardizing the World Income Inequality Database’. Social
Science Quarterly 90, No. 2, pp. 231-242.
Solt, F. (2014) ‘The Standardized World Income Inequality Database’. Working
Paper SWIID Version 5.0, October 2014.
Swan, T. (1956). ‘Economic growth and capital accumulation’, Economic Record,
Vol. 32, pp. 344-361.