c s p (opeb) a gasb 75 f y j 1, 2019 j 30, 2020 › uploaded › ccsd › departments ›...
TRANSCRIPT
AQUARIUS CAPITAL 110 Betsy Brown Road · Port Chester, NY 10573 Tel: 914-933-0063 · Fax: 914-933-0064
AQUARIUS
CAPITAL
CHAPPAQUA CENTRAL SCHOOL DISTRICT
OTHER POSTEMPLOYMENT BENEFITS (OPEB)
REPORTING IN ACCORDANCE WITH GASB 75
FISCAL YEAR
JULY 1, 2019 TO JUNE 30, 2020
Prepared by: AQUARIUS CAPITAL SOLUTIONS GROUP LLCDate: May 21, 2020
AQUARIUS CAPITAL 110 Betsy Brown Road · Port Chester, NY 10573 Tel: 914-933-0063 · Fax: 914-933-0064
May 21, 2020
Mr. John L. ChowAssistant Superintendent for BusinessChappaqua Central School District66 Roaring Brook RoadChappaqua, NY 10514
Re: Report - GASB No. 75 Valuation Report for Fiscal Year July 1, 2019 to June 30, 2020
Dear Mr. Chow:
Enclosed is an analysis of estimated costs for other postemployment benefits (OPEB) valuation underGovernment Accounting Standards Board (GASB) No. 75 for Chappaqua Central School District (the“District”). The valuation was done for fiscal year July 1, 2019 to June 30, 2020. The attached report wascompleted in accordance with generally accepted actuarial principles and practices. Please note thecalculations contained herein are done for the sole purpose of reporting GASB 75 results for the auditedfinancial statements. Fiscal year July 1, 2017 to June 30, 2018 was the first year of implementation forGASB 75 for the District.
Financial Results
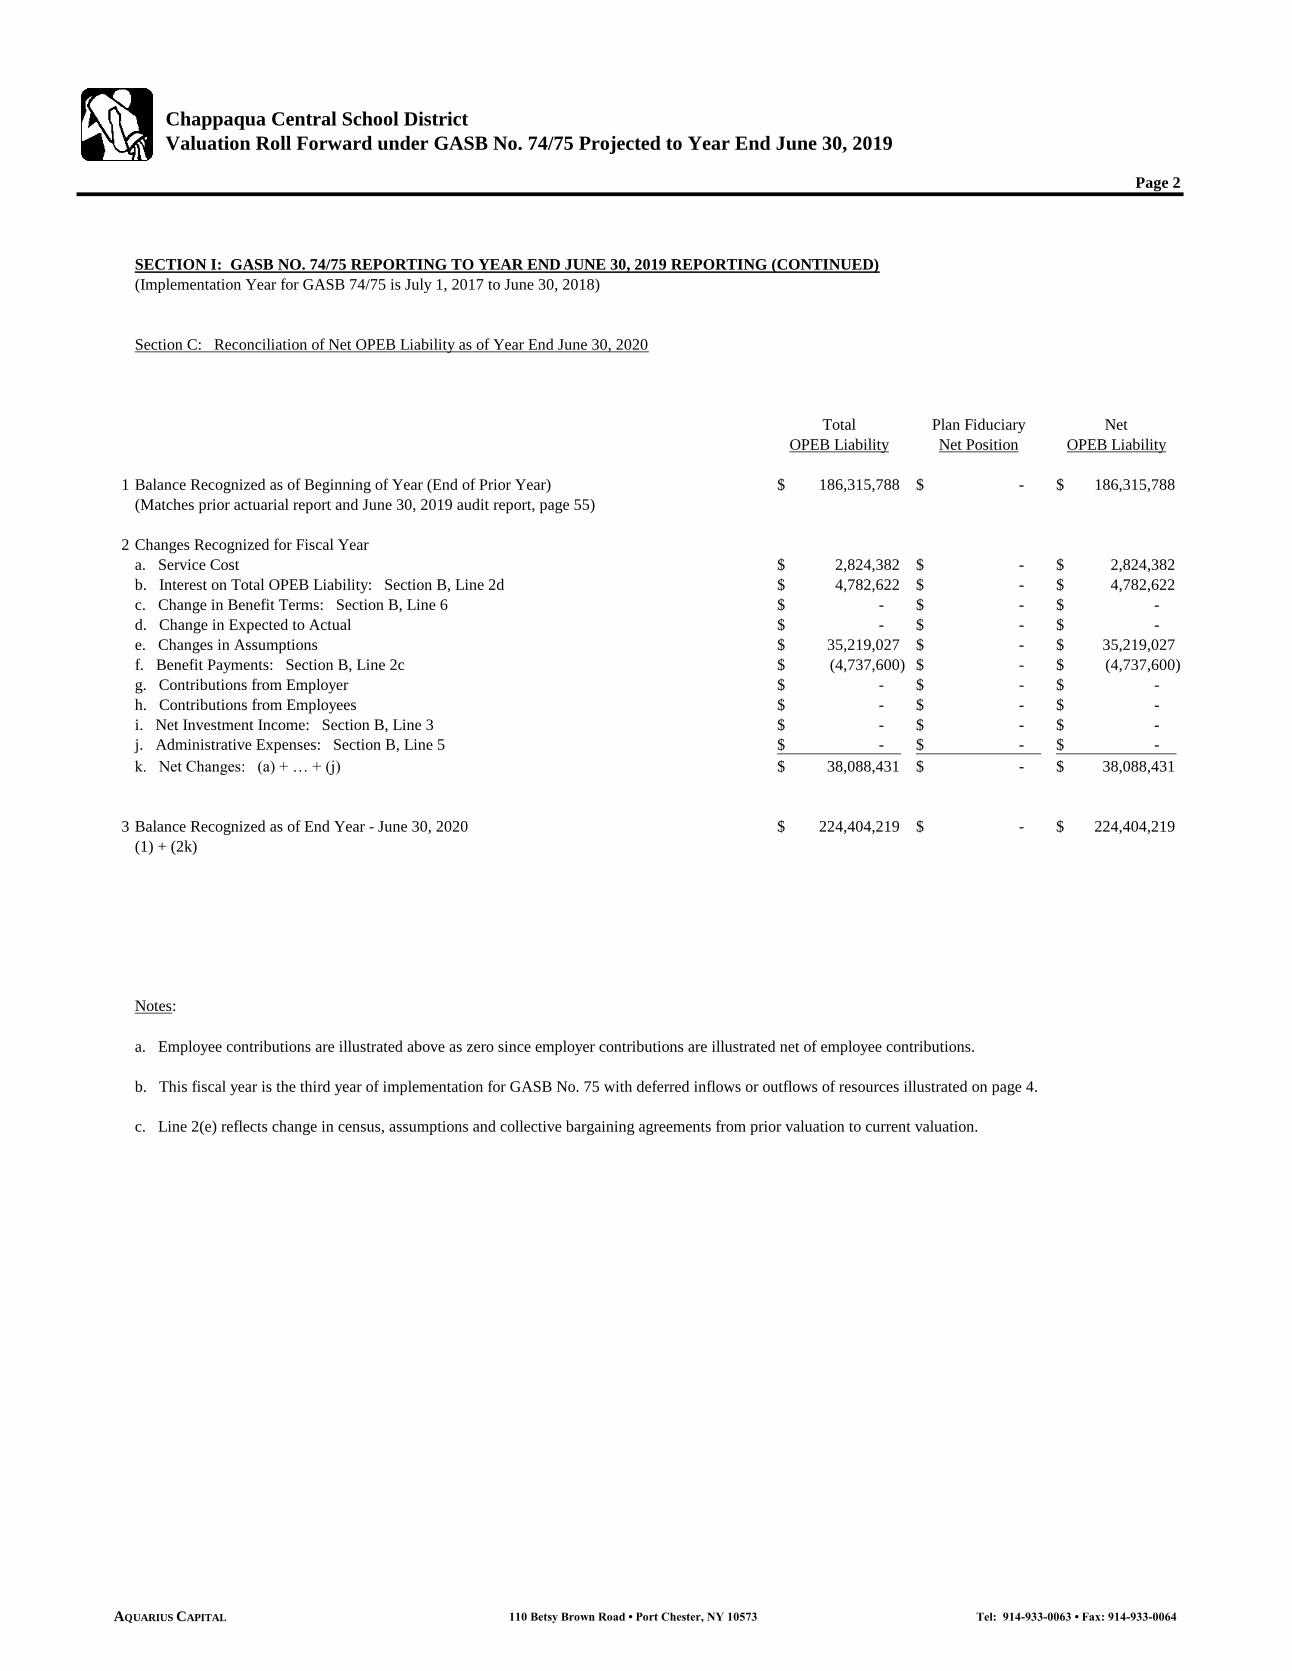
Included in the analysis is a Table of Contents. Sections I-III of the report, which is four pages, includes thefinancial forecast for GASB 75. The Net OPEB Liability as of year-end June 30, 2020 is $224.4 million,which is based on the projected pay-as-you-go number for fiscal year July 1, 2019 to June 30, 2020 asreported by the District.
Pages 1-2 of the report illustrate the financial projections for the plan as of year-end June 30, 2020 to assistyour auditors with accounting for the respective plan year. The report also includes the actuariallydetermined contribution (page 3), deferred inflows/outflows calculation (page 4) and sensitivity for discountand trend rates (page 5). Although the auditors may only require pages 1-5, we recommend forwarding thereport in its entirety. The remainder of the report will include additional documentation and disclosures.
Results for this valuation were valued based on census information provided by your organization in April2020. This is based on a total of 1,030 employees, reflecting the sum of 603 active employees and 427retired employees. The active population reflects approximately 58.3% of the unfunded accrued liabilityabove, with 174 employees or 28.9% of these actives eligible for retirement. Details of census demographicinformation are illustrated further in the report on pages 8-10.
Covered Benefits and Claim Cost Assumptions
The District provides post-employment medical benefits, including prescription drug benefits, as part of themedical plan on a fully insured basis through the Putnam Northern Westchester Health Benefits Consortium(the “Consortium). A second plan was available through Empire Blue Cross/Blue Shield, which was achange from Emblem Health, effective July 1, 2012. However, this second plan was discontinued effectiveJuly 1, 2016 so not reflected in the valuation. As a result, active and retirees will only be participating inthe Consortium medical plan, effective July 1, 2017. Furthermore, premium rates for the Consortium arereflected through June 30, 2021 since these rates were available for this valuation.
AQUARIUS CAPITAL 110 Betsy Brown Road · Port Chester, NY 10573 Tel: 914-933-0063 · Fax: 914-933-0064
Mr. John L. ChowMay 21, 2020Page 2
The valuation reflects the reimbursement of Medicare Part B premium to retirees, spouses, and survivingspouses over age 65 that are eligible for the benefit. Employee will pay Medicare Part B premium and bereimbursed by District. The District does not reimbursement for the Income Related Monthly AdjustmentAmount (IRMAA) amount, which is the excess/income adjusted portion of the Medicare Part B premium.
Certain retirees are eligible for life insurance and receive on a non-contributory basis. The District does notsubsidize benefits for dental or vision coverage in retirement.
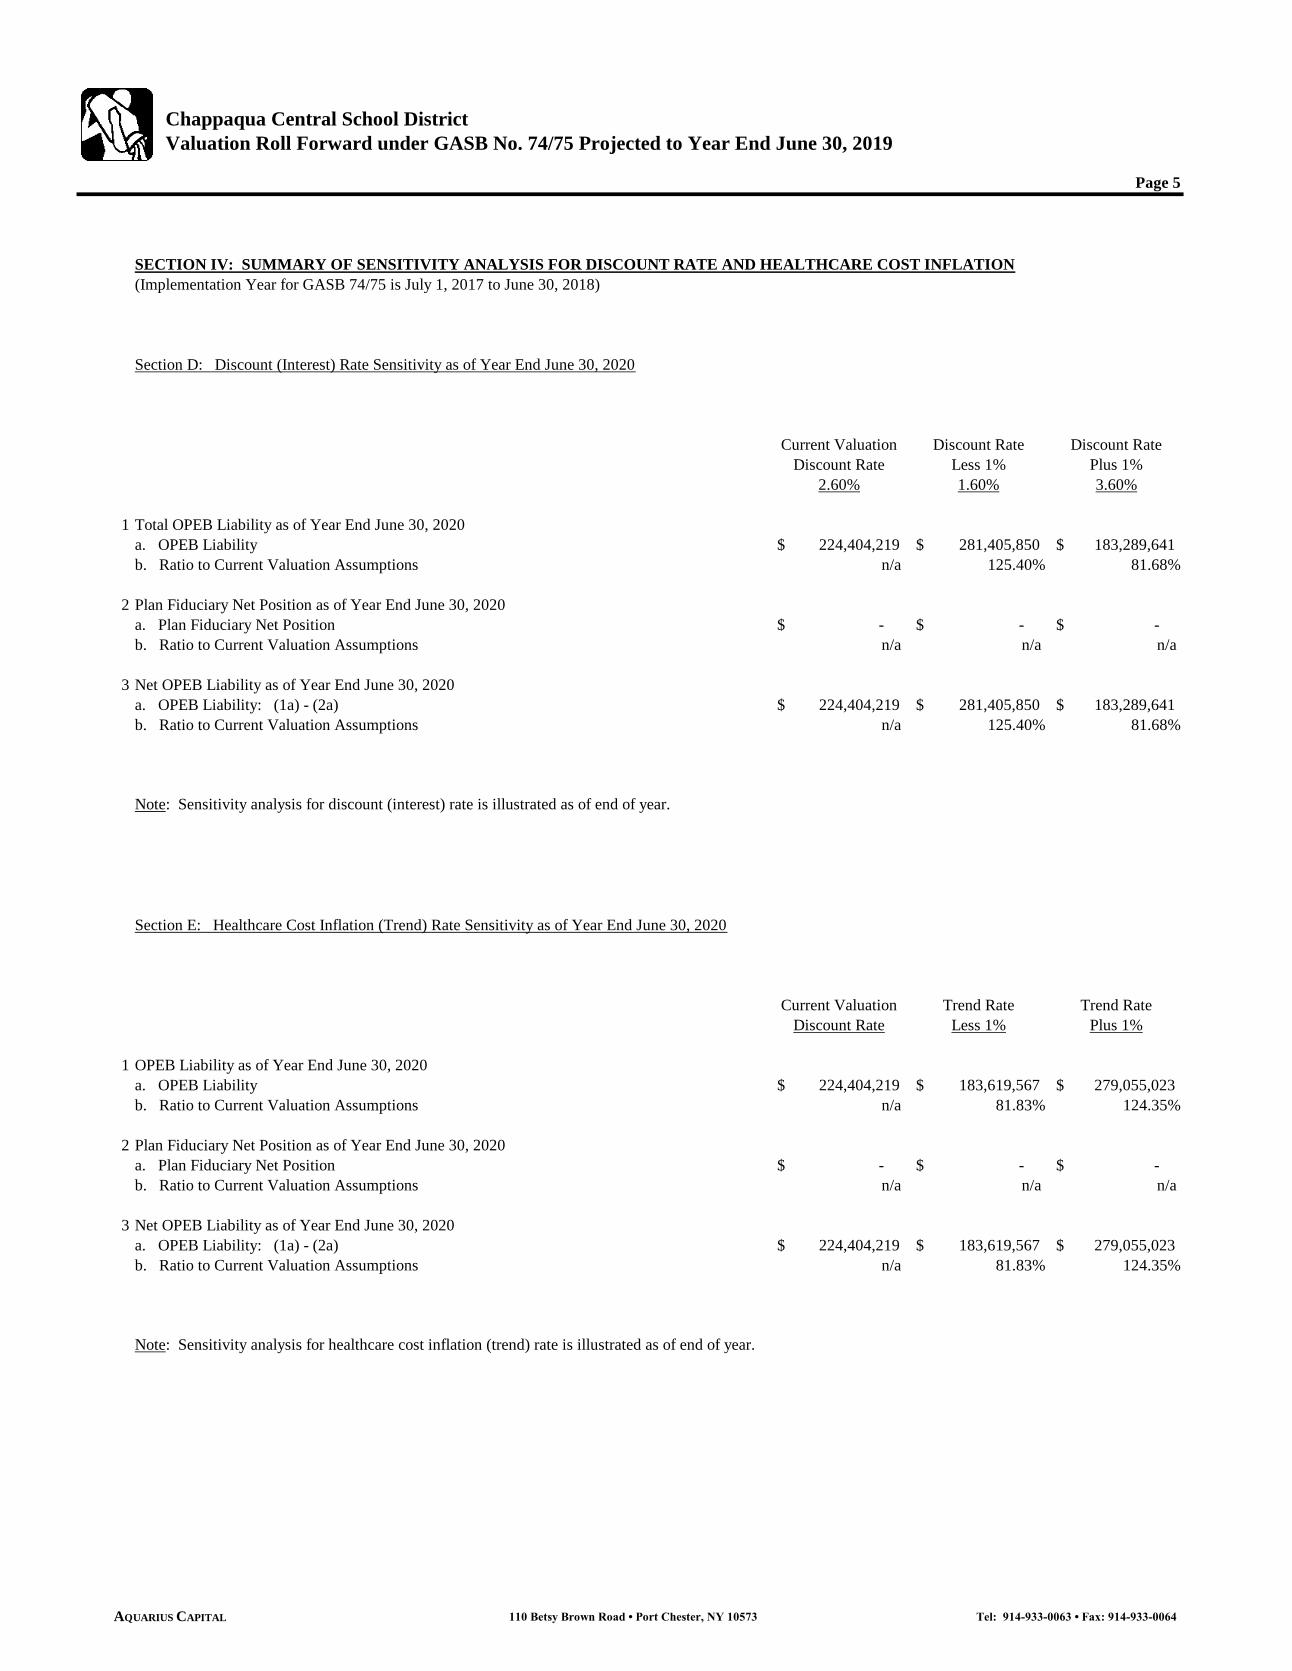
Sensitivity Analysis
Section IV (pages 5-6) of the report includes a sensitivity analysis as of fiscal year-end June 30, 2020 basedon varying the discount interest rate and the healthcare cost inflation (trend) rates. We illustrate twoscenarios for each variable of discount rate and trend rate as prescribed under GASB 75.
The discount rate used was 2.6%, which is consistent with discount rates in the market today and consistentwith the prescribed discount rate under GASB 75. The prior valuation discount rate was 3.5%. Details ofthe discount rate assumption are described further in the report in Section V, page 11.
Additional Seventy-Nine (79) Scenarios
Similar to last year, we incorporated additional scenarios for the valuation as requested by the District, whichare illustrated on pages 16-17. All scenarios are identical to the prior year. This includes forty-nine (49)combinations of discount rate and healthcare cost inflation rate, which are illustrated on page 18 of the report.This is similar to the number of scenarios in the prior valuation.
Also included are thirty (30) combinations of future retiree contribution rates (illustrative percentages) andthe ultimate healthcare inflation rates. It should be noted that the retiree contribution rates are scenarios forillustrative purposes and have not been implemented or negotiated. Retiree contribution rate scenariosassume that current retiree contribution rates will not change and changes to retiree contribution rates wouldonly apply to current actives that would retire in the future.
Similar to past years, the thirty (30) scenarios reflect the use of the same contribution rate for all futureretirees, regardless of union or employment class. These scenarios are illustrated on page 19 of the report.
The ultimate healthcare inflation rates for all seventy-nine (79) scenarios on pages 18-19 are applied foryears 2027 and later. All other assumptions are based on the valuation assumptions in the report. Thesescenarios are illustrated as of July 1, 2019, which is the beginning of the fiscal year to be consistent with theprior year’s analysis.
Projected Pay-As-You-Go and OPEB Liability Projections for Twenty (20) Years
Similar to the prior year, we included a forecast of the projected pay-as-you-go for twenty (20) years. Thisis illustrated on page 17 of the report. The projection includes a forecast of the OPEB Liability during thesame time period for illustrative purposes. The conditions and assumptions used for the projections areillustrated in the footnotes on page 17.
AQUARIUS CAPITAL 110 Betsy Brown Road · Port Chester, NY 10573 Tel: 914-933-0063 · Fax: 914-933-0064
Mr. John L. ChowMay 21, 2020Page 3
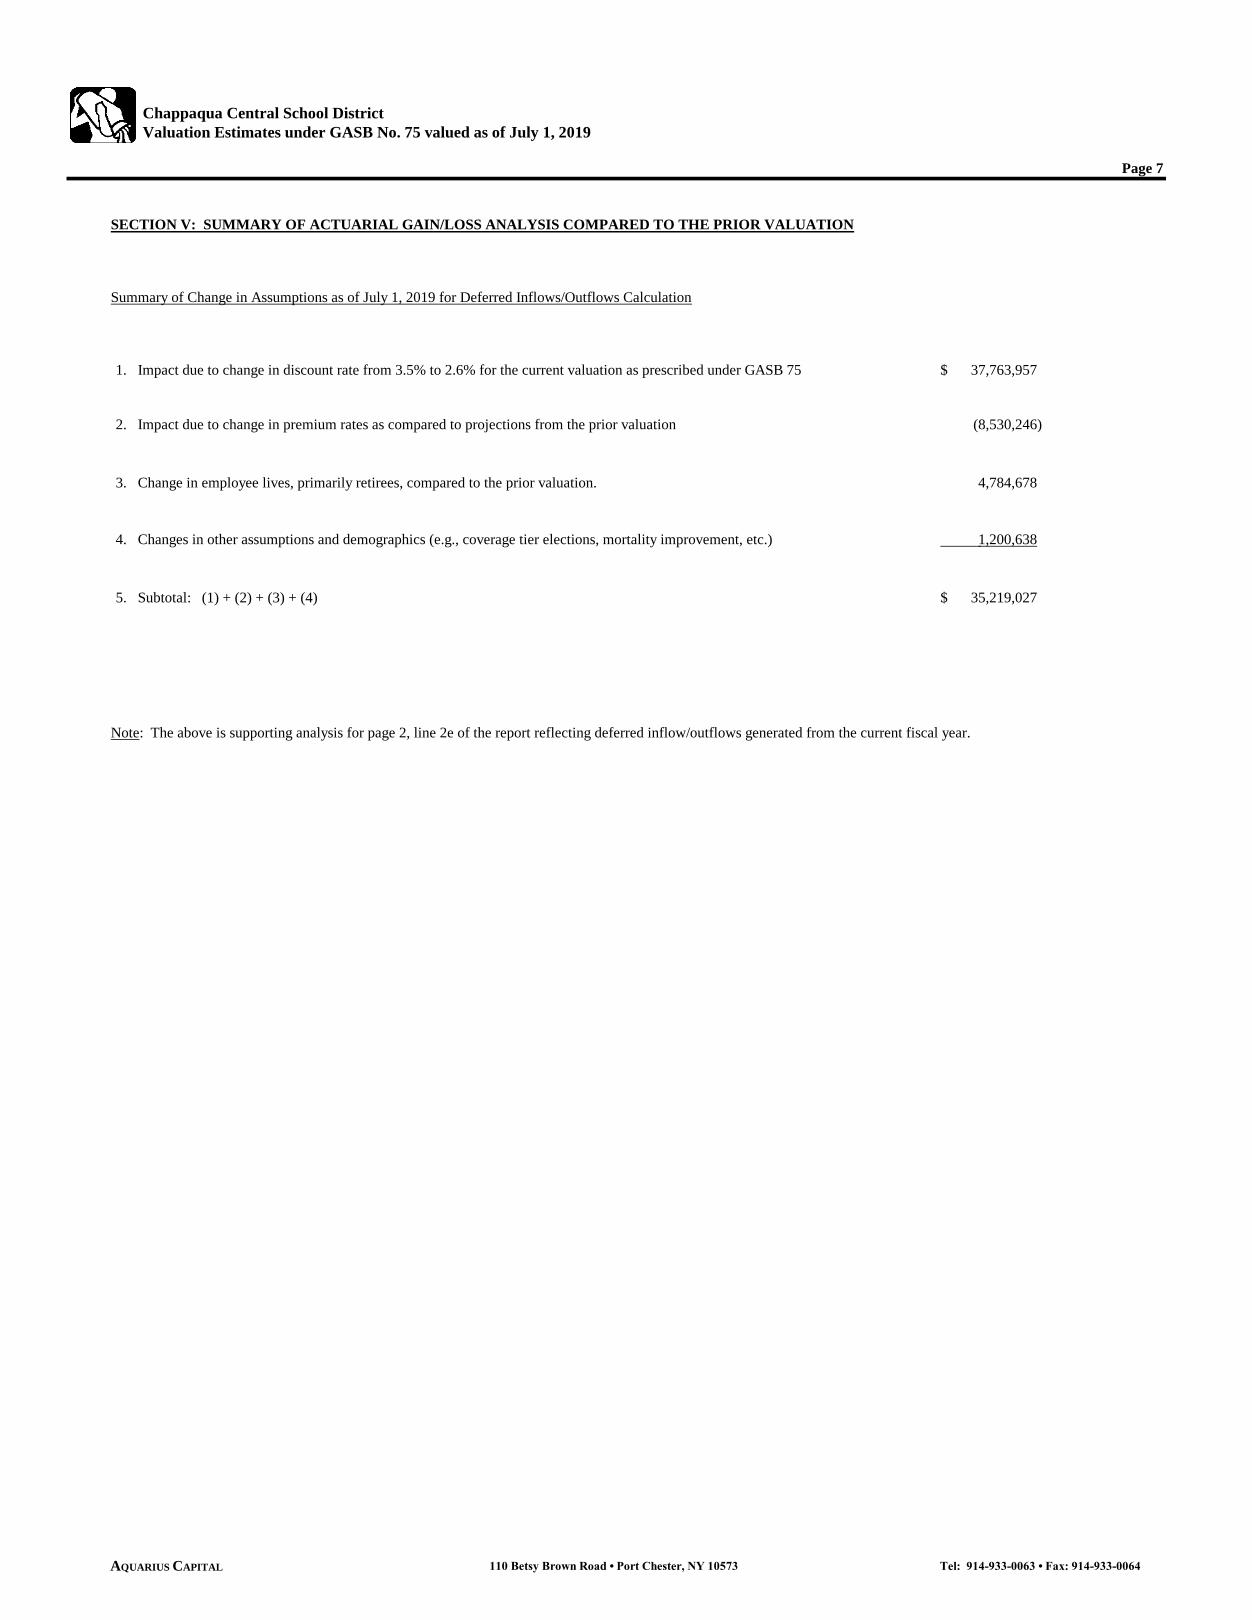
Overview of Actuarial Gain/Loss
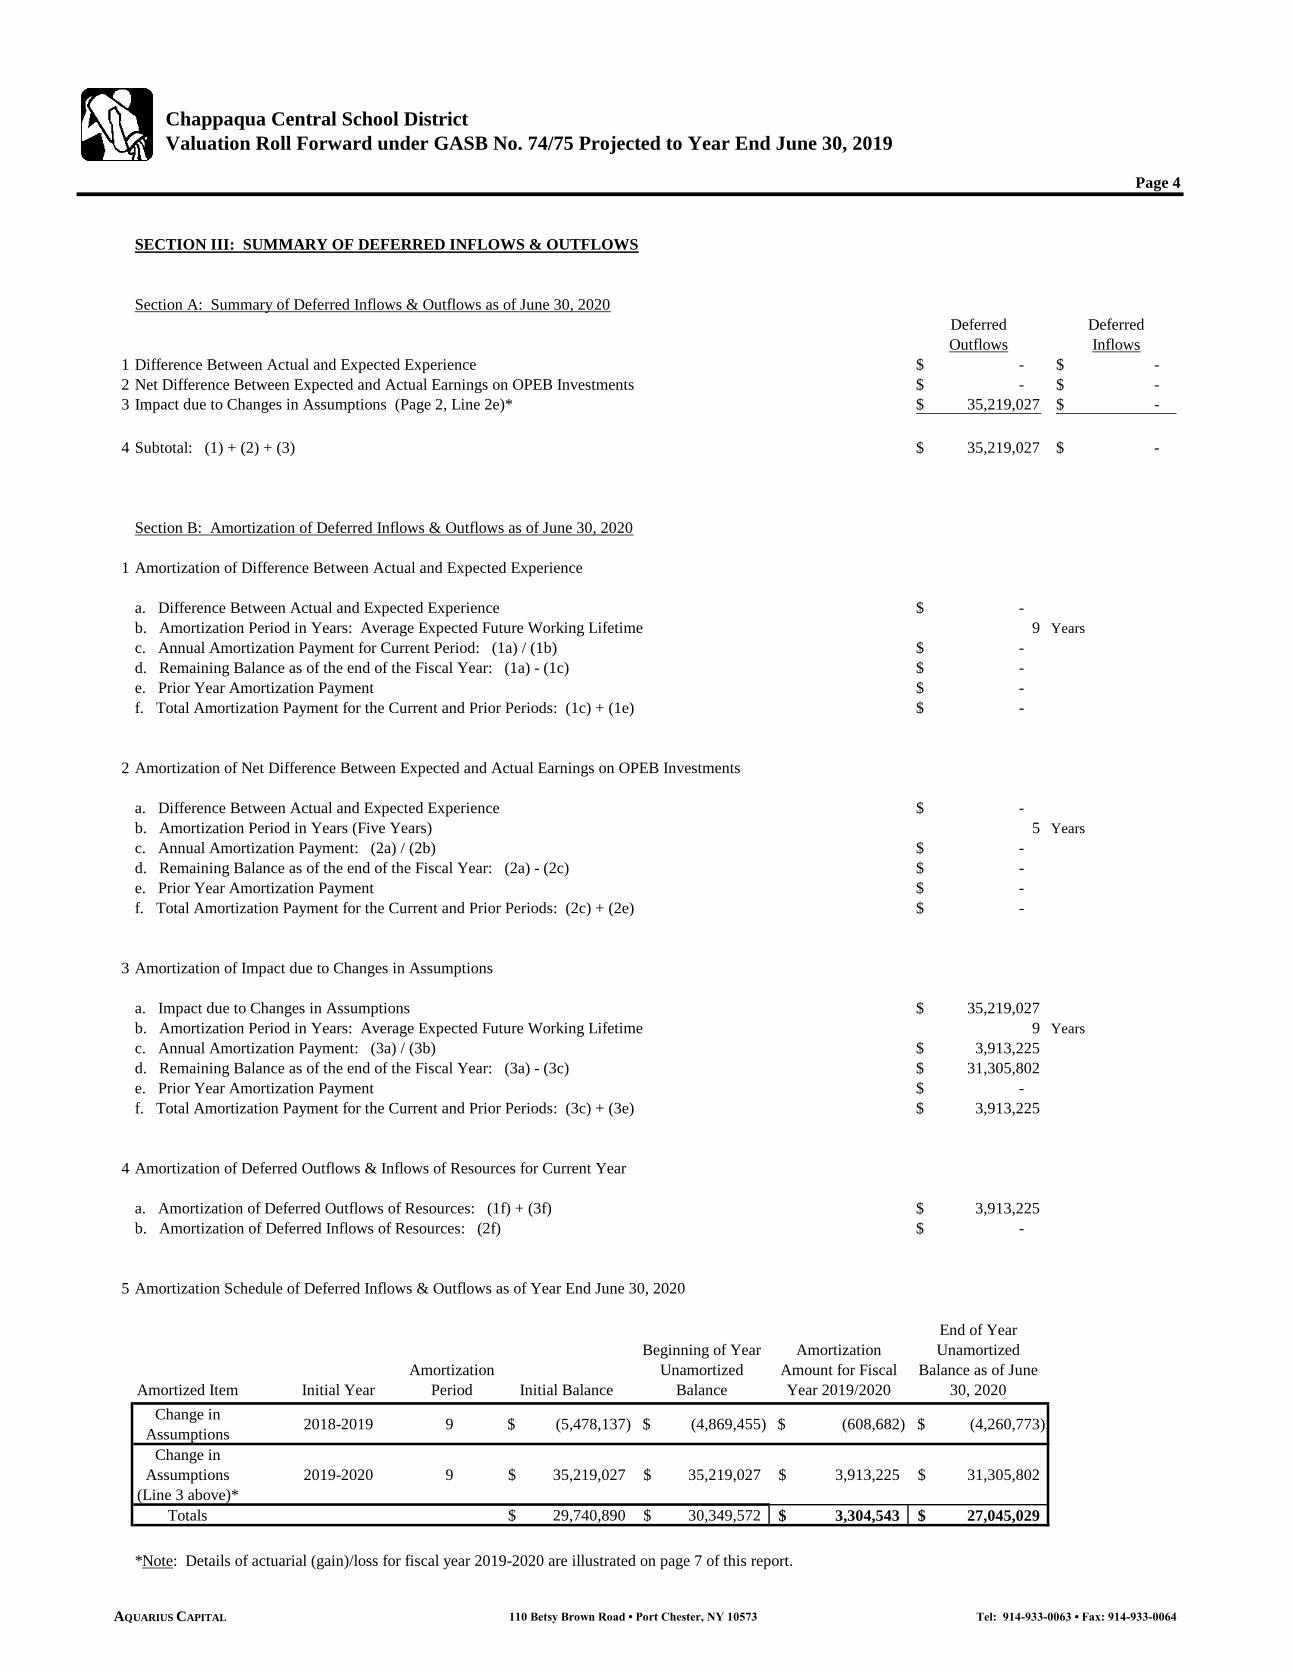
Fiscal year July 1, 2019 to June 30, 2020 is the third year of implementation under GASB 75, so there is anactuarial gain/loss analysis included on page 7 of the report. Furthermore, calculations of deferredinflows/outflow are illustrated on page 4 of the report.
On page 7 (Section V) of the valuation report, we illustrate an actuarial loss (or increase in liability) of $35.2million as compared to the prior year. This reflects the increase in the UAL (or OPEB Liability) as of July1, 2019, which is primarily due the following:
Change in discount rate from 3.5% in the prior valuation to 2.6%; Change in plan costs (premium rates) since the prior valuation; Change in number of employees (primarily retirees) reflected in the valuation as compared to the
prior year; and Change in other assumptions and demographics (e.g., coverage tiers for enrollees, mortality
improvement, etc.).
The above reflects the activity for the deferred inflows/outflows generated for the current fiscal year. Detailsof the actuarial loss including financial projections for each component above, are illustrated on page 7 ofthe report.
The amortization of the deferred inflows/outflow is reflected in the financial statements on page 4 of thereport, which reflects amortizations for each year (current and prior year amortization schedules).
Demographic Information
Section VI of the report illustrates additional information pertaining to underlying census informationincluding age and sex analysis for active and retired employees along with summaries of the activepopulation by age and years of service. Census analysis is illustrated separately for actives and retirees.This is highlighted on pages 6-8 of the report.
Some highlights of census demographic information as of the July 1, 2019 valuation date are as follows:
For retirees, the overall average age is 74.7 years, which reflects an average age of 61.1 for pre-65retirees and 76.6 for post-65 retirees with 12.2% of retirees below age 65.
For actives, the average age is 48.4 years and average years of service of 12.3.
Of the active population, 28.9% of the population (174 employees) is eligible to retire.
74.1% actives and 70.3% retirees valued were female. Active population includes 137 employees that opted-out of coverage.
The report also includes a comparison of demographics from the prior valuation report, i.e., the July 1, 2018valuation. See page 10 for details.
AQUARIUS CAPITAL 110 Betsy Brown Road · Port Chester, NY 10573 Tel: 914-933-0063 · Fax: 914-933-0064
Mr. John L. ChowMay 21, 2020Page 4
Assumptions & Definitions
As part of this report, we included supporting documentation such as a summary of assumptions and keydefinitions (glossary), which are provided in Sections VII-IX. This includes assumptions for health carecosts (premium rates through June 30, 2021 for the Consortium plan), retiree contribution rates, healthcareinflation, decrement tables (e.g., probability of death, turnover, disability, and retirement) and otherprovisions.
The decrement tables used for this valuation are based on the New York State Employees’ RetirementSystem (ERS) and the New York State Teachers’ Retirement System (TRS), similar to the prior valuation.The mortality table used for the current valuation was the RP 2014 Healthy Male and Female Tables basedon the Combined Healthy Table for both pre and post-retirement with mortality improvement projected tothe valuation date similar to the previous valuation, plus fifteen additional years for mortality projectionconsistent with current industry trends in the market.
For additional details on assumptions and definitions, see pages 11-16.
Healthcare Reform
The Patient Protection and Affordable Care Act (PPACA) enacted in March 2010 (Healthcare Reform)includes several fees and/or taxes levied on employer groups either directly (e.g., self-funded employergroups which calculates and pays the fees directly) or indirectly (e.g., fully insured groups in which thehealth insurer pays and passes on to the group in their premium rates). Consistent with the prior valuation,fees associated with PPACA are reflected in the valuation and described in more detail on page 12 of thereport.
Information Reviewed
We based our analysis on reviewing electronic census information (record-by-record review), retiree planinformation, cost information (premium rates through June 30, 2021 for the Consortium plan), collectivebargaining contracts by bargaining unit, audited financial statements as of June 30, 2019, and other summaryinformation of retiree benefits and eligibility. Note that the District’s collective bargaining agreements wereavailable on the District’s website by business unit and fiscal year.
The projected OPEB Liability as of June 30, 2020 reflects the projected pay-as-you-go results for fiscal yearJuly 1, 2019 to June 30, 2020.
We also gathered additional information from the company through emails and other correspondence inorder to confirm retiree benefit information, census confirmations, and assumptions. Census informationwas provided in April 2020 for actives and retirees with details illustrated in Section VI of the report,including comparisons to the prior year valuation report.
AQUARIUS CAPITAL 110 Betsy Brown Road · Port Chester, NY 10573 Tel: 914-933-0063 · Fax: 914-933-0064
Mr. John L. ChowMay 21, 2020Page 5
Data Reliance & Limitations
In our review, we have relied on the information provided by the District. We have not audited or verifiedthe accuracy of the information provided. If the underlying data or information is inaccurate or incomplete,the results of our analysis may likewise be inaccurate or incomplete.
This report and all attachments contained herein are for the internal use of the District. It may not beprovided to other parties without prior consent. If consent is granted, the report must be provided in itsentirety. We understand the District intends to distribute this letter and attachments to its auditor and feeaccountant in connection with the reporting of results of this report for the sole use of preparation of auditedfinancial statements. Aquarius consents to this distribution as long as the report is provided in its entiretyand the auditor is advised to have an actuary review the work.
This report is provided to the District for the sole purpose of calculating results under GASB 75. Informationin this report may not be appropriate to use for other purposes. Aquarius does not intend to benefit from theoverall results of the report, and we assume no duty, liability or obligation to parties that use this work forother reasons other than its sole intention, i.e., reporting of GASB 75 for financial statements for the District.
A summary of benefits and eligibility are provided in this documentation for illustrative purposes in orderto understand the types of benefits reflected in the valuation. We recommend reviewing the District’s plandocument and collective bargaining agreements for details on eligibility and covered benefits. Informationin this report should not be used instead of the District’s plan document and/or summary plan description(SPD) when evaluating benefits.
This report does not reflect the impact of GASB 45 since the District migrated to GASB 75 for fiscal yearJuly 1, 2017 to June 30, 2018. Furthermore, the payroll number reported in this valuation is based on asnapshot of annualized payroll information and not actual payroll paid to employees throughout the year.
Furthermore, our understanding is that the District does not maintain assets in an OPEB trust, so nodisclosure reporting would be required under GASB74. If the District elects to set up an OPEB trust andcontribute assets towards the plan, then please let us know so that we can reflect accordingly, includingproviding any additional disclosures that may be required under GASB 74.
Special Considerations due to Current Market Conditions
In the end of February, the market conditions and assets were adversely impacted due to the global impactof the Corona Virus (COVID-19). The OPEB plan is currently unfunded, so supporting assets were notevaluated or reviewed.
Furthermore, no special adjustments were made to the current mortality or morbidity assumptions (e.g.,health plan costs for the Putnam Northern Westchester Health Benefits Consortium) for the OPEB liabilitydue to COVID-19. This will be reviewed further as experience materializes for future valuations.

AQUARIUS CAPITAL 110 Betsy Brown Road · Port Chester, NY 10573 Tel: 914-933-0063 · Fax: 914-933-0064
Mr. John L. ChowMay 21, 2020Page 6
Actuarial Opinion
I, Michael L. Frank, ASA, FCA, MAAA, am President and Actuary of Aquarius Capital Solutions GroupLLC. I am an Associate of the Society of Actuaries, Fellow of Conference of Consulting Actuaries, andMember of the American Academy of Actuaries and I meet the Qualification Standards of the AmericanAcademy of Actuaries to render the actuarial opinion contained herein.
The attached report was completed in accordance with generally accepted actuarial principles and practices.
Independence Certification
Our organization and its employees are independent of the District and do not have any conflicts of interestas it relates to the services performed on behalf of the District in the preparation of this report.
We hope that this report is beneficial. When convenient, please contact me so that we can schedule a callor meeting to review the report in more detail. We are available to walk through the report with your auditorsas well to assist with the reporting of GASB 75 results for the current fiscal year.
In addition, please extend thanks to you and your team for assistance in the gathering of information to helpus complete this analysis. Their assistance was much appreciated. We look forward to working with youin the future.
Sincerely,
Michael L. Frank, A.S.A., M.A.A.A., F.C.A.President & ActuaryAmerican Academy of Actuaries ID No. 21342
cc: Donald Rusconi – Aquarius Capital
Enclosure
Chappaqua Central School District
Valuation Estimates under GASB No. 75 valued as of July 1, 2019
Prepared by: Aquarius Capital Solutions Group LLCMay 21, 2020
CHAPPAQUA CENTRAL SCHOOL DISTRICT
GASB NO. 75
VALUATION AS OF JULY 1, 2019
110 Betsy Brown Road • Port Chester, NY 10573 Tel: 914-933-0063 • Fax: 914-933-0064AQUARIUS CAPITAL

Chappaqua Central School District
Valuation Estimates under GASB No. 75 valued as of July 1, 2019
Pages
Sections I - V Summary of Financial Information including Sensitivity Analysis 1 - 5
Section I: GASB No. 74/75 Financial Results for June 30, 2020 Disclosure 1 - 2
Section II: Actuarially Determined Contribution 3
Section III: Summary of Deferred Inflows & Outflows 4
Section IV: Sensitivity Analysis for Discount Rate and Healthcare Cost Inflation 5 - 6
Section V: Summary of Actuarial Gain/Loss Analysis Compared to the Prior Valuation 7
Section VI Summary of Census Information for Active & Retired Employees 8 - 10
Summary of Retired Employees 8
Summary of Active Employees 9
Comparison of Census Information to the Prior Valuation 10
Section VII Summary of Assumptions 11 - 14
Section VIII Summary of Definitions & Glossary 15
Section IX Summary of Plan Cost Assumptions 16
Section X Projection of Pay-As-You-Go Payments and OPEB Liability for Twenty (20) Years 17
Section XI Summary of Scenarios for Discount Rates & Healthcare Cost Trend Rates - 49 Scenarios 18
Section XII Summary of Scenarios for Retiree Contribution Rates & Healthcare Cost Trend Rates - 30 Scenarios 19
TABLE OF CONTENTS
110 Betsy Brown Road • Port Chester, NY 10573 Tel: 914-933-0063 • Fax: 914-933-0064AQUARIUS CAPITAL

Chappaqua Central School District
Valuation Roll Forward under GASB No. 74/75 Projected to Year End June 30, 2019
Page 1
SECTION I: GASB NO. 74/75 REPORTING TO YEAR END JUNE 30, 2019 REPORTING
(Implementation Year for GASB 74/75 is July 1, 2017 to June 30, 2018)
Section A: Reported OPEB Liability as of Year End June 30, 2020
1 Discount Rate 2.60%
2 Present Value of Future Benefits as of Year End June 30, 2020 274,231,157$
3 Total OPEB Liability as of Year End June 30, 2020 224,404,219$
4 Plan Fiduciary Net Position as of Year End June 30, 2020 -$
5 Net OPEB Liability as of Year End June 30, 2020: (3) - (4) 224,404,219$
6 Plan Fiduciary Net Position as a Percentage of OPEB Liability: (4) / (3) 0.00%
7 Total Annual Salary (Compensation) based on current valuation census (including assumptions for missing salaries) 60,717,351$
8 Net OPEB Liability as a Percentage of Annual Salary: (5) / (7) 369.59%
9 Total Employee Census Counts for Valuationa. Active Employees (including opt-outs) 603 b. Retired Employees (including vested terminations) 427 c. Subtotal: (8a) + (8b) 1,030
Section B: Projected Expense Calculation as of Year End June 30, 2020
1 Service Cost with Interest - Period July 1, 2019 to June 30, 2020 2,824,382$
2 Interest Cost - Period July 1, 2019 to June 30, 2020a. Discount Rate 2.60%b. Total OPEB Liability as of June 30, 2019 186,315,788$ c. Actual Benefit Payments - Illustrated as Project for Period July 1, 2019 to June 30, 2020 4,737,600$ d. Interest Cost: (2a) x [ (2b) - (2c) / 2 ] 4,782,622$
3 Investment Return - Period July 1, 2019 to June 30, 2020 -$
4 Employee Contributions - Period July 1, 2019 to June 30, 2020 -$ (Amount is illustrated as zero since employer contributions are illustrated net of employee contributions)
5 Administrative Expenses -$
6 Plan Changes -$
7 Amortization of Unrecognized Amountsa. Liability (Gain)/Loss: Page 4, Section B, Line 5 3,304,543$ b. Asset (Gain)/Loss: Page 4, Section B, Line 5 -$ c. Net (Gain)/Loss: (7a) - (7b) 3,304,543$
8 Total Expense - Period July 1, 2019 to June 30, 2020 10,911,547$ (1) + (2d) + (3) + (4) + (5) + (6) + (7c)
110 Betsy Brown Road • Port Chester, NY 10573 Tel: 914-933-0063 • Fax: 914-933-0064AQUARIUS CAPITAL
Chappaqua Central School District
Valuation Roll Forward under GASB No. 74/75 Projected to Year End June 30, 2019
Page 2
SECTION I: GASB NO. 74/75 REPORTING TO YEAR END JUNE 30, 2019 REPORTING (CONTINUED)
(Implementation Year for GASB 74/75 is July 1, 2017 to June 30, 2018)
Section C: Reconciliation of Net OPEB Liability as of Year End June 30, 2020
Total Plan Fiduciary NetOPEB Liability Net Position OPEB Liability
1 Balance Recognized as of Beginning of Year (End of Prior Year) 186,315,788$ -$ 186,315,788$ (Matches prior actuarial report and June 30, 2019 audit report, page 55)
2 Changes Recognized for Fiscal Yeara. Service Cost 2,824,382$ -$ 2,824,382$ b. Interest on Total OPEB Liability: Section B, Line 2d 4,782,622$ -$ 4,782,622$ c. Change in Benefit Terms: Section B, Line 6 -$ -$ -$ d. Change in Expected to Actual -$ -$ -$ e. Changes in Assumptions 35,219,027$ -$ 35,219,027$ f. Benefit Payments: Section B, Line 2c (4,737,600)$ -$ (4,737,600)$ g. Contributions from Employer -$ -$ -$ h. Contributions from Employees -$ -$ -$ i. Net Investment Income: Section B, Line 3 -$ -$ -$ j. Administrative Expenses: Section B, Line 5 -$ -$ -$ k. Net Changes: (a) + … + (j) 38,088,431$ -$ 38,088,431$
3 Balance Recognized as of End Year - June 30, 2020 224,404,219$ -$ 224,404,219$ (1) + (2k)
Notes:
a. Employee contributions are illustrated above as zero since employer contributions are illustrated net of employee contributions.
b. This fiscal year is the third year of implementation for GASB No. 75 with deferred inflows or outflows of resources illustrated on page 4.
c. Line 2(e) reflects change in census, assumptions and collective bargaining agreements from prior valuation to current valuation.
110 Betsy Brown Road • Port Chester, NY 10573 Tel: 914-933-0063 • Fax: 914-933-0064AQUARIUS CAPITAL
Chappaqua Central School District
Valuation Roll Forward under GASB No. 74/75 Projected to Year End June 30, 2019
Page 3
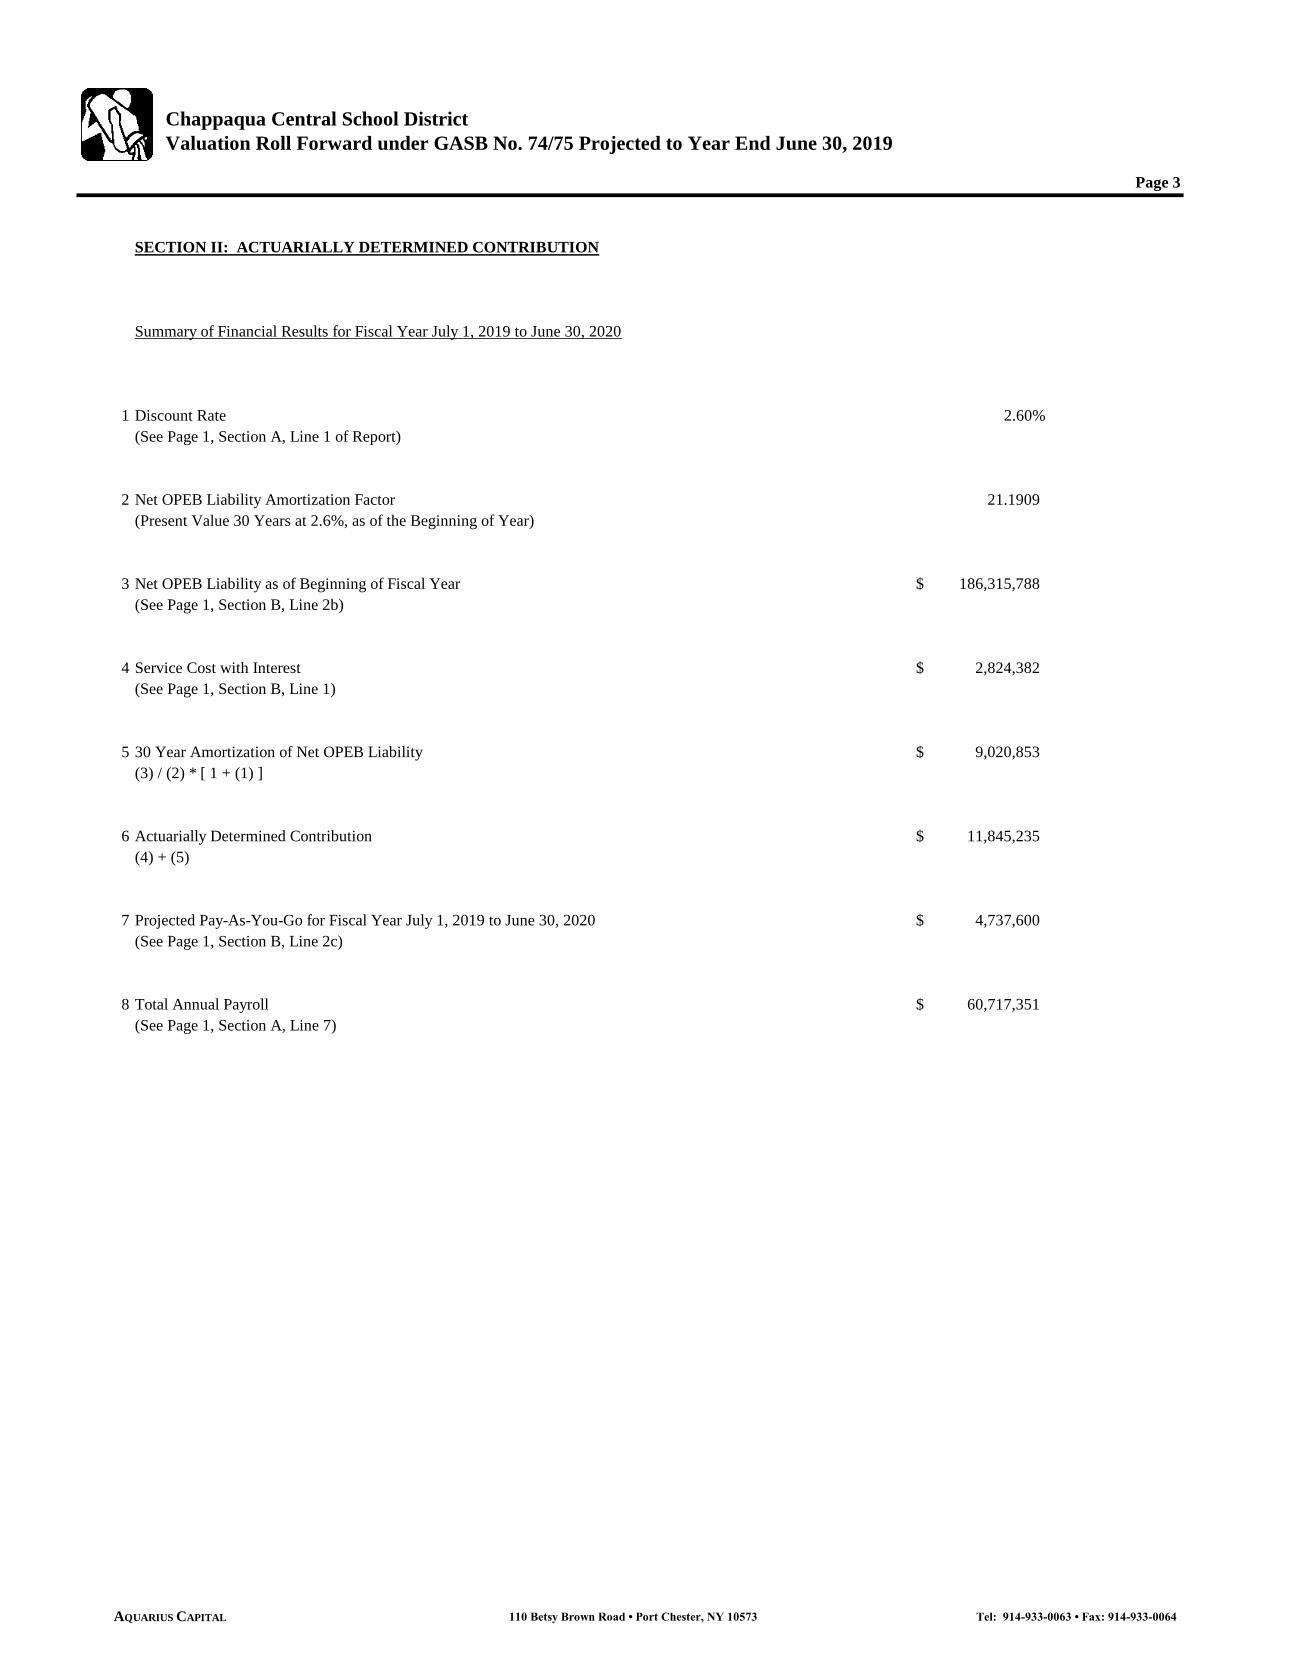
SECTION II: ACTUARIALLY DETERMINED CONTRIBUTION
Summary of Financial Results for Fiscal Year July 1, 2019 to June 30, 2020
1 Discount Rate 2.60%(See Page 1, Section A, Line 1 of Report)
2 Net OPEB Liability Amortization Factor 21.1909 (Present Value 30 Years at 2.6%, as of the Beginning of Year)
3 Net OPEB Liability as of Beginning of Fiscal Year 186,315,788$ (See Page 1, Section B, Line 2b)
4 Service Cost with Interest 2,824,382$ (See Page 1, Section B, Line 1)
5 30 Year Amortization of Net OPEB Liability 9,020,853$ (3) / (2) * [ 1 + (1) ]
6 Actuarially Determined Contribution 11,845,235$ (4) + (5)
7 Projected Pay-As-You-Go for Fiscal Year July 1, 2019 to June 30, 2020 4,737,600$ (See Page 1, Section B, Line 2c)
8 Total Annual Payroll 60,717,351$ (See Page 1, Section A, Line 7)
110 Betsy Brown Road • Port Chester, NY 10573 Tel: 914-933-0063 • Fax: 914-933-0064AQUARIUS CAPITAL
Chappaqua Central School District
Valuation Roll Forward under GASB No. 74/75 Projected to Year End June 30, 2019
Page 4
SECTION III: SUMMARY OF DEFERRED INFLOWS & OUTFLOWS
Section A: Summary of Deferred Inflows & Outflows as of June 30, 2020Deferred DeferredOutflows Inflows
1 Difference Between Actual and Expected Experience -$ -$ 2 Net Difference Between Expected and Actual Earnings on OPEB Investments -$ -$ 3 Impact due to Changes in Assumptions (Page 2, Line 2e)* 35,219,027$ -$
4 Subtotal: (1) + (2) + (3) 35,219,027$ -$
Section B: Amortization of Deferred Inflows & Outflows as of June 30, 2020
1 Amortization of Difference Between Actual and Expected Experience
a. Difference Between Actual and Expected Experience -$ b. Amortization Period in Years: Average Expected Future Working Lifetime 9 Yearsc. Annual Amortization Payment for Current Period: (1a) / (1b) -$ d. Remaining Balance as of the end of the Fiscal Year: (1a) - (1c) -$ e. Prior Year Amortization Payment -$ f. Total Amortization Payment for the Current and Prior Periods: (1c) + (1e) -$
2 Amortization of Net Difference Between Expected and Actual Earnings on OPEB Investments
a. Difference Between Actual and Expected Experience -$ b. Amortization Period in Years (Five Years) 5 Yearsc. Annual Amortization Payment: (2a) / (2b) -$ d. Remaining Balance as of the end of the Fiscal Year: (2a) - (2c) -$ e. Prior Year Amortization Payment -$ f. Total Amortization Payment for the Current and Prior Periods: (2c) + (2e) -$
3 Amortization of Impact due to Changes in Assumptions
a. Impact due to Changes in Assumptions 35,219,027$ b. Amortization Period in Years: Average Expected Future Working Lifetime 9 Yearsc. Annual Amortization Payment: (3a) / (3b) 3,913,225$ d. Remaining Balance as of the end of the Fiscal Year: (3a) - (3c) 31,305,802$ e. Prior Year Amortization Payment -$ f. Total Amortization Payment for the Current and Prior Periods: (3c) + (3e) 3,913,225$
4 Amortization of Deferred Outflows & Inflows of Resources for Current Year
a. Amortization of Deferred Outflows of Resources: (1f) + (3f) 3,913,225$ b. Amortization of Deferred Inflows of Resources: (2f) -$
5 Amortization Schedule of Deferred Inflows & Outflows as of Year End June 30, 2020
Amortized Item Initial YearAmortization
Period Initial Balance
Beginning of Year Unamortized
Balance
Amortization Amount for Fiscal Year 2019/2020
End of Year Unamortized
Balance as of June 30, 2020
Change in Assumptions 2018-2019 9 (5,478,137)$ (4,869,455)$ (608,682)$ (4,260,773)$
Change in Assumptions
(Line 3 above)*2019-2020 9 35,219,027$ 35,219,027$ 3,913,225$ 31,305,802$
Totals 29,740,890$ 30,349,572$ 3,304,543$ 27,045,029$
*Note: Details of actuarial (gain)/loss for fiscal year 2019-2020 are illustrated on page 7 of this report.
110 Betsy Brown Road • Port Chester, NY 10573 Tel: 914-933-0063 • Fax: 914-933-0064AQUARIUS CAPITAL
Chappaqua Central School District
Valuation Roll Forward under GASB No. 74/75 Projected to Year End June 30, 2019
Page 5
SECTION IV: SUMMARY OF SENSITIVITY ANALYSIS FOR DISCOUNT RATE AND HEALTHCARE COST INFLATION
(Implementation Year for GASB 74/75 is July 1, 2017 to June 30, 2018)
Section D: Discount (Interest) Rate Sensitivity as of Year End June 30, 2020
Current Valuation Discount Rate Discount RateDiscount Rate Less 1% Plus 1%
2.60% 1.60% 3.60%
1 Total OPEB Liability as of Year End June 30, 2020a. OPEB Liability 224,404,219$ 281,405,850$ 183,289,641$ b. Ratio to Current Valuation Assumptions n/a 125.40% 81.68%
2 Plan Fiduciary Net Position as of Year End June 30, 2020a. Plan Fiduciary Net Position -$ -$ -$ b. Ratio to Current Valuation Assumptions n/a n/a n/a
3 Net OPEB Liability as of Year End June 30, 2020a. OPEB Liability: (1a) - (2a) 224,404,219$ 281,405,850$ 183,289,641$ b. Ratio to Current Valuation Assumptions n/a 125.40% 81.68%
Note: Sensitivity analysis for discount (interest) rate is illustrated as of end of year.
Section E: Healthcare Cost Inflation (Trend) Rate Sensitivity as of Year End June 30, 2020
Current Valuation Trend Rate Trend RateDiscount Rate Less 1% Plus 1%
1 OPEB Liability as of Year End June 30, 2020a. OPEB Liability 224,404,219$ 183,619,567$ 279,055,023$ b. Ratio to Current Valuation Assumptions n/a 81.83% 124.35%
2 Plan Fiduciary Net Position as of Year End June 30, 2020a. Plan Fiduciary Net Position -$ -$ -$ b. Ratio to Current Valuation Assumptions n/a n/a n/a
3 Net OPEB Liability as of Year End June 30, 2020a. OPEB Liability: (1a) - (2a) 224,404,219$ 183,619,567$ 279,055,023$ b. Ratio to Current Valuation Assumptions n/a 81.83% 124.35%
Note: Sensitivity analysis for healthcare cost inflation (trend) rate is illustrated as of end of year.
110 Betsy Brown Road • Port Chester, NY 10573 Tel: 914-933-0063 • Fax: 914-933-0064AQUARIUS CAPITAL

Chappaqua Central School District
Valuation Estimates under GASB No. 75 valued as of July 1, 2019
Page 6
SECTION IV: SUMMARY OF SENSITIVITY ANALYSIS FOR DISCOUNT RATE AND HEALTHCARE COST INFLATION (CONTINUED)
Summary of Financial Results with Sensitivity Analysis Base Scenario Sensitivity Analysis Sensitivity Analysis Healthcare Cost Healthcare Cost(July 1, 2019 Valuation Date) Val. Discount Val. Discount Val. Discount Trend Rate Trend Rate
Rate of Rate of Rate of Assumptions Assumptions2.60% 3.60% 1.60% Increased 1% Decreased 1%
1 Total Employee Livesa. Actives 603 603 603 603 603 b. Retirees 427 427 427 427 427 c. Subtotal 1,030 1,030 1,030 1,030 1,030
2 Present Value of Future Benefits (PVFB) as of July 1, 2019a. Actives 179,957,056$ 134,328,736$ 245,910,428$ 239,666,874$ 136,993,926$ b. Retirees 92,002,345$ 81,840,718$ 104,346,663$ 102,249,768$ 83,299,068$ c. Subtotal 271,959,401$ 216,169,454$ 350,257,091$ 341,916,642$ 220,292,994$ d. % Actives as ratio of Subtotal 66.2% 62.1% 70.2% 70.1% 62.2%e. Sensitivity Analysis of Subtotal: Ratio to Base Scenario for PVFB 79.5% 128.8% 125.7% 81.0%
3 Accrued Liability (AL) as of July 1, 2019a. Actives 128,639,980$ 97,467,670$ 174,020,400$ 170,685,949$ 98,280,043$ b. Retirees 92,002,345$ 81,840,718$ 104,346,663$ 102,249,768$ 83,299,068$ c. Subtotal 220,642,325$ 179,308,388$ 278,367,063$ 272,935,717$ 181,579,111$ d. % Actives as ratio of Subtotal 58.3% 54.4% 62.5% 62.5% 54.1%e. Sensitivity Analysis of Subtotal: Ratio to Base Scenario for AL 81.3% 126.2% 123.7% 82.3%
4 Assets as of July 1, 2019 -$ -$ -$ -$ -$
5 Unfunded Accrued Liability (UAL) 220,642,325$ 179,308,388$ 278,367,063$ 272,935,717$ 181,579,111$ (3c) - (4)
6 Service Cost with Interesta. Service Cost at Year End: 2,824,382$ 2,349,028$ 3,360,415$ 3,822,166$ 2,118,588$ b. Ratio to Valuation Results for Service Cost 83.2% 119.0% 135.3% 75.0%
7 Pay-As-You-Go Benefits - Illustrated as Projected 4,737,600$ 4,737,600$ 4,737,600$ 4,737,600$ 4,737,600$
8 Ratio of AL to Pay-As-You-Go: (3c) / (7) 46.57 37.85 58.76 57.61 38.33
9 Ratio of Service Cost to Pay-As-You-Go: (6a) / (7) 0.60 0.50 0.71 0.81 0.45
10 Average Annual Pay-As-You-Go Benefit per Retiree 11,095$ 11,095$ 11,095$ 11,095$ 11,095$ (7) / (1b)
11 Three Year Projection of Pay-As-You-Go Costsa. Year 1: July 1, 2019 to June 30, 2020: (7) 4,737,600$ 4,737,600$ 4,737,600$ 4,737,600$ 4,737,600$ b. Year 2: July 1, 2020 to June 30, 2021 4,881,104$ 4,881,104$ 4,881,104$ 4,881,104$ 4,881,104$ c. Year 3: July 1, 2021 to June 30, 2022 5,141,740$ 5,141,740$ 5,141,740$ 5,146,794$ 5,136,678$
12 Discount Rate 2.60% 3.60% 1.60% 2.60% 2.60%
13 Interest Cost for Fiscal Year July 1, 2019 to June 30, 2020 5,675,112$ 6,369,825$ 4,415,972$ 7,034,740$ 4,659,468$ (3c) x (12) - (7) x (12) / 2; excludes interest on service cost
14 Accrued Liability (AL) as of June 30, 2020 224,404,219$ 183,289,641$ 281,405,850$ 279,055,023$ 183,619,567$ (3c) + (6a) - (7) + (13)
15 Assets as of June 30, 2020 -$ -$ -$ -$ -$
16 Unfunded Accrued Liability (UAL) as of June 30, 2020 224,404,219$ 183,289,641$ 281,405,850$ 279,055,023$ 183,619,567$ (14) - (15)
17 Present Value of Future Benefits (PVFB) as of June 30, 2020 274,231,157$ 219,128,678$ 351,085,704$ 346,007,286$ 221,221,423$ (2c) x [ 1 + (12) ] - (7) x [ 1 + (12) / 2 ]
Note: All costs are net of retiree contributions. See pages 1-2 for financial statement information.
110 Betsy Brown Road • Port Chester, NY 10573 Tel: 914-933-0063 • Fax: 914-933-0064AQUARIUS CAPITAL
Chappaqua Central School District
Valuation Estimates under GASB No. 75 valued as of July 1, 2019
Page 7
SECTION V: SUMMARY OF ACTUARIAL GAIN/LOSS ANALYSIS COMPARED TO THE PRIOR VALUATION
Summary of Change in Assumptions as of July 1, 2019 for Deferred Inflows/Outflows Calculation
1. Impact due to change in discount rate from 3.5% to 2.6% for the current valuation as prescribed under GASB 75 37,763,957$
2. Impact due to change in premium rates as compared to projections from the prior valuation (8,530,246)
3. Change in employee lives, primarily retirees, compared to the prior valuation. 4,784,678
4. Changes in other assumptions and demographics (e.g., coverage tier elections, mortality improvement, etc.) 1,200,638
5. Subtotal: (1) + (2) + (3) + (4) 35,219,027$
Note: The above is supporting analysis for page 2, line 2e of the report reflecting deferred inflow/outflows generated from the current fiscal year.
110 Betsy Brown Road • Port Chester, NY 10573 Tel: 914-933-0063 • Fax: 914-933-0064AQUARIUS CAPITAL
Chappaqua Central School District
Valuation Estimates under GASB No. 75 valued as of July 1, 2019
Page 8
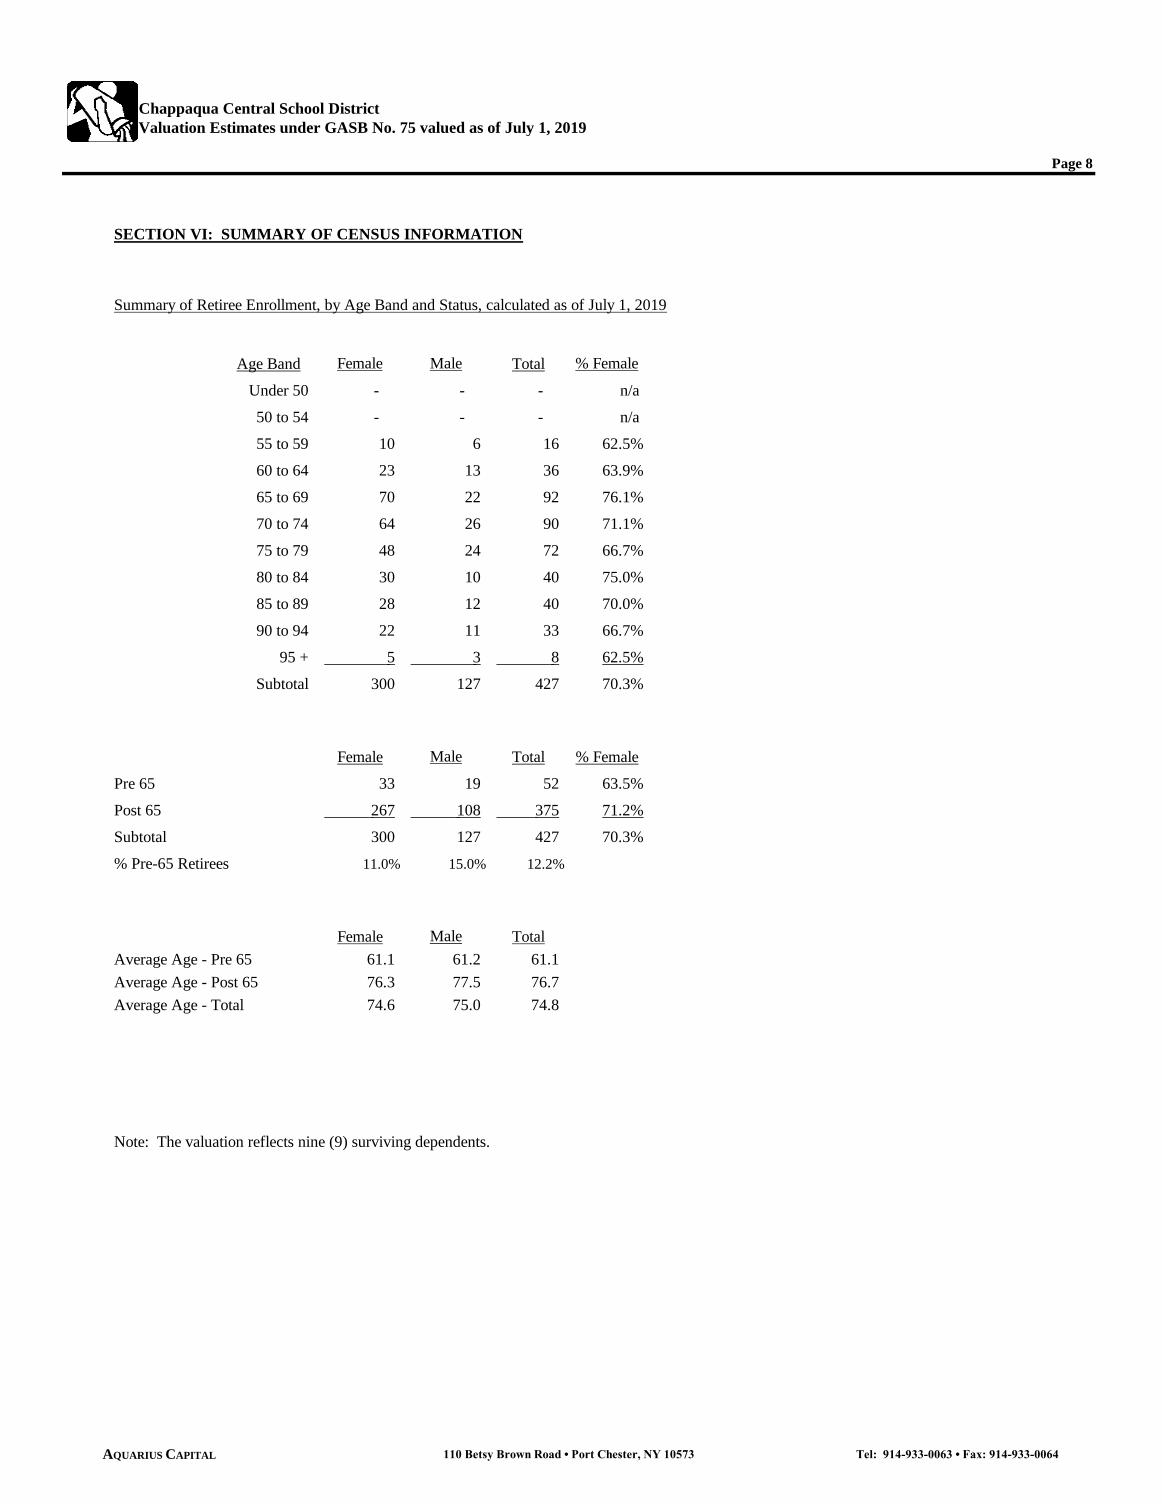
SECTION VI: SUMMARY OF CENSUS INFORMATION
Summary of Retiree Enrollment, by Age Band and Status, calculated as of July 1, 2019
Age Band Female Male Total % Female
Under 50 - - - n/a 50 to 54 - - - n/a 55 to 59 10 6 16 62.5%60 to 64 23 13 36 63.9%65 to 69 70 22 92 76.1%70 to 74 64 26 90 71.1%75 to 79 48 24 72 66.7%80 to 84 30 10 40 75.0%85 to 89 28 12 40 70.0%90 to 94 22 11 33 66.7%
95 + 5 3 8 62.5%Subtotal 300 127 427 70.3%
Female Male Total % FemalePre 65 33 19 52 63.5%Post 65 267 108 375 71.2%Subtotal 300 127 427 70.3%% Pre-65 Retirees 11.0% 15.0% 12.2%
Female Male TotalAverage Age - Pre 65 61.1 61.2 61.1 Average Age - Post 65 76.3 77.5 76.7 Average Age - Total 74.6 75.0 74.8
Note: The valuation reflects nine (9) surviving dependents.
110 Betsy Brown Road • Port Chester, NY 10573 Tel: 914-933-0063 • Fax: 914-933-0064AQUARIUS CAPITAL
Chappaqua Central School District
Valuation Estimates under GASB No. 75 valued as of July 1, 2019
Page 9
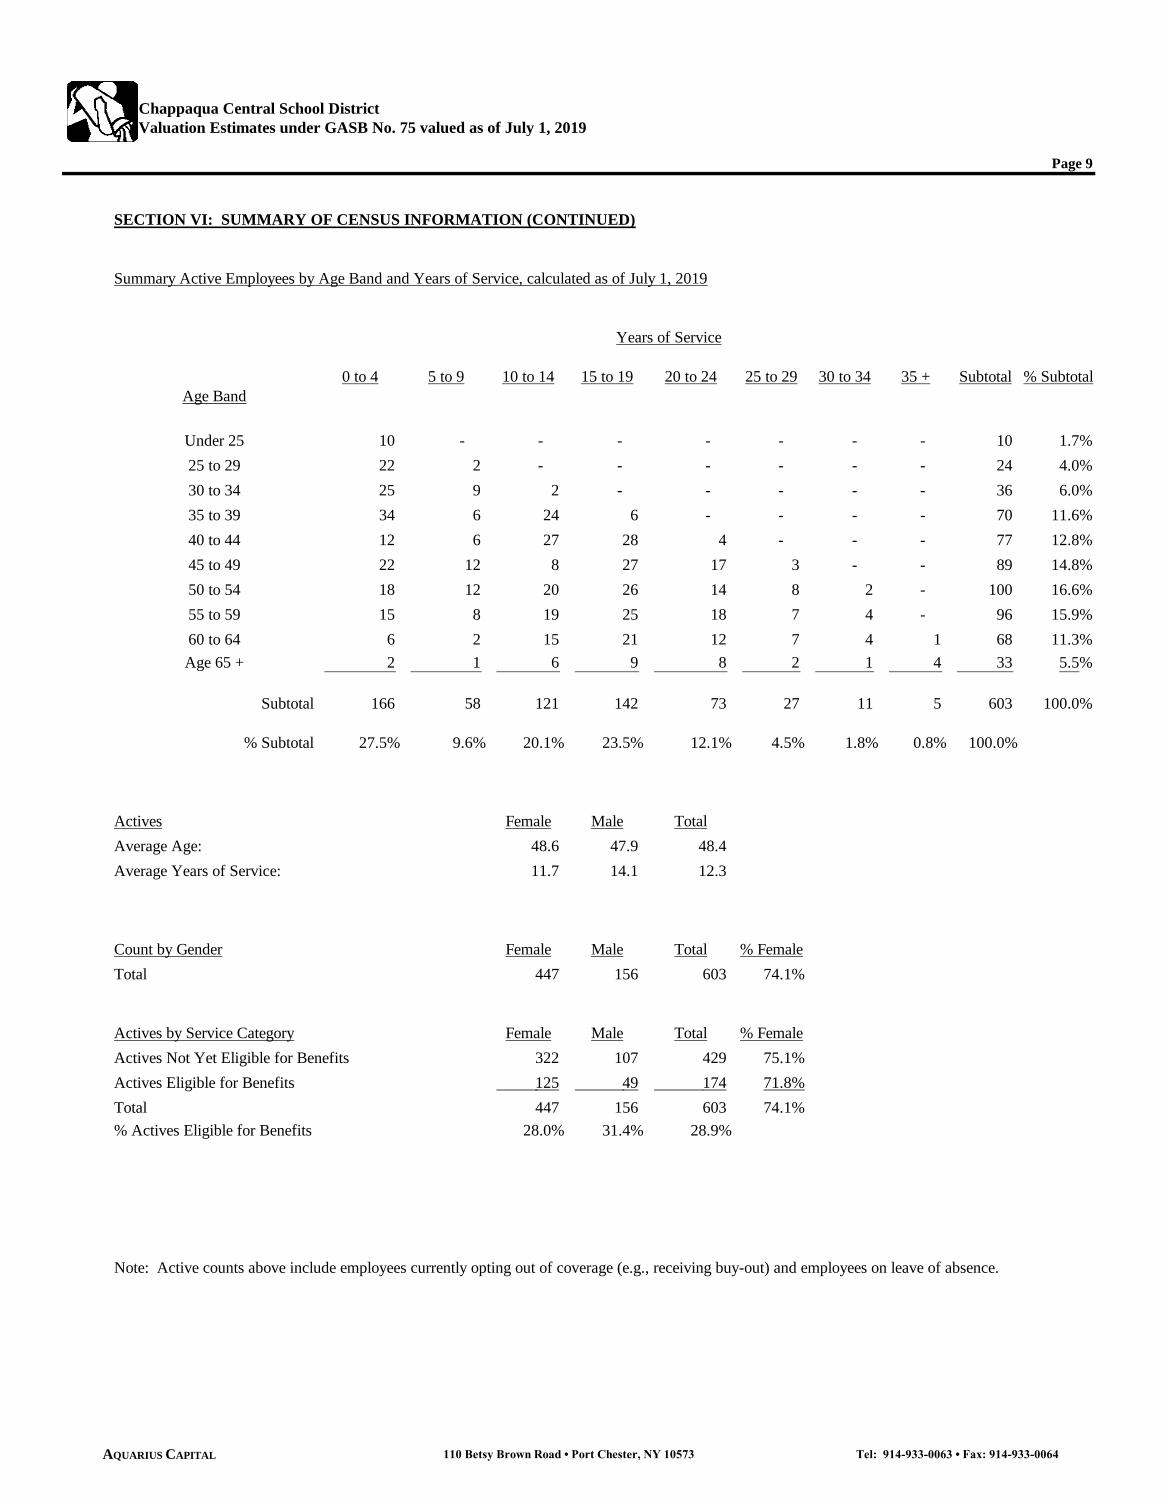
SECTION VI: SUMMARY OF CENSUS INFORMATION (CONTINUED)
Summary Active Employees by Age Band and Years of Service, calculated as of July 1, 2019
0 to 4 5 to 9 10 to 14 15 to 19 20 to 24 25 to 29 30 to 34 35 + Subtotal % Subtotal
10 - - - - - - - 10 1.7%22 2 - - - - - - 24 4.0%25 9 2 - - - - - 36 6.0%34 6 24 6 - - - - 70 11.6%12 6 27 28 4 - - - 77 12.8%22 12 8 27 17 3 - - 89 14.8%18 12 20 26 14 8 2 - 100 16.6%15 8 19 25 18 7 4 - 96 15.9%6 2 15 21 12 7 4 1 68 11.3%2 1 6 9 8 2 1 4 33 5.5%
Subtotal 166 58 121 142 73 27 11 5 603 100.0%
% Subtotal 27.5% 9.6% 20.1% 23.5% 12.1% 4.5% 1.8% 0.8% 100.0%
Actives Female Male TotalAverage Age: 48.6 47.9 48.4Average Years of Service: 11.7 14.1 12.3
Count by Gender Female Male Total % FemaleTotal 447 156 603 74.1%
Actives by Service Category Female Male Total % FemaleActives Not Yet Eligible for Benefits 322 107 429 75.1%Actives Eligible for Benefits 125 49 174 71.8%Total 447 156 603 74.1%% Actives Eligible for Benefits 28.0% 31.4% 28.9%
Note: Active counts above include employees currently opting out of coverage (e.g., receiving buy-out) and employees on leave of absence.
30 to 34
60 to 64Age 65 +
35 to 3940 to 4445 to 4950 to 5455 to 59
Years of Service
Age Band
Under 2525 to 29
110 Betsy Brown Road • Port Chester, NY 10573 Tel: 914-933-0063 • Fax: 914-933-0064AQUARIUS CAPITAL
Chappaqua Central School District
Valuation Estimates under GASB No. 75 valued as of July 1, 2019
Page 10
SECTION VI: SUMMARY OF CENSUS INFORMATION (CONTINUED)
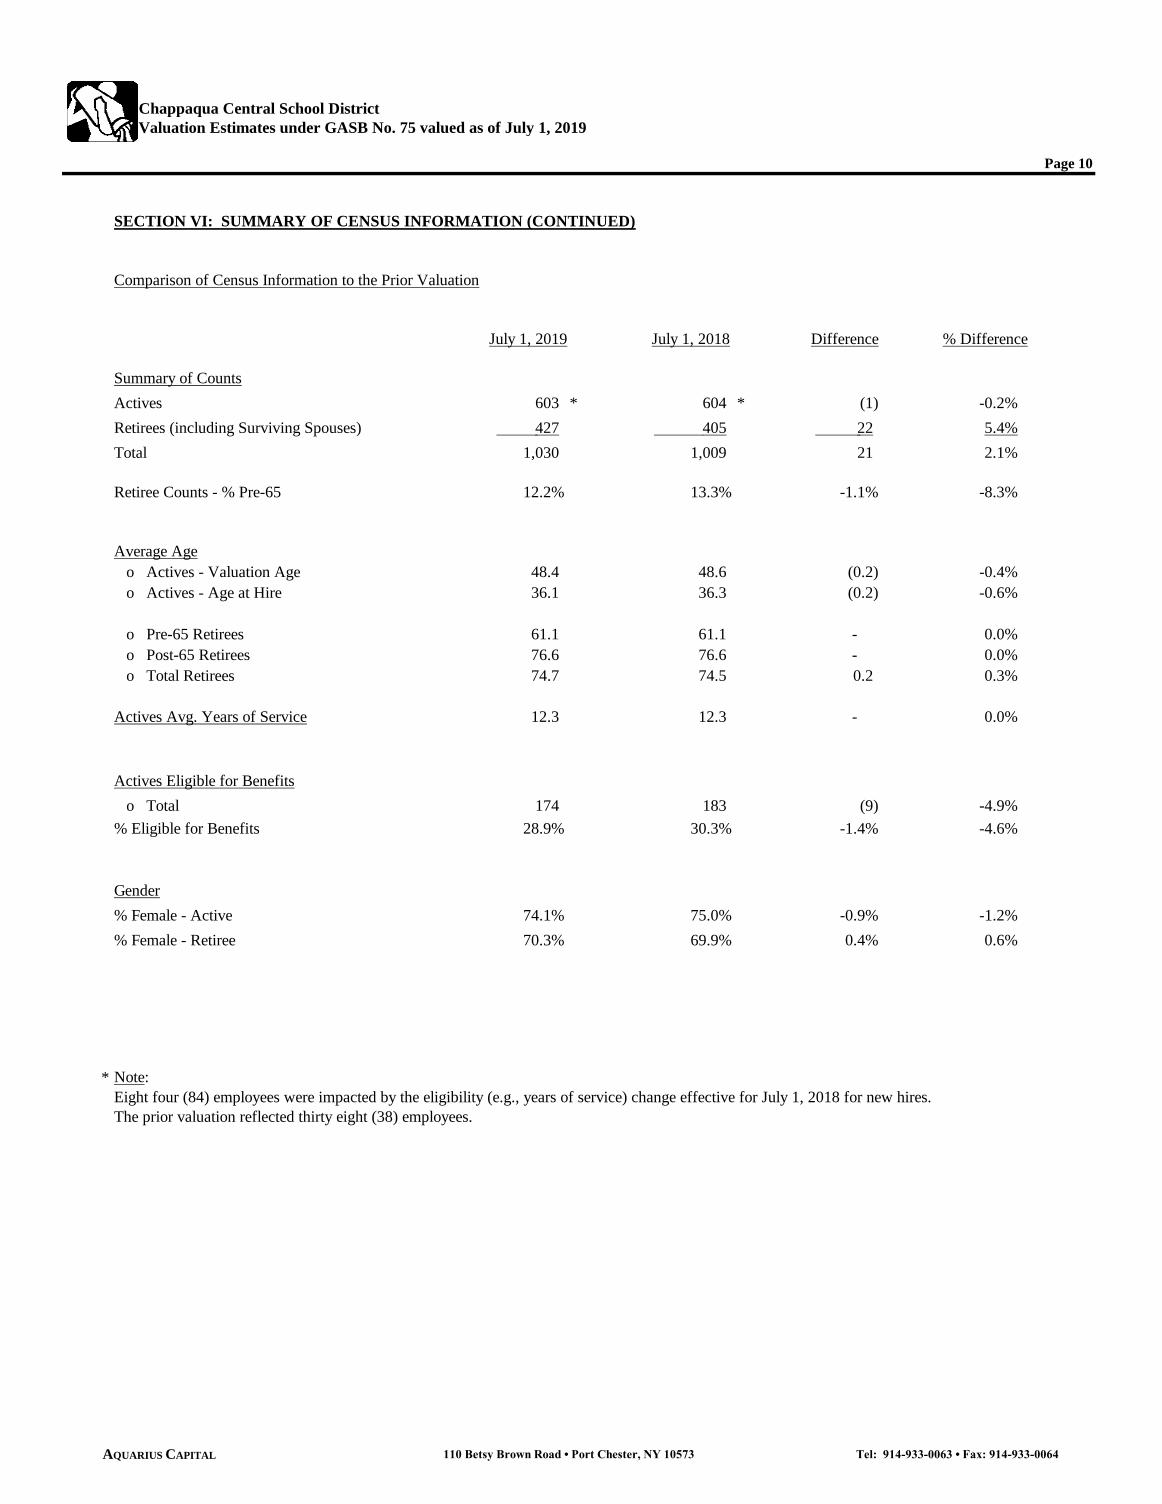
Comparison of Census Information to the Prior Valuation
July 1, 2019 July 1, 2018 Difference % Difference
Summary of CountsActives 603 * 604 * (1) -0.2%Retirees (including Surviving Spouses) 427 405 22 5.4%Total 1,030 1,009 21 2.1%
Retiree Counts - % Pre-65 12.2% 13.3% -1.1% -8.3%
Average Age o Actives - Valuation Age 48.4 48.6 (0.2) -0.4% o Actives - Age at Hire 36.1 36.3 (0.2) -0.6%
o Pre-65 Retirees 61.1 61.1 - 0.0% o Post-65 Retirees 76.6 76.6 - 0.0% o Total Retirees 74.7 74.5 0.2 0.3%
Actives Avg. Years of Service 12.3 12.3 - 0.0%
Actives Eligible for Benefits o Total 174 183 (9) -4.9%% Eligible for Benefits 28.9% 30.3% -1.4% -4.6%
Gender% Female - Active 74.1% 75.0% -0.9% -1.2%% Female - Retiree 70.3% 69.9% 0.4% 0.6%
* Note:Eight four (84) employees were impacted by the eligibility (e.g., years of service) change effective for July 1, 2018 for new hires.The prior valuation reflected thirty eight (38) employees.
110 Betsy Brown Road • Port Chester, NY 10573 Tel: 914-933-0063 • Fax: 914-933-0064AQUARIUS CAPITAL
Chappaqua Central School District
Valuation Estimates under GASB No. 75 valued as of July 1, 2019
Page 11
SECTION VII: SUMMARY OF ASSUMPTIONS
Municipality Chappaqua Central School District ("District")
Valuation Date July 1, 2019
Initial Implementation Year Implementation Year for GASB 74/75 is July 1, 2017 to June 30, 2018 for GASB No. 74/75 The impact to financial statements as a result of these new GASB Statements include, but are not limited to, the amount of the
OPEB liability to be reported on the financial statements, the selected actuarial cost method, discount rate used, and disclosuresin the audited financial statements. Details are described throughout the report.
Purpose of Work This report is provided to your organization for the purpose of calculation results under GASB No. 74/75. Information in thisreport may not be appropriate to use for other purposes. Aquarius does not intend to benefit from the overall results of thereport and we assume no duty, liability or obligation to parties that use this work for reasons other than its intention, i.e.,reporting of GASB No. 74/75 for financial statements. Pages 1-3 reflect results under GASB No. 74/75. Our organization wasthe consulting actuary for the prior year valuation. GASB 75 replaced GASB 45 for fiscal year July 1, 2017 to June 30, 2018.
Discount Rate 2.6%The selected discount rate is based on the prescribed discount interest rate methodology under GASB No. 74/75 based on anaverage of three 20-year bond indices (e.g., Bond Buyer-20 Bond GO at 2.27%, S&P Municipal Bond 20 Year High Grade Rate Index at 2.94%, Fidelity GA AA 20 Years at 2.48%) as of March 31, 2020 with the average rate rounded to the nearest 0.1%. The discount rate for the prior valuation was 3.5%.
Assets Not valued since benefit is unfunded. Assets are zero.
Expected Return on Assets n/a
Information for Valuation All information was provided by your organization.
Retirement Assumptions Valuation of active and retired population.
Retirement Benefits Coverage for pre-65 and post-65 retirement benefits. This valuation is provided to a single employer plan.
Covered Benefits Coverage for medical only including prescription drug coverage as part of medical plan. Certain retirees are eligible for lifeinsurance and receive on a non-contributory basis. Subsidized dental and vision coverage are not provided in retirement withdental and vision solely provided on a retiree pay-all-basis with no implicit or explicit subsidy assumed for these ancillary coverages.For detailed and accurate description of benefits, we recommend that you review the District's plan documents for determiningbenefits, eligibility, etc. Summaries in this report are illustrative and solely to assist the reviewer to understand the types of benefits that were valued and reflected in this report. These summaries should not be used for any other purposes.
Insurance Coverage and Funding Medical, including prescription drugs, is fully insured through Putnam Northern Westchester Health Benefits Consortium Basis ("Consortium") and Empire Blue Cross/Blue Shield. The Empire plan was a new plan effective July 1, 2013, replacing the
medical plan with Emblem Health. The Empire plan was cancelled effective July 1, 2016, so all employees are valued onthe Consortium plan only with no other assumed medical plan options available to them. The District is one of fourteen (14)participating schools districts, including Putnam Northern Westchester BOCES, to participate in the Consortium health plan.The life insurance benefit is provided on a fully insured basis with Mutual of Omaha.
Actuarial Cost Method Entry Age Normal as a Level Percentage of Payroll
Health Care Cost Trend Assumption The following assumptions are used for annual healthcare cost inflation (trend):
Year Pre-65 Post 65Year 1 Trend July 1, 2021 7.0% 7.0%Ultimate Trend July 1, 2027 & Later 4.0% 4.0%Grading Per Year 0.5% 0.5%
Starting Claim Cost Base plan costs for medical are based on premium rates for plan year July 1, 2019 to June 30, 2020 for year 1 and plan yearJuly 1, 2020 to June 30, 2021 for Year 2. Both plan years were reflected in the valuation since known premium cost to the District.Medical insured monthly premiums for pre-65 and post-65 retirees for the Consortium are illustrated on page 16 of the report.These costs are based on 100% before retiree contributions and are assumed to include all administrative expenses and therequired PPACA fees due at this time. Plan costs for July 1, 2021 and beyond are trended forward using the trend ratesillustrated under the "Health Care Cost Trend Assumptions" section above.
Projected Benefit Costs While the plans within the Consortium are assumed to be community rated, Actuarial Standards of Practice No. 6 requires ageadjusted costs be measured by estimating the expected costs by age whether or not a pooling or community rating applies.The underlying costs for the Consortium reflect an average age of actives and pre-65 retirees of age 49 and an average age forretirees post-65 of age 76 for purposes of developing aging for the valuation. The prior valuation under GASB 75 reflected anassumption for aging.
Implicit Subsidy This reflects the difference between the premium rate or cost charged to a retiree for a particular benefit as compared to theestimated rate of cost to the retiree, if those benefits were calculated reflecting retirees as a separate group (rather than their costsbundled with the active population). The results in this valuation reflect an implicit subsidy in the cost projections.
110 Betsy Brown Road • Port Chester, NY 10573 Tel: 914-933-0063 • Fax: 914-933-0064AQUARIUS CAPITAL

Chappaqua Central School District
Valuation Estimates under GASB No. 75 valued as of July 1, 2019
Page 12
SECTION VII: SUMMARY OF ASSUMPTIONS (CONTINUED)
Medicare Part B Reimbursements Valuation reflects the reimbursement of Medicare Part B premium to retirees, spouses and surviving spouses over age 65 thatare eligible for the benefit. Employee will pay Medicare Part B premium and be reimbursed by District. The District does notreimburse for the Income Related Monthly Adjustment Amount (IRMAA) amount. The District confirmed this valuation thatIRMAA was not a reimburseable benefit, consistent with the prior valuation.
Medicare Part D The District does not reimburse for Medicare Part D premium.
Life Insurance A small number of retirees are eligible for a non-contributory (District-pay-all) life insurance benefit and costs are reflected inthe report. This group reported eight (8) retirees receiving benefits and rates were reflected for these individuals as reported.Retiree life insurance coverage is provided on a fully insured basis through Mutual of Omaha.
Healthcare Reform Impact The Patient Protection and Affordable Care Act (PPACA) enacted in March 2010 (Healthcare Reform) includes several feesand/or taxes levied on employer groups either directly (e.g., self-funded employer groups which calculates and pays the feesdirectly) or indirectly (e.g., fully insured employer groups in which the health insurer pays and passes on to the group in theirpremium rates.) The fees included in this valuation are 1) Comparative Effectiveness Research fee (aka PCORI), 2) HealthInsurance Industry fee, and 3) High Cost Plans Excise Tax ("Cadillac tax"). The Reinsurance Assessment, also initiated withthe passing of the PPACA, was a short-term fee levied on fully insured and self-funded employer groups between 2014 - 2016.
The Comparative Effectiveness Research fee runs through 2029 and is tax deductible. The initial fee was $1 per participant peryear increasing to $2 in the next year. Subsequent years are increased based on medical inflation. The fee applies to post-65retirees where Medicare is the primary payer. Initially, this fee was to expire in 2019, however, recent legislation signed into lawby President Trump on December 20, 2019 HR 1865 "Further Consolidated Appropriations Act, 2020" extended the fee 10 years.
The Health Insurance Industry fee is based on targeted fixed fees to be paid by the health insurance industry and is not taxdeductible. The total fee amount to be paid by health insurers starts at $8 billion in 2014 and increases to $14.3 billion in 2018.After 2018, the fee increases annually based on premium growth. The fee was suspended for the 2017 plan year and resumedin 2018 with the estimated fee to be approximately 3.0% to 4.0% of premium. The fee applies to fully insured plans includingMedicare Advantage plans and excludes self-funded employer sponsored group health plans. Effective with legislation passedon January 22, 2018, this fee was suspended again for the 2019 plan year but will resume in 2020.
The High Cost Plans Excise tax included a 40% tax ("Cadillac tax") on high cost plans to be levied on insurers and third partyadministrators (TPA) beginning in 2022 and was to be tax deductible. The calculation was to be done separately for single andfamily coverage and was equal to 40% of the excess of per employee plan costs, net of patient cost sharing, over the 2022 statedcost limits of:
o - $10,200 single / $27,500 family o - $11,850 single / $30,950 family for retirees age 55-64
This valuation excludes the Cadillac tax in its entirety based on recent legislation signed into law by President Trump on 12/20/19,HR 1865 "Further Consolidated Appropriations Act, 2020" repealing the "Cadillac Tax".
Plan Design Changes Valuation assumes no changes in future plan designs (e.g., deductibles, coinsurance, etc.) from current benefits offered for thecurrent plan year. It is assumed that the current level of benefits will remain, with no modifications to avoid the potential excisetax imposed by the Patient Protection and Affordable Care Act (PPACA) described in detail above.
% Future Retirees Opting Out It is assumed that 100% participation for those covered as actives. All eligible active and retiree employee records provided by theDistrict were valued.
Census Information Participant data was provided by your organization in April 2020. We relied on information as being accurate and we have notconducted any data audits.
New Hires This valuation is based on a closed group and does not reflect the impact of future new entrants (e.g., new hires after date of datacollection, i.e., April 2020) into the plan.
Retirement System Valuation is based on the most recent New York State Employees' Retirement System (ERS), and the New York State Teachers'Retirement System (TRS). ERS and TRS tables were based on version released in 2015.
Retirement Eligibility Assumptions Eligibility for early retirement is based on meeting a criteria of minimum age and/or years of service (YOS) requirements. Allemployees are assumed to be eligible upon reaching age fifty-five (55) and completing five (5) YOS, which is based on the currentcontracts as provided by your organization. For CCT, COSA, Teaching Assistants, and RN/PT, the retirement eligibility increasesto fifteen (15) YOS for dates of hire after July 1, 2018 while CSEA increases to ten (10) YOS. The Administration group remainsunchanged at five (5) YOS as of July 1, 2018 and is assumed to continue until the next bargaining period for valuation purposes.Eight four (84) employees were impacted by the eligibility (e.g., years of service) change effective for July 1, 2018 for new hires.
110 Betsy Brown Road • Port Chester, NY 10573 Tel: 914-933-0063 • Fax: 914-933-0064AQUARIUS CAPITAL
Chappaqua Central School District
Valuation Estimates under GASB No. 75 valued as of July 1, 2019
Page 13
SECTION VII: SUMMARY OF ASSUMPTIONS (CONTINUED)
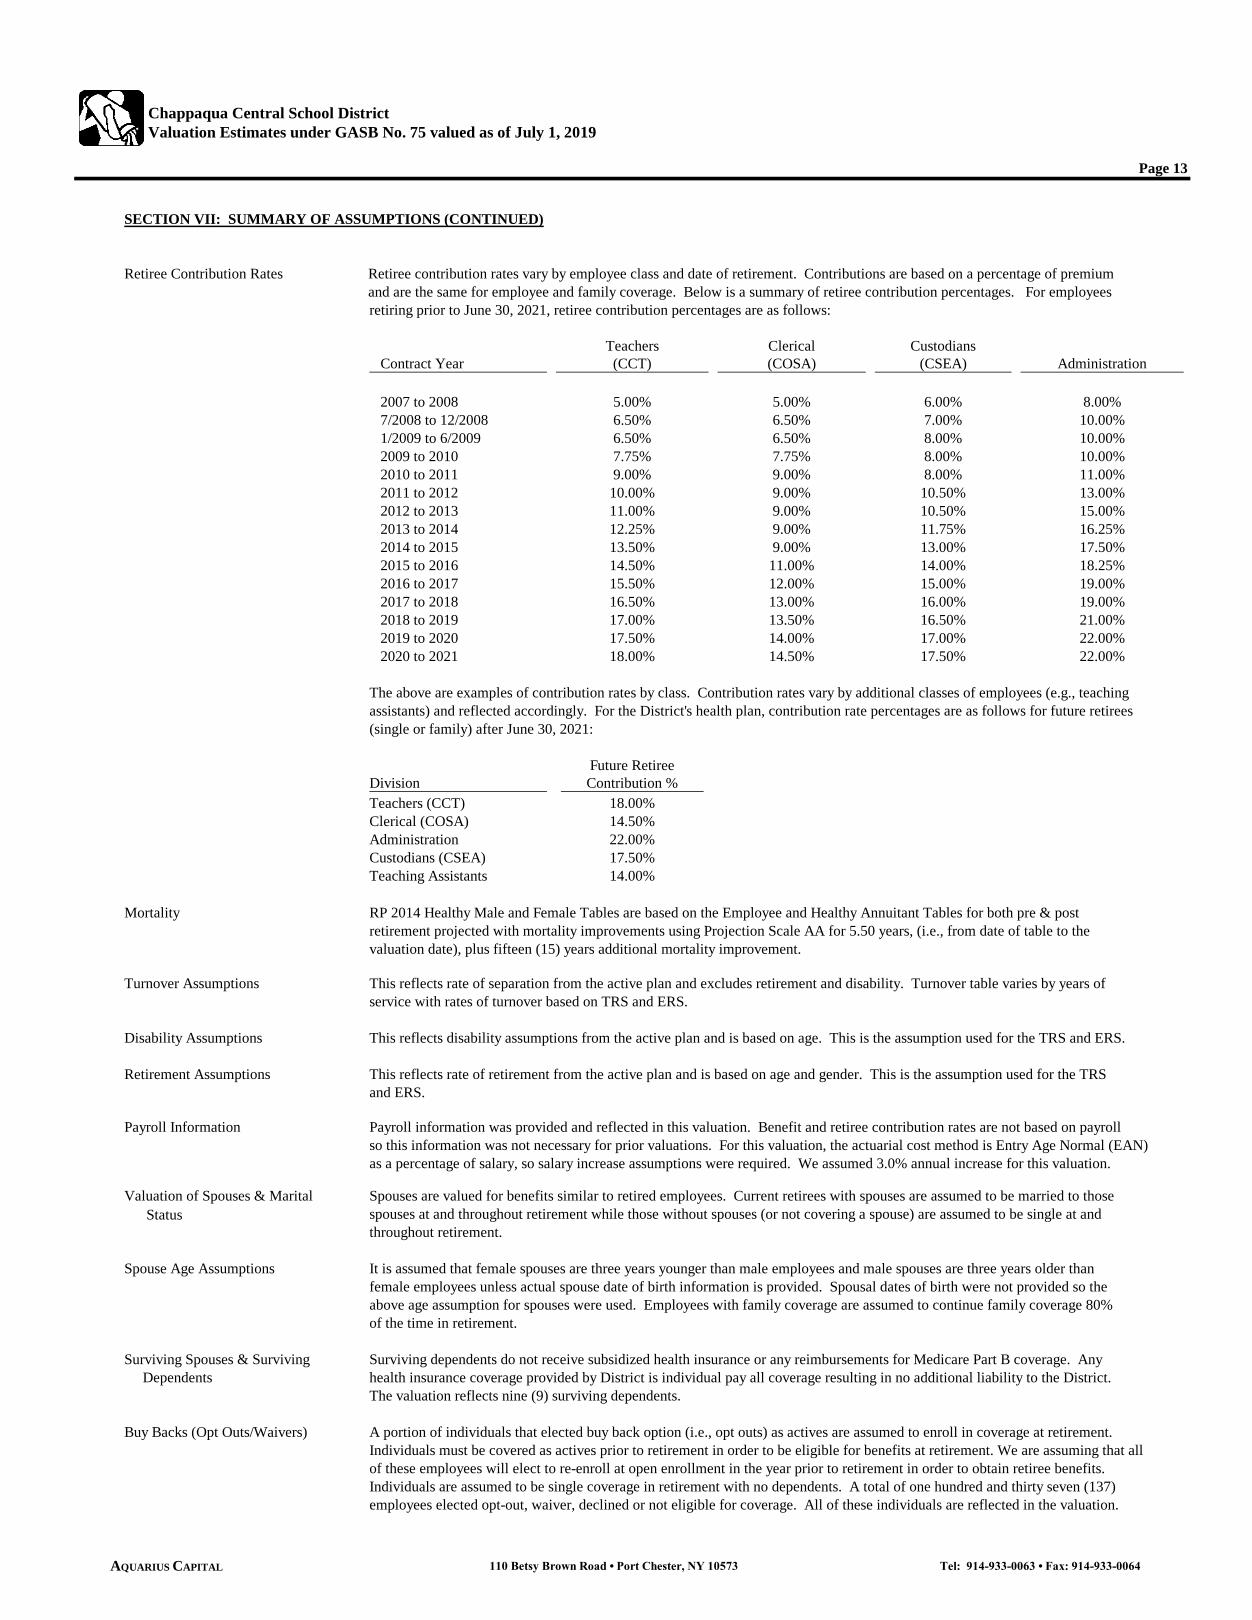
Retiree Contribution Rates Retiree contribution rates vary by employee class and date of retirement. Contributions are based on a percentage of premium and are the same for employee and family coverage. Below is a summary of retiree contribution percentages. For employeesretiring prior to June 30, 2021, retiree contribution percentages are as follows:
Teachers Clerical Custodians Contract Year (CCT) (COSA) (CSEA) Administration
2007 to 2008 5.00% 5.00% 6.00% 8.00% 7/2008 to 12/2008 6.50% 6.50% 7.00% 10.00% 1/2009 to 6/2009 6.50% 6.50% 8.00% 10.00% 2009 to 2010 7.75% 7.75% 8.00% 10.00% 2010 to 2011 9.00% 9.00% 8.00% 11.00% 2011 to 2012 10.00% 9.00% 10.50% 13.00% 2012 to 2013 11.00% 9.00% 10.50% 15.00% 2013 to 2014 12.25% 9.00% 11.75% 16.25% 2014 to 2015 13.50% 9.00% 13.00% 17.50% 2015 to 2016 14.50% 11.00% 14.00% 18.25% 2016 to 2017 15.50% 12.00% 15.00% 19.00% 2017 to 2018 16.50% 13.00% 16.00% 19.00% 2018 to 2019 17.00% 13.50% 16.50% 21.00% 2019 to 2020 17.50% 14.00% 17.00% 22.00% 2020 to 2021 18.00% 14.50% 17.50% 22.00%
The above are examples of contribution rates by class. Contribution rates vary by additional classes of employees (e.g., teaching assistants) and reflected accordingly. For the District's health plan, contribution rate percentages are as follows for future retirees (single or family) after June 30, 2021:
Future RetireeDivision Contribution %Teachers (CCT) 18.00%Clerical (COSA) 14.50%Administration 22.00%Custodians (CSEA) 17.50%Teaching Assistants 14.00%
Mortality RP 2014 Healthy Male and Female Tables are based on the Employee and Healthy Annuitant Tables for both pre & postretirement projected with mortality improvements using Projection Scale AA for 5.50 years, (i.e., from date of table to thevaluation date), plus fifteen (15) years additional mortality improvement.
Turnover Assumptions This reflects rate of separation from the active plan and excludes retirement and disability. Turnover table varies by years ofservice with rates of turnover based on TRS and ERS.
Disability Assumptions This reflects disability assumptions from the active plan and is based on age. This is the assumption used for the TRS and ERS.
Retirement Assumptions This reflects rate of retirement from the active plan and is based on age and gender. This is the assumption used for the TRSand ERS.
Payroll Information Payroll information was provided and reflected in this valuation. Benefit and retiree contribution rates are not based on payrollso this information was not necessary for prior valuations. For this valuation, the actuarial cost method is Entry Age Normal (EAN)as a percentage of salary, so salary increase assumptions were required. We assumed 3.0% annual increase for this valuation.
Valuation of Spouses & Marital Spouses are valued for benefits similar to retired employees. Current retirees with spouses are assumed to be married to those Status spouses at and throughout retirement while those without spouses (or not covering a spouse) are assumed to be single at and
throughout retirement.
Spouse Age Assumptions It is assumed that female spouses are three years younger than male employees and male spouses are three years older thanfemale employees unless actual spouse date of birth information is provided. Spousal dates of birth were not provided so theabove age assumption for spouses were used. Employees with family coverage are assumed to continue family coverage 80%of the time in retirement.
Surviving Spouses & Surviving Surviving dependents do not receive subsidized health insurance or any reimbursements for Medicare Part B coverage. Any Dependents health insurance coverage provided by District is individual pay all coverage resulting in no additional liability to the District.
The valuation reflects nine (9) surviving dependents.
Buy Backs (Opt Outs/Waivers) A portion of individuals that elected buy back option (i.e., opt outs) as actives are assumed to enroll in coverage at retirement.Individuals must be covered as actives prior to retirement in order to be eligible for benefits at retirement. We are assuming that allof these employees will elect to re-enroll at open enrollment in the year prior to retirement in order to obtain retiree benefits. Individuals are assumed to be single coverage in retirement with no dependents. A total of one hundred and thirty seven (137)employees elected opt-out, waiver, declined or not eligible for coverage. All of these individuals are reflected in the valuation.
110 Betsy Brown Road • Port Chester, NY 10573 Tel: 914-933-0063 • Fax: 914-933-0064AQUARIUS CAPITAL
Chappaqua Central School District
Valuation Estimates under GASB No. 75 valued as of July 1, 2019
Page 14
SECTION VII: SUMMARY OF ASSUMPTIONS (CONTINUED)
Vested Terminations There were no individuals listed as vested terminated.
COBRA & Terminated Participants One (1) individual employees was listed as COBRA and reflected in the valuation. No other individuals were listed as non-vestedtermination.
Leave of Absence One (1) employee is listed as leave of absence and is assumed to return to work. This individual is reflected as an active employee.
Missing Census Information
o Dates of Birth No employees were missing date of birth, so no special adjustments were needed. Employees with missing or incorrect dates ofbirth were matched to records from the prior valuation, so adjusted in the census file.
o Dates of Hire No active employees were missing date of hire, so no special adjustments were needed.
o Gender No individuals were missing gender, so no special adjustments were needed.
o Coverage Tier No enrolled employees were missing coverage tier, so no special adjustments were needed.
o Salary Individual salary was provided and used for the valuation. Nine (9) actives were missing salary, so these individuals were assumed to have the same average salary as other reported active employees for valuation purposes.
Special Adjustments No other special adjustments were provided since client data was complete for purposes of completing the valuation. All activeand retired employees provided were valued.
Medicare Tax Subsidy The Medicare tax subsidy is not reflected in valuation. There is no offset in premium rates charged to employer and post-65costs are illustrated gross of subsidy.
Eligible Population Population reflects all benefit eligible employees provided. Any new hires after date of data collection are not reflected herein.
Rounding of Results Results are illustrated to the nearest dollar. In using unrounded results (exact dollars), no implication is made as to the degreeof precision in those results. Clients and their auditors should apply their own judgement as to the desirability of roundingwhen transferring results from this valuation report to the client's financial statements.
Initial Year of Recognition of GASB We have not reviewed the audited financials of client so are not providing an opinion on when client should recognize and No. 43/45 & 74/75 comply with GASB 43/45 & 74/75. We rely on the opinion of your organization and auditor for this determination.
Employee Contracts & Collective Employee contracts and collective bargaining agreements specific to retiree benefits were reviewed for this valuation. Furthermore, Bargaining Agreements results were also based on information as provided by your organization. Contract information was available by contract year from
the District's website and includes contracts for the following groups: (1) Chappaqua Administrators Association; (2) ChappaquaCongress of Teachers, including Teachers and Teaching Assistants; Chappaqua Office Staff Association; (3) Civil Service Employees Association; and (4) Other Groups. The Other category includes contracts for Nurses, OT, PT, Athletic Trainer, LPN, andSuperintendents.
Plan Summaries A summary of benefits and eligibility are provided in this documentation for illustrative purposes in order to understand the typesof benefits reflected in the valuation. We recommend reviewing the District's plan document for details on eligibility and coveredbenefits. Information in this report should not be used instead of the District's plan document and/or summary plan description.
Other Comments Actuarial methods, considerations, and analyses used in forming this certification conform to the appropriate Standards ofPractice and guidelines of the Actuarial Standards Board (ASB).
110 Betsy Brown Road • Port Chester, NY 10573 Tel: 914-933-0063 • Fax: 914-933-0064AQUARIUS CAPITAL
Chappaqua Central School District
Valuation Estimates under GASB No. 75 valued as of July 1, 2019
Page 15
SECTION VIII: DEFINITIONS & GLOSSARY
Other Post Employment Benefits Medical, dental, vision, life and other health benefits provided to terminated or retired employees including their dependents (OPEB) and beneficiaries.
Actuarial Present Value of Future Present value of all benefits expected to be paid by the employer, net of expected retiree contributions, based on actuarial Benefits (PVFB) assumptions used in the valuation.
Accrued Liability (AL) This is the past service liability or present value of all benefits earned to date. Since retiree medical benefits are not accruedbased on a specific formula like a pension plan, the accounting standard requires the benefits to be earned ratably from dateof hire to date of full eligibility for benefits. For retirees and actives that are immediately eligible to retire and receive fullbenefits, the AL equals the PVFB. For actives not yet eligible to retire, it equals a pro-rata portion of the PVFB based onpast service to total service to retirement eligibility for that employee. This is consistent with the Total OPEB Liability underGASB 74 & 75 reporting.
Unfunded Accrued Liability (UAL) This is the excess of the AL over Plan Fiduciary Net Position (OPEB trust assets). This would also be referred to as the TotalNet OPEB Liability, reflecting the Total OPEB Liability less the Plan Fiduciary Net Position.
Actuarial Cost Method A procedure for allocating the Actuarial Present Value of Future Benefits (PVFB) to time periods, usually in the form ofNormal Cost and an Accrued Liability (AL). This actuarial cost method is prescribed under GASB 74 & 75.
Service Cost (Normal Cost) The proportion of the PVFB of a plan's benefits and expenses which is allocated to a valuation year by the Actuarial CostMethod used in the valuation. This is the cost of OPEB attributed to the current year of service.
Pay-As-You-Go This is a method of financing a postretirement benefit plan under which the contributions to the plan are generally made atabout the same time and amount as benefits and expenses become due.
Plan Fiduciary Net Position The current market value of assets placed in an irrevocable OPEB trust.
Closed Group Valuation This means that it does not consider the Actuarial PVFB associated with future entrants.
Decrement Rates This includes mortality, turnover, disability and retirement rate assumptions. This is used to determine the likelihood ofan employee qualifying for OPEB and when benefits will commence. Mortality is also used to determine probability ofindividuals to live and continue to receive benefits.
Covered Payroll The payroll of the active employees that are provided OPEB benefits.
Discount Rate Assumption used for converting present value of future benefits less future contributions into today's dollar amounts.
Projected Unit Credit This is an actuarial cost method whereby the costs of benefits earned is funded each year and the value of the accruedliability reflects the benefits earned to date. This was the most common method used under GASB No. 45.
Individual Entry Age Normal This is an actuarial cost method whereby costs are determined as of the entry age of the employee until his/her exiting ofactive service. This allocation can be done on a level dollar or level percentage of pay. This method is prescribed underGASB No. 75 with the valuation done on a level percentage of pay.
Deferred Inflows/Outflows of This reflects amounts resulting from experience gains/losses that have not been recognized in the current OPEB expense Resources calculations, but will be potentially reflected in future years.
Plan Members The individuals covered by the terms of an OPEB plan. The plan membership generally includes employees in active service,terminated employees who have accumulated benefits but are not yet receiving them, and retired employees and beneficiariescurrently receiving benefits.
Substantive Plan The terms of the OPEB plan as understood by the employer and its plan members. The plan is assumed to be a single employerplan unless noted otherwise in the report.
Recognition Year for GASB No. The effective date for reporting GASB No. 74 is for fiscal years beginning after June 15, 2016. The effective date for 74 & 75 reporting GASB No. 75 is for fiscal years beginning after June 15, 2017. GASB No. 74 & 75 replaced GASB No 43 & 45.
Recognition Year for GASB No. 2007-08 Fiscal Year: This impacts public agencies with total annual revenue of $100 million or more must comply in the 43 & 45 fiscal year after December 15, 2006.
2008-09 Fiscal Year: This impacts public agencies with total annual revenue between $10 million and $100 million mustcomply in the fiscal year after December 15, 2007.
2009-10 Fiscal Year: This impacts public agencies with total annual revenue less than $10 million must comply in the fiscalyear after December 15, 2008.
110 Betsy Brown Road • Port Chester, NY 10573 Tel: 914-933-0063 • Fax: 914-933-0064AQUARIUS CAPITAL
Chappaqua Central School District
Valuation Estimates under GASB No. 75 valued as of July 1, 2019
Page 16
SECTION IX: SUMMARY OF PLAN COST ASSUMPTIONS
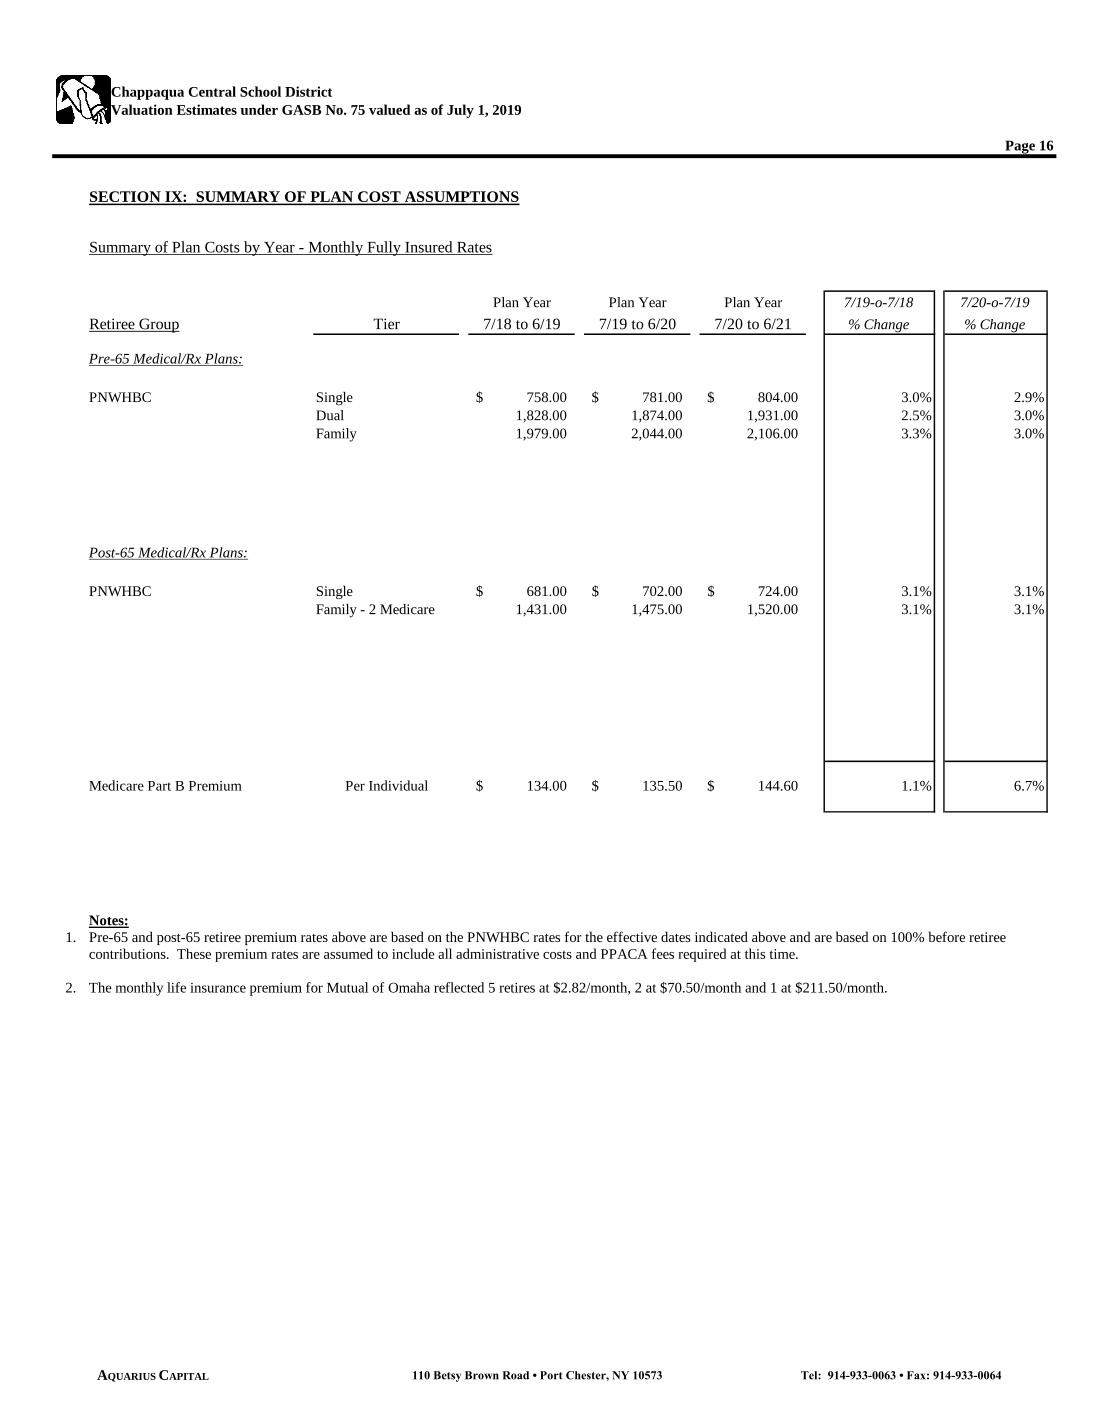
Summary of Plan Costs by Year - Monthly Fully Insured Rates
Plan Year Plan Year Plan Year 7/19-o-7/18 7/20-o-7/19
Retiree Group Tier 7/18 to 6/19 7/19 to 6/20 7/20 to 6/21 % Change % Change
Pre-65 Medical/Rx Plans:
PNWHBC Single 758.00$ 781.00$ 804.00$ 3.0% 2.9%Dual 1,828.00 1,874.00 1,931.00 2.5% 3.0%Family 1,979.00 2,044.00 2,106.00 3.3% 3.0%
Post-65 Medical/Rx Plans:
PNWHBC Single 681.00$ 702.00$ 724.00$ 3.1% 3.1%Family - 2 Medicare 1,431.00 1,475.00 1,520.00 3.1% 3.1%
Medicare Part B Premium Per Individual 134.00$ 135.50$ 144.60$ 1.1% 6.7%
Notes:
1. Pre-65 and post-65 retiree premium rates above are based on the PNWHBC rates for the effective dates indicated above and are based on 100% before retireecontributions. These premium rates are assumed to include all administrative costs and PPACA fees required at this time.
2. The monthly life insurance premium for Mutual of Omaha reflected 5 retires at $2.82/month, 2 at $70.50/month and 1 at $211.50/month.
110 Betsy Brown Road • Port Chester, NY 10573 Tel: 914-933-0063 • Fax: 914-933-0064AQUARIUS CAPITAL

Chappaqua Central School District
Valuation Estimates under GASB No. 75 valued as of July 1, 2019
Page 17
SECTION X: TWENTY (20) YEAR FORECAST OF PAY-AS-YOU-GO COSTS AND TOTAL OPEB LIABILITY FOR CURRENT POPULATION
ProjectedTotal OPEB Annual Pay-As-You-Go Total OPEBLiability at Service Annual Year over Year Annual Liability atBeginning Cost with Projected % Increase Interest End
Fiscal Year of Year Interest Pay-As-You-Go (Decrease) Cost of Year
1 Fiscal Year July 1, 2019 to June 30, 2020 220,642,325$ 2,824,382$ 4,737,600$ n/a 5,675,112$ 224,404,219$ 2 Fiscal Year July 1, 2020 to June 30, 2021 224,404,219 2,909,113 4,881,104 3.0% 5,771,055 228,203,283 3 Fiscal Year July 1, 2021 to June 30, 2022 228,203,283 2,996,386 5,141,740 5.3% 5,866,443 231,924,372 4 Fiscal Year July 1, 2022 to June 30, 2023 231,924,372 3,086,278 5,338,407 3.8% 5,960,634 235,632,877 5 Fiscal Year July 1, 2023 to June 30, 2024 235,632,877 3,178,866 5,591,714 4.7% 6,053,763 239,273,792 6 Fiscal Year July 1, 2024 to June 30, 2025 239,273,792 3,274,232 5,804,077 3.8% 6,145,666 242,889,613 7 Fiscal Year July 1, 2025 to June 30, 2026 242,889,613 3,372,459 6,027,086 3.8% 6,236,778 246,471,764 8 Fiscal Year July 1, 2026 to June 30, 2027 246,471,764 3,473,633 6,273,304 4.1% 6,326,713 249,998,806 9 Fiscal Year July 1, 2027 to June 30, 2028 249,998,806 3,577,842 6,378,899 1.7% 6,417,043 253,614,792
10 Fiscal Year July 1, 2028 to June 30, 2029 253,614,792 3,685,177 6,673,752 4.6% 6,507,226 257,133,443 11 Fiscal Year July 1, 2029 to June 30, 2030 257,133,443 3,795,732 6,909,447 3.5% 6,595,647 260,615,375 12 Fiscal Year July 1, 2030 to June 30, 2031 260,615,375 3,909,604 7,146,603 3.4% 6,683,094 264,061,470 13 Fiscal Year July 1, 2031 to June 30, 2032 264,061,470 4,026,892 7,476,128 4.6% 6,768,409 267,380,643 14 Fiscal Year July 1, 2032 to June 30, 2033 267,380,643 4,147,699 7,735,690 3.5% 6,851,333 270,643,985 15 Fiscal Year July 1, 2033 to June 30, 2034 270,643,985 4,272,130 8,200,002 6.0% 6,930,144 273,646,257 16 Fiscal Year July 1, 2034 to June 30, 2035 273,646,257 4,400,294 8,670,919 5.7% 7,002,081 276,377,713 17 Fiscal Year July 1, 2035 to June 30, 2036 276,377,713 4,532,303 9,063,950 4.5% 7,067,989 278,914,055 18 Fiscal Year July 1, 2036 to June 30, 2037 278,914,055 4,668,272 9,565,429 5.5% 7,127,415 281,144,313 19 Fiscal Year July 1, 2037 to June 30, 2038 281,144,313 4,808,320 9,965,880 4.2% 7,180,196 283,166,949 20 Fiscal Year July 1, 2038 to June 30, 2039 283,166,949 4,952,570 10,234,376 2.7% 7,229,294 285,114,437
21 Subtotal - Projected Pay-As-You-Go for Twenty Years: (1) + … + (20) 141,816,107$
Notes:1. Projections are based on the current census population and valuation assumptions. Group is assumed to be closed group with no new hires solely for projection purposes.2. The above costs are net of retiree contribution rates.3. Service cost is assumed for illustrative purposes to increase based on the assumed salary increase assumption on a year-over-year basis.4. No plan design, contribution rate or eligibility changes are assumed other than illustrated in the Assumptions section (e.g., only known collective bargaining changes are reflected, etc.)5. Plan fiduciary net position (assets) is zero so not illustrated in the projects.
110 Betsy Brown Road • Port Chester, NY 10573 Tel: 914-933-0063 • Fax: 914-933-0064AQUARIUS CAPITAL
Chappaqua Central School District
Valuation Estimates under GASB No. 75 valued as of July 1, 2019
Page 18
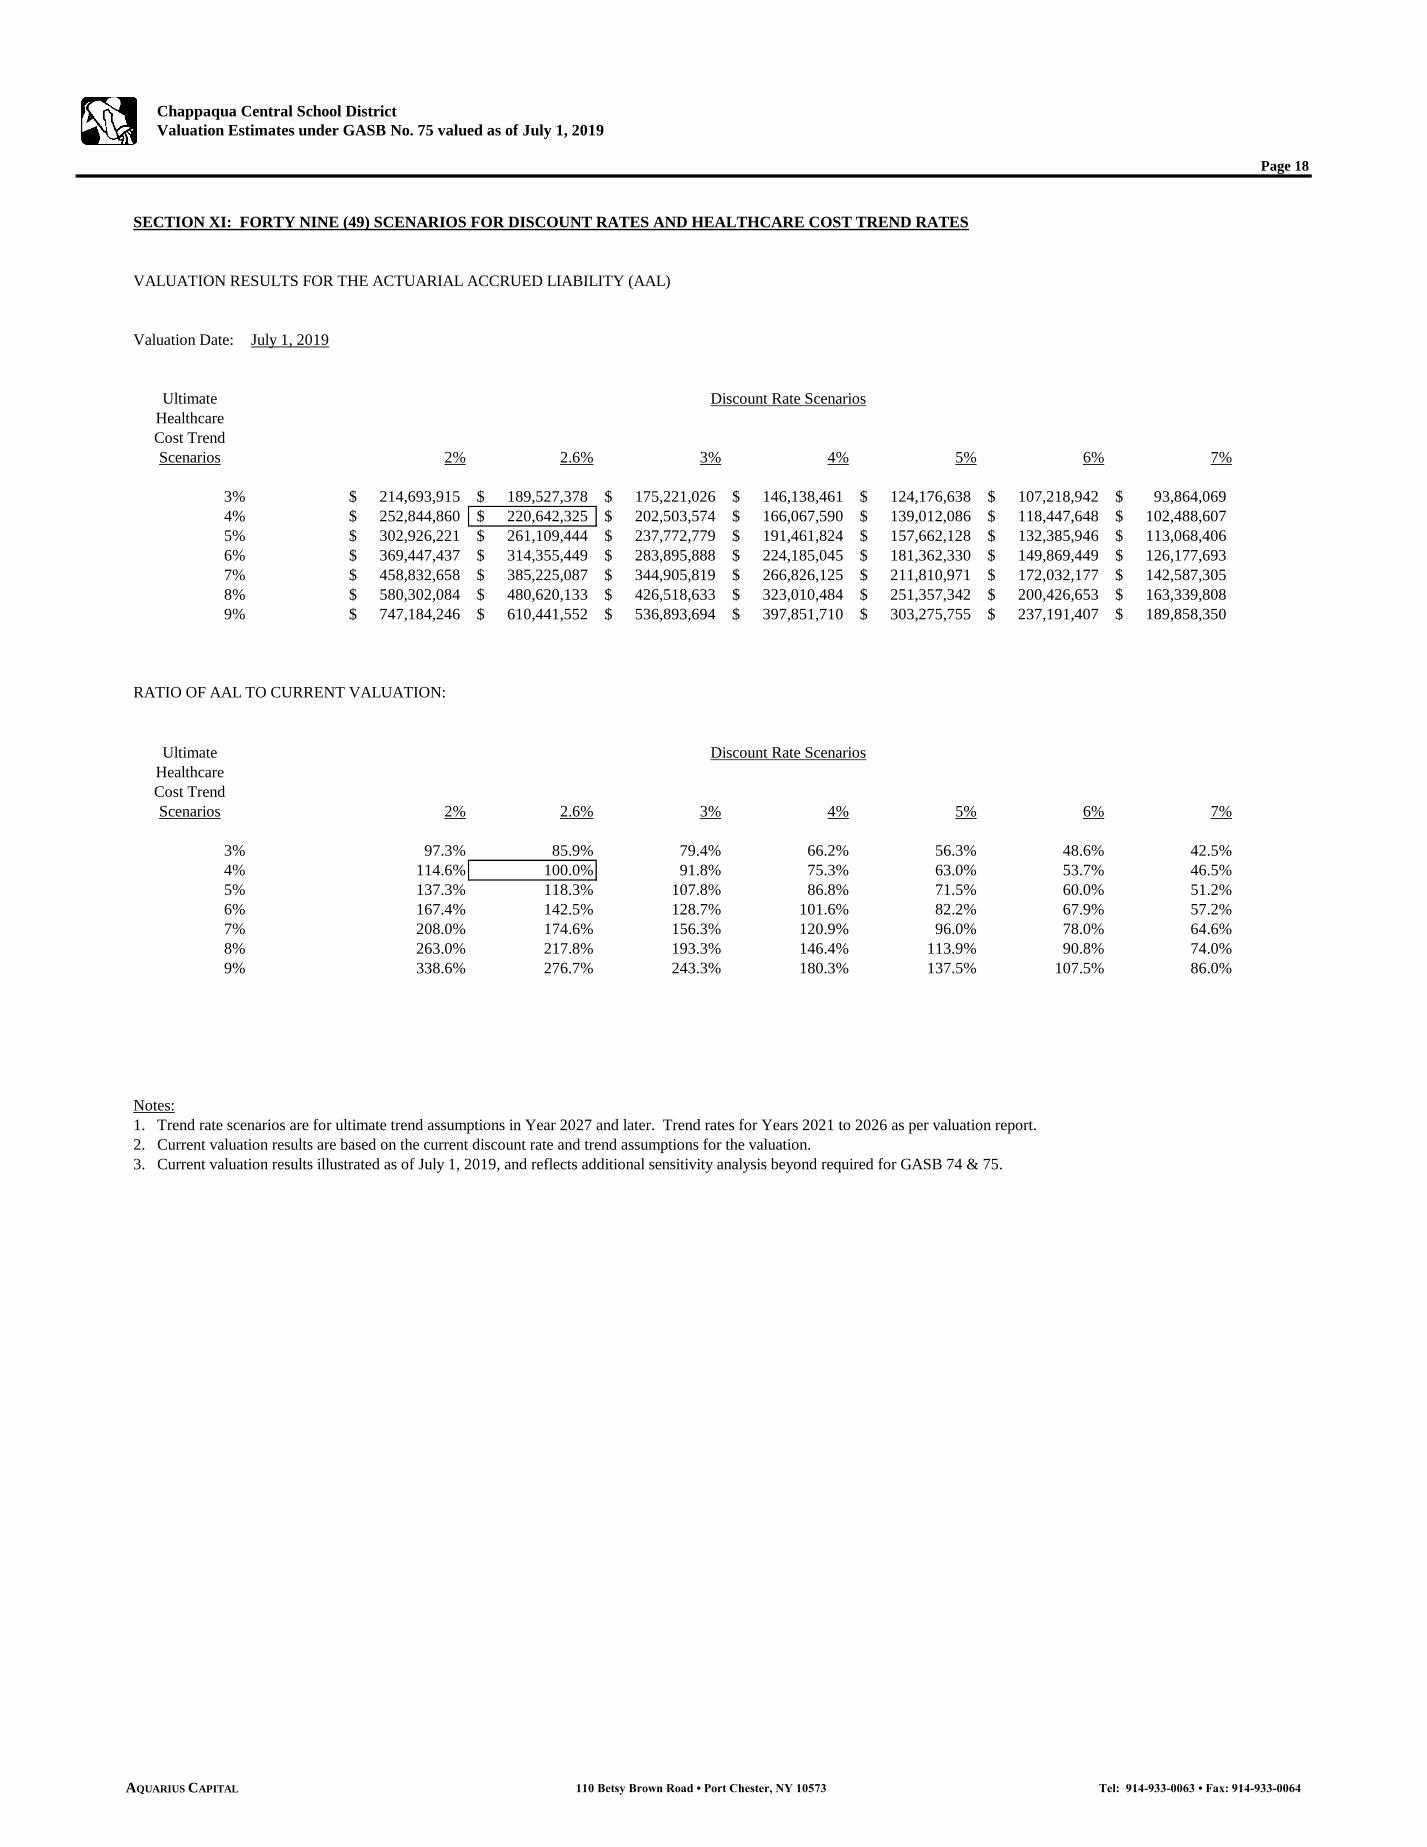
SECTION XI: FORTY NINE (49) SCENARIOS FOR DISCOUNT RATES AND HEALTHCARE COST TREND RATES
VALUATION RESULTS FOR THE ACTUARIAL ACCRUED LIABILITY (AAL)
Valuation Date: July 1, 2019
UltimateHealthcareCost TrendScenarios 2% 2.6% 3% 4% 5% 6% 7%
3% 214,693,915$ 189,527,378$ 175,221,026$ 146,138,461$ 124,176,638$ 107,218,942$ 93,864,069$ 4% 252,844,860$ 220,642,325$ 202,503,574$ 166,067,590$ 139,012,086$ 118,447,648$ 102,488,607$ 5% 302,926,221$ 261,109,444$ 237,772,779$ 191,461,824$ 157,662,128$ 132,385,946$ 113,068,406$ 6% 369,447,437$ 314,355,449$ 283,895,888$ 224,185,045$ 181,362,330$ 149,869,449$ 126,177,693$ 7% 458,832,658$ 385,225,087$ 344,905,819$ 266,826,125$ 211,810,971$ 172,032,177$ 142,587,305$ 8% 580,302,084$ 480,620,133$ 426,518,633$ 323,010,484$ 251,357,342$ 200,426,653$ 163,339,808$ 9% 747,184,246$ 610,441,552$ 536,893,694$ 397,851,710$ 303,275,755$ 237,191,407$ 189,858,350$
RATIO OF AAL TO CURRENT VALUATION:
UltimateHealthcareCost TrendScenarios 2% 2.6% 3% 4% 5% 6% 7%
3% 97.3% 85.9% 79.4% 66.2% 56.3% 48.6% 42.5%4% 114.6% 100.0% 91.8% 75.3% 63.0% 53.7% 46.5%5% 137.3% 118.3% 107.8% 86.8% 71.5% 60.0% 51.2%6% 167.4% 142.5% 128.7% 101.6% 82.2% 67.9% 57.2%7% 208.0% 174.6% 156.3% 120.9% 96.0% 78.0% 64.6%8% 263.0% 217.8% 193.3% 146.4% 113.9% 90.8% 74.0%9% 338.6% 276.7% 243.3% 180.3% 137.5% 107.5% 86.0%
Notes:1. Trend rate scenarios are for ultimate trend assumptions in Year 2027 and later. Trend rates for Years 2021 to 2026 as per valuation report.2. Current valuation results are based on the current discount rate and trend assumptions for the valuation.3. Current valuation results illustrated as of July 1, 2019, and reflects additional sensitivity analysis beyond required for GASB 74 & 75.
Discount Rate Scenarios
Discount Rate Scenarios
110 Betsy Brown Road • Port Chester, NY 10573 Tel: 914-933-0063 • Fax: 914-933-0064AQUARIUS CAPITAL
Chappaqua Central School District
Valuation Estimates under GASB No. 75 valued as of July 1, 2019
Page 19
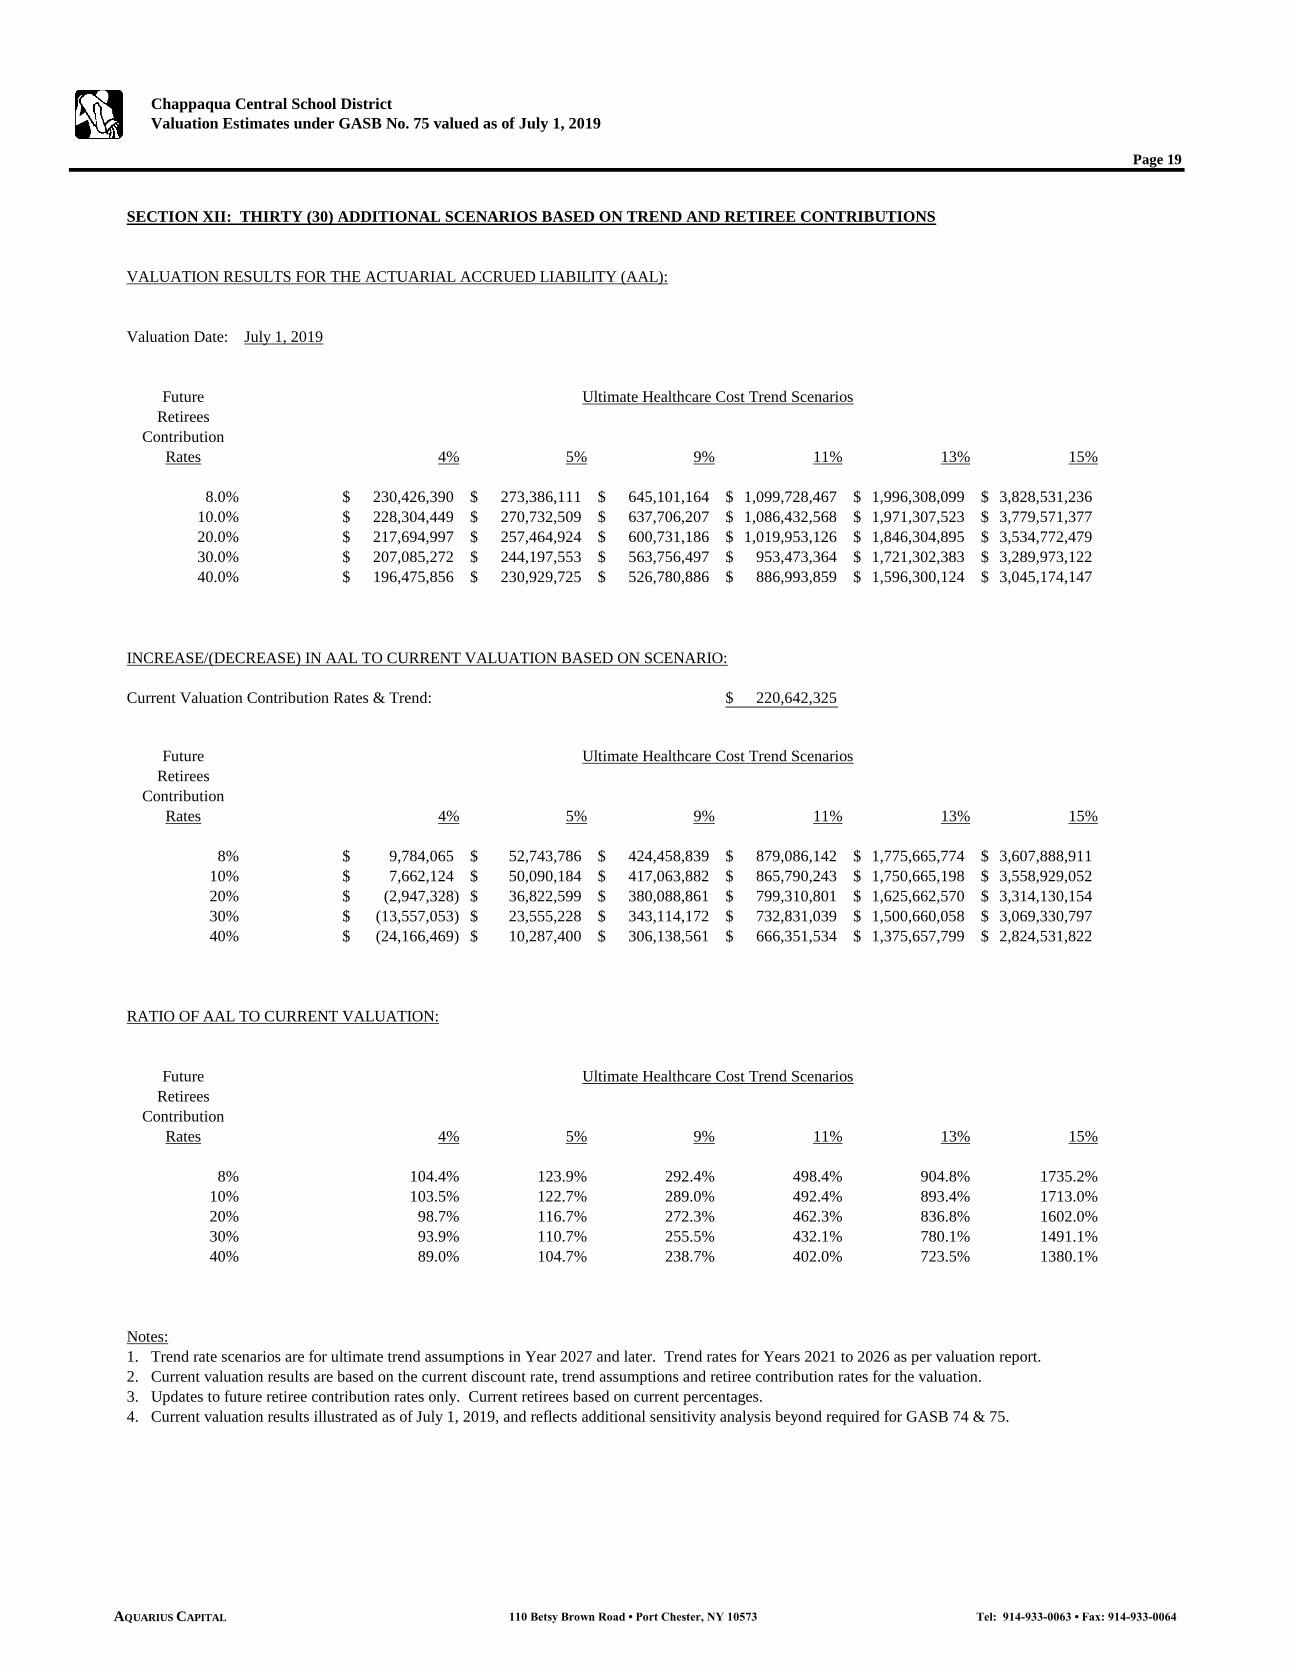
SECTION XII: THIRTY (30) ADDITIONAL SCENARIOS BASED ON TREND AND RETIREE CONTRIBUTIONS
VALUATION RESULTS FOR THE ACTUARIAL ACCRUED LIABILITY (AAL):
Valuation Date: July 1, 2019
FutureRetirees
ContributionRates 4% 5% 9% 11% 13% 15%
8.0% 230,426,390$ 273,386,111$ 645,101,164$ 1,099,728,467$ 1,996,308,099$ 3,828,531,236$ 10.0% 228,304,449$ 270,732,509$ 637,706,207$ 1,086,432,568$ 1,971,307,523$ 3,779,571,377$ 20.0% 217,694,997$ 257,464,924$ 600,731,186$ 1,019,953,126$ 1,846,304,895$ 3,534,772,479$ 30.0% 207,085,272$ 244,197,553$ 563,756,497$ 953,473,364$ 1,721,302,383$ 3,289,973,122$ 40.0% 196,475,856$ 230,929,725$ 526,780,886$ 886,993,859$ 1,596,300,124$ 3,045,174,147$
INCREASE/(DECREASE) IN AAL TO CURRENT VALUATION BASED ON SCENARIO:
Current Valuation Contribution Rates & Trend: 220,642,325$
FutureRetirees
ContributionRates 4% 5% 9% 11% 13% 15%
8% 9,784,065$ 52,743,786$ 424,458,839$ 879,086,142$ 1,775,665,774$ 3,607,888,911$ 10% 7,662,124$ 50,090,184$ 417,063,882$ 865,790,243$ 1,750,665,198$ 3,558,929,052$ 20% (2,947,328)$ 36,822,599$ 380,088,861$ 799,310,801$ 1,625,662,570$ 3,314,130,154$ 30% (13,557,053)$ 23,555,228$ 343,114,172$ 732,831,039$ 1,500,660,058$ 3,069,330,797$ 40% (24,166,469)$ 10,287,400$ 306,138,561$ 666,351,534$ 1,375,657,799$ 2,824,531,822$
RATIO OF AAL TO CURRENT VALUATION:
FutureRetirees
ContributionRates 4% 5% 9% 11% 13% 15%
8% 104.4% 123.9% 292.4% 498.4% 904.8% 1735.2%10% 103.5% 122.7% 289.0% 492.4% 893.4% 1713.0%20% 98.7% 116.7% 272.3% 462.3% 836.8% 1602.0%30% 93.9% 110.7% 255.5% 432.1% 780.1% 1491.1%40% 89.0% 104.7% 238.7% 402.0% 723.5% 1380.1%
Notes:1. Trend rate scenarios are for ultimate trend assumptions in Year 2027 and later. Trend rates for Years 2021 to 2026 as per valuation report.2. Current valuation results are based on the current discount rate, trend assumptions and retiree contribution rates for the valuation.3. Updates to future retiree contribution rates only. Current retirees based on current percentages.4. Current valuation results illustrated as of July 1, 2019, and reflects additional sensitivity analysis beyond required for GASB 74 & 75.
Ultimate Healthcare Cost Trend Scenarios
Ultimate Healthcare Cost Trend Scenarios
Ultimate Healthcare Cost Trend Scenarios
110 Betsy Brown Road • Port Chester, NY 10573 Tel: 914-933-0063 • Fax: 914-933-0064AQUARIUS CAPITAL