c560 corn production handbook - ksre bookstorephoto 17. european corn borer eggs. photo 18. fall...
TRANSCRIPT
CornProductionHandbook
Kansas State UniversityAgricultural Experiment Station
And Cooperative Extension Service
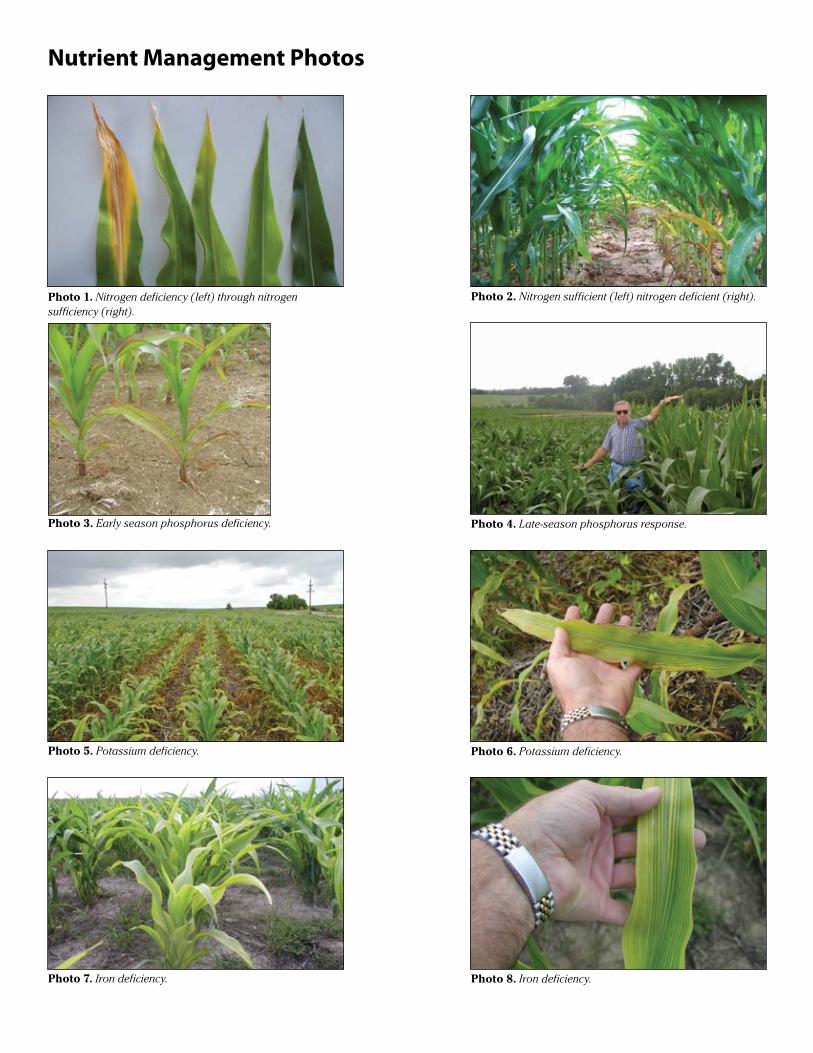
Nutrient Management Photos
Photo 1. Nitrogen deficiency (left) through nitrogen sufficiency (right).
Photo 2. Nitrogen sufficient (left) nitrogen deficient (right).
Photo 3. Early season phosphorus deficiency. Photo 4. Late-season phosphorus response.
Photo 5. Potassium deficiency. Photo 6. Potassium deficiency.
Photo 7. Iron deficiency. Photo 8. Iron deficiency.
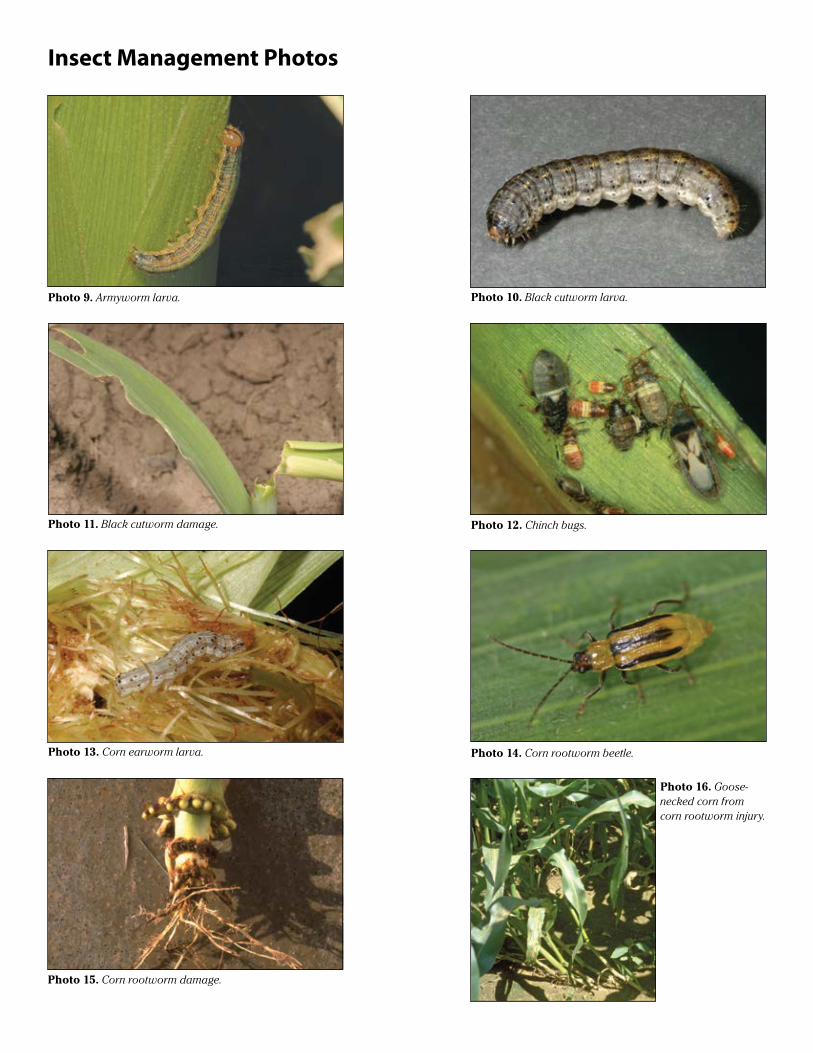
Insect Management Photos
Photo 9. Armyworm larva. Photo 10. Black cutworm larva.
Photo 11. Black cutworm damage. Photo 12. Chinch bugs.
Photo 13. Corn earworm larva.
Photo 15. Corn rootworm damage.
Photo 16. Goose-necked corn from corn rootworm injury.
Photo 14. Corn rootworm beetle.
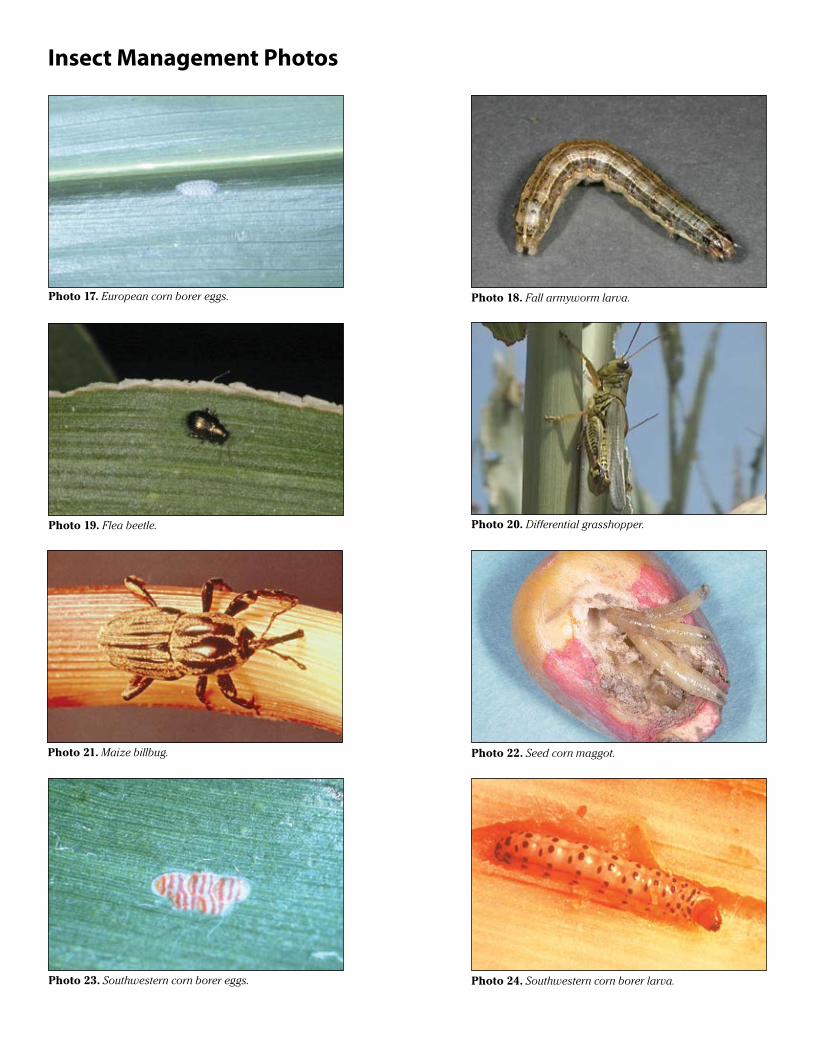
Photo 17. European corn borer eggs. Photo 18. Fall armyworm larva.
Photo 19. Flea beetle. Photo 20. Differential grasshopper.
Photo 21. Maize billbug. Photo 22. Seed corn maggot.
Photo 23. Southwestern corn borer eggs.
Insect Management Photos
Photo 24. Southwestern corn borer larva.
Growth and Development Stewart Duncan, Northeast Area Extension Agronomist, Crops and Soils Dale Fjell, Northeast Area Extension Director Richard Vanderlip, Research Agronomist, Crop Production (Emeritus) 3____________________________________________________________________________________________________________Select Hybrids Carefully Kraig Roozeboom, Extension Specialist, Crop Production/Cropping Systems Dale Fjell, Northeast Area Extension Director 7____________________________________________________________________________________________________________Optimum Planting Practices Kraig Roozeboom, Extension Specialist, Crop Production/Cropping Systems Dan Devlin, Extension Specialist, Environmental Quality Stewart Duncan, Northeast Area Extension Agronomist, Crops and Soils Keith Janssen, Research/Extension Specialist, Soil Management and Conservation Specialist Brian Olson, Northwest Area Extension Agronomist, Crops and Soils Curtis Thompson, Southwest Area Extension Agronomist, Crops and Soils 10____________________________________________________________________________________________________________Nutrient Management Dale Leikam, Extension Specialist, Nutrient Management David Mengel, Professor, Soil Fertility and Nutrient Management 14____________________________________________________________________________________________________________Weed Management David Regehr, Extension Specialist, Weed Science Brian Olson, Northwest Area Extension Agronomist, Crops and Soils Curtis Thompson, Southwest Area Extension Agronomist, Crops and Soils 21____________________________________________________________________________________________________________Insect Management Jeff Whitworth, Extension Specialist, Entomology Phillip Sloderbeck, Extension Specialist, Entomology 23____________________________________________________________________________________________________________Major Corn Diseases Doug Jardine, Extension Specialist, Plant Pathology 25____________________________________________________________________________________________________________Irrigation Danny Rogers, Extension Specialist, Irrigation 30____________________________________________________________________________________________________________Harvesting Suggestions Randy Price, Extension Specialist, Farm Machinery 36____________________________________________________________________________________________________________Drying and Storing Joe Harner, Extension Specialist, Grain and Livestock Systems Phillip Sloderbeck, Extension Specialist, Entomology 38____________________________________________________________________________________________________________Profit Prospects Michael Langemeier, Professor, Agricultural Economist 42
Contents

3
Growth and DevelopmentThat corn crop that you’re planning to harvest next fall,
or the one you are reviewing to try to understand why yields were less or greater than expected, started when the seed was planted and ended when the ear was successfully harvested. Before planting, considerable planning and preparation goes into corn production. The crop you hope to produce is dependent on the genetic and environmental characteristics in which the plant was grown.
If we understand how the corn plant grows, develops, and produces grain, we have a better chance of knowing what will affect plant growth and consequently how to manage the crop for best production. Consider the age of the corn in terms of plant development rather than in days. With information regarding specific production practices, the other sections of this publication will be more easily understood.
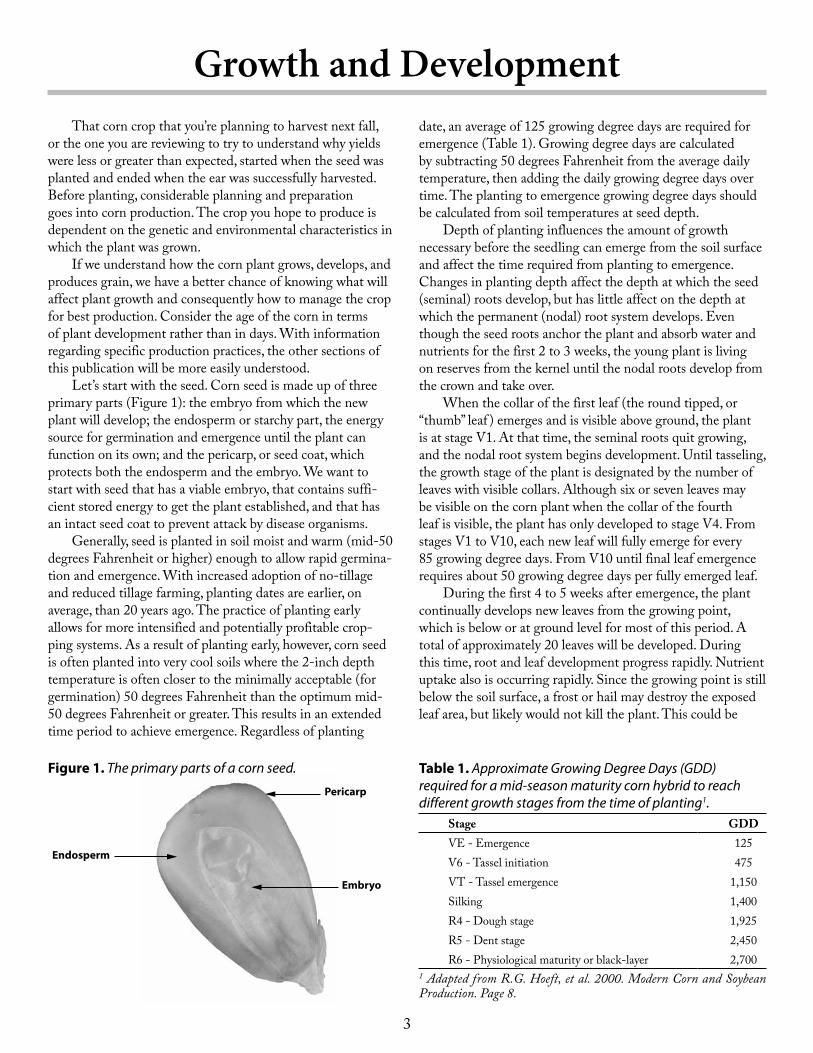
Let’s start with the seed. Corn seed is made up of three primary parts (Figure 1): the embryo from which the new plant will develop; the endosperm or starchy part, the energy source for germination and emergence until the plant can function on its own; and the pericarp, or seed coat, which protects both the endosperm and the embryo. We want to start with seed that has a viable embryo, that contains suffi-cient stored energy to get the plant established, and that has an intact seed coat to prevent attack by disease organisms.
Generally, seed is planted in soil moist and warm (mid-50 degrees Fahrenheit or higher) enough to allow rapid germina-tion and emergence. With increased adoption of no-tillage and reduced tillage farming, planting dates are earlier, on average, than 20 years ago. The practice of planting early allows for more intensified and potentially profitable crop-ping systems. As a result of planting early, however, corn seed is often planted into very cool soils where the 2-inch depth temperature is often closer to the minimally acceptable (for germination) 50 degrees Fahrenheit than the optimum mid-50 degrees Fahrenheit or greater. This results in an extended time period to achieve emergence. Regardless of planting
date, an average of 125 growing degree days are required for emergence (Table 1). Growing degree days are calculated by subtracting 50 degrees Fahrenheit from the average daily temperature, then adding the daily growing degree days over time. The planting to emergence growing degree days should be calculated from soil temperatures at seed depth.
Depth of planting influences the amount of growth necessary before the seedling can emerge from the soil surface and affect the time required from planting to emergence. Changes in planting depth affect the depth at which the seed (seminal) roots develop, but has little affect on the depth at which the permanent (nodal) root system develops. Even though the seed roots anchor the plant and absorb water and nutrients for the first 2 to 3 weeks, the young plant is living on reserves from the kernel until the nodal roots develop from the crown and take over.
When the collar of the first leaf (the round tipped, or “thumb” leaf ) emerges and is visible above ground, the plant is at stage V1. At that time, the seminal roots quit growing, and the nodal root system begins development. Until tasseling, the growth stage of the plant is designated by the number of leaves with visible collars. Although six or seven leaves may be visible on the corn plant when the collar of the fourth leaf is visible, the plant has only developed to stage V4. From stages V1 to V10, each new leaf will fully emerge for every 85 growing degree days. From V10 until final leaf emergence requires about 50 growing degree days per fully emerged leaf.
During the first 4 to 5 weeks after emergence, the plant continually develops new leaves from the growing point, which is below or at ground level for most of this period. A total of approximately 20 leaves will be developed. During this time, root and leaf development progress rapidly. Nutrient uptake also is occurring rapidly. Since the growing point is still below the soil surface, a frost or hail may destroy the exposed leaf area, but likely would not kill the plant. This could be
Pericarp
Embryo
Endosperm
Figure 1. The primary parts of a corn seed. Table 1. Approximate Growing Degree Days (GDD) required for a mid-season maturity corn hybrid to reach different growth stages from the time of planting1.
Stage GDDVE - Emergence 125V6 - Tassel initiation 475VT - Tassel emergence 1,150Silking 1,400R4 - Dough stage 1,925R5 - Dent stage 2,450R6 - Physiological maturity or black-layer 2,700
1 Adapted from R.G. Hoeft, et al. 2000. Modern Corn and Soybean Production. Page 8.
4
particularly important when determining whether or not to replant following a late-spring frost or hail storm.
At stage V5 to V6, or about 475 growing degree days, all of the leaves the plant will produce have been started and the growing point differentiates into the tassel (Table 1). Ears are initiated shortly after the tassel. By growth stage V6, the nodal roots have become the main root system of the plant. Within a few days of tassel initiation, the stalk grows rapidly and the growing point is elevated above the soil surface where any damage could affect the growing point and kill the plant. During the following 4 to 5 weeks, rapid growth occurs with the remaining leaves increasing in size and forming the “factory” that produces the grain during the latter portion of the growth cycle.
During this period of rapid stalk growth, plant height increases dramatically, culminating in the emergence of the developing tassel (1,150 growing degree days - Table 1) from the whorl. The tassel continues developing until pollination occurs. Rapid root development and nutrient uptake also occur during this stage. At tasseling, less than half of the final weight of the corn plant has been developed. However, more than 60 percent of the nitrogen, 50 percent of the phosphorus, and 80 percent of the potassium have already accumulated in the plant. The grain producing capability of the plant is determined during this particularly important time period.
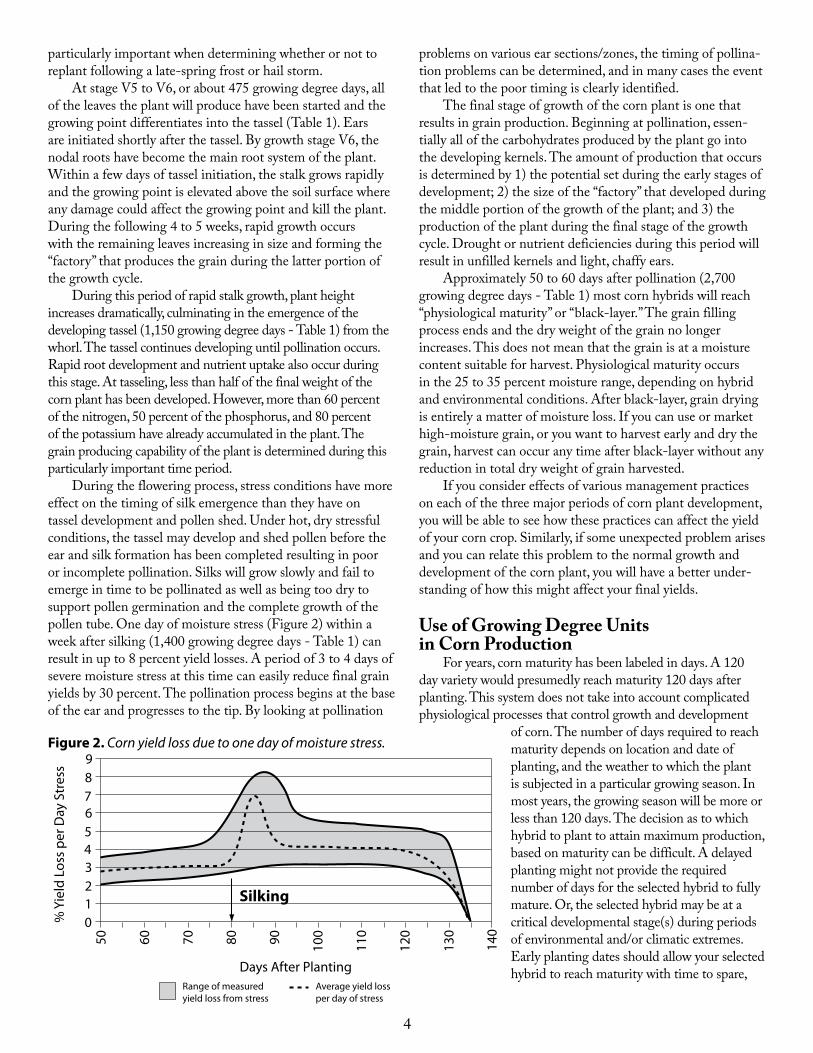
During the flowering process, stress conditions have more effect on the timing of silk emergence than they have on tassel development and pollen shed. Under hot, dry stressful conditions, the tassel may develop and shed pollen before the ear and silk formation has been completed resulting in poor or incomplete pollination. Silks will grow slowly and fail to emerge in time to be pollinated as well as being too dry to support pollen germination and the complete growth of the pollen tube. One day of moisture stress (Figure 2) within a week after silking (1,400 growing degree days - Table 1) can result in up to 8 percent yield losses. A period of 3 to 4 days of severe moisture stress at this time can easily reduce final grain yields by 30 percent. The pollination process begins at the base of the ear and progresses to the tip. By looking at pollination
problems on various ear sections/zones, the timing of pollina-tion problems can be determined, and in many cases the event that led to the poor timing is clearly identified.
The final stage of growth of the corn plant is one that results in grain production. Beginning at pollination, essen-tially all of the carbohydrates produced by the plant go into the developing kernels. The amount of production that occurs is determined by 1) the potential set during the early stages of development; 2) the size of the “factory” that developed during the middle portion of the growth of the plant; and 3) the production of the plant during the final stage of the growth cycle. Drought or nutrient deficiencies during this period will result in unfilled kernels and light, chaffy ears.
Approximately 50 to 60 days after pollination (2,700 growing degree days - Table 1) most corn hybrids will reach “physiological maturity” or “black-layer.” The grain filling process ends and the dry weight of the grain no longer increases. This does not mean that the grain is at a moisture content suitable for harvest. Physiological maturity occurs in the 25 to 35 percent moisture range, depending on hybrid and environmental conditions. After black-layer, grain drying is entirely a matter of moisture loss. If you can use or market high-moisture grain, or you want to harvest early and dry the grain, harvest can occur any time after black-layer without any reduction in total dry weight of grain harvested.
If you consider effects of various management practices on each of the three major periods of corn plant development, you will be able to see how these practices can affect the yield of your corn crop. Similarly, if some unexpected problem arises and you can relate this problem to the normal growth and development of the corn plant, you will have a better under-standing of how this might affect your final yields.
Use of Growing Degree Units in Corn Production
For years, corn maturity has been labeled in days. A 120 day variety would presumedly reach maturity 120 days after planting. This system does not take into account complicated physiological processes that control growth and development
of corn. The number of days required to reach maturity depends on location and date of planting, and the weather to which the plant is subjected in a particular growing season. In most years, the growing season will be more or less than 120 days. The decision as to which hybrid to plant to attain maximum production, based on maturity can be difficult. A delayed planting might not provide the required number of days for the selected hybrid to fully mature. Or, the selected hybrid may be at a critical developmental stage(s) during periods of environmental and/or climatic extremes. Early planting dates should allow your selected hybrid to reach maturity with time to spare,
9 8 7 6 5 4 3 2 1 0 %
Yie
ld L
oss
per D
ay S
tres
s
50
80
90
110
120
100 70
60
140
130
Days After Planting
Silking
Average yield loss per day of stress
Range of measured yield loss from stress
Figure 2. Corn yield loss due to one day of moisture stress.

5
but again, if the plants are stressed during key reproductive stages yields may be devastated.
Each day does not contribute equally to the growth of plants. Growth is faster during the warm season than in cold weather. On the other hand, summer temperatures can be too high for optimum growth. Although factors other than temperature enter into determining rate of growth, seed producers use the temperature based growing degree days concept to express hybrid maturity. Over the years, many “heat-unit” systems have been devised. The one currently in use for corn was proposed by the Environmental Data Service of the National Oceanic and Atmospheric Administration (formerly U.S. Weather Bureau).
In this system, 50 degrees Fahrenheit is the base tempera-ture. Growing degree days are calculated by subtracting the base from the average daily air temperature. Corn grows very little at temperatures below 50 degrees Fahrenheit. Until the leaves emerge from the soil, use of the average daily soil temperature at seed depth rather than air temperatures is recommended to more accurately calculate growing degree days. As the temperature rises, corn grows faster if moisture, and nutrients, are plentiful. However, at air temperatures higher than 86 degrees Fahrenheit, plant roots have greater difficulty taking in water fast enough to keep the plant growing at full speed. Growing degree days are calculated by the following equation:
GDD =Max Temp. + Min Temp.
– 50° F2
Minimum temperatures below 50 degrees Fahrenheit are counted as 50 degrees Fahrenheit and temperatures above 86 degrees Fahrenheit are counted as 86 degrees Fahrenheit (Table 2).
The average growing degree days accumulation beginning on March 1 for four sites are shown in Figure 3. Use the accu-mulations to understand how growing degree days can be used to help plan your corn operation. Notice that the accumulation rate is very slow early in the season, then increases rapidly and finally slows down again near the end of the growing season. This variable rate of accumulation is what makes maturity expressed in days inconsistent. Planting 1 week early may result in corn reaching maturity only 1 day earlier.
The three curves in Figure 3 represent the growing conditions throughout the state. Colby represents the high elevations in northwest Kansas that have a relatively short growing season. The Garden City-Horton curve represents the broad mid-range of conditions in the state. Interestingly, a northern station at a low elevation (Horton) has about the same conditions for promoting growth as a southern station at a higher elevation (Garden City). Elevation and latitude combine to determine the length of the Kansas growing season. Independence data represents the area of southeast Kansas that has a relatively long growing season. Periods of summer heat are more critical for corn production in this area than the chances of an early freeze.
Suppose you are considering selecting one of the two hybrids rated by the seed supplier as shown in Figure 3. Further, let’s assume that soil temperatures will warm to favor-able planting levels at about 400 growing degree days after March 1. By following the Planting Date line, we can deter-mine the average date at each location when this will occur. Naturally, southeast Kansas (April 22) will reach the point sooner than at Garden City (May 1) or at Colby (May 7).
If you are able to plant when 400 growing degree days have accumulated, the seed supplier predicts that the early hybrid will silk after 1,390 additional growing degree days have accumulated (1,790 total growing degree days). The fuller season hybrid will not silk until a 1,960 total growing degree days have accumulated. The silking stage is crucial for
Table 2. GDD accumulations calculated for selected high and low daily temperatures.
Daily Temperature, Degrees FMinimum Maximum GDD
40 70 548 70 552 78 1559 85 2262 88 2462 98 24
GDU’s Required to Reach:
Early Season Variety Full Season Variety
Silking Maturity
1,390 2,610 2,830 1,560
4,000
3,500
3,000
2,500
500
1,000
1,500
2,000
Mar Aug July June May Apr Oct Sept
Maturity (full)
Maturity (early)
Silking (full)
Silking (early)
Planting
Independence
Colby
Garden City and Horton
End of Season Figure 3.
6
the production of high corn yields. You can reduce the risk of your corn reaching silking at the time when moisture and high temperature stress are most likely. Corn producers in your area, especially dryland growers, should pay particular attention to select a hybrid rating and planting date that will fit your environment.
If we add the predicted number of growing degree days needed to reach maturity to our assumed planting date accumulation of 400 growing degree days, we can predict the time when the crop will be ready for harvest. Earlier planting
dates, earlier maturing hybrids and the use of starter fertilizer have all contributed to crop physiological maturity and harvest being well ahead of the prospects of an early freeze, unless planting is abnormally delayed. In our example, however, the end of season mark on each curve indicates the date 10 days prior to the average 32 degrees Fahrenheit freeze date. Note that neither hybrid utilizes the entire growing season in southeastern Kansas. Perhaps you might want to try a hybrid that requires almost 3,000 growing degree days to reach maturity. Remember however, mid-season hot spells affect polli-nation. In northwestern Kansas, and in west central Kansas, full season corn that has a requirement of 2,800 or more growing degree
days may not reach maturity before a killing freeze. The early season hybrid certainly looks to be more promising in this area.
The example given above assumes a normal year, and planting on schedule. What if your planting is delayed 1 week, or even 2 weeks? Your decision will depend on your location, but you might want to change corn hybrids. Another factor to consider is that the curve represents normal (or average) conditions. As everyone knows, such conditions don’t often
Cheyenne Rawlins Decatur Norton Phillips Smith Jewell Republic Washington Marshall Nemaha Brown
DO
AtchisonJacksonPottawatomieRilelyClay
CloudMitchellOsborne
Dickinso n Gear y
Morris
Lyon
Wabaunsee
Ottawa
Rook sGrahamSheridanThomasSherman
Wallace Logan Gove Tr ego Ellis RussellLincoln
Salin e
Ellsworth
BartonRus hNessLaneScottWichitaGreeley
Hamilton Kearny Finney
Gray
HodgemanPawnee
Edwards
Sta�ord
Rice
Reno
McPherson MarionChase
HarveyButler
Shawnee
Je�erson LV
WY
Douglas Johnson
MiamiFranklin
Osage
LinnAndersonCo�ey
Bourbon
Crawford
Cherokee
Allen
Neosho
Labette
Wilson
Montgomery
W oodsonGreenwood
Sedgwick
Elk
Chautauqua
CowleySumner
Kingman
Harper
Pratt
Barber
Kiowa
Comanche
Ford
ClarkMeadeSewar d
HaskellGrant
StevensMorton
Stanton
5 5 10 10 10 15
20
25
25
25
252025252525 20
2015
10
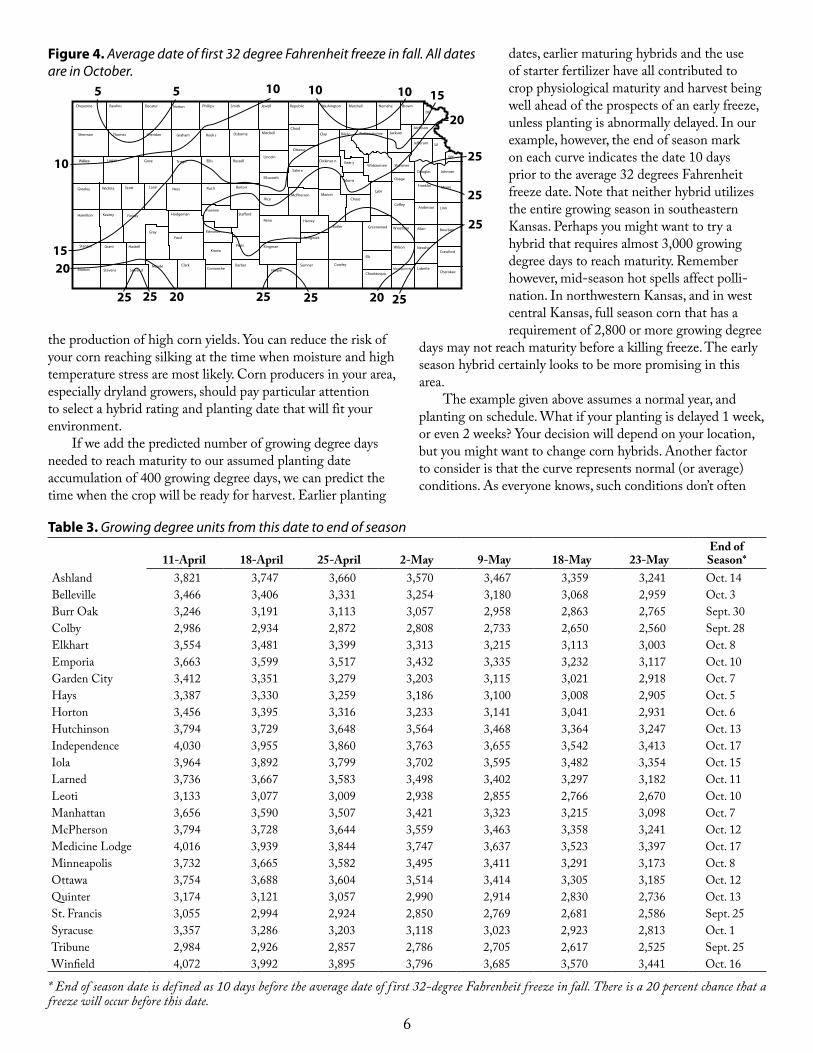
Figure 4. Average date of first 32 degree Fahrenheit freeze in fall. All dates are in October.
Table 3. Growing degree units from this date to end of season
11-April 18-April 25-April 2-May 9-May 18-May 23-MayEnd of
Season* Ashland 3,821 3,747 3,660 3,570 3,467 3,359 3,241 Oct. 14 Belleville 3,466 3,406 3,331 3,254 3,180 3,068 2,959 Oct. 3 Burr Oak 3,246 3,191 3,113 3,057 2,958 2,863 2,765 Sept. 30 Colby 2,986 2,934 2,872 2,808 2,733 2,650 2,560 Sept. 28 Elkhart 3,554 3,481 3,399 3,313 3,215 3,113 3,003 Oct. 8 Emporia 3,663 3,599 3,517 3,432 3,335 3,232 3,117 Oct. 10 Garden City 3,412 3,351 3,279 3,203 3,115 3,021 2,918 Oct. 7 Hays 3,387 3,330 3,259 3,186 3,100 3,008 2,905 Oct. 5 Horton 3,456 3,395 3,316 3,233 3,141 3,041 2,931 Oct. 6 Hutchinson 3,794 3,729 3,648 3,564 3,468 3,364 3,247 Oct. 13 Independence 4,030 3,955 3,860 3,763 3,655 3,542 3,413 Oct. 17 Iola 3,964 3,892 3,799 3,702 3,595 3,482 3,354 Oct. 15 Larned 3,736 3,667 3,583 3,498 3,402 3,297 3,182 Oct. 11 Leoti 3,133 3,077 3,009 2,938 2,855 2,766 2,670 Oct. 10 Manhattan 3,656 3,590 3,507 3,421 3,323 3,215 3,098 Oct. 7 McPherson 3,794 3,728 3,644 3,559 3,463 3,358 3,241 Oct. 12 Medicine Lodge 4,016 3,939 3,844 3,747 3,637 3,523 3,397 Oct. 17 Minneapolis 3,732 3,665 3,582 3,495 3,411 3,291 3,173 Oct. 8 Ottawa 3,754 3,688 3,604 3,514 3,414 3,305 3,185 Oct. 12 Quinter 3,174 3,121 3,057 2,990 2,914 2,830 2,736 Oct. 13 St. Francis 3,055 2,994 2,924 2,850 2,769 2,681 2,586 Sept. 25 Syracuse 3,357 3,286 3,203 3,118 3,023 2,923 2,813 Oct. 1 Tribune 2,984 2,926 2,857 2,786 2,705 2,617 2,525 Sept. 25 Winfield 4,072 3,992 3,895 3,796 3,685 3,570 3,441 Oct. 16
* End of season date is defined as 10 days before the average date of f irst 32-degree Fahrenheit freeze in fall. There is a 20 percent chance that a freeze will occur before this date.
7
exist. These curves can still be useful if they are shifted to fit the actual conditions on a particular date. For example, Figure 3 shows that between March 1 and May 27, 1,000 growing degree days accumulation at Independence is normal. What if the spring is cool and growing degree days doesn’t reach 1,000 until June 7? If you assume normal conditions the rest of the year by shifting the curve so that the 1,000 growing degree days level is reached on June 7, you will again have a prediction of the growth and development of your corn crop for that particular year.
Table 3 lists the number of growing degree days that will be available on average for various planting dates for a number of Kansas locations. We assume that the growing season ends 10 days prior to the average date of the first freeze in the fall.
The probability that a freeze will occur before that date is only one in five or 20 percent. Figure 4 shows the average date of the first 32 degrees Fahrenheit freeze across Kansas.
If you plant corn in the Tribune area on May 2, you can expect to have a seasonal total of 2,786 growing degree days for your crop. You should select a hybrid that has a require-ment less than this. Keep in mind that the number of growing degree days will vary from year to year. The totals will be within 150 growing degree days above or below the values listed in Table 3 in 70 percent of the years.
The growing degree days rating placed on corn hybrids by seed producers can give you a great deal of insight into the growth and development of your crop. Getting familiar with, and using the growing degree days system will be worth your effort.
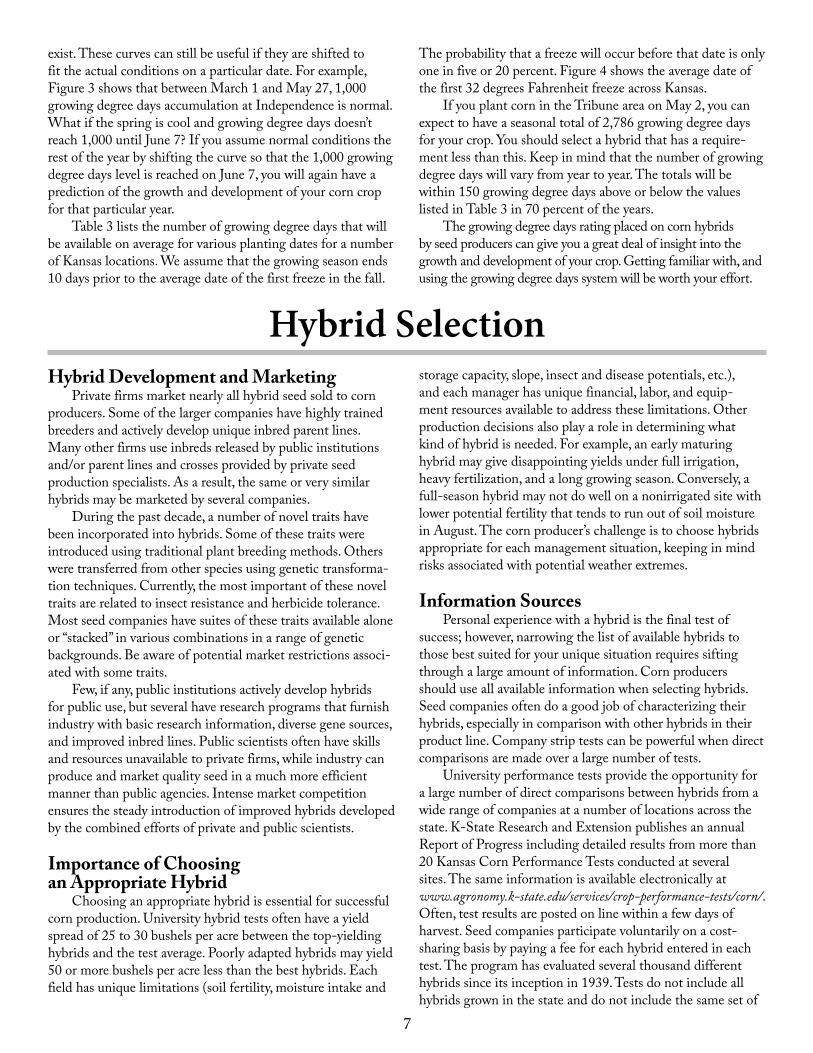
Hybrid SelectionHybrid Development and Marketing
Private firms market nearly all hybrid seed sold to corn producers. Some of the larger companies have highly trained breeders and actively develop unique inbred parent lines. Many other firms use inbreds released by public institutions and/or parent lines and crosses provided by private seed production specialists. As a result, the same or very similar hybrids may be marketed by several companies.
During the past decade, a number of novel traits have been incorporated into hybrids. Some of these traits were introduced using traditional plant breeding methods. Others were transferred from other species using genetic transforma-tion techniques. Currently, the most important of these novel traits are related to insect resistance and herbicide tolerance. Most seed companies have suites of these traits available alone or “stacked” in various combinations in a range of genetic backgrounds. Be aware of potential market restrictions associ-ated with some traits.
Few, if any, public institutions actively develop hybrids for public use, but several have research programs that furnish industry with basic research information, diverse gene sources, and improved inbred lines. Public scientists often have skills and resources unavailable to private firms, while industry can produce and market quality seed in a much more efficient manner than public agencies. Intense market competition ensures the steady introduction of improved hybrids developed by the combined efforts of private and public scientists.
Importance of Choosing an Appropriate Hybrid
Choosing an appropriate hybrid is essential for successful corn production. University hybrid tests often have a yield spread of 25 to 30 bushels per acre between the top-yielding hybrids and the test average. Poorly adapted hybrids may yield 50 or more bushels per acre less than the best hybrids. Each field has unique limitations (soil fertility, moisture intake and
storage capacity, slope, insect and disease potentials, etc.), and each manager has unique financial, labor, and equip-ment resources available to address these limitations. Other production decisions also play a role in determining what kind of hybrid is needed. For example, an early maturing hybrid may give disappointing yields under full irrigation, heavy fertilization, and a long growing season. Conversely, a full-season hybrid may not do well on a nonirrigated site with lower potential fertility that tends to run out of soil moisture in August. The corn producer’s challenge is to choose hybrids appropriate for each management situation, keeping in mind risks associated with potential weather extremes.
Information SourcesPersonal experience with a hybrid is the final test of
success; however, narrowing the list of available hybrids to those best suited for your unique situation requires sifting through a large amount of information. Corn producers should use all available information when selecting hybrids. Seed companies often do a good job of characterizing their hybrids, especially in comparison with other hybrids in their product line. Company strip tests can be powerful when direct comparisons are made over a large number of tests.
University performance tests provide the opportunity for a large number of direct comparisons between hybrids from a wide range of companies at a number of locations across the state. K-State Research and Extension publishes an annual Report of Progress including detailed results from more than 20 Kansas Corn Performance Tests conducted at several sites. The same information is available electronically at www.agronomy.k-state.edu/services/crop-performance-tests/corn/. Often, test results are posted on line within a few days of harvest. Seed companies participate voluntarily on a cost-sharing basis by paying a fee for each hybrid entered in each test. The program has evaluated several thousand different hybrids since its inception in 1939. Tests do not include all hybrids grown in the state and do not include the same set of
8
hybrids at all test sites because entrants choose where to enter their hybrids. However, test results containing current-year summaries and multi-year averages can provide considerable guidance toward wise hybrid choices.
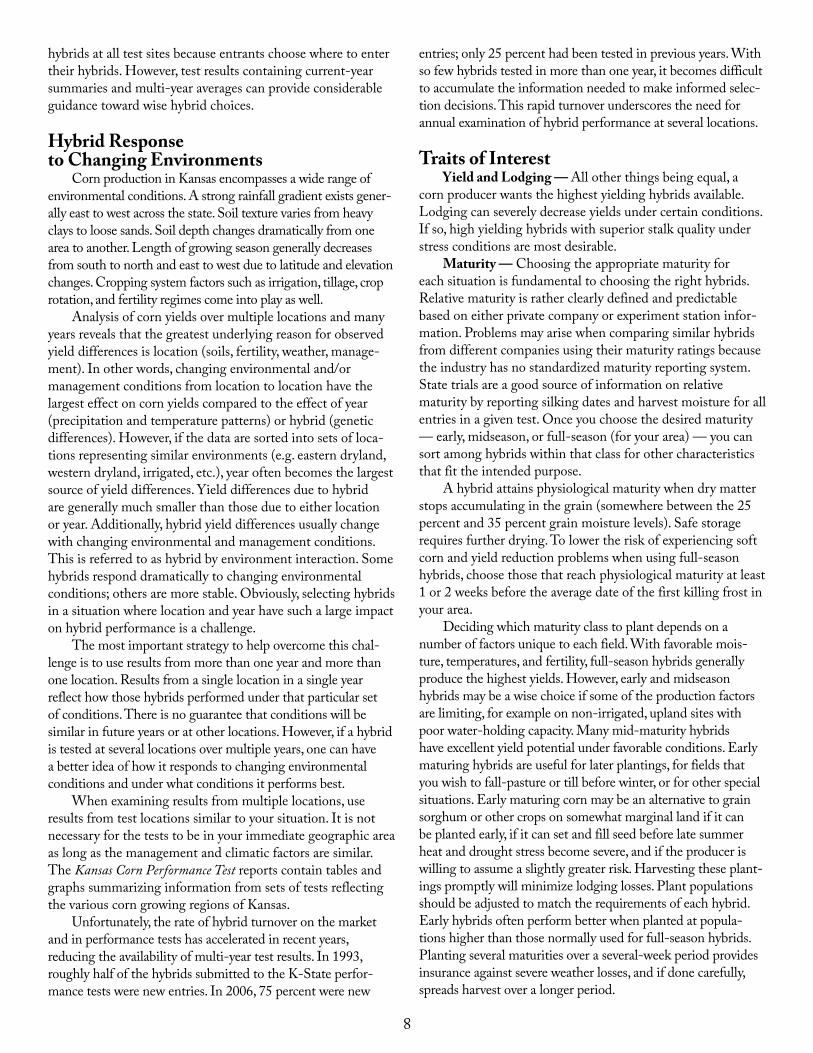
Hybrid Response to Changing Environments
Corn production in Kansas encompasses a wide range of environmental conditions. A strong rainfall gradient exists gener-ally east to west across the state. Soil texture varies from heavy clays to loose sands. Soil depth changes dramatically from one area to another. Length of growing season generally decreases from south to north and east to west due to latitude and elevation changes. Cropping system factors such as irrigation, tillage, crop rotation, and fertility regimes come into play as well.
Analysis of corn yields over multiple locations and many years reveals that the greatest underlying reason for observed yield differences is location (soils, fertility, weather, manage-ment). In other words, changing environmental and/or management conditions from location to location have the largest effect on corn yields compared to the effect of year (precipitation and temperature patterns) or hybrid (genetic differences). However, if the data are sorted into sets of loca-tions representing similar environments (e.g. eastern dryland, western dryland, irrigated, etc.), year often becomes the largest source of yield differences. Yield differences due to hybrid are generally much smaller than those due to either location or year. Additionally, hybrid yield differences usually change with changing environmental and management conditions. This is referred to as hybrid by environment interaction. Some hybrids respond dramatically to changing environmental conditions; others are more stable. Obviously, selecting hybrids in a situation where location and year have such a large impact on hybrid performance is a challenge.
The most important strategy to help overcome this chal-lenge is to use results from more than one year and more than one location. Results from a single location in a single year reflect how those hybrids performed under that particular set of conditions. There is no guarantee that conditions will be similar in future years or at other locations. However, if a hybrid is tested at several locations over multiple years, one can have a better idea of how it responds to changing environmental conditions and under what conditions it performs best.
When examining results from multiple locations, use results from test locations similar to your situation. It is not necessary for the tests to be in your immediate geographic area as long as the management and climatic factors are similar. The Kansas Corn Performance Test reports contain tables and graphs summarizing information from sets of tests reflecting the various corn growing regions of Kansas.
Unfortunately, the rate of hybrid turnover on the market and in performance tests has accelerated in recent years, reducing the availability of multi-year test results. In 1993, roughly half of the hybrids submitted to the K-State perfor-mance tests were new entries. In 2006, 75 percent were new
entries; only 25 percent had been tested in previous years. With so few hybrids tested in more than one year, it becomes difficult to accumulate the information needed to make informed selec-tion decisions. This rapid turnover underscores the need for annual examination of hybrid performance at several locations.
Traits of InterestYield and Lodging — All other things being equal, a
corn producer wants the highest yielding hybrids available. Lodging can severely decrease yields under certain conditions. If so, high yielding hybrids with superior stalk quality under stress conditions are most desirable.
Maturity — Choosing the appropriate maturity for each situation is fundamental to choosing the right hybrids. Relative maturity is rather clearly defined and predictable based on either private company or experiment station infor-mation. Problems may arise when comparing similar hybrids from different companies using their maturity ratings because the industry has no standardized maturity reporting system. State trials are a good source of information on relative maturity by reporting silking dates and harvest moisture for all entries in a given test. Once you choose the desired maturity — early, midseason, or full-season (for your area) — you can sort among hybrids within that class for other characteristics that fit the intended purpose.
A hybrid attains physiological maturity when dry matter stops accumulating in the grain (somewhere between the 25 percent and 35 percent grain moisture levels). Safe storage requires further drying. To lower the risk of experiencing soft corn and yield reduction problems when using full-season hybrids, choose those that reach physiological maturity at least 1 or 2 weeks before the average date of the first killing frost in your area.
Deciding which maturity class to plant depends on a number of factors unique to each field. With favorable mois-ture, temperatures, and fertility, full-season hybrids generally produce the highest yields. However, early and midseason hybrids may be a wise choice if some of the production factors are limiting, for example on non-irrigated, upland sites with poor water-holding capacity. Many mid-maturity hybrids have excellent yield potential under favorable conditions. Early maturing hybrids are useful for later plantings, for fields that you wish to fall-pasture or till before winter, or for other special situations. Early maturing corn may be an alternative to grain sorghum or other crops on somewhat marginal land if it can be planted early, if it can set and fill seed before late summer heat and drought stress become severe, and if the producer is willing to assume a slightly greater risk. Harvesting these plant-ings promptly will minimize lodging losses. Plant populations should be adjusted to match the requirements of each hybrid. Early hybrids often perform better when planted at popula-tions higher than those normally used for full-season hybrids. Planting several maturities over a several-week period provides insurance against severe weather losses, and if done carefully, spreads harvest over a longer period.
9
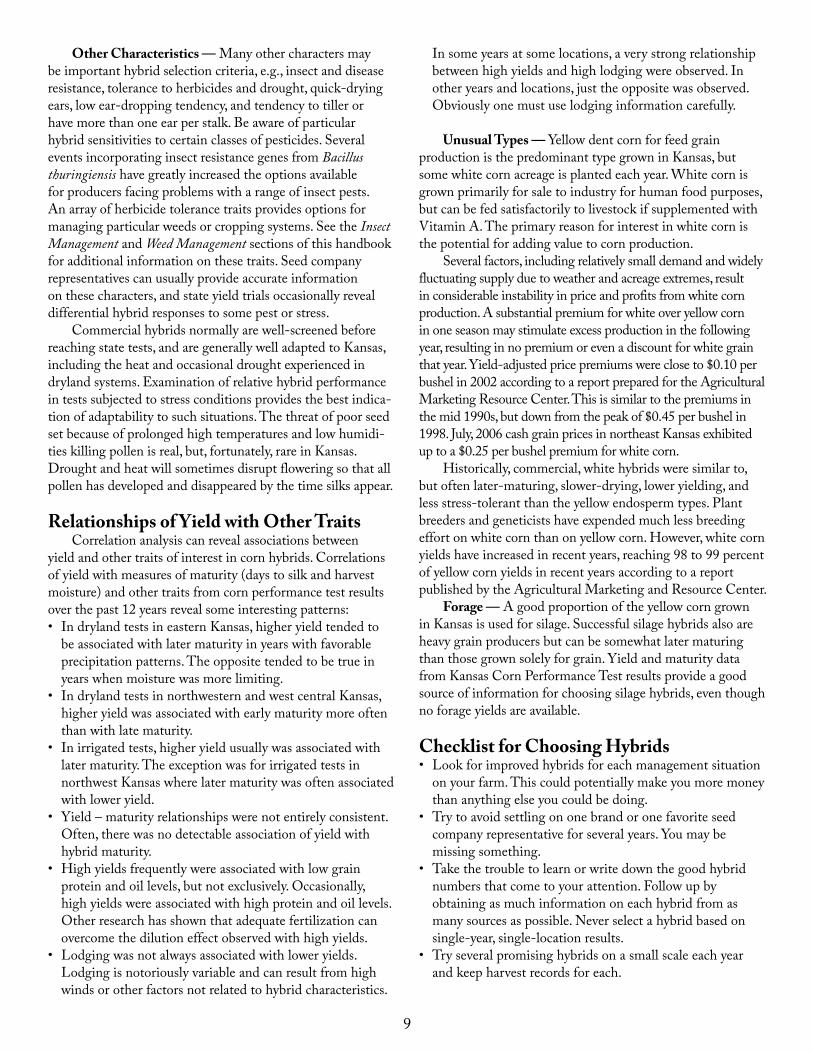
Other Characteristics — Many other characters may be important hybrid selection criteria, e.g., insect and disease resistance, tolerance to herbicides and drought, quick-drying ears, low ear-dropping tendency, and tendency to tiller or have more than one ear per stalk. Be aware of particular hybrid sensitivities to certain classes of pesticides. Several events incorporating insect resistance genes from Bacillus thuringiensis have greatly increased the options available for producers facing problems with a range of insect pests. An array of herbicide tolerance traits provides options for managing particular weeds or cropping systems. See the Insect Management and Weed Management sections of this handbook for additional information on these traits. Seed company representatives can usually provide accurate information on these characters, and state yield trials occasionally reveal differential hybrid responses to some pest or stress.
Commercial hybrids normally are well-screened before reaching state tests, and are generally well adapted to Kansas, including the heat and occasional drought experienced in dryland systems. Examination of relative hybrid performance in tests subjected to stress conditions provides the best indica-tion of adaptability to such situations. The threat of poor seed set because of prolonged high temperatures and low humidi-ties killing pollen is real, but, fortunately, rare in Kansas. Drought and heat will sometimes disrupt flowering so that all pollen has developed and disappeared by the time silks appear.
Relationships of Yield with Other TraitsCorrelation analysis can reveal associations between
yield and other traits of interest in corn hybrids. Correlations of yield with measures of maturity (days to silk and harvest moisture) and other traits from corn performance test results over the past 12 years reveal some interesting patterns: • In dryland tests in eastern Kansas, higher yield tended to
be associated with later maturity in years with favorable precipitation patterns. The opposite tended to be true in years when moisture was more limiting.
• In dryland tests in northwestern and west central Kansas, higher yield was associated with early maturity more often than with late maturity.
• In irrigated tests, higher yield usually was associated with later maturity. The exception was for irrigated tests in northwest Kansas where later maturity was often associated with lower yield.
• Yield – maturity relationships were not entirely consistent. Often, there was no detectable association of yield with hybrid maturity.
• High yields frequently were associated with low grain protein and oil levels, but not exclusively. Occasionally, high yields were associated with high protein and oil levels. Other research has shown that adequate fertilization can overcome the dilution effect observed with high yields.
• Lodging was not always associated with lower yields. Lodging is notoriously variable and can result from high winds or other factors not related to hybrid characteristics.
In some years at some locations, a very strong relationship between high yields and high lodging were observed. In other years and locations, just the opposite was observed. Obviously one must use lodging information carefully.
Unusual Types — Yellow dent corn for feed grain production is the predominant type grown in Kansas, but some white corn acreage is planted each year. White corn is grown primarily for sale to industry for human food purposes, but can be fed satisfactorily to livestock if supplemented with Vitamin A. The primary reason for interest in white corn is the potential for adding value to corn production.
Several factors, including relatively small demand and widely fluctuating supply due to weather and acreage extremes, result in considerable instability in price and profits from white corn production. A substantial premium for white over yellow corn in one season may stimulate excess production in the following year, resulting in no premium or even a discount for white grain that year. Yield-adjusted price premiums were close to $0.10 per bushel in 2002 according to a report prepared for the Agricultural Marketing Resource Center. This is similar to the premiums in the mid 1990s, but down from the peak of $0.45 per bushel in 1998. July, 2006 cash grain prices in northeast Kansas exhibited up to a $0.25 per bushel premium for white corn.
Historically, commercial, white hybrids were similar to, but often later-maturing, slower-drying, lower yielding, and less stress-tolerant than the yellow endosperm types. Plant breeders and geneticists have expended much less breeding effort on white corn than on yellow corn. However, white corn yields have increased in recent years, reaching 98 to 99 percent of yellow corn yields in recent years according to a report published by the Agricultural Marketing and Resource Center.
Forage — A good proportion of the yellow corn grown in Kansas is used for silage. Successful silage hybrids also are heavy grain producers but can be somewhat later maturing than those grown solely for grain. Yield and maturity data from Kansas Corn Performance Test results provide a good source of information for choosing silage hybrids, even though no forage yields are available.
Checklist for Choosing Hybrids• Look for improved hybrids for each management situation
on your farm. This could potentially make you more money than anything else you could be doing.
• Try to avoid settling on one brand or one favorite seed company representative for several years. You may be missing something.
• Take the trouble to learn or write down the good hybrid numbers that come to your attention. Follow up by obtaining as much information on each hybrid from as many sources as possible. Never select a hybrid based on single-year, single-location results.
• Try several promising hybrids on a small scale each year and keep harvest records for each.
10
Optimum Planting PracticesSeedbed Preparation and Planting Practices
Corn kernels need a soil that is warm, moist, well supplied with air, and fine enough to give good contact between seed and soil for rapid germination. A number of different tillage and planting systems can be used to produce corn. These systems may involve primary and/or secondary tillage, or no preplant tillage operations. An ideal seedbed should accom-plish the following:• control weeds,• conserve moisture,• preserve or improve tilth,• protect water quality,• control wind and water erosion, and• be suitable for planting with your equipment.
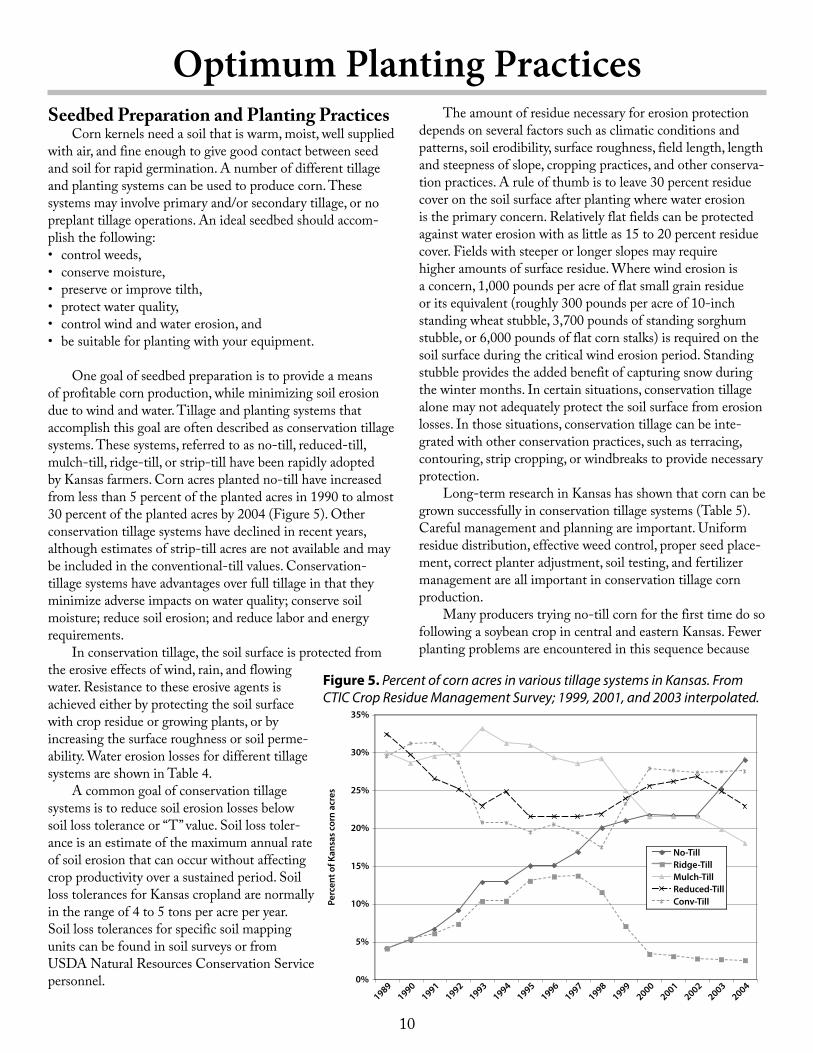
One goal of seedbed preparation is to provide a means of profitable corn production, while minimizing soil erosion due to wind and water. Tillage and planting systems that accomplish this goal are often described as conservation tillage systems. These systems, referred to as no-till, reduced-till, mulch-till, ridge-till, or strip-till have been rapidly adopted by Kansas farmers. Corn acres planted no-till have increased from less than 5 percent of the planted acres in 1990 to almost 30 percent of the planted acres by 2004 (Figure 5). Other conservation tillage systems have declined in recent years, although estimates of strip-till acres are not available and may be included in the conventional-till values. Conservation-tillage systems have advantages over full tillage in that they minimize adverse impacts on water quality; conserve soil moisture; reduce soil erosion; and reduce labor and energy requirements.
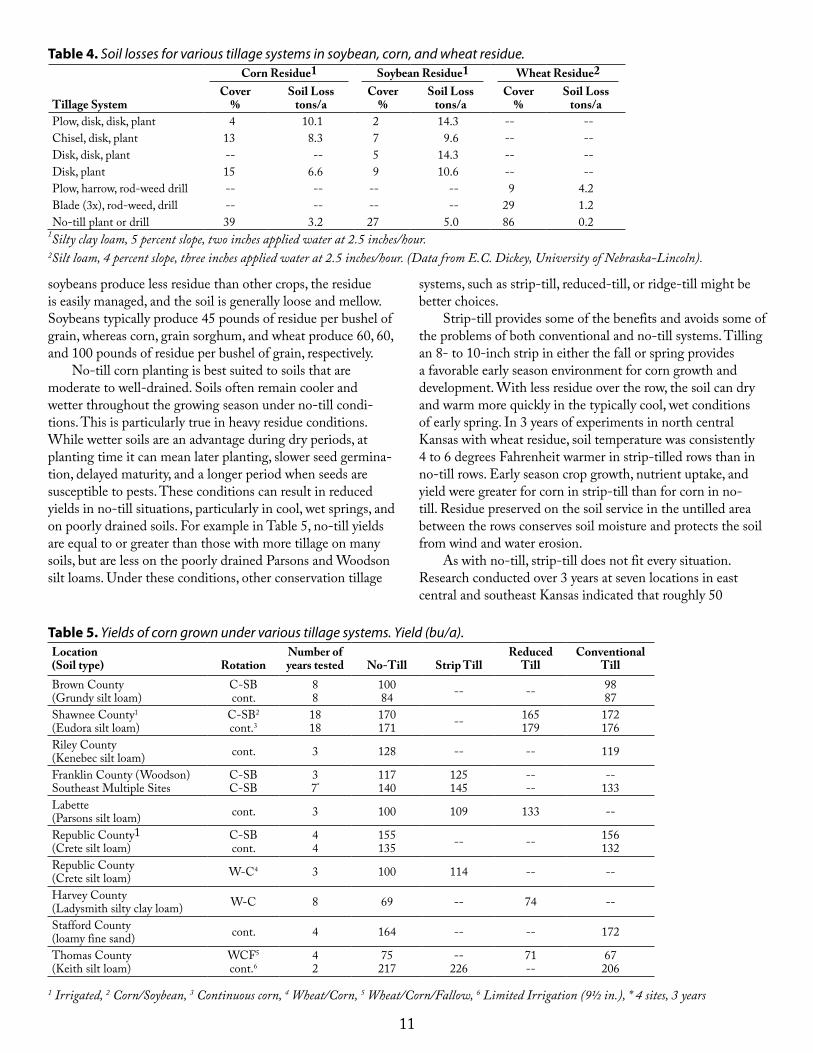
In conservation tillage, the soil surface is protected from the erosive effects of wind, rain, and flowing water. Resistance to these erosive agents is achieved either by protecting the soil surface with crop residue or growing plants, or by increasing the surface roughness or soil perme-ability. Water erosion losses for different tillage systems are shown in Table 4.
A common goal of conservation tillage systems is to reduce soil erosion losses below soil loss tolerance or “T” value. Soil loss toler-ance is an estimate of the maximum annual rate of soil erosion that can occur without affecting crop productivity over a sustained period. Soil loss tolerances for Kansas cropland are normally in the range of 4 to 5 tons per acre per year. Soil loss tolerances for specific soil mapping units can be found in soil surveys or from USDA Natural Resources Conservation Service personnel.
The amount of residue necessary for erosion protection depends on several factors such as climatic conditions and patterns, soil erodibility, surface roughness, field length, length and steepness of slope, cropping practices, and other conserva-tion practices. A rule of thumb is to leave 30 percent residue cover on the soil surface after planting where water erosion is the primary concern. Relatively flat fields can be protected against water erosion with as little as 15 to 20 percent residue cover. Fields with steeper or longer slopes may require higher amounts of surface residue. Where wind erosion is a concern, 1,000 pounds per acre of flat small grain residue or its equivalent (roughly 300 pounds per acre of 10-inch standing wheat stubble, 3,700 pounds of standing sorghum stubble, or 6,000 pounds of flat corn stalks) is required on the soil surface during the critical wind erosion period. Standing stubble provides the added benefit of capturing snow during the winter months. In certain situations, conservation tillage alone may not adequately protect the soil surface from erosion losses. In those situations, conservation tillage can be inte-grated with other conservation practices, such as terracing, contouring, strip cropping, or windbreaks to provide necessary protection.
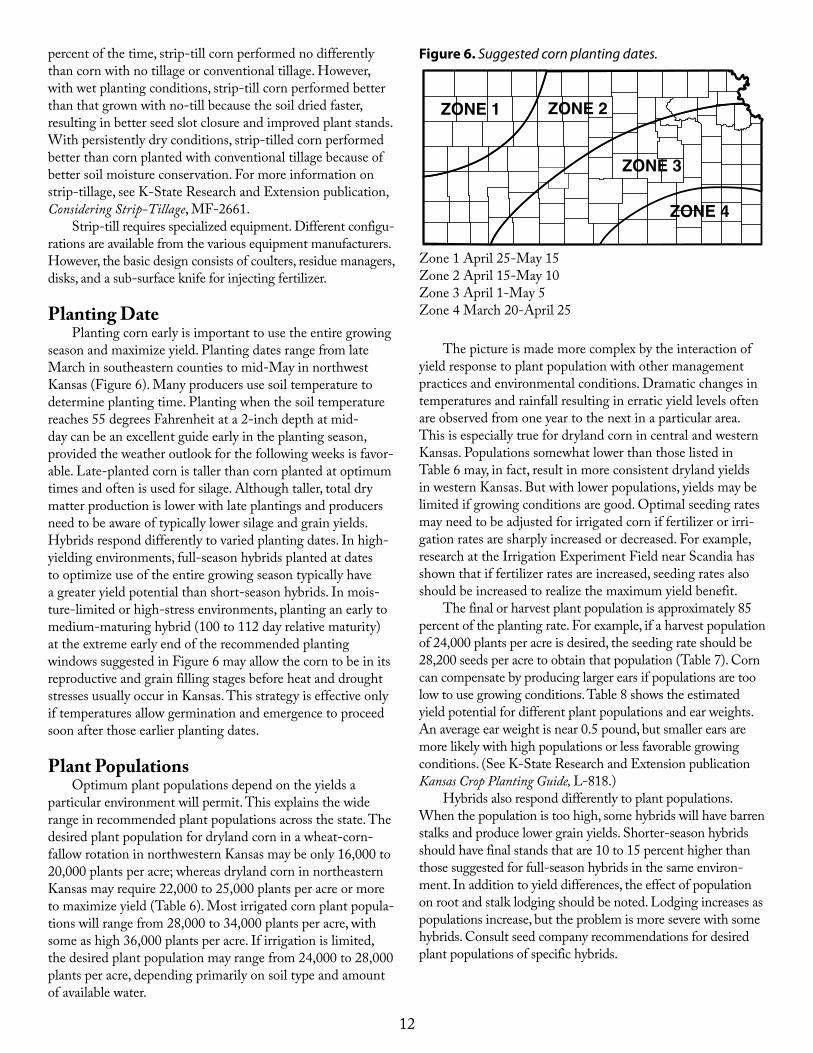
Long-term research in Kansas has shown that corn can be grown successfully in conservation tillage systems (Table 5). Careful management and planning are important. Uniform residue distribution, effective weed control, proper seed place-ment, correct planter adjustment, soil testing, and fertilizer management are all important in conservation tillage corn production.
Many producers trying no-till corn for the first time do so following a soybean crop in central and eastern Kansas. Fewer planting problems are encountered in this sequence because
0%
5%
10%
15%
20%
25%
30%
35%
19891990
19911992
19931994
19951996
19971998
19992000
20012002
20032004
No-TillRidge-TillMulch-TillReduced-TillConv-TillPe
rcen
t of K
ansa
s co
rn a
cres
Figure 5. Percent of corn acres in various tillage systems in Kansas. From CTIC Crop Residue Management Survey; 1999, 2001, and 2003 interpolated.
11
soybeans produce less residue than other crops, the residue is easily managed, and the soil is generally loose and mellow. Soybeans typically produce 45 pounds of residue per bushel of grain, whereas corn, grain sorghum, and wheat produce 60, 60, and 100 pounds of residue per bushel of grain, respectively.
No-till corn planting is best suited to soils that are moderate to well-drained. Soils often remain cooler and wetter throughout the growing season under no-till condi-tions. This is particularly true in heavy residue conditions. While wetter soils are an advantage during dry periods, at planting time it can mean later planting, slower seed germina-tion, delayed maturity, and a longer period when seeds are susceptible to pests. These conditions can result in reduced yields in no-till situations, particularly in cool, wet springs, and on poorly drained soils. For example in Table 5, no-till yields are equal to or greater than those with more tillage on many soils, but are less on the poorly drained Parsons and Woodson silt loams. Under these conditions, other conservation tillage
systems, such as strip-till, reduced-till, or ridge-till might be better choices.
Strip-till provides some of the benefits and avoids some of the problems of both conventional and no-till systems. Tilling an 8- to 10-inch strip in either the fall or spring provides a favorable early season environment for corn growth and development. With less residue over the row, the soil can dry and warm more quickly in the typically cool, wet conditions of early spring. In 3 years of experiments in north central Kansas with wheat residue, soil temperature was consistently 4 to 6 degrees Fahrenheit warmer in strip-tilled rows than in no-till rows. Early season crop growth, nutrient uptake, and yield were greater for corn in strip-till than for corn in no-till. Residue preserved on the soil service in the untilled area between the rows conserves soil moisture and protects the soil from wind and water erosion.
As with no-till, strip-till does not fit every situation. Research conducted over 3 years at seven locations in east central and southeast Kansas indicated that roughly 50
Table 4. Soil losses for various tillage systems in soybean, corn, and wheat residue.Corn Residue1 Soybean Residue1 Wheat Residue2
Tillage SystemCover
%Soil Loss
tons/aCover
%Soil Loss
tons/aCover
%Soil Loss
tons/aPlow, disk, disk, plant 4 10.1 2 14.3 -- --Chisel, disk, plant 13 8.3 7 9.6 -- --Disk, disk, plant -- -- 5 14.3 -- --Disk, plant 15 6.6 9 10.6 -- --Plow, harrow, rod-weed drill -- -- -- -- 9 4.2Blade (3x), rod-weed, drill -- -- -- -- 29 1.2No-till plant or drill 39 3.2 27 5.0 86 0.2
1Silty clay loam, 5 percent slope, two inches applied water at 2.5 inches/hour.2Silt loam, 4 percent slope, three inches applied water at 2.5 inches/hour. (Data from E.C. Dickey, University of Nebraska-Lincoln).
Table 5. Yields of corn grown under various tillage systems. Yield (bu/a).Location (Soil type) Rotation
Number of years tested No-Till Strip Till
Reduced Till
Conventional Till
Brown County (Grundy silt loam)
C-SB cont.
8 8
100 84 -- -- 98
87Shawnee County1 (Eudora silt loam)
C-SB2 cont.3
18 18
170 171 -- 165
179172 176
Riley County (Kenebec silt loam) cont. 3 128 -- -- 119
Franklin County (Woodson) Southeast Multiple Sites
C-SB C-SB
3 7*
117 140
125 145
-- --
-- 133
Labette (Parsons silt loam) cont. 3 100 109 133 --
Republic County1 (Crete silt loam)
C-SB cont.
4 4
155 135 -- -- 156
132Republic County (Crete silt loam) W-C4 3 100 114 -- --
Harvey County (Ladysmith silty clay loam) W-C 8 69 -- 74 --
Stafford County (loamy fine sand) cont. 4 164 -- -- 172
Thomas County (Keith silt loam)
WCF5 cont.6
4 2
75 217
-- 226
71 --
67 206
1 Irrigated, 2 Corn/Soybean, 3 Continuous corn, 4 Wheat/Corn, 5 Wheat/Corn/Fallow, 6 Limited Irrigation (9½ in.), * 4 sites, 3 years
12
percent of the time, strip-till corn performed no differently than corn with no tillage or conventional tillage. However, with wet planting conditions, strip-till corn performed better than that grown with no-till because the soil dried faster, resulting in better seed slot closure and improved plant stands. With persistently dry conditions, strip-tilled corn performed better than corn planted with conventional tillage because of better soil moisture conservation. For more information on strip-tillage, see K-State Research and Extension publication, Considering Strip-Tillage, MF-2661.
Strip-till requires specialized equipment. Different configu-rations are available from the various equipment manufacturers. However, the basic design consists of coulters, residue managers, disks, and a sub-surface knife for injecting fertilizer.
Planting DatePlanting corn early is important to use the entire growing
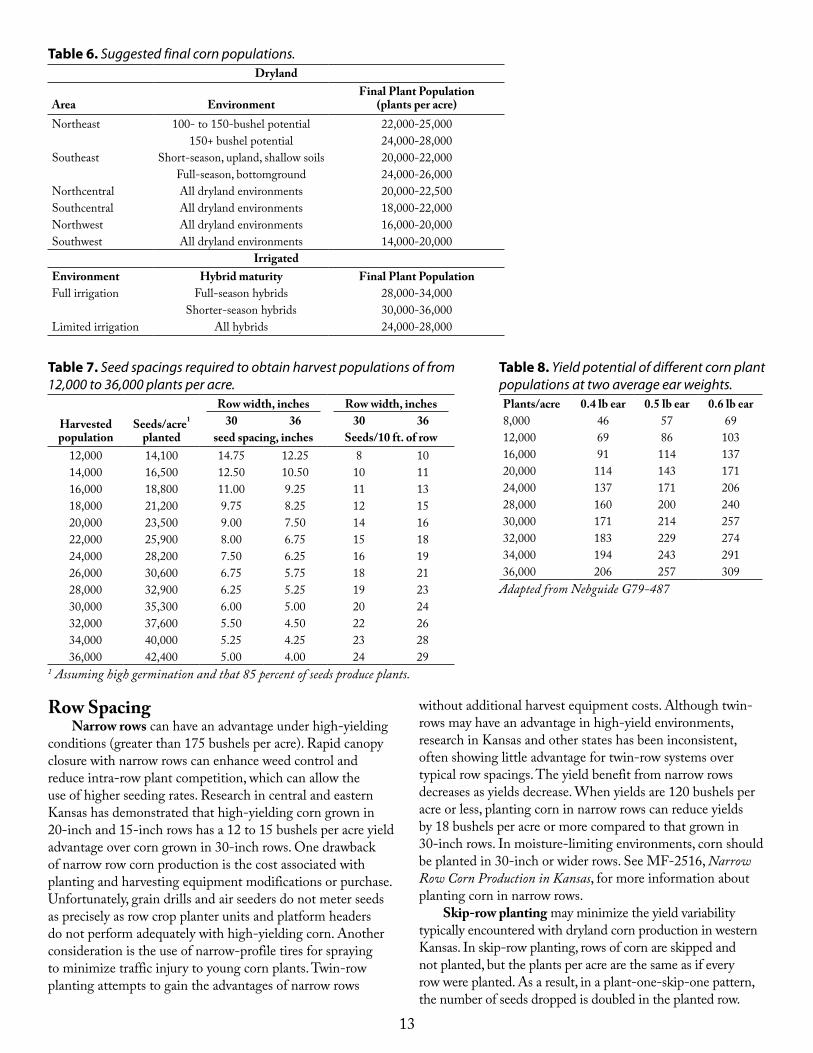
season and maximize yield. Planting dates range from late March in southeastern counties to mid-May in northwest Kansas (Figure 6). Many producers use soil temperature to determine planting time. Planting when the soil temperature reaches 55 degrees Fahrenheit at a 2-inch depth at mid-day can be an excellent guide early in the planting season, provided the weather outlook for the following weeks is favor-able. Late-planted corn is taller than corn planted at optimum times and often is used for silage. Although taller, total dry matter production is lower with late plantings and producers need to be aware of typically lower silage and grain yields. Hybrids respond differently to varied planting dates. In high-yielding environments, full-season hybrids planted at dates to optimize use of the entire growing season typically have a greater yield potential than short-season hybrids. In mois-ture-limited or high-stress environments, planting an early to medium-maturing hybrid (100 to 112 day relative maturity) at the extreme early end of the recommended planting windows suggested in Figure 6 may allow the corn to be in its reproductive and grain filling stages before heat and drought stresses usually occur in Kansas. This strategy is effective only if temperatures allow germination and emergence to proceed soon after those earlier planting dates.
Plant PopulationsOptimum plant populations depend on the yields a
particular environment will permit. This explains the wide range in recommended plant populations across the state. The desired plant population for dryland corn in a wheat-corn-fallow rotation in northwestern Kansas may be only 16,000 to 20,000 plants per acre; whereas dryland corn in northeastern Kansas may require 22,000 to 25,000 plants per acre or more to maximize yield (Table 6). Most irrigated corn plant popula-tions will range from 28,000 to 34,000 plants per acre, with some as high 36,000 plants per acre. If irrigation is limited, the desired plant population may range from 24,000 to 28,000 plants per acre, depending primarily on soil type and amount of available water.
The picture is made more complex by the interaction of yield response to plant population with other management practices and environmental conditions. Dramatic changes in temperatures and rainfall resulting in erratic yield levels often are observed from one year to the next in a particular area. This is especially true for dryland corn in central and western Kansas. Populations somewhat lower than those listed in Table 6 may, in fact, result in more consistent dryland yields in western Kansas. But with lower populations, yields may be limited if growing conditions are good. Optimal seeding rates may need to be adjusted for irrigated corn if fertilizer or irri-gation rates are sharply increased or decreased. For example, research at the Irrigation Experiment Field near Scandia has shown that if fertilizer rates are increased, seeding rates also should be increased to realize the maximum yield benefit.
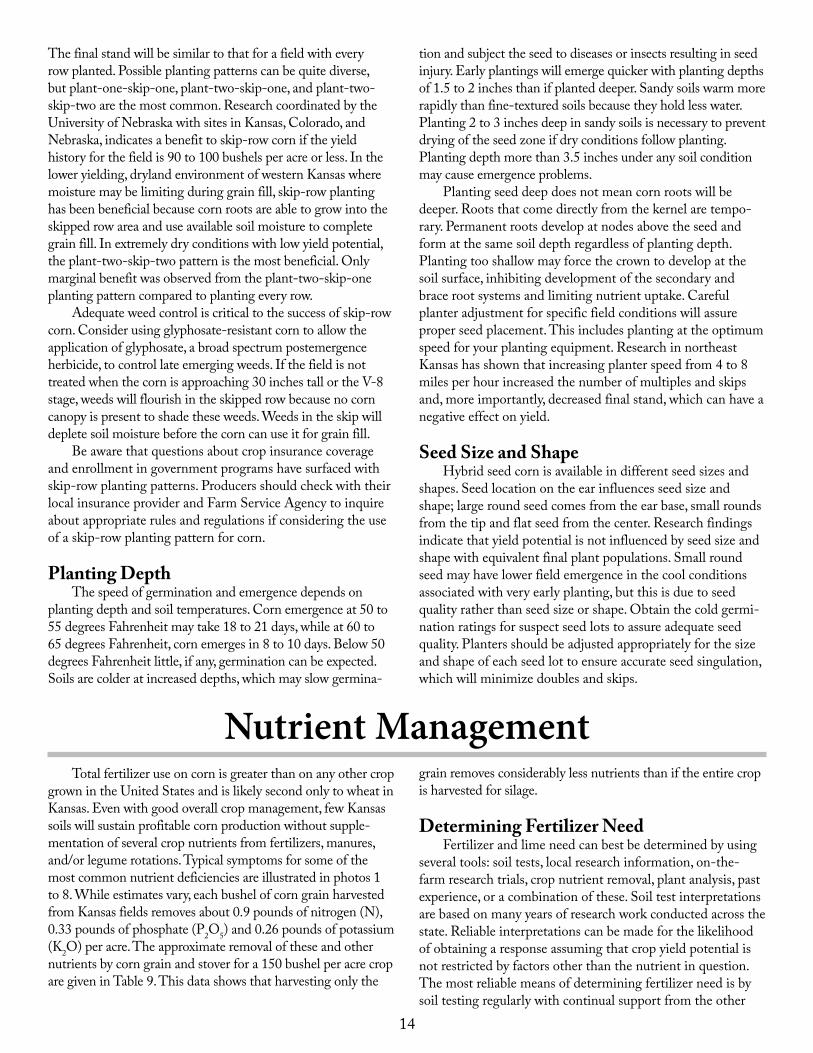
The final or harvest plant population is approximately 85 percent of the planting rate. For example, if a harvest population of 24,000 plants per acre is desired, the seeding rate should be 28,200 seeds per acre to obtain that population (Table 7). Corn can compensate by producing larger ears if populations are too low to use growing conditions. Table 8 shows the estimated yield potential for different plant populations and ear weights. An average ear weight is near 0.5 pound, but smaller ears are more likely with high populations or less favorable growing conditions. (See K-State Research and Extension publication Kansas Crop Planting Guide, L-818.)
Hybrids also respond differently to plant populations. When the population is too high, some hybrids will have barren stalks and produce lower grain yields. Shorter-season hybrids should have final stands that are 10 to 15 percent higher than those suggested for full-season hybrids in the same environ-ment. In addition to yield differences, the effect of population on root and stalk lodging should be noted. Lodging increases as populations increase, but the problem is more severe with some hybrids. Consult seed company recommendations for desired plant populations of specific hybrids.
Zone 1 April 25-May 15Zone 2 April 15-May 10Zone 3 April 1-May 5Zone 4 March 20-April 25
Figure 6. Suggested corn planting dates.
13
Row SpacingNarrow rows can have an advantage under high-yielding
conditions (greater than 175 bushels per acre). Rapid canopy closure with narrow rows can enhance weed control and reduce intra-row plant competition, which can allow the use of higher seeding rates. Research in central and eastern Kansas has demonstrated that high-yielding corn grown in 20-inch and 15-inch rows has a 12 to 15 bushels per acre yield advantage over corn grown in 30-inch rows. One drawback of narrow row corn production is the cost associated with planting and harvesting equipment modifications or purchase. Unfortunately, grain drills and air seeders do not meter seeds as precisely as row crop planter units and platform headers do not perform adequately with high-yielding corn. Another consideration is the use of narrow-profile tires for spraying to minimize traffic injury to young corn plants. Twin-row planting attempts to gain the advantages of narrow rows
without additional harvest equipment costs. Although twin-rows may have an advantage in high-yield environments, research in Kansas and other states has been inconsistent, often showing little advantage for twin-row systems over typical row spacings. The yield benefit from narrow rows decreases as yields decrease. When yields are 120 bushels per acre or less, planting corn in narrow rows can reduce yields by 18 bushels per acre or more compared to that grown in 30-inch rows. In moisture-limiting environments, corn should be planted in 30-inch or wider rows. See MF-2516, Narrow Row Corn Production in Kansas, for more information about planting corn in narrow rows.
Skip-row planting may minimize the yield variability typically encountered with dryland corn production in western Kansas. In skip-row planting, rows of corn are skipped and not planted, but the plants per acre are the same as if every row were planted. As a result, in a plant-one-skip-one pattern, the number of seeds dropped is doubled in the planted row.
Table 6. Suggested final corn populations.Dryland
Area EnvironmentFinal Plant Population
(plants per acre)Northeast 100- to 150-bushel potential 22,000-25,000
150+ bushel potential 24,000-28,000Southeast Short-season, upland, shallow soils 20,000-22,000
Full-season, bottomground 24,000-26,000Northcentral All dryland environments 20,000-22,500Southcentral All dryland environments 18,000-22,000Northwest All dryland environments 16,000-20,000Southwest All dryland environments 14,000-20,000
IrrigatedEnvironment Hybrid maturity Final Plant PopulationFull irrigation Full-season hybrids 28,000-34,000
Shorter-season hybrids 30,000-36,000Limited irrigation All hybrids 24,000-28,000
Table 7. Seed spacings required to obtain harvest populations of from 12,000 to 36,000 plants per acre.
Harvested population
Seeds/acre1 planted
Row width, inches Row width, inches30 36 30 36
seed spacing, inches Seeds/10 ft. of row12,000 14,100 14.75 12.25 8 1014,000 16,500 12.50 10.50 10 1116,000 18,800 11.00 9.25 11 1318,000 21,200 9.75 8.25 12 1520,000 23,500 9.00 7.50 14 1622,000 25,900 8.00 6.75 15 1824,000 28,200 7.50 6.25 16 1926,000 30,600 6.75 5.75 18 2128,000 32,900 6.25 5.25 19 2330,000 35,300 6.00 5.00 20 2432,000 37,600 5.50 4.50 22 2634,000 40,000 5.25 4.25 23 2836,000 42,400 5.00 4.00 24 29
1 Assuming high germination and that 85 percent of seeds produce plants.
Table 8. Yield potential of different corn plant populations at two average ear weights.Plants/acre 0.4 lb ear 0.5 lb ear 0.6 lb ear8,000 46 57 6912,000 69 86 10316,000 91 114 13720,000 114 143 17124,000 137 171 20628,000 160 200 24030,000 171 214 25732,000 183 229 27434,000 194 243 29136,000 206 257 309
Adapted from Nebguide G79-487
14
Nutrient ManagementTotal fertilizer use on corn is greater than on any other crop
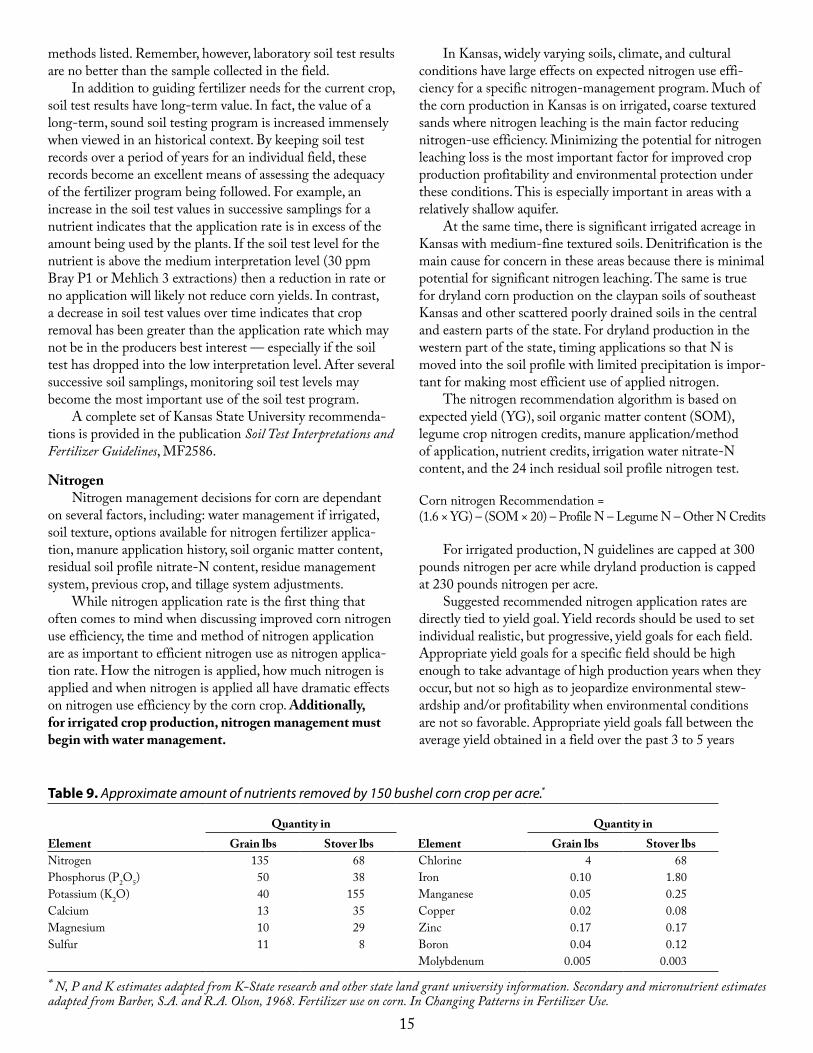
grown in the United States and is likely second only to wheat in Kansas. Even with good overall crop management, few Kansas soils will sustain profitable corn production without supple-mentation of several crop nutrients from fertilizers, manures, and/or legume rotations. Typical symptoms for some of the most common nutrient deficiencies are illustrated in photos 1 to 8. While estimates vary, each bushel of corn grain harvested from Kansas fields removes about 0.9 pounds of nitrogen (N), 0.33 pounds of phosphate (P2O5) and 0.26 pounds of potassium (K2O) per acre. The approximate removal of these and other nutrients by corn grain and stover for a 150 bushel per acre crop are given in Table 9. This data shows that harvesting only the
grain removes considerably less nutrients than if the entire crop is harvested for silage.
Determining Fertilizer NeedFertilizer and lime need can best be determined by using
several tools: soil tests, local research information, on-the-farm research trials, crop nutrient removal, plant analysis, past experience, or a combination of these. Soil test interpretations are based on many years of research work conducted across the state. Reliable interpretations can be made for the likelihood of obtaining a response assuming that crop yield potential is not restricted by factors other than the nutrient in question. The most reliable means of determining fertilizer need is by soil testing regularly with continual support from the other
The final stand will be similar to that for a field with every row planted. Possible planting patterns can be quite diverse, but plant-one-skip-one, plant-two-skip-one, and plant-two-skip-two are the most common. Research coordinated by the University of Nebraska with sites in Kansas, Colorado, and Nebraska, indicates a benefit to skip-row corn if the yield history for the field is 90 to 100 bushels per acre or less. In the lower yielding, dryland environment of western Kansas where moisture may be limiting during grain fill, skip-row planting has been beneficial because corn roots are able to grow into the skipped row area and use available soil moisture to complete grain fill. In extremely dry conditions with low yield potential, the plant-two-skip-two pattern is the most beneficial. Only marginal benefit was observed from the plant-two-skip-one planting pattern compared to planting every row.
Adequate weed control is critical to the success of skip-row corn. Consider using glyphosate-resistant corn to allow the application of glyphosate, a broad spectrum postemergence herbicide, to control late emerging weeds. If the field is not treated when the corn is approaching 30 inches tall or the V-8 stage, weeds will flourish in the skipped row because no corn canopy is present to shade these weeds. Weeds in the skip will deplete soil moisture before the corn can use it for grain fill.
Be aware that questions about crop insurance coverage and enrollment in government programs have surfaced with skip-row planting patterns. Producers should check with their local insurance provider and Farm Service Agency to inquire about appropriate rules and regulations if considering the use of a skip-row planting pattern for corn.
Planting DepthThe speed of germination and emergence depends on
planting depth and soil temperatures. Corn emergence at 50 to 55 degrees Fahrenheit may take 18 to 21 days, while at 60 to 65 degrees Fahrenheit, corn emerges in 8 to 10 days. Below 50 degrees Fahrenheit little, if any, germination can be expected. Soils are colder at increased depths, which may slow germina-
tion and subject the seed to diseases or insects resulting in seed injury. Early plantings will emerge quicker with planting depths of 1.5 to 2 inches than if planted deeper. Sandy soils warm more rapidly than fine-textured soils because they hold less water. Planting 2 to 3 inches deep in sandy soils is necessary to prevent drying of the seed zone if dry conditions follow planting. Planting depth more than 3.5 inches under any soil condition may cause emergence problems.
Planting seed deep does not mean corn roots will be deeper. Roots that come directly from the kernel are tempo-rary. Permanent roots develop at nodes above the seed and form at the same soil depth regardless of planting depth. Planting too shallow may force the crown to develop at the soil surface, inhibiting development of the secondary and brace root systems and limiting nutrient uptake. Careful planter adjustment for specific field conditions will assure proper seed placement. This includes planting at the optimum speed for your planting equipment. Research in northeast Kansas has shown that increasing planter speed from 4 to 8 miles per hour increased the number of multiples and skips and, more importantly, decreased final stand, which can have a negative effect on yield.
Seed Size and ShapeHybrid seed corn is available in different seed sizes and
shapes. Seed location on the ear influences seed size and shape; large round seed comes from the ear base, small rounds from the tip and flat seed from the center. Research findings indicate that yield potential is not influenced by seed size and shape with equivalent final plant populations. Small round seed may have lower field emergence in the cool conditions associated with very early planting, but this is due to seed quality rather than seed size or shape. Obtain the cold germi-nation ratings for suspect seed lots to assure adequate seed quality. Planters should be adjusted appropriately for the size and shape of each seed lot to ensure accurate seed singulation, which will minimize doubles and skips.
15
Table 9. Approximate amount of nutrients removed by 150 bushel corn crop per acre.*
ElementQuantity in
ElementQuantity in
Grain lbs Stover lbs Grain lbs Stover lbsNitrogen 135 68 Chlorine 4 68Phosphorus (P2O5) 50 38 Iron 0.10 1.80Potassium (K2O) 40 155 Manganese 0.05 0.25Calcium 13 35 Copper 0.02 0.08Magnesium 10 29 Zinc 0.17 0.17Sulfur 11 8 Boron 0.04 0.12
Molybdenum 0.005 0.003
* N, P and K estimates adapted from K-State research and other state land grant university information. Secondary and micronutrient estimates adapted from Barber, S.A. and R.A. Olson, 1968. Fertilizer use on corn. In Changing Patterns in Fertilizer Use.
methods listed. Remember, however, laboratory soil test results are no better than the sample collected in the field.
In addition to guiding fertilizer needs for the current crop, soil test results have long-term value. In fact, the value of a long-term, sound soil testing program is increased immensely when viewed in an historical context. By keeping soil test records over a period of years for an individual field, these records become an excellent means of assessing the adequacy of the fertilizer program being followed. For example, an increase in the soil test values in successive samplings for a nutrient indicates that the application rate is in excess of the amount being used by the plants. If the soil test level for the nutrient is above the medium interpretation level (30 ppm Bray P1 or Mehlich 3 extractions) then a reduction in rate or no application will likely not reduce corn yields. In contrast, a decrease in soil test values over time indicates that crop removal has been greater than the application rate which may not be in the producers best interest — especially if the soil test has dropped into the low interpretation level. After several successive soil samplings, monitoring soil test levels may become the most important use of the soil test program.
A complete set of Kansas State University recommenda-tions is provided in the publication Soil Test Interpretations and Fertilizer Guidelines, MF2586.
NitrogenNitrogen management decisions for corn are dependant
on several factors, including: water management if irrigated, soil texture, options available for nitrogen fertilizer applica-tion, manure application history, soil organic matter content, residual soil profile nitrate-N content, residue management system, previous crop, and tillage system adjustments.
While nitrogen application rate is the first thing that often comes to mind when discussing improved corn nitrogen use efficiency, the time and method of nitrogen application are as important to efficient nitrogen use as nitrogen applica-tion rate. How the nitrogen is applied, how much nitrogen is applied and when nitrogen is applied all have dramatic effects on nitrogen use efficiency by the corn crop. Additionally, for irrigated crop production, nitrogen management must begin with water management.
In Kansas, widely varying soils, climate, and cultural conditions have large effects on expected nitrogen use effi-ciency for a specific nitrogen-management program. Much of the corn production in Kansas is on irrigated, coarse textured sands where nitrogen leaching is the main factor reducing nitrogen-use efficiency. Minimizing the potential for nitrogen leaching loss is the most important factor for improved crop production profitability and environmental protection under these conditions. This is especially important in areas with a relatively shallow aquifer.
At the same time, there is significant irrigated acreage in Kansas with medium-fine textured soils. Denitrification is the main cause for concern in these areas because there is minimal potential for significant nitrogen leaching. The same is true for dryland corn production on the claypan soils of southeast Kansas and other scattered poorly drained soils in the central and eastern parts of the state. For dryland production in the western part of the state, timing applications so that N is moved into the soil profile with limited precipitation is impor-tant for making most efficient use of applied nitrogen.
The nitrogen recommendation algorithm is based on expected yield (YG), soil organic matter content (SOM), legume crop nitrogen credits, manure application/method of application, nutrient credits, irrigation water nitrate-N content, and the 24 inch residual soil profile nitrogen test.
Corn nitrogen Recommendation = (1.6 × YG) – (SOM × 20) – Profile N – Legume N – Other N Credits
For irrigated production, N guidelines are capped at 300 pounds nitrogen per acre while dryland production is capped at 230 pounds nitrogen per acre.
Suggested recommended nitrogen application rates are directly tied to yield goal. Yield records should be used to set individual realistic, but progressive, yield goals for each field. Appropriate yield goals for a specific field should be high enough to take advantage of high production years when they occur, but not so high as to jeopardize environmental stew-ardship and/or profitability when environmental conditions are not so favorable. Appropriate yield goals fall between the average yield obtained in a field over the past 3 to 5 years
16
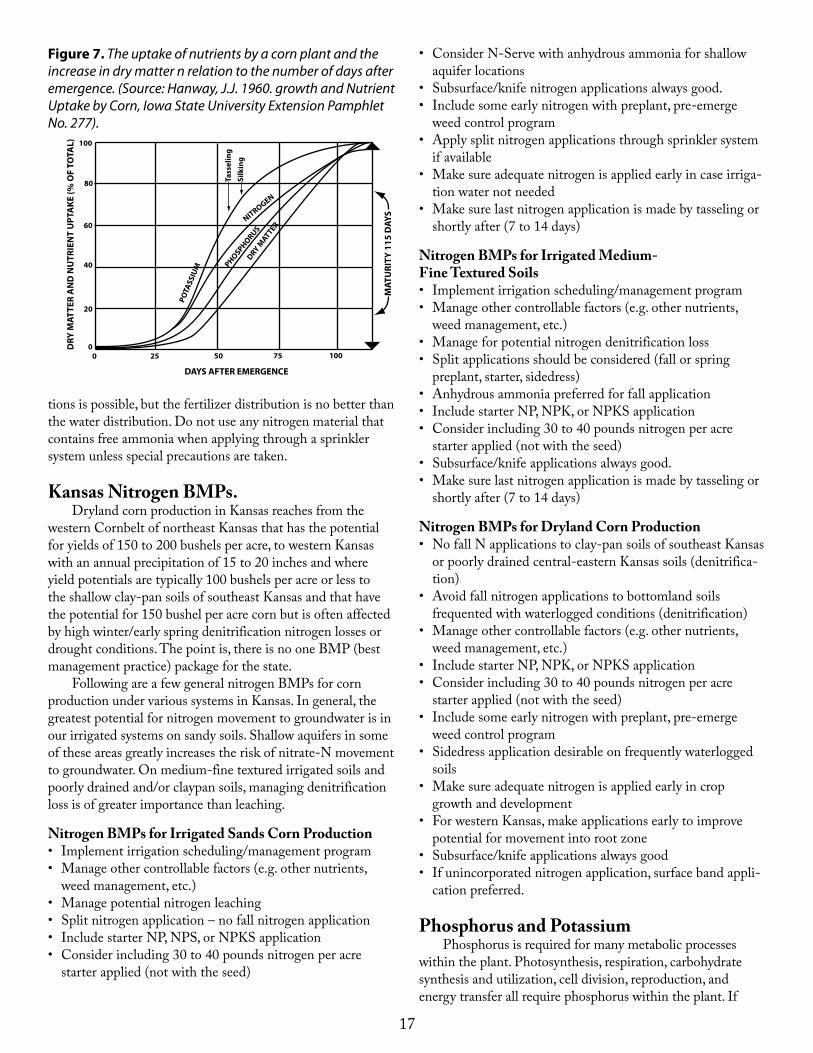
Table 11. Likelihood Of Significant Profile Nitrogen Carryover
Higher Probability Of Significant Profile Nitrogen – Profile Nitrogen Test More Valuable
Lower Probability Of Significant Profile Nitrogen – Profile Nitrogen Test Less Valuable
• Medium-Fine Textured Soils • Sandy soils• Recent History Of Excessive N Rates • Appropriate N Rate History• Previous Crop • Previous Crop
• Lower than expected yield • Soybeans (immediately preceding)• Drought affected • Higher than expected yield history• Fallow • Expected yields history• Previously destroyed stands of alfalfa/clovers • Excessive Precipitation
• Manure Application or History • No Manure or Biosolid Application History• Warm, Late Falls and/or Early, Warm Springs • Increased Rotation Intensity
to near the highest yield obtained in a specific field. The producer should set the individual field yield goals.
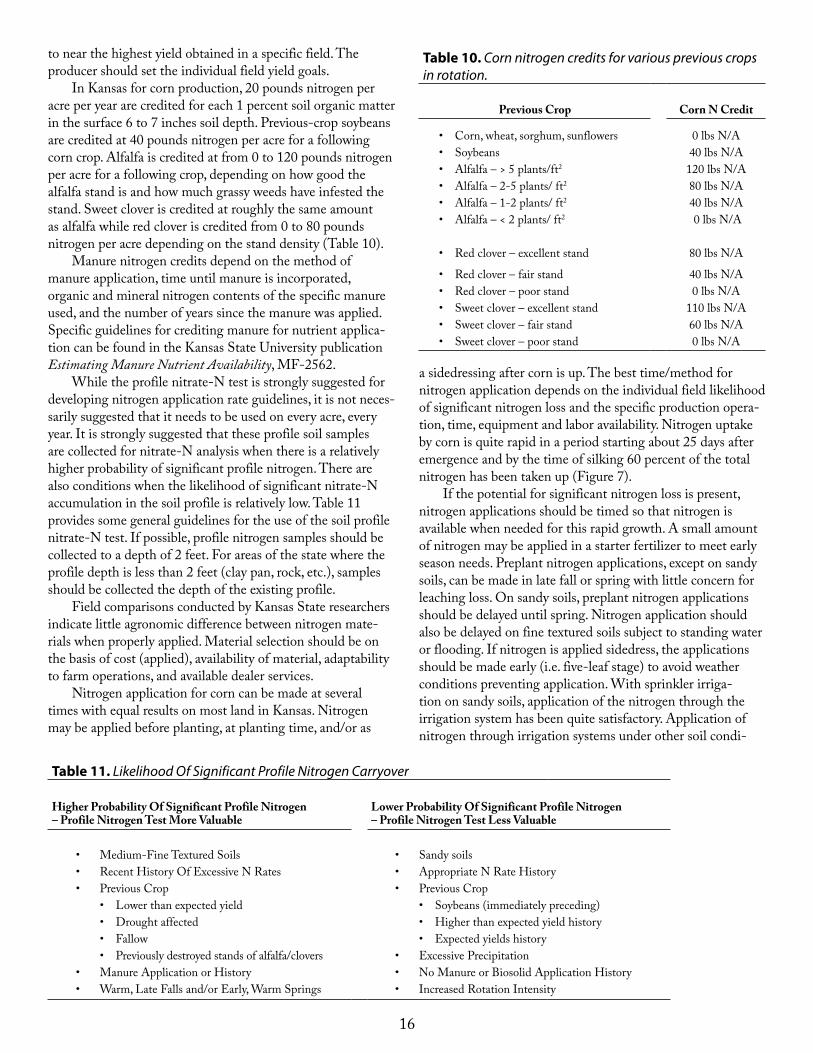
In Kansas for corn production, 20 pounds nitrogen per acre per year are credited for each 1 percent soil organic matter in the surface 6 to 7 inches soil depth. Previous-crop soybeans are credited at 40 pounds nitrogen per acre for a following corn crop. Alfalfa is credited at from 0 to 120 pounds nitrogen per acre for a following crop, depending on how good the alfalfa stand is and how much grassy weeds have infested the stand. Sweet clover is credited at roughly the same amount as alfalfa while red clover is credited from 0 to 80 pounds nitrogen per acre depending on the stand density (Table 10).
Manure nitrogen credits depend on the method of manure application, time until manure is incorporated, organic and mineral nitrogen contents of the specific manure used, and the number of years since the manure was applied. Specific guidelines for crediting manure for nutrient applica-tion can be found in the Kansas State University publication Estimating Manure Nutrient Availability, MF-2562.
While the profile nitrate-N test is strongly suggested for developing nitrogen application rate guidelines, it is not neces-sarily suggested that it needs to be used on every acre, every year. It is strongly suggested that these profile soil samples are collected for nitrate-N analysis when there is a relatively higher probability of significant profile nitrogen. There are also conditions when the likelihood of significant nitrate-N accumulation in the soil profile is relatively low. Table 11 provides some general guidelines for the use of the soil profile nitrate-N test. If possible, profile nitrogen samples should be collected to a depth of 2 feet. For areas of the state where the profile depth is less than 2 feet (clay pan, rock, etc.), samples should be collected the depth of the existing profile.
Field comparisons conducted by Kansas State researchers indicate little agronomic difference between nitrogen mate-rials when properly applied. Material selection should be on the basis of cost (applied), availability of material, adaptability to farm operations, and available dealer services.
Nitrogen application for corn can be made at several times with equal results on most land in Kansas. Nitrogen may be applied before planting, at planting time, and/or as
a sidedressing after corn is up. The best time/method for nitrogen application depends on the individual field likelihood of significant nitrogen loss and the specific production opera-tion, time, equipment and labor availability. Nitrogen uptake by corn is quite rapid in a period starting about 25 days after emergence and by the time of silking 60 percent of the total nitrogen has been taken up (Figure 7).
If the potential for significant nitrogen loss is present, nitrogen applications should be timed so that nitrogen is available when needed for this rapid growth. A small amount of nitrogen may be applied in a starter fertilizer to meet early season needs. Preplant nitrogen applications, except on sandy soils, can be made in late fall or spring with little concern for leaching loss. On sandy soils, preplant nitrogen applications should be delayed until spring. Nitrogen application should also be delayed on fine textured soils subject to standing water or flooding. If nitrogen is applied sidedress, the applications should be made early (i.e. five-leaf stage) to avoid weather conditions preventing application. With sprinkler irriga-tion on sandy soils, application of the nitrogen through the irrigation system has been quite satisfactory. Application of nitrogen through irrigation systems under other soil condi-
Table 10. Corn nitrogen credits for various previous crops in rotation.
Previous Crop Corn N Credit
• Corn, wheat, sorghum, sunflowers 0 lbs N/A• Soybeans 40 lbs N/A• Alfalfa – > 5 plants/ft2 120 lbs N/A• Alfalfa – 2-5 plants/ ft2 80 lbs N/A• Alfalfa – 1-2 plants/ ft2 40 lbs N/A• Alfalfa – < 2 plants/ ft2 0 lbs N/A
• Red clover – excellent stand 80 lbs N/A
• Red clover – fair stand 40 lbs N/A• Red clover – poor stand 0 lbs N/A• Sweet clover – excellent stand 110 lbs N/A• Sweet clover – fair stand 60 lbs N/A• Sweet clover – poor stand 0 lbs N/A
17
tions is possible, but the fertilizer distribution is no better than the water distribution. Do not use any nitrogen material that contains free ammonia when applying through a sprinkler system unless special precautions are taken.
Kansas Nitrogen BMPs.Dryland corn production in Kansas reaches from the
western Cornbelt of northeast Kansas that has the potential for yields of 150 to 200 bushels per acre, to western Kansas with an annual precipitation of 15 to 20 inches and where yield potentials are typically 100 bushels per acre or less to the shallow clay-pan soils of southeast Kansas and that have the potential for 150 bushel per acre corn but is often affected by high winter/early spring denitrification nitrogen losses or drought conditions. The point is, there is no one BMP (best management practice) package for the state.
Following are a few general nitrogen BMPs for corn production under various systems in Kansas. In general, the greatest potential for nitrogen movement to groundwater is in our irrigated systems on sandy soils. Shallow aquifers in some of these areas greatly increases the risk of nitrate-N movement to groundwater. On medium-fine textured irrigated soils and poorly drained and/or claypan soils, managing denitrification loss is of greater importance than leaching.
Nitrogen BMPs for Irrigated Sands Corn Production• Implement irrigation scheduling/management program• Manage other controllable factors (e.g. other nutrients,
weed management, etc.)• Manage potential nitrogen leaching• Split nitrogen application – no fall nitrogen application• Include starter NP, NPS, or NPKS application• Consider including 30 to 40 pounds nitrogen per acre
starter applied (not with the seed)
• Consider N-Serve with anhydrous ammonia for shallow aquifer locations
• Subsurface/knife nitrogen applications always good.• Include some early nitrogen with preplant, pre-emerge
weed control program• Apply split nitrogen applications through sprinkler system
if available• Make sure adequate nitrogen is applied early in case irriga-
tion water not needed• Make sure last nitrogen application is made by tasseling or
shortly after (7 to 14 days)
Nitrogen BMPs for Irrigated Medium-Fine Textured Soils• Implement irrigation scheduling/management program• Manage other controllable factors (e.g. other nutrients,
weed management, etc.)• Manage for potential nitrogen denitrification loss• Split applications should be considered (fall or spring
preplant, starter, sidedress)• Anhydrous ammonia preferred for fall application• Include starter NP, NPK, or NPKS application• Consider including 30 to 40 pounds nitrogen per acre
starter applied (not with the seed)• Subsurface/knife applications always good.• Make sure last nitrogen application is made by tasseling or
shortly after (7 to 14 days)
Nitrogen BMPs for Dryland Corn Production• No fall N applications to clay-pan soils of southeast Kansas
or poorly drained central-eastern Kansas soils (denitrifica-tion)
• Avoid fall nitrogen applications to bottomland soils frequented with waterlogged conditions (denitrification)
• Manage other controllable factors (e.g. other nutrients, weed management, etc.)
• Include starter NP, NPK, or NPKS application• Consider including 30 to 40 pounds nitrogen per acre
starter applied (not with the seed)• Include some early nitrogen with preplant, pre-emerge
weed control program• Sidedress application desirable on frequently waterlogged
soils• Make sure adequate nitrogen is applied early in crop
growth and development• For western Kansas, make applications early to improve
potential for movement into root zone• Subsurface/knife applications always good • If unincorporated nitrogen application, surface band appli-
cation preferred.
Phosphorus and PotassiumPhosphorus is required for many metabolic processes
within the plant. Photosynthesis, respiration, carbohydrate synthesis and utilization, cell division, reproduction, and energy transfer all require phosphorus within the plant. If
DRY
MAT
TER
AN
D N
UTR
IEN
T U
PTA
KE (%
OF
TOTA
L) 100
80
60
40
20
00 100755025
DAYS AFTER EMERGENCE
MAT
URI
TY 1
15 D
AYS
POTA
SSIU
M PHOSPHORUS
NITROGEN
DRY MATTER
Tass
elin
g
Silk
ing
Figure 7. The uptake of nutrients by a corn plant and the increase in dry matter n relation to the number of days after emergence. (Source: Hanway, J.J. 1960. growth and Nutrient Uptake by Corn, Iowa State University Extension Pamphlet No. 277).
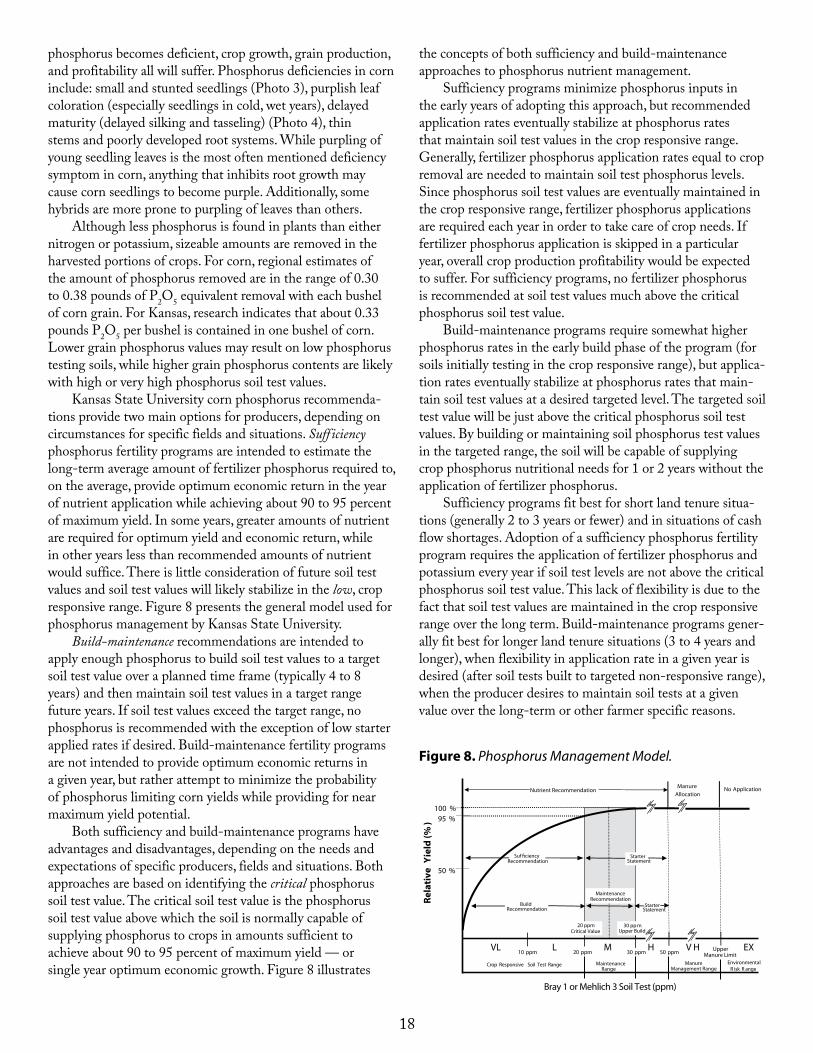
18
Rela
tive
Yie
ld (%
)
VL L M H V H
100 %95 %
50 %
50 ppm
Crop Responsive Soil Test Range Maintenance Range
ManureManagement Range
EnvironmentalR isk R ange
EX
No ApplicationManureAllocation
10 ppm 20 ppm 30 ppm
20 ppmCritical Value
30 pp mUpper Build
BuildRecommendation
Suf �ciencyRecommendation
MaintenanceRecommendation
StarterStatement
StarterStatement
Bray 1 or Mehlich 3 Soil Test (ppm)
Nutrient Recommendation
UpperManure Limit
Figure 8. Phosphorus Management Model.
phosphorus becomes deficient, crop growth, grain production, and profitability all will suffer. Phosphorus deficiencies in corn include: small and stunted seedlings (Photo 3), purplish leaf coloration (especially seedlings in cold, wet years), delayed maturity (delayed silking and tasseling) (Photo 4), thin stems and poorly developed root systems. While purpling of young seedling leaves is the most often mentioned deficiency symptom in corn, anything that inhibits root growth may cause corn seedlings to become purple. Additionally, some hybrids are more prone to purpling of leaves than others.
Although less phosphorus is found in plants than either nitrogen or potassium, sizeable amounts are removed in the harvested portions of crops. For corn, regional estimates of the amount of phosphorus removed are in the range of 0.30 to 0.38 pounds of P2O5 equivalent removal with each bushel of corn grain. For Kansas, research indicates that about 0.33 pounds P2O5 per bushel is contained in one bushel of corn. Lower grain phosphorus values may result on low phosphorus testing soils, while higher grain phosphorus contents are likely with high or very high phosphorus soil test values.
Kansas State University corn phosphorus recommenda-tions provide two main options for producers, depending on circumstances for specific fields and situations. Sufficiency phosphorus fertility programs are intended to estimate the long-term average amount of fertilizer phosphorus required to, on the average, provide optimum economic return in the year of nutrient application while achieving about 90 to 95 percent of maximum yield. In some years, greater amounts of nutrient are required for optimum yield and economic return, while in other years less than recommended amounts of nutrient would suffice. There is little consideration of future soil test values and soil test values will likely stabilize in the low, crop responsive range. Figure 8 presents the general model used for phosphorus management by Kansas State University.
Build-maintenance recommendations are intended to apply enough phosphorus to build soil test values to a target soil test value over a planned time frame (typically 4 to 8 years) and then maintain soil test values in a target range future years. If soil test values exceed the target range, no phosphorus is recommended with the exception of low starter applied rates if desired. Build-maintenance fertility programs are not intended to provide optimum economic returns in a given year, but rather attempt to minimize the probability of phosphorus limiting corn yields while providing for near maximum yield potential.
Both sufficiency and build-maintenance programs have advantages and disadvantages, depending on the needs and expectations of specific producers, fields and situations. Both approaches are based on identifying the critical phosphorus soil test value. The critical soil test value is the phosphorus soil test value above which the soil is normally capable of supplying phosphorus to crops in amounts sufficient to achieve about 90 to 95 percent of maximum yield — or single year optimum economic growth. Figure 8 illustrates
the concepts of both sufficiency and build-maintenance approaches to phosphorus nutrient management.
Sufficiency programs minimize phosphorus inputs in the early years of adopting this approach, but recommended application rates eventually stabilize at phosphorus rates that maintain soil test values in the crop responsive range. Generally, fertilizer phosphorus application rates equal to crop removal are needed to maintain soil test phosphorus levels. Since phosphorus soil test values are eventually maintained in the crop responsive range, fertilizer phosphorus applications are required each year in order to take care of crop needs. If fertilizer phosphorus application is skipped in a particular year, overall crop production profitability would be expected to suffer. For sufficiency programs, no fertilizer phosphorus is recommended at soil test values much above the critical phosphorus soil test value.
Build-maintenance programs require somewhat higher phosphorus rates in the early build phase of the program (for soils initially testing in the crop responsive range), but applica-tion rates eventually stabilize at phosphorus rates that main-tain soil test values at a desired targeted level. The targeted soil test value will be just above the critical phosphorus soil test values. By building or maintaining soil phosphorus test values in the targeted range, the soil will be capable of supplying crop phosphorus nutritional needs for 1 or 2 years without the application of fertilizer phosphorus.
Sufficiency programs fit best for short land tenure situa-tions (generally 2 to 3 years or fewer) and in situations of cash flow shortages. Adoption of a sufficiency phosphorus fertility program requires the application of fertilizer phosphorus and potassium every year if soil test levels are not above the critical phosphorus soil test value. This lack of flexibility is due to the fact that soil test values are maintained in the crop responsive range over the long term. Build-maintenance programs gener-ally fit best for longer land tenure situations (3 to 4 years and longer), when flexibility in application rate in a given year is desired (after soil tests built to targeted non-responsive range), when the producer desires to maintain soil tests at a given value over the long-term or other farmer specific reasons.

19
As a result, both sufficiency and build-maintenance programs are appropriate phosphorus nutrient management strategies depending on the individual producer situations, goals and objectives for specific fields. Producers may adopt different phosphorus management approaches for individual fields within their operation.
Sufficiency phosphorus and potassium recommendations for corn are presented in Table 12. Included is the equation used to generate these guidelines. These recommendations are intended to, on the average, provide for optimum economic return in the year of application. If more phosphorus is removed in the corn grain than is supplied from various nutrient sources, soil tests values would be expected to decline over time. The information in Table 12 also provides an esti-mate of the amount of P2O5 and K2O equivalent removed in corn grain at various yield levels.
The estimated amount of P2O5 required to build phosphorus soil test values are presented in Table 13. As a general rule-of-thumb, about 18 pounds P2O5 in excess of crop removal is required to increase the Bray P-1 or Mehlich 3 soil test one part-per-million for the surface 6 inches of soil. Sandy soils and shallower tillage will typically require less and fine-textured soils containing larger amounts of clay and deeper tillage operations may require more. In addition
to the amount of phosphorus required to build up soil test phosphorus, enough P2O5 needs to be applied to replace the amount removed in the crop in order to maintain phosphorus soil tests. Crop removal is about 0.33 pounds P2O5 per bushel of corn grain removed.
Phosphorus can be applied either preplant broadcast, preplant banded with nitrogen (dual placement), placed in a starter band near the seed or placed directly with the seed. Banded applications are recognized as being most efficient, particularly when small amounts are applied on very acid or calcareous soils low in soil test phosphorus. Savings in time at seeding achieved by broadcasting rather than banding may offset lower efficiency for the broadcast application.
Starter applications can be placed in direct contact with the seed or placed to the side and below the seed (preferred). If placed in contact with the seed, the starter material should contain no more than 8 to 10 pounds per acre of nitrogen plus potash. The nitrogen and potash can cause germina-tion damage. Recently, research has shown that applying starter phosphorus mixed with 30 to 40 pounds of additional nitrogen in a surface band an 1 or 2 inches to the side of the seed slot to be an effective method of starter application for high surface residue corn production systems.
Table 12. Phosphorus and Potassium Sufficiency Recommendations for Corn Production.Phosphorus Sufficiency Recommendations for Corn1 Potassium Sufficiency Recommendations for Corn1
Mehlich 3 Bray P1Soil Test
Yield Goal (Bu/A) Yield Goal (Bu/A)
60 100 140 180 220 Exch. K 60 100 140 180 220(ppm) - –- – – – – Lb P2O5/A – – – – – – – – (ppm) - – – – – – – Lb K2O/A – – – – – – –
0-5 55 60 70 75 80 0-40 70 80 85 95 1005-10 40 45 50 55 60 40-80 45 50 55 60 6510-15 25 25 30 30 35 80-120 20 20 25 25 3015-20 15 15 15 15 15 120-130 15 15 15 15 1520+ 0 2 0 2 0 2 0 2 0 2 130+ 0 0 0 0 0
Crop Removal3
20 33 46 59 73 Crop Removal3
16 26 36 47 57
Corn Sufficiency P Rec = [ 50 + (Exp Yield × 0.2) + (Bray P × -2.5) + (Exp Yield × Bray P × -0.01) ] If Bray P is greater than 20 ppm, then only a NP or NPKS starter fertilizer suggested If Bray P is less than 20 ppm, then the minimum P Recommendation = 15 Lb P2O5/ACorn Sufficiency K Rec = [ 73 + (Exp. Yield × 0.21) + (Exch K × -0.565) + (Exp Yield × Exch K × -0.0016) ] If Exch K is greater than 130 ppm then only a NPK or NPKS starter fertilizer is suggested If Exch K is less than 130 ppm then the minimum K Recommendation = 15 Lb K2O/A
Table 13. Phosphorus Build-Maintenance Corn Recommendations
Bray P1Soil Test
4-Year Build Time FrameYield (Bu/A)
6-Year Build Time FrameYield (Bu/A)
8-Year Build Time FrameYield (Bu/A)
60 140 220 60 140 220 60 140 220(ppm) - – Lb P2O5/A – – - – Lb P2O5/A – – - – Lb P2O5/A – –
0-5 99 125 151 72 99 125 59 86 1125-10 76 102 129 57 84 110 48 74 10110-15 54 80 106 42 69 95 37 63 8915-20 31 57 84 27 54 80 25 52 78
20-30 4 20 46 73 20 46 73 20 46 7330+ 0 2 0 2 0 2 0 2 0 2 0 2 0 2 0 2 0 2
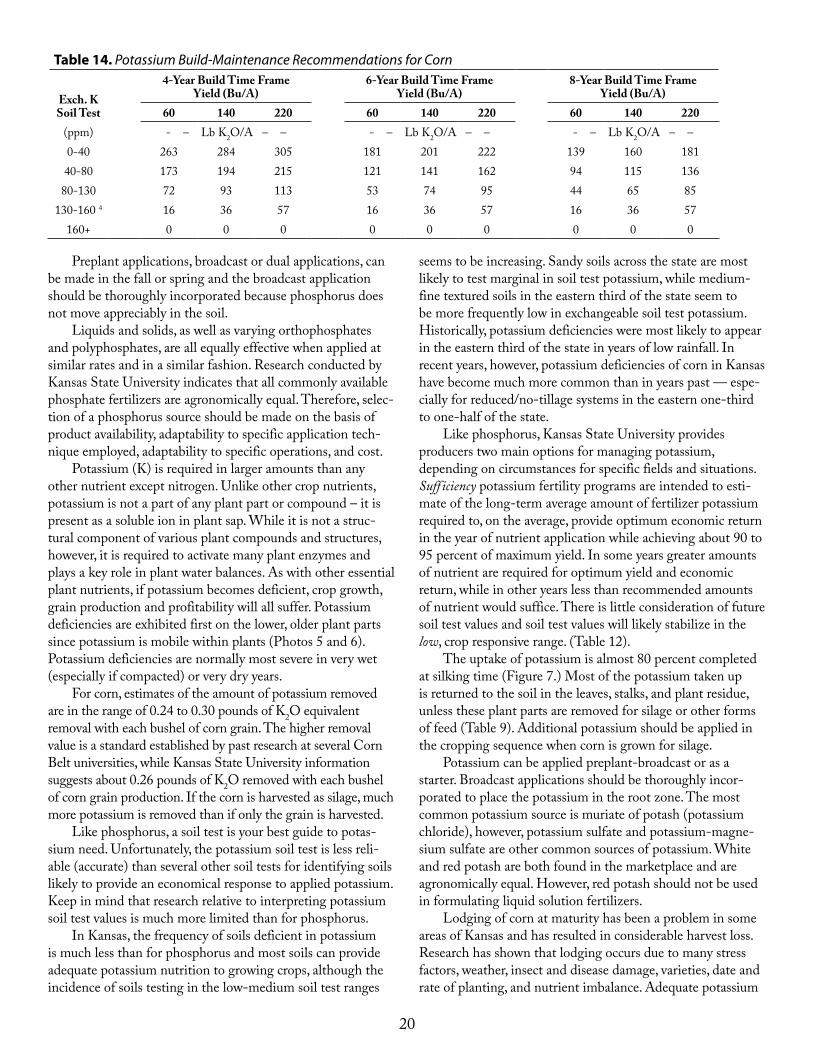
20
Preplant applications, broadcast or dual applications, can be made in the fall or spring and the broadcast application should be thoroughly incorporated because phosphorus does not move appreciably in the soil.
Liquids and solids, as well as varying orthophosphates and polyphosphates, are all equally effective when applied at similar rates and in a similar fashion. Research conducted by Kansas State University indicates that all commonly available phosphate fertilizers are agronomically equal. Therefore, selec-tion of a phosphorus source should be made on the basis of product availability, adaptability to specific application tech-nique employed, adaptability to specific operations, and cost.
Potassium (K) is required in larger amounts than any other nutrient except nitrogen. Unlike other crop nutrients, potassium is not a part of any plant part or compound – it is present as a soluble ion in plant sap. While it is not a struc-tural component of various plant compounds and structures, however, it is required to activate many plant enzymes and plays a key role in plant water balances. As with other essential plant nutrients, if potassium becomes deficient, crop growth, grain production and profitability will all suffer. Potassium deficiencies are exhibited first on the lower, older plant parts since potassium is mobile within plants (Photos 5 and 6). Potassium deficiencies are normally most severe in very wet (especially if compacted) or very dry years.
For corn, estimates of the amount of potassium removed are in the range of 0.24 to 0.30 pounds of K2O equivalent removal with each bushel of corn grain. The higher removal value is a standard established by past research at several Corn Belt universities, while Kansas State University information suggests about 0.26 pounds of K2O removed with each bushel of corn grain production. If the corn is harvested as silage, much more potassium is removed than if only the grain is harvested.
Like phosphorus, a soil test is your best guide to potas-sium need. Unfortunately, the potassium soil test is less reli-able (accurate) than several other soil tests for identifying soils likely to provide an economical response to applied potassium. Keep in mind that research relative to interpreting potassium soil test values is much more limited than for phosphorus.
In Kansas, the frequency of soils deficient in potassium is much less than for phosphorus and most soils can provide adequate potassium nutrition to growing crops, although the incidence of soils testing in the low-medium soil test ranges
seems to be increasing. Sandy soils across the state are most likely to test marginal in soil test potassium, while medium-fine textured soils in the eastern third of the state seem to be more frequently low in exchangeable soil test potassium. Historically, potassium deficiencies were most likely to appear in the eastern third of the state in years of low rainfall. In recent years, however, potassium deficiencies of corn in Kansas have become much more common than in years past — espe-cially for reduced/no-tillage systems in the eastern one-third to one-half of the state.
Like phosphorus, Kansas State University provides producers two main options for managing potassium, depending on circumstances for specific fields and situations. Sufficiency potassium fertility programs are intended to esti-mate of the long-term average amount of fertilizer potassium required to, on the average, provide optimum economic return in the year of nutrient application while achieving about 90 to 95 percent of maximum yield. In some years greater amounts of nutrient are required for optimum yield and economic return, while in other years less than recommended amounts of nutrient would suffice. There is little consideration of future soil test values and soil test values will likely stabilize in the low, crop responsive range. (Table 12).
The uptake of potassium is almost 80 percent completed at silking time (Figure 7.) Most of the potassium taken up is returned to the soil in the leaves, stalks, and plant residue, unless these plant parts are removed for silage or other forms of feed (Table 9). Additional potassium should be applied in the cropping sequence when corn is grown for silage.
Potassium can be applied preplant-broadcast or as a starter. Broadcast applications should be thoroughly incor-porated to place the potassium in the root zone. The most common potassium source is muriate of potash (potassium chloride), however, potassium sulfate and potassium-magne-sium sulfate are other common sources of potassium. White and red potash are both found in the marketplace and are agronomically equal. However, red potash should not be used in formulating liquid solution fertilizers.
Lodging of corn at maturity has been a problem in some areas of Kansas and has resulted in considerable harvest loss. Research has shown that lodging occurs due to many stress factors, weather, insect and disease damage, varieties, date and rate of planting, and nutrient imbalance. Adequate potassium
Table 14. Potassium Build-Maintenance Recommendations for Corn
Exch. KSoil Test
4-Year Build Time FrameYield (Bu/A)
6-Year Build Time FrameYield (Bu/A)
8-Year Build Time FrameYield (Bu/A)
60 140 220 60 140 220 60 140 220(ppm) - – Lb K2O/A – – - – Lb K2O/A – – - – Lb K2O/A – – 0-40 263 284 305 181 201 222 139 160 18140-80 173 194 215 121 141 162 94 115 13680-130 72 93 113 53 74 95 44 65 85
130-160 4 16 36 57 16 36 57 16 36 57160+ 0 0 0 0 0 0 0 0 0
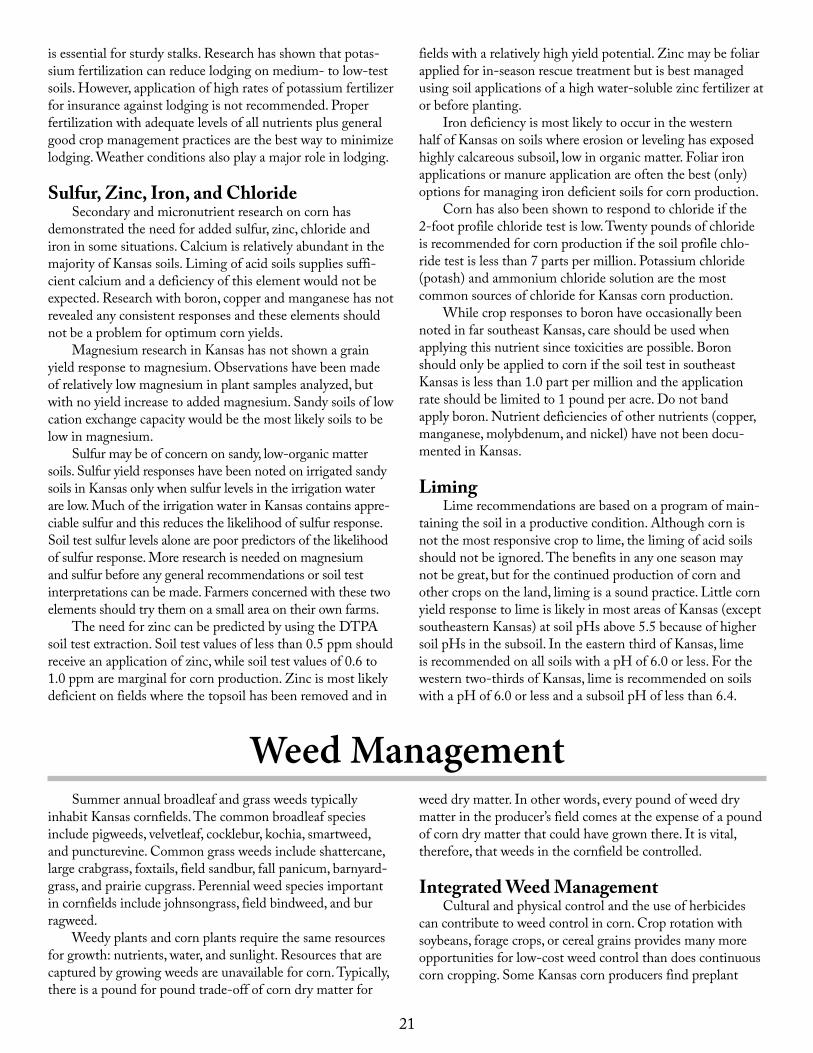
21
is essential for sturdy stalks. Research has shown that potas-sium fertilization can reduce lodging on medium- to low-test soils. However, application of high rates of potassium fertilizer for insurance against lodging is not recommended. Proper fertilization with adequate levels of all nutrients plus general good crop management practices are the best way to minimize lodging. Weather conditions also play a major role in lodging.
Sulfur, Zinc, Iron, and ChlorideSecondary and micronutrient research on corn has
demonstrated the need for added sulfur, zinc, chloride and iron in some situations. Calcium is relatively abundant in the majority of Kansas soils. Liming of acid soils supplies suffi-cient calcium and a deficiency of this element would not be expected. Research with boron, copper and manganese has not revealed any consistent responses and these elements should not be a problem for optimum corn yields.
Magnesium research in Kansas has not shown a grain yield response to magnesium. Observations have been made of relatively low magnesium in plant samples analyzed, but with no yield increase to added magnesium. Sandy soils of low cation exchange capacity would be the most likely soils to be low in magnesium.
Sulfur may be of concern on sandy, low-organic matter soils. Sulfur yield responses have been noted on irrigated sandy soils in Kansas only when sulfur levels in the irrigation water are low. Much of the irrigation water in Kansas contains appre-ciable sulfur and this reduces the likelihood of sulfur response. Soil test sulfur levels alone are poor predictors of the likelihood of sulfur response. More research is needed on magnesium and sulfur before any general recommendations or soil test interpretations can be made. Farmers concerned with these two elements should try them on a small area on their own farms.
The need for zinc can be predicted by using the DTPA soil test extraction. Soil test values of less than 0.5 ppm should receive an application of zinc, while soil test values of 0.6 to 1.0 ppm are marginal for corn production. Zinc is most likely deficient on fields where the topsoil has been removed and in
fields with a relatively high yield potential. Zinc may be foliar applied for in-season rescue treatment but is best managed using soil applications of a high water-soluble zinc fertilizer at or before planting.
Iron deficiency is most likely to occur in the western half of Kansas on soils where erosion or leveling has exposed highly calcareous subsoil, low in organic matter. Foliar iron applications or manure application are often the best (only) options for managing iron deficient soils for corn production.
Corn has also been shown to respond to chloride if the 2-foot profile chloride test is low. Twenty pounds of chloride is recommended for corn production if the soil profile chlo-ride test is less than 7 parts per million. Potassium chloride (potash) and ammonium chloride solution are the most common sources of chloride for Kansas corn production.
While crop responses to boron have occasionally been noted in far southeast Kansas, care should be used when applying this nutrient since toxicities are possible. Boron should only be applied to corn if the soil test in southeast Kansas is less than 1.0 part per million and the application rate should be limited to 1 pound per acre. Do not band apply boron. Nutrient deficiencies of other nutrients (copper, manganese, molybdenum, and nickel) have not been docu-mented in Kansas.
LimingLime recommendations are based on a program of main-
taining the soil in a productive condition. Although corn is not the most responsive crop to lime, the liming of acid soils should not be ignored. The benefits in any one season may not be great, but for the continued production of corn and other crops on the land, liming is a sound practice. Little corn yield response to lime is likely in most areas of Kansas (except southeastern Kansas) at soil pHs above 5.5 because of higher soil pHs in the subsoil. In the eastern third of Kansas, lime is recommended on all soils with a pH of 6.0 or less. For the western two-thirds of Kansas, lime is recommended on soils with a pH of 6.0 or less and a subsoil pH of less than 6.4.
Weed ManagementSummer annual broadleaf and grass weeds typically
inhabit Kansas cornfields. The common broadleaf species include pigweeds, velvetleaf, cocklebur, kochia, smartweed, and puncturevine. Common grass weeds include shattercane, large crabgrass, foxtails, field sandbur, fall panicum, barnyard-grass, and prairie cupgrass. Perennial weed species important in cornfields include johnsongrass, field bindweed, and bur ragweed.
Weedy plants and corn plants require the same resources for growth: nutrients, water, and sunlight. Resources that are captured by growing weeds are unavailable for corn. Typically, there is a pound for pound trade-off of corn dry matter for
weed dry matter. In other words, every pound of weed dry matter in the producer’s field comes at the expense of a pound of corn dry matter that could have grown there. It is vital, therefore, that weeds in the cornfield be controlled.
Integrated Weed ManagementCultural and physical control and the use of herbicides
can contribute to weed control in corn. Crop rotation with soybeans, forage crops, or cereal grains provides many more opportunities for low-cost weed control than does continuous corn cropping. Some Kansas corn producers find preplant
22
tillage and row-crop cultivation to be cost-effective weed-management practices.
Field corn is well adapted to early planting, which allows it to become established before many summer annual weeds germinate. Corn is vulnerable to weed competition for about the first 4 weeks, a time span that often coincides with cool spring temperatures. Thereafter, the established corn plant grows rapidly and the crop becomes highly competitive. Thus, a successful weed-control strategy should assure weed-free conditions for at least a month after planting. Weeds germi-nating after that period pose much less threat to yield reduc-tion but may still interfere with harvest.
No-Tillage, Ecofallow, and Strip-Till CornField corn may be planted directly into crop residues from
the previous year, as well as into killed alfalfa or smooth brome sods. Before planting, winter annual weeds must be controlled with tillage or with foliar-absorbed herbicides. Established cool-season grasses such as cheat, downy brome, and volunteer wheat are best controlled with glyphosate. Dicamba and 2,4-D are important for controlling marestail, dandelion, mustards, and other emerged broadleaf weeds.
Corn herbicides such as atrazine (with crop oil adjuvant) have both foliar burndown and soil-residual properties. Balance Pro (not labeled in some counties) can give very good burndown and residual control of pigweeds, kochia, and velvetleaf, as well as suppressing other weeds and grasses. Similarly, herbicide products containing mesotrione and atra-zine (Lexar, Lumax) have both burndown and residual activity.
Often, acetamide herbicides such as Dual Magnum, Harness/Surpass, and Outlook are tank mixed with burndown herbicides that are applied about 10 to 14 days before planting. These herbicides do not have foliar activity, but play an important role in residual control of grasses and small-seeded broadleaf weeds. Half rates of these herbicides can give good control for a few weeks, after which control falls off sharply. Several weeks of control after planting may be adequate in fields where broad-spectrum postemerge herbi-cides will be applied.
Weed Control after Corn EmergenceSome Kansas corn producers control weeds with inter-
row cultivation. Corn produced without pesticides may qualify for price premiums on the organic market. Auto-steer technology is making precision cultivation a more attractive option. Banding residual herbicides over the row at planting, and then controlling inter-row weeds with cultivation can
greatly reduce herbicide inputs. Furrow-irrigated corn and ridge-tilled corn is often managed with very low herbicide inputs. These weed control options are accompanied by increased risk of yield-reducing weed competition, however, if timely cultivation is not achieved.
Many postemerge herbicides are available for use in field corn. Some, such as mixtures of atrazine with dicamba, Aim, or 2,4-D, mainly control selected broadleaf weeds. Several herbi-cides with the ALS (acetolactate synthase) inhibitor mode of action, such as Equip, Steadfast, and Resolve, selectively control a broader weed spectrum, including shattercane. Many corn hybrids carry genes that make them resistant to Liberty and/or to glyphosate. Glyphosate controls the widest spectrum of weeds and is especially useful for problem weeds such as field sandbur in fields with coarse-textured soils where soil-applied herbicides have inadequate activity. The low cost of glyphosate-based weed control in corn is partly offset by the technology fee for seed and the cost of controlling volunteer corn the following year.
Corn producers should plan for weed control systems that integrate cultural and physical or chemical controls. Good control ahead of the crop can optimize soil moisture and planting conditions.
In-crop control is more satisfactory with a combination of preemerge and postemerge herbicides, than depending on a single postemerge herbicide application. In most fields, weed pressure is too high and timeliness is too critical for one application to be adequate. Much better weed control in field corn can be achieved through use of a preplant burndown that includes some residual herbicides in no-till fields or a planting-time application in tilled fields, followed by one or more postemerge applications.
Additional Information on Chemical Weed Control
This publication lists some of the alternatives available for weed management in field corn. For a comprehensive list of current herbicides and their use in corn, request a copy of Chemical Weed Control for Field Crops, Pastures, Rangeland, and Noncropland from your local K-State Research and Extension office; the K-State Research and Extension Bookstore, 24 Umberger Hall, Kansas State University, Manhattan, KS 66506, or online at www.bookstore.ksre.ksu.edu/pubs/chemweedguide.pdf. In addi-tion, WeedSOFT Advisor, a comprehensive, computer-aided, decision-support system can help you select the best manage-ment solutions for specific weed problems.
23
Belowground Insect Problems (seed-destroying or root-pruning insects)
Several insects can attack and destroy corn seed before it germinates, leading to reduced plant populations. These insects are most likely to cause economic damage where cool-to-cold soils occur at planting and inadequate or excessive surface moisture combine to delay germination.
To reduce damage from seed-attacking insects, seed protectants can be applied to the seed. Seed maybe purchased with a commercially applied seed treatment, or producers may apply a seed treatment prior to planting or use a planter-box seed treatment. The choice of the seed treatment will depend on the primary pests the producer needs to control.
Seed protectants may be most beneficial where a recent field history of sod, alfalfa, reduced tillage, and/or unfavorable soil conditions delay germination. In most instances, insecticide seed protectants should be considered where planting time soil insecticides for rootworms, grubs, and/or wire worms are not used and planting occurs before June 2 in southeast Kansas, June 4 in south central Kansas, June 5 in northeast Kansas, June 7 in southwest Kansas, and June 12 in northwest Kansas. Be especially concerned if many seed corn maggot flies, seed corn beetles, and/or wireworms are noticed when the soil is worked before planting.
Root-pruning and belowground stalk-chewing insects include corn rootworm larvae, wireworm larvae, and white grubs. Because some seed protectants do not protect the plant after the seed coat is ruptured at germination, be sure to read labels carefully when selecting insecti cides to control these pests. Western and northern corn rootworm larvae are prob-ably most consistently avoided if crops are rotated annually. Rootworms rarely cause economic damage, except where corn follows corn, because the adults prefer to lay eggs in corn fields and the larvae have a difficult time surviv ing on other plants.
The primary pest to be controlled will determine the best insecticide and application methods for a specific field. Banding the insecticide gives better rootworm suppres sion, whereas wireworms are probably more effectively sup pressed if the insecticide is applied in-furrow. In some cases, control
strategies directed against adult corn rootworms to prevent egg laying are a good management option. Weekly scouting of fields is necessary for this strategy to work as a sub stitute for soil-applied planting-time treatments. Where wireworm or white grub infestations are very heavy, replanting (sometimes more than once) may be necessary. Wire worm and white grub problems are typically most severe where corn follows a sod crop such as brome. When the soil surface is dry, cutworms may cut plants below the soil surface.
The introduction of transgenic rootworm resistant hybrids gives producers another option to control corn root-worms. These hybrids generally come pretreated with a seed treatment to protect against other seed-attacking pests.
Aboveground Insect Problems (leaf-chewing, stalk-boring, sap-feeding, or silk-feeding insects)
Insects attacking seedling plants above ground include thrips, flea beetles, chinch bugs, stalk borers, cutworms, and garden webworms. Black cutworm larvae are most com monly a problem in the eastern third of the state. The risk of cutworm injury is greater in fields that were weedy just before planting. Sometimes cutworms are more serious in no-till or reduced tillage operations.
Between 2-feet tall and tassel stage, corn plants may be attacked by first generation European and southwestern corn borers, fall armyworms, and corn earworms. After tassels have emerged, most insect problems will be caused by west ern bean cutworms, adult corn rootworm beetles, grasshop pers, fall armyworms, corn earworms, beet armyworms, true army-worms, second generation European and southwestern corn borers, and spider mites.
See current copy of Corn Insect Management, MF-810 for registered insecticides and Bt hybrids for these and other corn insect pests.
Introductions of Bt corn hybrids that offer resistance to feeding caused by some of the lepidopteran larvae, i.e. both corn borers, black cutworms, western bean cutworm, etc. provide another option for corn producers.
Insect Management
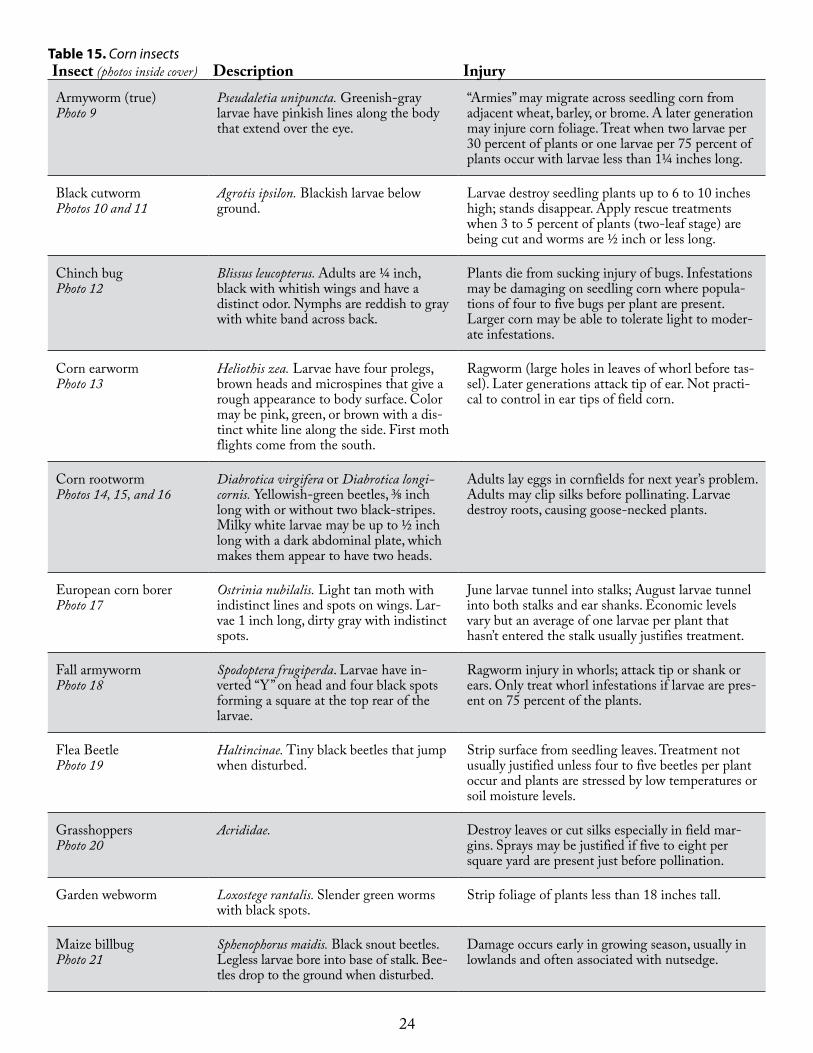
24
Insect (photos inside cover) Description InjuryArmyworm (true)Photo 9
Pseudaletia unipuncta. Greenish-gray larvae have pinkish lines along the body that extend over the eye.
“Armies” may migrate across seedling corn from adjacent wheat, barley, or brome. A later generation may injure corn foliage. Treat when two larvae per 30 percent of plants or one larvae per 75 percent of plants occur with larvae less than 1¼ inches long.
Black cutwormPhotos 10 and 11
Agrotis ipsilon. Blackish larvae below ground.
Larvae destroy seedling plants up to 6 to 10 inches high; stands disappear. Apply rescue treatments when 3 to 5 percent of plants (two-leaf stage) are being cut and worms are ½ inch or less long.
Chinch bugPhoto 12
Blissus leucopterus. Adults are ¼ inch, black with whitish wings and have a distinct odor. Nymphs are reddish to gray with white band across back.
Plants die from sucking injury of bugs. Infestations may be damaging on seedling corn where popula-tions of four to five bugs per plant are present. Larger corn may be able to tolerate light to moder-ate infestations.
Corn earwormPhoto 13
Heliothis zea. Larvae have four prolegs, brown heads and microspines that give a rough appearance to body surface. Color may be pink, green, or brown with a dis-tinct white line along the side. First moth flights come from the south.
Ragworm (large holes in leaves of whorl before tas-sel). Later generations attack tip of ear. Not practi-cal to control in ear tips of field corn.
Corn rootwormPhotos 14, 15, and 16
Diabrotica virgifera or Diabrotica longi-cornis. Yellowish-green beetles, 3/8 inch long with or without two black-stripes. Milky white larvae may be up to ½ inch long with a dark abdominal plate, which makes them appear to have two heads.
Adults lay eggs in cornfields for next year’s problem. Adults may clip silks before pollinating. Larvae destroy roots, causing goose-necked plants.
European corn borerPhoto 17
Ostrinia nubilalis. Light tan moth with indistinct lines and spots on wings. Lar-vae 1 inch long, dirty gray with indistinct spots.
June larvae tunnel into stalks; August larvae tunnel into both stalks and ear shanks. Economic levels vary but an average of one larvae per plant that hasn’t entered the stalk usually justifies treatment.
Fall armywormPhoto 18
Spodoptera frugiperda. Larvae have in-verted “Y” on head and four black spots forming a square at the top rear of the larvae.
Ragworm injury in whorls; attack tip or shank or ears. Only treat whorl infestations if larvae are pres-ent on 75 percent of the plants.
Flea BeetlePhoto 19
Haltincinae. Tiny black beetles that jump when disturbed.
Strip surface from seedling leaves. Treatment not usually justified unless four to five beetles per plant occur and plants are stressed by low temperatures or soil moisture levels.
GrasshoppersPhoto 20
Acrididae. Destroy leaves or cut silks especially in field mar-gins. Sprays may be justified if five to eight per square yard are present just before pollination.
Garden webworm Loxostege rantalis. Slender green worms with black spots.
Strip foliage of plants less than 18 inches tall.
Maize billbugPhoto 21
Sphenophorus maidis. Black snout beetles. Legless larvae bore into base of stalk. Bee-tles drop to the ground when disturbed.
Damage occurs early in growing season, usually in lowlands and often associated with nutsedge.
Table 15. Corn insects
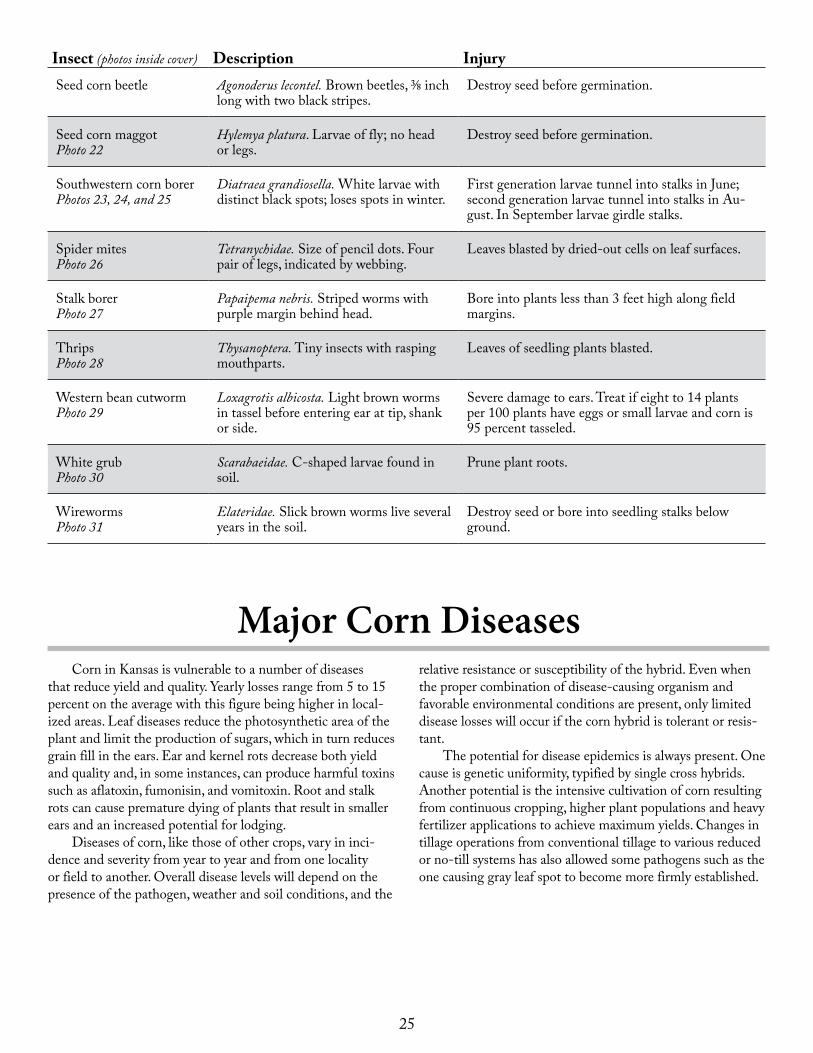
25
Insect (photos inside cover) Description InjurySeed corn beetle Agonoderus lecontel. Brown beetles, 3/8 inch
long with two black stripes.Destroy seed before germination.
Seed corn maggotPhoto 22
Hylemya platura. Larvae of fly; no head or legs.
Destroy seed before germination.
Southwestern corn borerPhotos 23, 24, and 25
Diatraea grandiosella. White larvae with distinct black spots; loses spots in winter.
First generation larvae tunnel into stalks in June; second generation larvae tunnel into stalks in Au-gust. In September larvae girdle stalks.
Spider mitesPhoto 26
Tetranychidae. Size of pencil dots. Four pair of legs, indicated by webbing.
Leaves blasted by dried-out cells on leaf surfaces.
Stalk borerPhoto 27
Papaipema nebris. Striped worms with purple margin behind head.
Bore into plants less than 3 feet high along field margins.
ThripsPhoto 28
Thysanoptera. Tiny insects with rasping mouthparts.
Leaves of seedling plants blasted.
Western bean cutwormPhoto 29
Loxagrotis albicosta. Light brown worms in tassel before entering ear at tip, shank or side.
Severe damage to ears. Treat if eight to 14 plants per 100 plants have eggs or small larvae and corn is 95 percent tasseled.
White grubPhoto 30
Scarabaeidae. C-shaped larvae found in soil.
Prune plant roots.
WirewormsPhoto 31
Elateridae. Slick brown worms live several years in the soil.
Destroy seed or bore into seedling stalks below ground.
Corn in Kansas is vulnerable to a number of diseases that reduce yield and quality. Yearly losses range from 5 to 15 percent on the average with this figure being higher in local-ized areas. Leaf diseases reduce the photosynthetic area of the plant and limit the production of sugars, which in turn reduces grain fill in the ears. Ear and kernel rots decrease both yield and quality and, in some instances, can produce harmful toxins such as aflatoxin, fumonisin, and vomitoxin. Root and stalk rots can cause premature dying of plants that result in smaller ears and an increased potential for lodging.
Diseases of corn, like those of other crops, vary in inci-dence and severity from year to year and from one locality or field to another. Overall disease levels will depend on the presence of the pathogen, weather and soil conditions, and the
Major Corn Diseasesrelative resistance or susceptibility of the hybrid. Even when the proper combination of disease-causing organism and favorable environmental conditions are present, only limited disease losses will occur if the corn hybrid is tolerant or resis-tant.
The potential for disease epidemics is always present. One cause is genetic uniformity, typified by single cross hybrids. Another potential is the intensive cultivation of corn resulting from continuous cropping, higher plant populations and heavy fertilizer applications to achieve maximum yields. Changes in tillage operations from conventional tillage to various reduced or no-till systems has also allowed some pathogens such as the one causing gray leaf spot to become more firmly established.
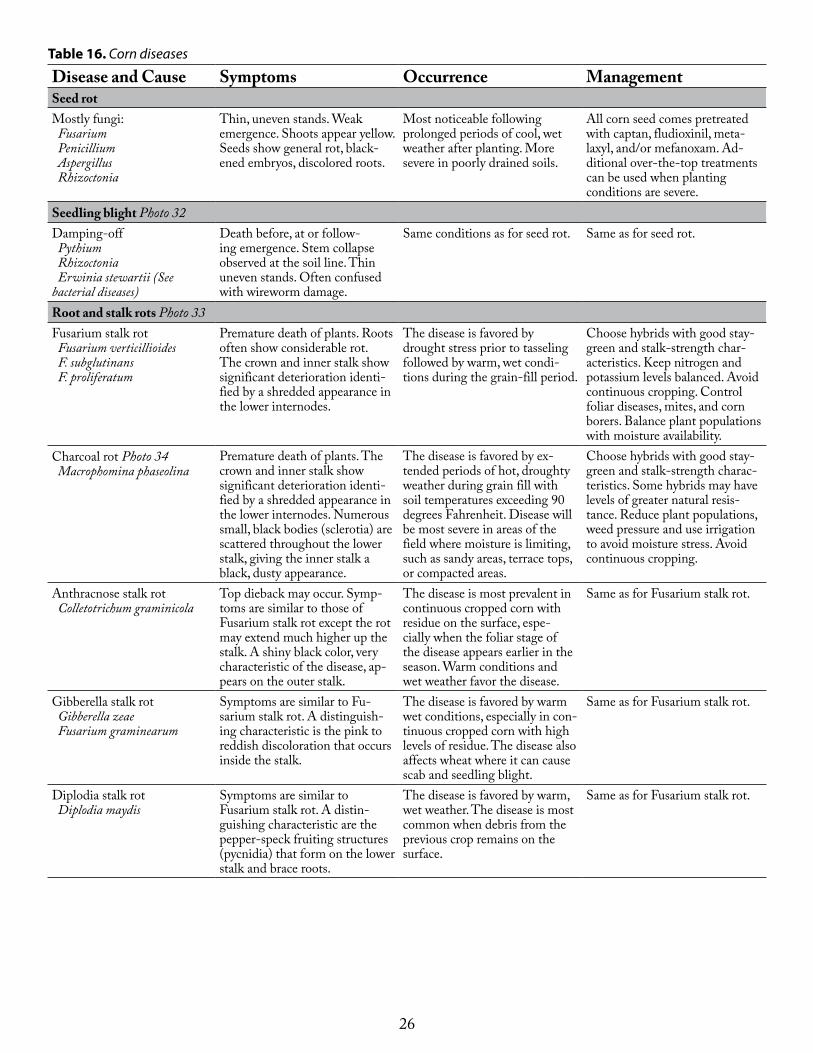
26
Table 16. Corn diseases
Disease and Cause Symptoms Occurrence ManagementSeed rotMostly fungi: Fusarium Penicillium Aspergillus Rhizoctonia
Thin, uneven stands. Weak emergence. Shoots appear yellow. Seeds show general rot, black-ened embryos, discolored roots.
Most noticeable following prolonged periods of cool, wet weather after planting. More severe in poorly drained soils.
All corn seed comes pretreated with captan, fludioxinil, meta-laxyl, and/or mefanoxam. Ad-ditional over-the-top treatments can be used when planting conditions are severe.
Seedling blight Photo 32Damping-off Pythium Rhizoctonia Erwinia stewartii (See bacterial diseases)
Death before, at or follow-ing emergence. Stem collapse observed at the soil line. Thin uneven stands. Often confused with wireworm damage.
Same conditions as for seed rot. Same as for seed rot.
Root and stalk rots Photo 33Fusarium stalk rot Fusarium verticillioides F. subglutinans F. proliferatum
Premature death of plants. Roots often show considerable rot. The crown and inner stalk show significant deterioration identi-fied by a shredded appearance in the lower internodes.
The disease is favored by drought stress prior to tasseling followed by warm, wet condi-tions during the grain-fill period.
Choose hybrids with good stay-green and stalk-strength char-acteristics. Keep nitrogen and potassium levels balanced. Avoid continuous cropping. Control foliar diseases, mites, and corn borers. Balance plant populations with moisture availability.
Charcoal rot Photo 34 Macrophomina phaseolina
Premature death of plants. The crown and inner stalk show significant deterioration identi-fied by a shredded appearance in the lower internodes. Numerous small, black bodies (sclerotia) are scattered throughout the lower stalk, giving the inner stalk a black, dusty appearance.
The disease is favored by ex-tended periods of hot, droughty weather during grain fill with soil temperatures exceeding 90 degrees Fahrenheit. Disease will be most severe in areas of the field where moisture is limiting, such as sandy areas, terrace tops, or compacted areas.
Choose hybrids with good stay-green and stalk-strength charac-teristics. Some hybrids may have levels of greater natural resis-tance. Reduce plant populations, weed pressure and use irrigation to avoid moisture stress. Avoid continuous cropping.
Anthracnose stalk rot Colletotrichum graminicola
Top dieback may occur. Symp-toms are similar to those of Fusarium stalk rot except the rot may extend much higher up the stalk. A shiny black color, very characteristic of the disease, ap-pears on the outer stalk.
The disease is most prevalent in continuous cropped corn with residue on the surface, espe-cially when the foliar stage of the disease appears earlier in the season. Warm conditions and wet weather favor the disease.
Same as for Fusarium stalk rot.
Gibberella stalk rot Gibberella zeae Fusarium graminearum
Symptoms are similar to Fu-sarium stalk rot. A distinguish-ing characteristic is the pink to reddish discoloration that occurs inside the stalk.
The disease is favored by warm wet conditions, especially in con-tinuous cropped corn with high levels of residue. The disease also affects wheat where it can cause scab and seedling blight.
Same as for Fusarium stalk rot.
Diplodia stalk rot Diplodia maydis
Symptoms are similar to Fusarium stalk rot. A distin-guishing characteristic are the pepper-speck fruiting structures (pycnidia) that form on the lower stalk and brace roots.
The disease is favored by warm, wet weather. The disease is most common when debris from the previous crop remains on the surface.
Same as for Fusarium stalk rot.
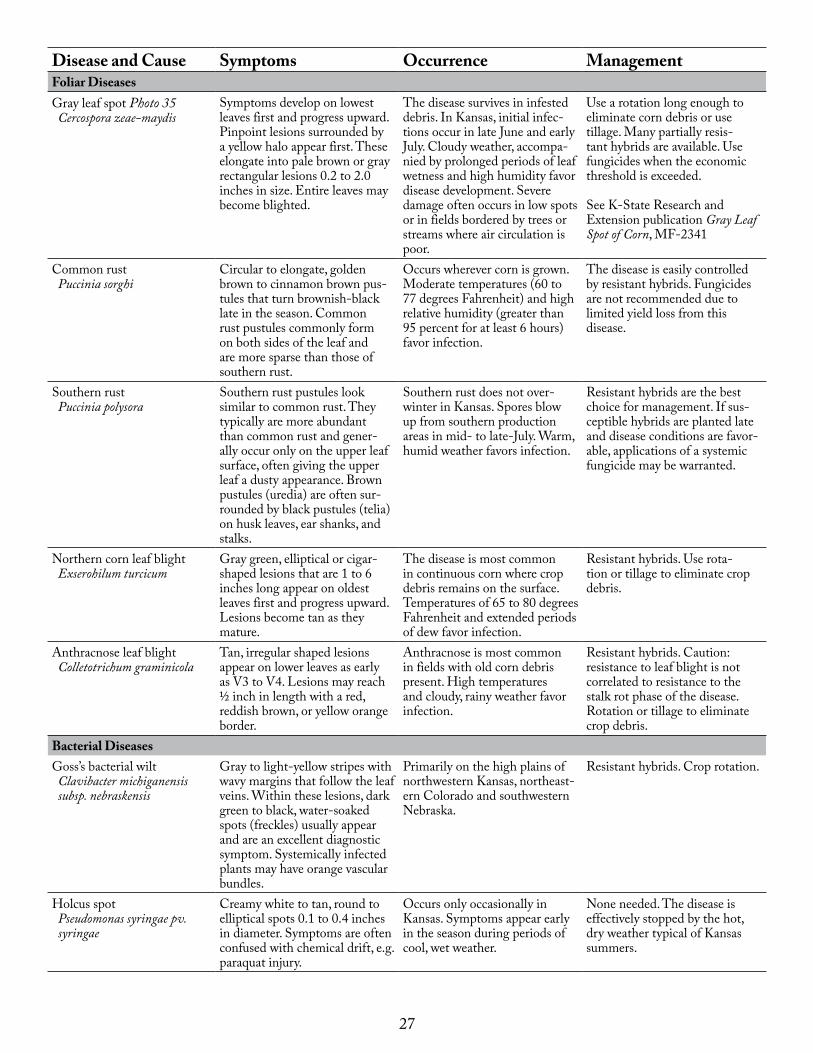
27
Disease and Cause Symptoms Occurrence ManagementFoliar DiseasesGray leaf spot Photo 35 Cercospora zeae-maydis
Symptoms develop on lowest leaves first and progress upward. Pinpoint lesions surrounded by a yellow halo appear first. These elongate into pale brown or gray rectangular lesions 0.2 to 2.0 inches in size. Entire leaves may become blighted.
The disease survives in infested debris. In Kansas, initial infec-tions occur in late June and early July. Cloudy weather, accompa-nied by prolonged periods of leaf wetness and high humidity favor disease development. Severe damage often occurs in low spots or in fields bordered by trees or streams where air circulation is poor.
Use a rotation long enough to eliminate corn debris or use tillage. Many partially resis-tant hybrids are available. Use fungicides when the economic threshold is exceeded.
See K-State Research and Extension publication Gray Leaf Spot of Corn, MF-2341
Common rust Puccinia sorghi
Circular to elongate, golden brown to cinnamon brown pus-tules that turn brownish-black late in the season. Common rust pustules commonly form on both sides of the leaf and are more sparse than those of southern rust.
Occurs wherever corn is grown. Moderate temperatures (60 to 77 degrees Fahrenheit) and high relative humidity (greater than 95 percent for at least 6 hours) favor infection.
The disease is easily controlled by resistant hybrids. Fungicides are not recommended due to limited yield loss from this disease.
Southern rust Puccinia polysora
Southern rust pustules look similar to common rust. They typically are more abundant than common rust and gener-ally occur only on the upper leaf surface, often giving the upper leaf a dusty appearance. Brown pustules (uredia) are often sur-rounded by black pustules (telia) on husk leaves, ear shanks, and stalks.
Southern rust does not over-winter in Kansas. Spores blow up from southern production areas in mid- to late-July. Warm, humid weather favors infection.
Resistant hybrids are the best choice for management. If sus-ceptible hybrids are planted late and disease conditions are favor-able, applications of a systemic fungicide may be warranted.
Northern corn leaf blight Exserohilum turcicum
Gray green, elliptical or cigar-shaped lesions that are 1 to 6 inches long appear on oldest leaves first and progress upward. Lesions become tan as they mature.
The disease is most common in continuous corn where crop debris remains on the surface. Temperatures of 65 to 80 degrees Fahrenheit and extended periods of dew favor infection.
Resistant hybrids. Use rota-tion or tillage to eliminate crop debris.
Anthracnose leaf blight Colletotrichum graminicola
Tan, irregular shaped lesions appear on lower leaves as early as V3 to V4. Lesions may reach ½ inch in length with a red, reddish brown, or yellow orange border.
Anthracnose is most common in fields with old corn debris present. High temperatures and cloudy, rainy weather favor infection.
Resistant hybrids. Caution: resistance to leaf blight is not correlated to resistance to the stalk rot phase of the disease. Rotation or tillage to eliminate crop debris.
Bacterial DiseasesGoss’s bacterial wilt Clavibacter michiganensis subsp. nebraskensis
Gray to light-yellow stripes with wavy margins that follow the leaf veins. Within these lesions, dark green to black, water-soaked spots (freckles) usually appear and are an excellent diagnostic symptom. Systemically infected plants may have orange vascular bundles.
Primarily on the high plains of northwestern Kansas, northeast-ern Colorado and southwestern Nebraska.
Resistant hybrids. Crop rotation.
Holcus spot Pseudomonas syringae pv. syringae
Creamy white to tan, round to elliptical spots 0.1 to 0.4 inches in diameter. Symptoms are often confused with chemical drift, e.g. paraquat injury.
Occurs only occasionally in Kansas. Symptoms appear early in the season during periods of cool, wet weather.
None needed. The disease is effectively stopped by the hot, dry weather typical of Kansas summers.
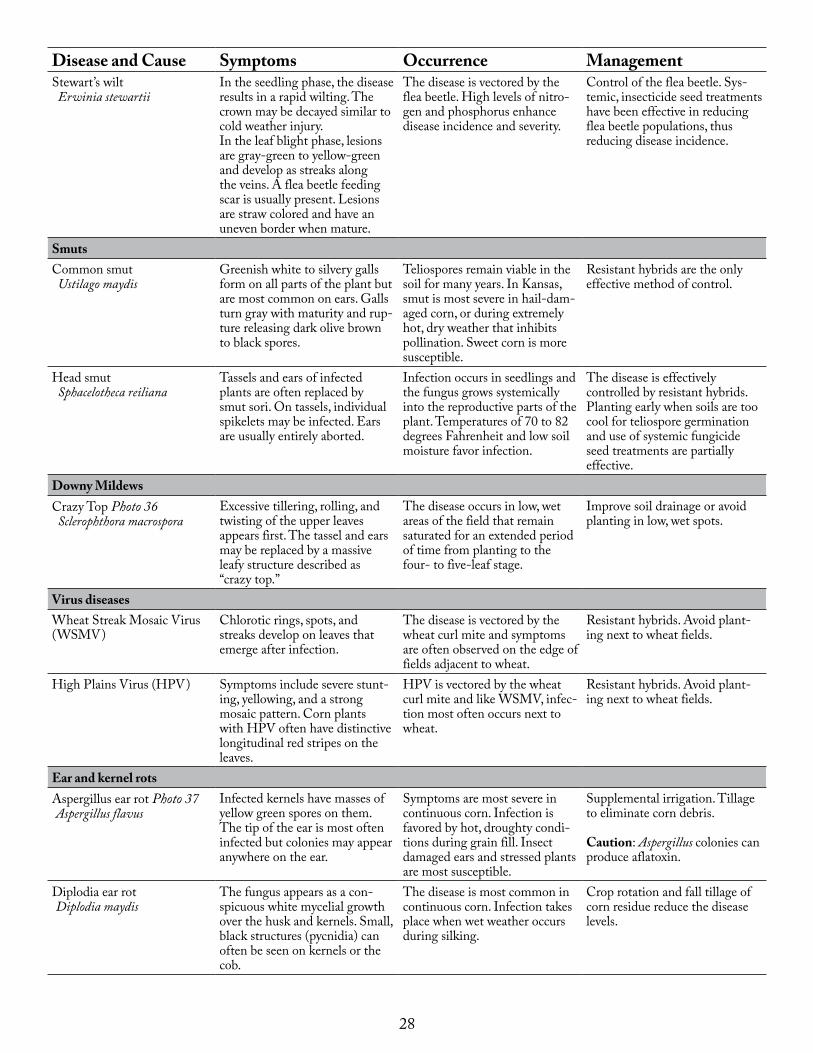
28
Disease and Cause Symptoms Occurrence ManagementStewart’s wilt Erwinia stewartii
In the seedling phase, the disease results in a rapid wilting. The crown may be decayed similar to cold weather injury.In the leaf blight phase, lesions are gray-green to yellow-green and develop as streaks along the veins. A flea beetle feeding scar is usually present. Lesions are straw colored and have an uneven border when mature.
The disease is vectored by the flea beetle. High levels of nitro-gen and phosphorus enhance disease incidence and severity.
Control of the flea beetle. Sys-temic, insecticide seed treatments have been effective in reducing flea beetle populations, thus reducing disease incidence.
SmutsCommon smut Ustilago maydis
Greenish white to silvery galls form on all parts of the plant but are most common on ears. Galls turn gray with maturity and rup-ture releasing dark olive brown to black spores.
Teliospores remain viable in the soil for many years. In Kansas, smut is most severe in hail-dam-aged corn, or during extremely hot, dry weather that inhibits pollination. Sweet corn is more susceptible.
Resistant hybrids are the only effective method of control.
Head smut Sphacelotheca reiliana
Tassels and ears of infected plants are often replaced by smut sori. On tassels, individual spikelets may be infected. Ears are usually entirely aborted.
Infection occurs in seedlings and the fungus grows systemically into the reproductive parts of the plant. Temperatures of 70 to 82 degrees Fahrenheit and low soil moisture favor infection.
The disease is effectively controlled by resistant hybrids. Planting early when soils are too cool for teliospore germination and use of systemic fungicide seed treatments are partially effective.
Downy MildewsCrazy Top Photo 36 Sclerophthora macrospora
Excessive tillering, rolling, and twisting of the upper leaves appears first. The tassel and ears may be replaced by a massive leafy structure described as “crazy top.”
The disease occurs in low, wet areas of the field that remain saturated for an extended period of time from planting to the four- to five-leaf stage.
Improve soil drainage or avoid planting in low, wet spots.
Virus diseasesWheat Streak Mosaic Virus (WSMV)
Chlorotic rings, spots, and streaks develop on leaves that emerge after infection.
The disease is vectored by the wheat curl mite and symptoms are often observed on the edge of fields adjacent to wheat.
Resistant hybrids. Avoid plant-ing next to wheat fields.
High Plains Virus (HPV) Symptoms include severe stunt-ing, yellowing, and a strong mosaic pattern. Corn plants with HPV often have distinctive longitudinal red stripes on the leaves.
HPV is vectored by the wheat curl mite and like WSMV, infec-tion most often occurs next to wheat.
Resistant hybrids. Avoid plant-ing next to wheat fields.
Ear and kernel rotsAspergillus ear rot Photo 37 Aspergillus flavus
Infected kernels have masses of yellow green spores on them. The tip of the ear is most often infected but colonies may appear anywhere on the ear.
Symptoms are most severe in continuous corn. Infection is favored by hot, droughty condi-tions during grain fill. Insect damaged ears and stressed plants are most susceptible.
Supplemental irrigation. Tillage to eliminate corn debris.
Caution: Aspergillus colonies can produce aflatoxin.
Diplodia ear rot Diplodia maydis
The fungus appears as a con-spicuous white mycelial growth over the husk and kernels. Small, black structures (pycnidia) can often be seen on kernels or the cob.
The disease is most common in continuous corn. Infection takes place when wet weather occurs during silking.
Crop rotation and fall tillage of corn residue reduce the disease levels.
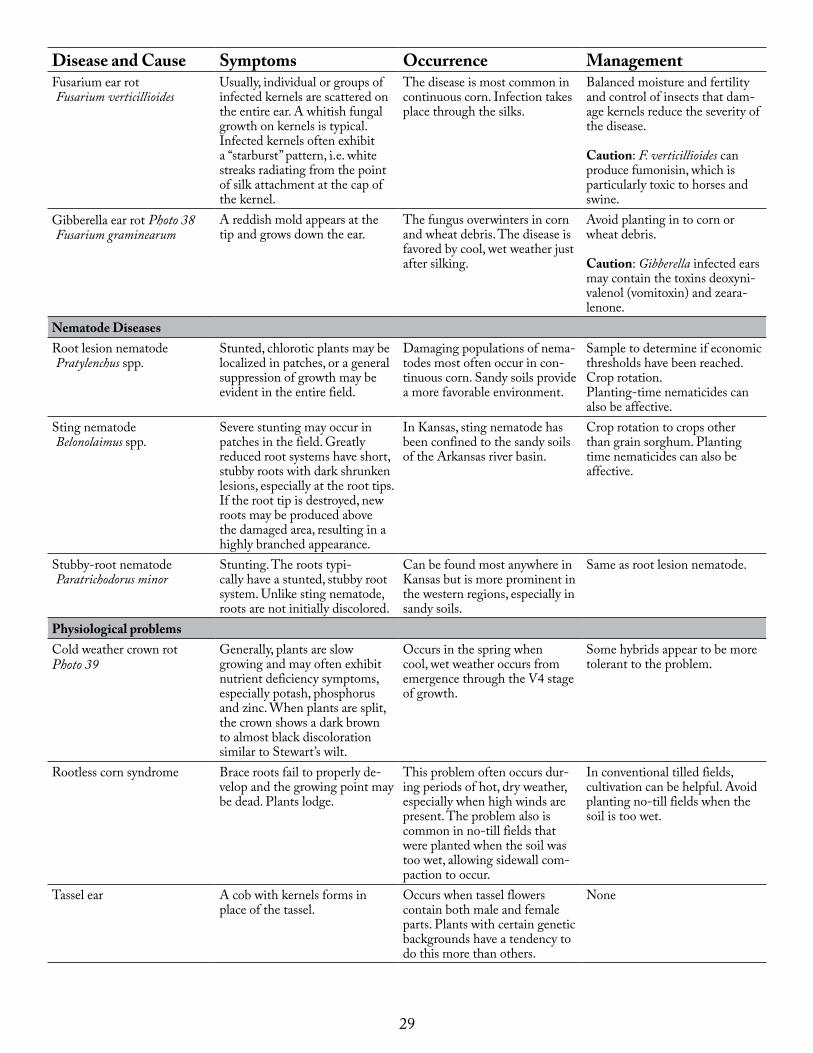
29
Disease and Cause Symptoms Occurrence ManagementFusarium ear rot Fusarium verticillioides
Usually, individual or groups of infected kernels are scattered on the entire ear. A whitish fungal growth on kernels is typical. Infected kernels often exhibit a “starburst” pattern, i.e. white streaks radiating from the point of silk attachment at the cap of the kernel.
The disease is most common in continuous corn. Infection takes place through the silks.
Balanced moisture and fertility and control of insects that dam-age kernels reduce the severity of the disease.
Caution: F. verticillioides can produce fumonisin, which is particularly toxic to horses and swine.
Gibberella ear rot Photo 38 Fusarium graminearum
A reddish mold appears at the tip and grows down the ear.
The fungus overwinters in corn and wheat debris. The disease is favored by cool, wet weather just after silking.
Avoid planting in to corn or wheat debris.
Caution: Gibberella infected ears may contain the toxins deoxyni-valenol (vomitoxin) and zeara-lenone.
Nematode DiseasesRoot lesion nematode Pratylenchus spp.
Stunted, chlorotic plants may be localized in patches, or a general suppression of growth may be evident in the entire field.
Damaging populations of nema-todes most often occur in con-tinuous corn. Sandy soils provide a more favorable environment.
Sample to determine if economic thresholds have been reached. Crop rotation.Planting-time nematicides can also be affective.
Sting nematode Belonolaimus spp.
Severe stunting may occur in patches in the field. Greatly reduced root systems have short, stubby roots with dark shrunken lesions, especially at the root tips. If the root tip is destroyed, new roots may be produced above the damaged area, resulting in a highly branched appearance.
In Kansas, sting nematode has been confined to the sandy soils of the Arkansas river basin.
Crop rotation to crops other than grain sorghum. Planting time nematicides can also be affective.
Stubby-root nematode Paratrichodorus minor
Stunting. The roots typi-cally have a stunted, stubby root system. Unlike sting nematode, roots are not initially discolored.
Can be found most anywhere in Kansas but is more prominent in the western regions, especially in sandy soils.
Same as root lesion nematode.
Physiological problemsCold weather crown rot Photo 39
Generally, plants are slow growing and may often exhibit nutrient deficiency symptoms, especially potash, phosphorus and zinc. When plants are split, the crown shows a dark brown to almost black discoloration similar to Stewart’s wilt.
Occurs in the spring when cool, wet weather occurs from emergence through the V4 stage of growth.
Some hybrids appear to be more tolerant to the problem.
Rootless corn syndrome Brace roots fail to properly de-velop and the growing point may be dead. Plants lodge.
This problem often occurs dur-ing periods of hot, dry weather, especially when high winds are present. The problem also is common in no-till fields that were planted when the soil was too wet, allowing sidewall com-paction to occur.
In conventional tilled fields, cultivation can be helpful. Avoid planting no-till fields when the soil is too wet.
Tassel ear A cob with kernels forms in place of the tassel.
Occurs when tassel flowers contain both male and female parts. Plants with certain genetic backgrounds have a tendency to do this more than others.
None
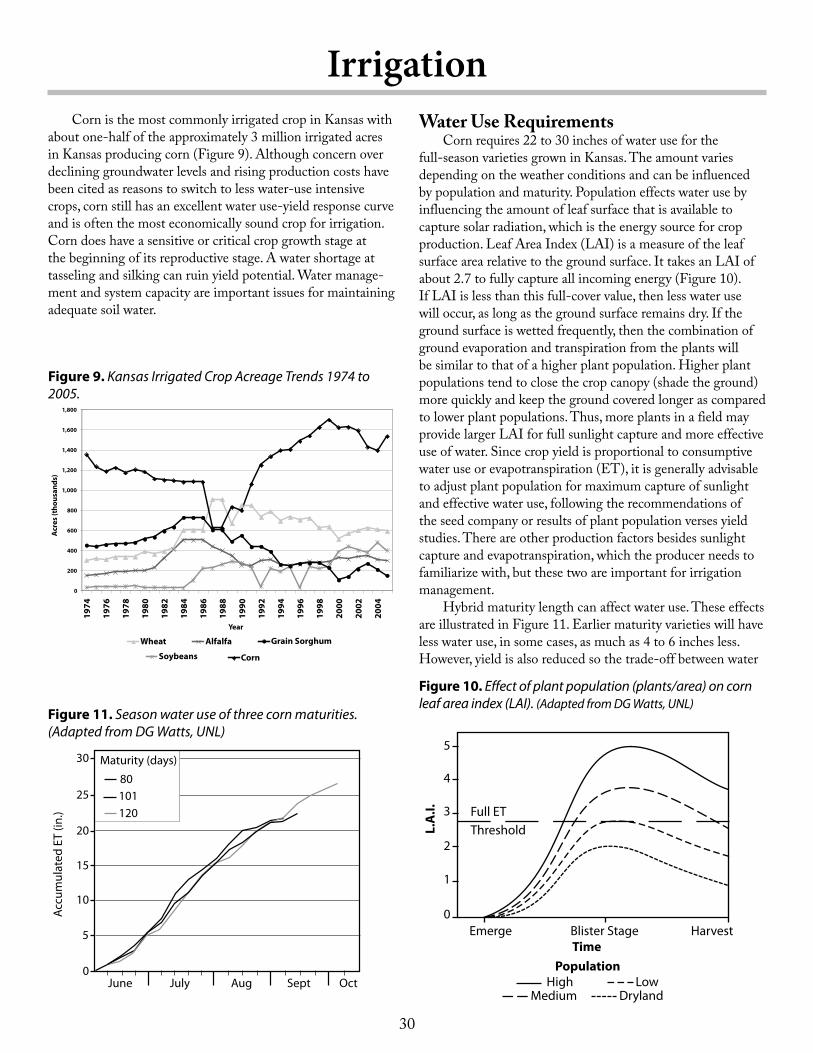
30
30
0
5
10
15
20
25
June SeptAugJuly Oct
Accu
mul
ated
ET
(in.)
80
120101
Maturity (days)
Figure 11. Season water use of three corn maturities. (Adapted from DG Watts, UNL)
IrrigationCorn is the most commonly irrigated crop in Kansas with
about one-half of the approximately 3 million irrigated acres in Kansas producing corn (Figure 9). Although concern over declining groundwater levels and rising production costs have been cited as reasons to switch to less water-use intensive crops, corn still has an excellent water use-yield response curve and is often the most economically sound crop for irrigation. Corn does have a sensitive or critical crop growth stage at the beginning of its reproductive stage. A water shortage at tasseling and silking can ruin yield potential. Water manage-ment and system capacity are important issues for maintaining adequate soil water.
Water Use RequirementsCorn requires 22 to 30 inches of water use for the
full-season varieties grown in Kansas. The amount varies depending on the weather conditions and can be influenced by population and maturity. Population effects water use by influencing the amount of leaf surface that is available to capture solar radiation, which is the energy source for crop production. Leaf Area Index (LAI) is a measure of the leaf surface area relative to the ground surface. It takes an LAI of about 2.7 to fully capture all incoming energy (Figure 10). If LAI is less than this full-cover value, then less water use will occur, as long as the ground surface remains dry. If the ground surface is wetted frequently, then the combination of ground evaporation and transpiration from the plants will be similar to that of a higher plant population. Higher plant populations tend to close the crop canopy (shade the ground) more quickly and keep the ground covered longer as compared to lower plant populations. Thus, more plants in a field may provide larger LAI for full sunlight capture and more effective use of water. Since crop yield is proportional to consumptive water use or evapotranspiration (ET), it is generally advisable to adjust plant population for maximum capture of sunlight and effective water use, following the recommendations of the seed company or results of plant population verses yield studies. There are other production factors besides sunlight capture and evapotranspiration, which the producer needs to familiarize with, but these two are important for irrigation management.
Hybrid maturity length can affect water use. These effects are illustrated in Figure 11. Earlier maturity varieties will have less water use, in some cases, as much as 4 to 6 inches less. However, yield is also reduced so the trade-off between water
0
200
400
600
800
1,000
1,200
1,400
1,600
1,800
1974
1976
1978
1980
1982
1984
1986
1988
1990
1992
1994
1996
1998
2000
2002
2004
Year
Acr
es (t
hous
ands
)
Wheat Alfalfa
Soybeans
Grain Sorghum
Corn
5
0
1
2
3
4
Blister Stage HarvestEmergeTime
Population
L.A
.I. Full ETThreshold
MediumLowHigh
Dryland
Figure 10. Effect of plant population (plants/area) on corn leaf area index (LAI). (Adapted from DG Watts, UNL)
Figure 9. Kansas Irrigated Crop Acreage Trends 1974 to 2005.
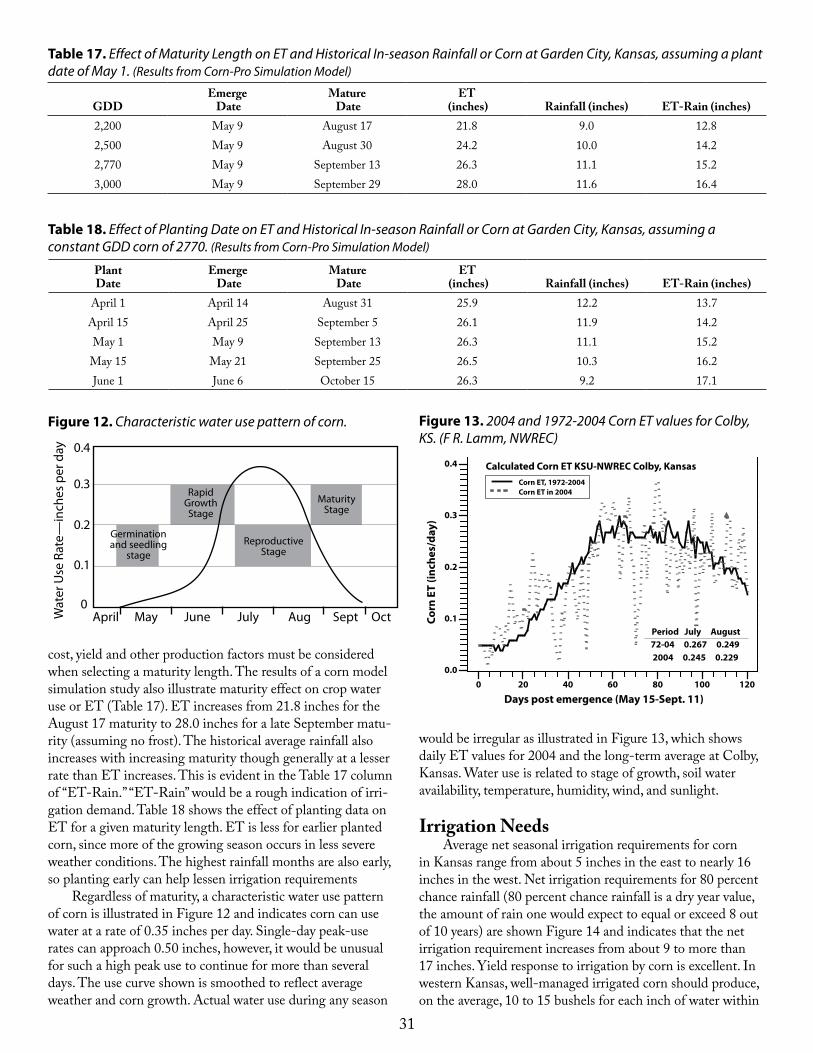
31
cost, yield and other production factors must be considered when selecting a maturity length. The results of a corn model simulation study also illustrate maturity effect on crop water use or ET (Table 17). ET increases from 21.8 inches for the August 17 maturity to 28.0 inches for a late September matu-rity (assuming no frost). The historical average rainfall also increases with increasing maturity though generally at a lesser rate than ET increases. This is evident in the Table 17 column of “ET-Rain.” “ET-Rain” would be a rough indication of irri-gation demand. Table 18 shows the effect of planting data on ET for a given maturity length. ET is less for earlier planted corn, since more of the growing season occurs in less severe weather conditions. The highest rainfall months are also early, so planting early can help lessen irrigation requirements
Regardless of maturity, a characteristic water use pattern of corn is illustrated in Figure 12 and indicates corn can use water at a rate of 0.35 inches per day. Single-day peak-use rates can approach 0.50 inches, however, it would be unusual for such a high peak use to continue for more than several days. The use curve shown is smoothed to reflect average weather and corn growth. Actual water use during any season
would be irregular as illustrated in Figure 13, which shows daily ET values for 2004 and the long-term average at Colby, Kansas. Water use is related to stage of growth, soil water availability, temperature, humidity, wind, and sunlight.
Irrigation NeedsAverage net seasonal irrigation requirements for corn
in Kansas range from about 5 inches in the east to nearly 16 inches in the west. Net irrigation requirements for 80 percent chance rainfall (80 percent chance rainfall is a dry year value, the amount of rain one would expect to equal or exceed 8 out of 10 years) are shown Figure 14 and indicates that the net irrigation requirement increases from about 9 to more than 17 inches. Yield response to irrigation by corn is excellent. In western Kansas, well-managed irrigated corn should produce, on the average, 10 to 15 bushels for each inch of water within
GDDEmerge
DateMature
DateET
(inches) Rainfall (inches) ET-Rain (inches)2,200 May 9 August 17 21.8 9.0 12.82,500 May 9 August 30 24.2 10.0 14.22,770 May 9 September 13 26.3 11.1 15.23,000 May 9 September 29 28.0 11.6 16.4
Table 17. Effect of Maturity Length on ET and Historical In-season Rainfall or Corn at Garden City, Kansas, assuming a plant date of May 1. (Results from Corn-Pro Simulation Model)
April OctSeptAugJulyJuneMay
0.4
0
0.1
0.2
0.3
Wat
er U
se R
ate—
inch
es p
er d
ay
Germination and seedling
stage
Maturity Stage
Reproductive Stage
Rapid Growth Stage
Figure 12. Characteristic water use pattern of corn.
Plant Date
Emerge Date
Mature Date
ET (inches) Rainfall (inches) ET-Rain (inches)
April 1 April 14 August 31 25.9 12.2 13.7April 15 April 25 September 5 26.1 11.9 14.2May 1 May 9 September 13 26.3 11.1 15.2May 15 May 21 September 25 26.5 10.3 16.2June 1 June 6 October 15 26.3 9.2 17.1
Table 18. Effect of Planting Date on ET and Historical In-season Rainfall or Corn at Garden City, Kansas, assuming a constant GDD corn of 2770. (Results from Corn-Pro Simulation Model)
0 20 40 60 80 100 120
Days post emergence (May 15-Sept. 11)
0.0
0.1
0.2
0.3
0.4
Corn
ET
(inch
es/d
ay)
Calculated Corn ET KSU-NWREC Colby, KansasCorn ET, 1972-2004Corn ET in 2004
Period July August 72-04 0.267 0.249 2004 0.245 0.229
Figure 13. 2004 and 1972-2004 Corn ET values for Colby, KS. (F R. Lamm, NWREC)
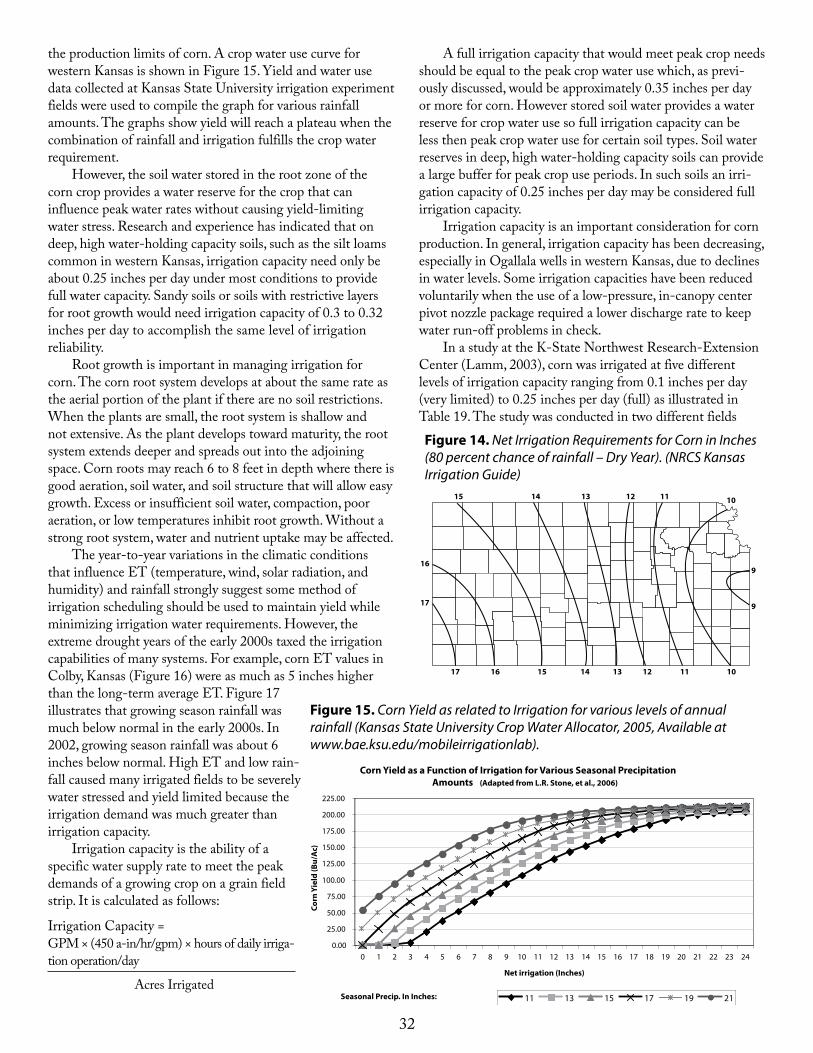
32
Figure 15. Corn Yield as related to Irrigation for various levels of annual rainfall (Kansas State University Crop Water Allocator, 2005, Available at www.bae.ksu.edu/mobileirrigationlab).
Corn Yield as a Function of Irrigation for Various Seasonal Precipitation Amounts (Adapted from L.R. Stone, et al., 2006)
0.00
25.00
50.00
75.00
100.00
125.00
150.00
175.00
200.00
225.00
0 1 2 3 4 5 6 7 8 9 10 11 12 13 14 15 16 17 18 19 20 21 22 23 24
Net irrigation (Inches)
Corn
Yie
ld (B
u/A
c)
11 13 15 17 19 21Seasonal Precip. In Inches:
the production limits of corn. A crop water use curve for western Kansas is shown in Figure 15. Yield and water use data collected at Kansas State University irrigation experiment fields were used to compile the graph for various rainfall amounts. The graphs show yield will reach a plateau when the combination of rainfall and irrigation fulfills the crop water requirement.
However, the soil water stored in the root zone of the corn crop provides a water reserve for the crop that can influence peak water rates without causing yield-limiting water stress. Research and experience has indicated that on deep, high water-holding capacity soils, such as the silt loams common in western Kansas, irrigation capacity need only be about 0.25 inches per day under most conditions to provide full water capacity. Sandy soils or soils with restrictive layers for root growth would need irrigation capacity of 0.3 to 0.32 inches per day to accomplish the same level of irrigation reliability.
Root growth is important in managing irrigation for corn. The corn root system develops at about the same rate as the aerial portion of the plant if there are no soil restrictions. When the plants are small, the root system is shallow and not extensive. As the plant develops toward maturity, the root system extends deeper and spreads out into the adjoining space. Corn roots may reach 6 to 8 feet in depth where there is good aeration, soil water, and soil structure that will allow easy growth. Excess or insufficient soil water, compaction, poor aeration, or low temperatures inhibit root growth. Without a strong root system, water and nutrient uptake may be affected.
The year-to-year variations in the climatic conditions that influence ET (temperature, wind, solar radiation, and humidity) and rainfall strongly suggest some method of irrigation scheduling should be used to maintain yield while minimizing irrigation water requirements. However, the extreme drought years of the early 2000s taxed the irrigation capabilities of many systems. For example, corn ET values in Colby, Kansas (Figure 16) were as much as 5 inches higher than the long-term average ET. Figure 17 illustrates that growing season rainfall was much below normal in the early 2000s. In 2002, growing season rainfall was about 6 inches below normal. High ET and low rain-fall caused many irrigated fields to be severely water stressed and yield limited because the irrigation demand was much greater than irrigation capacity.
Irrigation capacity is the ability of a specific water supply rate to meet the peak demands of a growing crop on a grain field strip. It is calculated as follows:
Irrigation Capacity =GPM × (450 a-in/hr/gpm) × hours of daily irriga-tion operation/day
Acres Irrigated
A full irrigation capacity that would meet peak crop needs should be equal to the peak crop water use which, as previ-ously discussed, would be approximately 0.35 inches per day or more for corn. However stored soil water provides a water reserve for crop water use so full irrigation capacity can be less then peak crop water use for certain soil types. Soil water reserves in deep, high water-holding capacity soils can provide a large buffer for peak crop use periods. In such soils an irri-gation capacity of 0.25 inches per day may be considered full irrigation capacity.
Irrigation capacity is an important consideration for corn production. In general, irrigation capacity has been decreasing, especially in Ogallala wells in western Kansas, due to declines in water levels. Some irrigation capacities have been reduced voluntarily when the use of a low-pressure, in-canopy center pivot nozzle package required a lower discharge rate to keep water run-off problems in check.
In a study at the K-State Northwest Research-Extension Center (Lamm, 2003), corn was irrigated at five different levels of irrigation capacity ranging from 0.1 inches per day (very limited) to 0.25 inches per day (full) as illustrated in Table 19. The study was conducted in two different fields Figure 14. Net Irrigation Requirements for Corn in Inches (80 percent chance of rainfall – Dry Year). (NRCS Kansas Irrigation Guide)
17 1516 11121314 10
9
9
12 11 1014 1315
17
16
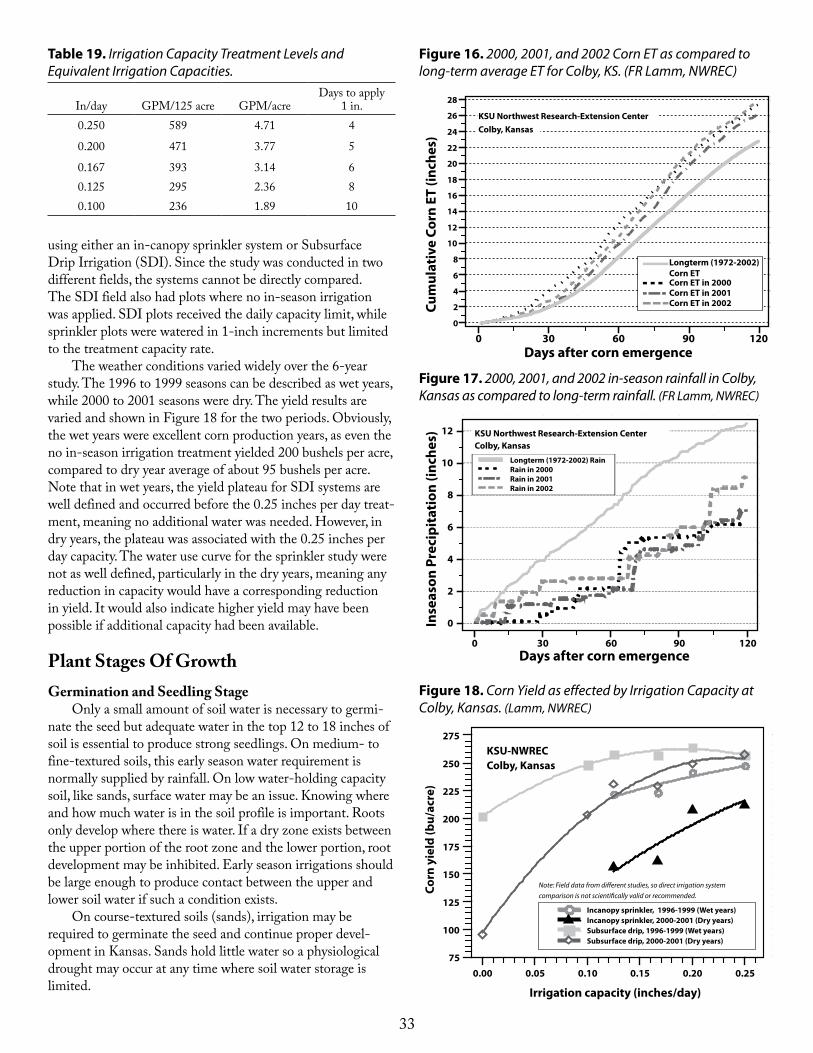
33
using either an in-canopy sprinkler system or Subsurface Drip Irrigation (SDI). Since the study was conducted in two different fields, the systems cannot be directly compared. The SDI field also had plots where no in-season irrigation was applied. SDI plots received the daily capacity limit, while sprinkler plots were watered in 1-inch increments but limited to the treatment capacity rate.
The weather conditions varied widely over the 6-year study. The 1996 to 1999 seasons can be described as wet years, while 2000 to 2001 seasons were dry. The yield results are varied and shown in Figure 18 for the two periods. Obviously, the wet years were excellent corn production years, as even the no in-season irrigation treatment yielded 200 bushels per acre, compared to dry year average of about 95 bushels per acre. Note that in wet years, the yield plateau for SDI systems are well defined and occurred before the 0.25 inches per day treat-ment, meaning no additional water was needed. However, in dry years, the plateau was associated with the 0.25 inches per day capacity. The water use curve for the sprinkler study were not as well defined, particularly in the dry years, meaning any reduction in capacity would have a corresponding reduction in yield. It would also indicate higher yield may have been possible if additional capacity had been available.
Plant Stages Of GrowthGermination and Seedling Stage
Only a small amount of soil water is necessary to germi-nate the seed but adequate water in the top 12 to 18 inches of soil is essential to produce strong seedlings. On medium- to fine-textured soils, this early season water requirement is normally supplied by rainfall. On low water-holding capacity soil, like sands, surface water may be an issue. Knowing where and how much water is in the soil profile is important. Roots only develop where there is water. If a dry zone exists between the upper portion of the root zone and the lower portion, root development may be inhibited. Early season irrigations should be large enough to produce contact between the upper and lower soil water if such a condition exists.
On course-textured soils (sands), irrigation may be required to germinate the seed and continue proper devel-opment in Kansas. Sands hold little water so a physiological drought may occur at any time where soil water storage is limited.
0 30 60 90 120Days after corn emergence
0
2
4
6
8
10
12
14
16
18
20
22
24
26
28
Cum
ulat
ive
Corn
ET
(inch
es)
Longterm (1972-2002)Corn ETCorn ET in 2000Corn ET in 2001Corn ET in 2002
KSU Northwest Research-Extension CenterColby, Kansas
Figure 16. 2000, 2001, and 2002 Corn ET as compared to long-term average ET for Colby, KS. (FR Lamm, NWREC)
In/day GPM/125 acre GPM/acreDays to apply
1 in.0.250 589 4.71 4
0.200 471 3.77 5
0.167 393 3.14 60.125 295 2.36 80.100 236 1.89 10
Table 19. Irrigation Capacity Treatment Levels and Equivalent Irrigation Capacities.
0.00 0.05 0.10 0.15 0.20 0.25
Irrigation capacity (inches/day)
75
100
125
150
175
200
225
250
275
Corn
yie
ld (b
u/ac
re)
Incanopy sprinkler, 1996-1999 (Wet years)Incanopy sprinkler, 2000-2001 (Dry years)Subsurface drip, 1996-1999 (Wet years)Subsurface drip, 2000-2001 (Dry years)
Note: Field data from di�erent studies, so direct irrigation system comparison is not scienti�cally valid or recommended.
KSU-NWRECColby, Kansas
Figure 18. Corn Yield as effected by Irrigation Capacity at Colby, Kansas. (Lamm, NWREC)
0 30 60 90 120Days after corn emergence
0
2
4
6
8
10
12In
seas
on P
reci
pita
tion
(inc
hes) KSU Northwest Research-Extension Center
Colby, KansasLongterm (1972-2002) RainRain in 2000Rain in 2001Rain in 2002
Figure 17. 2000, 2001, and 2002 in-season rainfall in Colby, Kansas as compared to long-term rainfall. (FR Lamm, NWREC)
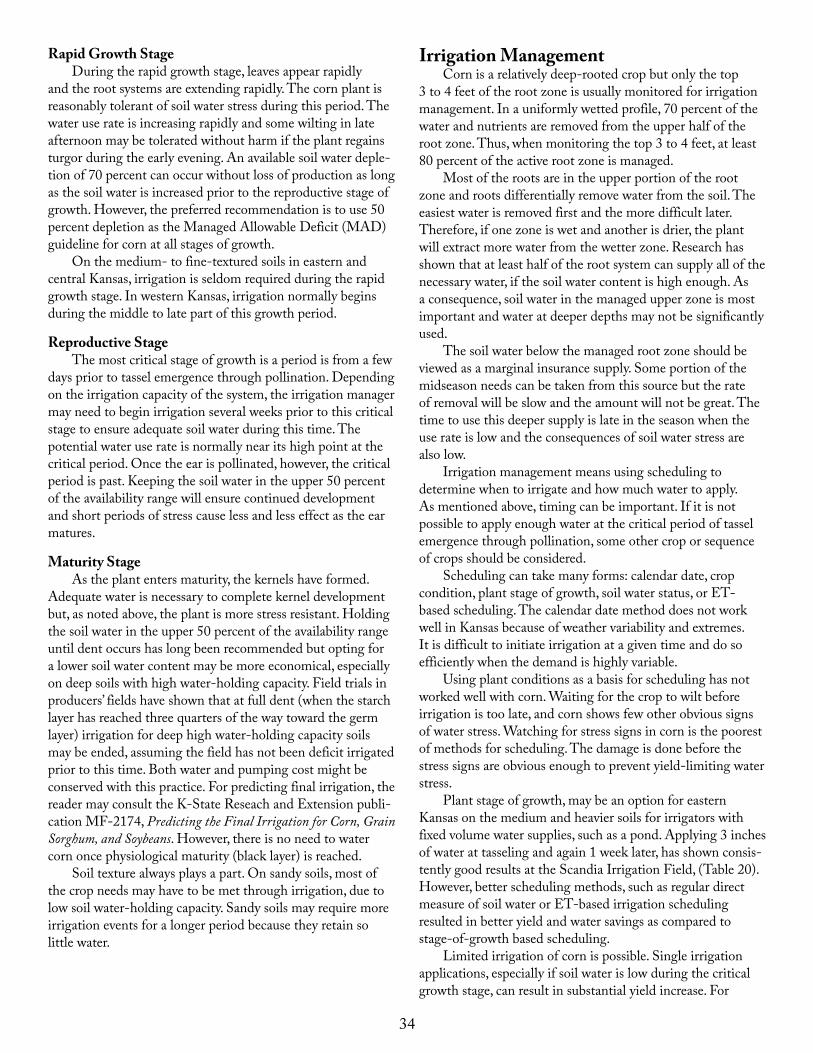
34
Rapid Growth StageDuring the rapid growth stage, leaves appear rapidly
and the root systems are extending rapidly. The corn plant is reasonably tolerant of soil water stress during this period. The water use rate is increasing rapidly and some wilting in late afternoon may be tolerated without harm if the plant regains turgor during the early evening. An available soil water deple-tion of 70 percent can occur without loss of production as long as the soil water is increased prior to the reproductive stage of growth. However, the preferred recommendation is to use 50 percent depletion as the Managed Allowable Deficit (MAD) guideline for corn at all stages of growth.
On the medium- to fine-textured soils in eastern and central Kansas, irrigation is seldom required during the rapid growth stage. In western Kansas, irrigation normally begins during the middle to late part of this growth period.
Reproductive StageThe most critical stage of growth is a period is from a few
days prior to tassel emergence through pollination. Depending on the irrigation capacity of the system, the irrigation manager may need to begin irrigation several weeks prior to this critical stage to ensure adequate soil water during this time. The potential water use rate is normally near its high point at the critical period. Once the ear is pollinated, however, the critical period is past. Keeping the soil water in the upper 50 percent of the availability range will ensure continued development and short periods of stress cause less and less effect as the ear matures.
Maturity StageAs the plant enters maturity, the kernels have formed.
Adequate water is necessary to complete kernel development but, as noted above, the plant is more stress resistant. Holding the soil water in the upper 50 percent of the availability range until dent occurs has long been recommended but opting for a lower soil water content may be more economical, especially on deep soils with high water-holding capacity. Field trials in producers’ fields have shown that at full dent (when the starch layer has reached three quarters of the way toward the germ layer) irrigation for deep high water-holding capacity soils may be ended, assuming the field has not been deficit irrigated prior to this time. Both water and pumping cost might be conserved with this practice. For predicting final irrigation, the reader may consult the K-State Reseach and Extension publi-cation MF-2174, Predicting the Final Irrigation for Corn, Grain Sorghum, and Soybeans. However, there is no need to water corn once physiological maturity (black layer) is reached.
Soil texture always plays a part. On sandy soils, most of the crop needs may have to be met through irrigation, due to low soil water-holding capacity. Sandy soils may require more irrigation events for a longer period because they retain so little water.
Irrigation ManagementCorn is a relatively deep-rooted crop but only the top
3 to 4 feet of the root zone is usually monitored for irrigation management. In a uniformly wetted profile, 70 percent of the water and nutrients are removed from the upper half of the root zone. Thus, when monitoring the top 3 to 4 feet, at least 80 percent of the active root zone is managed.
Most of the roots are in the upper portion of the root zone and roots differentially remove water from the soil. The easiest water is removed first and the more difficult later. Therefore, if one zone is wet and another is drier, the plant will extract more water from the wetter zone. Research has shown that at least half of the root system can supply all of the necessary water, if the soil water content is high enough. As a consequence, soil water in the managed upper zone is most important and water at deeper depths may not be significantly used.
The soil water below the managed root zone should be viewed as a marginal insurance supply. Some portion of the midseason needs can be taken from this source but the rate of removal will be slow and the amount will not be great. The time to use this deeper supply is late in the season when the use rate is low and the consequences of soil water stress are also low.
Irrigation management means using scheduling to determine when to irrigate and how much water to apply. As mentioned above, timing can be important. If it is not possible to apply enough water at the critical period of tassel emergence through pollination, some other crop or sequence of crops should be considered.
Scheduling can take many forms: calendar date, crop condition, plant stage of growth, soil water status, or ET-based scheduling. The calendar date method does not work well in Kansas because of weather variability and extremes. It is difficult to initiate irrigation at a given time and do so efficiently when the demand is highly variable.
Using plant conditions as a basis for scheduling has not worked well with corn. Waiting for the crop to wilt before irrigation is too late, and corn shows few other obvious signs of water stress. Watching for stress signs in corn is the poorest of methods for scheduling. The damage is done before the stress signs are obvious enough to prevent yield-limiting water stress.
Plant stage of growth, may be an option for eastern Kansas on the medium and heavier soils for irrigators with fixed volume water supplies, such as a pond. Applying 3 inches of water at tasseling and again 1 week later, has shown consis-tently good results at the Scandia Irrigation Field, (Table 20). However, better scheduling methods, such as regular direct measure of soil water or ET-based irrigation scheduling resulted in better yield and water savings as compared to stage-of-growth based scheduling.
Limited irrigation of corn is possible. Single irrigation applications, especially if soil water is low during the critical growth stage, can result in substantial yield increase. For
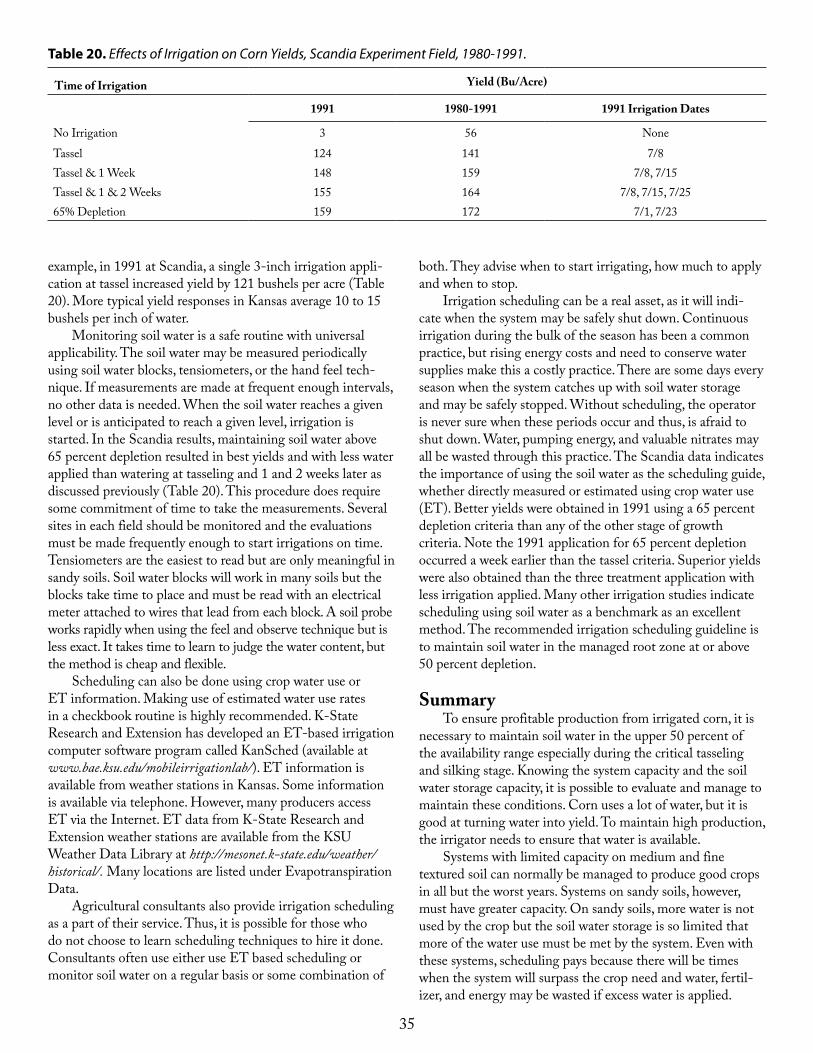
35
example, in 1991 at Scandia, a single 3-inch irrigation appli-cation at tassel increased yield by 121 bushels per acre (Table 20). More typical yield responses in Kansas average 10 to 15 bushels per inch of water.
Monitoring soil water is a safe routine with universal applicability. The soil water may be measured periodically using soil water blocks, tensiometers, or the hand feel tech-nique. If measurements are made at frequent enough intervals, no other data is needed. When the soil water reaches a given level or is anticipated to reach a given level, irrigation is started. In the Scandia results, maintaining soil water above 65 percent depletion resulted in best yields and with less water applied than watering at tasseling and 1 and 2 weeks later as discussed previously (Table 20). This procedure does require some commitment of time to take the measurements. Several sites in each field should be monitored and the evaluations must be made frequently enough to start irrigations on time. Tensiometers are the easiest to read but are only meaningful in sandy soils. Soil water blocks will work in many soils but the blocks take time to place and must be read with an electrical meter attached to wires that lead from each block. A soil probe works rapidly when using the feel and observe technique but is less exact. It takes time to learn to judge the water content, but the method is cheap and flexible.
Scheduling can also be done using crop water use or ET information. Making use of estimated water use rates in a checkbook routine is highly recommended. K-State Research and Extension has developed an ET-based irrigation computer software program called KanSched (available at www.bae.ksu.edu/mobileirrigationlab/). ET information is available from weather stations in Kansas. Some information is available via telephone. However, many producers access ET via the Internet. ET data from K-State Research and Extension weather stations are available from the KSU Weather Data Library at http://mesonet.k-state.edu/weather/historical/. Many locations are listed under Evapotranspiration Data.
Agricultural consultants also provide irrigation scheduling as a part of their service. Thus, it is possible for those who do not choose to learn scheduling techniques to hire it done. Consultants often use either use ET based scheduling or monitor soil water on a regular basis or some combination of
both. They advise when to start irrigating, how much to apply and when to stop.
Irrigation scheduling can be a real asset, as it will indi-cate when the system may be safely shut down. Continuous irrigation during the bulk of the season has been a common practice, but rising energy costs and need to conserve water supplies make this a costly practice. There are some days every season when the system catches up with soil water storage and may be safely stopped. Without scheduling, the operator is never sure when these periods occur and thus, is afraid to shut down. Water, pumping energy, and valuable nitrates may all be wasted through this practice. The Scandia data indicates the importance of using the soil water as the scheduling guide, whether directly measured or estimated using crop water use (ET). Better yields were obtained in 1991 using a 65 percent depletion criteria than any of the other stage of growth criteria. Note the 1991 application for 65 percent depletion occurred a week earlier than the tassel criteria. Superior yields were also obtained than the three treatment application with less irrigation applied. Many other irrigation studies indicate scheduling using soil water as a benchmark as an excellent method. The recommended irrigation scheduling guideline is to maintain soil water in the managed root zone at or above 50 percent depletion.
SummaryTo ensure profitable production from irrigated corn, it is
necessary to maintain soil water in the upper 50 percent of the availability range especially during the critical tasseling and silking stage. Knowing the system capacity and the soil water storage capacity, it is possible to evaluate and manage to maintain these conditions. Corn uses a lot of water, but it is good at turning water into yield. To maintain high production, the irrigator needs to ensure that water is available.
Systems with limited capacity on medium and fine textured soil can normally be managed to produce good crops in all but the worst years. Systems on sandy soils, however, must have greater capacity. On sandy soils, more water is not used by the crop but the soil water storage is so limited that more of the water use must be met by the system. Even with these systems, scheduling pays because there will be times when the system will surpass the crop need and water, fertil-izer, and energy may be wasted if excess water is applied.
Time of Irrigation Yield (Bu/Acre)
1991 1980-1991 1991 Irrigation Dates
No Irrigation 3 56 NoneTassel 124 141 7/8Tassel & 1 Week 148 159 7/8, 7/15Tassel & 1 & 2 Weeks 155 164 7/8, 7/15, 7/2565% Depletion 159 172 7/1, 7/23
Table 20. Effects of Irrigation on Corn Yields, Scandia Experiment Field, 1980-1991.
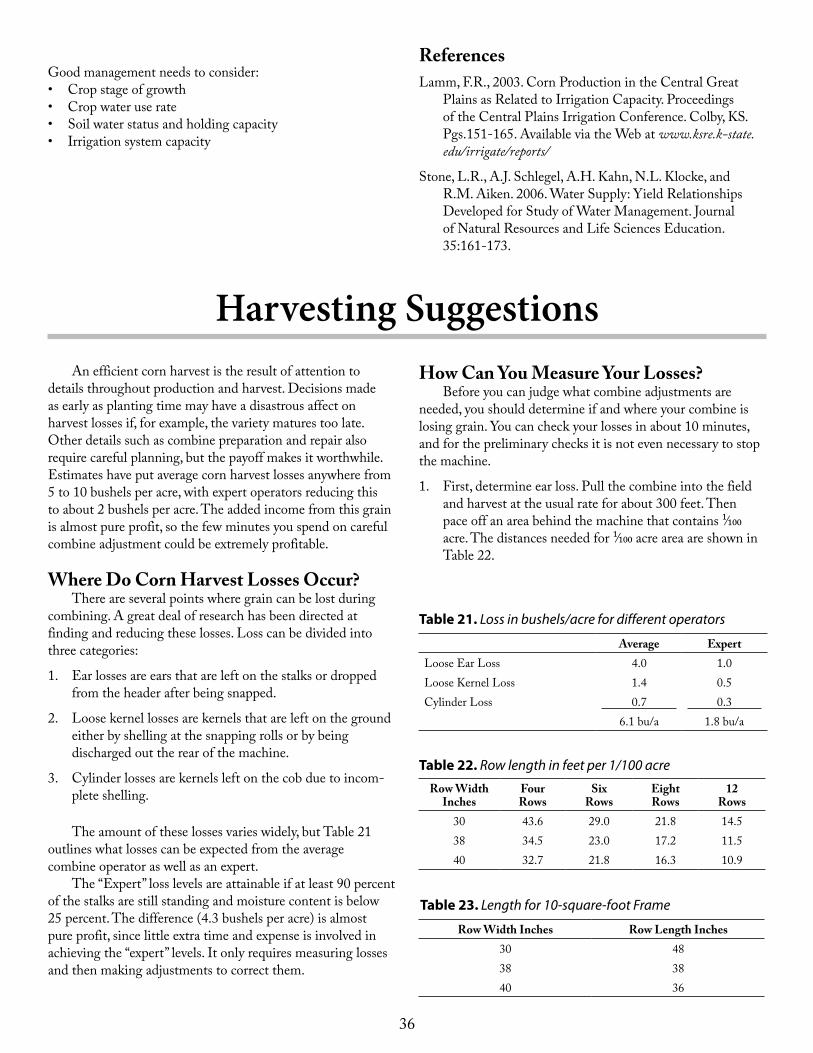
36
Harvesting SuggestionsAn efficient corn harvest is the result of attention to
details throughout production and harvest. Decisions made as early as planting time may have a disastrous affect on harvest losses if, for example, the variety matures too late. Other details such as combine preparation and repair also require careful planning, but the payoff makes it worthwhile. Estimates have put average corn harvest losses anywhere from 5 to 10 bushels per acre, with expert operators reducing this to about 2 bushels per acre. The added income from this grain is almost pure profit, so the few minutes you spend on careful combine adjustment could be extremely profitable.
Where Do Corn Harvest Losses Occur?There are several points where grain can be lost during
combining. A great deal of research has been directed at finding and reducing these losses. Loss can be divided into three categories:
1. Ear losses are ears that are left on the stalks or dropped from the header after being snapped.
2. Loose kernel losses are kernels that are left on the ground either by shelling at the snapping rolls or by being discharged out the rear of the machine.
3. Cylinder losses are kernels left on the cob due to incom-plete shelling.
The amount of these losses varies widely, but Table 21 outlines what losses can be expected from the average combine operator as well as an expert.
The “Expert” loss levels are attainable if at least 90 percent of the stalks are still standing and moisture content is below 25 percent. The difference (4.3 bushels per acre) is almost pure profit, since little extra time and expense is involved in achieving the “expert” levels. It only requires measuring losses and then making adjustments to correct them.
How Can You Measure Your Losses?Before you can judge what combine adjustments are
needed, you should determine if and where your combine is losing grain. You can check your losses in about 10 minutes, and for the preliminary checks it is not even necessary to stop the machine.
1. First, determine ear loss. Pull the combine into the field and harvest at the usual rate for about 300 feet. Then pace off an area behind the machine that contains ¹⁄100 acre. The distances needed for ¹⁄100 acre area are shown in Table 22.
Average ExpertLoose Ear Loss 4.0 1.0Loose Kernel Loss 1.4 0.5Cylinder Loss 0.7 0.3
6.1 bu/a 1.8 bu/a
Table 21. Loss in bushels/acre for different operators
Row Width Inches
Four Rows
Six Rows
Eight Rows
12 Rows
30 43.6 29.0 21.8 14.538 34.5 23.0 17.2 11.540 32.7 21.8 16.3 10.9
Table 22. Row length in feet per 1/100 acre
Row Width Inches Row Length Inches30 4838 3840 36
Table 23. Length for 10-square-foot Frame
Good management needs to consider:• Crop stage of growth• Crop water use rate• Soil water status and holding capacity• Irrigation system capacity
ReferencesLamm, F.R., 2003. Corn Production in the Central Great
Plains as Related to Irrigation Capacity. Proceedings of the Central Plains Irrigation Conference. Colby, KS. Pgs.151-165. Available via the Web at www.ksre.k-state.edu/irrigate/reports/
Stone, L.R., A.J. Schlegel, A.H. Kahn, N.L. Klocke, and R.M. Aiken. 2006. Water Supply: Yield Relationships Developed for Study of Water Management. Journal of Natural Resources and Life Sciences Education. 35:161-173.
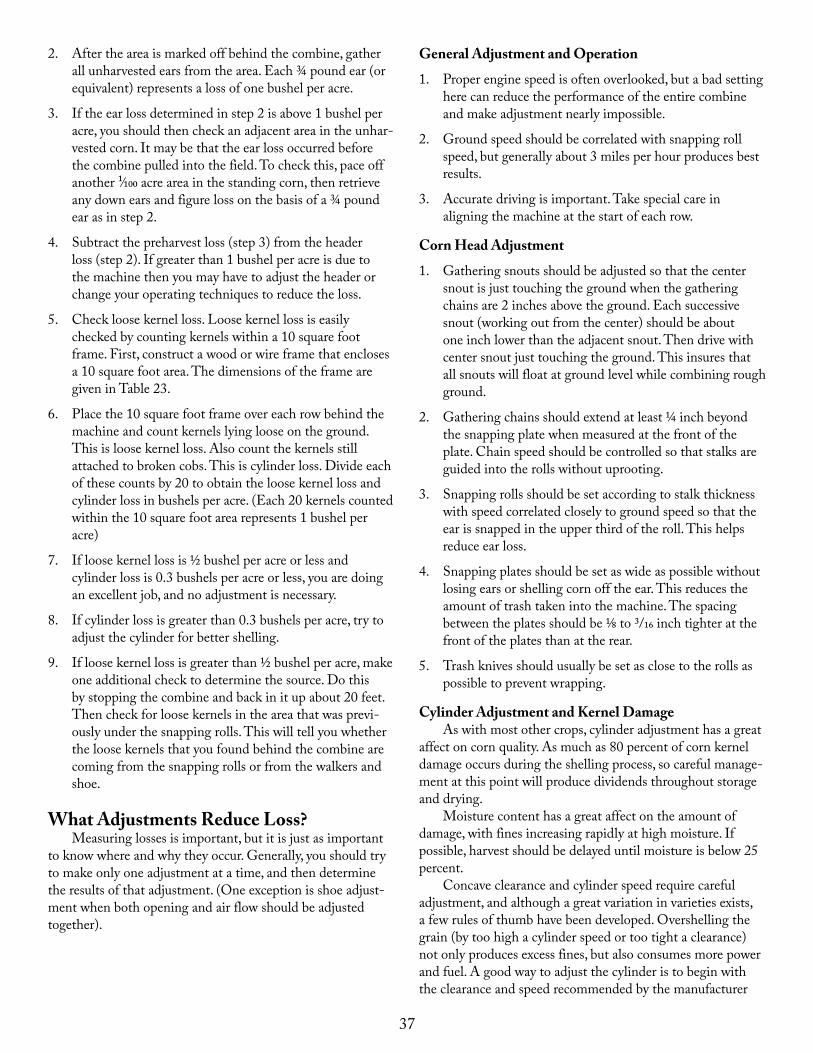
37
2. After the area is marked off behind the combine, gather all unharvested ears from the area. Each ¾ pound ear (or equivalent) represents a loss of one bushel per acre.
3. If the ear loss determined in step 2 is above 1 bushel per acre, you should then check an adjacent area in the unhar-vested corn. It may be that the ear loss occurred before the combine pulled into the field. To check this, pace off another ¹⁄100 acre area in the standing corn, then retrieve any down ears and figure loss on the basis of a ¾ pound ear as in step 2.
4. Subtract the preharvest loss (step 3) from the header loss (step 2). If greater than 1 bushel per acre is due to the machine then you may have to adjust the header or change your operating techniques to reduce the loss.
5. Check loose kernel loss. Loose kernel loss is easily checked by counting kernels within a 10 square foot frame. First, construct a wood or wire frame that encloses a 10 square foot area. The dimensions of the frame are given in Table 23.
6. Place the 10 square foot frame over each row behind the machine and count kernels lying loose on the ground. This is loose kernel loss. Also count the kernels still attached to broken cobs. This is cylinder loss. Divide each of these counts by 20 to obtain the loose kernel loss and cylinder loss in bushels per acre. (Each 20 kernels counted within the 10 square foot area represents 1 bushel per acre)
7. If loose kernel loss is ½ bushel per acre or less and cylinder loss is 0.3 bushels per acre or less, you are doing an excellent job, and no adjustment is necessary.
8. If cylinder loss is greater than 0.3 bushels per acre, try to adjust the cylinder for better shelling.
9. If loose kernel loss is greater than ½ bushel per acre, make one additional check to determine the source. Do this by stopping the combine and back in it up about 20 feet. Then check for loose kernels in the area that was previ-ously under the snapping rolls. This will tell you whether the loose kernels that you found behind the combine are coming from the snapping rolls or from the walkers and shoe.
What Adjustments Reduce Loss?Measuring losses is important, but it is just as important
to know where and why they occur. Generally, you should try to make only one adjustment at a time, and then determine the results of that adjustment. (One exception is shoe adjust-ment when both opening and air flow should be adjusted together).
General Adjustment and Operation
1. Proper engine speed is often overlooked, but a bad setting here can reduce the performance of the entire combine and make adjustment nearly impossible.
2. Ground speed should be correlated with snapping roll speed, but generally about 3 miles per hour produces best results.
3. Accurate driving is important. Take special care in aligning the machine at the start of each row.
Corn Head Adjustment
1. Gathering snouts should be adjusted so that the center snout is just touching the ground when the gathering chains are 2 inches above the ground. Each successive snout (working out from the center) should be about one inch lower than the adjacent snout. Then drive with center snout just touching the ground. This insures that all snouts will float at ground level while combining rough ground.
2. Gathering chains should extend at least ¼ inch beyond the snapping plate when measured at the front of the plate. Chain speed should be controlled so that stalks are guided into the rolls without uprooting.
3. Snapping rolls should be set according to stalk thickness with speed correlated closely to ground speed so that the ear is snapped in the upper third of the roll. This helps reduce ear loss.
4. Snapping plates should be set as wide as possible without losing ears or shelling corn off the ear. This reduces the amount of trash taken into the machine. The spacing between the plates should be ⅛ to 3/16 inch tighter at the front of the plates than at the rear.
5. Trash knives should usually be set as close to the rolls as possible to prevent wrapping.
Cylinder Adjustment and Kernel DamageAs with most other crops, cylinder adjustment has a great
affect on corn quality. As much as 80 percent of corn kernel damage occurs during the shelling process, so careful manage-ment at this point will produce dividends throughout storage and drying.
Moisture content has a great affect on the amount of damage, with fines increasing rapidly at high moisture. If possible, harvest should be delayed until moisture is below 25 percent.
Concave clearance and cylinder speed require careful adjustment, and although a great variation in varieties exists, a few rules of thumb have been developed. Overshelling the grain (by too high a cylinder speed or too tight a clearance) not only produces excess fines, but also consumes more power and fuel. A good way to adjust the cylinder is to begin with the clearance and speed recommended by the manufacturer
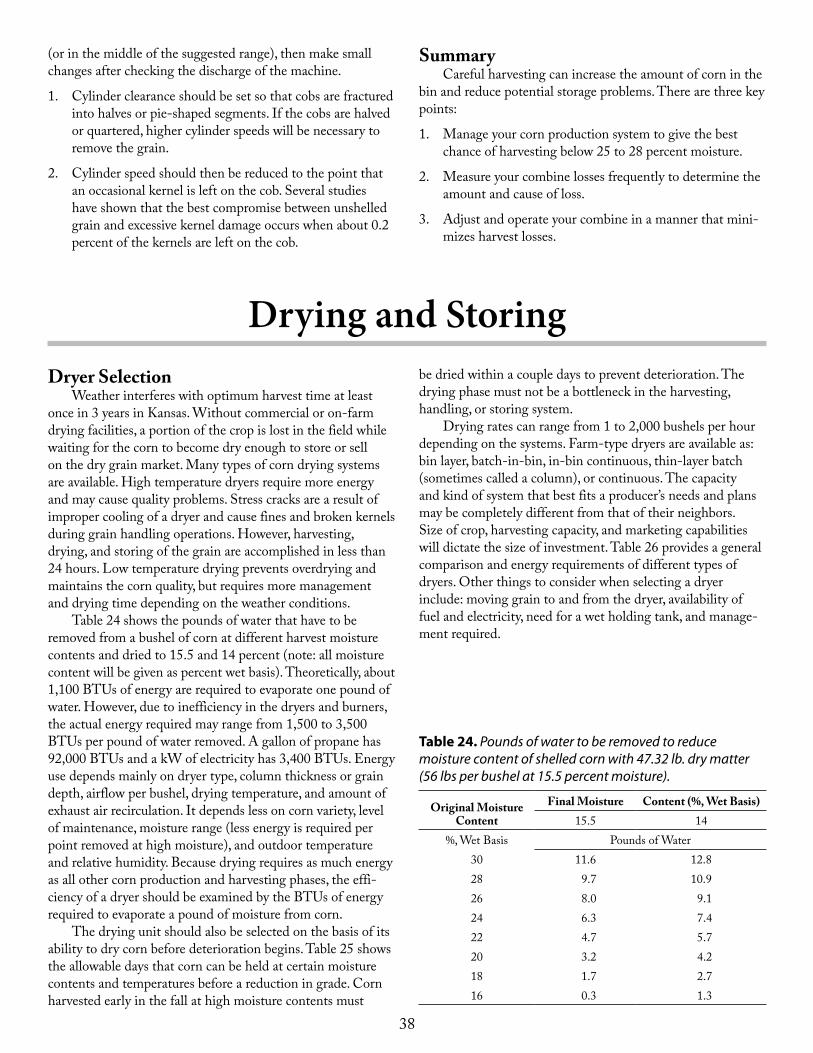
38
Dryer SelectionWeather interferes with optimum harvest time at least
once in 3 years in Kansas. Without commercial or on-farm drying facilities, a portion of the crop is lost in the field while waiting for the corn to become dry enough to store or sell on the dry grain market. Many types of corn drying systems are available. High temperature dryers require more energy and may cause quality problems. Stress cracks are a result of improper cooling of a dryer and cause fines and broken kernels during grain handling operations. However, harvesting, drying, and storing of the grain are accomplished in less than 24 hours. Low temperature drying prevents overdrying and maintains the corn quality, but requires more management and drying time depending on the weather conditions.
Table 24 shows the pounds of water that have to be removed from a bushel of corn at different harvest moisture contents and dried to 15.5 and 14 percent (note: all moisture content will be given as percent wet basis). Theoretically, about 1,100 BTUs of energy are required to evaporate one pound of water. However, due to inefficiency in the dryers and burners, the actual energy required may range from 1,500 to 3,500 BTUs per pound of water removed. A gallon of propane has 92,000 BTUs and a kW of electricity has 3,400 BTUs. Energy use depends mainly on dryer type, column thickness or grain depth, airflow per bushel, drying temperature, and amount of exhaust air recirculation. It depends less on corn variety, level of maintenance, moisture range (less energy is required per point removed at high moisture), and outdoor temperature and relative humidity. Because drying requires as much energy as all other corn production and harvesting phases, the effi-ciency of a dryer should be examined by the BTUs of energy required to evaporate a pound of moisture from corn.
The drying unit should also be selected on the basis of its ability to dry corn before deterioration begins. Table 25 shows the allowable days that corn can be held at certain moisture contents and temperatures before a reduction in grade. Corn harvested early in the fall at high moisture contents must
Drying and Storingbe dried within a couple days to prevent deterioration. The drying phase must not be a bottleneck in the harvesting, handling, or storing system.
Drying rates can range from 1 to 2,000 bushels per hour depending on the systems. Farm-type dryers are available as: bin layer, batch-in-bin, in-bin continuous, thin-layer batch (sometimes called a column), or continuous. The capacity and kind of system that best fits a producer’s needs and plans may be completely different from that of their neighbors. Size of crop, harvesting capacity, and marketing capabilities will dictate the size of investment. Table 26 provides a general comparison and energy requirements of different types of dryers. Other things to consider when selecting a dryer include: moving grain to and from the dryer, availability of fuel and electricity, need for a wet holding tank, and manage-ment required.
Original Moisture Content
Final Moisture Content (%, Wet Basis)15.5 14
%, Wet Basis Pounds of Water30 11.6 12.828 9.7 10.926 8.0 9.124 6.3 7.422 4.7 5.720 3.2 4.218 1.7 2.716 0.3 1.3
Table 24. Pounds of water to be removed to reduce moisture content of shelled corn with 47.32 lb. dry matter (56 lbs per bushel at 15.5 percent moisture).
(or in the middle of the suggested range), then make small changes after checking the discharge of the machine.
1. Cylinder clearance should be set so that cobs are fractured into halves or pie-shaped segments. If the cobs are halved or quartered, higher cylinder speeds will be necessary to remove the grain.
2. Cylinder speed should then be reduced to the point that an occasional kernel is left on the cob. Several studies have shown that the best compromise between unshelled grain and excessive kernel damage occurs when about 0.2 percent of the kernels are left on the cob.
SummaryCareful harvesting can increase the amount of corn in the
bin and reduce potential storage problems. There are three key points:
1. Manage your corn production system to give the best chance of harvesting below 25 to 28 percent moisture.
2. Measure your combine losses frequently to determine the amount and cause of loss.
3. Adjust and operate your combine in a manner that mini-mizes harvest losses.
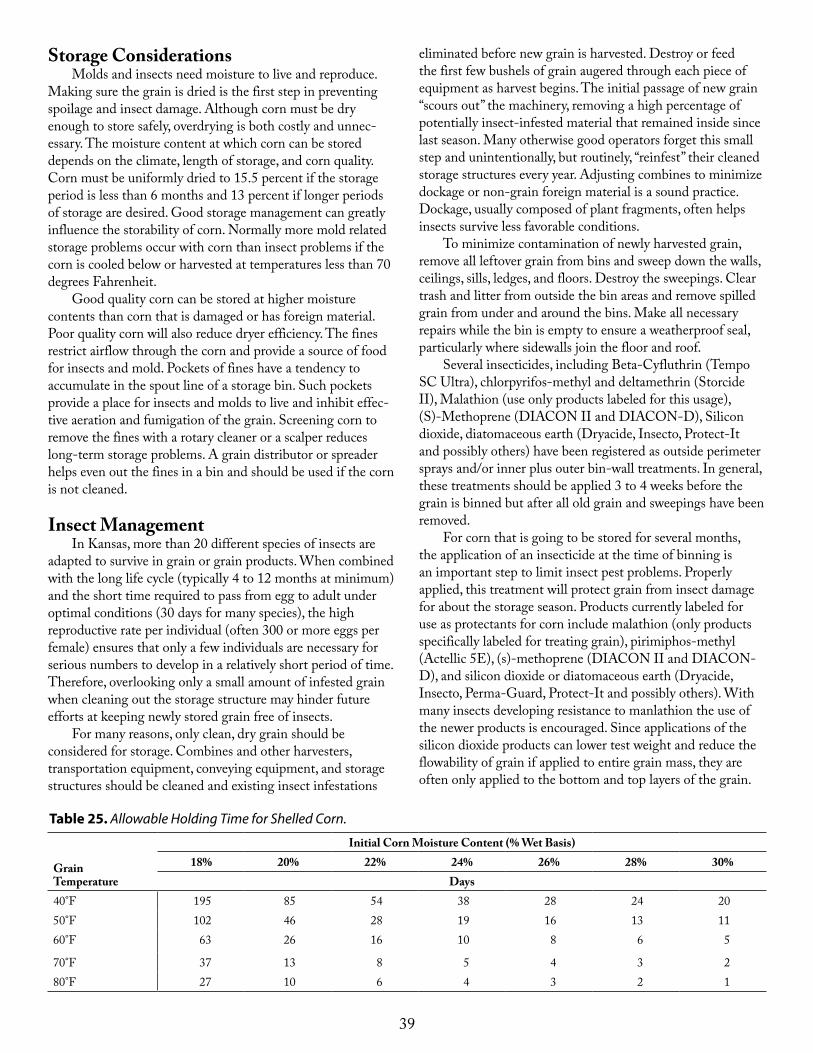
39
Storage ConsiderationsMolds and insects need moisture to live and reproduce.
Making sure the grain is dried is the first step in preventing spoilage and insect damage. Although corn must be dry enough to store safely, overdrying is both costly and unnec-essary. The moisture content at which corn can be stored depends on the climate, length of storage, and corn quality. Corn must be uniformly dried to 15.5 percent if the storage period is less than 6 months and 13 percent if longer periods of storage are desired. Good storage management can greatly influence the storability of corn. Normally more mold related storage problems occur with corn than insect problems if the corn is cooled below or harvested at temperatures less than 70 degrees Fahrenheit.
Good quality corn can be stored at higher moisture contents than corn that is damaged or has foreign material. Poor quality corn will also reduce dryer efficiency. The fines restrict airflow through the corn and provide a source of food for insects and mold. Pockets of fines have a tendency to accumulate in the spout line of a storage bin. Such pockets provide a place for insects and molds to live and inhibit effec-tive aeration and fumigation of the grain. Screening corn to remove the fines with a rotary cleaner or a scalper reduces long-term storage problems. A grain distributor or spreader helps even out the fines in a bin and should be used if the corn is not cleaned.
Insect ManagementIn Kansas, more than 20 different species of insects are
adapted to survive in grain or grain products. When combined with the long life cycle (typically 4 to 12 months at minimum) and the short time required to pass from egg to adult under optimal conditions (30 days for many species), the high reproductive rate per individual (often 300 or more eggs per female) ensures that only a few individuals are necessary for serious numbers to develop in a relatively short period of time. Therefore, overlooking only a small amount of infested grain when cleaning out the storage structure may hinder future efforts at keeping newly stored grain free of insects.
For many reasons, only clean, dry grain should be considered for storage. Combines and other harvesters, transportation equipment, conveying equipment, and storage structures should be cleaned and existing insect infestations
eliminated before new grain is harvested. Destroy or feed the first few bushels of grain augered through each piece of equipment as harvest begins. The initial passage of new grain “scours out” the machinery, removing a high percentage of potentially insect-infested material that remained inside since last season. Many otherwise good operators forget this small step and unintentionally, but routinely, “reinfest” their cleaned storage structures every year. Adjusting combines to minimize dockage or non-grain foreign material is a sound practice. Dockage, usually composed of plant fragments, often helps insects survive less favorable conditions.
To minimize contamination of newly harvested grain, remove all leftover grain from bins and sweep down the walls, ceilings, sills, ledges, and floors. Destroy the sweepings. Clear trash and litter from outside the bin areas and remove spilled grain from under and around the bins. Make all necessary repairs while the bin is empty to ensure a weatherproof seal, particularly where sidewalls join the floor and roof.
Several insecticides, including Beta-Cyfluthrin (Tempo SC Ultra), chlorpyrifos-methyl and deltamethrin (Storcide II), Malathion (use only products labeled for this usage), (S)-Methoprene (DIACON II and DIACON-D), Silicon dioxide, diatomaceous earth (Dryacide, Insecto, Protect-It and possibly others) have been registered as outside perimeter sprays and/or inner plus outer bin-wall treatments. In general, these treatments should be applied 3 to 4 weeks before the grain is binned but after all old grain and sweepings have been removed.
For corn that is going to be stored for several months, the application of an insecticide at the time of binning is an important step to limit insect pest problems. Properly applied, this treatment will protect grain from insect damage for about the storage season. Products currently labeled for use as protectants for corn include malathion (only products specifically labeled for treating grain), pirimiphos-methyl (Actellic 5E), (s)-methoprene (DIACON II and DIACON-D), and silicon dioxide or diatomaceous earth (Dryacide, Insecto, Perma-Guard, Protect-It and possibly others). With many insects developing resistance to manlathion the use of the newer products is encouraged. Since applications of the silicon dioxide products can lower test weight and reduce the flowability of grain if applied to entire grain mass, they are often only applied to the bottom and top layers of the grain.
Initial Corn Moisture Content (% Wet Basis)
GrainTemperature
18% 20% 22% 24% 26% 28% 30%Days
40°F 195 85 54 38 28 24 2050°F 102 46 28 19 16 13 1160°F 63 26 16 10 8 6 5
70°F 37 13 8 5 4 3 280°F 27 10 6 4 3 2 1
Table 25. Allowable Holding Time for Shelled Corn.
40
If a protectant is not used on all incoming grain, it is advisable to apply a “capout” treatment to the grain surface to at least provide some protection to incoming pests.
Slow-release DDVP or dichlorvos strips and several formulations of Bacillus thuringienses, a biological insecticide, are available for use against Indian meal moth adults and larvae, respectively. The strips are hung in the overspace at the rate of one strip per 1,000 cubic feet. Bacillus thuringiensis is an insecticide that is a derivative of an insect disease agent effective only following ingestion by certain moth larvae, including Indian meal moth. This product, marketed as Dipel, is mixed with the surface four to six inches of grain.
Optimal feeding and reproduction of storage insects typically occurs from 70 degrees Fahrenheit to 90 degrees Fahrenheit. As grain temperatures drop to near 60 degrees Fahrenheit, reproduction falls off rapidly. Most visible insect activity, including feeding, ceases when grain temperatures fall below 50 degrees Fahrenheit. In addition, mold activity may double with each 10 degrees Fahrenheit rise in temperature, but is normally minimized at temperatures below 50 degrees Fahrenheit. Thus, proper use of aeration fans can slow or halt pest damage with the onset of cooler weather. In addition, insects have a more difficult time developing to serious levels as grain moistures are lowered to 12 percent or below.
Storage bins should be equipped with an aeration system that provides a reasonably uniform airflow of about 1/10 cubic feet of air per minute per bushel. Aeration controls grain temperature to prevent or reduce spoilage and insect and mold activity. Aeration brings the corn to an uniform temperature, which prevents moisture migration. Aeration is not a drying process, although small moisture changes of up to 1 percent do occur with a change in temperature. During aeration (cooling or warming), a temperature zone moves through the corn, much like a drying front during drying, only much faster.
Insects are not able to grow and reproduce in an environ-ment where the temperature is below 50 degrees Fahrenheit. The corn should be maintained at 40 degrees Fahrenheit during the winter and 50 degrees Fahrenheit to 60 degrees Fahrenheit during the summer. To cool the corn in the fall, the average outdoor temperatures (average of high and low for a day) should be 10 degrees Fahrenheit to 15 degrees Fahrenheit lower than the corn temperature. The fan should run continuously until the corn is completely cooled, unless the fan is automatically controlled. The temperature of corn should be measured at multiple points within the bin to be sure it has cooled adequately.
Grain Bin InspectionsCareful observation is the best way to detect unfavor-
able storage conditions. The corn should be checked every week in the fall, spring, and summer and every 2 weeks in the winter. Turn the fan on for about 20 minutes while checking grain conditions. Be observant for changes in temperature, moisture, and odors. A faint musty odor is the first indica-tion that something may be happening. This is particularly
true during the spring when heating may be occurring due to warm weather or molds and insects. A long 3/8-inch diam-eter rod can be used to detect hard, compact layers of corn, which indicate spoilage. Also, a probe can be used to remove samples to determine moisture content and insect activity below the surface of the bin. To inspect grain properly, you will need: a grain probe; a section of eave trough or strip of canvas for handling the grain from the probe; screening pans for sifting insects from the grain samples; and a means of measuring temperatures in the grain. A record book of grain temperatures can help detect gradual increases in grain temperature. Slight increases are early signs that heating and potential spoilage may be occurring. Thermometers or temperature monitoring systems can be used to measure the grain temperature. If live insects are detected in the grain mass, a determination will need to be made as to whether the infestation justifies fumigation. If fumigation is needed then it should be done by specially trained applicators.
Alternatives to Drying CornShelled corn storage options common today include dry
storage, ensiled, and preservative treated. Corn produced for feed on the farm need not be dried if properly stored. Whole, shelled, high-moisture corn can be stored in oxygen-limiting silos; but a medium grind is needed for proper packing if “wet” corn is stored in conventional silos. Wet corn may also be bin-stored if preserved with propionic acid or a propionic-acetic mixture. If the acids are inadequately applied or become diluted, molds will grow and spoil the corn.
Select the method that fits your use or marketing situ-ation. The key fact to remember is, ensiled or preservative-treated corn is an animal feed. It is not suitable for the cash grain or human-food market. It does, however, offer another storage option to the producer who feeds his corn or has a dependable market agreement with a local feeder. Research shows livestock feeding performance on ensiled or treated corn equals or exceeds dry grain feeding performance. Some guidelines on wet corn storage management are as follows:
Wet Corn, Open Non-Sealed Silo, Upright or Bunker• Moisture level when stored — 25 to 30 percent• Process — roll or grind when placed in storage• Thoroughly pack corn placed in trenches or bunkers and
cover to reduce surface losses• Feed within 24 hours after removal from silo in winter
— 12 hours in summer
Wet Corn, Sealed or Oxygen Limiting Storage• Moisture level when ensiled — 20 percent or more• Process corn as it is removed from silo• Fed within 24 hours after removal in winter — 12 hours in
summer
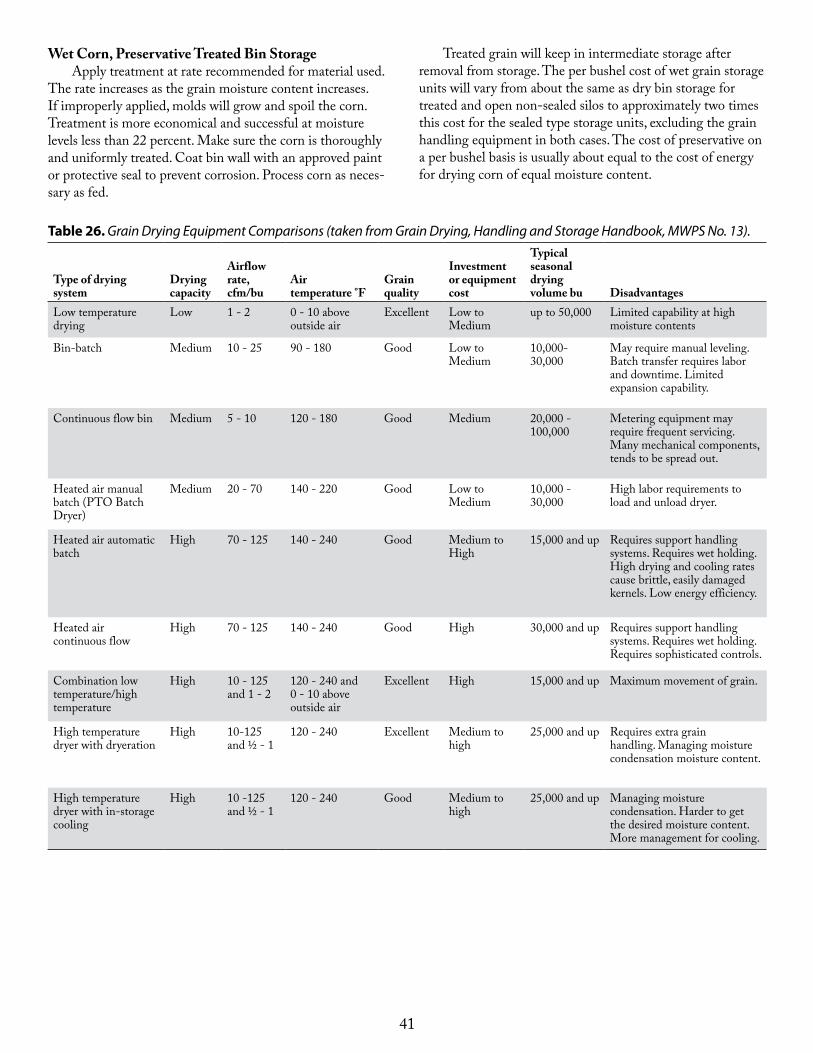
41
Wet Corn, Preservative Treated Bin StorageApply treatment at rate recommended for material used.
The rate increases as the grain moisture content increases. If improperly applied, molds will grow and spoil the corn. Treatment is more economical and successful at moisture levels less than 22 percent. Make sure the corn is thoroughly and uniformly treated. Coat bin wall with an approved paint or protective seal to prevent corrosion. Process corn as neces-sary as fed.
Treated grain will keep in intermediate storage after removal from storage. The per bushel cost of wet grain storage units will vary from about the same as dry bin storage for treated and open non-sealed silos to approximately two times this cost for the sealed type storage units, excluding the grain handling equipment in both cases. The cost of preservative on a per bushel basis is usually about equal to the cost of energy for drying corn of equal moisture content.
Type of drying system
Drying capacity
Airflow rate, cfm/bu
Air temperature °F
Grain quality
Investment or equipment cost
Typical seasonal drying volume bu Disadvantages
Low temperature drying
Low 1 - 2 0 - 10 above outside air
Excellent Low to Medium
up to 50,000 Limited capability at high moisture contents
Bin-batch Medium 10 - 25 90 - 180 Good Low to Medium
10,000-30,000
May require manual leveling. Batch transfer requires labor and downtime. Limited expansion capability.
Continuous flow bin Medium 5 - 10 120 - 180 Good Medium 20,000 -100,000
Metering equipment may require frequent servicing. Many mechanical components, tends to be spread out.
Heated air manual batch (PTO Batch Dryer)
Medium 20 - 70 140 - 220 Good Low to Medium
10,000 - 30,000
High labor requirements to load and unload dryer.
Heated air automatic batch
High 70 - 125 140 - 240 Good Medium to High
15,000 and up Requires support handling systems. Requires wet holding. High drying and cooling rates cause brittle, easily damaged kernels. Low energy efficiency.
Heated air continuous flow
High 70 - 125 140 - 240 Good High 30,000 and up Requires support handling systems. Requires wet holding. Requires sophisticated controls.
Combination low temperature/high temperature
High 10 - 125 and 1 - 2
120 - 240 and 0 - 10 above outside air
Excellent High 15,000 and up Maximum movement of grain.
High temperature dryer with dryeration
High 10-125 and ½ - 1
120 - 240 Excellent Medium to high
25,000 and up Requires extra grain handling. Managing moisture condensation moisture content.
High temperature dryer with in-storage cooling
High 10 -125 and ½ - 1
120 - 240 Good Medium to high
25,000 and up Managing moisture condensation. Harder to get the desired moisture content. More management for cooling.
Table 26. Grain Drying Equipment Comparisons (taken from Grain Drying, Handling and Storage Handbook, MWPS No. 13).

42
Profit ProspectsIn 2005, Kansas ranked seventh in the United States in
the production of corn for grain with 465.75 million bushels. Total acres of corn harvested for grain in Kansas totaled 3.45 million acres in 2005. In comparison, wheat acres harvested totaled 9.5 million in 2005. Sorghum and soybean acreage in 2005 totaled 2.6 million and 2.85 million acres, respectively. Approximately 56 percent of the harvested corn acres in 2005 were non-irrigated. The highest concentration of non-irri-gated corn was in the northeast crop-reporting district. The highest concentration of irrigated corn was in the southwest crop-reporting district.
Two questions each producer must answer when selecting crops and the acreage of each crop to produce are: “Will the crop be profitable?” and “Will the crop add more to farm profitability than other crops?” Information needed to answer these questions include crop yield, crop price, government payments, crop insurance proceeds, and production costs.
Production costs are typically broken down into variable and fixed costs. Variable costs vary with the level of produc-tion and include seed, fertilizer, herbicide, insecticide, fuel and utilities, repairs, insurance, and miscellaneous items such as
storage and marketing. Fixed costs do not vary with the level of production and include depreciation, interest on noncurrent assets, taxes, and land charges.
Historical revenue and production costs are shown for non-irrigated corn in eastern, central, and northwest Kansas, and for irrigated corn. The north central and northwest infor-mation represents no-till production. The historical revenue and production costs illustrated represent the operator’s share of revenue and costs. Gross income per acre includes revenue from corn production and other revenue such as patronage dividends, government payments, and crop insurance proceeds. Production cost per acre includes cash costs, depreciation, and opportunity costs on owned assets, but excludes hired labor and unpaid operator and family labor. Thus, the bottom line number represents a residual return accruing to labor and management. An individual that owns their ground would have higher per acre revenue and cost than that shown.
More information about whole-farm and enterprise profitability can be obtaining by clicking on “KFMA” on the following Web site: www.kmar105.com.
Table 27. Net Return to Labor and Management for Corn.
Northeast SoutheastNorth
CentralSouth
Central Northwest IrrigatedYield per Acre 111 106 75 77 27 183Revenue from Corn Production 196.06 208.77 143.73 137.86 52.70 369.30Other Revenue 55.46 29.52 46.44 32.05 84.63 63.42
GROSS INCOME PER ACRE $251.52 $238.29 $190.17 $169.91 $137.33 $432.73Seed 33.04 31.24 28.31 18.69 19.31 44.79Fertilizer and Lime 45.24 41.81 37.21 23.75 19.19 48.78Herbicide and Insecticide 24.91 19.21 27.64 16.05 22.87 35.81Fuel and Utilities 14.58 13.14 9.88 9.67 6.64 79.60Repairs and Machine Hire 26.13 21.26 16.76 12.68 16.61 44.10Crop Insurance 7.98 5.74 8.82 3.77 8.19 11.92General Farm Insurance 4.66 2.74 2.75 1.79 2.07 6.06Miscellaneous 5.23 3.54 3.31 2.59 2.32 6.67Depreciation 23.42 21.87 15.06 15.47 12.81 28.68Interest 19.08 16.65 15.45 11.32 11.33 28.20Taxes 4.98 3.26 3.09 3.20 2.17 3.71Land Charges 43.71 33.26 33.14 20.49 13.48 51.89
PRODUCTION COST PER ACRE $252.96 $213.70 $201.42 $139.49 $136.98 $390.23NET RETURN TO LABOR AND MANAGEMENT -$1.44 $24.58 -$11.26 $30.42 $0.35 $42.50Note: Revenue and cost items above are based on Kansas Farm Management Association enterprise data for the 2002-2006 period, and only include the operator’s share of revenue and costs.

43
Photo CreditsPhoto 1. Dale Leikam; Photo 2. K-State; Photo 3. Dale Leikam; Photo 4. Dale Leikam; Photo 5. Dale Leikam; Photo 6. Dale Leikam; Photo 7. Dale Leikam; Photo 8. Dale Leikam; Photo 9. Phil Sloderbeck; Photo 10. Phil Sloderbeck; Photo 11. K-State Entomology Teaching Collection; Photo 12. Bob Wright, University of Nebraska; Photo 13. Phil Sloderbeck; Photo 14. Phil Sloderbeck; Photo 15. Phil Sloderbeck; Photo 16. Phil Sloderbeck; Photo 17. Phil Sloderbeck; Photo 18. Phil Sloderbeck; Photo 19. Phil Sloderbeck; Photo 20. Phil Sloderbeck; Photo 21. USDA, Clemson Extension; Photo 22. Marlin Rice, Iowa State University; Photo 23. Kansas State University; Photo 24. Kansas State University; Photo 25. Phil Sloderbeck; Photo 26. Phil Sloderbeck; Photo 27. University of Illinios; Photo 28. Phil Sloderbeck; Photo 29. Phil Sloderbeck; Photo 30. K-State Entomology Teaching Collection; Photo 31. USDA, Clemson Extension; Photo 32. K-State; Photo 33. K-State; Photo 34. K-State; Photo 35. Doug Jardine; Photo 36. Doug Jardine; Photo 37. Doug Jardine; Photo 38. Doug Jardine; Photo 39. Doug Jardine.

44

Photo 26. Spider mite damage.
Photo 27. Stalk borer.
Photo 29. Western bean cutworm larva.
Photo 28. Thrips.
Photo 30. White grubs.
Photo 31. Wireworm.
Insect Management Photos
Photo 25. Stalk girdled by southwestern corn borer.
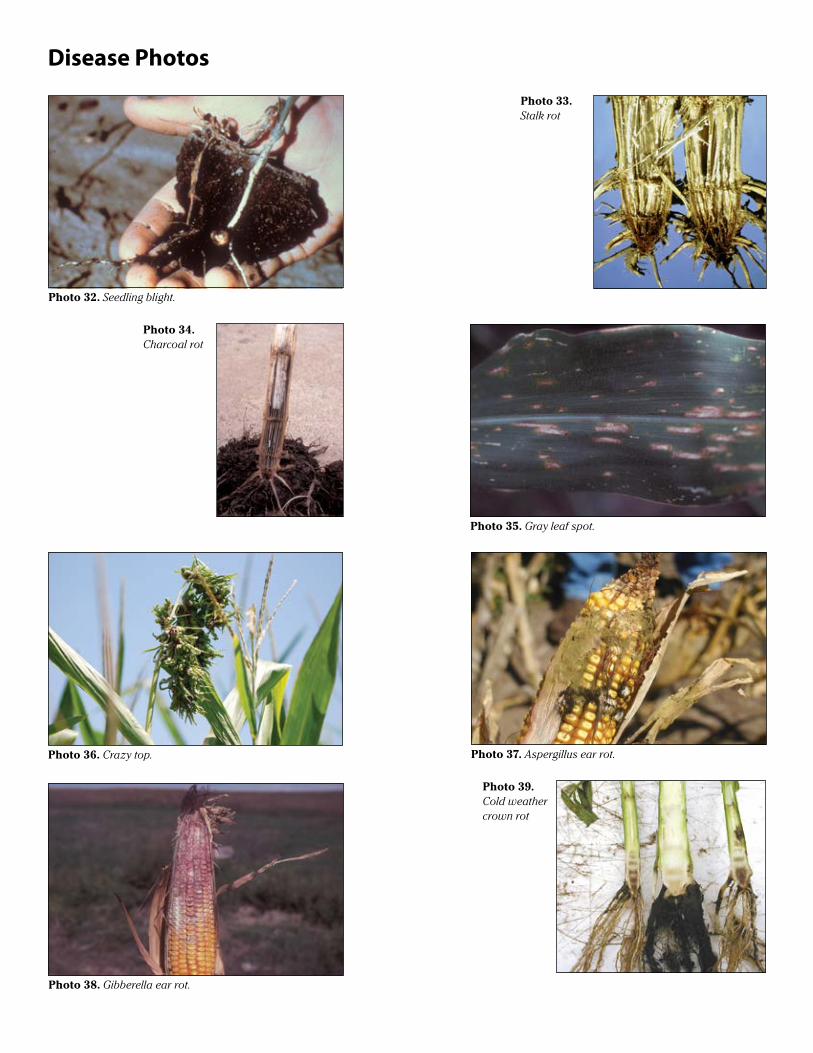
Disease Photos
Photo 37. Aspergillus ear rot.
Photo 39. Cold weather crown rot
Photo 38. Gibberella ear rot.
Photo 35. Gray leaf spot.
Photo 32. Seedling blight.
Photo 33. Stalk rot
Photo 34. Charcoal rot
Photo 36. Crazy top.


Brand names appearing in this publication are for product identification purposes only. No endorsement is intended, nor is criticism implied of similar products not mentioned.
Publications from Kansas State University are available at: bookstore.ksre.ksu.edu
Contents of this publication may be freely reproduced for educational purposes. All other rights reserved. In each case, credit authors, Corn Production Handbook, Kansas State University, September 2007.
Kansas State University Agricultural Experiment Station and Cooperative Extension Service
C560 September 2007K-State Research and Extension is an equal opportunity provider and employer. Issued in furtherance of Cooperative Extension Work, Acts of May 8 and June 30, 1914, as amended. Kansas State University, County Extension Councils, Extension Districts, and United States Department of Agriculture Cooperating, John D. Floros, Director.