ca chorus™ infrastructure management update...devops expand it infrastructure with flexible cloud...
TRANSCRIPT

CA Chorus™ Infrastructure Management Update
Speaker Name: Sam Knutson, Craig Guess
Speaker Company: CA Technologies
Date of Presentation: March 13th, 2014
Session Number: 15377
Insert
Custom
Session
QR if
Desired.

Agenda
Disruption in the Data Center
CA Chorus™ Infrastructure Management Overview
Demo of Chorus™ IM
Q&A

Disruption in the Data Center

Dynamic Data Center: Business Solutions on Demand
Bring Your Own Device
Java
Exceptional User Experience Linux on System z
System z
Cloud Agility
Continuous Delivery
Big Data
Predictive Analytics

Baby Boomers
Changing World of IT
iGen GenX GenY
60’s to 40’s 40’s to 30’s 30’s to 20’s Entering College
UNITE MULTIPLE GENERATIONS
TECHNOLOGY ENABLEMENT AGILITY
PEOPLE
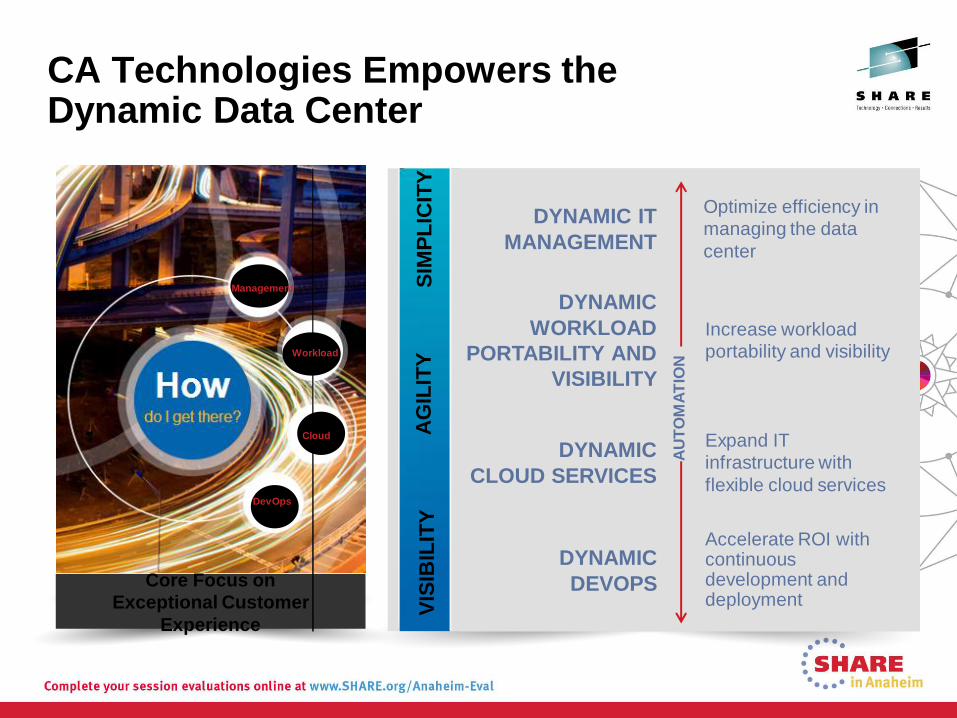
CA Technologies Empowers the Dynamic Data Center
THE DYNAMIC DATA CENTER
Core Focus on
Exceptional Customer
Experience
VIS
IBIL
ITY
AG
ILIT
Y
SIM
PL
ICIT
Y
DYNAMIC
CLOUD SERVICES
DYNAMIC
WORKLOAD
PORTABILITY AND
VISIBILITY
DYNAMIC IT
MANAGEMENT
DYNAMIC
DEVOPS
Expand IT
infrastructure with
flexible cloud services
Accelerate ROI with continuous development and deployment
Increase workload
portability and visibility
Optimize efficiency in
managing the data
center
AU
TO
MA
TIO
N
DevOps
Workload
Cloud
Management

CA Chorus

www.experiencecachorus.com
Copyright © 2013 CA. All rights reserved. 8

Transforming IT Management Managing the Dynamic Data Center
9
Technology Objectives
Reduce tools through vendor rationalization or integration into a
common platform
Simplify and modernize mainframe management to enable the next-
generation of mainframers to manage the platform
Provide cross-enterprise management that “normalizes” the
mainframe
Innovation to enable constant relevancy to the business
e.g. Manage Linux on System z
Business Benefits
Reduce costs and raise productivity
Replicate critical skills & improve staff efficiency
Maximize staff output by minimizing operational friction
Drive business growth & manage complexity
CA Chorus™
- Our
platform and
our strategy

Innovation to increase productivity and knowledge transfer

DEFINITIVE MANAGEMENT TOOL FOR THE DYNAMIC DATA
CENTER
Dynamic IT Management CA Chorus™
SOLVE PROBLEMS FASTER with graphical diagnostics ACCELERATE LEARNING CURVE through knowledge capture
INCREASE EFFICIENCY using integrated workspace
REDUCE ERRORS AND RISK with proactive analytics and automation

Pla
tform
Ag
ility &
Alig
nm
en
t z/O
S • z/L
inux • P
serie
s, X
serie
s, L
-Inte
l• Mobile
• SaaS
Strategy Transformational IT Management Driving the Dynamic Data Center
12 For CA Technologies Internal Use Only - Strictly Confidential
Domain Capabilities Database • Security & Compliance • Storage • Systems • Networks • Workload • System
Automation • others
Unparalleled Integration Cross-domain •Rich Content • Robust Ecosystem • Platform SDK
Data
So
urc
es
Unified Workspace
Any Time, Any Where, Any Device
Intuitive User Experience
Exp
eri
en
ces
Legend: Current; Future
Analytics and Automation Proactive • Programmatic • Predictive
Knowledge Management Capture & Transfer• In-context Help • Community Contributed • Social
Serv
ices
Software Management Acquisition• Installation• Maintenance• Deployment • Configuration • License
Key

13 Copyright © 2013 CA. All rights reserved.
CA Chorus™ an overview…

CA Chorus™ Infrastructure
Management Update

CA Chorus™ Infrastructure Management for Networks and Systems
Enterprise Health Monitoring Policy driven consolidated views of many resources using color to depict status of those resources that are grouped via the policy.
System Resource Topology Delivers enhanced graphics to identify relationships and status information.
Interactive Problem and Diagnostic Tools Capabilities combining normally disparate data into a cohesive diagnostic path, combined with status information and visual cues.
New System, Network , and Personalized Alert modules Delivering interactive and actionable alert notifications.
Consolidated Performance Reporting Enhanced filtering, new graphs, and the ability to export data to external sources.
Investigator Quick-link Web Navigation New additions for Network and System, and Open to any URL that supports the iFrame technology.

Enterprise Health Monitoring Dashboards

Enterprise Health Monitoring Dashboards
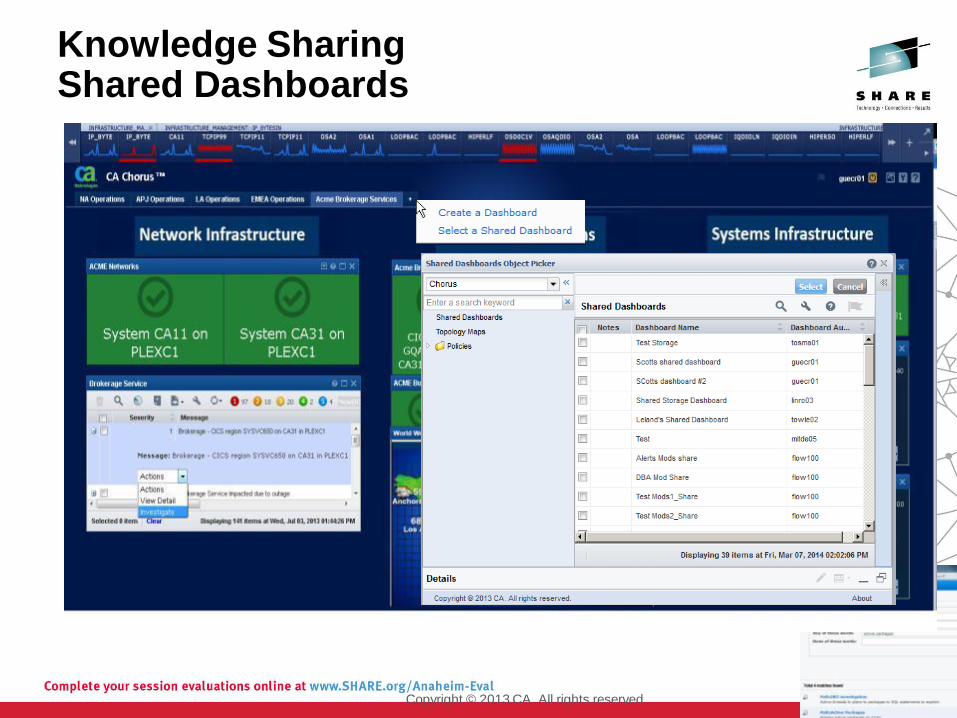
Knowledge Sharing Shared Dashboards
Copyright © 2013 CA. All rights reserved.

Investigator – Analysis across the enterprise

Investigator – Analysis across the enterprise


22 Copyright © 2013 CA. All rights reserved.
Interactive Problem and Diagnostic Time Series Facility – Flexible Time Analysis
ools

Interactive Problem and Diagnostic Tools Topology – Relationships and Status

Knowledge Center: Quickref
Copyright © 2013 CA. All rights reserved.

Collaboration export and launch Excel
Copyright © 2013 CA. All rights reserved.

Knowledge Sharing Custom Views
Copyright © 2013 CA. All rights reserved.
Saved Paths

Knowledge Sharing Saved Paths
Copyright © 2013 CA. All rights reserved.
Demo
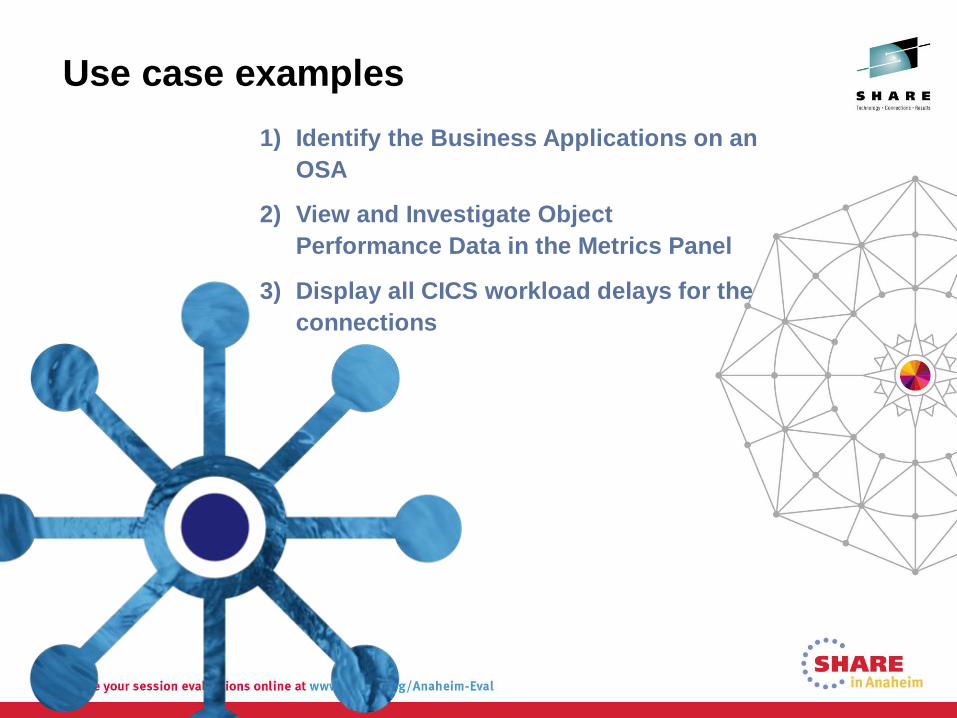
Use case examples
1) Identify the Business Applications on an
OSA
2) View and Investigate Object
Performance Data in the Metrics Panel
3) Display all CICS workload delays for the
connections
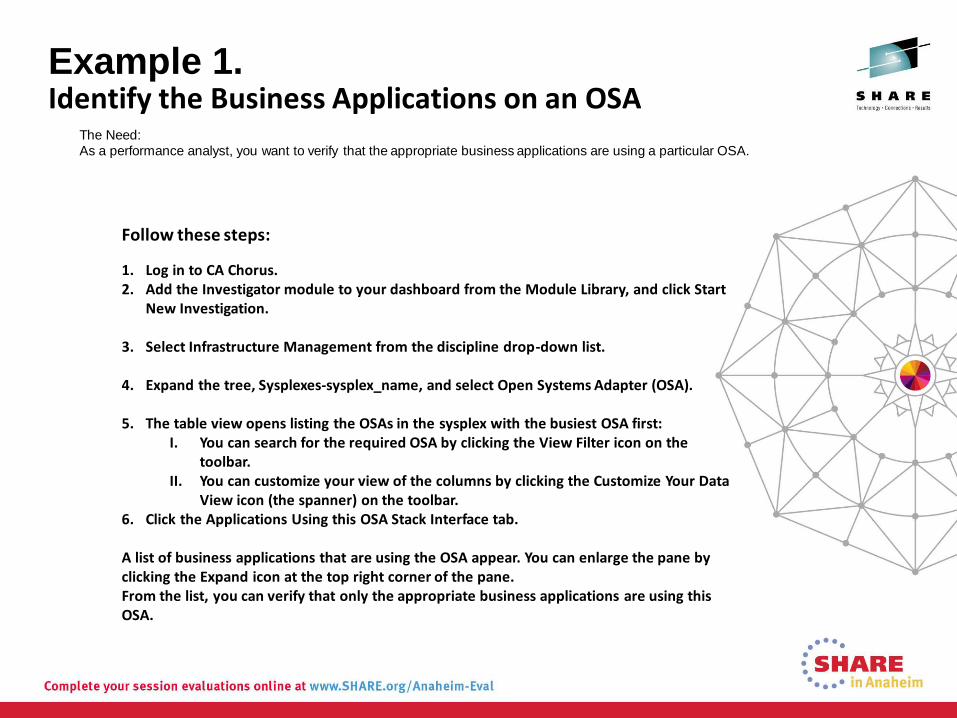
Example 1. Identify the Business Applications on an OSA
The Need:
As a performance analyst, you want to verify that the appropriate business applications are using a particular OSA.
Follow these steps:
1. Log in to CA Chorus. 2. Add the Investigator module to your dashboard from the Module Library, and click Start
New Investigation.
3. Select Infrastructure Management from the discipline drop-down list.
4. Expand the tree, Sysplexes-sysplex_name, and select Open Systems Adapter (OSA).
5. The table view opens listing the OSAs in the sysplex with the busiest OSA first: I. You can search for the required OSA by clicking the View Filter icon on the
toolbar. II. You can customize your view of the columns by clicking the Customize Your Data
View icon (the spanner) on the toolbar. 6. Click the Applications Using this OSA Stack Interface tab.
A list of business applications that are using the OSA appear. You can enlarge the pane by clicking the Expand icon at the top right corner of the pane. From the list, you can verify that only the appropriate business applications are using this OSA.

Example 2. View and Investigate Object Performance Data in the Metrics Panel
The Need:
As a performance analyst, you want to monitor system metrics like CPU.
Follow these steps:
1. Log in to CA Chorus. 2. Click the plus sign control (+) on the Metrics panel. 3. Identify the metric and the data source to populate your Metrics panel by following the
prompts. 4. Expand the tree, Sysplexes-sysplex_name, and select Open Systems Adapter (OSA). 5. Select available metrics as follows:
a. Use the right arrow keys to select individual or all metrics. The available metrics change based on the category that is specified on the previous dialog. b. Specify the name of the metric group in the Name the Metric Group field.
6. Default: Name of the system that the user selected.
Click Finish.
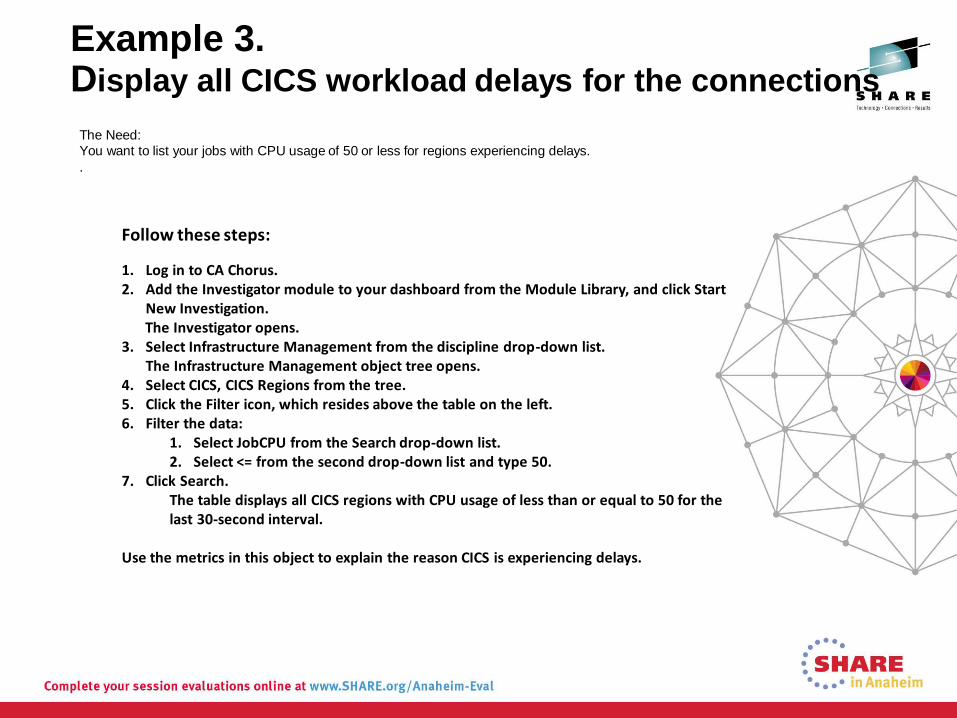
Example 3. Display all CICS workload delays for the connections
The Need:
You want to list your jobs with CPU usage of 50 or less for regions experiencing delays.
.
Follow these steps:
1. Log in to CA Chorus. 2. Add the Investigator module to your dashboard from the Module Library, and click Start
New Investigation. The Investigator opens.
3. Select Infrastructure Management from the discipline drop-down list. The Infrastructure Management object tree opens.
4. Select CICS, CICS Regions from the tree. 5. Click the Filter icon, which resides above the table on the left. 6. Filter the data:
1. Select JobCPU from the Search drop-down list. 2. Select <= from the second drop-down list and type 50.
7. Click Search. The table displays all CICS regions with CPU usage of less than or equal to 50 for the last 30-second interval.
Use the metrics in this object to explain the reason CICS is experiencing delays.

Thank you for attending! Questions?

Speaker Name: Sam Knutson, Craig Guess
Speaker Company: CA Technologies
Date of Presentation: March 13th, 2014
Session Number: 15377
Insert
Custom
Session
QR if
Desired.