ca unified communications monitor user guide unified communications monitor 3... · mean opinion...
TRANSCRIPT
User Guide Version 3.3
CA Unified Communications Monitor

This Documentation, which includes embedded help systems and electronically distributed materials, (hereinafter referred to as the “Documentation”) is for your informational purposes only and is subject to change or withdrawal by CA at any time.
This Documentation may not be copied, transferred, reproduced, disclosed, modified or duplicated, in whole or in part, without the prior written consent of CA. This Documentation is confidential and proprietary information of CA and may not be disclosed by you or used for any purpose other than as may be permitted in (i) a separate agreement between you and CA governing your use of the CA software to which the Documentation relates; or (ii) a separate confidentiality agreement between you and CA.
Notwithstanding the foregoing, if you are a licensed user of the software product(s) addressed in the Documentation, you may print or otherwise make available a reasonable number of copies of the Documentation for internal use by you and your employees in connection with that software, provided that all CA copyright notices and legends are affixed to each reproduced copy.
The right to print or otherwise make available copies of the Documentation is limited to the period during which the applicable license for such software remains in full force and effect. Should the license terminate for any reason, it is your responsibility to certify in writing to CA that all copies and partial copies of the Documentation have been returned to CA or destroyed.
TO THE EXTENT PERMITTED BY APPLICABLE LAW, CA PROVIDES THIS DOCUMENTATION “AS IS” WITHOUT WARRANTY OF ANY KIND, INCLUDING WITHOUT LIMITATION, ANY IMPLIED WARRANTIES OF MERCHANTABILITY, FITNESS FOR A PARTICULAR PURPOSE, OR NONINFRINGEMENT. IN NO EVENT WILL CA BE LIABLE TO YOU OR ANY THIRD PARTY FOR ANY LOSS OR DAMAGE, DIRECT OR INDIRECT, FROM THE USE OF THIS DOCUMENTATION, INCLUDING WITHOUT LIMITATION, LOST PROFITS, LOST INVESTMENT, BUSINESS INTERRUPTION, GOODWILL, OR LOST DATA, EVEN IF CA IS EXPRESSLY ADVISED IN ADVANCE OF THE POSSIBILITY OF SUCH LOSS OR DAMAGE.
The use of any software product referenced in the Documentation is governed by the applicable license agreement and such license agreement is not modified in any way by the terms of this notice.
The manufacturer of this Documentation is CA.
Provided with “Restricted Rights.” Use, duplication or disclosure by the United States Government is subject to the restrictions set forth in FAR Sections 12.212, 52.227-14, and 52.227-19(c)(1) - (2) and DFARS Section 252.227-7014(b)(3), as applicable, or their successors.
Copyright © 2012 CA. All rights reserved. All trademarks, trade names, service marks, and logos referenced herein belong to their respective companies.

Contact CA Technologies
Contact CA Support
For your convenience, CA Technologies provides one site where you can access the information that you need for your Home Office, Small Business, and Enterprise CA Technologies products. At http://ca.com/support, you can access the following resources:
■ Online and telephone contact information for technical assistance and customer services
■ Information about user communities and forums
■ Product and documentation downloads
■ CA Support policies and guidelines
■ Other helpful resources appropriate for your product
Providing Feedback About Product Documentation
If you have comments or questions about CA Technologies product documentation, you can send a message to [email protected].
To provide feedback about CA Technologies product documentation, complete our short customer survey which is available on the CA Support website at http://ca.com/docs.

Contents 5
Contents
Chapter 1: What is UC Monitor? 7
Product Components ................................................................................................................................................... 8
How UC Monitor Works ............................................................................................................................................... 9
Call Activity Monitoring .............................................................................................................................................. 10
Call Performance Monitoring ..................................................................................................................................... 10
The Call Watch Feature .............................................................................................................................................. 11
Medianet Traffic Monitoring ...................................................................................................................................... 12
Chapter 2: Using the Management Console 13
Launch UC Monitor .................................................................................................................................................... 13
Navigate the Management Console ........................................................................................................................... 13
Navigate Between Reporting Consoles ...................................................................................................................... 14
Change the Time Frame of a Report .......................................................................................................................... 14
Drill Down into Reports .............................................................................................................................................. 15
Print a Report ............................................................................................................................................................. 16
Email a Report ............................................................................................................................................................ 16
Export Call Details ...................................................................................................................................................... 18
Set Filter and Display Options for Reports ................................................................................................................. 20
Refresh Reports .......................................................................................................................................................... 22
Chapter 3: What are Performance Thresholds? 23
Call Quality Thresholds ............................................................................................................................................... 24
Call Setup Threshold................................................................................................................................................... 25
Video Quality Thresholds ........................................................................................................................................... 26
Chapter 4: What are Call Server Thresholds? 27
Call Server Thresholds ................................................................................................................................................ 27
Call Server Group Thresholds ..................................................................................................................................... 28
Chapter 5: What are Codec Thresholds? 31
Chapter 6: What are Incidents? 33
How Incidents Trigger Responses .............................................................................................................................. 34
How Incidents are Closed ........................................................................................................................................... 35
6 User Guide
Manage Incident Responses ...................................................................................................................................... 36
How to Respond to an Incident .................................................................................................................................. 37
View Incident Details .................................................................................................................................................. 38
Acknowledge Incidents .............................................................................................................................................. 38
Chapter 7: What is Call Watch? 39
How to Use Call Watch ............................................................................................................................................... 40
Call Watch List ............................................................................................................................................................ 41
Create a Call Watch Definition ................................................................................................................................... 41
Call Watch Limitations ................................................................................................................................................ 43
Appendix A: Report Metrics 45
Call Quality Metrics .................................................................................................................................................... 45
Call Setup Metrics ...................................................................................................................................................... 48
Video Metrics ............................................................................................................................................................. 49
Mean Opinion Scores ................................................................................................................................................. 50
Cisco MOS Calculations ....................................................................................................................................... 51
Avaya MOS Calculation ....................................................................................................................................... 51
Microsoft MOS Calculations ................................................................................................................................ 51
Appendix B: Integration with CA Performance Center 53
Glossary 55
Index 69
Chapter 1: What is UC Monitor? 7
Chapter 1: What is UC Monitor?
CA Unified Communications Monitor (UC Monitor) tracks the performance of VoIP systems and unified communications systems. UC Monitor employs passive monitoring to maintain a continuous record of the call setup traffic, call audio and video quality, and performance associated with the following endpoints:
■ IP phones
■ Audio and video clients
■ Call servers
■ Voice gateways
■ Midstream devices
UC Monitor reports let you view and analyze collected data. You can configure automatic actions to gather additional information for troubleshooting and diagnostics. You can set performance thresholds, with automatic alerts to let you know about declines in call quality, failed calls, or call server issues.
UC Monitor can help you with all of these challenges, and can also help you perform quick diagnostics and troubleshooting when issues inevitably arise. In most enterprises, application performance issues are commonly, but often incorrectly, blamed on the network. UC Monitor helps you determine the true source of VoIP performance degradation. You can avoid the costly, and often unnecessary, infrastructure upgrades that are often the default solution to performance issues.
UC Monitor helps you gauge how well your unified communications hardware and software deliver services to the end user.
■ Proactively monitor VoIP and video call quality and call setup metrics.
■ Know immediately when users cannot complete calls and when audio or video quality is low.
■ Receive a notification when call quality fails to meet a threshold.
■ Receive a notification when a call setup is slow.
■ Gather call performance data from a targeted endpoint (see definition on page 58) for use in troubleshooting an issue.
■ Gather data from unidirectional traffic flows from medianet-enabled devices, such as switches and routers.

Product Components
8 User Guide
■ Access call performance data in formatted reports that are easy to understand and analyze for detailed metrics.
■ Leverage a full suite of analytics and reporting by registering UC Monitor as a data source for CA Performance Center.
This section contains the following topics:
Product Components (see page 8) How UC Monitor Works (see page 9) Call Activity Monitoring (see page 10) Call Performance Monitoring (see page 10) The Call Watch Feature (see page 11) Medianet Traffic Monitoring (see page 12)
Product Components
The UC Monitor system includes hardware and software components: a collection device and a web-based management console. The components are deployed in the following ways:
■ In a distributed system, the collectors and the management console are installed on different servers.
■ In a standalone system, the collector and management console are installed on the same server.
Collection Devices
Depending on your environment, the collection device is the standard collector or the external Lync collector.
Collector
The UC Monitor collector (collector) monitors VoIP network traffic in Cisco IP telephony and Avaya Communication Manager environments.
■ When attached to a SPAN port on a core switch, the collector monitors data flows to and from Cisco Unified Communications Manager call servers. The collector inspects network traffic and collects data about voice- or video-over-IP performance. Specifically, it inspects packets that use the SIP, SCCP, H323, or MGCP protocols. The collector sends data to the management console at regular intervals for storage, analysis, and reporting.
■ Without using a port mirroring session, the collector monitors Avaya unified communications deployments with passive and active monitoring technologies. The collector receives and processes call quality reports from Avaya endpoints and call detail records from the Avaya Communication Manager. The collector also polls supporting devices for information.
■ Multiple collectors can communicate with the same management console.
How UC Monitor Works
Chapter 1: What is UC Monitor? 9
Lync collector
UC Monitor supports a third-party collection device, the Lync collector, in a Microsoft environment. The front-end server for Microsoft Lync Server 2010 acts as the Lync collector. The Lync collector sends call audio and video quality data to the management console.
In a Microsoft environment, the built-in UC Monitor collector is not required.
Management Console
The management console processes, stores, and reports on VoIP-related network data. The management console uses a MySQL database to store data.
Use the management console to:
■ Define the Locations to monitor and send this configuration information to the collector.
■ Create UC Monitor users and assign them roles with permissions to view reports and initiate diagnostic actions.
■ View reports.
■ Initiate diagnostic actions, such as the Call Watch feature.
How UC Monitor Works
UC Monitor performs passive and active monitoring of call quality in unified communications environments. UC Monitor does not actually listen to calls. Most call performance measurements are derived from data flows to and from the call servers. For example:
■ Cisco endpoints (see definition on page 58) report quality data to their call server at the completion of every call. The UC Monitor collector inspects these flows for performance metrics.
■ Each Microsoft instance reports end-of-call quality metrics to the Lync collector.
■ Avaya endpoints use RTCP to send in-progress call quality reports directly to the collector. The collector uses SNMP to poll the Avaya Communication Manager for information.
Call Activity Monitoring
10 User Guide
Thresholds allow UC Monitor to detect performance exceptions and send alerts. UC Monitor measures and analyzes the performance of VoIP-related call setup protocols. At regular intervals, supported collection devices send relevant call quality data back to the database at the management console for analysis and reporting.
■ The collector transmits only the data necessary to calculate and report about call setup and call quality for calls from Cisco or Avaya hardware.
■ The Lync collector receives end-of-call quality reports from audio and video endpoints, posts them to the management console, and saves them as call detail records.
UC Monitor also gathers call quality and call setup data from media devices that support VoIP. UC Monitor monitors data flows between the origination device and the destination call server or media device to evaluate call setup performance.
Call Activity Monitoring
UC Monitor monitors the call activity on your data network. The monitoring provides data about call volume, voice gateway and interface usage, and the success rate of attempted calls. A successful VoIP and video implementation relies heavily on bandwidth availability, so you must gauge and even predict network usage patterns to provide adequate provisioning.
t
Capacity Planning reports provide data about the following types of call activity:
■ Call attempts
■ Call completions
■ Grade of Service
■ Call failures during setup, with the cause code.
■ Usage of voice gateways and of individual gateway voice interfaces.
■ Busy hour call attempts and busy hour call completions to help you with capacity planning.
Call Performance Monitoring
UC Monitor measures and tracks the audio and video performance of calls, and alerts you when performance levels fall below a threshold. Call performance monitoring consists of two components that contribute to user perception of call quality:
■ Call setup monitoring, to ensure that users can initiate and complete calls.
■ Call quality monitoring, to gauge the clarity of the audio or image in the conversation.
The Call Watch Feature
Chapter 1: What is UC Monitor? 11
UC Monitor performs comprehensive, end-to-end monitoring of unified communications, which is a simple term that can mask a complex reality:
■ Audio and video signals travel over your data network and are subject to the complexities and fluctuations of all the other traffic sharing the links.
■ Multiple equipment vendors have implemented functions using multiple, sometimes proprietary, protocols.
■ One VoIP call can involve two IP telephones and their call server. Or it can involve a telephone in the PSTN, an IP telephone, a voice gateway, and a call server.
■ Problems with call setup or call quality can occur at several network locations.
In a Cisco environment, the collector passively monitors call setup flows at two points in their passage through the network:
■ Between VoIP endpoints and the Unified Communications Manager server
■ Between call servers and voice gateways
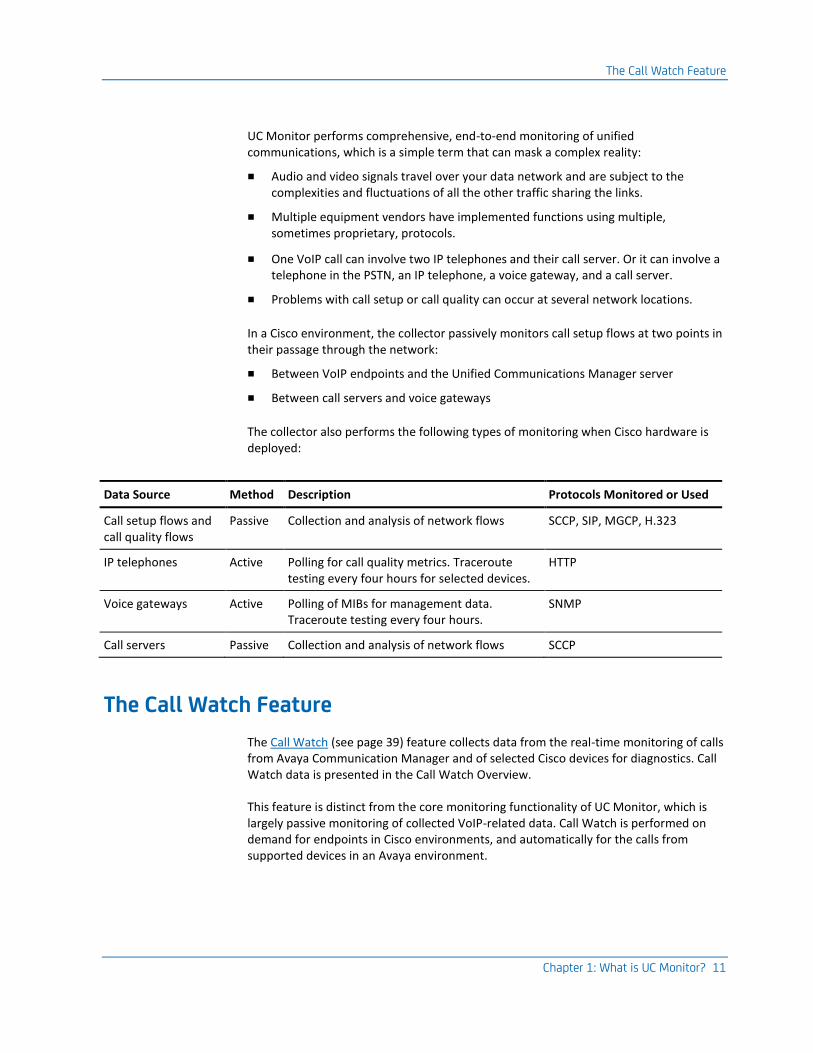
The collector also performs the following types of monitoring when Cisco hardware is deployed:
Data Source Method Description Protocols Monitored or Used
Call setup flows and call quality flows
Passive Collection and analysis of network flows SCCP, SIP, MGCP, H.323
IP telephones Active Polling for call quality metrics. Traceroute testing every four hours for selected devices.
HTTP
Voice gateways Active Polling of MIBs for management data. Traceroute testing every four hours.
SNMP
Call servers Passive Collection and analysis of network flows SCCP
The Call Watch Feature
The Call Watch (see page 39) feature collects data from the real-time monitoring of calls from Avaya Communication Manager and of selected Cisco devices for diagnostics. Call Watch data is presented in the Call Watch Overview.
This feature is distinct from the core monitoring functionality of UC Monitor, which is largely passive monitoring of collected VoIP-related data. Call Watch is performed on demand for endpoints in Cisco environments, and automatically for the calls from supported devices in an Avaya environment.
Medianet Traffic Monitoring
12 User Guide
In Cisco deployments, you can instruct the collector to collect detailed, real-time data for all calls from selected devices. You set up a Call Watch definition by selecting a directory number and the duration of the watch period.
Note: Call Watch is not supported in Microsoft-only unified communications environments.
Medianet Traffic Monitoring
A medianet is an IP architecture that enhances the performance of video, voice, and data, and automates many aspects of configuration. UC Monitor receives performance data about medianet-enabled (midstream) devices from the Flexible NetFlow protocol.
UC Monitor provides data about the performance of Real-Time Transport Protocol (RTP) traffic (or stream legs) on the midstream devices on your network. A stream leg is a unidirectional stream of packets.
Data from stream legs can help your troubleshooting efforts in situations such as the following examples:
■ Review video monitoring statistics for one video flow after a user submits a trouble ticket.
■ Monitor all video flows from a particular source to verify the quality of video that enters the network.
The UC Monitor support for monitoring medianet data works as follows:
■ Medianet-enabled devices send NetFlow data to the Harvester on the collector.
■ UC Monitor discovers a midstream device for every IP address that sends NetFlow data.
■ The Harvester parses and aggregates the data every 5 seconds and send the data to the management console.
■ The management console correlates medianet data with other data, such as RTCP (Avaya) or end-of-call (Cisco), and stores the data in the database.
Chapter 2: Using the Management Console 13
Chapter 2: Using the Management Console
This section contains the following topics:
Launch UC Monitor (see page 13) Navigate the Management Console (see page 13) Navigate Between Reporting Consoles (see page 14) Change the Time Frame of a Report (see page 14) Drill Down into Reports (see page 15) Print a Report (see page 16) Email a Report (see page 16) Export Call Details (see page 18) Set Filter and Display Options for Reports (see page 20) Refresh Reports (see page 22)
Launch UC Monitor
To access the server that hosts the management console, enter a server name or IP address into the Address field of your web browser. Use the following syntax:
http://<IPAddress>/UCMonitor/
You are prompted to log in when you first access the management console. The UC Monitor administrator at your organization can supply your login information and the UC Monitor server name or IP address.
Navigate the Management Console
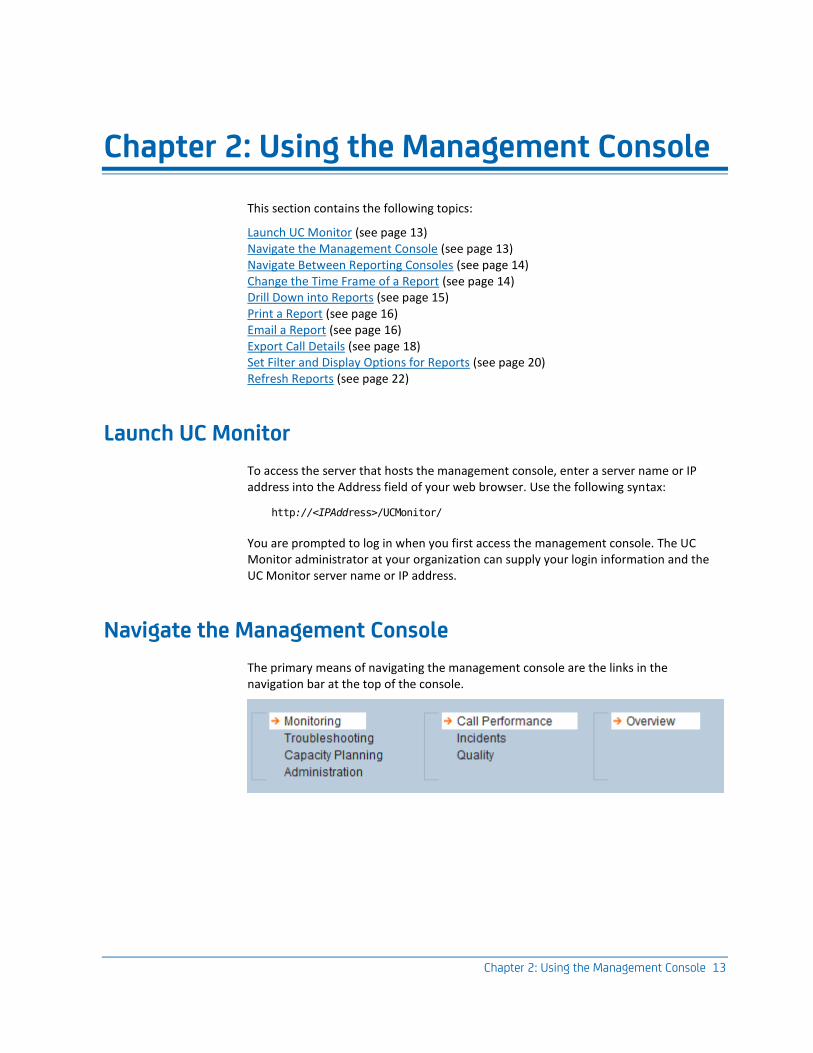
The primary means of navigating the management console are the links in the navigation bar at the top of the console.
Navigate Between Reporting Consoles
14 User Guide
These links let you select a report to view. Right-pointing arrows light up next to the active links to help you move between reports.
■ The items in the first column identify the category of reports you want to view.
■ The items in the second column are subcategories of reports and vary depending on your selection in the first column.
■ The items in the third column are the reports available from the selected category in the second column. Each report offers at least one view of the data. Within each view, you can drill down into more detailed views.
Navigate Between Reporting Consoles
You can switch between reports in the management console and the CA Performance Center console. Click the CAPC link in the upper-right corner of the management console. If your user account allows you to access CA Performance Center, you can switch between the two interfaces without supplying authentication credentials.
Change the Time Frame of a Report
You have multiple options for selecting the time frame of the data you want to see. UC Monitor stores data for up to 24 months. The Time Period selector lets you select the length of the segment of data for a report, such as a three-hour, one-day, or one-week segment. By default, data from the past three hours is shown for most reports.
Follow these steps:
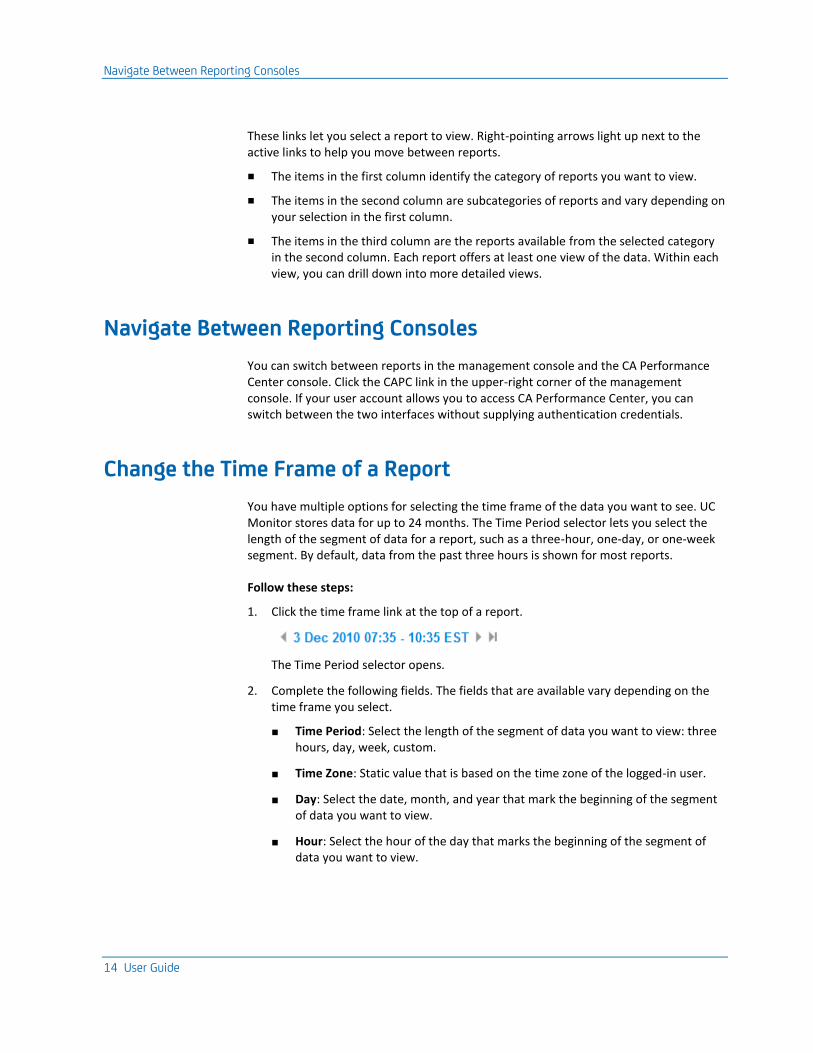
1. Click the time frame link at the top of a report.
The Time Period selector opens.
2. Complete the following fields. The fields that are available vary depending on the time frame you select.
■ Time Period: Select the length of the segment of data you want to view: three hours, day, week, custom.
■ Time Zone: Static value that is based on the time zone of the logged-in user.
■ Day: Select the date, month, and year that mark the beginning of the segment of data you want to view.
■ Hour: Select the hour of the day that marks the beginning of the segment of data you want to view.
Drill Down into Reports
Chapter 2: Using the Management Console 15
■ Time: Select the start time of a custom time frame.
■ Duration: Select the duration of a custom time frame. Options are in five-minute intervals.
3. Click OK.
The view of the displayed reports changes to reflect your new time frame.
4. (Optional) To view data from the previous or next time frame, click the arrows to the left and right of the time frame link.
Drill Down into Reports
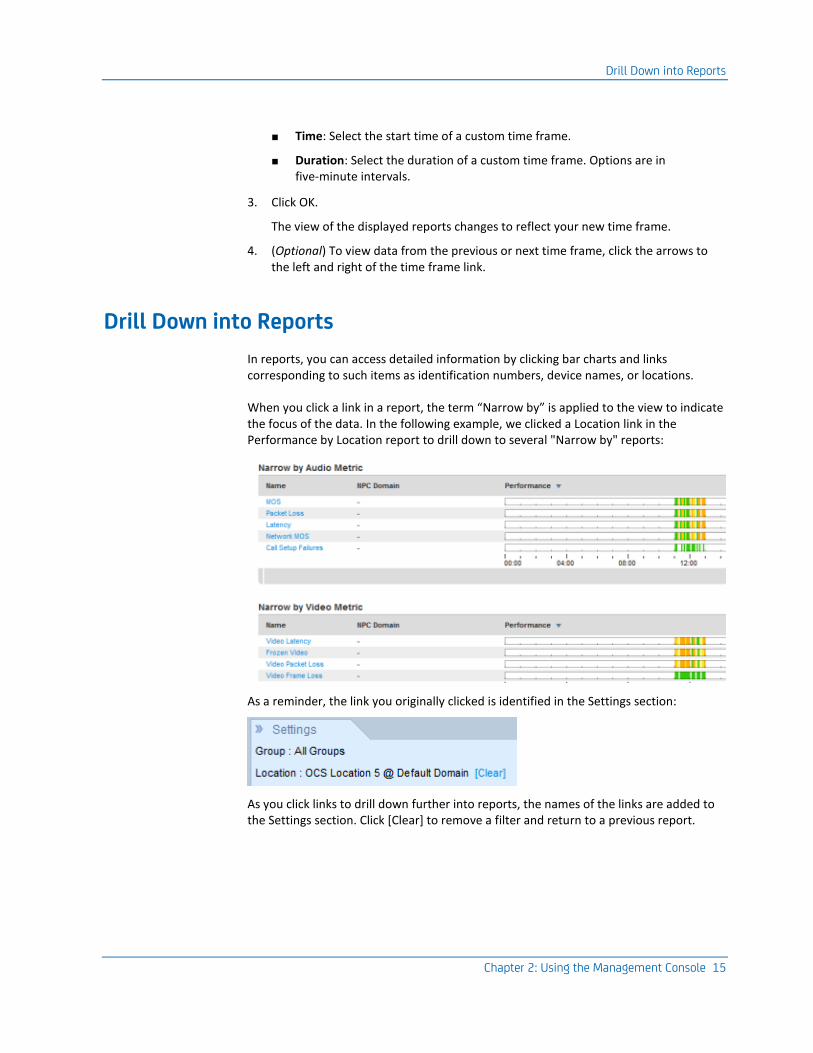
In reports, you can access detailed information by clicking bar charts and links corresponding to such items as identification numbers, device names, or locations.
When you click a link in a report, the term “Narrow by” is applied to the view to indicate the focus of the data. In the following example, we clicked a Location link in the Performance by Location report to drill down to several "Narrow by" reports:
As a reminder, the link you originally clicked is identified in the Settings section:
As you click links to drill down further into reports, the names of the links are added to the Settings section. Click [Clear] to remove a filter and return to a previous report.
Print a Report
16 User Guide
Print a Report
You can print a displayed UC Monitor report. Some reports contain tables with many rows or many columns, or both. You can format a report so that columns and table entries are printed appropriately.
Follow these steps:
1. Click OPTIONS, Print Page at the top right of a report.
The Print Properties dialog opens.
2. Select the directional orientation of the printed page:
■ Portrait. Standard printing on a page where the text is oriented vertically.
■ Landscape. Text is oriented horizontally on the page. Select this option when the report contains a table with many columns.
3. Select a page size that accommodates the amount of data that you want to print. For example, to print a report using the Landscape orientation, select the Legal paper size, which is wider than the Letter size.
4. Click OK.
The report is exported to PDF format and displayed in your default PDF viewer.
5. Use the print feature of your PDF viewer to print the report.
Tips:
■ If your report does not fit easily into one of the available size and orientation options, you can filter out some data. Use the Settings dialog to remove columns or rows.
■ Your printer driver settings determine the default page size for reports.
Email a Report
You can email a report in PDF format to specified recipients. You can email the report immediately or schedule it to be sent at a later time. For example, you can email Call Activity reports to coworkers in the IT department to provide detailed data for use in capacity planning. Or you can send incident reports on a regular basis to help your team track the performance of the entire VoIP system.
The administrator must configure an email server to enable this feature. You can create schedules for a report that you have permission to view. The administrator can create schedules for a report and can change all schedules.
Email a Report
Chapter 2: Using the Management Console 17
Follow these steps:
1. Click OPTIONS, Email Page at the top right of a report.
The Scheduled Email Properties dialog opens.
2. Complete the following fields and then click OK.
■ Send To: Enter email addresses in the following format: <name>@<domain>.
■ Reply To: The email address of the user who configures the email schedule. This option is available only when the administrator has configured a “Reply To” address in the user properties.
■ Subject: A descriptive subject for the emailed report. Include the report title and Locations or components included in the report.
■ Message: (Optional) A message to accompany the emailed report.
■ Time Zone: Select the time zone of the intended recipient.
■ Send Now: Select this option to send the email immediately.
■ Send on a Schedule: Select this option to send the report on a regular basis. When selected, the following options appear:
– Send Daily: Send the email once per day. If enabled, reveals check boxes where you can select the day of the week to send the report. By default, the report is mailed every weekday (Monday through Friday) at 0:30 hours in the time zone of the management console. The time frame of the daily report is the previous day.
– Send Weekly: Send the email once per week. By default, the report is mailed every Sunday at 01:00 in the time zone of the management console. The time frame of the weekly report is the previous week (Sunday through Saturday).
– Send Monthly: Send the email once per month. If enabled, reveals menus where you can select the day of the month to send the report. The monthly schedule sends the report on the first day of each month at 01:30 in the time zone of the management console. The time frame of the monthly report is the previous month. This option is available only for Capacity Planning reports.
■ Output Orientation: Select whether the email displays the report in portrait format or landscape format.
■ Page Size: Select a page size that accommodates the amount of data in the report. For example, for a report in the Landscape orientation, select the Legal paper size, which is wider than the Letter size.
Export Call Details
18 User Guide
Export Call Details
You can export the details of a call from the database into a spreadsheet. In some cases, the data available for export is not available in other UC Monitor reports.
No charts are included in the spreadsheet. The raw data provides a deeper insight into call activity and performance on the network and is useful for troubleshooting incidents. The spreadsheet identifies the directory numbers and IP addresses of the endpoints in each Location, which are useful for fine-tuning Location definitions.
You can select the details to include in the spreadsheet, such as the individual endpoint, the Location, media device, or a pair of Locations or media devices.
The following data is not available for export:
■ Data from watched calls from the Call Watch feature
■ Data from medianet streams
Follow these steps:
1. Click Troubleshooting, Calls, Export in the navigation bar.
The Export Call Details page opens.
2. Use the following fields to select the data and database columns you want to export.
■ Group and Location/Media Device lists. You can export call data for:
– a group of managed items.
– a pair of groups of managed items.
– a Location, media device, or directory number.
– a pair of Locations or media devices.
– a pair that consists of a Location and a media device.
– a pair of directory numbers.
– a pair that consists of a directory number and a Location or media device.
The lists include all available groups, Locations, and media devices.
Export Call Details
Chapter 2: Using the Management Console 19
■ Phone Number. Type the directory number of an endpoint whose call data you want to export. Use the format 8887675443.
– Enter a direct-dial number. Individual extensions are not supported.
– Do not use hyphens or periods to separate the area code and number.
– International numbers (with country code appended) are not supported.
– You can use an asterisk (*) as a wildcard. For example, *55* matches 55, 155, 552, and 1552. You can also use a pound or number sign (#) as a single-digit wildcard. For example, 45#7 matches 4517, 4527, and 4537.
■ To/From and To options. Use these options to determine the call data to include. The direction is an indication of the origination party and the destination party and thus indicates whether call setup metrics are included. Both directions (legs) of a call are always included.
– Select To to export only the call data for calls from Call Party 1 to Call Party 2.
– Select To/From to export call data for all calls related to the two call parties.
To export data for a Location or media device, select it as Call Party 1, select a direction, and then select Any (Location or Media Device) for Call Party 2.
■ Include abandoned calls. Select the check box to include data from calls that were connected successfully but were abandoned before data was sent.
■ Call Description. This option cannot be disabled.
– Date and time of a call
– Called number
– Call setup metrics
– MOS
■ Origination Call Detail. Select this option to include information about the origination endpoint, such as the directory number, call server, codec, firmware version, and switch connection type. Availability of this information depends on the type of endpoint.
■ Destination Call Detail. Select this option to include information about the destination endpoint, such as the directory number, call server, codec, firmware version, and switch connection type. Availability of this information depends on the type of endpoint.
3. Click Export.
The File Download dialog opens.
4. Click Save.
Note: We do not recommend selecting the option to open the file. Downloading a large amount of data takes longer when you select this option.
Set Filter and Display Options for Reports
20 User Guide
5. Enter or browse to a download location and click OK.
The selected details are exported to a file in .csv format. The process takes a few minutes to complete, depending on the amount of data available in the database and the parameters you selected.
Set Filter and Display Options for Reports
For every report, you can control the views that are displayed and the drill-down options that are available.
Some of the settings you select are associated with your user account and persist for the relevant report across login sessions. These include settings that indicate a viewing preference, such as the Display on Page settings and Additional Settings. Drill-down settings persist only among related reports. For example, the filtering applied to the Call Performance Overview also applies to the Call Leg Details for that report. Otherwise, drill-down settings are automatically cleared when you navigate away from the page.
Each selection restricts the other settings available to you, revealing only the options for a valid drill-down path into the report data. Each Settings dialog contains options that are specific to the selected report. The Settings dialog also contains options to filter by group name and group member when custom groups are defined.
Follow these steps:
1. Click the Settings link at the top of the page. The Settings link is to the right of the navigation bar.
The Settings dialog opens. The contents of the Settings dialog varies for each report. The navigation of each dialog is the same.
Set Filter and Display Options for Reports
Chapter 2: Using the Management Console 21
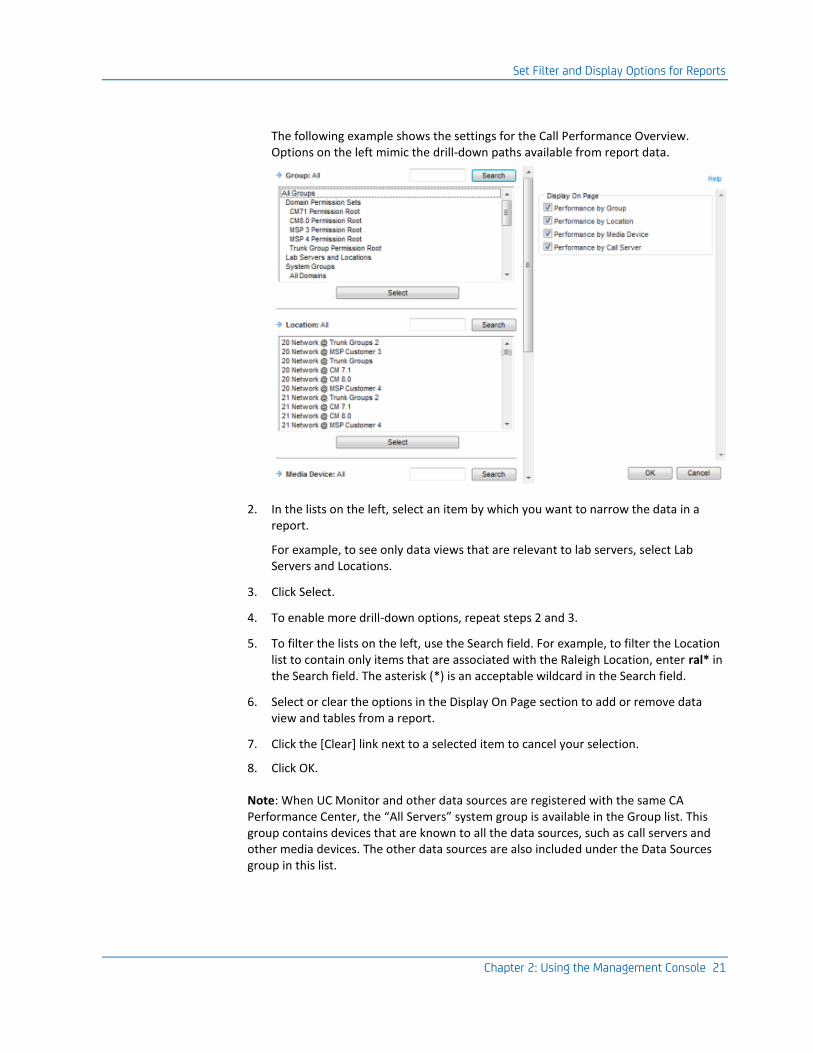
The following example shows the settings for the Call Performance Overview. Options on the left mimic the drill-down paths available from report data.
2. In the lists on the left, select an item by which you want to narrow the data in a report.
For example, to see only data views that are relevant to lab servers, select Lab Servers and Locations.
3. Click Select.
4. To enable more drill-down options, repeat steps 2 and 3.
5. To filter the lists on the left, use the Search field. For example, to filter the Location list to contain only items that are associated with the Raleigh Location, enter ral* in the Search field. The asterisk (*) is an acceptable wildcard in the Search field.
6. Select or clear the options in the Display On Page section to add or remove data view and tables from a report.
7. Click the [Clear] link next to a selected item to cancel your selection.
8. Click OK.
Note: When UC Monitor and other data sources are registered with the same CA Performance Center, the “All Servers” system group is available in the Group list. This group contains devices that are known to all the data sources, such as call servers and other media devices. The other data sources are also included under the Data Sources group in this list.
Refresh Reports
22 User Guide
Refresh Reports
The Auto Refresh setting affects all reports. When enabled, report pages are refreshed every 60 seconds to reflect new data that was sent from the collector since the page was last refreshed.
Follow these steps:
1. Click OPTIONS at the top right of a report.
A list of menu items appears.
2. Click Disable Auto Refresh to turn off the refresh feature.
3. Click Enable Auto Refresh to turn on the refresh feature.
Tip: When you hover your cursor over the Refresh menu item, a tooltip tells you whether the Auto Refresh feature is on or off.
Chapter 3: What are Performance Thresholds? 23
Chapter 3: What are Performance Thresholds?
For most metrics, UC Monitor provides default performance thresholds that establish a foundation for VoIP performance monitoring and reporting. Performance thresholds define the boundaries of acceptable performance behavior.
UC Monitor uses performance thresholds to determine when incidents are created and to rate collected data. For example, a call quality latency threshold of 150 milliseconds indicates a Degraded condition. If latency data crosses that threshold, UC Monitor rates the data as Degraded in call quality reports. Similarly, a measurement of 400-millisecond latency indicates an Excessive condition in reports.
Default thresholds were selected according to well-defined industry standards for acceptable VoIP and video performance from the perspective of network users. UC Monitor offers the following sets of performance thresholds:
■ Call setup thresholds, which trigger incidents in response to poor call setup, such as an excessive delay to dial tone.
■ Call quality thresholds, which trigger incidents in response to poor call quality, such as low MOS.
■ Video quality thresholds, which trigger incidents in response to poor video quality, such as video packet loss.
Note: Call quality incidents, which include video quality incidents, take precedence over call setup incidents when the incidents occur during the same incident interval, and the severity of the call quality incidents is equal to or greater than the severity of the call setup incidents.
For a monitored metric, two threshold levels are available:
■ Degraded threshold: Indicates a decline in performance
■ Excessive threshold: Indicates a severe decline in performance
Threshold values are not inclusive. They must be crossed, not met, before an incident is created.
This section contains the following topics:
Call Quality Thresholds (see page 24) Call Setup Threshold (see page 25) Video Quality Thresholds (see page 26)
Call Quality Thresholds
24 User Guide
Call Quality Thresholds
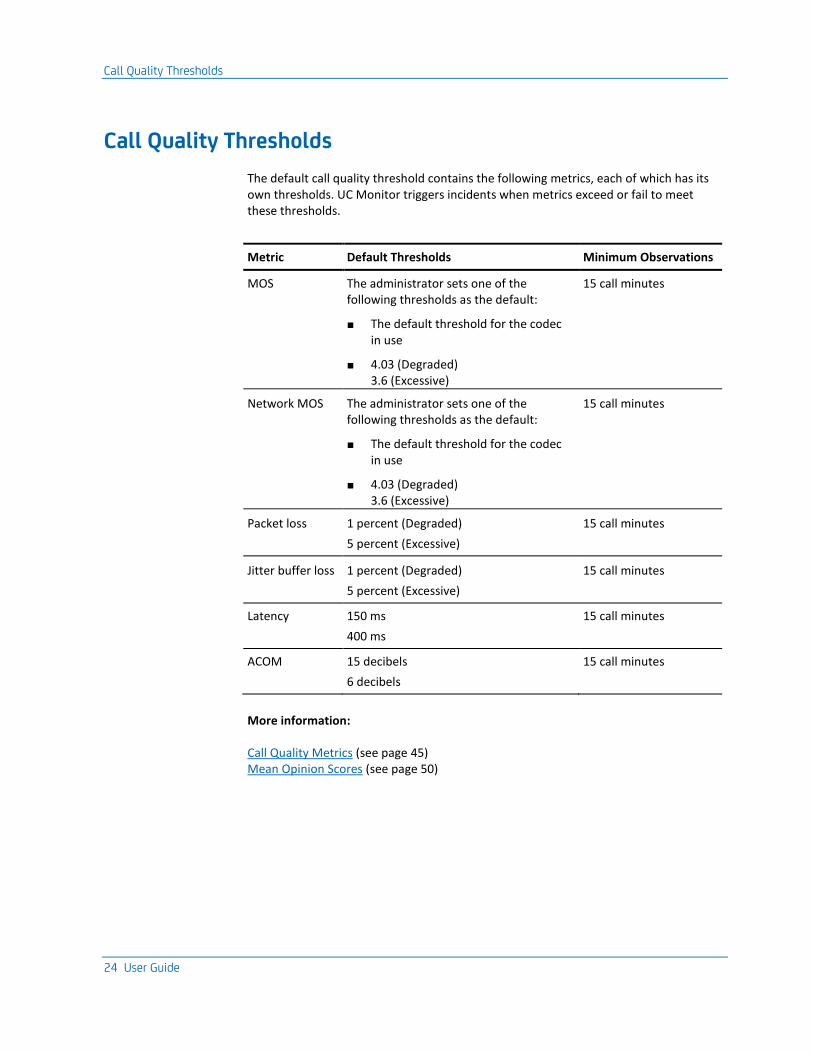
The default call quality threshold contains the following metrics, each of which has its own thresholds. UC Monitor triggers incidents when metrics exceed or fail to meet these thresholds.
Metric Default Thresholds Minimum Observations
MOS The administrator sets one of the following thresholds as the default:
■ The default threshold for the codec in use
■ 4.03 (Degraded) 3.6 (Excessive)
15 call minutes
Network MOS
The administrator sets one of the following thresholds as the default:
■ The default threshold for the codec in use
■ 4.03 (Degraded) 3.6 (Excessive)
15 call minutes
Packet loss
1 percent (Degraded)
5 percent (Excessive)
15 call minutes
Jitter buffer loss
1 percent (Degraded)
5 percent (Excessive)
15 call minutes
Latency 150 ms
400 ms
15 call minutes
ACOM 15 decibels
6 decibels
15 call minutes
More information:
Call Quality Metrics (see page 45) Mean Opinion Scores (see page 50)
Call Setup Threshold
Chapter 3: What are Performance Thresholds? 25
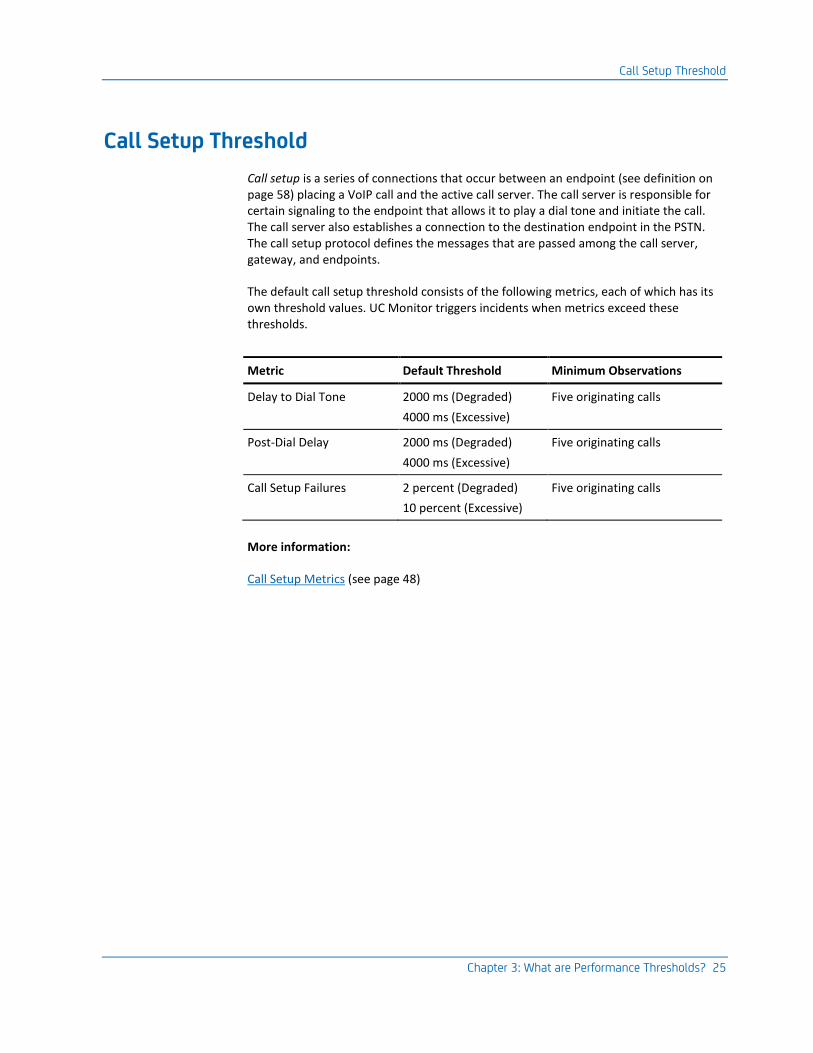
Call Setup Threshold
Call setup is a series of connections that occur between an endpoint (see definition on page 58) placing a VoIP call and the active call server. The call server is responsible for certain signaling to the endpoint that allows it to play a dial tone and initiate the call. The call server also establishes a connection to the destination endpoint in the PSTN. The call setup protocol defines the messages that are passed among the call server, gateway, and endpoints.
The default call setup threshold consists of the following metrics, each of which has its own threshold values. UC Monitor triggers incidents when metrics exceed these thresholds.
Metric Default Threshold Minimum Observations
Delay to Dial Tone 2000 ms (Degraded)
4000 ms (Excessive)
Five originating calls
Post-Dial Delay 2000 ms (Degraded)
4000 ms (Excessive)
Five originating calls
Call Setup Failures 2 percent (Degraded)
10 percent (Excessive)
Five originating calls
More information:
Call Setup Metrics (see page 48)
Video Quality Thresholds
26 User Guide
Video Quality Thresholds
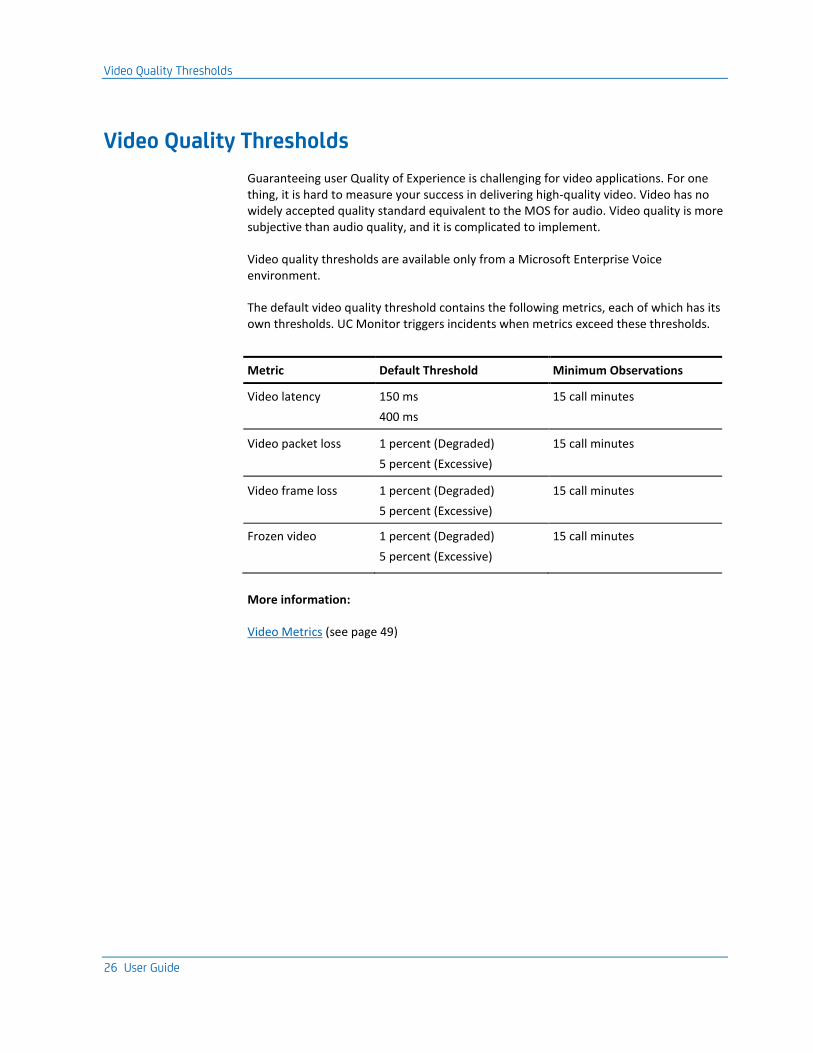
Guaranteeing user Quality of Experience is challenging for video applications. For one thing, it is hard to measure your success in delivering high-quality video. Video has no widely accepted quality standard equivalent to the MOS for audio. Video quality is more subjective than audio quality, and it is complicated to implement.
Video quality thresholds are available only from a Microsoft Enterprise Voice environment.
The default video quality threshold contains the following metrics, each of which has its own thresholds. UC Monitor triggers incidents when metrics exceed these thresholds.
Metric Default Threshold Minimum Observations
Video latency 150 ms
400 ms
15 call minutes
Video packet loss
1 percent (Degraded)
5 percent (Excessive)
15 call minutes
Video frame loss
1 percent (Degraded)
5 percent (Excessive)
15 call minutes
Frozen video 1 percent (Degraded)
5 percent (Excessive)
15 call minutes
More information:
Video Metrics (see page 49)
Chapter 4: What are Call Server Thresholds? 27
Chapter 4: What are Call Server Thresholds?
Call server thresholds are designed for monitoring in Cisco environments. They cannot be applied to Avaya or Microsoft components.
Call server performance and status have a powerful impact on Quality of Experience when users make or receive calls. IP phones and voice gateways register with a call server and send keepalives to provide status. The call server handles all aspects of call setup:
■ Sending dial tones and ringing or busy signals.
■ Routing calls.
■ Cleaning up resources after a call is complete.
To help you track call server status, UC Monitor offers two types of call server thresholds to provide more accurate reporting:
■ Call server thresholds, which are applied to individual servers and generate incidents for Registration Failures and Poor Call Quality.
■ Call server group thresholds, which are applied to call server groups and generate incidents for Phone Status Changes. An administrator creates call server groups to represent server clusters.
This section contains the following topics:
Call Server Thresholds (see page 27) Call Server Group Thresholds (see page 28)
Call Server Thresholds
Call server thresholds are applied to individual call servers. The call server thresholds are designed to create call server incidents from information in the Phone Details reports. For example, when a Registration Failures incident is reported, multiple endpoints (see definition on page 58) in the Phones report have a status of Registration Failed.
The default call server threshold consists of the following metrics, each of which has its own threshold values.
Registration Failures threshold
The Registration Failures threshold creates an incident when devices repeatedly, but unsuccessfully, try to register with a call server. Excessive registration failures can indicate a configuration problem, a call server issue, or a network issue, such as a connectivity outage.
Call Server Group Thresholds
28 User Guide
Excessive registration failures can indicate a security problem that can impede server performance. When an endpoint tries to register from an unauthorized address, the call server ultimately denies the request. The call server responds to every registration request. Therefore, excessive registrations consume bandwidth and tie up the call server while it tries to resolve device addresses and process requests.
For a Registration Failures incident, verify call setup performance in the Performance Overview to see whether problems with an overburdened call server caused other issues. Then review the Phones report to see whether the registration requests come from an unauthorized IP address.
Default: The default value for a Registration Failures threshold is 15 failures per reporting interval. The severity is always excessive.
Poor Call Quality threshold
The Poor Call Quality threshold is based on the Quality Report Tool (QRT), a feature of some Cisco IP telephone models. The QRT allows users to press a key to report poor call quality. When the key is pressed, the QRT collects information useful for troubleshooting the poor performance from various sources. The QRT then formats the information and sends it to its call server. The call server places the information in a call detail record.
The Poor Call Quality threshold creates an incident when a user presses the QRT key. When a Poor Call Quality incident is reported, a Phone Details Table is available from the Incidents Overview report. The Phone Details report shows call legs for the 15 minutes before the QRT key was pressed and identifies the associated telephone.
Default: The Poor Call Quality threshold is enabled by default, and its severity is always excessive.
Call Server Group Thresholds
The call server group thresholds are designed to be applied to your call server clusters, or to other logical groupings of call servers. Each call server in a cluster can play several different roles to provide failover safeguards and load balancing. The call server group thresholds apply to all call servers in a cluster.
The default call server group threshold triggers incidents when phone status changes exceed the Phone Status Changes metric. The Phone Status Changes incident helps you detect failover events and branch office outages. The incident also helps identify call server performance issues and costly branch office connectivity failures. Typically, the incident itself provides enough information to help you identify the affected devices and call server group. The Phone Status Changes incident helps you distinguish endpoints that access call servers over a WAN link from other endpoints that use a local cluster.
Default: The default call server group threshold is 50 percent of all devices that had status changes during the reporting interval.
Call Server Group Thresholds
Chapter 4: What are Call Server Thresholds? 29
The following types of status changes contribute to a Phone Status Changes incident.
Currently Missing Phones status
The percentage of endpoints that were registered to a server in the group, but are no longer registered to any server in the group. The total does not include endpoints that had normal deregistration, which may have occurred as part of a restart.
Recently Moved Phones status
The percentage of endpoints that were registered to a call server in this group, but are now registered to a different call server in the same group.
New/Found Phones status
The percentage of endpoints that are registered to a call server in this group, but were not registered during the previous reporting interval.
■ A new endpoint has never registered to this call server group since monitoring with UC Monitor began.
■ A found endpoint lost contact with this call server group in the past, but registered again with the group during the last reporting interval.
When the threshold is exceeded, a Phone Status Changes incident is included in the summary list of Call Server incidents. Separate data views provide information about each type of status change when you drill down into the detailed incident report.
The incident is not dependent on the similar information reported in the Phones Report. For example, when a Currently Missing Phones status change occurs, multiple devices in the Phones List can show a status of Unavailable or Lost Contact. The status of an endpoint is actually the device status at the end of the reporting interval. When a change in status occurs, the incident is created before another status change occurs. The later status is reflected in the Phones Report and is slightly out of sync with the incident. Review the Phone Details Report, which includes the Previous Status for each endpoint.


Chapter 5: What are Codec Thresholds? 31
Chapter 5: What are Codec Thresholds?
Codec-based thresholds supplement performance thresholds to help you better understand and manage call quality. By default, codec thresholds apply codec-appropriate values for MOS and Network MOS as traffic using various standard codecs is detected. These values can be changed, however. The administrator sets these thresholds relative to codec performance or relative to absolute MOS.
A codec encodes and decodes the audio from both ends of a telephone conversation, producing packets that are sent and received across the network. Codec performance has a noticeable effect on VoIP and video performance.
Many codecs are available to optimize VoIP or video performance, each with an accompanying set of drawbacks and benefits. In addition to the different bandwidth requirements associated with different codec types, codecs have other characteristics that can affect network performance. Some high-performance codecs do not compress data and, as a result, use more bandwidth than codecs that use a compression scheme. Compression often degrades the audio signal and adds delay.
For the most part, codecs provide a certain level of audio quality, which is expressed as a theoretical maximum MOS. Some codecs from Microsoft, however, receive ratings for two types of theoretical maximum MOS, and advertise different performance expectations in wideband and narrowband environments.
UC Monitor defines thresholds for the most common codecs. An administrator can modify these values to suit specific monitoring needs. The administrator can add new codec thresholds that are based on a list of supported codecs. The settings consist of Degraded and Excessive values for each MOS metric.
Predefined thresholds are available for most popular codecs, but no default codec threshold is defined. Therefore, when codec thresholds are enabled, UC Monitor applies the thresholds to the codecs it detects during monitoring. These thresholds include predefined or custom thresholds that use the codecs that are detected from monitored call traffic.
For codecs that are not in the list of predefined or custom codec thresholds, the associated MOS appears as Unrated in reports.
Note: The proprietary Microsoft codecs, RTAudio and Siren, offer a threshold for Network MOS, a metric that is available from Microsoft VoIP and video endpoints. The MOS scale used in the Microsoft codecs is different from the scale that other codecs use. For example, the MOS for a Degraded threshold for the RTAudio codec does not represent equivalent performance to the same threshold for the G.729 codec.

Chapter 6: What are Incidents? 33
Chapter 6: What are Incidents?
An incident is a record of information that UC Monitor creates when a threshold is crossed. Thresholds are boundaries of acceptable performance behavior, and exist by default for each monitored call performance metric. Administrators can change thresholds to make them more or less sensitive to performance changes.
UC Monitor creates incident reports, displays them on the Incidents Overview, and launches associated responses. An administrator can configure incident responses for each type of incident:
■ Call setup incidents
■ Call quality incidents
■ Video quality incidents
■ Call server and call server group incidents
The call quality that a user experiences occurs between pairs of network endpoints. Therefore, call quality thresholds are assigned to pairs that consist of two Locations, two media devices, or a Location and a media device. Call setup thresholds are assigned to single network entities. Call setup incidents are reported for pairs of affected Locations and call servers or media devices.
A set of consecutive incidents can represent one extended, degraded state. Depending on the type of metrics, excessive or degraded statistics triggers a call quality incident or a call setup incident. Only one incident is open at a time for a unique Location or voice gateway pair. When an incident is already open for a pair, the incident is updated with the time of the new observation.
By default, incident responses do not launch actions. A UC Monitor administrator configures the actions and notifications to occur in response to a threshold violation. For each incident response, an administrator specifies:
■ An action or notification to occur when performance meets or exceeds the Degraded threshold.
■ An action or notification to occur when performance meets or exceeds the Excessive threshold.
How Incidents Trigger Responses
34 User Guide
Note: Collector incidents are applicable to collector performance and are reported separately. For more information about collector incidents and collector thresholds, see the use case titled "Managing Collectors in Avaya or Cisco Environments" in the UC Monitor bookshelf on the CA Support website.
This section contains the following topics:
How Incidents Trigger Responses (see page 34) How Incidents are Closed (see page 35) Manage Incident Responses (see page 36) How to Respond to an Incident (see page 37) View Incident Details (see page 38) Acknowledge Incidents (see page 38)
How Incidents Trigger Responses
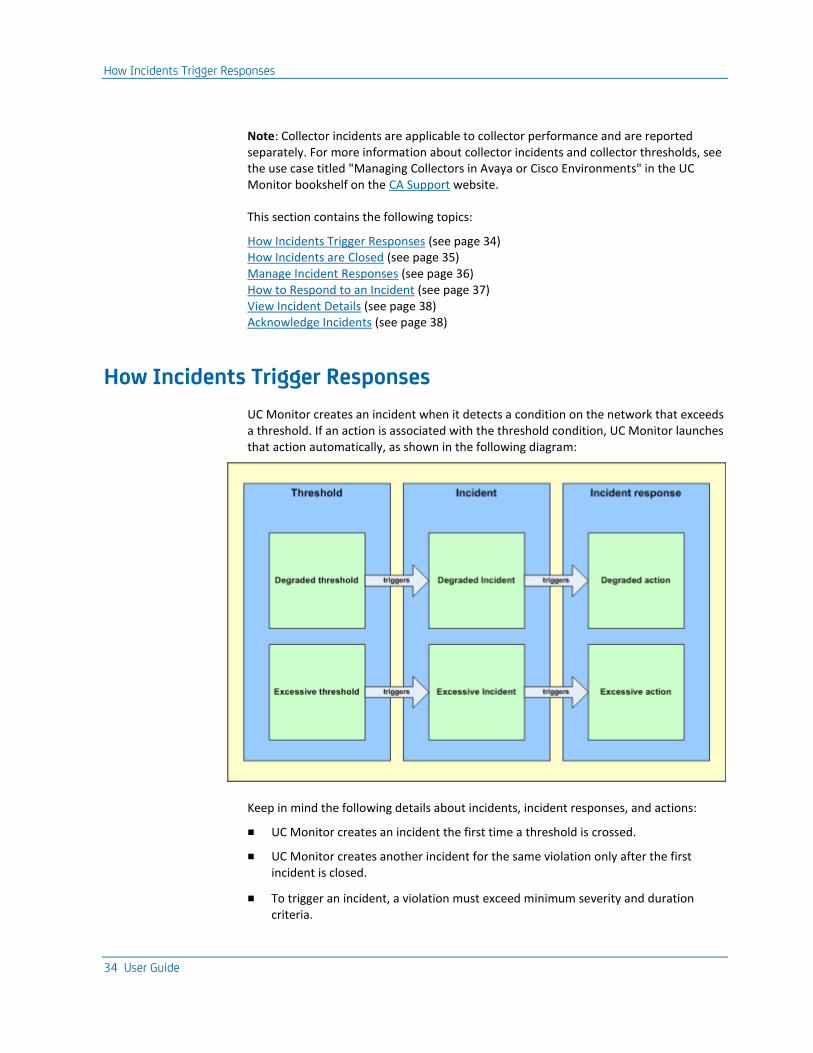
UC Monitor creates an incident when it detects a condition on the network that exceeds a threshold. If an action is associated with the threshold condition, UC Monitor launches that action automatically, as shown in the following diagram:
Keep in mind the following details about incidents, incident responses, and actions:
■ UC Monitor creates an incident the first time a threshold is crossed.
■ UC Monitor creates another incident for the same violation only after the first incident is closed.
■ To trigger an incident, a violation must exceed minimum severity and duration criteria.
How Incidents are Closed
Chapter 6: What are Incidents? 35
■ A UC Monitor administrator can associate an incident response with the incident type.
■ For a few incidents, such as the Abnormal Termination incident, no applicable metrics are monitored for improvement so that the incident can be closed. Therefore, the incident is briefly opened to trigger automatic actions and is then immediately closed. The accompanying email or SNMP trap notification indicates that the incident is open, but in fact closure is pending.
■ The traceroute investigation action is configured as an incident response action for call setup or call server group incidents only.
The results of a traceroute investigation for other types of incidents, such as call quality, are not helpful. Traceroutes begin at the collector, which is located so closely to the call server that little is determined from the route for call traffic.
For call server group incidents, the collector attempts to run a traceroute to the key phone at the affected Location.
A traceroute investigation can also be launched independently of an incident.
How Incidents are Closed
An incident remains open until it is automatically closed. For example, the severity of the condition changes, but the metrics still violate the degraded or excessive threshold. The incident is updated to reflect the change in severity, but the incident is not closed.
Incidents are closed when:
■ They are open for 24 hours. If the problem still occurs after 24 hours, a new incident is opened.
■ The performance condition that violated the threshold has not been detected for one full clock hour of data collection. A full clock hour is not the same as 60 minutes of time. A full clock hour starts at the beginning of an hour and ends at the beginning of the next hour.
Incident types can change. A call quality threshold violation overrides a call setup violation when they affect the same pair of reporting components. An incident remains open for that pair, but the type of incident changes to call quality when a call quality threshold violation is detected.
Note: You can acknowledge an incident for a degraded performance condition and not be aware that the performance condition has deteriorated further. A degraded incident can change to severe status while still appearing as acknowledged in incident reports. As a best practice, acknowledge only those incidents that you have taken steps to address.

Manage Incident Responses
36 User Guide
Manage Incident Responses
Incident responses are launched automatically in response to a threshold violation. Not all response actions are available for every incident.
Send email
You can send an email message to users in response to an incident. This response is available for the following incidents:
■ Call Performance
■ Call Setup
■ Call Quality
■ Call Server
■ Call Server Group Collect or
Send SNMP trap
You can send an SNMP trap to selected computers in response to an incident. This response is available for the following incidents:
■ Call Performance
■ Call Setup
■ Call Quality
■ Call Server
■ Call Server Group
■ Collector
Launch traceroute investigation
You can run a traceroute to the affected Location or gateway, and then report the results. This response is available for the following incidents. A traceroute is launched only once, even if the incident remains open for multiple reporting intervals.
■ Call Performance
■ Call Setup
■ Call Server Group
■ Collector
Note: For the Phone Status Changes incident, this action sends the traceroute only to key phones. Therefore, the traceroute is launched only when a key phone is defined.
Launch Call Watch investigation
A Call Watch investigation is automatically launched in response to a Poor Call Quality (QRT) incident. You cannot disable this action.
How to Respond to an Incident
Chapter 6: What are Incidents? 37
How to Respond to an Incident
Incidents and incident responses are useful for troubleshooting in the following ways:
■ Incidents maintain a record of conditions at the time a problem occurs.
■ Incident responses automatically gather information that helps you troubleshoot a problem, reducing the mean-time-to-repair (MTTR).
An email about an incident contains a notification that a threshold was crossed. The message also contains a link to the incident report, where you can drill down into detailed information.
Status updates are available for SNMP trap notifications. A UC Monitor administrator can configure them as incident response actions. They also include a notification that performance for a certain component has returned to normal after a recent threshold condition that was also reported. For each incident reported in an incident response email message, one or more links to associated UC Monitor reports are included.
When you receive an email notification or SNMP trap in response to an incident, perform one or more of the following actions to troubleshoot the poor performance.
■ Click links provided in the notification to view the relevant incident report.
■ Drill down for more information about the incident, such as the status of call servers.
■ Click the Related Reports link to an associated investigation report. Review the Traceroute Investigations report to see whether the path of the call setup traffic resembles the one shown in the Baseline Traceroute Details.
■ Launch a manual traceroute investigation for more information about the route between the affected endpoint and its call server or voice gateway.
■ Initiate a Call Watch for the affected endpoints.
■ Acknowledge the incident to reduce its priority and to let other operators know that the issue is addressed.
More information:
What is Call Watch? (see page 39)

View Incident Details
38 User Guide
View Incident Details
When call setup or call quality performance metrics exceed a threshold, UC Monitor displays a list of incidents on the Incidents Overview. Click the link for an incident to view the full incident report.
Incident reports show details of the related performance degradation. They have a maximum time frame of 24 hours. You can view incidents that were active during the time frame of interest.
Follow these steps:
1. Access the Incidents Overview in one of the following ways:
■ Click a link in the incident notification.
■ Click Monitoring, Incidents in the navigation bar.
The Incidents Overview opens.
2. In the ID column, click the number for the incident whose details you want to view.
The Incident Details page opens, and displays information that is already narrowed to show the affected Locations and a media device or call server. An alarm icon indicates when the incident was reported.
Acknowledge Incidents
Acknowledging an incident reduces its priority in reports and indicates to others that the incident was reviewed. If necessary, you can unacknowledge an acknowledged incident, to raise its priority in reports.
Follow these steps:
1. Click Monitoring, Incidents in the navigation bar.
The Incidents Overview page opens.
2. Select the check box of the incident you want to acknowledge in the Acknowledged column.
3. Click Apply.
The Severity status indicator identifies the acknowledged incident.
Note: You can acknowledge an incident for a degraded performance condition and not be aware that the performance condition has deteriorated further. A degraded incident can change to severe status while still appearing as acknowledged in incident reports. As a best practice, acknowledge only those incidents that you have taken steps to address.
Chapter 7: What is Call Watch? 39
Chapter 7: What is Call Watch?
The Call Watch feature supports troubleshooting and diagnostics by collecting real-time quality data from selected VoIP conversations and presenting it in the Call Watch Overview. This feature is distinct from the core monitoring functionality that UC Monitor provides, which is largely passive monitoring of VoIP-related data.
To enable the Call Watch and investigations features, a UC Monitor user account must have an associated role with the appropriate privileges, which an administrator assigns.
Call Watch provides an extra layer of call quality monitoring and can gather additional data from a potential problem area to use in troubleshooting. If a user complains of poor call quality, for example, you can initiate a Call Watch for the phone to collect additional performance data. In the resulting Call Watch Overview, you notice patterns in the measurements that can help you resolve the underlying problem.
A Call Watch actively polls the selected phone. During a Call Watch, the collector uses HTTP to collect in-progress call performance data from the web page of the phone. The HTTP query occurs every 15 seconds during the watch period when a call is active. An analog or PSTN telephone can also be watched. UC Monitor uses SNMP to query the MIB of the voice gateway that routes PSTN calls.
The collector gathers the following information from a watched IP phone, or from a voice gateway device for a watched PSTN telephone:
■ Origination time
■ Origination phone, destination phone
■ Delay to dial tone
■ Post-dial delay
■ MOS
■ Packet loss
■ Jitter buffer loss
■ Latency
■ ACOM and ERL, when collected from the gateway for a PSTN call

How to Use Call Watch
40 User Guide
■ Signal in and signal out, when collected from the gateway for a PSTN call
■ Concealed seconds, severely concealed seconds
Call Watch is specially designed for troubleshooting a reported problem with call setup or call quality.
This section contains the following topics:
How to Use Call Watch (see page 40) Call Watch List (see page 41) Create a Call Watch Definition (see page 41) Call Watch Limitations (see page 43)
How to Use Call Watch
During a Call Watch, UC Monitor collects detailed, real-time quality data for all calls traveling to or from a selected directory number for a specific period. During the Call Watch time frame, UC Monitor polls the associated device for information about call performance during active calls.
All calls made in an Avaya Communication Manager environment are automatically watched. Data from these calls is displayed in the Call Watch Overview, with a Type of Automatic. Because this data accumulates rapidly, it is purged after two days. To retain Call Watch data for a longer period, create a Call Watch definition.
Each Call Watch definition applies to one directory number. You can set up a Call Watch for the directory number of an IP phone in your VoIP system or the directory number of an analog telephone in the PSTN.
Example of a Call Watch scenario
1. A coworker submits a Help Desk ticket claiming that the audio quality of the last call from an IP phone was poor.
2. You set up a two-hour Call Watch for the directory number of the IP phone.
3. You ask the coworker to call again to help you test the system. The Call Watch feature performs extra polling to gather information about call performance.
4. You access the Call Watch Overview report and watch the incoming data. Jitter and latency measurements are high, and the MOS for the call is only 3.3.
5. Click the MOS bar chart to see which direction of the call was affected. The poor performance seems to occur between the destination telephone in the PSTN, and the origination phone in the incoming direction only.
This information indicates that the problem probably occurs at the voice gateway.
Call Watch List
Chapter 7: What is Call Watch? 41
6. You switch to the Call Performance Overview report and drill down into the data for the gateway at the user Location.
7. You find that calls to and from this gateway have low ACOM values, which indicate a problem with excessive echo. Determine whether the echo canceler is functioning properly.
Call Watch List
The Call Watch List identifies all defined Call Watches.
Phone Number
The number of the telephone or IP phone that is watched.
Duration
The length of time that the phone is watched.
Last Modified By
The name of the user who created or changed the Call Watch definition.
Last Modified On
The date and time the Call Watch definition was created or changed. Also the date and time when monitoring began on calls from and to this phone.
Create a Call Watch Definition
A Call Watch definition includes a location on the network where you think performance issues occur. You instruct UC Monitor to gather extra data from a directory number in that location.
As you select the directory number to watch, keep in mind the following guidelines:
■ All calls from supported Avaya phones are automatically watched. No configuration is necessary in the Avaya Communication Manager environment.
■ Call Watch is not supported in a Microsoft environment.
■ A few older Cisco IP phone models do not support the collection of all Call Watch statistics. Select newer Cisco IP phones to watch.
■ Unless there is a configuration issue in the Call Watch definition or in your network, Call Watch is bi-directional. Therefore, all calls to and from a watched directory number are monitored for quality statistics.
■ Do not include hyphens or periods to indicate the area code or exchange in the directory number.
Create a Call Watch Definition
42 User Guide
■ Select an IP phone for the Call Watch. UC Monitor lets you enter the directory numbers of analog phones in the PSTN, but the complications of number transformations, area codes, and prefix digits make it difficult to enter them accurately. IP phones also provide extra information about call performance. To troubleshoot a voice gateway, select a directory number that uses that gateway for the Call Watch.
■ Ensure that the directory number you watch is the same as the identity of the phone at the gateway. For example, do not enter a phone extension as the Call Watch directory number if the gateway identifies the phone by its full ten digits.
■ Reload the collectors when you create or change a Call Watch.
■ Start creating data for the Call Watch:
■ Call the watched directory number.
■ Call from the watched phone.
■ Watch a gateway. Set up a Call Watch to a phone that uses that gateway. Then use a cell phone to call the watched number. Or call from the watched phone. When the call is routed through the PSTN through the gateway, you see useful call performance statistics.
Follow these steps:
1. Click Troubleshooting, Call Watch, Definitions in the navigation bar.
The Call Watch List opens.
2. Click New.
The Call Watch Properties dialog opens.
3. Complete the following fields:
■ Phone Number. The number of the telephone or IP phone that is watched. Use the format 8887675443. Do not use hyphens or periods to separate the area code and number. Enter a direct-dial number.
■ Watch Continuously. Perform Call Watch functions until the Call Watch is canceled.
■ Watch Until. Perform Call Watch functions until a specified date and time. Enter the date to end the Call Watch, using the format MM/DD/YYYY. The time is automatically set relative to the time zone of the logged-in user. The default setting is to Watch Until 24 hours from the time the Call Watch definition is saved.
Note: If a call is active at the watched phone for more than eight hours, a Call Watch is automatically terminated for that call. Other calls to that phone are still watched.
4. Click Save to save this Call Watch definition.
5. Click Save and Add Another to save this definition and create another Call Watch.

Call Watch Limitations
Chapter 7: What is Call Watch? 43
Call Watch Limitations
The Call Watch Overview and the Call Watch list have limits that affect the number of items displayed.
Avaya Call Watch data accumulates rapidly because all calls from Avaya phones are automatically watched. As a result, data from such automatic Call Watch entries is purged after seven days. To retain Call Watch data for a longer period, set up a manual Call Watch for that phone.
UC Monitor supports up to 50 simultaneous Call Watch definitions per collector. However, this limit requires some clarification.
■ Up to 50 IP or analog phones are watched simultaneously. Voice gateways are actively polled during watched calls involving the PSTN.
■ Up to 25 calls appear in the Call Watch list when the origination and destination phones are watched.
The number of definitions shown in the Call Watch list depends on:
■ How you set up each definition.
■ The specific calls that were made at a given moment.

Appendix A: Report Metrics 45
Appendix A: Report Metrics
This section contains the following topics:
Call Quality Metrics (see page 45) Call Setup Metrics (see page 48) Video Metrics (see page 49) Mean Opinion Scores (see page 50)
Call Quality Metrics
The following metrics are available from UC Monitor reports.
ACOM
(Cisco PSTN calls only) The total echo return loss on the network. ACOM measures how significantly the voice gateway reduced the echo. ACOM includes echo reduction that occurs with or without the activity of an echo cancellation device.
Burst
(Microsoft only) The points in a data stream when a high percentage of packets is lost or discarded due to packets arriving late.
■ Burst Density. The percentage of packets within burst periods that are lost or discarded.
■ Burst Duration. The average duration of all high-loss periods in a data stream.
Concealment Ratio
A technique for masking the effects of packet loss in VoIP communications. Also known as packet loss concealment (PLC).
■ Cumulative Concealment Ratio: The percentage of all call seconds that had concealment events due to lost data.
■ Maximum Concealment Ratio: The highest concealment ratio value during the call.
■ Severely Concealed Seconds: The number of call seconds that had more than 5 percent concealment events from the start of the audio stream.
Echo Tail Length
(Avaya only) The “length” of echo cancellation processing. Based on the distance between a voice gateway and the endpoint. Typical values range from 8 milliseconds to 32 milliseconds.
Call Quality Metrics
46 User Guide
Gap
(Microsoft only)
■ Gap Density. The percentage of lost or discarded packets in the gaps between bursts in a data stream.
■ Gap Duration. The average duration of periods of good performance (low loss) between periods of data loss in a data stream. Occasionally, gap duration exceeds the call duration.
Jitter
Packet delay that distorts the quality of a voice conversation.In charts, maximum jitter values are graphed as data points and indicated on the right Y-axis.
The definition of Maximum Jitter varies by monitored environment:
■ Avaya environment: The maximum jitter per interval
■ Cisco environment: The maximum jitter thus far
Jitter Buffer
■ Jitter Buffer Delay. (Avaya only) Delay that the jitter buffer introduces while it holds one or more packets to reduce variations in packet arrival times. Acceptable jitter buffer delay is two RTP datagrams or less. Because most codecs have a datagram size of 20 to 30 milliseconds, a good jitter buffer delay is no more than 40 to 60 milliseconds.
■ Jitter Buffer Loss. (Cisco only) The packets that are lost when jitter hinders the caching capacity of the jitter buffer.
■ Jitter Buffer Over Runs. (Avaya only) The number of times that jitter exceeded the maximum size setting of the jitter buffer. Packets arrive too slowly to be contained by the jitter buffer. Over runs usually result in packet loss.
■ Jitter Buffer Under Runs. (Avaya only) The number of times that the jitter buffer became empty. Packets arrive too quickly to be contained by the jitter buffer. Under runs usually indicate that delays are too lengthy for the buffer setting.
Note: Avaya endpoints have a limitation that affects the way the Over Runs and Under Runs metrics are reported. The maximum value is 255. In a report, this cumulative value means that the value was greater than 255, and the actual maximum value cannot be reported. These values, reported every 15 seconds during a Call Watch, are additive. After the maximum is reached, Jitter Buffer Over Runs and Under Runs charts show 0 values for successive intervals until the call is completed.
Latency
One-way delay. Calculated from the origination party to the destination party. Includes propagation delay, network delay, and packetization delay. Latency has a severe effect on VoIP call quality.

Call Quality Metrics
Appendix A: Report Metrics 47
Mean Opinion Score (MOS)
The Mean Opinion Score (MOS) is an industry standard method for gauging call quality. MOS is an estimation of how impairments to a voice signal affect listener perception of call quality.
■ MOS is the average MOS listening quality (LQK) score observed for the bi-directional voice stream.
■ MOS (Min) is the lowest LQK score observed.
■ (Microsoft only) Conversational MOS is based on MOS values from both directions of data flow.
■ Listening MOS is based on call legs traveling toward the endpoint (see definition on page 58) to reflect listener perception of quality.
Network MOS
MOS listening quality value that is based only on network factors, such as codec, packet loss, packet reordering, packet errors, and jitter.
Noise Level
(Microsoft only) The average portion of an audio signal that is noise and not actual voice data. Measured in decibels.
Packet Loss
The percentage of data packets that were lost in transit. These packets were sent but never received at the destination.
■ Packet Loss. The average loss rate.
■ Packet Loss (Max). (Avaya only) The maximum loss rate.
■ Packets Received. A means of gauging the size of the data stream.
■ Packets Lost. The difference between the number of packets that were sent and the number of packets that were received.
Sequence
(Avaya only)
■ Sequence Jumps. The number of times that at least one consecutive packet was lost.
■ Sequence Falls. The number of times that at least one packet arrived out of order.
Call Setup Metrics
48 User Guide
Signal Level
(PSTN calls only) The average audio signal level in decibels. The dBm0 abbreviation refers to decibels relative to a power level of one milliwatt (dBm) measured at a zero transmission level.
■ Signal in. The signal level of the data traveling into the echo canceler.
■ Signal out. The signal level of the data traveling out of the echo canceler toward the IP network.
Time-To-Live
A counter embedded in data to prevent a data packet from circulating through the network indefinitely. The counter decrements each time that the packet passes through a router or a switch. The minimum and maximum TTL values are provided.
Call Setup Metrics
The term call setup refers to the connections that occur between a device trying to make a VoIP call and the active call server. The call server signals the device to play a dial tone and initiate the call. The call server also establishes a connection to the destination device. The call setup protocol defines the messages that are passed among the endpoints (see definition on page 58).
Only endpoints that initiate a call can generate call setup metrics, which are shown in Call Performance reports.
Call Setup Failures
The calls that fail to connect during the setup phase. Expressed as a percentage of all calls that were attempted during the monitoring interval.
Call Setup Failure Code
The code that the call server returns when a call fails during the setup phase. The code indicates the type of failure. For more information, see the list of call termination cause codes on the Cisco website.
Delay to Dial Tone
The amount of time it takes for a user to hear a dial tone after picking up the receiver of an IP telephone. During the call setup phase of a VoIP call, the device receives messages from the call server to play a dial tone. Users can think that the system is not working when dial tone is delayed.
Post-Dial Delay
The amount of time from when a user enters the last digit of a telephone number to when the user hears a ring or busy signal.
Video Metrics
Appendix A: Report Metrics 49
Video Metrics
Maintaining user Quality of Experience (QoE) is immensely challenging for video applications because it is difficult to measure success in delivering high-quality video. Video applications do not have a widely accepted video quality standard equivalent to the MOS for audio. Video quality is more subjective than audio quality, and it is more complicated to implement.
Note: Video metrics are available only from monitored Microsoft Lync environments or from medianet-enabled devices.
Frozen Period
The average length of frozen video instances.
Frozen Video
The frequency of long and noticeable frozen video periods for an entire session. Expressed as a percentage of session time.
Video Bit Rate
Bit rates provide a gauge of codec performance.
■ Video Bit Rate. Average number of bits sent per second for an entire stream.
■ Video Bit Rate (Max). Maximum number of bits sent per second for and entire stream.
Video Frame Decoding Time
The average amount of time for decoding frames in a stream. A slower decoding rate can be the result of conditions on the endpoint, such as lack of CPU resources, and can affect call quality.
Video Frame
■ Frame Loss: The average number of unique consecutive images, or video frames, lost due to corruption and error concealment for the entire system. Video frames can span multiple packets. Video frames can span multiple packets, so this metric is useful when compared with the video packet loss metric.
■ Frame Rate: The average number of frames that were sent or received per second for an entire stream.
Video Jitter
■ Video Jitter. The variation in delay among video packets in the same stream.
■ Video Jitter (Max). The highest observed jitter level for the call.
Video Latency
The maximum time for a video packet to travel between the calling parties. Measured from end-to-end in one direction. Calculated by taking the average round-trip time for a call leg in a given video call and dividing it in half.

Mean Opinion Scores
50 User Guide
Video Packet
The percentage of video packets that were lost in transit. These packets were sent but never received at the destination.
■ Packet Loss. The average loss rate. The maximum rate is also provided.
■ Packets Received. A means of gauging the size of the data stream.
■ Packets Lost. The difference between the number of packets that were sent and the number of packets that were received.
■ Consecutive Packet Loss. The percentage of all packets that were lost consecutively. This value provides a gauge of loss burstiness.
Mean Opinion Scores
The Mean Opinion Score (MOS) is an industry standard method for gauging call quality. MOS is an estimation of how impairments to a voice signal affect listener perception of call quality. The MOS scale ranges from 5.0 to 1.0.
■ 5.00 represents an audio signal of the highest quality, free from impairment.
■ 1.00 represents the lowest quality.
The MOS provided in UC Monitor reports is an average that is derived from multiple samples, unless otherwise specified.
The G.107 standard provides a scale that relates MOS values to user satisfaction:
MOS Range Likely User Opinion of Call Quality
4.3-5.0 Users are very satisfied
4.0-4.3 Users are satisfied
3.6-4.0 Some users are dissatisfied
3.1-3.6 Many users are dissatisfied
2.6-3.1 Nearly all users are dissatisfied
1.0-2.6 Not recommended
The MOS value for a VoIP call leg partly depends on the codec that is used to packetize the audio signal. Different codecs advertise different theoretical maximum MOS values, which are the highest possible score they can achieve in the absence of other impediments.
In UC Monitor reports, the calculations for MOS values in a Cisco or Avaya environment differ from the calculations in a Microsoft environment.

Mean Opinion Scores
Appendix A: Report Metrics 51
Cisco MOS Calculations
UC Monitor uses information from Cisco IP endpoints (see definition on page 58) to report MOS for the calls that do not leave the monitored network. Each endpoint tells its call server about the MOS of the last call that was made or received. The collector inspects the packets sent to the call server to find the MOS information.
For VoIP calls from endpoints in the PSTN, the collector polls the gateway for MOS information. For these PSTN calls, the collector uses the G.107 standard to calculate MOS from gateway call legs that use MGCP, H.323, or SIP.
The MOS is referred to as listening quality MOS (MOS-LQK) to distinguish it from conversational quality MOS (MOS-CQ). Unlike MOS-CQ, MOS-LQK does not account for echo or delay.
Cisco uses a proprietary algorithm that estimates voice listening quality by taking into account the following factors:
■ Perceptual weighting factors.
■ Quality impairment factors that affected the audio stream, such as the type of codec used.
Avaya MOS Calculation
Avaya endpoints (see definition on page 58) send metrics every few seconds. The collector uses these metrics to calculate and report MOS during an active call. The collector uses an algorithm similar to the Cisco voice gateways, using the G.107 standard. The scores are thus based on MOS listening quality.
Microsoft MOS Calculations
Endpoints that support VoIP and video quality metrics in a Microsoft system provide the following types of MOS:
■ Listening quality MOS (MOS-LQ): Isolates the listening quality of audio by excluding bidirectional effects, such as delay and echo.
■ Conversational quality MOS (MOS-CQ). Consists of the listening quality in each direction of the call, taking into account impairments from delay and echo.
■ Network MOS: MOS listening quality value that is based only on network factors, such as codec, packet loss, packet reordering, packet errors, and jitter. Generally, the Lync instances report these values and other quality metrics at the end of each call. The Network MOS therefore helps you isolate network impediments on audio quality.

Mean Opinion Scores
52 User Guide
The proprietary Microsoft codecs, RTAudio and Siren (used for conference calls), can operate in two bandwidth modes. Therefore, MOS-LQ and Network MOS are reported on a wideband scale.

Appendix B: Integration with CA Performance Center 53
Appendix B: Integration with CA Performance Center
CA Performance Center is a web-based reporting interface that helps you effectively manage your physical and virtual networks, applications, and devices. CA Performance Center dashboards and reports present performance data that was collected by network and systems-monitoring products. You can compare large amounts of statistical data from multiple sources within a single web page.
CA Performance Center takes a "performance-first" approach to application service delivery. This approach places end users in the primary role. To understand how well an IT organization supports application delivery to users, you must capture and analyze data from applications, devices, and the network.
CA Performance Center offers role-specific views of application response times, traffic composition, infrastructure health, and flow-based diagnostics.
When you register UC Monitor as a data source for CA Performance Center, you enable additional features.
■ Locations and devices are organized into groups and tenants using the CA Performance Center group administration interface.
■ CA Performance Center supports monitoring by IP domain. Overlapping IP addresses that correspond to separate enterprise networks are monitored separately, with no sharing of secure data among third-party operators.
■ Security parameters are shared among all CA Performance Center data sources. User accounts and their associated roles and access permissions are managed in CA Performance Center and shared with other CA Performance Center data sources.
■ SNMP profiles are created in CA Performance Center and shared automatically among all data sources, including UC Monitor.
■ Multiple data views from UC Monitor reports are available in the Unified Communications dashboards in CA Performance Center. The dashboards provide a high-level summary of your unified communications deployment.
You can click a link in a dashboard view and access the related report in the UC Monitor management console, with the appropriate context selected. The management console provides more details of the data that is summarized in the dashboard.
– Performance Overview Dashboard. Provides a daily or weekly summary of overall VoIP and video call performance. Performance is sorted by call server, group, Location, and media device.

Mean Opinion Scores
54 User Guide
– Volume and Utilization Dashboard. Provides views that focus on volume and usage. The views sort data by group, Location, phones, trunk groups, and voice interfaces.
– Worst Performance Dashboard. Identifies the phones and Locations with the worst performance for a specified interval.
Glossary 55
Glossary
ACOM The total echo return loss on the network. ACOM measures how significantly the voice gateway reduced the echo. ACOM includes echo reduction that occurs with or without the activity of an echo cancellation device.
all channels busy The percentage of the reporting interval for which all active channels in a trunk group carried traffic.
analog telephone adapters (ATA) A device used to connect a standard telephone to a computer or network so that the user can make calls over the internet. ATAs are typically cheaper than specialized VoIP phones that connect directly to a computer's USB port. An ATA typically supports one or two ports.
Answer Seizure Ratio (ASR) The number of successfully answered calls compared to the number of call attempts.
Application Enablement Services (AES) The Avaya application server that provides system management APIs.
audio/visual conferencing server A server in a Microsoft Lync environment that enables audio and video (multi-party) conference calls. Also referred to as an A/V MCU.
Automatic Number Identification (ANI) A feature of telephony that lets subscribers display or capture the telephone numbers of calling parties.
Avaya Communication Manager In an Avaya unified communications system, the component that handles voice and video call processing and performs all the tasks that are provided by a PBX in a legacy system.
burst The points in a data stream when a high percentage of packets is lost or discarded due to packets arriving late.
burst density The percentage of packets within burst periods that are lost or discarded.
burst duration The average duration of all high-loss periods in a data stream.
56 User Guide
busy-hour call attempts (BHCA) The number of calls attempted at the busiest (peak) hour of the day.
busy-hour call completions (BHCC) The number of calls completed at the busiest (peak) hour of the day. BHCC is a measure of the throughput capacity of a VoIP network.
call detail record (CDR) Storage of information about the endpoints of a call and other aspects of call control and routing.
call leg A discrete segment of a call connection in a VOIP network. A logical connection between a router and an endpoint.
call management record (CMR) Storage of information about the quality of the streamed audio of a call.
call minutes The number of minutes that calls were active during the selected time period.
call path The path, or route, a call takes between the origination and destination endpoints in a network.
call setup A series of connections that occur between a telephone placing a VoIP call and the active call server. The call server is responsible for certain signaling to the telephone that allows it to play a dial tone and make the call. The call server also establishes a connection to the destination endpoint in the PSTN. The call setup protocol defines the messages that are passed among the call server, gateway, and endpoints.
call setup failures The calls that fail to connect during the setup phase. Expressed as a percentage of all calls that were attempted during the monitoring interval.
call setup protocol Protocols involved in the call setup process: SIP, SCCP, H323, and MGCP.
calls attempted All calls that the monitored system tried to place, either successfully or unsuccessfully. This metric is the primary unit of measurement for the Call Volume Audio views.
calls completed The number of audio-only calls that were successfully completed during the selected time frame. Includes calls from endpoints within the monitored system and calls from outside of the system to endpoints inside of the system.

Glossary 57
channels out-of-service The number of channels in a trunk group that are out of service.
Cisco CallManager cluster A group of physical servers, running Cisco Unified Communications Manager (CallManager), to work together as an IP PBX system.
Cisco IP Communicator A Microsoft Windows-based softphone application for making voice and video calls.
Cisco Performance Monitor A feature of Cisco routers and switches that enables reporting of quality metrics for a medianet environment.
codec Codecs (the term is short for coder-decoder) convert an audio signal into compressed digital form for transmission and then back into an uncompressed audio signal for replay.
concealment A technique for masking the effects of packet loss in VoIP communications. Also known as packet loss concealment (PLC).
concealment ratio The percentage of frames in a data stream that are concealment frames, which the endpoints generate to conceal packet loss. Includes both early and late packets.
conference ID Identifier for a voice gateway call.
connection attempts The number of times a connection to the server is attempted before timing out.
controller LAN board (C-LAN) G650 voice gateways can have C-LANs defined and running on the device as separate call servers. Each C-LAN has a dedicated IP address, which appears in UC Monitor reports as a call server. However, the actual call server is the Communication Manager, which is usually installed on a separate media server.
conversational MOS The Mean Opinion Score (MOS) based on metric factors from both directions of data flow.
currently missing phones The percentage of endpoints that were registered to a server in the group, but are no longer registered to any server in the group.
delay see latency (see page 61)
58 User Guide
delay to dial tone The amount of time it takes for a user to hear a dial tone after picking up the receiver of an IP telephone. During the call setup phase of a VoIP call, the device receives messages from the call server to play a dial tone. Users can think that the system is not working when dial tone is delayed.
Differentiated Services Code Point (DSCP) The Differentiated Services Code Point setting of the incoming RTP packets.
digital telephone Digital telephones convert analog sound into digital format at the handset. Digital telephones do not include web browsers or more advanced applications generally available from IP telephones.
directory number (DN) A telephone number.
echo The phenomenon of your voice coming back to you, as if you were repeating yourself. In a VoIP network, echo is accentuated by the amount of delay in the network.
Echo Return Loss (ERL) Reduction in the echo level produced in the circuit without an echo canceler. The degree or amount of loss reflects the volume of the echo that remains, and a measurement of how significantly echo was reduced.
Echo Return Loss Enhancement (ERLE) An enhancement in the echo return loss that an echo canceler produces. An echo canceler removes the echo portion of a VoIP call signal as it exits the tail circuit and heads into the WAN. Also referred to as cancellation loss.
echo tail length The “length” of echo cancellation processing. Based on the distance between a voice gateway and the endpoint. Typical values range from 8 milliseconds to 32 milliseconds.
edge server In a Microsoft Lync™ Server 2010 environment, a server running in the perimeter network to provide connectivity for external users and public instant messaging connections. The edge server ensures that users outside the firewall are authorized before they obtain access to the Lync deployment. The edge server also provides media relay for audio/visual streams where direct connection is not possible.
egress interface The interface where traffic exits a device.
endpoint An endpoint is any device where a media stream begins or ends, such as telephone, softphone, telepresence, voice gateway, media device, and video camera.
Glossary 59
erlang In telephony, a statistical measure of the volume of telecommunications traffic. Traffic of one Erlang refers to a single resource being in continuous use, or two channels being at fifty percent use, and so on.
failover Failover is the process of switching to a backup server or system when the primary server or system fails, is offline, or becomes unavailable.
Flexible NetFlow The next generation in flow technology from Cisco. Flexible NetFlow enables the delivery of medianet data to UC Monitor.
front-end server In a Microsoft Lync Server 2010 environment, a server that typically performs call processing functions. Lync Server 2010 supports a pool of one or more front-end servers working together to perform functions such as call processing.
frozen period The average length of frozen video instances.
frozen video frequency The frequency of long and noticeable frozen video periods for an entire session. Expressed as a percentage of session time.
G.107 An ITU-T standard for reporting VoIP conversational call quality. UC Monitor uses this standard to calculate MOS from the voice gateway’s perspective at the end of an IP-PSTN call.
G.711 A high-performance, high bit-rate codec (64 Kbps) often used for its excellent voice quality. Because it does not use compression, G.711 requires more bandwidth than some other common codecs.
gap density The percentage of lost or discarded packets in the gaps between bursts in a data stream.
gap duration The average duration of periods of good performance (low loss) between periods of data loss in a data stream.
gatekeeper An optional component of a VoIP network that provides services such as endpoint registration, address resolution, admission control, and user authentication.
gateway A device that provides the conversion interface between the PSTN and an IP network.
60 User Guide
Grade of Service (GoS) An estimation of the probability that a VoIP call receives a busy signal. The GoS value (a decimal fraction) is always expressed with reference to the busy hour when the traffic intensity is the greatest. GoS is reported from the perspective of the origination Location or gateway device (the outgoing direction).
group overflows The number of outgoing calls presented to the trunk but not carried. Overflow calls arrived when all trunks in the trunk group were busy, but were not queued on the trunk group. This value does not include calls that were denied service on the trunk group because of authorization failures.
H.323 An ITU standard protocol for call setup. UC Monitor supports gateways that use this protocol to communicate with Cisco Unified Communications Manager.
ingress interface The interface where traffic enters a device.
Interactive Connectivity Establishment (ICE) A mechanism for SIP-based VoIP clients to successfully traverse the variety of firewalls that may exist between a remote user and a network.
jitter Packet delay that distorts the quality of a voice conversation.
jitter buffer Buffers that attempt to reduce or eliminate network jitter by caching packets. If jitter exceeds caching capacity, packets are lost (jitter buffer loss).
jitter buffer delay Delay that the jitter buffer introduces while it holds one or more packets to reduce variations in packet arrival times.
jitter buffer loss The packets that are lost when jitter hinders the caching capacity of the jitter buffer.
jitter buffer over runs The number of times that jitter exceeded the maximum size setting of the jitter buffer. Packets arrive too slowly to be contained by the jitter buffer. Over runs usually result in packet loss.
jitter buffer under runs The number of times that the jitter buffer became empty. Packets arrive too quickly to be contained by the jitter buffer. Under runs usually indicate that delays are too lengthy for the buffer setting.
Glossary 61
keepalive A message sent by one device to another to verify that the connection between the two is operating, or to prevent the connection from breaking.
latency One-way delay. Calculated from the origination party to the destination party. Includes propagation delay, network delay, and packetization delay.
Listening MOS The Mean Opinion Score, which is based on call legs traveling toward the endpoint to reflect listener perception of quality.
Mean Opinion Score (MOS) The Mean Opinion Score (MOS) is an industry standard method for gauging call quality. MOS is an estimation of how impairments to a voice signal affect listener perception of call quality.
mean time to repair (MTTR) Time required to repair a failed component or device. MTTR is also defined as "mean time to recovery," which is the amount of time required for a device to recover from a failure.
media device Specialized devices to route calls from the PSTN, handle conference calls, or transcode media streams. Examples include voice gateways, mediation servers, conferencing servers, and unified messaging servers.
Media Gateway Control Protocol (MGCP) Signaling and call control protocol used in a distributed VoIP system.
media processor The IP termination point for audio. It performs the conversion between time-division multiplexing (TDM) and IP. The audio payload is encapsulated in RTP, then UDP, then IP.
media relay An edge server function used with interactive connectivity establishment to provide end-to-end delivery of media streams where direct connectivity between two IP endpoints is not possible.
medianet A medianet is an IP architecture that enhances the performance of video, voice, and data, and automates many aspects of configuration.
mediation server Handles calls from the PSTN and interoperates with media devices that are outside the Microsoft Lync environment, such as other IP telephony environments.
62 User Guide
Microsoft Lync Server 2010 Microsoft Lync is the most recent version of Microsoft Office Communications Server, delivered and renamed in 2010.
midstream device A medianet-enabled device, such as a router or switch, that sends NetFlow data to UC Monitor to report on the quality of audio or video streams.
narrowband codec Compresses and decompresses traditional speech, covering frequencies 300 to 3400 Hz, to more easily fit over an IP network.
NetFlow Developed by Cisco, this network protocol collects IP traffic information.
network congestion Occurs when a network device carries so much data that the QoS deteriorates. Network congestion can result in packet loss and delay.
network delay
Transport delay produced by intervening network equipment, such as routers and switches.
Network MOS MOS listening quality value that is based only on network factors, such as codec, packet loss, packet reordering, packet errors, and jitter.
noise level (Microsoft only) The average portion of an audio signal that is noise and not actual voice data. Measured in decibels.
origination/destination The origination phone initiates the call. The destination phone receives the call.
packet loss The percentage of data packets that were lost in transit. These packets were sent but never received at the destination.
packet rate The number of data packets that are received per second. UC Monitor uses this value to determine whether an RTP stream is audio or video for medianet-enabled devices that do not report a codec.
packetization delay Delay introduced by a codec.
Glossary 63
port mirroring On a network switch, the port mirroring function sends copies of network packets from one port to another switch or port for analysis. The port mirroring function on Cisco switches is named Switched Port Analyzer (SPAN).
post-dial delay The amount of time from when a user enters the last digit of a telephone number to when the user hears a ring or busy signal.
POTS Plain Old Telephone System. The voice-grade telephone service that is the basic form of residential and small business service connection to the telephone network in most parts of the world.
presence In a unified communications environment, the ability for users to know the status and availability of other users.
propagation delay Delay produced by the physical distance that packets travel in a data transmission.
PSTN Public Switched Telephone Network. The network of the world's public circuit-switched telephone networks, in much the same way that the internet is the network of the world’s public IP-based packet-switched networks.
Publisher Required member of the Cisco Unified Communications Manager cluster that publishes database (config) updates to other members of the cluster. In failover situations, the Publisher can take over call processing functions from the Subscriber.
Quality of Service (QoS) QoS provides different priorities, or throughput levels, for different applications, users, or data flows on a packet-switched telecommunications network.
Quality Report Tool (QRT) A problem-reporting tool for Cisco IP phones, which allows users to easily report audio and other general problems with their IP phone. Many Cisco phones have a QRT softkey.
queue abandons Calls that were removed from the Trunk Group Queue.
queue overflows The number of calls that arrived when all slots in the Trunk Group Queue were busy.
Real-Time Control Protocol An IETF standard for providing out-of-band statistics and control information for an RTP flow. Generally sent over the next highest odd-numbered port as the corresponding RTP flow. RTCP provides feedback on the QoS in media distribution.
64 User Guide
Real-Time Transport Protocol (RTP) An IETF standard for delivering audio and video over the Internet. Generally sent on an even-numbered UDP port.
R-value R-value is a number, or score, that is used to quantitatively express the subjective quality of speech in a VoIP network. The R-value can range from 1 (worst) to 100 (best), and is based on the percentage of users who are satisfied with the quality of a test voice signal after it passed through a network from a source (transmitter) to a destination (receiver). In many cases, an R-value is mapped to a MOS, which is used most frequently when referring to VoIP call quality.
sending/receiving All endpoints that are involved in a call are, at some point, a sender and a receiver. During a call, all endpoints send data (talk) and receive data (listen).
sequence falls The number of times that at least one packet arrived out of order.
sequence jumps The number of times that at least one consecutive packet was lost.
Session Initiation Protocol (SIP) A signaling protocol for setting up and tearing down multimedia communication sessions such as voice and video calls.
severely concealed seconds The number of call seconds that had more than 5 percent concealment events from the start of the data stream.
signal level The average audio signal level in decibels (dBm0).
Simple Network Management Protocol (SNMP) Protocol for managing devices on IP networks. A network that is managed by SNMP consists of a managed device, an agent on the managed device, and a network management system on the manager.
SIP Enablement Services The SIP proxy server for Avaya SIP endpoints.
SIP trunking A service offered by an Internet Telephony Service Provider that permits businesses with a PBX to use VoIP outside the enterprise network by using the same connection as the Internet connection.
Glossary 65
Skinny Call Control Protocol (SCCP) A proprietary Cisco messaging protocol that is used between clients (phones) and the Cisco Unified Communications Manager in a VoIP environment. SCCP passes messages using TCP and port 2000.
stream leg Unidirectional stream of packets.
Subscriber A server in the Cisco Unified Communications Manager cluster that typically performs call-processing functions.
successful call ratio Number of successful call completions divided by the number of call attempts.
Time to Live (TTL) A counter embedded in data to prevent a data packet from circulating through the network indefinitely. The counter decrements each time that the packet passes through a router or a switch.
traceroute A diagnostic tool that displays the route (path) and measures the transit delays of packets across an IP network
trunk group A group of trunks serving the same special purpose. The term commonly is applied to voice Private Branch Exchange (PBX) trunks.
trunk group ID The trunk group number for a voice gateway call in a Call Watch. The phone number of the endpoint that sends data through the gateway cannot be identified while the call is in progress. The trunk group ID is substituted for the phone number and displayed in the Phone Number field until the phone number is identified.
unified communications The convergence of multiple modes of communication (such as phone, video, and email) within applications and infrastructure to allow people, teams, and organizations to communicate more effectively.
Uniform Resource Identifier (URI) A user’s SIP phone number. A SIP URI may resemble an email address, such as sip:[email protected].
VG 224 gateway A Cisco gateway device that lets analog phones connect to an IP PBX, which typically supports 24 analog phones. All phones are assigned the same IP address with different port numbers.
66 User Guide
video bit rate The number of bits sent per second for an entire video stream. Bit rates provide a gauge of codec performance.
video frame decoding time The average amount of time for decoding frames in a stream. A slower decoding rate can be the result of conditions on the endpoint, such as lack of CPU resources, and can affect call quality.
video frame loss The average number of unique consecutive images, or video frames, lost due to corruption and error concealment for the entire system. Video frames can span multiple packets.
video frame rate The average number of frames that were sent or received per second for an entire stream.
video jitter The variation in delay among video packets in the same stream.
video latency The maximum time for a video packet to travel between the calling parties. Measured from end-to-end in one direction. Calculated by taking the average round-trip time for a call leg in a given video call and dividing it in half.
video packet loss The percentage of video packets that were lost in transit. These packets were sent but never received at the destination.
VLAN ID The ID of the virtual local area network (VLAN) that carries RTP packets.
voice gateway A router or switch with a specialized card that enables VoIP calls to and from the PSTN.
Voice over IP (Voip) A set of technologies, protocols, and transmission techniques for the delivery of voice communications and multimedia sessions over Internet Protocol (IP) networks, such as the Internet.
VoIP trunk A large bandwidth channel that handles multimedia data and forms the backbone of a network. In telephone exchanges, a trunk simultaneously transmits data and voice packets from one point to another.
weighted average A computation for an average value that takes into consideration the number of observations.
Glossary 67
For example, to compute the value of average jitter across sites in your network, use the following calculation:
(site1 avg + site2 avg + site3 avg + site N avg) divided by N
where N is the number of sites. To compute weighted average, use the following calculation, which allots more weight to sites with more jitter:
(o1(s1) + o2(s2) + o2(s3)+ oN(sN)) divided by (o1 + o2 + o3)
where N is the number of sites and o is the number of observations.
wideband codec Compresses and decompresses wideband speech, such as high-definition voice, to more easily fit over an IP network.

Index 69
Index
A
abandoned calls in exported call details • 18
acknowledging incidents • 38 ACOM
defined • 45 in a Call Watch • 39 threshold • 24
active monitoring • 9 architecture • 8, 9 auto refresh feature • 22 auto-attendant • 41 Avaya environments
call performance monitoring • 10 Call Watch feature • 11, 39 in UC Monitor architecture • 8, 9 MOS calculation • 51
B
bandwidth, provisioning for VoIP • 10 BHCA
defined • 56 in capacity planning • 10
BHCC defined • 56 in capacity planning • 10
browser support • 13
C
CA Performance Center defined • 53
call activity monitoring • 10 call detail record (CDR)
and Quality Report Tool • 27 defined • 56 end of call • 9
call failures cause codes • 48 monitoring • 48
call legs in MOS calculation • 50 Phone Details report • 27
call minutes defined • 56
in call quality thresholds • 24 in video quality thresholds • 26
call path, defined • 56 call performance
measurements • 9 thresholds • 23 VoIP and video • 10
call quality incidents • 33 metrics, defined • 45 MOS calculation • 50 thresholds • 23, 27, 31 troubleshooting • 39
call server groups incidents • 33 thresholds • 28
call servers monitoring • 9, 10 thresholds • 27
call setup and registration failures • 27 defined • 56 incidents • 33 metrics • 48 monitoring • 10 thresholds • 25 troubleshooting • 39
call volume monitoring • 10
Call Watch and the QRT tool • 27 creating a definition • 41 description • 39 sample scenario • 40 viewing list of definitions • 41
Calls Export feature • 18 channels
All Channels Busy • 55 Channels Out Of Service • 57
Cisco environments call server thresholds • 27 MOS calculation • 51
C-LAN • 57 codecs
defined • 57
70 User Guide
in delay calculation • 45 in MOS calculation • 50 thresholds • 31
collectors and MOS information • 51 defined • 8 how they work • 9 Lync collector • 8
concealed seconds defined • 45, 64
Concealment Ratio Call Details report • 45 defined • 45, 57 in jitter buffer loss calculation • 45
D
data collection Avaya environments • 10 Cisco environments • 10 collectors • 8 in incident closure • 35
data sources and CA Performance Center • 53
database as UC Monitor component • 8 export from • 18 MySQL • 8
degraded threshold defined • 23 in incident creation • 33
delay call setup • 25 caused by compression • 31 defined • 57
delay to dial tone defined • 48, 58 thresholds • 25
directory number in a Call Watch • 39
distributed system, defined • 8 drilling down into reports • 15
E
echo defined • 58 in MOS calculation • 51
echo cancelation in ACOM calculation • 45
Echo Return Loss (ERL) defined • 58 in ACOM calculation • 45
echo tail length • 58 excessive threshold
defined • 23 in incident creation • 33
exporting call details • 18
F
failed calls cause codes • 48
failovers defined • 59 Phone Status Changes incident • 28
front-end server as Lync collector • 8 role in UC Monitor architecture • 9
frozen video defined • 26, 49 threshold • 26
G
gap density, defined • 45, 59 gap duration, defined • 45, 59 Grade of Service
defined • 60
H
H.323 defined • 60 in call setup • 10, 25 in collected data • 8, 9 in MOS calculation • 51
I
incidents acknowledging • 38 avoiding multiple • 23 closing • 35 defined • 33 responding to • 34, 37 triggered by • 23, 27, 28 types of responses • 36
investigations Call Watch feature • 39
Index 71
J
jitter defined • 45, 60 in MOS calculations • 50 metrics • 45
jitter buffer delay defined • 60 metrics • 45
jitter buffer loss defined • 60 metrics • 45
jitter buffer overruns defined • 60 metrics • 45
L
listening quality Avaya MOS • 51 Cisco MOS • 51 Microsoft MOS • 51, 62
Locations segregating multiple enterprises • 8 selecting for export • 18
M
management console defined • 8 logging in • 13
media device selecting for export • 18
medianet defined • 61 midstream device • 62 monitoring • 12
MGCP in call setup • 25, 61 in MOS calculation • 51
Microsoft Lync environments data collection device • 8 in UC Monitor architecture • 8, 9 MOS calculation • 51 Network MOS • 31, 51 proprietary codecs • 31 video quality metrics • 49 video quality thresholds • 26
missing phones • 28, 57 MOS
Avaya calculation • 51 Cisco calculation • 51 defined • 50, 61 Microsoft calculation • 51 Network MOS • 31 theoretical maximum • 31
moved phones • 28
N
Network MOS calculation • 51 defined • 45 thresholds • 24, 31
new or found phones • 28 noise level
as MOS factor • 51 defined • 62
O
observations in call quality thresholds • 24 in call setup thresholds • 25 in video quality thresholds • 26
P
packet loss concealment • 51 defined • 45, 62 in MOS calculation • 50
passive monitoring • 9 phones
missing • 28 moved • 28 new or found • 28 registration failures • 27 status changes • 28
poor call quality Incident response • 36 QRT defined • 27 threshold • 27
post-dial delay defined • 48, 63 threshold • 25
printing reports • 16 protocols
for call setup • 56 per data source • 10 role in collector functionality • 8, 9
72 User Guide
Q
Quality Report Tool (QRT) and Poor Call Quality threshold • 27
R
registration failures threshold • 27
reports changing time frame • 14 drilling down into • 15 filtering displayed data • 20 printing • 16 refreshing • 22
RTAudio and Network MOS • 31 in MOS calculation • 51
RTCP • 9, 63 RTP
defined • 64 in jitter buffer delay • 45
S
sample size for call quality thresholds • 24 for call setup thresholds • 25
SCCP in call server monitoring • 10 in call setup monitoring • 10, 56 in collected data • 8, 9
sequence falls/jumps • 64 severely concealed seconds
defined • 45, 64 signal level • 64 SIP
in call setup monitoring • 10 in collected data • 8, 9
SIP URI defined • 65
standalone system, defined • 8
T
thresholds call quality • 24 call server • 27 call server group • 28 call setup • 25 codec • 31
video quality • 26 time frame for reports • 14 time-to-live • 65 traceroute • 34 troubleshooting
by exporting to .csv • 18 Call Watch feature • 11 using incidents and responses • 37
U
UC Monitor architecture • 8, 9 overview • 9
Unified Communications Dashboard • 13
V
video frame loss defined • 49, 66 threshold • 26
video jitter • 66 video latency
defined • 49, 66 threshold • 26
video packet loss defined • 49, 66 threshold • 26
voice gateways and registration failures • 27 in a Call Watch • 39
voice mail monitoring • 41
W
web browser support • 13