caam funds emerging internal demand page 1 caam funds emerging internal demand a domestic growth...
Post on 19-Dec-2015
217 views
TRANSCRIPT

Page 1 CAAM Funds Emerging Internal Demand
CAAM Funds Emerging Internal Demand
A domestic growth thematic fund

Page 2 CAAM Funds Emerging Internal Demand
Contents
Summary p. 3
1. Why focus on " Internal Demand " in Emerging Countries now? p. 4
1.1 Historical overview of economic development
1.2 An important contributor to world growth
1.3 Strong macro-economic fundamentals
1.4 Decreasing sensitivity of emerging markets to the US economy
2. The strong drivers of Internal Demand in Emerging Countries p. 12
2.1 Household consumption: the emergence of a gigantic middle class
2.2 Corporate investments: strong support from private investments,
infrastructure spending and urbanisation
3. CAAM Funds Emerging Internal Demand p. 20
3.1 CAAM Funds Emerging Internal demand: concept & attractiveness
3.2 Fund key features
3.3 Investment philosophy, robust process & risk monitoring
3.4 Track- record of Global Emerging funds managed by the team
3.5 Strengths of CAAM expertise

Page 3 CAAM Funds Emerging Internal Demand
A winning theme in the current market environment:
Growth engine of the world economy in the years to come
Better economic health of emerging countries should translate into more resilient internal demand than in the
past
A way to invest in Emerging Markets with a targeted lower volatility
Some protection from the slowdown of developed economies
Summary
Emerging internal demand: why now?

1. Why focus on Internal Demand
in Emerging Countries now?

Page 5 CAAM Funds Emerging Internal Demand
United KingdomUnited StatesFranceGermanySwedenJapanRussiaItalyCanadaAustraliaTaiwanSouth KoreaMexicoArgentina
Take-off BrazilTurkey
March towards technology maturity ChinaThailand
Mass consumption India
1780 1800 1820 1840 1900 19201860 1880 1940 1960
United KingdomUnited StatesFranceGermanySwedenJapanRussiaItalyCanadaAustraliaTaiwanSouth KoreaMexicoArgentinaBrazilTurkeyChinaThailandIndiaIndonesiaPhilippinesVietnam
1980 2000 2020 2040
1.1 Historical overview of economic development
Large Emerging countries are entering mass consumption phase
Analysis of Rostow in 1960 (updated in 1990), « The Stages of Economic Growth », economica,3e edition
Our vision

Page 6 CAAM Funds Emerging Internal Demand
Retail Sales growth over last 12 months (6 months average, mio $)
0
4000
8000
12000
16000
20000
24000
août
-98
févr
-99
août
-99
févr
-00
août
-00
févr
-01
août
-01
févr
-02
août
-02
févr
-03
août
-03
févr
-04
août
-04
févr
-05
août
-05
févr
-06
août
-06
févr
-07
United States China
Growth in retail sales are already higher in current dollars in China than in the United States
1.2 Internal Demand in Emerging countries: an important contributor to world growth (1/2)
Source : CAAM

Page 7 CAAM Funds Emerging Internal Demand
Differential between Emerging and Developed Countries
-5,0-4,0-3,0-2,0-1,00,01,02,03,04,0
1992
1993
1994
1995
1996
1997
1998
1999
2000
2001
2002
2003
2004
2005
2006
2007
2008
source : EIU, MSCI, CAAMGDP (real, %yoy) Average
GDP growth in emerging countries consistently above the one of developed countries (except for 1998)
Growth looks set to remain strong due to improvement in fundamentals
1.2 Internal Demand in Emerging countries: an important contributor to world growth (2/2)
Page 8 CAAM Funds Emerging Internal Demand
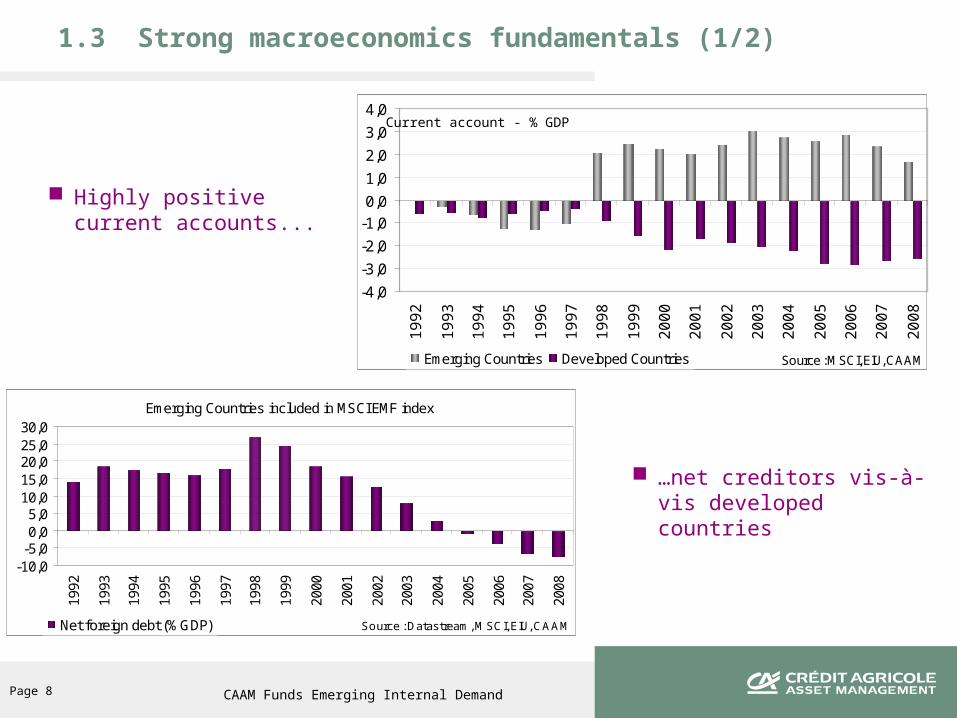
1.3 Strong macroeconomics fundamentals (1/2)
Highly positive current accounts...
-4,0
-3,0
-2,0
-1,0
0,0
1,0
2,0
3,0
4,0
19
92
19
93
19
94
19
95
19
96
19
97
19
98
19
99
20
00
20
01
20
02
20
03
20
04
20
05
20
06
20
07
20
08
Source : MSCI, EIU, CAAMEmerging Countries Developed Countries
Emerging Countries included in MSCI EMF index
-10,0-5,00,05,0
10,015,020,025,030,0
1992
1993
1994
1995
1996
1997
1998
1999
2000
2001
2002
2003
2004
2005
2006
2007
2008
Source : Datastream, MSCI, EIU, CAAMNet foreign debt (%GDP)
Current account - % GDP
…net creditors vis-à-vis developed countries

Page 9 CAAM Funds Emerging Internal Demand
Comparison of different bond spreads
0
200
400
600
800
1000
1200
1400
1600
1800
jan
v.-
98
ma
i-9
8
se
pt.-9
8
jan
v.-
99
ma
i-9
9
se
pt.-9
9
jan
v.-
00
ma
i-0
0
se
pt.-0
0
jan
v.-
01
ma
i-0
1
se
pt.-0
1
jan
v.-
02
ma
i-0
2
se
pt.-0
2
jan
v.-
03
ma
i-0
3
se
pt.-0
3
jan
v.-
04
ma
i-0
4
se
pt.-0
4
jan
v.-
05
ma
i-0
5
se
pt.-0
5
jan
v.-
06
ma
i-0
6
se
pt.-0
6
jan
v.-
07
ma
i-0
7
Source : CAAM London
Emerging Markets Bond Index Lehman Brothers High Yield Merrill Lynch BBB Index
Difference in rating between emerging and developed countries set to tighten further
10 years of macroeconomic adjustment and budget discipline:
historically low and less volatile spreads
1.3 Strong macroeconomics fundamentals (2/2)
S&P Ratings of countries included in the MSCI Emerging Markets (w eighted according to equity country w eight)
-1
0
1
2
3
4
5
6
7
8
9
Sep
-96
Mar
-97
Sep
-97
Mar
-98
Sep
-98
Mar
-99
Sep
-99
Mar
-00
Sep
-00
Mar
-01
Sep
-01
Mar
-02
Sep
-02
Mar
-03
Sep
-03
Nov
-03
Jan-
04
Mar
-04
May
-04
Jul-0
4
Sep
-04
Nov
-04
Jan-
05
Mar
-05
May
-05
Jul-0
5
Sep
-05
Nov
-05
Jan-
06
Mar
-06
May
-06
Jul-0
6
Sep
-06
Nov
-06
Jan-
07
0%
10%
20%
30%
40%
50%
60%
70%
80%
90%
100%
% Investment Grade (right) Av. grade for MSCI EMF (left)
Exit of Greece
Outperformance of non investment grade country leading to a lower rating
S&P upgraded Russia to "investment grade"
S&P upgraded India to "investment grade"
Downgrade of South Korea & exit of Portugal
Source : CAAM
Page 10 CAAM Funds Emerging Internal Demand
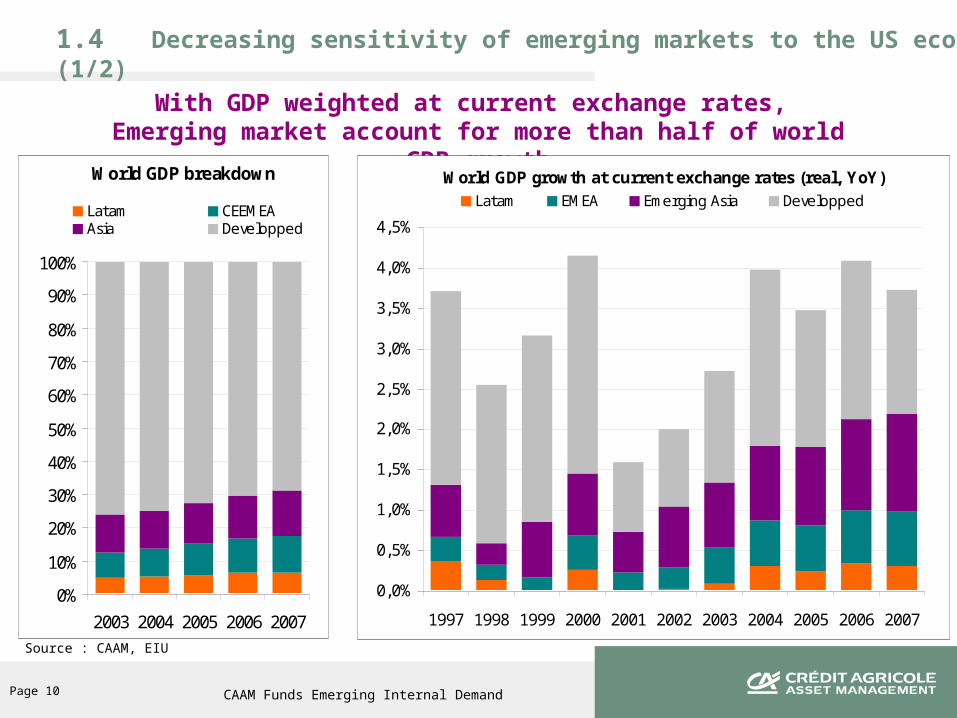
With GDP weighted at current exchange rates, Emerging market account for more than half of world GDP growth
Source : CAAM, EIU
World GDP breakdown
0%
10%
20%
30%
40%
50%
60%
70%
80%
90%
100%
2003 2004 2005 2006 2007
Latam CEEMEAAsia Developped
World GDP growth at current exchange rates (real, YoY)
0,0%
0,5%
1,0%
1,5%
2,0%
2,5%
3,0%
3,5%
4,0%
4,5%
1997 1998 1999 2000 2001 2002 2003 2004 2005 2006 2007
Latam EMEA Emerging Asia Developped
1.4 Decreasing sensitivity of emerging markets to the US economy (1/2)

Page 11 CAAM Funds Emerging Internal Demand
With GDP weighted at purchasing power parity, Emerging market account for 80% of world GDP growth
Source : CAAM, EIU
World GDP breakdown
0%
10%
20%
30%
40%
50%
60%
70%
80%
90%
100%
2002 2003 2004 2005 2006
Latam EMEAEmerging Asia Developped
World GDP growth at current exchange rates (real, YoY)
0,0%
1,0%
2,0%
3,0%
4,0%
5,0%
6,0%
1997 1998 1999 2000 2001 2002 2003 2004 2005 2006 2007
Latam EMEA Emerging Asia Developped
1.4 Decreasing sensitivity of emerging markets to the US economy (2/2)

2. The strong drivers of Internal Demand
in Emerging Countries

Page 13 CAAM Funds Emerging Internal Demand
0
10
20
30
40
50
60
0 1000 2000 3000 4000 5000 6000 7000 8000 9000 10000 11000 12000 13000 14000 15000 16000
Inc
om
e p
erc
en
tile
2000
Source : Nomura, July 2007« China consumer – The great Leap Upwards »
An accelerator effect beyond a certain level of development…
2.1 Household consumption: the emergence of a gigantic middle class (1/3)
< 3000$ : low incomes, subsistence consumption (strong share of food and clothing)
> 3000$: decent incomes allowing savings and consumption (cars, white goods, education, etc.)
0
10
20
30
40
50
60
0 1000 2000 3000 4000 5000 6000 7000 8000 9000 10000 11000 12000 13000 14000 15000 16000
Inc
om
e p
erc
en
tile
2000 2005
0
10
20
30
40
50
60
0 1000 2000 3000 4000 5000 6000 7000 8000 9000 10000 11000 12000 13000 14000 15000 16000
Inc
om
e p
erc
en
tile
2000 2005 2010
0
10
20
30
40
50
60
0 1000 2000 3000 4000 5000 6000 7000 8000 9000 10000 11000 12000 13000 14000 15000 16000
Inc
om
e p
erc
en
tile
2000 2005 2010 2015
Distribution of urban Chinese income
Percentage of households with income higher than 3000$ pa
2000 2005 2010 2015Urban revenu /capita 731 1235 1911 3000Growth 69% 55% 57%Nbr of people over 47 179 419Growth 281% 134%
Average GDP growth : 9%Average increase in number of people over 3000$ : 24%

Page 14 CAAM Funds Emerging Internal Demand
Source : Rostow, Goldman Sachs
2.1 Household consumption: the emergence of a gigantic middle class (2/3)
0
100
200
300
400
500
600
700
2000 2005 2010 2015 2020 2025 2030 2035 2040 2045 2050
Germany
US
Japan
Korea
Russia
Brazil
China
India
Nb of cars per 1000 habitants
Acceleration effect : for example, the car industry
Private car penetration
Log scale
Japan
Italy
Germany
France
UK
Canada
United States
Nb of habitants per car
Nb
of c
ars
per
1000
hab
itant
s

Page 15 CAAM Funds Emerging Internal Demand
Expansion of a middle-class population :
population size will considerably impact emerging countries
In 10 years time, 800 million people will cross the 3000$ threshold, i.e. a greater population compared to the US, Europe and Japan put together
Massive middle-class population expansion in highly-populated countries
Middle class in Brazil, Russia, India & China
0
0,5
1
1,5
2
2,5
3
3,5
2005 2010 2015 2020 2025 2030 2035 2040 2045 2050
Nb of people with income above3000$ pa (bn)
Dramatic rise in China's and India's middle class
0
200
400
600
800
1000
1200
1400
1600
2005 2015 2025 2035 2045
China
India
Sources : Goldman Sachs
2.1 Household consumption: the emergence of a gigantic middle class (3/3)

Page 16 CAAM Funds Emerging Internal Demand
2.2 Corporate investments: strong support from private investments
Healthy balance sheets should translate into higher capex
High levels of capacity utilization
0
10
20
30
40
50
60
70
80
90
100
2000 2001 2002 2003 2004 2005 2006E
0
10
20
30
40
50
60
70
80
90
100
Asia Pacific Free Cash Flow * (LHS) Asia Pacific Net Debt-to-Equity Ratio* (RHS)
%US$bn
70
72
74
76
78
80
82
84
86
Q2
19
95
Q4
19
95
Q2
19
96
Q4
19
96
Q2
19
97
Q4
19
97
Q2
19
98
Q4
19
98
Q2
19
99
Q4
19
99
Q2
20
00
Q4
20
00
Q2
20
01
Q4
20
01
Q2
20
02
Q4
20
02
Q2
20
03
Q4
20
03
Q2
20
04
Q4
20
04
Q2
20
05
Q4
20
05
Q2
20
06
Q4
20
06
Q2
20
07
Computation : average of Brazil, Thailand, Korea, Mexico, India, China Source : OECD, CAAM
Capacity utilization ratio
Source: Merrill Lynch

Page 17 CAAM Funds Emerging Internal Demand
2.2 Government spending: strong support from infrastructure
Governments infrastructure spending plans for 2007 to 2009
Source : Merrill Lynch, World Bank
Country Investment estimated Sectors targeted
China400bn$(12% GDP)
Energy, transportation (rail, highways), environment protection.2008 Olympics is a reason for sustained spending
India110bn$(9,7% GDP)
Roads, ports, oil and gas, power generation.
Indonesia45bn$ (10,5% GDP)
Roads, power generation, ports & water treatmentHas been reduced given slow regulatory reform and efforts to combat corruption
Russia185bn$(15,6% GDP)
Projects to facilitate exports of commodities (pipeline, ports)
Central & Eastern Europe25bn$ (3,5% GDP)
Spending target trans-European transport network (high speed motorways, rail lines)
South Africa60bn$(23%)
Will focus on electricity generation and transportation (rail freight)2010 world cup is the objective
Brazil100bn$(7,7% GDP)
Will apply to a wide range of sectors: oil, power generation, telecommunications, transportation, engineering and construction
Mexico60bn$(6,8%)
Natural gas, electricity, oil, roads, highways, home building
Total 985bn$ (10,8% GDP)

Page 18 CAAM Funds Emerging Internal Demand
Infrastructure needs are a major boost to investment
Example: India
Golden Quadrilateral was a huge
success: more roads built in India
over the past 5 years than there were
over the previous 50 years combined
Road / Highways- Development is
two-fold:
Expanding the 4 lane GQ network to 6
lanes
North/South & East/West corridors
linking the entire country
Source : CAAM Hong Kong
Page 19 CAAM Funds Emerging Internal Demand
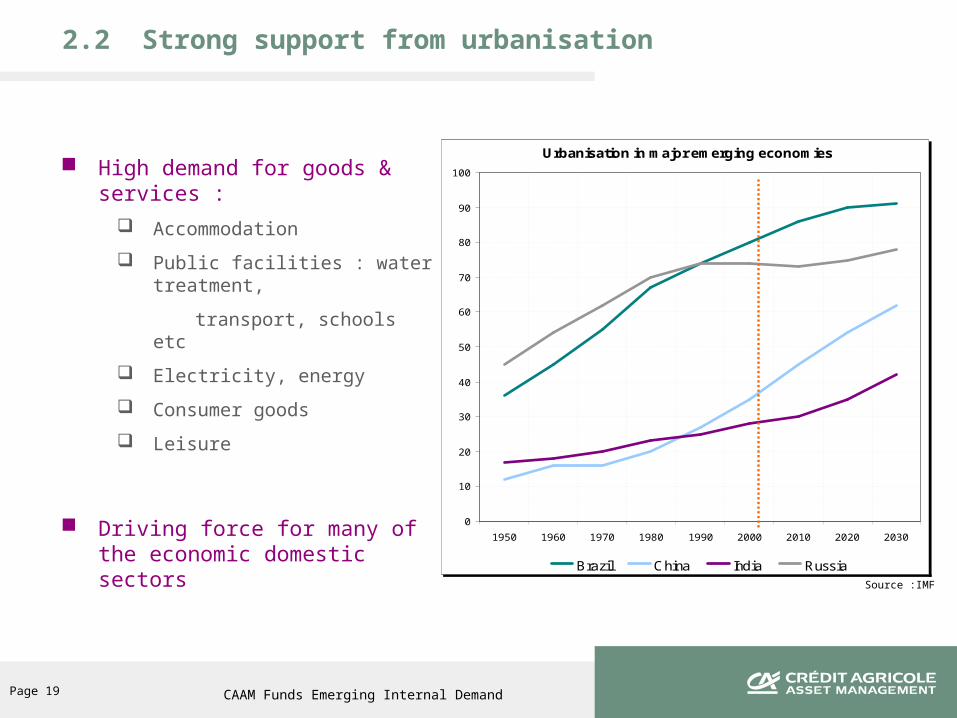
2.2 Strong support from urbanisation
High demand for goods & services :
Accommodation
Public facilities : water treatment,
transport, schools etc
Electricity, energy
Consumer goods
Leisure
Driving force for many of the economic domestic sectors
Urbanisation in major emerging economies
0
10
20
30
40
50
60
70
80
90
100
1950 1960 1970 1980 1990 2000 2010 2020 2030
Brazil China India Russia
Source :IMF

3. CAAM Funds Emerging Internal Demand

Page 21 CAAM Funds Emerging Internal Demand
An important contributor to world growth
Strong fundamentals supportive of a high and stable growth : Increasing purchasing power and demographics supportive of an increase in consumption Huge investments requirements compared to developed countries
Should provide investors with some protection from slowing developed economies
Internal Demand in emerging countries: an opportunity for investors…
3.1 CAAM Funds Emerging Internal demand: concept & attractiveness
Internal Demand: an economic concept…
Household consumption
Corporate investments
Government spending
DOMESTIC DEMAND = + +
CAAM Funds Emerging Internal Demand Focus on companies exposed to emerging domestic demand
Using tested investment philosophy and process

Page 22 CAAM Funds Emerging Internal Demand
3.2 CAAM Funds Emerging Internal Demand key features (1/2)
Fund objective:
Outperform the MSCI Emerging Markets by benefiting from the growth potential of emerging countries' growing domestic demand
Focus on companies that sell most of their goods and services to Emerging Countries
Favor sectors catering to Internal Demand
Consumer Discretionary, Consumer Staples, Finance, Industry, Telecom and Public Utilities
Sectors most likely to be underweight are those most linked to developed economies :
Technology, Healthcare, Energy, Materials

Page 23 CAAM Funds Emerging Internal Demand
CAAM Funds Emerging Internal Demand should be less volatile than other GEM funds
Source: CAAM
3.2 CAAM Funds Emerging Internal Demand key features (2/2)
Volatility 3 years (monthly performance)
10%
15%
20%
25%
30%
35%
40%
févr
.-9
7
ao
ût-
97
févr
.-9
8
ao
ût-
98
févr
.-9
9
ao
ût-
99
févr
.-0
0
ao
ût-
00
févr
.-0
1
ao
ût-
01
févr
.-0
2
ao
ût-
02
févr
.-0
3
ao
ût-
03
févr
.-0
4
ao
ût-
04
févr
.-0
5
ao
ût-
05
févr
.-0
6
ao
ût-
06
févr
.-0
7
ao
ût-
07
MSCI EMF Domestic sectors MSCI EMF External sectors
MSCI EMF MSCI Bric

Page 24 CAAM Funds Emerging Internal Demand
3.3 Tested investment philosophy
Our convictions
Fundamental analysis and judgemental decisions
Anticipating changes
Arbitraging prospects vs. valuations vs. risks
3 sources of alpha generation: country selection, sector allocation & stock picking
Exposure to small/mid cap stocks
Risk diversification
Medium term investments
Average 18 months holding
Page 25 CAAM Funds Emerging Internal Demand
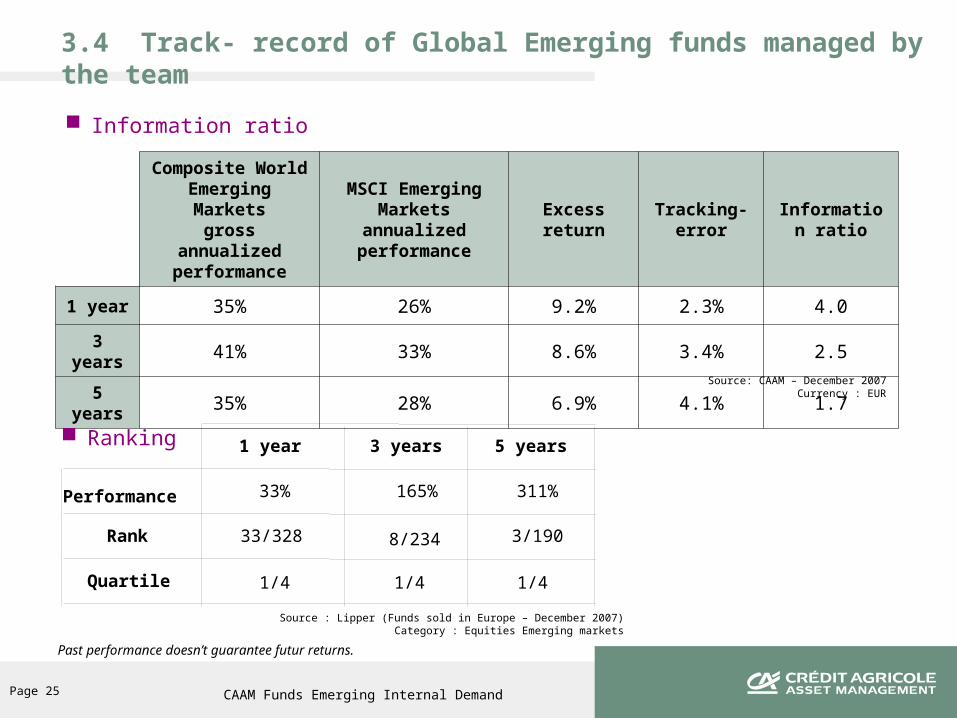
Information ratio
Composite World Emerging Marketsgross annualized
performance
MSCI Emerging Markets annualized
performance
Excess return
Tracking-error
Information ratio
1 year 35% 26% 9.2% 2.3% 4.0
3 years 41% 33% 8.6% 3.4% 2.5
5 years 35% 28% 6.9% 4.1% 1.7
Source: CAAM – December 2007Currency : EUR
3.4 Track- record of Global Emerging funds managed by the team
Source : Lipper (Funds sold in Europe – December 2007)Category : Equities Emerging markets
1 year 3 years 5 years
Performance 33% 165% 311%
Rank 33/328 8/234 3/190
Quartile 1/4 1/4 1/4
Ranking
Past performance doesn’t guarantee futur returns.

Page 26 CAAM Funds Emerging Internal Demand
3.5 Strengths of CAAM expertise
A team of 7 investment professionnals dedicated to emerging equity management with complementary skills
Latin America managers: Patrice Lemonnier (CFA) and Lionel Bernard Emerging Asia: Philippe Guigny and Mickaël Tricot (CFA) Emerging Europe, Middle East and Africa: Nina de Martinis (CFA) Analysts: Hélène Ecalle and Qian Jang
Recognised for its expertise and good track-record* Lipper Funds Awards (2008)
Award Trophy for CAAM Funds Latin America Equities C Cap (USD)-Equity Emerging Markets Latin America, over 3, 5 and 10 years in Switzerland / Best fund in Spain over 3 years for « Equity Emerging Markets Latin America » : CAAM Funds Latin America Equities C Cap (USD).
Lipper Funds Awards (2007)Best fund over 10 years in the category « Equity Emerging Latin America » in Italy, Spain, France, Austria, North Countries, Germany and Switzerland for CAAM Latin America Equities C Cap
La Tribune-Standard&Poor’s (march 2007)1st place over 1 year and the 2nd place over 3 and 5 years in the category « emerging countries equities » for a french domiciled fund.
Mieux VivreVotre Argent (march 2007)Excellence Label for a french domiciled fund and Regularity Label for a french domiciled Global Emerging Equity fund.
With a large product range Global emerging equity funds Latin America equity fund Europe emerging equity fund
More than €2 billion under management (as at 31/12/2007)
* Past performance doesn’t guarantee future returns.

Page 27 CAAM Funds Emerging Internal Demand
CAAM Funds Emerging Internal Demand – Fund information
Classic (C) Institutional (I) Classic S* (S)
Management company Crédit Agricole Asset Management Luxembourg S.A.
Investment manager Crédit Agricole Asset Management
Custodian CACEIS Bank Luxembourg
Reference currency USD
Minimum recommended period 5 years
Countries registered for sales as at 14/04/2008
Austria, Belgium, Finland, France, Germany, Hong Kong, Irland, Italy, Luxembourg, The Netherlands, Norway, Portugal, Spain, Sweden, Switzerland, United Kingdom
Isin Code Accumulation :
LU0319685854
Distribution :
LU0319686076
Accumulation :
LU0319685342
Distribution :
LU00319685425
LU0319686159
Minimum initial subscription None USD 500 000** None
Share categories Accumulation / Distribution Accumulation
Frequency of NAV calculation Daily
Cut off for dealing times Luxembourg dealing days before 2pm***
Maximum initial charge 4.50% 2.50% 3.00%
Maximum annual management fee 1.60% 1.00% 2.00%
Annual administration fee 0.50% 0.40% 0.50%
Performance fee None
Maximum conversion fee 1.00%
Maximum redemption fee None
Not all share classes and, as the case may be, share categories are registered for sales in all countries
* Only for distributors authorised by Board of Directors.** Or equivalent in another currency.*** Or, as the case may be, an earlier cut off time applicable by the relevant distributor.

Page 28 CAAM Funds Emerging Internal Demand
Disclaimer
This document which is not contractual and not part of documents usually certified by statutory auditors, is provided solely for information purposes by Crédit Agricole Asset Management, based on sources that we consider to be reliable. Crédit Agricole Asset Management can in no way be held responsible for any decision made on the basis of information contained in this document.
The information contained in this document doesn’t constitute a recommendation, a request for proposal or an invitation to purchase, sell or switch shares in the funds (Organismes de Placement Collectif en Valeurs Mobilières or OPCVM, UCITS) described herein, and should in no case be interpreted as such. The information contained in this document may be modified without prior notice. Additional information is available upon request. The information contained in this document is disclosed to you on a confidential basis and you agree it shall not be copied, reproduced, or distributed to a third party without our prior written approval. The information contained in this document is not intended for all categories of customers.
Your attention is drawn to the fact that units or shares in these UCITS may not be purchased if the regulations of your country of origin or any other applicable regulation forbid such purchase. As a consequence, it is your responsibility, prior to subscribing to any shares, to ensure that such purchase is permitted by applicable laws and regulations, as well as to inform yourself as to the fiscal consequences of such investment. It is also your responsibility to read the legal documents in force for each UCITS, in particular the prospectus as approved by the AMF (French Regulatory Authority) and the CSSF (Luxembourg Regulatory Authority) which are available upon request.
Past performance does not prejudge future results, nor is it a guarantee of future returns. The value of units or shares in UCITS may fluctuate according to market conditions and as a result the value of initial investments may rise as well as fall.
Document issued by Crédit Agricole Asset Management , a limited company ( “ French société anonyme”) with a registered capital of € 546 162 915, head office : 90 Boulevard Pasteur, 75 015 PARIS, 437 574 452 RCS Paris.Crédit Agricole Asset Management is a portfolio management company approved by the AMF (Autorité des Marchés Financiers), the French Securities Regulator under n° GP 04000036www.caam.com
This document contains information about CAAM Funds Emerging Internal Demand (the “Sub-Funds”), a sub-fund of CAAM Funds (the “Sicav”), an undertaking for collective investment in transferable securities existing under Part I of the Luxembourg law of 20 December 2002, organised as a société d’investissement à capital variable and registered with the Luxembourg Trade and Companies Register under number B68.806. The Sicav has its registered office at 5, Allée Scheffer, l-2520 Luxembourg.The Sub-Fund has been authorised for public sale by the Commision de Surveillance du Secteur Financier in Luxembourg. The Sicav comprises other sub-funds which are described in the Sicav’s full and simplified prospectus. Not all sub-funds will be necessarily be registered or authorised for sales in all jurisdictions or be available to all investors. Subscriptions in the Sub-Funds will only be accepted on the basis of the Sicav’s latest complete and simplified prospectuses and its latest annual and semi-annual reports that may be obtained, at the registered office of the Sicav or at its local representative. The name of the local representative may be obtained at the Sicav's registered office.Consideration should be given to whether the risks attached to an investment in the Sub-Funds are suitable for prospective investors who should ensure that they fully understand the contents of this document. In case of doubt, it is advised to consult a professional advisor to determine whether an investment in the Sub-Funds is suitable.The value of, and any income from, an investment in the Sub-Funds can decrease as well as increase. The Sub-Funds have no guaranteed performance. Further, past performance is not a guarantee or a reliable indicator for future returns.This document does not constitute an offer to buy nor a solicitation to sell in any country where it might be considered as unlawful, nor does it constitute public advertising or investment advice.This document is solely for the attention of institutional, professional or sophisticated investors and is not to be distributed to the general public.