cache-based application detection in the cloud … · cache-based application detection in the...
TRANSCRIPT
Cache-Based Application Detection in the CloudUsing Machine Learning
Berk Gulmezoglu, Thomas Eisenbarth, and Berk Sunar
Worcester Polytechnic Institute, Worcester, MA, USAbgulmezoglu,teisenbarth,[email protected]
Abstract. Cross-VM attacks have emerged as a major threat on com-mercial clouds. These attacks commonly exploit hardware level leakageson shared physical servers. A co-located machine can readily feel the pres-ence of a co-located instance with a heavy computational load throughperformance degradation due to contention on shared resources. Sharedcache architectures such as the last level cache (LLC) have become apopular leakage source to mount cross-VM attack. By exploiting LLCleakages, researchers have already shown that it is possible to recoverfine grain information such as cryptographic keys from popular softwarelibraries. This makes it essential to verify implementations that handlesensitive data across the many versions and numerous target platforms,a task too complicated, error prone and costly to be handled by humanbeings.Here we propose a machine learning based technique to classify applica-tions according to their cache access profiles. We show that with minimaland simple manual processing steps feature vectors can be used to trainmodels using support vector machines to classify the applications witha high degree of success. The profiling and training steps are completelyautomated and do not require any inspection or study of the code to beclassified. In native execution, we achieve a successful classification rateas high as 98% (L1 cache) and 78% (LLC) over 40 benchmark applica-tions in the Phoronix suite with mild training. In the cross-VM settingon the noisy Amazon EC2 the success rate drops to 60% for a suite of 25applications. With this initial study we demonstrate that it is possibleto train meaningful models to successfully predict applications runningin co-located instances.
Keywords: Cross-VM Attacks, Machine Learning, SVM, Prime&Probe.
1 Motivation
In the last decade the cloud infrastructure has matured to the point wherecompanies, government agencies, hospitals and schools alike have outsourcedtheir infrastructure to cloud service providers. The main benefit of moving tothe cloud is the reduction of money spent on IT by pooling servers and storages inbigger cloud services. In many cases, rented servers are instances shared through
2
virtualization among many users. Sharing is the basis for the reduction in theIT costs. Despite the clear cost benefit, given the vast amount of personal andsensitive information kept on shared resources, rightfully security concerns havebeen steadily growing among cloud customers.
Naturally, the cloud infrastructure has come under the scrutiny of securityresearchers. The first breakthrough result was reported by Ristenpart et al. [30]who showed that it is possible to co-locate in a controlled manner with possi-ble target instances on commercial public clouds, e.g. Amazon EC2. This workopened the door to a series of investigations that examined the threats from anattacker, i.e. a legitimate cloud user, exploiting cross VM leakage to steal sensi-tive information. A number of methods have been proposed to steal private keysor valuable information between VMs in IaaS and PaaS clouds [21,18,15,37,38].In these works, the cryptographic keys and other sensitive information are stolenby attacker by exploiting leakages at the microarchitectural level, i.e. throughthe shared cache architecture. Especially, the shared last-level cache (LLC) is adangerous information leakage source in public clouds. IaaS instance allocationpolicy commonly allocate an instance per core. This means that the LLC is ashared resource among multiple user instances. Thus by timing his own LLC ac-cess times, a user can gleam information on another user’s co-located instance’scache access behavior. LLC attacks proliferated to the point that the most recentLLC Prime&Probe attacks do not depend on the de-duplication feature [19,24]to be enabled to mount cross core cache attacks in public commercial clouds.
Cross-VM leakage attacks are extremely destructive in nature. They requirealmost no privileges. Anyone can rent an instance on EC2 for a small fee andrun an attack code on an instance co-located typically with multiple targetinstances out of potentially millions of targets. The attack code does only le-gitimate accesses, e.g. collection of cache access times, for accesses in its ownmemory/application space. Thus, Cross-VM attacks pose a great threat. Po-tentially, one could automate the attack and mine the entire compute cloudfor cryptographic keys. There are practical difficulties in carrying out such at-tacks on a mass scale. Cross-VM security attacks on public clouds require asophisticated methodology to extract the sensitive information from data. Forinstance, the cache pattern is extracted and by using personal effort the relationbetween pattern and key is established [18]. This makes discovery of vulnerabili-ties, a manual process, rather costly and time-consuming. Cryptographic librarydesigners experience a similar difficulty. Cryptographic libraries are constantlypatched for newly discovered leakages and emerging vulnerabilities. This in itselfis a painstaking process requiring careful inspection of the code for any potentialleakage for a target platform1. Software bugs may result in secondary leakagesconfounding the problem further. Thus, in practice, even constant executionflow/time implementation may be compromised due to bugs.
With the growing complexity of cryptographic libraries, or more broadly ofcode that handles sensitive data, it becomes impossible to manually verify the
1 A code that is considered secure on one platform, may not be on another due tomicroarchitectural differences.
3
code for leakages across the numerous platforms exhaustively. Clearly, there isa great need for automated verification and testing of sensitive code againstleakages. Firstly, Brumley et al. [10] proposed vector quantization and HMM toclassify ECC ops with respect to L1-D cache. Then, an automated profiling at-tack on LLC was introduced by Gruss et al. [13]. In this work, the access patternof different events are first extracted in a non-virtualized (less noisy) environ-ment. The attacker learns the cache access templates from the cache. During anattack the new data is compared against the learned templates. While this isa worthy effort, machine learning (ML) algorithms have advanced to the pointwhere they offer sophisticated solutions to complicated recognition, classification,clustering, and regression problems. For instance, image and speech recognition,sense extraction in text and speech [28], recommendation systems and searchengines, as well as malicious behavior detection [11]. Further, cryptographers re-cently started to consider machine learning algorithms for side channel analysis,[23,16].
In this work we take another step in this direction. We are motivated by theneed for automation in cross-VM leakage analysis. Our goal is to minimize theneed for human involvement in formulating an attack. While more sophisticatedtechniques such as deep neural networks can solve more complicated problems,they require significantly more training data and take longer. Instead here wefocus on more traditional ML techniques for classification. In particular, we areinterested in automating classification of applications through their cache leak-age profiles in the Cross-VM setting. A successful classification technique wouldnot only compromise the privacy of a co-located user, but could also serve asthe initial discovery phase for a more advanced follow-up high precision attackto extract sensitive information. To this end, in this work we first profile thecache fingerprints of representative benchmark applications, we then identifythe minimal processing steps required to extract robust features. We train thesefeatures using support vector machines and report success rates across the stud-ied benchmarks for experiments repeated for L1 and LLC. Finally, we take theattack to AWS EC2 to solve a specific problem, i.e. we use the classificationtechnique to show that it is possible to detect other co-located VMs. We achievethis by sending ping requests to open ports by simultaneously monitoring LLCon Amazon EC2. If the ping receiver code is detected running on the co-locatedinstance we infer co-location with the targeted IP.
Our Contribution
We present a study in automation of cache attacks in modern processors usingmachine learning algorithms. In order to extract fine grain information fromcache access patterns, we apply frequency transformation on data to extractedfingerprints to obtain features. To classify a suite of representative applicationswe train a model using a support vector machine. This eliminates the need formanually identifying patterns and crafting processing steps in the formulation ofthe cache attack. In our experimental work, we classify the applications bundled
4
in the Phoronix Test Suite. Note that we do not have any information about thecontent of the code and nor have we studied any internal execution patterns.In summary, this work
– for the first time implements machine learning algorithm, i.e. SVM, to profilethe activity of other users on the cloud
– extracts the feature vectors from cache access data for different types ofapplications using a straightforward FFT computation,
– demonstrates that there is no need for synchronization between spy andtarget to profile an application while SVM based approach is implemented,
– shows that targeted co-location is achievable by sending ping requests onAmazon EC2 if the targeted IP is known by spy
The rest of the study is divided as follows. We first review the related workand give the background knowledge in Section 2. The approach is presented inSection 3. The experiment setup and results are explained in Section 4 and thepaper is concluded in Section 6
2 Background
In this section we give a brief overview of the related work in terms of cacheattacks and several implementations of machine learning techniques in differentside channel analysis.
2.1 Related Work
Co-location detection techniques: In 2009, Ristenpart et al. [30] demon-strated the possibility of the co-location between attacker and victim in publicIaaS clouds. After two years, Zhang et al. [36] detected the co-location by simplymonitoring the L2 cache if attacker and victim reside on the same core. In 2012,Bates et al. [6] showed that if the network traffic is analyzed it is possible todetect the co-location. In 2014, it is shown that deduplication enables the co-location detection in Paas clouds by Zhang et al. [38]. Recently, Varadarajan etal. [33] and Inci et al. [17] showed that the co-location detection is still possibleon Amazon EC2, Google Compute Engine and Microsoft Azure using memorybus locking.
Cache Attacks: Cache attacks are widely used to extract information fromcryptographic libraries. In 2003, Tsunoo et al. [32] presented a cache attackon DES using cryptanalysis. In 2004, AES cache attacks were firstly presentedby Bernstein [7] using microarchitectual timing differences for different look-up table positions in cache. In the same year, Osvik et al. [27] implementedtwo new cache attacks (Evict+Reload and Prime&Probe) on AES. Both attacksrecovered the AES encryption key with different number of encryption. Afterit is shown that it is possible to recover AES encryption key the communityfocused on analyzing the potential thread of cache attacks on both AES andRSA.
5
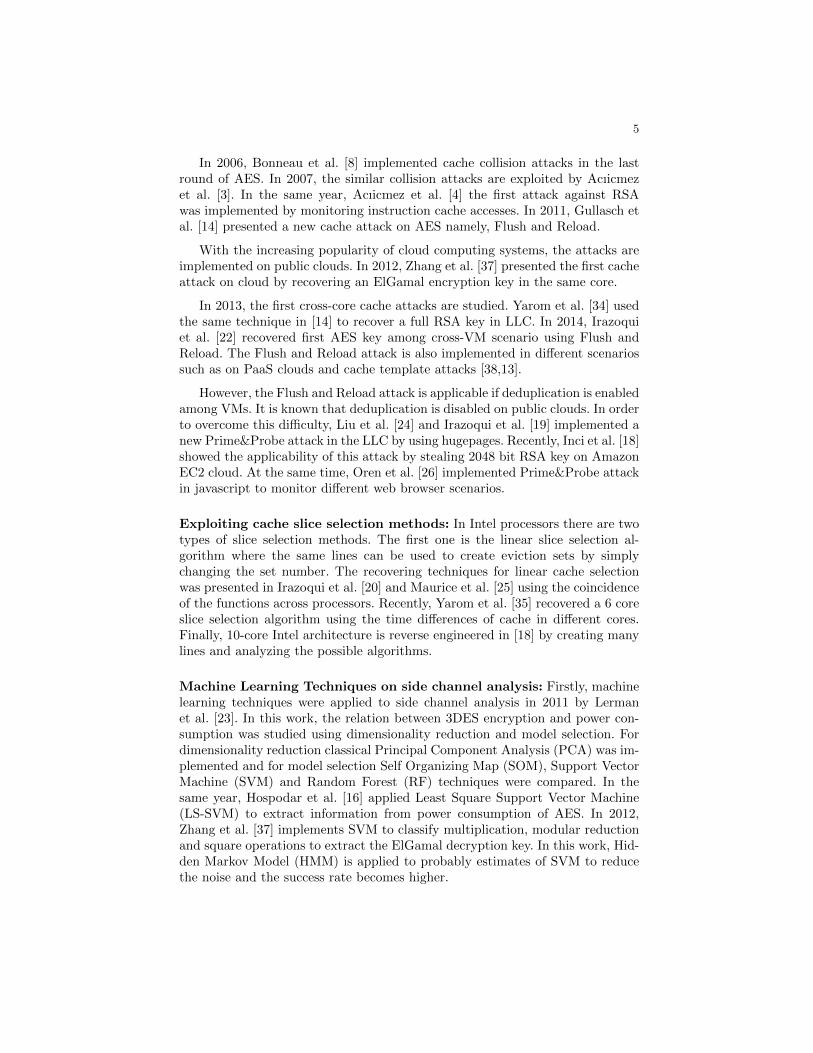
In 2006, Bonneau et al. [8] implemented cache collision attacks in the lastround of AES. In 2007, the similar collision attacks are exploited by Acıicmezet al. [3]. In the same year, Acıicmez et al. [4] the first attack against RSAwas implemented by monitoring instruction cache accesses. In 2011, Gullasch etal. [14] presented a new cache attack on AES namely, Flush and Reload.
With the increasing popularity of cloud computing systems, the attacks areimplemented on public clouds. In 2012, Zhang et al. [37] presented the first cacheattack on cloud by recovering an ElGamal encryption key in the same core.
In 2013, the first cross-core cache attacks are studied. Yarom et al. [34] usedthe same technique in [14] to recover a full RSA key in LLC. In 2014, Irazoquiet al. [22] recovered first AES key among cross-VM scenario using Flush andReload. The Flush and Reload attack is also implemented in different scenariossuch as on PaaS clouds and cache template attacks [38,13].
However, the Flush and Reload attack is applicable if deduplication is enabledamong VMs. It is known that deduplication is disabled on public clouds. In orderto overcome this difficulty, Liu et al. [24] and Irazoqui et al. [19] implemented anew Prime&Probe attack in the LLC by using hugepages. Recently, Inci et al. [18]showed the applicability of this attack by stealing 2048 bit RSA key on AmazonEC2 cloud. At the same time, Oren et al. [26] implemented Prime&Probe attackin javascript to monitor different web browser scenarios.
Exploiting cache slice selection methods: In Intel processors there are twotypes of slice selection methods. The first one is the linear slice selection al-gorithm where the same lines can be used to create eviction sets by simplychanging the set number. The recovering techniques for linear cache selectionwas presented in Irazoqui et al. [20] and Maurice et al. [25] using the coincidenceof the functions across processors. Recently, Yarom et al. [35] recovered a 6 coreslice selection algorithm using the time differences of cache in different cores.Finally, 10-core Intel architecture is reverse engineered in [18] by creating manylines and analyzing the possible algorithms.
Machine Learning Techniques on side channel analysis: Firstly, machinelearning techniques were applied to side channel analysis in 2011 by Lermanet al. [23]. In this work, the relation between 3DES encryption and power con-sumption was studied using dimensionality reduction and model selection. Fordimensionality reduction classical Principal Component Analysis (PCA) was im-plemented and for model selection Self Organizing Map (SOM), Support VectorMachine (SVM) and Random Forest (RF) techniques were compared. In thesame year, Hospodar et al. [16] applied Least Square Support Vector Machine(LS-SVM) to extract information from power consumption of AES. In 2012,Zhang et al. [37] implements SVM to classify multiplication, modular reductionand square operations to extract the ElGamal decryption key. In this work, Hid-den Markov Model (HMM) is applied to probably estimates of SVM to reducethe noise and the success rate becomes higher.
6
2.2 Prime&Probe Technique
In the modern computer architecture, it is not possible for users to see thephysical address of a line because of the security issues. Therefore, the virtualaddress is translated from the physical address and it is visible to users. Invirtual address the first 12 bits are exactly same with the first 12 bits of physicaladdress. However, this is not enough to find the corresponding cache set for theline in LLC. Thus, it is not possible to create an eviction set with regular 4KBpages in LLC.
The Prime&Probe technique is the most widely applicable profiling techniqueon the cloud since all major Cloud Service Providers (CSPs) have disabled dedu-plication, making Flush and Reload attacks infeasible. To achieve an eviction setin LLC the spy needs to know more than 12 bits of the physical line. If Hugepages (2MB) are allocated by the spy, it is possible to know the first 21 bitsof the line which is enough to know the corresponding set in LLC. After find-ing the eviction set for the desired set, the eviction can be implemented. ThePrime&Probe profiling is divided into three main stages:
1. Prime stage: This stage is used to create an eviction set. To create aneviction set the spy generates distinct lines which reside on the monitoredset. The number of lines in the eviction set is equal to number of ways in themonitored set. After all lines accessed by the spy the eviction set is ready.
2. Waiting stage: In this stage, the spy waits for the target to evict some linesfrom the primed set. The waiting time is crucial to determine the resolutionof the profiling. While the time is increasing the frequency and resolutionare getting lower.
3. Probe stage: In the probe stage, the spy accesses the addresses used in theprime stage. If the monitored set was not accessed by another process, nodata has been evicted; all accesses result in a cache hit, giving a low accesstime. If another process has accessed the monitored set, its data must haveevicted at least one of the lines of the spy’s data. Hence, the probe accesswill include accesses to memory, resulting in measurably higher access times.
In native and cloud environment experiments we used non-linear slice selec-tion algorithm since EC2 Cloud uses 10 core non-linear slice selection algorithm.In non-linear slice selection algorithm for each set the eviction set should becreated by implementing the algorithm. This makes the process harder becauseto find the eviction set for all sets in LLC by hand takes huge amount of time.Therefore, the algorithm in [15] is implemented in 10 core machine to createLLC eviction sets faster. The ratio of noisy sets should remain the same forlinear and non-linear slice selection algorithms. Hence, we believe the proposedwork is applicable to all Intel Ivy bridge processors.
2.3 Support Vector Machine (SVM)
SVM is a data classification technique used in many areas such as speech recog-nition, image recognition and so on [28,5]. The aim of SVM is to produce a modelbased on the training data and give classification results for testing data.

7
Firstly, SVM is built for binary classification. For a training set of instance-label pairs (xi, yi), i = 1, . . . , k where xi ∈ Rn and y ∈ {1,−1}k, SVM requirethe solution of the following optimization problem:
minw,b,ξ
1
2wTw + C
k∑i=1
ξi
subject to yi(wTφ(xi) + b) ≥ 1− ξi
where ξi ≥ 0
(1)
The function ξ maps the training vectors into a higher dimensional space. Inthis higher dimensional space a linear separating hyperplane is found by SVMwhere C > 0 is the penalty parameter of the error term. For the kernel functionin our paper we use linear kernel:
K(xi, xj) = xTi xj (2)
In our work, we have many application to classify. Therefore, multi-classSVM library LIBSVM [12] is used.
In addition, we apply the cross-validation (CV) technique. In K-fold CV,the training data D is partitioned into N subsets D, . . . , DN . Each data inD is randomly separated to each subset with equal size. So, we define Dti =⋃j=1,...,N(j 6=i) where Dti is the union of all data except those in Di. For each
subset a model is built by applying the algorithm to the trainingDti . The averageof N results are evaluated as cross-validation (test) performance.
3 Methodology
In this section, we show how machine learning can be used on cache profilesto detect running programs. One specific use case is the detection of the pingservice, which can serve as an implicit co-location test.
3.1 Extracting Feature Vectors from Applications on Cache
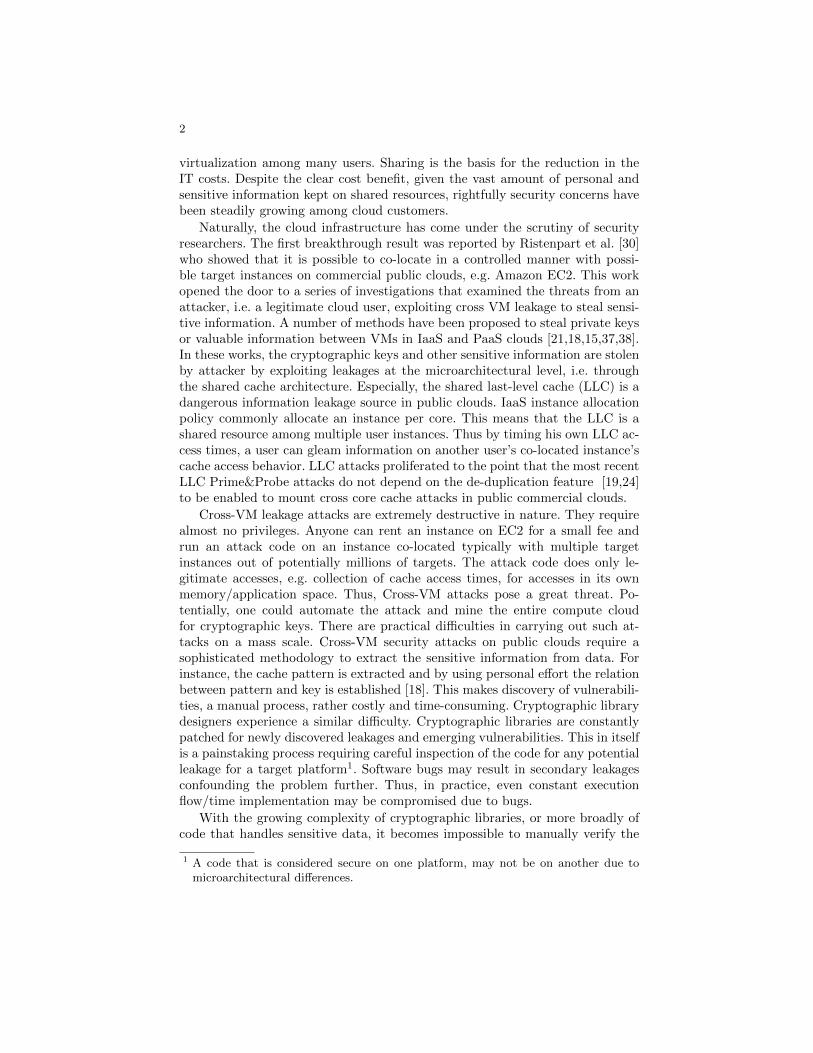
Our thesis is to show that programs have unique fingerprints in cache and itis possible to learn and classify application fingerprints using ML algorithmswith a high accuracy. The proposed approach starts by creating profiles forevery software using the Prime&Probe technique. This way, dynamic and staticfunctions of the application are detected, resulting in fairly reliable fingerprints.The raw cache timing traces are first turned into hits and misses, followed by aFourier transform. Performing a Fourier transform on the cache profiles removesthe need for tight synchronization and makes the approach more resilient tonoise. The FFT output can then directly be fed into a machine learning methodof choice. The process to obtain application fingerprints is visualized in Figure 1.Our approach differs from previous works in cache-based information extractionin several ways:

8
Fig. 1. The flow chart of the approach for both L1 and LLC profiling
Fourier Transform Most previous works [13,18,22], assume the monitoringprocess to be synchronized. The synchronization is handled by triggeringthe event, then the profiling phase is started. However, it is not trivial whenthe monitoring process and the target do not have communication. In ad-dition, the functions periodically accessed in the application would give acertain information which could be exploited by using Fourier transform.Therefore, we transform the data to frequency domain from time domain inorder to eliminate a strong assumption like synchronization and to extractthe periodic functions’ cache accesses as fingerprints of the applications.
No Deduplication Deduplication enables incredibly powerful side channel at-tacks [13,9,29], most prominently the Flush and Reload technique [34,13].However, public cloud service providers are aware of this issue and have dis-abled deduplication. Therefore, it is impossible to track data of other VMsin shared memory in IaaS and most PaaS clouds. Hence, the Prime&Probetechnique is preferred to implement in our scenario instead of the Flushand Reload method to eliminate the strong assumption for deduplication.Prime&Probe technique is simply based on fill all ways in the monitoredLLC set by enabling Huge pages which is possible in all public clouds.
The resolution of the resulting analysis is lower than Flush and Reloadmethod in LLC, however the results show that after training enough data itis efficient to detect programs used by other co-located VMs.
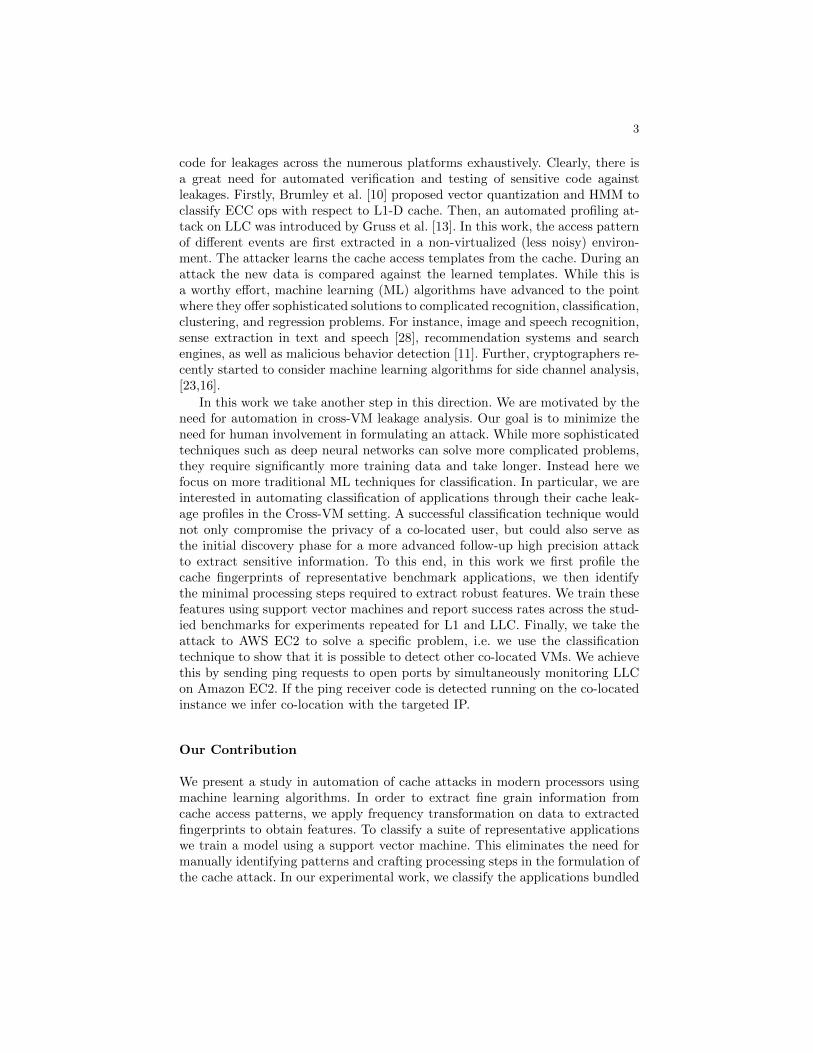
Detecting Dynamic Code Our method does not make any assumption onwhether code is dynamic, static or a shared function. Instead, we profile oneof the columns in the cache, as shown in Figure 2. This means the locationof a line in LLC might change from one run to another run if the functionis dynamic. However, the offset bits (o) never change therefore, it resides onone of the set-slice pairs solving s mod 64 = o.
Long profiles Our method shows that even if the entire process of a programis not profiled, the spectral density of a small part of the program can giveenough information to detect the program (in fact, the length of the analyzedprograms varies from two seconds to 3.5 hours).

9
Fig. 2. Visualization of 10 core LLC. Gray set-slice pairs are noisy, white set-slice pairsare unused sets and black set-slice pairs are actively used by target application.
Our approach starts by creating cache profiles for every application by usingthe Prime&Probe technique in the same core to monitor all L1 cache sets. Theanalysis of L1 cache leakage provides a very high-resolution channel, therebydescribing a best-case scenario for the learning technique. In addition, the L1cache experiments provide valuable information which cache sets are activelyused by the application. This information can be used as a preparatory step forLLC profiling to find the corresponding active sets in LLC. After the data iscollected for a set of application, the Fourier transform is applied to extract thefeature vectors subsequently used in an ML algorithm.
3.2 Extracting feature vectors from L1 cache
We assume that the number of L1-instruction and L1-data cache sets are SL1for either cache. In L1 cache, the data and instruction cache are monitoredseparately, while profiling process and target application are running in the samecore. The overall process to monitor L1 sets and creating feature vectors fordifferent applications is given in Algorithm 1.
For L1-data and L1-instruction monitoring, a total of NT traces is collectedper set for each data set. Therefore, for each data set we have SL1 · NT tracesin total. After collecting several data sets, the total number of traces is equal toSL1 ·NT ·ND where ND is the total number of data sets per application collectedby the spy.

10
The outliers in the data should be filtered before the raw data (R) is convertedto binary data (B). Hence, the L1-data and L1-instruction sets are monitoredin idle case and base Probe values are recorded. The outlier threshold (τo) andbinary conversion threshold (τc) are obtained based on the idle values.
Table 1. Symbol Descriptions
Symbols Description
SL1 Number of sets in L1 cacheNT Number of traces collectedND Number of data sets per testNS Number of applicationsNC Number of coresNA Number of active setsτo Outlier threshold for samplesτc Hit&Miss thresholdFs Sampling FrequencyFCPU CPU frequencyTcc Prime&Probe timeLf Length of fingerprint
The Probe timings are compared to τo and τc. The values are higher thanτo are set to median value of idle case of that set to get rid of the outliers. Theconversion from R to B is also implemented by comparing with τc. If the Probetime is higher than τc, then the trace is converted to 1, implying an access to thecache set. If it is below than τc, the trace is converted to 0, implying no cacheaccess. The resulting binary trace is converted by using Fourier transform.
In the transformation phase, the sampling frequency should be computed. Inorder to calculate the sampling frequency (Fs), the total Prime&Probe time formonitored set is computed in clock cycle (Tcc), then the CPU frequency (Fcpu)is divided by Tcc to get Fs for L1-data and L1-instruction cache. We assume thatthe sampling frequency is same for all sets in L1-data and L1-instruction cache.To calculate the frequency components of binary data, Fs is used in FFT andthe length of the outcome is NT . However, the result has two symmetric sidesof which only the first half is used as a fingerprint. Therefore, the length of afingerprint obtained from one data set is NT /2.
For each process there are SL1 different fingerprints hence, these fingerprintsare concatenated from set 0 to set SL1 − 1 sequentially. Thus, the total lengthof the fingerprint of a process is Lf = SL1 · NT /2. If the total number of datasets is ND then, the size of a training matrix of a process is ND · Lf .
The SVM then processes all matrices combined and labeled from 1 to NSwhere NS is the number of different applications. The final success rate is com-puted using 10-fold cross-validation.
11
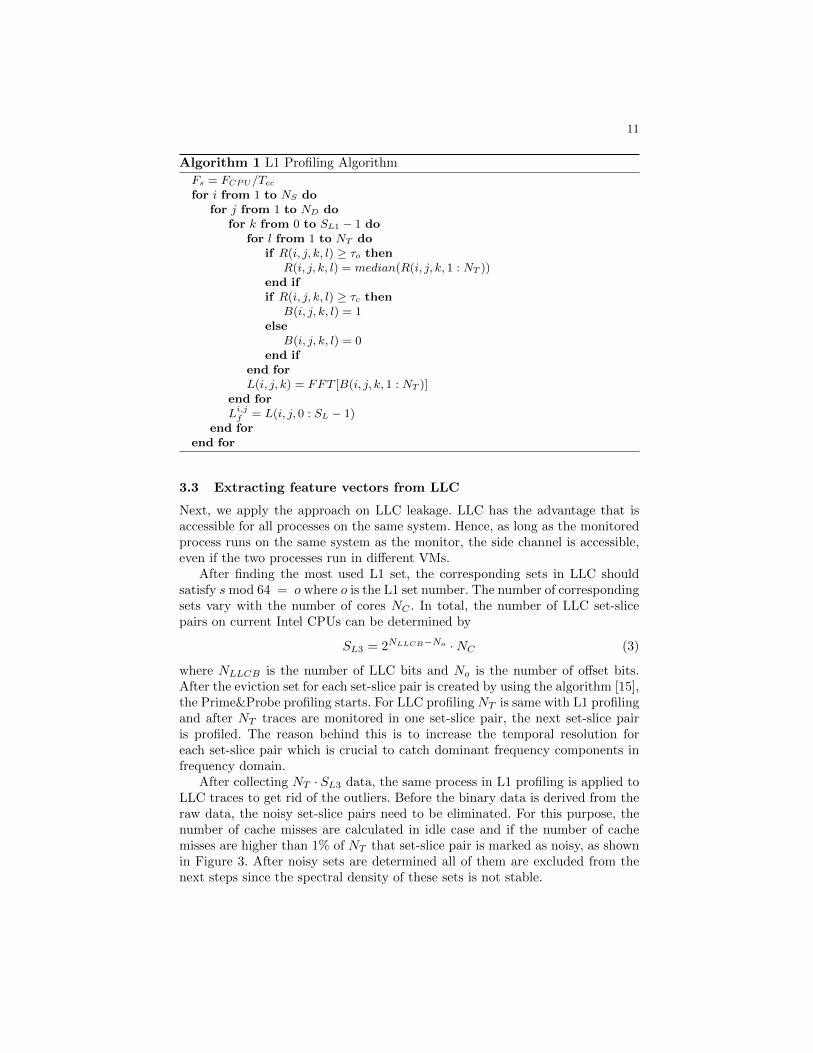
Algorithm 1 L1 Profiling Algorithm
Fs = FCPU/Tcc
for i from 1 to NS dofor j from 1 to ND do
for k from 0 to SL1 − 1 dofor l from 1 to NT do
if R(i, j, k, l) ≥ τo thenR(i, j, k, l) = median(R(i, j, k, 1 : NT ))
end ifif R(i, j, k, l) ≥ τc then
B(i, j, k, l) = 1else
B(i, j, k, l) = 0end if
end forL(i, j, k) = FFT [B(i, j, k, 1 : NT )]
end forLi,j
f = L(i, j, 0 : SL − 1)end for
end for
3.3 Extracting feature vectors from LLC
Next, we apply the approach on LLC leakage. LLC has the advantage that isaccessible for all processes on the same system. Hence, as long as the monitoredprocess runs on the same system as the monitor, the side channel is accessible,even if the two processes run in different VMs.
After finding the most used L1 set, the corresponding sets in LLC shouldsatisfy s mod 64 = o where o is the L1 set number. The number of correspondingsets vary with the number of cores NC . In total, the number of LLC set-slicepairs on current Intel CPUs can be determined by
SL3 = 2NLLCB−No ·NC (3)
where NLLCB is the number of LLC bits and No is the number of offset bits.After the eviction set for each set-slice pair is created by using the algorithm [15],the Prime&Probe profiling starts. For LLC profiling NT is same with L1 profilingand after NT traces are monitored in one set-slice pair, the next set-slice pairis profiled. The reason behind this is to increase the temporal resolution foreach set-slice pair which is crucial to catch dominant frequency components infrequency domain.
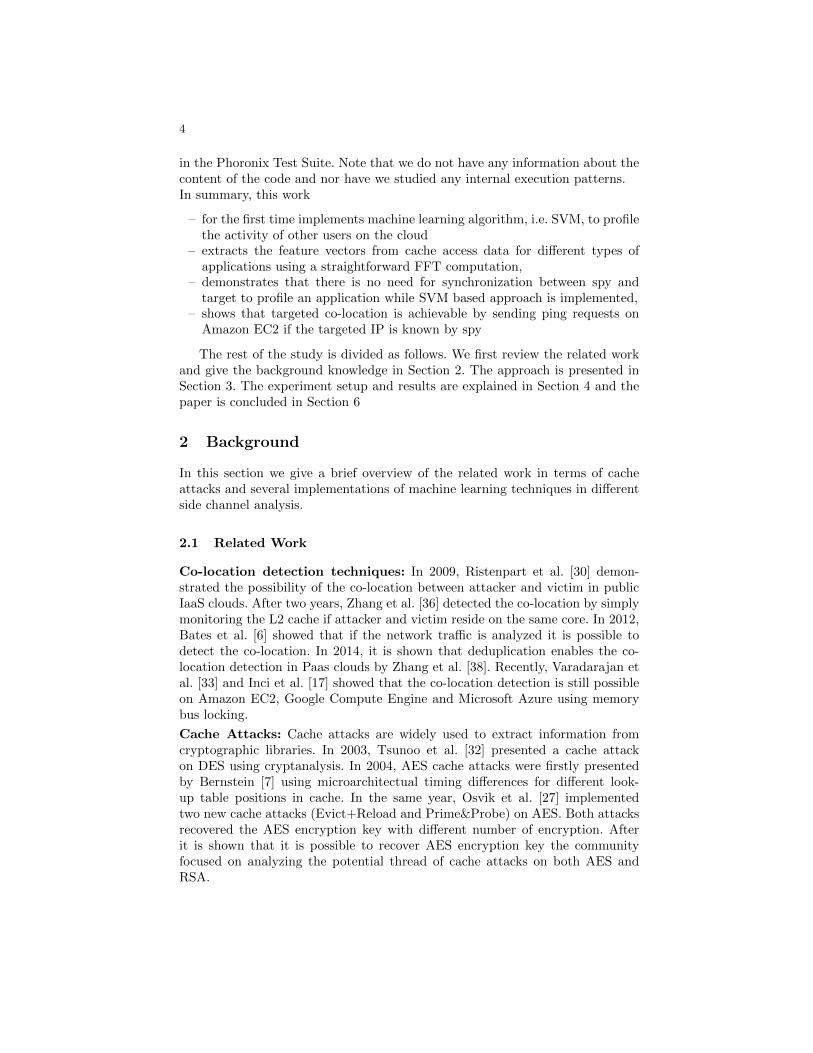
After collecting NT · SL3 data, the same process in L1 profiling is applied toLLC traces to get rid of the outliers. Before the binary data is derived from theraw data, the noisy set-slice pairs need to be eliminated. For this purpose, thenumber of cache misses are calculated in idle case and if the number of cachemisses are higher than 1% of NT that set-slice pair is marked as noisy, as shownin Figure 3. After noisy sets are determined all of them are excluded from thenext steps since the spectral density of these sets is not stable.

12
Set Number0 50 100 150 200 250 300 350
Num
ber
of c
ache
mis
ses
0
500
1000
1500
2000
2500
Fig. 3. Eliminated noisy sets in LLC
Sample Number0 1000 2000 3000 4000 5000 6000 7000 8000 9000 10000
Tim
ing(
cloc
k cy
cle)
80
100
120
140
160
180
200
220
240
Fig. 4. One of the active sets for an application
The active set-slice pairs are determined by checking the number of cachemisses in the data. If the number of cache misses is higher than 3% of NT inFigure 4, then the set-slice pair is marked as an active set. After all active setsare derived, they can be converted to binary data with the same process in L1profiling in Figure 5 before the Fourier transform starts.
For the Fourier transform Fs should be calculated for LLC sets. Fs is lowerin LLC profiling since the number of ways in the sets are higher than L1 setsand the access time to lines reside on LLC is greater than L1 lines. Therefore,the total Prime&Probe time for each set-slice pair should be calculated and theaverage of all of them are used as LLC Fs. After Fs is calculated, the active
13
Sample number0 1000 2000 3000 4000 5000 6000 7000 8000 9000 10000
Hit(
0) v
s M
iss(
1)
0
0.5
1
1.5
2
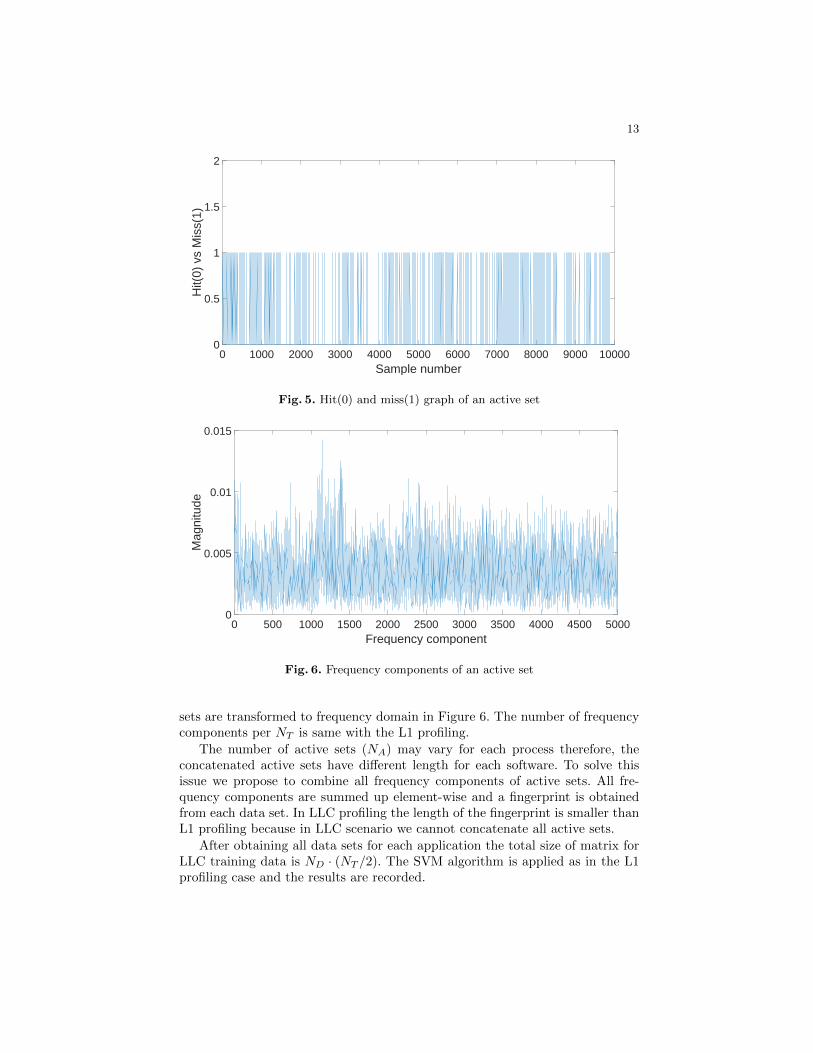
Fig. 5. Hit(0) and miss(1) graph of an active set
Frequency component0 500 1000 1500 2000 2500 3000 3500 4000 4500 5000
Mag
nitu
de
0
0.005
0.01
0.015
Fig. 6. Frequency components of an active set
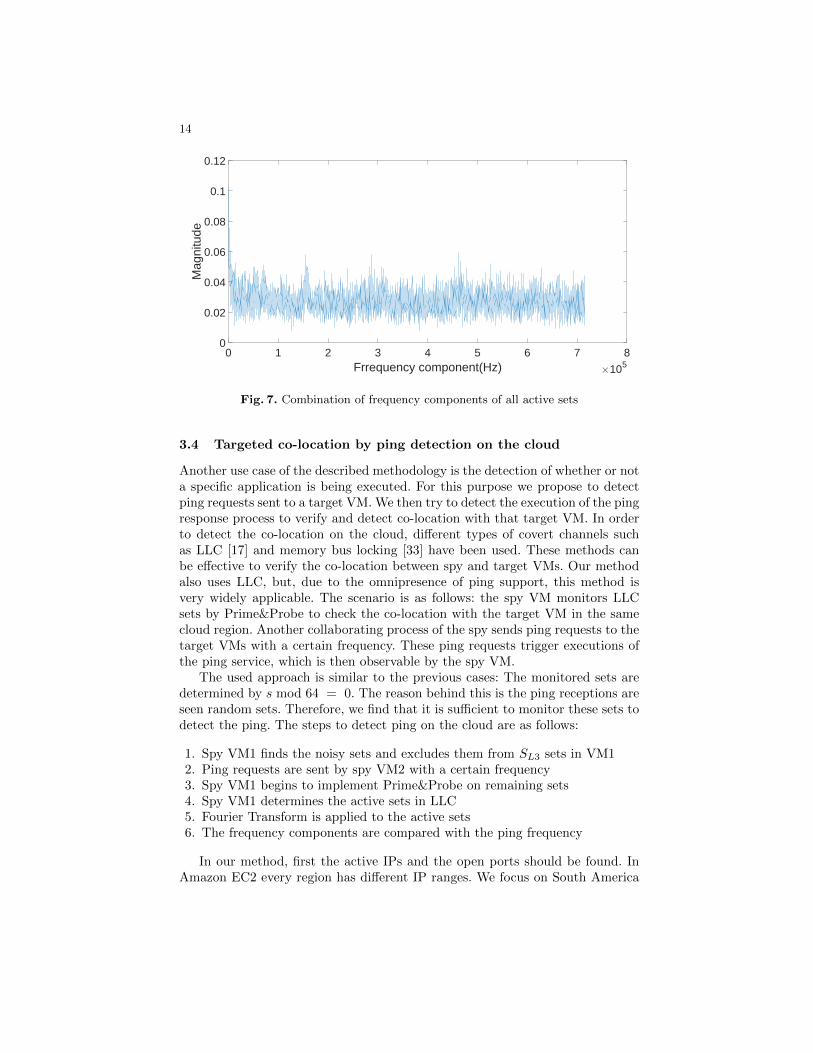
sets are transformed to frequency domain in Figure 6. The number of frequencycomponents per NT is same with the L1 profiling.
The number of active sets (NA) may vary for each process therefore, theconcatenated active sets have different length for each software. To solve thisissue we propose to combine all frequency components of active sets. All fre-quency components are summed up element-wise and a fingerprint is obtainedfrom each data set. In LLC profiling the length of the fingerprint is smaller thanL1 profiling because in LLC scenario we cannot concatenate all active sets.
After obtaining all data sets for each application the total size of matrix forLLC training data is ND · (NT /2). The SVM algorithm is applied as in the L1profiling case and the results are recorded.
14
Frrequency component(Hz) ×1050 1 2 3 4 5 6 7 8
Mag
nitu
de
0
0.02
0.04
0.06
0.08
0.1
0.12
Fig. 7. Combination of frequency components of all active sets
3.4 Targeted co-location by ping detection on the cloud
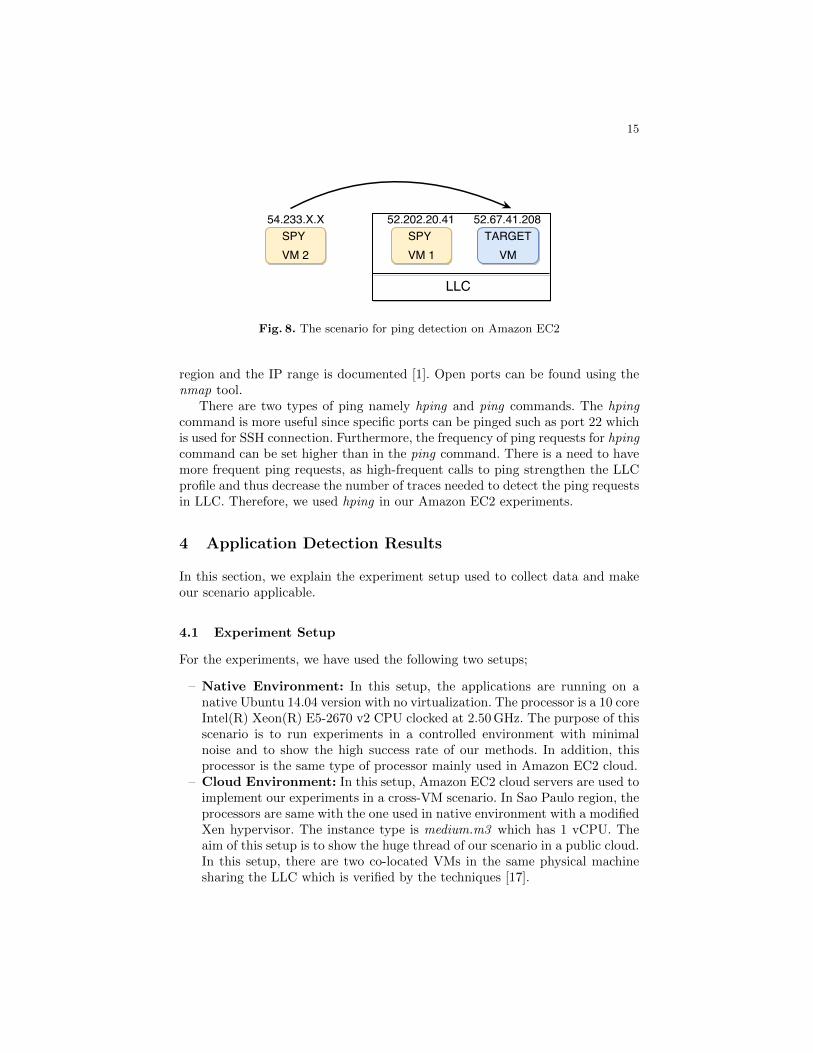
Another use case of the described methodology is the detection of whether or nota specific application is being executed. For this purpose we propose to detectping requests sent to a target VM. We then try to detect the execution of the pingresponse process to verify and detect co-location with that target VM. In orderto detect the co-location on the cloud, different types of covert channels suchas LLC [17] and memory bus locking [33] have been used. These methods canbe effective to verify the co-location between spy and target VMs. Our methodalso uses LLC, but, due to the omnipresence of ping support, this method isvery widely applicable. The scenario is as follows: the spy VM monitors LLCsets by Prime&Probe to check the co-location with the target VM in the samecloud region. Another collaborating process of the spy sends ping requests to thetarget VMs with a certain frequency. These ping requests trigger executions ofthe ping service, which is then observable by the spy VM.
The used approach is similar to the previous cases: The monitored sets aredetermined by s mod 64 = 0. The reason behind this is the ping receptions areseen random sets. Therefore, we find that it is sufficient to monitor these sets todetect the ping. The steps to detect ping on the cloud are as follows:
1. Spy VM1 finds the noisy sets and excludes them from SL3 sets in VM12. Ping requests are sent by spy VM2 with a certain frequency3. Spy VM1 begins to implement Prime&Probe on remaining sets4. Spy VM1 determines the active sets in LLC5. Fourier Transform is applied to the active sets6. The frequency components are compared with the ping frequency
In our method, first the active IPs and the open ports should be found. InAmazon EC2 every region has different IP ranges. We focus on South America
15
Fig. 8. The scenario for ping detection on Amazon EC2
region and the IP range is documented [1]. Open ports can be found using thenmap tool.
There are two types of ping namely hping and ping commands. The hpingcommand is more useful since specific ports can be pinged such as port 22 whichis used for SSH connection. Furthermore, the frequency of ping requests for hpingcommand can be set higher than in the ping command. There is a need to havemore frequent ping requests, as high-frequent calls to ping strengthen the LLCprofile and thus decrease the number of traces needed to detect the ping requestsin LLC. Therefore, we used hping in our Amazon EC2 experiments.
4 Application Detection Results
In this section, we explain the experiment setup used to collect data and makeour scenario applicable.
4.1 Experiment Setup
For the experiments, we have used the following two setups;
– Native Environment: In this setup, the applications are running on anative Ubuntu 14.04 version with no virtualization. The processor is a 10 coreIntel(R) Xeon(R) E5-2670 v2 CPU clocked at 2.50 GHz. The purpose of thisscenario is to run experiments in a controlled environment with minimalnoise and to show the high success rate of our methods. In addition, thisprocessor is the same type of processor mainly used in Amazon EC2 cloud.
– Cloud Environment: In this setup, Amazon EC2 cloud servers are used toimplement our experiments in a cross-VM scenario. In Sao Paulo region, theprocessors are same with the one used in native environment with a modifiedXen hypervisor. The instance type is medium.m3 which has 1 vCPU. Theaim of this setup is to show the huge thread of our scenario in a public cloud.In this setup, there are two co-located VMs in the same physical machinesharing the LLC which is verified by the techniques [17].

16
To evaluate our approach on a broad range of commonly used yet differentapplications, we decided to use the Phoronix test benchmarks as sample appli-cations for classification [2]. We performed classification experiments on theseapplications in three different scenarios. As baseline experiments we first per-formed the experiments in the above-described native scenario, both by monitor-ing L1 cache leakages and also by monitoring LLC leakages. The former showsthe potential of L1 cache leakages if they are accessible. The latter assumes arealistic observation scenario for any process running on the same system. Fi-nally, we performed the same experiments on Amazon EC2 cloud to show thefeasibility in a noisy and cross-VM scenario. In this public cloud scenario, onlyLLC is profiled to classify benchmarks since each VM has only one thread inthe core and they do not reside on the same core. For both L1 cache and LLCexperiments, our methodology is applied to 40 different Phoronix benchmarktests in including cryptography, gaming, compressing, SQL, apache and so onAppendix. Last but not least, we present a scenario where we only try to detectthe presence of a single application, the ping detection described in Section 3.4.
4.2 Application Detection in Native Environment
We first performed experiments in the native environment.
Monitoring L1 Cache In native case, first we implemented our profiling onL1 cache. There are two types of cache structure namely, data and instruction.Therefore, in our experiments we profiled each of them separately. In our pro-cessor there are SL1 = 64 sets for each L1-data and L1-instruction cache andthe sets are 8 way associative.
The profiling and application code run on the same core to detect misses inL1 cache. Hence, the hyper-threading feature of Intel processors is used. Beforethe training data is collected, an idle case of L1-data and L1-instruction sets aremonitored and base Probe values are recorded. For L1-data the base value isaround 65 clock cycles and for L1-instruction it is around 75 clock cycles. Hence,the outlier threshold is chosen as τo = 150 for both data and instruction cache.For the conversion from raw data to binary data the threshold value is τo,d = 80for data cache and τo,d = 90 for instruction cache. The number of traces collectedper set for each data set is NT = 10, 000. Therefore, the total number of tracesis equal to 640,000 which belongs to one data set for L1-instruction or L1-data.
To compute the sampling frequency, we checked the total Prime&Probe timeand it is almost same for all sets in L1 cache which is around Tcc = 200 clockcycle. Hence, the sampling frequency is Fs = 2.5GHz/200 = 12.5MHz for L1cache profiling. Fs for L1 cache is higher than LLC profiling because the numberof ways in L1 sets is smaller than LLC sets and accessing to L1 cache lines isfaster than LLC lines. Thus, the resolution of L1 profiling is higher than LLCprofiling which results more distinct feature vectors and high success rates inML algorithm.
After Fs is determined, FFT can be applied to traces. The outcome of FFTis NT /2 which is equal to 5,000 frequency components in our case. This process

17
1 2 4 8 16 32 64Number of sets
40
60
80
100
Suc
cess
rat
e(%
)
datainstruction
Fig. 9. Success rate graph for varying number of sets to train the data
is applied to all 64 sets in data and instruction cache for each test. Hence, thefeature vector of a test consists of 320,000 frequency components after all setsare concatenated. The number of data sets per test is ND = 60 which means thetraining data is a matrix of the size 2, 400× 320, 000.
To classify the training data, first 10-fold cross validation is implemented inSVM. For cross-validation we implement both C-SVC and nu-SVC SVM typesin the LIBSVM library. Our results show that C-SVC gives better success rates,so we preferred this option. For the kernel type, the linear option is chosen sincethe success rate is much higher than for the other options. After these optionsare chosen kernel parameters and the penalty parameter for error are optimizedby LIBSVM. In both training and test phases the chosen parameters are usedto implement SVM. Therefore, there is no user interaction to choose the bestparameters and the steps are automated.
In cross-validation experiments, we show the effect of number of L1 sets onsuccess rate. If only 1 set is used to generate the training model, the cross-validation success rate is 46.8% for instruction and 60.71% for data cache. Withthe increasing number of sets, the cross-validation success rate for data andinstruction cache is increasing to 95.74% and 97.95%, respectively in Figure 9.
For training and individual success rate of test, 60 data sets per test aretrained where the SVMMODEL is obtained with C-SVC and linear kernel op-tions. With the cross-validation technique, the success rate for instruction cacheis higher than data cache. The reason behind this is some of the Phoronix testsdo not use L1-data cache however all tests use L1-instruction cache. Therefore,extracting the feature vectors for tests in instruction cache is more successfulthan L1-data cache.
The results also show that the cross-validation success rate is 98.65% if allinformation in L1 cache (both instruction and data) is used in the machinelearning algorithm. To achieve this success rate we used all 64 cache sets and in

18
Test Number0 5 10 15 20 25 30 35 40 Avg.
Suc
cess
Rat
e (%
)
0
10
20
30
40
50
60
70
80
90
100
110
Fig. 10. Success rate for different tests in L1-data (blue) and L1-instruction (yellow).The last bar represents the average of success rates for 40 tests
total we have 50 × 640, 000 size feature vectors per test. Therefore, the size oftraining data is 2, 000× 640, 000.
LLC Results L1 profiling is not realistic in the real world since the probabilityof two co-located VMs in the same core is really low. Therefore, before switchingto public cloud we implemented our attack in LLC with a cross-core scenario.The number of cores is NC = 10 in our processor and the number of set-slicepairs solving the equation in 3 s mod 64 = o is SL3 = 25 · 10 = 320 whereNLLCB = 11 because of 2,048 LLC sets in total and the number of offset bits isNo = 6. o is the set number which is the most used one in L1 profiling for thattest. Therefore, we have 320 set-slice pairs in total to monitor.
Before collecting data for every test, the idle case of each set is monitored todetermine the base value (τb). τb changes between 90 and 110 clock cycle amongdifferent set-slice pairs. Hence, for each set-slice pair τb is different. The outlierthreshold (τo) is 250 clock cycle. The threshold value (τc) for the conversion fromraw data to binary data is τb + 15 clock cycle. After obtaining the binary data,it is trivial to find the noisy sets. If the number of cache misses is higher than100 in a set-slice pair, it is marked as noisy. These noisy sets are not processedwhen the data is collected.
While collecting the training data 10,000 traces are collected per set-slicepair. The active sets are determined by checking the number of cache missesin each set-slice pair excluding the noisy sets. If the number of cache misses ishigher than 300, then that set-slice pair is marked as active and they are includedin Fourier transform.
The Prime&Probe timings change between 1,800 and 2,200 clock cycle so thesampling frequency (Fs) is taken 1.3 MHz. After FFT is applied to active sets,the left symmetric side of the outcome is recorded. The length of the fingerprint
19
Number of feature values100 500 1000 1500 2000 2500 3000 4000 5000
Suc
cess
Rat
e(%
)
0
50
100
NativeAmazon EC2
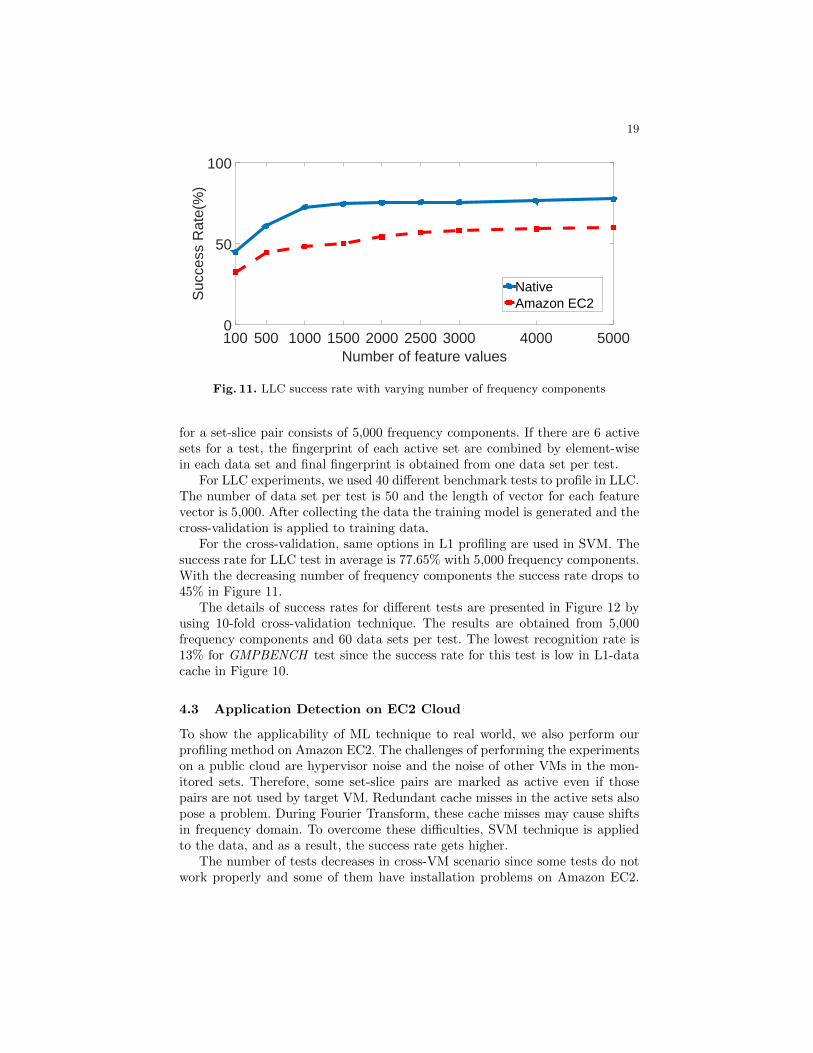
Fig. 11. LLC success rate with varying number of frequency components
for a set-slice pair consists of 5,000 frequency components. If there are 6 activesets for a test, the fingerprint of each active set are combined by element-wisein each data set and final fingerprint is obtained from one data set per test.
For LLC experiments, we used 40 different benchmark tests to profile in LLC.The number of data set per test is 50 and the length of vector for each featurevector is 5,000. After collecting the data the training model is generated and thecross-validation is applied to training data.
For the cross-validation, same options in L1 profiling are used in SVM. Thesuccess rate for LLC test in average is 77.65% with 5,000 frequency components.With the decreasing number of frequency components the success rate drops to45% in Figure 11.
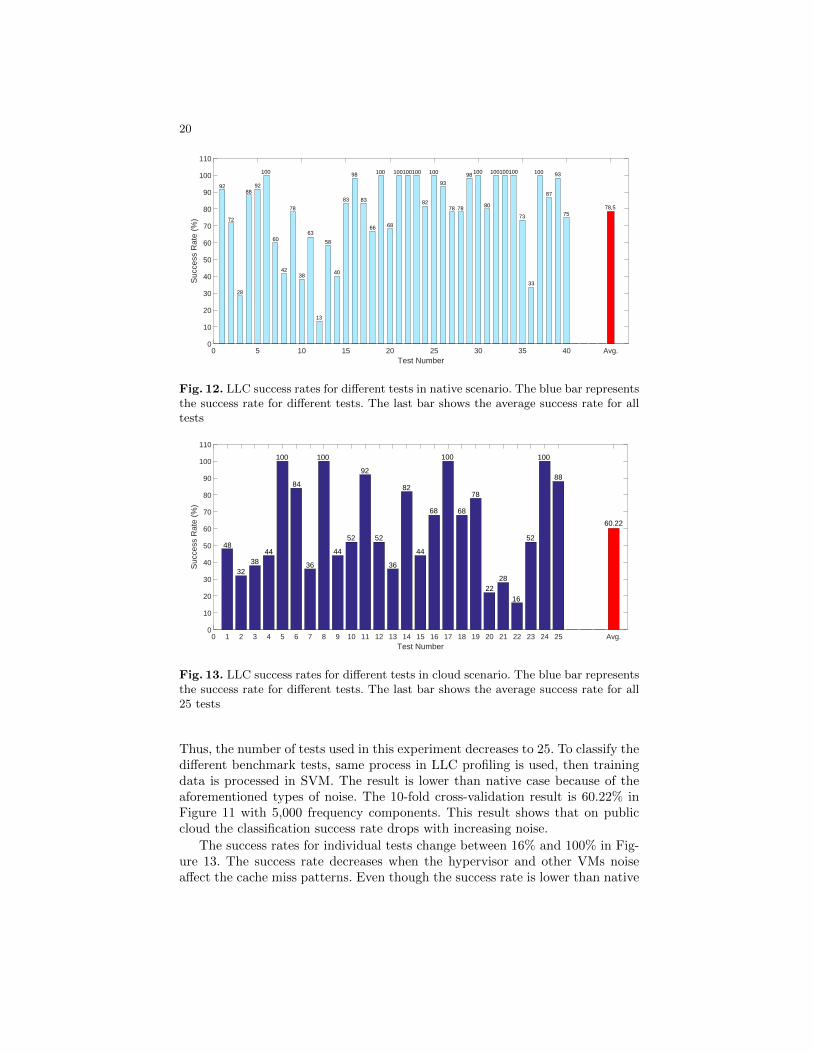
The details of success rates for different tests are presented in Figure 12 byusing 10-fold cross-validation technique. The results are obtained from 5,000frequency components and 60 data sets per test. The lowest recognition rate is13% for GMPBENCH test since the success rate for this test is low in L1-datacache in Figure 10.
4.3 Application Detection on EC2 Cloud
To show the applicability of ML technique to real world, we also perform ourprofiling method on Amazon EC2. The challenges of performing the experimentson a public cloud are hypervisor noise and the noise of other VMs in the mon-itored sets. Therefore, some set-slice pairs are marked as active even if thosepairs are not used by target VM. Redundant cache misses in the active sets alsopose a problem. During Fourier Transform, these cache misses may cause shiftsin frequency domain. To overcome these difficulties, SVM technique is appliedto the data, and as a result, the success rate gets higher.
The number of tests decreases in cross-VM scenario since some tests do notwork properly and some of them have installation problems on Amazon EC2.
20
Test Number0 5 10 15 20 25 30 35 40 Avg.
Suc
cess
Rat
e (%
)
0
10
20
30
40
50
60
70
80
90
100
110
100
40
100 100100100
92
28
92
42
78
38
63
58
98
83
66 68
83 82
13
93
78 78
98100 100 100100100
88
60
80
7273
33
100
87
93
7578,5
Fig. 12. LLC success rates for different tests in native scenario. The blue bar representsthe success rate for different tests. The last bar shows the average success rate for alltests
Test Number0 1 2 3 4 5 6 7 8 9 10 11 12 13 14 15 16 17 18 19 20 21 22 23 24 25 Avg.
Suc
cess
Rat
e (%
)
0
10
20
30
40
50
60
70
80
90
100
110
60.22
48
3238
44
100
84
36
100
92
82
44
68
100
68
78
2228
16
52
100
88
36
5252
44
Fig. 13. LLC success rates for different tests in cloud scenario. The blue bar representsthe success rate for different tests. The last bar shows the average success rate for all25 tests
Thus, the number of tests used in this experiment decreases to 25. To classify thedifferent benchmark tests, same process in LLC profiling is used, then trainingdata is processed in SVM. The result is lower than native case because of theaforementioned types of noise. The 10-fold cross-validation result is 60.22% inFigure 11 with 5,000 frequency components. This result shows that on publiccloud the classification success rate drops with increasing noise.
The success rates for individual tests change between 16% and 100% in Fig-ure 13. The success rate decreases when the hypervisor and other VMs noiseaffect the cache miss patterns. Even though the success rate is lower than native

21
Prime and Probe Sample0 2000 4000 6000 8000 10000
Cac
he a
cces
s
0
0.5
1
1.5
2
Fig. 14. Cache miss pattern of received ping requests in LLC
scenario, this result demonstrates the applicability of out method in the cloudplatform.
4.4 Ping detection on EC2
To detect the co-located VMs with spy VM, ping requests are sent by one of theVMs controlled by the spy in the same region. The purpose of this is to decreaseRTT and increase the frequency of ping requests. At the same time, spy VM 2monitors 320 set-slice pairs since the processor has 10 slices and 32 different setnumbers satisfying s mod 64 = 0.
The set-slice pairs are very noisy on the cloud therefore even if the candidateVM is not co-located with the spy VM, there are some active sets in LLC becauseof the noise from other VMs. However, when the frequency domain of active setsis checked by the spy, there is no dominant frequency component or the dominantfrequency components are not consistent with the ping frequency. If the targetVM is co-located with the spy VM, then the periodic cache misses can be seenin one of the active sets in Figure 14.
After applying Fourier Transform with an appropriate Fs, the dominant fre-quencies are clearly seen in Figure 15. In order to calculate the frequency domainthe sampling frequency Fs should be computed before the frequency transforma-tion is applied to the data. After averaging all LLC sets, Fs is determined to bearound 1,800 clock cycle. The normal CPU frequency of the processor is 2.5 GHzso Fs is equal to 1.56 MHz on Amazon EC2 VMs. When the ping requests aresent every 0.4 ms from Spy VM2, then Spy VM1 can monitor the cache missesin active sets as in Figure 14. When the frequency domain is generated, thefrequency components overlap with the frequency of ping requests in Figure 15.
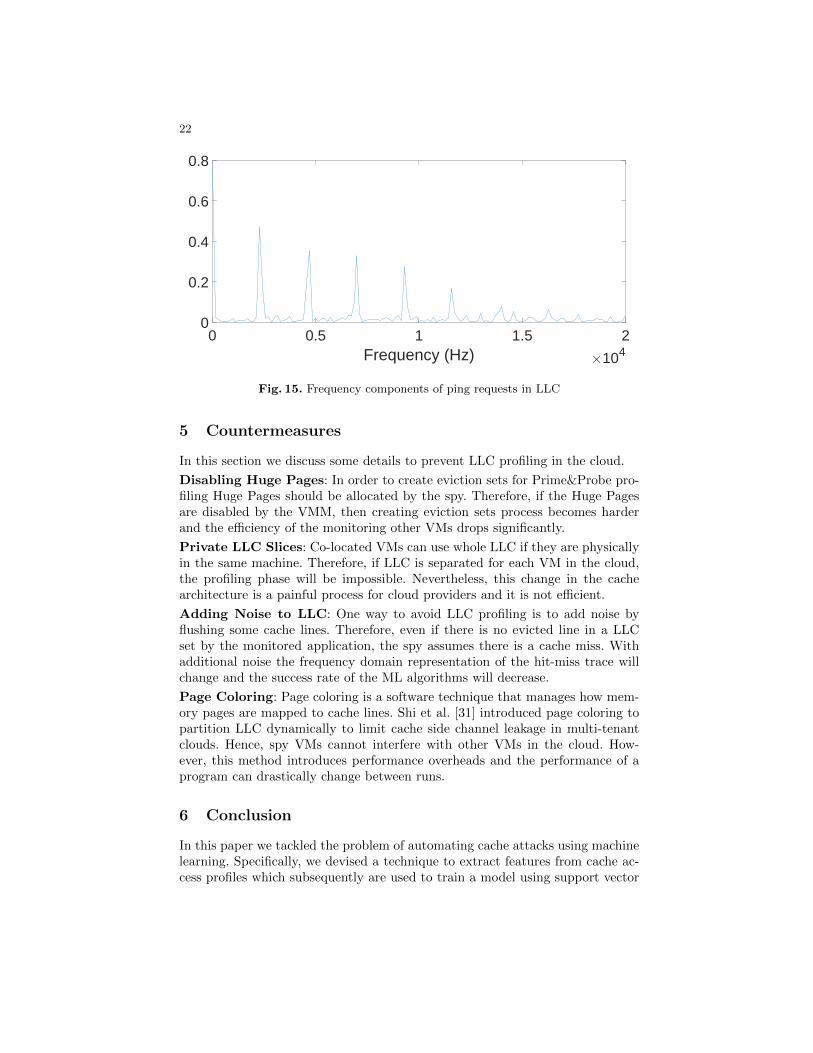
22
Frequency (Hz) ×1040 0.5 1 1.5 2
0
0.2
0.4
0.6
0.8
Fig. 15. Frequency components of ping requests in LLC
5 Countermeasures
In this section we discuss some details to prevent LLC profiling in the cloud.
Disabling Huge Pages: In order to create eviction sets for Prime&Probe pro-filing Huge Pages should be allocated by the spy. Therefore, if the Huge Pagesare disabled by the VMM, then creating eviction sets process becomes harderand the efficiency of the monitoring other VMs drops significantly.
Private LLC Slices: Co-located VMs can use whole LLC if they are physicallyin the same machine. Therefore, if LLC is separated for each VM in the cloud,the profiling phase will be impossible. Nevertheless, this change in the cachearchitecture is a painful process for cloud providers and it is not efficient.
Adding Noise to LLC: One way to avoid LLC profiling is to add noise byflushing some cache lines. Therefore, even if there is no evicted line in a LLCset by the monitored application, the spy assumes there is a cache miss. Withadditional noise the frequency domain representation of the hit-miss trace willchange and the success rate of the ML algorithms will decrease.
Page Coloring: Page coloring is a software technique that manages how mem-ory pages are mapped to cache lines. Shi et al. [31] introduced page coloring topartition LLC dynamically to limit cache side channel leakage in multi-tenantclouds. Hence, spy VMs cannot interfere with other VMs in the cloud. How-ever, this method introduces performance overheads and the performance of aprogram can drastically change between runs.
6 Conclusion
In this paper we tackled the problem of automating cache attacks using machinelearning. Specifically, we devised a technique to extract features from cache ac-cess profiles which subsequently are used to train a model using support vector

23
machines. The model is used later for classification applications based on theircache access profiles. This allows, for instance, a cloud instance to spy on appli-cations co-located on the same server. Even further, our technique can be usedas a discovery phase of a vulnerable application, to be succeeded by a moresophisticated fine grain attack. We validated our models on test executions of40 applications bundled in the Phoronix benchmark suite. Using L1 and LLCcache access profiles our trained model achieves classification rates of 98% and78%, respectively. Even further, our model achieves a 60% (for a suite of 25applications) in the noisy cross-VM setting on Amazon EC2.
6.1 Acknowledgments
This work is supported by the National Science Foundation, under grants CNS-1618837 and CNS-1314770.
References
1. AWS IP Address Ranges. https://ip-ranges.amazonaws.com/ip-ranges.json.2. Phoronix Test Suite Tests. https://openbenchmarking.org/tests/pts.3. Aciicmez, O., Schindler, W., and Cetin K. Koc. Cache Based Remote Timing
Attack on the AES. In CT-RSA 2007, pp. 271–286.4. Acıicmez, O. Yet Another MicroArchitectural Attack: Exploiting I-Cache. In
Proceedings of the 2007 ACM Workshop on Computer Security Architecture.5. Akata, Z., Perronnin, F., Harchaoui, Z., and Schmid, C. Good practice
in large-scale learning for image classification. IEEE Transactions on PatternAnalysis and Machine Intelligence 36, 3 (2014), 507–520.
6. Bates, A., Mood, B., Pletcher, J., Pruse, H., Valafar, M., and Butler,K. Detecting Co-residency with Active Traffic Analysis Techniques. In Proceedingsof the 2012 ACM Workshop on Cloud Computing Security Workshop.
7. Bernstein, D. J. Cache-timing attacks on AES, 2004. URL:http://cr.yp.to/papers.html#cachetiming.
8. Bonneau, J., and Mironov, I. Cache-Collision Timing Attacks against AES. InCHES 2006, vol. 4249 of Springer LNCS, pp. 201–215.
9. Bosman, E., Razavi, K., Bos, H., and Giuffrida, C. Dedup est machina: Mem-ory deduplication as an advanced exploitation vector. In 2016 IEEE Symposiumon Security and Privacy (SP) (May 2016), pp. 987–1004.
10. Brumley, B. B., and Hakala, R. M. Cache-timing template attacks. In Inter-national Conference on the Theory and Application of Cryptology and InformationSecurity (2009), Springer, pp. 667–684.
11. Chandrashekar, G., and Sahin, F. A survey on feature selection methods.Computers & Electrical Engineering 40, 1 (2014), 16–28.
12. Chang, C.-C., and Lin, C.-J. LIBSVM: A library for support vector machines.ACM Transactions on Intelligent Systems and Technology 2 (2011), 27:1–27:27.Software available at http://www.csie.ntu.edu.tw/~cjlin/libsvm.
13. Gruss, D., Spreitzer, R., and Mangard, S. Cache template attacks: Automat-ing attacks on inclusive last-level caches. In USENIX Security (2015), pp. 897–912.
14. Gullasch, D., Bangerter, E., and Krenn, S. Cache Games – Bringing Access-Based Cache Attacks on AES to Practice. IEEE S&P (2011), 490–505.

24
15. Gulmezoglu, B., Inci, M., Irazoki, G., Eisenbarth, T., and Sunar, B. Cross-vm cache attacks on aes.
16. Hospodar, G., Gierlichs, B., De Mulder, E., Verbauwhede, I., and Van-dewalle, J. Machine learning in side-channel analysis: a first study. Journal ofCryptographic Engineering 1, 4 (2011), 293–302.
17. Inci, M. S., Gulmezoglu, B., Eisenbarth, T., and Sunar, B. Co-locationDetection on the Cloud. In COSADE 2016.
18. Inci, M. S., Gulmezoglu, B., Irazoqui, G., Eisenbarth, T., and Sunar, B.Seriously, get off my cloud! Cross-VM RSA Key Recovery in a Public Cloud. Tech.rep. http://eprint.iacr.org/.
19. Irazoqui, G., Eisenbarth, T., and Sunar, B. S$A: A Shared Cache Attackthat Works Across Cores and Defies VM Sandboxing and its Application to AES.In IEEE S&P 2015.
20. Irazoqui, G., Eisenbarth, T., and Sunar, B. Systematic reverse engineeringof cache slice selection in intel processors. In Digital System Design (DSD), 2015Euromicro Conference on (2015), IEEE, pp. 629–636.
21. Irazoqui, G., Inci, M. S., Eisenbarth, T., and Sunar, B. Wait a Minute! Afast, Cross-VM Attack on AES. In RAID 2014.
22. Irazoqui, G., Inci, M. S., Eisenbarth, T., and Sunar, B. Wait a minute! Afast, Cross-VM attack on AES. In RAID 2014. pp. 299–319.
23. Lerman, L., Bontempi, G., and Markowitch, O. Side channel attack: an ap-proach based on machine learning. Center for Advanced Security Research Darm-stadt (2011), 29–41.
24. Liu, F. and Yarom, Y. and Ge, Q. and Heiser, G. and Lee, R. B. Last-levelcache side-channel attacks are practical. In IEEE S&P 2015.
25. Maurice, C. and Le Scouarnec, N. and Neumann, C. and Heen, O. andFrancillon, A. Reverse Engineering Intel Last-Level Cache Complex AddressingUsing Performance Counters . In RAID 2015.
26. Oren, Y., Kemerlis, V. P., Sethumadhavan, S., and Keromytis, A. D. Thespy in the sandbox: Practical cache attacks in javascript and their implications. InCCS 2015, pp. 1406–1418.
27. Osvik, D. A., Shamir, A., and Tromer, E. Cache Attacks and Countermea-sures: The Case of AES. CT-RSA 2006.
28. Pan, Y., Shen, P., and Shen, L. Speech emotion recognition using supportvector machine. International Journal of Smart Home 6, 2 (2012), 101–108.
29. Razavi, K., Gras, B., Bosman, E., Preneel, B., Giuffrida, C., and Bos,H. Flip feng shui: Hammering a needle in the software stack. In 25th USENIXSecurity Symposium (USENIX Security 16) (Austin, TX, Aug. 2016), USENIXAssociation, pp. 1–18.
30. Ristenpart, T., Tromer, E., Shacham, H., and Savage, S. Hey, you, get offof my cloud: Exploring information leakage in third-party compute clouds. In CCS’09, pp. 199–212.
31. Shi, J., Song, X., Chen, H., and Zang, B. Limiting cache-based side-channelin multi-tenant cloud using dynamic page coloring. In Dependable Systems andNetworks Workshops (DSN-W), 2011 IEEE/IFIP 41st International Conferenceon (2011), IEEE, pp. 194–199.
32. Tsunoo, Y., Saito, T., Suzaki, T., and Shigeri, M. Cryptanalysis of DESimplemented on computers with cache. In Proc. of CHES 2003, Springer LNCS(2003), pp. 62–76.
33. Varadarajan, V., Zhang, Y., Ristenpart, T., and Swift, M. A placementvulnerability study in multi-tenant public clouds. In USENIX Security 2015.
25
34. Yarom, Y., and Falkner, K. FLUSH+RELOAD: A High Resolution, Low Noise,L3 Cache Side-Channel Attack. In (USENIX Security 2014).
35. Yarom, Y., Ge, Q., Liu, F., Lee, R. B., and Heiser, G. Mapping the intel last-level cache. Cryptology ePrint Archive, Report 2015/905, 2015. http://eprint.
iacr.org/.36. Zhang, Y., Juels, A., Oprea, A., and Reiter, M. K. HomeAlone: Co-residency
Detection in the Cloud via Side-Channel Analysis. In IEEE S&P 2011.37. Zhang, Y., Juels, A., Reiter, M. K., and Ristenpart, T. Cross-VM Side
Channels and Their Use to Extract Private Keys. In CCS 2012.38. Zhang, Y., Juels, A., Reiter, M. K., and Ristenpart, T. Cross-tenant side-
channel attacks in PaaS clouds. In CCS (2014), pp. 990–1003.

26
Table 2. APPENDIX
Test Number in Fig. 10,12 Type Time(s) Test Number in Fig. 13 Description
1) APACHE System 61 19 Apache benchmark program2) DCRAW PC 67 20 Convert a RAW image to PPM image3) FFTW PC 292 21 Computes discrete Fourier transform (DFT)4) GNUPG PC 15 Encrypts a file using GnuPG5) HIMENO PC 62 22 Implements point-Jacobi method6) OPENSSL PC 22 Implements SSL and TSL7) DOLFYN PC 34 23 Implements Computational Fluid Dynamics8) JAVA-SCIMARK2 PC 34 Runs Java version of Scimark9) JOHN-THE-RIPPER PC 68 Password cracker10) BOTAN PC 401 Implements AES-25611) ESPEAK PC 49 Speech synthesizer12) GMPBENCH PC 480 Test of the GMP 4.3.0 math library13) HMMER PC 60 Implements Hidden Markov Models14) MAFFT PC 39 Performs an alignment process15) GCRYPT PC 30 25 Libgcrypt with CAMELLIA256-ECB16) NPB PC 1440 High-end computer systems benchmark17) CLOMP PC 48 1 Measures OpenMP overheads18) BORK PC 20 2 Cross-platform encryption utility19) C-RAY PC 147 3 Tests the floating-point CPU performance20) FFMPEG PC 37 Tests audio/video encoding performance21) MINION PC 74 4 Constraint solver22) NERO2D PC 650 5 Two-dimensional TM/TE solver23) NGINX System 43 6 Apache program against nginx24) PERL-BENCHMARK PC 88 7 Implementing different versions of perl25) POSTMARK Disk 56 8 Small-file testing in Web and mail servers26) SMALLPT PC 558 C++ global illumination renderer27) STOCKFISH PC 6 Chess benchmark28) SUDOKUT PC 14 9 Sudoku puzzle solver29) SYSTEM-LIBXML2 PC 96 24 Parse a random XML file with libxml230) VPXENC PC 84 10 Video encoding test of Google’s libvpx31) COMPRESS-GZIP PC 14 11 Implements Gzip compression32) CRAFTY PC 86 12 Chess engine33) POLYBENCH-C PC 8 13 C-language polyhedral benchmark34) PRIMESIEVE PC 418 14 Generates prime numbers35) TTSIOD-RENDERER PC 168 15 A portable GPL 3D software renderer36) MENCODER PC 31 Tests audio/video encoding performance37) FHOURSTONES PC 143 16 Integer benchmark for connect-4 game38) EBIZZY PC 22 17 Generates workloads onweb server workloads39) HPCC PC 12600 Cluster focused benchmark40) N-QUEENS PC 260 18 solves the N-queens problem