cadmium (1)
TRANSCRIPT
Locating and Estimating Air EmissionsFrom Sources of Cadmium and
Cadmium Compounds
U. S. Environmental Protection AgencyOffice of Air and Radiation
Office of Air Quality Planning and Standards
Locating and Estimating Air EmissionsFrom Sources of Cadmium and
Cadmium Compounds
Prepared for:
Anne PopeOffice of Air Quality Planning and Standards
Technical Support DivisionU. S. Environmental Protection Agency
Research Triangle Park, N.C. 27711
Prepared by:
Midwest Research Institute401 Harrison Oaks Boulevard, Suite 350
Cary, North Carolina 27513
TABLE OF CONTENTS
Section Page
1 PURPOSE OF DOCUMENT. . . . . . . . . . . . . . . . . . 1-1REFERENCES . . . . . . . . . . . . . . . . . . . . 1-4
2 OVERVIEW OF DOCUMENT CONTENTS. . . . . . . . . . . . . 2-1
3 BACKGROUND . . . . . . . . . . . . . . . . . . . . . . . 3-1NATURE OF POLLUTANT. . . . . . . . . . . . . . . . 3-1OVERVIEW OF PRODUCTION, USE, AND EMISSIONS. . . . 3-4
Productio n . . . . . . . . . . . . . . . . . . 3-4Use . . . . . . . . . . . . . . . . . . . . . 3-6Emissions . . . . . . . . . . . . . . . . . . 3-6
REFERENCES . . . . . . . . . . . . . . . . . . . 3-13
4 EMISSIONS FROM CADMIUM PRODUCTION. . . . . . . . . . . 4-1CADMIUM REFINING AND CADMIUM OXIDE PRODUCTION. . . 4-1
Process Description . . . . . . . . . . . . . 4-3Emissions and Controls . . . . . . . . . . . . 4-6
CADMIUM PIGMENTS PRODUCTION. . . . . . . . . . . 4-11Process Description . . . . . . . . . . . . 4-14Emissions and Controls . . . . . . . . . . . 4-19
CADMIUM STABILIZERS PRODUCTION. . . . . . . . . 4-20Process Description . . . . . . . . . . . . 4-22Emission and Controls . . . . . . . . . . . 4-24
OTHER CADMIUM COMPOUND PRODUCTION. . . . . . . . 4-25Process Descriptions . . . . . . . . . . . . 4-25Emissions and Controls . . . . . . . . . . . 4-29
REFERENCES . . . . . . . . . . . . . . . . . . . 4-32
5 EMISSIONS FROM MAJOR USES OF CADMIUM. . . . . . . . . . 5-1CADMIUM ELECTROPLATING. . . . . . . . . . . . . . 5-1
Process Description . . . . . . . . . . . . . 5-2Emission Control . . . . . . . . . . . . . . . 5-6Emissions . . . . . . . . . . . . . . . . . . 5-7
SECONDARY BATTERY MANUFACTURE. . . . . . . . . . . 5-7Process Description . . . . . . . . . . . . . 5-9Emission Control Measures . . . . . . . . . 5-13Emissions . . . . . . . . . . . . . . . . . 5-13
CADMIUM STABILIZERS FOR PLASTICS . . . . . . . . 5-14Process Description . . . . . . . . . . . . 5-16Emission Control Measures . . . . . . . . . 5-17Emissions . . . . . . . . . . . . . . . . . 5-18
CADMIUM PIGMENTS IN PLASTICS . . . . . . . . . . 5-18Process Description . . . . . . . . . . . . 5-20Emission Control Measures . . . . . . . . . 5-22Emissions . . . . . . . . . . . . . . . . . 5-22
REFERENCES . . . . . . . . . . . . . . . . . . . 5-23
iii
TABLE OF CONTENTS (continued)
6 EMISSIONS FROM COMBUSTION SOURCES. . . . . . . . . . . 6-1COAL COMBUSTION . . . . . . . . . . . . . . . . . . 6-5
Coal Characteristics . . . . . . . . . . . . . 6-6Process Description . . . . . . . . . . . . 6-10Emission Control Measures . . . . . . . . . 6-15Emissions . . . . . . . . . . . . . . . . . 6-16
FUEL OIL COMBUSTION. . . . . . . . . . . . . . . 6-20Fuel Oil Characteristics . . . . . . . . . . 6-22Process Description . . . . . . . . . . . . 6-23Emission Control Measures . . . . . . . . . 6-27Emissions . . . . . . . . . . . . . . . . . 6-28
NATURAL GAS COMBUSTION. . . . . . . . . . . . . 6-33Natural Gas Characteristics . . . . . . . . 6-33Process Description . . . . . . . . . . . . 6-34Emission Control Measures . . . . . . . . . 6-34Emissions . . . . . . . . . . . . . . . . . 6-34
WOOD COMBUSTION . . . . . . . . . . . . . . . . . 6-35Process Description . . . . . . . . . . . . 6-35Emission Control Measures . . . . . . . . . 6-37Emissions . . . . . . . . . . . . . . . . . 6-39
MUNICIPAL WASTE COMBUSTION. . . . . . . . . . . 6-40Municipal Solid Waste Characteristics . . . 6-42Process Description . . . . . . . . . . . . 6-42Emission Control Measures . . . . . . . . . 6-48Emissions . . . . . . . . . . . . . . . . . 6-50
SEWAGE SLUDGE INCINERATORS. . . . . . . . . . . 6-51Process Description . . . . . . . . . . . . 6-54Emission Control Measures . . . . . . . . . 6-58Emissions . . . . . . . . . . . . . . . . . 6-59
MEDICAL WASTE INCINERATION . . . . . . . . . . . 6-61Process Description . . . . . . . . . . . . 6-62Emission Control Measures . . . . . . . . . 6-67Emissions . . . . . . . . . . . . . . . . . 6-68
REFERENCES . . . . . . . . . . . . . . . . . . . 6-75
7 EMISSIONS FROM NONFERROUS SMELTING/REFINING. . . . . . 7-1PRIMARY LEAD SMELTING. . . . . . . . . . . . . . . 7-1
Process Description . . . . . . . . . . . . . 7-2Emission Control Measures . . . . . . . . . . 7-4Emissions . . . . . . . . . . . . . . . . . . 7-5
PRIMARY COPPER SMELTING. . . . . . . . . . . . . . 7-7Process Description . . . . . . . . . . . . . 7-8Emission Control Measures . . . . . . . . . 7-13Emissions . . . . . . . . . . . . . . . . . 7-14
PRIMARY ZINC SMELTING AND REFINING . . . . . . . 7-15Process Description - Electrolytic . . . . . 7-17Process Description--Pyrometallurgical
(Electrothermic) . . . . . . . . . . . . . 7-22Emission Control Measures . . . . . . . . . 7-23Emissions . . . . . . . . . . . . . . . . . 7-24
iv

TABLE OF CONTENTS (continued)
SECONDARY COPPER SMELTING AND REFINING. . . . . 7-25Process Description . . . . . . . . . . . . 7-26Emission Control Measures . . . . . . . . . 7-31Emissions . . . . . . . . . . . . . . . . . 7-33
SECONDARY ZINC RECOVERY FROM METALLIC SCRAP . . . 7-34Process Description . . . . . . . . . . . . 7-34Emission Control Measures . . . . . . . . . 7-39Emissions . . . . . . . . . . . . . . . . . 7-41
SECONDARY ZINC RECOVERY FROM STEEL PRODUCTION . . 7-41Process Description . . . . . . . . . . . . 7-43Emission Control Measures . . . . . . . . . 7-48Emissions . . . . . . . . . . . . . . . . . 7-48
REFERENCES . . . . . . . . . . . . . . . . . . . 7-49
8 EMISSIONS FROM MISCELLANEOUS SOURCES. . . . . . . . . . 8-1IRON AND STEEL PRODUCTION. . . . . . . . . . . . . 8-1
Process Description . . . . . . . . . . . . . 8-4Emission Control Measures . . . . . . . . . 8-10Emissions . . . . . . . . . . . . . . . . . 8-12
PORTLAND CEMENT MANUFACTURING. . . . . . . . . . 8-12Process Description . . . . . . . . . . . . 8-15Emission Control Measures . . . . . . . . . 8-18Emissions . . . . . . . . . . . . . . . . . 8-20
PHOSPHATE ROCK PROCESSING. . . . . . . . . . . . 8-20Process Description . . . . . . . . . . . . 8-23Emission Control Measures . . . . . . . . . 8-25Emissions . . . . . . . . . . . . . . . . . 8-26
CARBON BLACK PRODUCTION. . . . . . . . . . . . 8-27Process Description . . . . . . . . . . . . 8-29Emission Control Measures . . . . . . . . . 8-31Emissions . . . . . . . . . . . . . . . . . 8-31
MOBILE SOURCES . . . . . . . . . . . . . . . . . 8-32REFERENCES . . . . . . . . . . . . . . . . . . . 8-33
9 SOURCE TEST PROCEDURES. . . . . . . . . . . . . . . . . 9-1INTRODUCTION . . . . . . . . . . . . . . . . . . . 9-1MULTIPLE METALS SAMPLING TRAINS. . . . . . . . . . 9-2
Method 0012-Methodology for the Determin-ation of Metals Emissions in ExhaustGases from Hazardous Waste Incinerationand Similar Combustion Sources . . . . . . . 9-2
Methodology for the Determination of MetalsEmissions in Exhaust Gases from HazardousWaste Incineration and Similar CombustionSources . . . . . . . . . . . . . . . . . . 9-4
CARB Method 436-Determination of MultipleMetals Emissions from Stationary Sources . . 9-4
EPA Method 29-Methodology for the
v

TABLE OF CONTENTS (continued)
Determination of Metals Emissions inExhaust Gases from Incineration andSimilar Combustion Sources (Draft) . . . . . 9-5
ANALYTICAL METHODS FOR DETERMINATION OF CADMIUM . . 9-5Flame AAS . . . . . . . . . . . . . . . . . . 9-6Graphite Furnace AAS . . . . . . . . . . . . . 9-6Hydride A A . . . . . . . . . . . . . . . . . . 9-6Cold-Vapor AA . . . . . . . . . . . . . . . . 9-7
SUMMARY . . . . . . . . . . . . . . . . . . . . . . 9-7REFERENCES . . . . . . . . . . . . . . . . . . . . 9-9
APPENDIX A - NATIONWIDE EMISSION ESTIMATES . . . . . . . . . A-1
APPENDIX B - SUMMARY OF COMBUSTION SOURCE CADMIUMEMISSION DATA . . . . . . . . . . . . . . . . B-1
APPENDIX C - PLANT LOCATIONS AND ANNUAL CAPACITIES FORMISCELLANEOUS EMISSIONS SOURCES. . . . . . . C-1
vi
LIST OF FIGURES
Figure Page
3-1 1991 supply and demand for cadmium . . . . . . . . . . . 3-5
3-2 End use pattern of cadmium . . . . . . . . . . . . . . . 3-7
4-1 Flow diagram for cadmium refining . . . . . . . . . . . 4-4
4-2 Process flowsheet for the production ofcadmium pigments . . . . . . . . . . . . . . . . . . 4-17
4-3 General flowsheet for the production ofpowdered cadmium stabilizers. . . . . . . . . . . . 4-23
5-1 Cadmium electroplating process. . . . . . . . . . . . . 5-4
5-2 Simplified flow diagram for production of sinteredplate nickel-cadmium batteries. . . . . . . . . . . 5-11
6-1 Distribution of sewage sludge incinerators in theUnited States . . . . . . . . . . . . . . . . . . . 6-53
6-2 Process flow diagram for sludge incineration . . . . . 6-55
6-3 Major components of an incineration system. . . . . . 6-64
7-1 Typical primary lead-processing scheme . . . . . . . . . 7-3
7-2 Typical primary copper-smelting process. . . . . . . . . 7-9
7-3 Typical primary zinc-smelting process. . . . . . . . . 7-18
7-4 Process flow diagram for second-gradecopper recovery. . . . . . . . . . . . . . . . . . . 7-28
7-5 Process flow diagram for high-gradebrass and bronze alloying. . . . . . . . . . . . . . 7-29
7-6 Process flow diagram for secondary zinc processing . . 7-36
7-7 Process flow diagram for Waelz kiln process. . . . . . 7-45
7-8 Process flow diagram for zinc calcine formation. . . . 7-47
8-1 General flow diagram for the iron and steel industry . . 8-5
8-2 Process flow diagram of Portland cementmanufacturing process . . . . . . . . . . . . . . . 8-16
8-3 Typical flowsheet for processing phosphate rock . . . 8-24
vii
LIST OF FIGURES (continued)
8-4 Process flow diagram for carbon blackmanufacturing process . . . . . . . . . . . . . . . 8-30
9-1. Typical multiple metals sampling train . . . . . . . . 9-3
viii
LIST OF TABLES
Table Page
3-1 PHYSICAL PROPERTIES OF CADMIUM. . . . . . . . . . . . . 3-2
3-2 SIC CODES OF INDUSTRIES ASSOCIATED WITHCADMIUM EMISSIONS . . . . . . . . . . . . . . . . . 3-10
3-3 ESTIMATED 1990 NATIONWIDE CADMIUM EMISSIONS FORSELECTED SOURCE CATEGORIES. . . . . . . . . . . . . 3-12
4-1 CADMIUM AND CADMIUM OXIDE PRODUCERS. . . . . . . . . . 4-2
4-2 INVENTORY OF CADMIUM EMISSION SOURCES ANDCONTROLS FOR CADMIUM REFINING PLANTS. . . . . . . . . 4-7
4-3 PRIMARY ZINC AND CADMIUM PRODUCERS REPORTING CADMIUMEMISSIONS IN THE 1990 TOXIC CHEMICALSRELEASE INVENTORY . . . . . . . . . . . . . . . . . 4-10
4-4 CADMIUM EMISSION FACTORS FOR CADMIUM REFININGPLANT USING LEAD BLAST FURNACE DUST. . . . . . . . 4-12
4-5 EMISSION FACTORS FOR CADMIUM AND CADMIUMOXIDE PRODUCTION. . . . . . . . . . . . . . . . . . 4-13
4-6 COMMON CADMIUM PIGMENTS PRODUCED IN 1991. . . . . . . 4-15
4-7 CURRENT CADMIUM PIGMENT PRODUCERS. . . . . . . . . . 4-16
4-8 INORGANIC PIGMENTS MANUFACTURERS REPORTING CADMIUMEMISSIONS IN THE 1990 TOXIC CHEMICALSRELEASE INVENTORY . . . . . . . . . . . . . . . . . 4-21
4-9 MANUFACTURERS OF ORGANIC COMPOUNDS REPORTING CADMIUMEMISSIONS IN THE 1990 TOXIC CHEMICALSRELEASE INVENTORY . . . . . . . . . . . . . . . . . 4-26
4-10 CADMIUM COMPOUND MANUFACTURERS (OTHER THANCADMIUM OXIDE, PIGMENTS, AND STABILIZERS) . . . . . 4-27
4-11 CADMIUM COMPOUND MANUFACTURERS (OTHER THAN CADMIUMOXIDE, PIGMENTS, AND STABILIZERS . . . . . . . . . . 4-30
4-12 MANUFACTURERS OF INORGANIC COMPOUNDS REPORTING CADMIUMEMISSIONS IN THE 1990 TOXIC CHEMICALSRELEASE INVENTORY . . . . . . . . . . . . . . . . . 4-31
5-1 MARKET AREAS FOR CADMIUM COATINGS. . . . . . . . . . . 5-3
5-2 COMPOSITION AND OPERATING PARAMETERS OF CADMIUMCYANIDE PLATING BATH. . . . . . . . . . . . . . . . . 5-6
ix

LIST OF TABLES (continued)
5-3 NICKEL-CADMIUM BATTERY PRODUCERS--1990. . . . . . . . . 5-9
5-4 REPORTED CADMIUM EMISSIONS BY MANUFACTURERS OFFORMULATED RESINS AND PLASTIC PRODUCTS. . . . . . . 5-19
5-5 REPORTED CADMIUM EMISSIONS BY PRODUCERS OFCUSTOM COMPOUNDED RESINS. . . . . . . . . . . . . . 5-21
6-1 DISTRIBUTION OF FOSSIL FUEL CONSUMPTION IN THEUNITED STATES . . . . . . . . . . . . . . . . . . . . 6-3
6-2 COAL HEATING VALUES . . . . . . . . . . . . . . . . . . 6-7
6-3 EXAMPLES OF COAL HEAT CONTENT VARIABILITY. . . . . . . 6-8
6-4 CADMIUM CONCENTRATION IN COAL BY COAL TYPE. . . . . . 6-11
6-5 CADMIUM CONCENTRATION IN COAL BY REGION. . . . . . . 6-11
6-6 CALCULATED UNCONTROLLED CADMIUM EMISSION FACTORSFOR COAL COMBUSTION. . . . . . . . . . . . . . . . 6-18
6-7 SUMMARY OF CADMIUM EMISSION FACTORS FORCOAL COMBUSTION. . . . . . . . . . . . . . . . . . 6-19
6-8 BEST TYPICAL CADMIUM EMISSION FACTORS FORCOAL COMBUSTION. . . . . . . . . . . . . . . . . . 6-21
6-9 TYPICAL HEATING VALUES OF FUEL OILS . . . . . . . . . 6-24
6-10 TYPICAL FUEL OIL HEATING VALUES FORSPECIFIC REGIONS . . . . . . . . . . . . . . . . . 6-25
6-11 CADMIUM CONCENTRATION IN OIL BY OIL TYPE. . . . . . . 6-26
6-12 CALCULATED UNCONTROLLED CADMIUM EMISSION FACTORSFOR FUEL OIL COMBUSTION . . . . . . . . . . . . . . 6-29
6-13 MEASURED CADMIUM EMISSION FACTORS FOR FUELOIL COMBUSTION . . . . . . . . . . . . . . . . . . . 6-30
6-14 CADMIUM EMISSION FACTORS FOR FUEL OIL COMBUSTIONGENERATED FROM CALIFORNIA "HOT SPOTS" TESTS. . . . 6-32
6-15 BEST TYPICAL CADMIUM EMISSION FACTORS FOR FUEL OILCOMBUSTION . . . . . . . . . . . . . . . . . . . . . . 6-33
6-16 SUMMARY OF CADMIUM EMISSION FACTORS FORWOOD COMBUSTION. . . . . . . . . . . . . . . . . . 6-39
x
LIST OF TABLES (continued)
6-17 SUMMARY OF GEOGRAPHICAL DISTRIBUTION OFMWC FACILITIES . . . . . . . . . . . . . . . . . . . 6-41
6-18 CURRENT AND FORECAST COMPOSITION OFDISPOSED RESIDENTIALAND COMMERCIAL WASTE (WEIGHT PERCENT). . . . . . . 6-43
6-19 BEST TYPICAL CADMIUM EMISSION FACTORS FOR MUNICIPALWASTE COMBUSTORS. . . . . . . . . . . . . . . . . . 6-52
6-20 SUMMARY OF CADMIUM EMISSION FACTORS FORSEWAGE SLUDGE INCINERATION. . . . . . . . . . . . . 6-60
6-21 UNCONTROLLED CADMIUM EMISSION FACTORS FORMEDICAL WASTE INCINERATORS. . . . . . . . . . . . . 6-70
6-22 SUMMARY OF CONTROLLED CADMIUM EMISSION FACTORSAND CONTROL EFFICIENCIES FOR MEDICALWASTE INCINERATORS. . . . . . . . . . . . . . . . . 6-73
6-23 BEST TYPICAL UNCONTROLLED CADMIUM EMISSIONFACTORS FOR MEDICAL WASTE INCINERATORS. . . . . . . 6-74
7-1 DOMESTIC PRIMARY LEAD SMELTERS AND REFINERIES. . . . . 7-2
7-2 PRIMARY LEAD PRODUCERS REPORTING CADMIUM EMISSIONSIN THE 1990 TOXICS RELEASE INVENTORY. . . . . . . . . 7-5
7-3 CADMIUM EMISSION FACTORS FOR LEAD-SMELTINGFACILITIE S . . . . . . . . . . . . . . . . . . . . . . 7-6
7-4 DOMESTIC PRIMARY COPPER SMELTERS AND REFINERIES. . . . 7-7
7-5 PRIMARY COPPER PRODUCERS REPORTING CADMIUM EMISSIONSIN THE 1990 TOXICS RELEASE INVENTORY. . . . . . . . 7-14
7-6 CADMIUM EMISSIONS FROM PRIMARY COPPER PRODUCTION . . . 7-16
7-7 DOMESTIC PRIMARY ZINC PRODUCERS. . . . . . . . . . . 7-17
7-8 PRIMARY ZINC PRODUCERS REPORTING CADMIUM EMISSIONSIN THE 1990 TOXICS RELEASE INVENTORY. . . . . . . . 7-24
7-9 CADMIUM EMISSIONS FROM PRIMARY ZINC PRODUCTION. . . . 7-25
7-10 DOMESTIC SECONDARY COPPER PRODUCERS. . . . . . . . . 7-26
7-11 SECONDARY COPPER PRODUCERS REPORTINGCADMIUM EMISSIONS IN THE 1989 AND 1990TOXICS RELEASE INVENTORY. . . . . . . . . . . . . . 7-34
xi
LIST OF TABLES (continued)
7-12 DOMESTIC PRODUCERS OF SECONDARY ZINC FROMMETALLIC SCRAP . . . . . . . . . . . . . . . . . . 7-35
7-13 CADMIUM EMISSIONS FROM SECONDARY ZINC RECOVERYFROM METAL SCRAP . . . . . . . . . . . . . . . . . . 7-42
7-14 DOMESTIC PRODUCERS OF SECONDARY ZINC FROM EAF DUST . 7-44
8-1 INTEGRATED IRON AND STEEL PLANTS. . . . . . . . . . . . 8-3
8-2 COKE PRODUCTION CAPACITY FOR INTEGRATED IRONAND STEEL FACILITIES IN THE UNITED STATESIN 1991 . . . . . . . . . . . . . . . . . . . . . . . 8-6
8-3 CADMIUM RELEASES REPORTED BY IRON AND STEELFACILITIES IN 1990 TRI . . . . . . . . . . . . . . . 8-13
8-4 CADMIUM EMISSIONS REPORTED FROM BETHLEHEM STEEL,SPARROWS POINT, MARYLAND. . . . . . . . . . . . . . 8-14
8-5 CADMIUM EMISSION FACTORS FROM PORTLANDCEMENT FACILITIES . . . . . . . . . . . . . . . . . 8-21
8-6 CARBON BLACK PRODUCTION FACILITIES. . . . . . . . . . 8-28
9-1 CADMIUM SAMPLING METHODS. . . . . . . . . . . . . . . . 9-8
xii

SECTION 1
PURPOSE OF DOCUMENT
The U. S. Environmenta l Protectio n Agenc y (EPA) , State , and
loca l ai r pollutio n contro l agencie s ar e becomin g increasingly
awar e of th e presenc e of substance s i n th e ambien t ai r tha t may
be toxi c at certai n concentrations. Thi s awareness , i n turn , has
le d t o attempt s t o identif y source/recepto r relationship s for
thes e substance s and t o develo p contro l program s t o regulate
emissions. Unfortunately , littl e informatio n exist s on the
ambien t ai r concentratio n of thes e substance s or abou t the
source s tha t may be dischargin g the m t o th e atmosphere.
To assis t group s intereste d i n inventoryin g ai r emission s of
variou s potentiall y toxi c substances , EPA i s preparin g a series
of document s suc h as thi s tha t compile s availabl e informatio n on
source s and emission s of thes e substances. Prio r document s in
th e serie s ar e liste d below:
SubstanceEPA
Publicatio n NumberAcrylonitrile EPA-450/4-84-007aCarbo n Tetrachloride EPA-450/4-84-007bChloroform EPA-450/4-84-007cEthylen e Dichloride EPA-450/4-84-007dFormaldehyde EPA-450/4-91-012Nickel EPA-450/4-84-007fChromium EPA-450/4-84-007gManganese EPA-450/4-84-007hPhosgene EPA-450/4-84-007iEpichlorohydrin EPA-450/4-84-007jVinyliden e Chloride EPA-450/4-84-007kEthylen e Oxide EPA-450/4-84-007l
1-1

Chlorobenzene EPA-450/4-84-007mPolychlorinate d Biphenyl s (PCB’s) EPA-450/4-84-007nPolycycli c Organi c Matte r (POM) EPA-450/4-84-007pBenzene EPA-450/4-84-007qPerchloroethylen e and
TrichloroethyleneEPA-450/2-89-013
Municipa l Waste Combustion EPA-450/2-89-006Coal and Oi l Combustion EPA-450/2-89-0011,3-Butadiene EPA-450/2-89-021Chromiu m (Supplement) EPA-450/2-89-002Sewage Sludge EPA-450/2-90-009Styrene EPA-450/4-91-029
Thi s document deal s specificall y wit h cadmiu m and cadmium
compounds ; however , th e majorit y of th e informatio n containe d in
thi s document concern s cadmium. Source s of cadmiu m emissions
evaluate d i n thi s document include : (1 ) cadmiu m productio n and
us e processes ; (2 ) emission s fro m combustio n sources ; (3)
productio n of othe r nonferrou s metal s wher e cadmiu m emissions
resul t as inadverten t byproduct s of th e process ; (4 ) production
processe s fo r selecte d material s othe r tha n nonferrou s metals;
and (5 ) mobil e sources.
I n additio n t o th e informatio n presente d i n thi s document,
anothe r potentia l sourc e of emission s dat a fo r cadmiu m and
cadmiu m compounds i s th e Toxi c Chemica l Releas e Inventor y (TRI)
for m require d by Sectio n 313 of Titl e II I of th e 1986 Superfund
Amendments and Reauthorizatio n Act (SARA 313). 1 SARA 313
require s owner s and operator s of facilitie s i n certai n Standard
Industria l Classificatio n Codes tha t manufacture , import , process
or otherwis e us e toxi c chemical s (a s liste d i n Sectio n 313) to
repor t annuall y thei r release s of thes e chemical s t o all
environmenta l media. As par t of SARA 313 , EPA provide s public
acces s t o th e annua l emission s data. The TRI dat a include
genera l facilit y information , chemica l information , and emissions
data. Ai r emission s dat a ar e reporte d as tota l facilit y release
1-2

estimate s fo r fugitiv e emission s and poin t sourc e emissions. No
individua l proces s or stac k dat a ar e provide d t o EPA unde r the
program. The TRI require s source s t o us e stac k monitorin g data
fo r reporting , i f available , but th e rul e does not requir e stack
monitorin g or othe r measuremen t of emission s i f i t is
unavailable. I f monitorin g dat a ar e unavailable , emission s are
t o be quantifie d base d on bes t estimate s of release s t o the
environment.
The reade r i s cautione d tha t th e TRI wil l not likel y provide
facility , emissions , and chemica l releas e dat a sufficien t for
conductin g detaile d exposur e modelin g and ris k assessment. In
many cases , th e TRI dat a ar e base d on annua l estimate s of
emission s (i.e. , on emissio n factors , materia l balance
calculations , and engineerin g judgment). We recommend th e us e of
TRI dat a i n conjunctio n wit h th e informatio n provide d i n this
document t o locat e potentia l emitter s of cadmiu m and t o make
preliminar y estimate s of ai r emission s fro m thes e facilities.
Cadmiu m i s of particula r importanc e as a resul t of th e Clean
Ai r Act Amendments of 1990. Cadmiu m and it s compounds are
include d i n th e Titl e II I lis t of hazardou s ai r pollutant s and
wil l be subjec t t o standard s establishe d unde r Sectio n 112,
includin g maximum achievabl e contro l technolog y (MACT). Also,
Sectio n 112(c)(6 ) of th e 1990 Amendments mandat e tha t cadmium
(amon g others ) be subjec t t o standard s tha t allo w fo r th e maximum
degre e of reductio n of emissions. Thes e standard s ar e t o be
promulgate d no late r tha n 10 year s followin g th e dat e of
enactment.
The dat a on cadmiu m emission s ar e based , wheneve r possible,
on th e result s of actua l tes t procedures. Dat a presente d i n this
document ar e tota l cadmiu m emission s and do not differentiat e the
metalli c and ioni c form s of cadmium. The samplin g and analysis
1-3

procedure s employe d fo r th e determinatio n of th e cadmium
concentration s fro m variou s source s ar e presente d i n Sectio n 9,
Sourc e Tes t Method.
1-4

REFERENCES FOR SECTION 1
1. Toxi c Chemica l Releas e Reporting: Communit y Right-To-Know.
Federa l Registe r 52(107): 21152-21208. Jun e 4, 1987.
1-5
SECTION 2
OVERVIEW OF DOCUMENT CONTENTS
As note d i n Sectio n 1, th e purpos e of thi s document i s to
assis t Federal , State , and loca l ai r pollutio n agencie s and
other s who ar e intereste d i n locatin g potentia l ai r emitter s of
cadmiu m and cadmiu m compounds and estimatin g ai r emission s from
thes e sources. Becaus e of th e limite d backgroun d dat a available,
th e informatio n summarize d i n thi s document does not and should
not be assumed t o represen t th e sourc e configuratio n or emissions
associate d wit h any particula r facility.
Thi s sectio n provide s an overvie w of th e content s of this
document. I t briefl y outline s th e nature , extent , and forma t of
th e materia l presente d i n th e remainin g section s of this
document.
Sectio n 3 of thi s document provide s a brie f summary of the
physica l and chemica l characteristic s of cadmiu m and cadmium
compounds and an overvie w of thei r productio n and uses. A
chemica l us e tre e summarize s th e quantitie s of cadmiu m produced
as wel l as th e relativ e amount s consume d by variou s end uses.
Thi s backgroun d sectio n may be usefu l t o someone who want s to
develo p a genera l perspectiv e on th e natur e of th e substanc e and
wher e i t i s manufacture d and consumed.
Section s 4 t o 7 of thi s document focu s on th e major
industria l sourc e categorie s tha t may discharg e cadmium-
containin g ai r emissions. Sectio n 4 discusse s th e productio n of
2-1
cadmiu m and cadmiu m compounds. Sectio n 5 discusse s th e different
majo r use s of cadmiu m as an industria l feedstock. Sectio n 6
discusse s emission s fro m combustio n sources. Sectio n 7 discusses
emission s fro m selecte d nonferrou s smelting/refinin g processes,
and Sectio n 8 discusse s emission s fro m miscellaneou s production
processe s and mobil e sources. For eac h majo r industria l source
categor y described , proces s description s and flo w diagram s are
give n whereve r possible , potentia l emissio n point s are
identified , and availabl e emissio n facto r estimate s ar e presented
tha t sho w th e potentia l fo r cadmiu m emission s befor e and after
control s ar e employe d by industry. Individua l companie s are
named tha t ar e reporte d t o be involve d wit h th e productio n and/or
us e of cadmiu m base d on industr y contacts , th e Toxi c Release
Inventor y (TRI) , and availabl e trad e publications.
The fina l sectio n of thi s document summarize s available
procedure s fo r sourc e samplin g and analysi s of cadmium. Details
ar e not prescribe d nor i s any EPA endorsemen t give n or implied
fo r any of thes e samplin g and analysi s procedures. Appendi x A
present s calculation s use d t o deriv e th e estimate d 1990
nationwid e cadmiu m emissions. Appendi x B present s a summary of
th e combustio n sourc e tes t data. Appendi x C list s names and
location s of electri c ar c furnaces , U.S . Portlan d cement
manufacturers , phosphat e roc k processors , and elemental
phosphoru s producers.
Thi s document does not contai n any discussio n of healt h or
othe r environmenta l effect s of cadmium , nor does i t includ e any
discussio n of ambien t ai r level s or ambien t ai r monitoring
techniques.
Comments on th e conten t or usefulnes s of thi s document are
welcome , as i s any informatio n on proces s descriptions , operating
2-2

practices , contro l measures , and emission s tha t woul d enabl e EPA
t o improv e it s contents. Al l comments shoul d be sen t to:
Chief , Emissio n Facto r and Methodolog y Sectio n (MD-14)Emissio n Inventor y BranchU. S. Environmenta l Protectio n AgencyResearc h Triangl e Park , NC 27711
2-3
SECTION 3
BACKGROUND
Thi s sectio n discusse s cadmiu m and it s compounds and alloys,
thei r chemica l and physica l properties , and thei r commercial
uses. The sectio n als o provide s statistic s on cadmiu m production
and use. Finally , th e sectio n present s nationwid e estimate s of
cadmiu m emission s fro m th e source s discusse d i n th e other
section s of thi s document.
NATURE OF POLLUTANT
Cadmiu m i s a soft , ductile , silvery-whit e metal. I t was
discovere d by Stromeye r i n 1817 as an impurit y i n zin c carbonate.
Tabl e 3- 1 summarize s cadmium’ s chemica l and physica l properties.
When heate d i n air , cadmiu m form s a fume of brown-colored
cadmiu m oxide , CdO. Othe r element s whic h reac t readil y with
cadmiu m meta l upon heatin g includ e th e halogens , phosphorus,
selenium , and tellurium. The meta l i s not attacke d by aqueous
solution s of alkal i hydroxides.
Cadmiu m i s slowl y attacke d by war m dilut e hydrochlori c or
sulfuri c aci d wit h th e evolutio n of hydroge n but i s rapidly
oxidize d t o th e cadmiu m io n by hot dilut e nitri c aci d with
evolutio n of variou s oxide s of nitroge n (NOx). Cadmiu m is
displace d fro m solutio n by more electropositiv e metal s suc h as
3-1

TABLE 3-1. PHYSICAL PROPERTIES OF CADMIUM
Property Value
Atomic weightCrystal structureCAS registry numberAtomic numberValence
112.41Hexagonal7440-43-9
482
Outer electron configurationMetallic radius, ÅCovalent radium, ÅElectrode potential, normal, V
Cd Cd2+ + 2 e
4d105s2
1.541.48
-0.4013
Melting point, °CBoiling, point, °CLatent heat of fusion, J/g (cal/g)a
Latent heat of vaporization, J/g (cal/g)a
Specific heat, J/mol·K (cal/mol·K)a
Solid, 20°CLiquid, 321° to 700°C
321.1767
55.2 (13.2)886.9 (212)
25.9 (6.19)29.7 (7.10)
Electrical resistivity, µΩ-cmat 22°Cat 400°Cat 600°Cat 700°C
Density, kg/m3
at 26°Cat melting pointat 400°Cat 600°C
7.2734.134.835.8
8,6248,0207,9307,720
Thermal conductivity, W (m·K), at 0°CVapor pressure, mmHg
at 382°Cat 478°Cat 595°Cat 767°C
98
0.75987.59875.98759.8
Source: Reference 1.
aTo convert J to cal, divide by 4.184.
3-2

zin c or aluminum. The hydroxid e of cadmium , Cd(OH) 2, i s
virtuall y insolubl e i n alkalin e media. The cadmiu m io n forms
stabl e complexe s wit h ammonia, as wel l as cyanid e and halide
ions.
Elementa l cadmiu m i s use d primaril y as an electroplated,
corrosio n resistan t coatin g applie d t o iron , steel , brass,
copper , and aluminum. Cadmiu m coating s ar e especiall y usefu l for
protectin g surface s expose d t o corrosiv e marin e environments. An
adde d advantag e of usin g cadmiu m surfac e coating s i s tha t cadmium
i s preferentiall y attacke d by th e corrosiv e environmen t and
protect s th e bas e meta l fro m corrosion. Even i f th e cadmium
coatin g i s slightl y damaged, i t continue s t o provid e protection
t o th e bas e metal.
Elementa l cadmiu m coating s als o hav e a lo w coefficien t of
friction , good electrica l conductivity , ar e easil y soldered , and
hav e lo w volum e corrosio n products. The coating s reduc e galvanic
corrosio n betwee n stee l and othe r metals , particularl y aluminum.
Technicall y and commerciall y importan t cadmiu m compounds
includ e th e oxide , sulfide , selenide , chloride , sulfate , nitrate,
hydroxide , and variou s organi c cadmiu m salt s of fatt y acids , such
as th e palmitat e and stearate. The onl y naturall y occurring
compound i s th e sulfide , CdS (greenockite) , whic h i s an accessory
minera l i n sulfid e ore s of lead , zinc , and coppe r and i n sulfur-
bearin g coals. 1,2
Cadmiu m form s alloy s wit h many metals ; thes e alloy s fall
int o tw o majo r groups: thos e i n whic h cadmiu m help s reduc e the
meltin g poin t and thos e i n whic h cadmiu m improve s mechanical
properties. 1,3,4
3-3

OVERVIEW OF PRODUCTION, USE, AND EMISSIONS
Thi s subsectio n summarize s cadmiu m productio n statistics,
identifie s industria l categorie s usin g cadmium , and provides
estimate s of nationwid e cadmiu m emissions.
Production
Primar y productio n of cadmiu m occur s as a byproduc t of
smeltin g domesti c and importe d zin c concentrate s and of recovery
fro m lea d smelte r baghous e dust. Ther e ar e fou r majo r producing
companie s i n th e U.S. , and thre e produc e th e cadmiu m from
smeltin g zin c concentrates. Onl y one company recover s cadmium
fro m th e lea d smelte r baghous e dust. 5
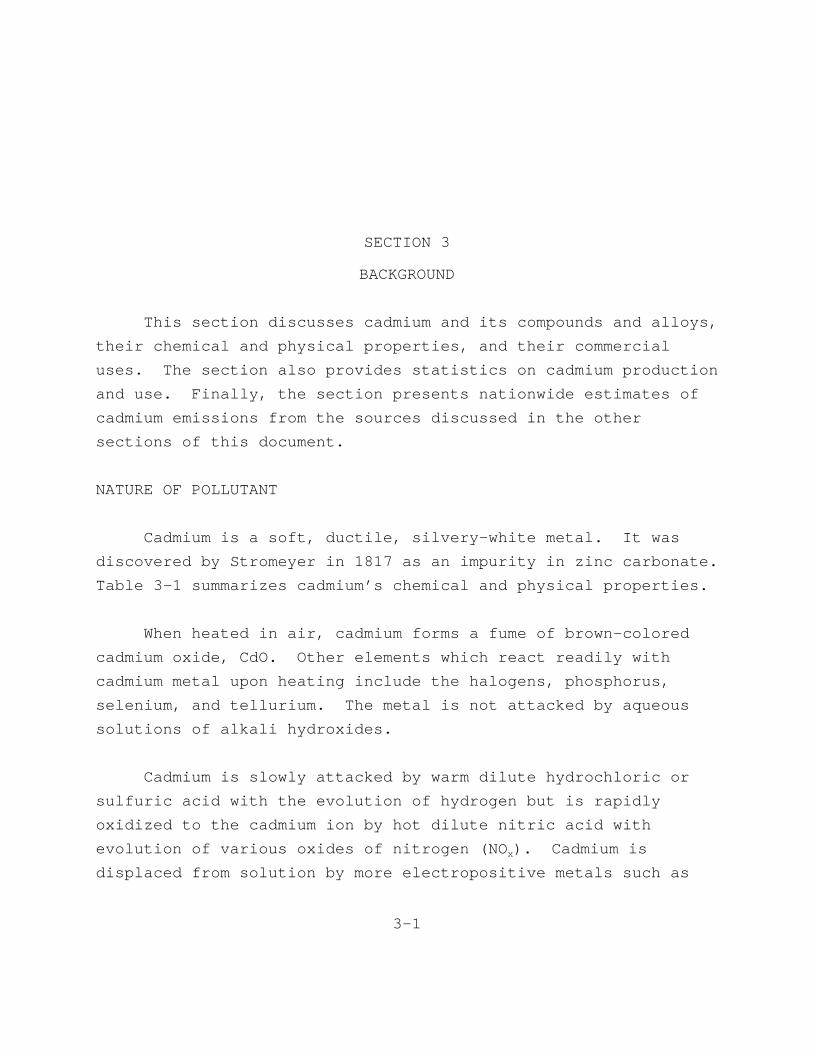
Figur e 3- 1 present s th e 1991 supply-and-deman d diagra m for
cadmium. The informatio n i n thi s figur e was obtaine d fro m the
U.S . Burea u of Mines , Divisio n of Minera l Commodities. 5 As shown
i n Figur e 3-1 , th e tota l U.S . suppl y of cadmiu m was 4,36 8 Mg
(4,80 5 tons). An estimate d 38 percen t of th e tota l supply
resulte d fro m U.S . primar y and secondar y productio n processes,
and 47 percen t was th e resul t of imports. The remaining
15 percen t came fro m produce r stockpiles. Figur e 3- 1 als o shows
tha t of th e tota l 1991 U.S . cadmiu m supply , 74 percen t was used
t o meet domesti c demands, whil e 4 percen t met expor t demands, and
22 percen t supplie d industr y stocks. Export s of cadmiu m ar e in
th e for m of cadmiu m meta l and cadmiu m i n alloys , dross , flue
dust , residues , and scrap. 5
The Burea u of Mine s reporte d U.S . productio n of 329 Mg
(36 2 tons ) of cadmiu m sulfid e (includin g lithopon e and cadmium
sulfoselenide ) and 1,08 9 Mg (1,19 8 tons ) of platin g salts,
cadmiu m oxide , and othe r compounds. The remainin g 1,82 0 Mg
(2,00 2 tons ) of U.S . demand i n 1991 apparentl y was comprise d of
3-4
cadmiu m metal , alloys , and importe d compounds. 5 The 1991 demand
of 3,23 8 Mg (3,56 2 tons ) shown i n Figur e 3- 1 represent s a slight
increas e ove r th e 1990 demand leve l of 3,10 7 Mg (3,41 8 tons) , but
les s tha n th e 1989 demand level s of 4,09 6 Mg (4,50 6 tons).
Use
The Burea u of Mine s estimate s tha t U.S . consumptio n of
cadmiu m and cadmiu m compounds occur s principall y i n th e following
fiv e areas:
1. Batter y production;
2. Coating s and platings;
3. Pigments;
4. Plasti c and syntheti c product s (primaril y as
stabilizers) ; and
5. Alloy s and othe r products.
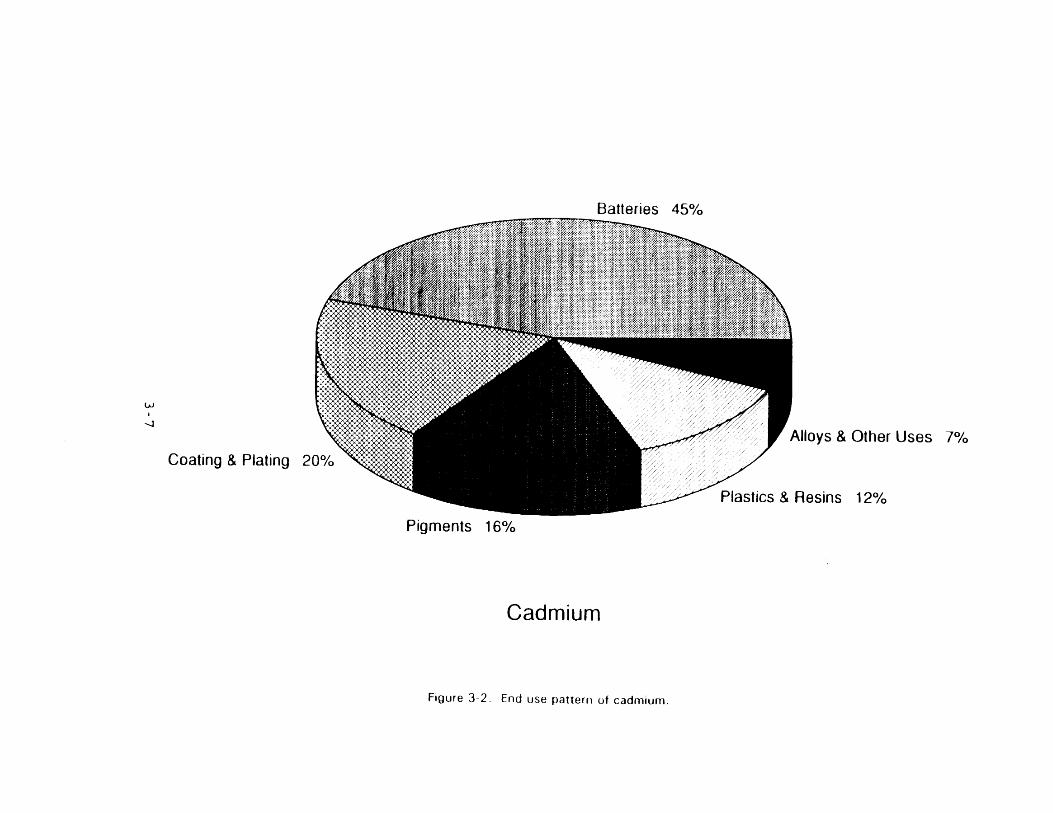
The estimate d percentag e of th e tota l 1991 U.S . cadmium
suppl y tha t was consume d by eac h end-us e categor y i s shown in
Figur e 3-2. Batter y production , at 45 percent , account s fo r the
larges t percentag e of cadmiu m consumptio n (1,45 7 Mg/1,60 3 tons).
Coatin g and platin g operation s wer e th e nex t larges t consume r at
20 percen t (64 8 Mg/71 3 tons). The thir d and fourt h largest
consume r categorie s wer e pigment s at 16 percen t (51 8 Mg/57 0 tons)
and plasti c and syntheti c product s (presume d t o be primarily
stabilizers ) at 12 percen t (38 9 Mg/42 8 tons). The smalles t end-
us e categor y was alloy s and othe r use s at 7 percent
(22 7 Mg/25 0 tons).
Emissions
Two distinc t method s wer e use d t o develo p nationwide
emissio n estimate s fo r specifi c sourc e categories. The first
3-6

metho d involve d developin g source-specifi c emissio n factor s and
applyin g thos e emissio n factor s t o estimate s of nationwid e source
activit y t o calculat e nationwid e mercur y emissio n estimates. The
secon d metho d relie d on extrapolatin g emissio n estimate s fro m the
Toxi c Chemical s Releas e Inventor y Syste m (TRI). 6
Cadmiu m i s emitte d fro m a number of industria l processes
(e.g. , fossi l fue l combustion , wast e incineration , and mineral
processin g operations ) becaus e i t i s presen t as a contaminan t in
th e proces s feed. For thos e processes , an emissio n factor-based
approac h was use d t o estimat e nationwid e cadmiu m emissions. A
comprehensiv e revie w and analysi s of bot h informatio n on cadmium
conten t i n th e fee d materia l and emissio n tes t dat a was
conducted. Primar y source s of information , whic h wer e used
include d ongoin g EPA regulator y developmen t activities,
informatio n tha t i s bein g collecte d by EPA t o develo p toxi c air
pollutan t emissio n factor s i n AP-42 7, and an EPA dat a bas e on
toxi c ai r pollutan t emissio n factors. 8 Upon completio n of the
review , a "bes t typical " emissio n facto r was selected. This
informatio n was combine d wit h readil y availabl e publishe d dat a on
sourc e categor y activit y t o calculat e nationwid e emission
estimates.
The sourc e of emission s informatio n use d fo r source
categorie s tha t involv e cadmiu m us e was th e TRI form , require d by
Sectio n 313 of Titl e II I of th e 1986 Superfun d Amendments and
Reauthorizatio n Act (SARA 313). 6 Thi s sectio n require s owners
and operator s of facilitie s i n Standar d Industria l Classification
(SIC ) code s 20-3 9 tha t manufacture , import , process , or otherwise
us e toxi c chemical s t o repor t annua l ai r release s of these
chemicals. The emission s may t o be base d on sourc e test s (if
available) ; otherwise , emission s may be base d on emission
factors , mass balances , or othe r approaches.
3-8
I n selecte d cases , facilitie s reporte d t o TRI unde r multiple
SI C codes. As a result , i t was difficul t t o assig n emission s to
a specifi c SI C code. I n thos e cases , effort s wer e made to
determin e th e appropriat e SI C code s associate d wit h the
emissions. I f appropriat e SI C code s coul d not be explicitly
identified , th e dat a wer e not use d i n th e analysis.
Tabl e 3- 2 present s a compilatio n of SI C code s tha t hav e been
associate d wit h cadmiu m emissions. 7,8 Thi s tabl e list s th e SIC
code s tha t wer e identifie d as a potentia l sourc e of cadmium
emissions , provide s a descriptio n of th e SI C code , and identifies
othe r emissio n source s tha t do not hav e an assigne d SI C code. 7,8
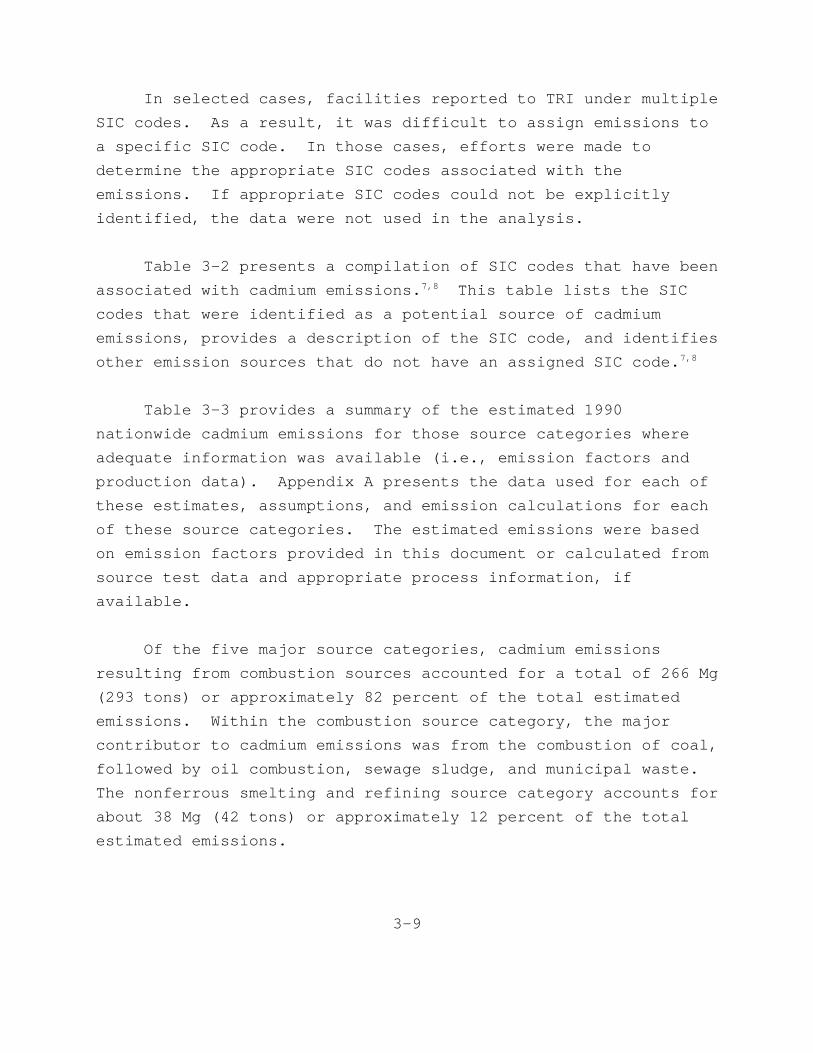
Tabl e 3- 3 provide s a summary of th e estimate d 1990
nationwid e cadmiu m emission s fo r thos e sourc e categorie s where
adequat e informatio n was availabl e (i.e. , emissio n factor s and
productio n data). Appendi x A present s th e dat a use d fo r eac h of
thes e estimates , assumptions , and emissio n calculation s fo r each
of thes e sourc e categories. The estimate d emission s wer e based
on emissio n factor s provide d i n thi s document or calculate d from
sourc e tes t dat a and appropriat e proces s information , if
available.
Of th e fiv e majo r sourc e categories , cadmiu m emissions
resultin g fro m combustio n source s accounte d fo r a tota l of 266 Mg
(29 3 tons ) or approximatel y 82 percen t of th e tota l estimated
emissions. Withi n th e combustio n sourc e category , th e major
contributo r t o cadmiu m emission s was fro m th e combustio n of coal,
followe d by oi l combustion , sewage sludge , and municipa l waste.
The nonferrou s smeltin g and refinin g sourc e categor y account s for
abou t 38 Mg (4 2 tons ) or approximatel y 12 percen t of th e total
estimate d emissions.
3-9

TABLE 3-2. SIC CODES OF INDUSTRIES ASSOCIATED WITH CADMIUM EMISSIONS
SIC code Industry
0711266261126212816
Soil Preparation Services (fertilizer application)Woven Fabric FinishingPulp MillsPaper MillsInorganic Pigments Manufacture
28192851286928742879
Industrial Inorganic Compounds, Not Elsewhere Classified (nec)Paint and Allied ProductsIndustrial Organic Chemicals, nec (plastics stabilizers)Phosphate FertilizersPesticides and Agricultural Chemicals, nec (trace elements)
28952911295130533081
Carbon BlackPetroleum RefiningAsphalt Paving Mixtures and BlocksGaskets, Packing, and Sealing DevicesUnsupported Plastic, Film and Sheet
30833087308932293241
Laminated Plastics, Plate, Sheet, and Profile ShapesCustom Compounding of Purchased Plastics Resins (with Cd pigments)Plastics Products, necPressed and Blown Glass and Glassware, necCement, Hydraulic (dry and wet process)
3264331233133323321
Porcelain Electrical SuppliesBlast Furnaces and Steel MillsFerroalloy ProductionIron and Steel FoundriesGray and Ductile Iron Foundries
333133393341335133563357
Primary Copper Smelting and RefiningPrimary Smelting and Refining of Nonferrous Metals (zinc, lead, cadmium)Secondary Smelting and Refining of Nonferrous Metals (zinc, lead, copper)Copper Rolling, Drawing, and ExtrudingNonferrous Rolling and Drawing, Except Copper and AluminumNonferrous Wire Drawing and Insulating
33623369336533993431
Brass, Bronze, Copper, Copper-Base Alloy FoundriesNonferrous Foundries, necAluminum FoundriesPrimary Metal Products, necEnameled Iron and Metal Sanitary Ware
33403452347134923494
Fabricated Structural Metal Products (diecasting)Bolts, Nuts, Screws, Rivets, and WashersPlating and Polishing (cadmium electroplating)Fluid Power Values and Hose FittingsValves and Pipe Fittings, nec
3-10

TABLE 3-2. (continued)
SIC code Industry
35853691369236943714
Refrigeration and Heating EquipmentStorage BatteriesPrimary Batteries, Dry and WetInternal Combustion Engine Electrical EquipmentMotor Vehicle Parts and Accessories
37213728395249539661
AircraftAircraft Parts and Auxiliary Equipment, necLead Pencils, Crayons, and Artists’ MaterialsRefuse Systems (municipal waste combustion)Space Research and Technology
----------
Coal CombustionGeneral Laboratory UseOil CombustionWood CombustionNatural Gas Combustion
Source: References 7 and 8.
3-11
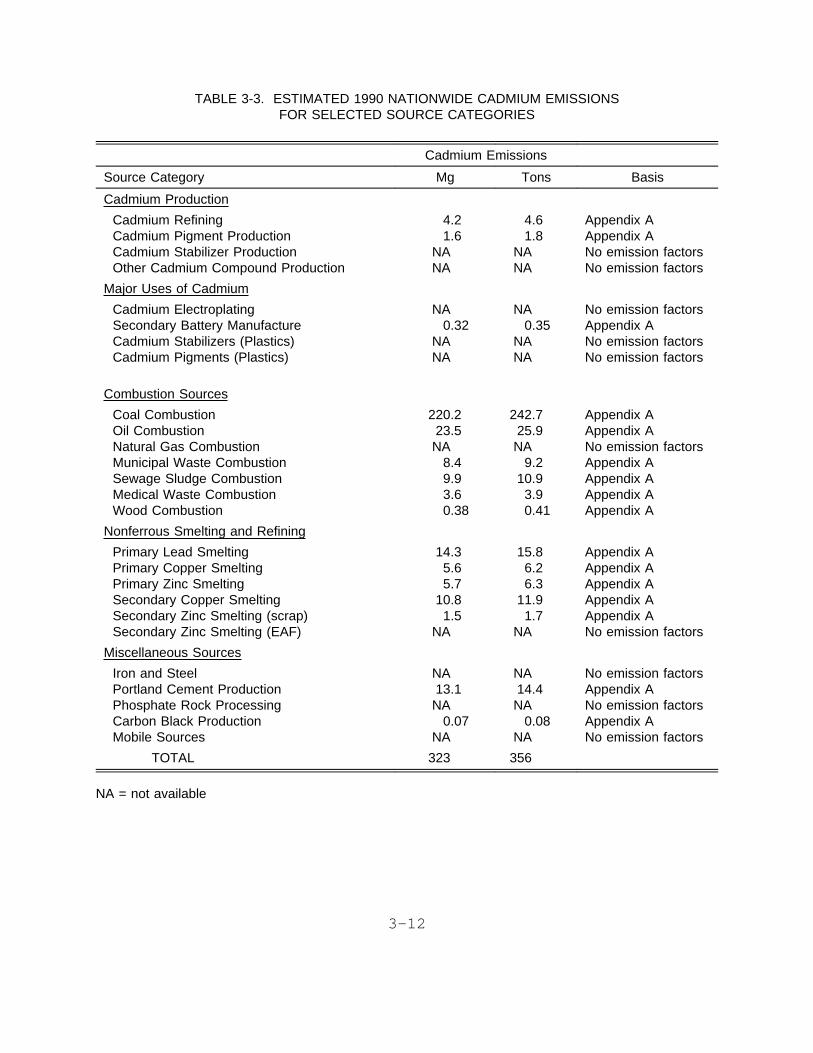
TABLE 3-3. ESTIMATED 1990 NATIONWIDE CADMIUM EMISSIONSFOR SELECTED SOURCE CATEGORIES
Cadmium Emissions
Source Category Mg Tons Basis
Cadmium Production
Cadmium RefiningCadmium Pigment ProductionCadmium Stabilizer ProductionOther Cadmium Compound Production
4.21.6
NANA
4.61.8
NANA
Appendix AAppendix ANo emission factorsNo emission factors
Major Uses of Cadmium
Cadmium ElectroplatingSecondary Battery ManufactureCadmium Stabilizers (Plastics)Cadmium Pigments (Plastics)
NA0.32
NANA
NA0.35
NANA
No emission factorsAppendix ANo emission factorsNo emission factors
Combustion Sources
Coal CombustionOil CombustionNatural Gas CombustionMunicipal Waste CombustionSewage Sludge CombustionMedical Waste CombustionWood Combustion
220.223.5NA
8.49.93.60.38
242.725.9NA
9.210.9
3.90.41
Appendix AAppendix ANo emission factorsAppendix AAppendix AAppendix AAppendix A
Nonferrous Smelting and Refining
Primary Lead SmeltingPrimary Copper SmeltingPrimary Zinc SmeltingSecondary Copper SmeltingSecondary Zinc Smelting (scrap)Secondary Zinc Smelting (EAF)
14.35.65.7
10.81.5
NA
15.86.26.3
11.91.7
NA
Appendix AAppendix AAppendix AAppendix AAppendix ANo emission factors
Miscellaneous Sources
Iron and SteelPortland Cement ProductionPhosphate Rock ProcessingCarbon Black ProductionMobile Sources
NA13.1NA
0.07NA
NA14.4NA
0.08NA
No emission factorsAppendix ANo emission factorsAppendix ANo emission factors
TOTAL 323 356
NA = not available
3-12

REFERENCES
1. Hollander , M. L. , and S. C. Carapella , Jr. Cadmiu m andCadmiu m Alloys. (In ) Kirk-Othme r Encyclopedi a of ChemicalTechnology. Volum e 4. M. Grayson , ed. A Wiley-IntersciencePublication , Joh n Wile y and Sons, New York , NY. 1978.
2. Parker , P.D. Cadmiu m Compounds. (In ) Kirk-OthmerEncyclopedi a of Chemica l Technology. Volum e 4. 3r d ed.M. Grayson , ed. A Wiley-Interscienc e Publication , Joh n Wileyand Sons, New York , NY. 1978.
3. Cadmiu m Association/Cadmiu m Council. Technica l Note s onCadmium. Cadmiu m i n Alloys. Cadmiu m Association , London;Cadmiu m Council , New York , NY. 1978.
4. Cadmiu m Association. Cadmium. The Qualit y Metal. CadmiumAssociation , London. undated.
5. Llewellyn , T.O. Cadmiu m i n 1991. Branc h of IndustrialMinerals , Divisio n of Minera l Commodities , Burea u of Mines,U.S . Departmen t of th e Interior , Washington , DC.Januar y 1993.
6. U. S. Environmenta l Protectio n Agency. 1990 Toxi c ReleaseInventory , Offic e of Toxi c Substances. Washington , DC.Januar y 1993.
7. U. S. Environmenta l Protectio n Agency. Compilatio n of AirPollutio n Emissio n Factors , AP-42 , Fourt h Edition,Supplemen t E. U. S. Environmenta l Protectio n Agency,Researc h Triangl e Park , NC. Octobe r 1992.
8. XATEF. Crosswalk/Ai r Toxi c Emissio n Facto r Dat a Base.Versio n 2 fo r 1992 update. Offic e of Ai r Qualit y Planningand Standards , U. S. Environmenta l Protectio n Agency,Researc h Triangl e Park , NC. Septembe r 1992.
3-13
SECTION 4
EMISSIONS FROM CADMIUM PRODUCTION
Thi s sectio n describe s th e potentia l source s of cadmium
emission s fro m th e productio n of cadmiu m and cadmiu m compounds.
The followin g subsections , coverin g cadmiu m refinin g and cadmium
oxid e production , cadmiu m pigment s production , cadmiu m stabilizer
production , and othe r cadmiu m compounds , presen t process
descriptions , identif y potentia l cadmiu m emissio n source s and
controls , and quantif y cadmiu m emissions.
CADMIUM REFININ G AND CADMIUM OXIDE PRODUCTION
Cadmiu m mineral s do not occu r i n concentration s and
quantitie s sufficien t enoug h t o justif y minin g the m i n thei r own
right , but the y ar e presen t i n most zin c ore s as cadmiu m sulfide
(th e minera l greenockite ) and ar e concentrate d durin g zin c ore
processing. 1 The resultin g zin c or e concentrate s fro m ore
processin g contai n fro m 0. 1 t o 0. 8 percen t cadmiu m by weight. 1
Cadmiu m meta l i s recovere d as either : (1 ) a byproduc t of the
extractio n and refinin g of zin c meta l fro m zin c sulfid e ore
concentrate s i n electrolyti c zin c smelters ; or (2 ) th e main
produc t i n th e processin g of lea d blas t furnac e dusts. Cadmium
oxid e i s produce d i n a secondar y proces s usin g cadmiu m meta l as
th e fee d material.
Tabl e 4- 1 list s th e cadmiu m meta l and cadmiu m oxid e producers
alon g wit h thei r locations , proces s fee d materials , and processes
4-1
TABLE 4-1. CADMIUM AND CADMIUM OXIDEPRODUCERS
Cadmium Refining Plant Location Feed Material Process
Cadmium Metal
ASARCO, Inc. Denver, CO Crude CdO in blastfurnace baghouse dustfrom East Helena leadsmelter.
Electromotive Cd
Big River Zinc Corp. Sauget, IL Zinc roaster calcine. Electromotive Cd
Jersey Miniere Zinc (JMZ) Clarksville, TN Zinc roaster calcine. Electrolytic Cd
Zinc Corp. of America (ZCA) Bartlesville, OK Zinc roaster calcine.a Electromotive Cd
Cadmium Oxide
ASARCO, Inc. Denver, CO Cd metal. Air oxidation fromretort furnace
Big River Zinc Corp. Sauget, IL Cd metal. Air oxidation fromretort furnace
Proctor and Gamble Co. Phillipsburg, NJ Not available. Not available
Witco Chemical Co. Brooklyn, NY Cd metal. Air oxidation fromretort furnace
aZCA also has an electrothermic primary zinc smelter in Monaca, Pennsylvania. That smelter also uses a crude zinc calcinerecovered from steelmaking electric arc furnace (EAF) dusts. The calcine from the EAF dusts also contains cadmium.
Source: References 1-3
4-2
used. Currently , ther e ar e fou r plant s tha t produc e cadmium
meta l i n th e Unite d States ; tw o of thes e fou r plant s als o produce
cadmiu m oxide. Thre e of th e fou r cadmiu m meta l refinin g plants
ar e colocate d at electrolyti c zin c smelter s and include : Big
Rive r Zin c (BRZ) Corporatio n locate d i n Sauget , Illinois ; Jersey
Minier e Zin c (JMZ) locate d i n Clarksville , Tennessee ; and Zinc
Corporatio n of Americ a (ZCA) locate d i n Bartlesville , Oklahoma.
The fourt h cadmiu m meta l refinin g plant , ASARCO, Inc. , i s located
i n Denver , Colorad o and processe s lea d blas t furnac e dust.
Cadmiu m oxid e i s produce d at bot h BRZ and ASARCO. (Anothe r ZCA
primar y zin c smelter , i n Monaca, Pennsylvania , does not hav e an
associate d cadmiu m refinery). 2
Referenc e 3 list s Procto r and Gamble Co. as a produce r of
cadmiu m oxide. However , at th e presen t time , i t i s not clear
whethe r cadmiu m oxid e i s manufacture d at thi s locatio n or whether
th e company onl y distribute s cadmiu m oxid e fro m thi s location.
Cadmiu m oxid e i s als o produce d at Witc o Chemica l Company located
i n Brooklyn , New York. Thi s plan t produce s cadmiu m oxid e fo r its
own us e i n th e productio n of cadmiu m stabilizers.
Proces s Description 1
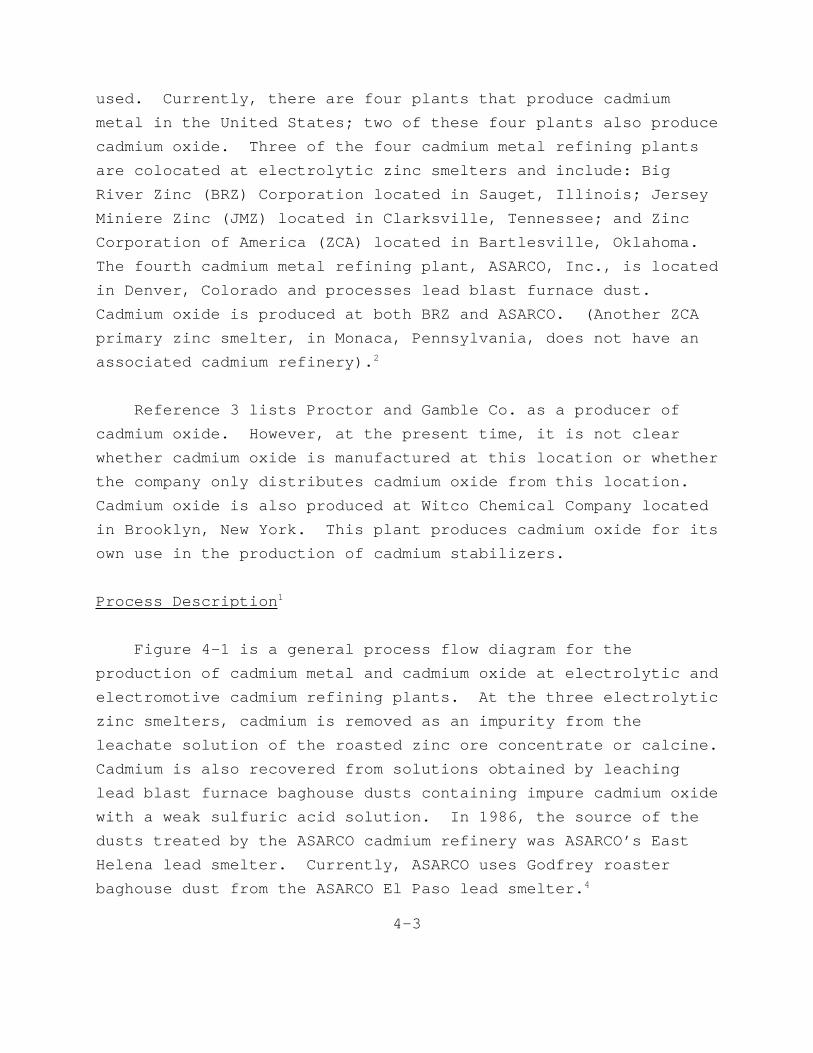
Figur e 4- 1 i s a genera l proces s flo w diagra m fo r the
productio n of cadmiu m meta l and cadmiu m oxid e at electrolyti c and
electromotiv e cadmiu m refinin g plants. At th e thre e electrolytic
zin c smelters , cadmiu m i s remove d as an impurit y fro m the
leachat e solutio n of th e roaste d zin c or e concentrat e or calcine.
Cadmiu m i s als o recovere d fro m solution s obtaine d by leaching
lea d blas t furnac e baghous e dust s containin g impur e cadmiu m oxide
wit h a weak sulfuri c aci d solution. I n 1986 , th e sourc e of the
dust s treate d by th e ASARCO cadmiu m refiner y was ASARCO’s East
Helen a lea d smelter. Currently , ASARCO use s Godfre y roaster
baghous e dus t fro m th e ASARCO El Paso lea d smelter. 4
4-3
The cadmium-bearin g fee d (Strea m A) i s leache d or dissolved
i n sulfuri c aci d i n Ste p 1. Next , th e sulfuri c aci d solution
(Strea m B) i s treate d by variou s solutio n purificatio n steps
(Ste p 2). The purifie d solutio n (Strea m C) i s treate d wit h zinc
dus t t o precipitat e a metalli c cadmiu m "sponge " (Strea m D) (Step
3). The cadmiu m spong e i s redissolve d i n sulfuri c acid ; the
solutio n undergoe s additiona l purificatio n step s t o produc e a
purifie d solutio n (Strea m E or E’ ; Ste p 4). The JMZ cadmium
refiner y i n Clarksville , Tennesse e use s th e electrolyti c process
t o recove r metalli c cadmiu m fro m th e purifie d cadmiu m sulfate
solutio n (Strea m E). The othe r cadmiu m refinerie s us e the
electromotiv e process. 3
I n th e electrolyti c cadmiu m refinin g proces s (Ste p 5),
electrolysi s of th e purifie d cadmiu m sulfat e solutio n (Strea m E)
deposit s cadmiu m on cathodes. The cadmiu m meta l (Strea m F) is
strippe d fro m th e electrode s and transferre d t o a cadmiu m melting
furnac e (Ste p 7) . The molte n cadmiu m (Strea m G) i s cas t into
ball s and sheet s fo r cadmiu m electroplatin g anode s or cas t into
slabs , ingots , and stick s fo r alloying , pigmen t production , and
cadmiu m oxid e productio n (Ste p 8).
I n th e electromotiv e cadmiu m refinin g process , zin c dus t is
adde d t o th e purifie d cadmiu m sulfat e solutio n (Strea m E’ ) to
displac e cadmiu m as "sponge " meta l (Strea m F) i n Ste p 6. The
spong e i s briquetted , melte d (Ste p 7) , and cas t (Ste p 8) into
product s fo r sal e or furthe r processing.
JMZ and ZCA produc e onl y cas t cadmiu m meta l products. ASARCO
and BRZ als o produc e powdere d cadmiu m metal , cadmiu m oxide , or
both. Cadmiu m fro m th e meltin g furnac e (Strea m G) i s transferred
t o a retor t furnac e (Ste p 9 or 11). I n powdere d cadmium
productio n (Ste p 9) , cadmiu m (Strea m G) i s route d t o a sealed
4-5

retor t tha t has been purge d of oxyge n wit h carbo n dioxide.
Cadmiu m vaporize s and condense s as a powder (Strea m I ) during
retortin g i n th e absenc e of oxygen. The condense d powder is
package d i n Ste p 10. I n cadmiu m oxid e productio n (Ste p 11),
retortin g i n ai r oxidize s cadmiu m t o cadmiu m oxide , whic h is
collecte d i n a baghous e (Ste p 12) and package d (Ste p 13).
Emission s and Controls
Durin g cadmiu m and cadmiu m oxid e production , cadmiu m is
emitte d fro m meltin g furnace s (Ste p 7) , retortin g (Step s 9 and
11) , castin g and tappin g (Ste p 8) , and packagin g (Step s 10
and 13). Chargin g th e leac h tank s fo r Ste p 1 wit h lea d blast
furnac e dust s (Strea m A) and solution s heatin g tank s (Ste p 4) at
th e Denver refiner y wer e additiona l sources.
I n 1986 , th e EPA inventorie d cadmiu m emissio n source s at
cadmiu m refinin g plant s base d on Sectio n 114 responses , emission
tes t reports , tri p reports , and a previou s cadmiu m sourc e survey
publishe d i n 1985. 5 Initiall y generate d emission s estimate s were
revise d base d on industr y comments. Tabl e 4- 2 shows th e cadmium
emissio n rate s develope d i n 1986 fo r norma l and maximum operation
at thre e of th e fou r cadmiu m refinin g plants. Revise d estimates
fo r norma l operation s usin g th e same genera l emissio n estimation
methodolog y at th e BRZ plan t wer e made i n 1989 6 and ar e presented
i n th e tabl e i n plac e of th e 1986 data. However , th e dat a shown
fo r maximum operatio n ar e fro m th e 1986 study. Revise d emission
estimate s fo r th e ASARCO plan t wer e develope d i n 1992 fo r the
Stat e of Colorad o by JACA Corporation. 4 The ASARCO facilit y had
undergon e substantia l modification s sinc e th e 1986 study. The
JACA stud y develope d emissio n estimate s fo r maximum operation
only. Thes e dat a ar e reporte d i n Tabl e 4-2. Emissio n estimates
fo r norma l operatio n fro m th e 1986 stud y ar e not reporte d in
Tabl e 4- 2 becaus e of th e proces s and contro l modifications
4-6
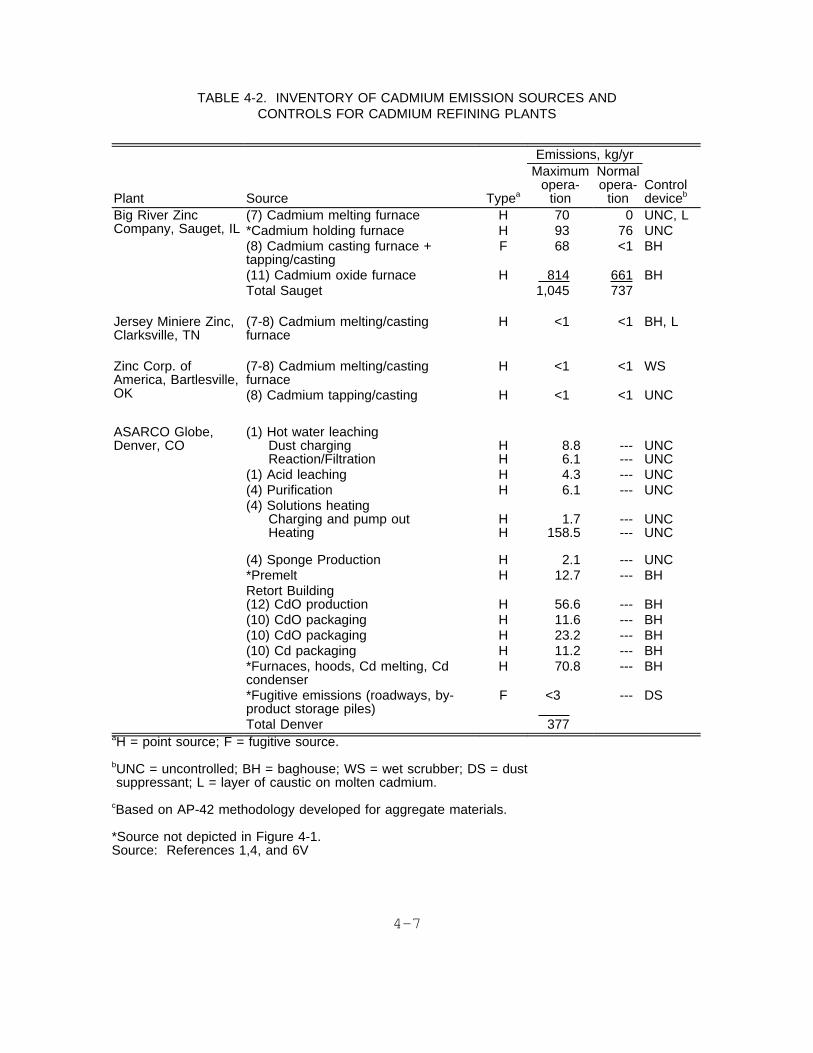
TABLE 4-2. INVENTORY OF CADMIUM EMISSION SOURCES ANDCONTROLS FOR CADMIUM REFINING PLANTS
Emissions, kg/yr
Plant Source Typea
Maximumopera-
tion
Normalopera-
tionControldeviceb
Big River ZincCompany, Sauget, IL
(7) Cadmium melting furnace H 70 0 UNC, L*Cadmium holding furnace H 93 76 UNC(8) Cadmium casting furnace +tapping/casting
F 68 <1 BH
(11) Cadmium oxide furnace H 814 661 BHTotal Sauget 1,045 737
Jersey Miniere Zinc,Clarksville, TN
(7-8) Cadmium melting/castingfurnace
H <1 <1 BH, L
Zinc Corp. ofAmerica, Bartlesville,OK
(7-8) Cadmium melting/castingfurnace
H <1 <1 WS
(8) Cadmium tapping/casting H <1 <1 UNC
ASARCO Globe,Denver, CO
(1) Hot water leachingDust chargingReaction/Filtration
HH
8.86.1
------
UNCUNC
(1) Acid leaching H 4.3 --- UNC(4) Purification H 6.1 --- UNC(4) Solutions heating
Charging and pump outHeating
(4) Sponge Production
HH
H
1.7158.5
2.1
------
---
UNCUNC
UNC*Premelt H 12.7 --- BHRetort Building(12) CdO production H 56.6 --- BH(10) CdO packaging H 11.6 --- BH(10) CdO packaging H 23.2 --- BH(10) Cd packaging H 11.2 --- BH*Furnaces, hoods, Cd melting, Cdcondenser
H 70.8 --- BH
*Fugitive emissions (roadways, by-product storage piles)
F <3 --- DS
Total Denver 377aH = point source; F = fugitive source.
bUNC = uncontrolled; BH = baghouse; WS = wet scrubber; DS = dustsuppressant; L = layer of caustic on molten cadmium.
cBased on AP-42 methodology developed for aggregate materials.
*Source not depicted in Figure 4-1.Source: References 1,4, and 6V
4-7

implemente d at ASARCO sinc e then , becaus e of th e us e of new
emissio n tes t dat a fro m test s conducte d sinc e 1986 , and because
th e emissio n estimatio n methodologie s use d i n 1986 versu s the
1992 JACA stud y ar e substantiall y different. The emission
source s ar e numbere d usin g th e same numberin g scheme as in
Figur e 4-1.
Cadmiu m meltin g furnace s and cadmiu m retor t furnace s were
identifie d as th e tw o type s of proces s emissio n source s at
cadmiu m refinin g plants. Cadmiu m meltin g furnace s ar e use d to
mel t eithe r cadmiu m spong e or sheets. 1 A laye r of causti c on the
molte n meta l surfac e i s use d t o preven t oxidatio n of th e metal,
t o hel p remov e impurities , and t o provid e some contro l of
particulat e matte r at thre e cadmiu m refinin g plants. 1 The other
plan t (JMZ) use s a laye r of resi n t o achiev e th e same results. 1
Proces s cadmiu m emission s fro m th e meltin g furnac e ar e controlled
by a baghous e at JMZ and by a wet scrubbe r at ZCA. 1 A hooding
syste m duct s fugitiv e emission s fro m th e charging/drossin g port
and fro m th e tapping/castin g are a t o th e baghous e at JMZ. 1 At
ASARCO, force d ventilatio n i s i n plac e durin g furnac e operation
and durin g chargin g and tapping/casting. 1 Sinc e th e 1986 study,
BRZ made severa l improvement s i n thei r cadmiu m refinin g process.
Among thes e improvements , was th e ductin g of th e cadmium
tapping/castin g are a of th e cadmiu m meltin g furnac e t o the
existin g lea d anod e furnaces ’ proces s fugitiv e emissions
baghouse. 6
Cadmiu m retor t furnace s ar e use d onl y at BRZ and ASARCO in
th e productio n of cadmiu m oxid e and/o r cadmiu m metal. 1 Emissions
fro m thes e source s wer e estimate d usin g emissio n tes t dat a from
thes e plants. 1 I n Octobe r 1988 , BRZ als o made improvement s to
th e cadmiu m oxid e produc t collectio n system. 6 The changes
include d a new produc t collectio n baghouse , a new ventilation
syste m and fugitiv e emission s baghouse , and an enclose d and
automate d cadmiu m oxid e packagin g operation. Whil e thes e changes
4-8
enhance d th e operatio n of th e cadmiu m oxid e system , i t was
assumed tha t no reduction s i n emission s wer e realized. The new
baghous e has th e same operatin g parameter s as th e one tha t was
replaced. Therefore , th e tes t conducte d i n 1986 was still
considere d t o be vali d and was use d t o develo p emission
estimates. Additionally , fugitiv e emission s fro m cadmiu m oxide
productio n and packagin g had been assumed t o be negligibl e in
1986 becaus e at tha t time , th e cadmiu m oxid e productio n and
packagin g operation s wer e house d i n a separat e roo m withi n the
cadmiu m building ; th e new ventilatio n syste m probabl y improves
workin g condition s insid e th e cadmiu m oxid e productio n and
packagin g areas. ASARCO has als o improve d operation s at the
Denver locatio n wit h th e additio n of a baghous e t o control
emission s fro m premel t operation s and anothe r baghous e t o control
fugitiv e emission s fro m th e Cd furnaces , hoods , Cd melting
operations , and th e Cd condense r i n th e retor t department. 4
Becaus e thre e of th e fou r cadmiu m refinerie s ar e operate d in
conjunctio n wit h zin c smelters , th e annua l emission s reporte d by
thes e plant s i n th e 1990 Toxi c Chemical s Releas e Inventor y (see
Tabl e 4-3 ) compris e th e su m of bot h sources. 7 The 860 kg
(1,89 6 lb ) cadmiu m emissio n reporte d by Bi g Rive r Zinc
Corporatio n i s slightl y more tha n th e su m of th e estimate s in
Referenc e 4 fo r th e cadmiu m refinin g operation s (73 7 kg ) and
primar y zin c smeltin g (10 0 kg). The JMZ plan t reporte d 227 kg
(50 0 lb ) cadmiu m emission s i n 1990 compare d t o th e 1986 estimates
of <1 kg fo r th e cadmiu m refiner y and 28 kg fo r th e zin c smelter.
The ZCA plan t reporte d a tota l of 2,93 6 kg (6,47 2 lb ) cadmium
emitte d i n 1990 , wherea s th e 1986 estimate s wer e <1 kg fo r the
refiner y and 12 kg fo r th e smelter. The ASARCO cadmiu m refining
plan t reporte d 180 kg (39 6 lb ) cadmiu m emission s (17 7 kg [39 1 lb]
fro m poin t sources ) i n 1990. 7 The difference s betwee n these
estimate s (199 0 TRI and reference s 1, 4, and 6) ar e likel y the
resul t of difference s i n productio n and i n th e assumption s used
4-9

TABLE 4-3. PRIMARY ZINC AND CADMIUM PRODUCERS REPORTING CADMIUMEMISSIONS IN THE 1990 TOXIC CHEMICALS RELEASE INVENTORY
Emissions, kg (lb)Monitoring
DataPlant Nonpoint Point Total
Asarco Inc, Globe Plant,Denver, Colorado(Cadmium refinery from lead smelterdusts)
2(5)
177(391)
180(396)
no
Big River Zinc Corp.,Sauget, Illinois
113(250)
747(1,646)
860(1,896)
no
Jersey Miniere Zinc,Clarksville, Tennessee
113(250)
113(250)
226(500)
yes(point)
Zinc Corporation of America,Bartlesville, Oklahoma
2(4)
2,934(6,468)
2,936(6,472)
no
TOTAL 230(509)
3,971(8,755)
4,202(9,264)
aCurrently not a cadmium refiner.
Source: Reference 7.
4-10
t o develo p th e emissio n estimates. For example , at BRZ, the
plan t personne l stil l us e th e emissio n factor s develope d fro m the
1986 stud y t o develo p thei r emissio n estimate s and multipl y these
factor s by th e productio n level s fo r th e particula r year. Also,
becaus e th e level s of cadmiu m i n th e zin c sulfid e or e residues
var y by almos t an orde r of magnitude , th e resultin g emission
estimate s coul d als o var y significantly.
Tabl e 4- 4 provide s emissio n factor s fo r th e cadmiu m refining
plan t usin g lea d blas t furnac e dusts. Thes e emissio n factors
wer e develope d fro m th e 1992 JACA stud y by usin g th e maximum
annua l emission s fro m Tabl e 4- 2 and dividin g by th e maximum
productio n rat e dat a as note d i n th e footnote s i n Tabl e 4-4.
Emissio n factor s fo r th e cadmiu m meta l and cadmiu m oxide
productio n processe s ar e presente d i n Tabl e 4-5. Thes e emission
factor s wer e develope d base d on emissio n test s conducte d at two
of th e cadmiu m refinin g plants.
CADMIUM PIGMENTS PRODUCTION
Cadmiu m i s emitte d durin g th e manufactur e of cadmium
pigments. Thi s subsectio n wil l describ e th e manufacturing
process , emissions , and controls. Most of th e informatio n herein
i s fro m a 1988 Emissio n Standard s Divisio n repor t on cadmium
emission s fro m pigmen t and stabilize r manufactur e and th e 1985
Backgroun d Informatio n Document fo r Cadmiu m Emissio n Sources. 5,8
Cadmiu m pigment s ar e stabl e inorgani c colorin g agent s that
provid e a rang e of brillian t shade s of yellow , orange , red , and
maroon. The pigment s ar e base d on cadmiu m sulfid e (CdS) , which
yield s a golde n yello w pigment. Partia l substitutio n of cadmium
i n th e crysta l lattic e by zin c or mercury , and of sulfu r by
selenium , produce s a serie s of intercrystallin e compounds making
4-11
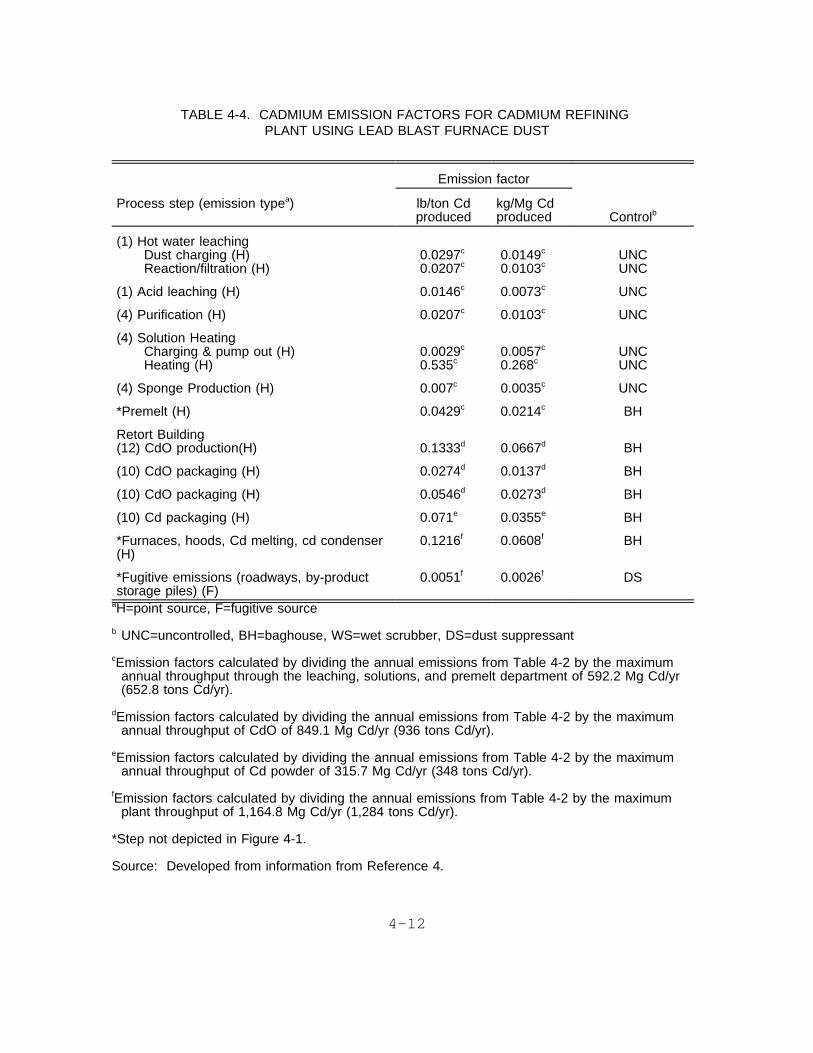
TABLE 4-4. CADMIUM EMISSION FACTORS FOR CADMIUM REFININGPLANT USING LEAD BLAST FURNACE DUST
Emission factor
Process step (emission typea) lb/ton Cdproduced
kg/Mg Cdproduced Controlb
(1) Hot water leachingDust charging (H)Reaction/filtration (H)
0.0297c
0.0207c0.0149c
0.0103cUNCUNC
(1) Acid leaching (H) 0.0146c 0.0073c UNC
(4) Purification (H) 0.0207c 0.0103c UNC
(4) Solution HeatingCharging & pump out (H)Heating (H)
0.0029c
0.535c0.0057c
0.268cUNCUNC
(4) Sponge Production (H) 0.007c 0.0035c UNC
*Premelt (H) 0.0429c 0.0214c BH
Retort Building(12) CdO production(H) 0.1333d 0.0667d BH
(10) CdO packaging (H) 0.0274d 0.0137d BH
(10) CdO packaging (H) 0.0546d 0.0273d BH
(10) Cd packaging (H) 0.071e 0.0355e BH
*Furnaces, hoods, Cd melting, cd condenser(H)
0.1216f 0.0608f BH
*Fugitive emissions (roadways, by-productstorage piles) (F)
0.0051f 0.0026f DS
aH=point source, F=fugitive source
b UNC=uncontrolled, BH=baghouse, WS=wet scrubber, DS=dust suppressant
cEmission factors calculated by dividing the annual emissions from Table 4-2 by the maximumannual throughput through the leaching, solutions, and premelt department of 592.2 Mg Cd/yr(652.8 tons Cd/yr).
dEmission factors calculated by dividing the annual emissions from Table 4-2 by the maximumannual throughput of CdO of 849.1 Mg Cd/yr (936 tons Cd/yr).
eEmission factors calculated by dividing the annual emissions from Table 4-2 by the maximumannual throughput of Cd powder of 315.7 Mg Cd/yr (348 tons Cd/yr).
fEmission factors calculated by dividing the annual emissions from Table 4-2 by the maximumplant throughput of 1,164.8 Mg Cd/yr (1,284 tons Cd/yr).
*Step not depicted in Figure 4-1.
Source: Developed from information from Reference 4.
4-12
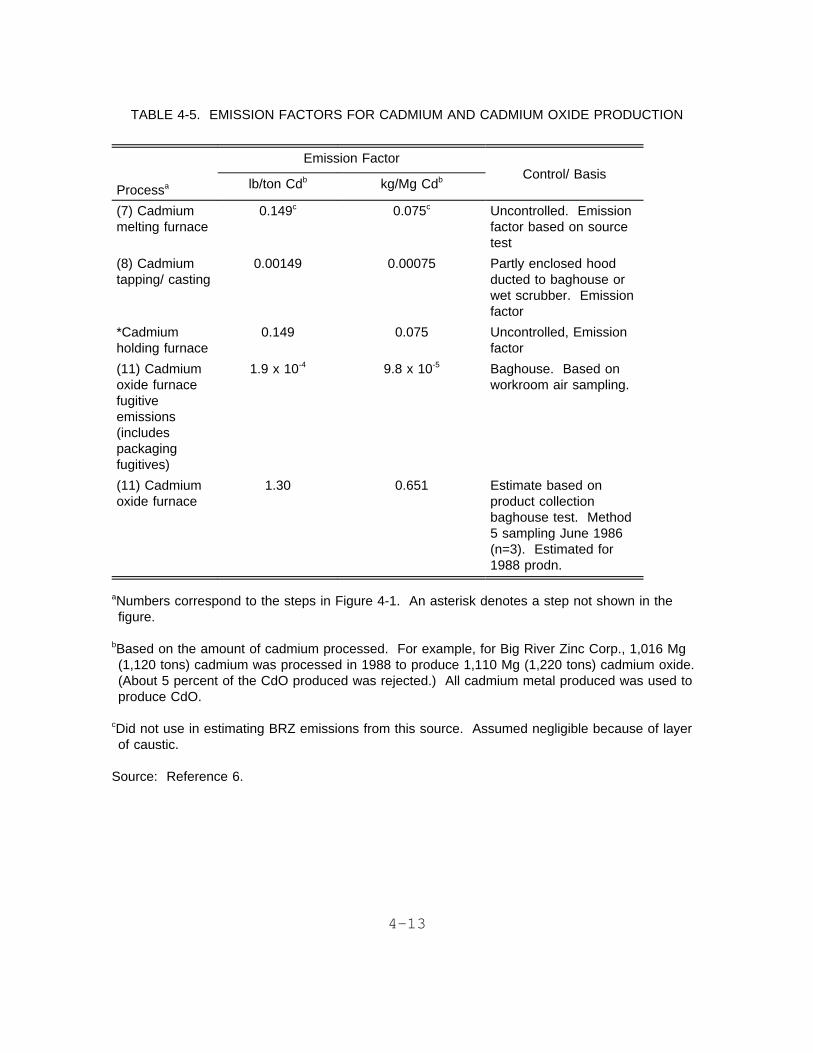
TABLE 4-5. EMISSION FACTORS FOR CADMIUM AND CADMIUM OXIDE PRODUCTION
Processa
Emission FactorControl/ Basis
lb/ton Cdb kg/Mg Cdb
(7) Cadmiummelting furnace
0.149c 0.075c Uncontrolled. Emissionfactor based on sourcetest
(8) Cadmiumtapping/ casting
0.00149 0.00075 Partly enclosed hoodducted to baghouse orwet scrubber. Emissionfactor
*Cadmiumholding furnace
0.149 0.075 Uncontrolled, Emissionfactor
(11) Cadmiumoxide furnacefugitiveemissions(includespackagingfugitives)
1.9 x 10⁻⁴ 9.8 x 10⁻⁵ Baghouse. Based onworkroom air sampling.
(11) Cadmiumoxide furnace
1.30 0.651 Estimate based onproduct collectionbaghouse test. Method5 sampling June 1986(n=3). Estimated for1988 prodn.
aNumbers correspond to the steps in Figure 4-1. An asterisk denotes a step not shown in thefigure.
bBased on the amount of cadmium processed. For example, for Big River Zinc Corp., 1,016 Mg(1,120 tons) cadmium was processed in 1988 to produce 1,110 Mg (1,220 tons) cadmium oxide.(About 5 percent of the CdO produced was rejected.) All cadmium metal produced was used toproduce CdO.
cDid not use in estimating BRZ emissions from this source. Assumed negligible because of layerof caustic.
Source: Reference 6.
4-13

up th e intermediat e color s i n th e lemon-yello w t o maroo n rang e of
colors. Tabl e 4- 6 list s th e most common cadmiu m pigments
produce d i n 1991. Tabl e 4- 7 list s th e curren t cadmiu m pigment
producers.
Cadmiu m pigment s hav e excellen t therma l stabilit y whic h makes
the m essentia l fo r us e i n high-temperatur e processing , or where
hig h servic e temperature s ar e encountered. Most cadmiu m pigments
ar e use d i n plastics , but the y ar e als o use d i n paints , coatings,
ceramics , glasses , and t o a lesse r degre e i n rubber , paper , and
inks. 9
Ther e ar e tw o basi c type s of cadmiu m pigment s produce d i n the
Unite d States: pur e pigments , base d on cadmiu m sulfid e or
cadmiu m selenide ; and lithophon e pigments , whic h ar e pur e cadmium
pigment s tha t hav e been dilute d wit h bariu m sulfate. The pure
pigment s ar e use d undilute d when lo w pigmen t loading s ar e desired
as i n colo r concentrate s fo r plastics. Lithopone s hav e only
one-hal f th e tintin g power of pur e pigments , but when high
pigmen t loading s ca n be tolerated , lithopone s offe r tinting
strengt h and hidin g power comparable , on an equa l cos t basis,
wit h th e pur e pigments. Thei r greates t us e i s i n th e colorin g of
plastic s wit h dr y blends. 8
Proces s Description 5,8,9
Cadmiu m pigmen t productio n i s base d on a generi c process,
illustrate d i n Figur e 4-2. However , cadmiu m pigment
manufacturer s hav e develope d differin g proprietar y procedure s for
creatin g pigments , wit h specifi c hues and properties. These
proprietar y procedure s includ e varyin g type s and percentage s of
ingredients , alterin g th e calcinatio n time , and addin g or
deletin g filtration , washing , drying , blending , or grinding
operations.
4-14
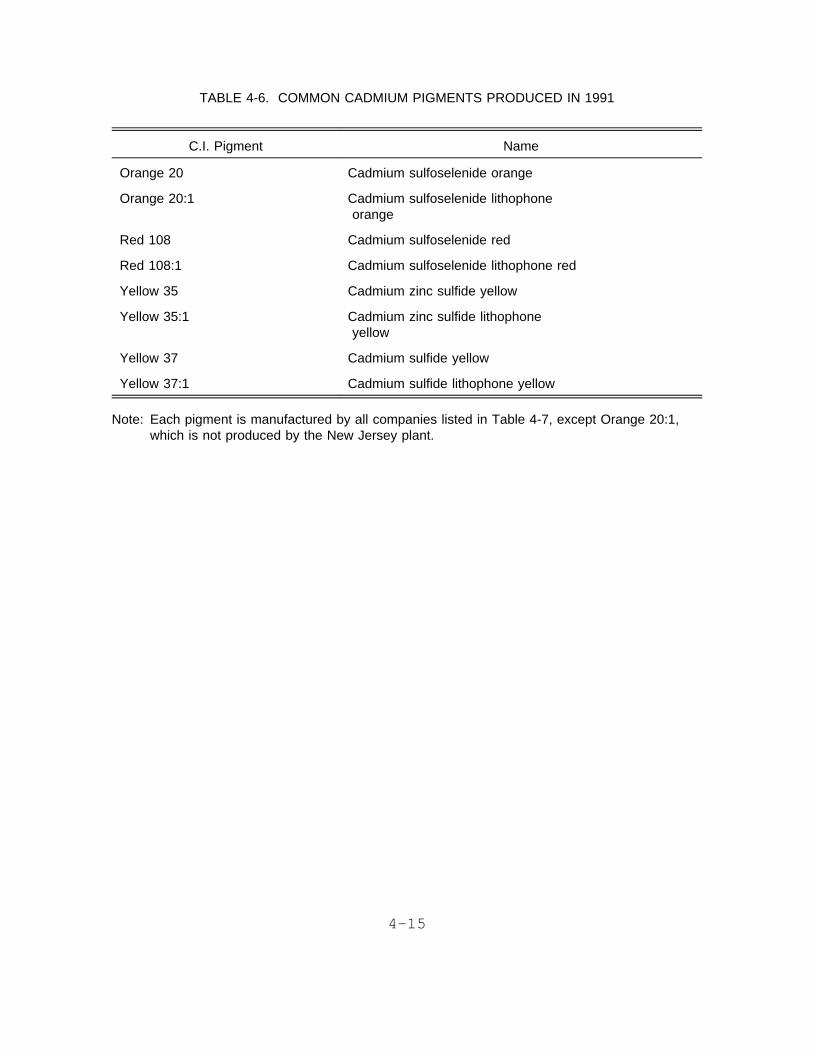
TABLE 4-6. COMMON CADMIUM PIGMENTS PRODUCED IN 1991
C.I. Pigment Name
Orange 20 Cadmium sulfoselenide orange
Orange 20:1 Cadmium sulfoselenide lithophoneorange
Red 108 Cadmium sulfoselenide red
Red 108:1 Cadmium sulfoselenide lithophone red
Yellow 35 Cadmium zinc sulfide yellow
Yellow 35:1 Cadmium zinc sulfide lithophoneyellow
Yellow 37 Cadmium sulfide yellow
Yellow 37:1 Cadmium sulfide lithophone yellow
Note: Each pigment is manufactured by all companies listed in Table 4-7, except Orange 20:1,which is not produced by the New Jersey plant.
4-15

TABLE 4-7. CURRENT CADMIUM PIGMENT PRODUCERS
Company name Location
Engelhard Corporation,Pigments and Additives Division(Formerly Harshaw/Filtrol Partnership)
Louisville, KY
Ferro Corporation, Coatings, Colors,and Electronic Materials Group, Color Division
Cleveland, OH
Hanson Industries, SCM Chemicals, Inc.,Subsidiary
Baltimore, MD
Universal Foods Corporation, Warner-Jenkinson Company,H.K. Color Group,(Formerly H. Kohnstamm and Company)
South Plainfield, NJ
Source: Reference 3.
4-16
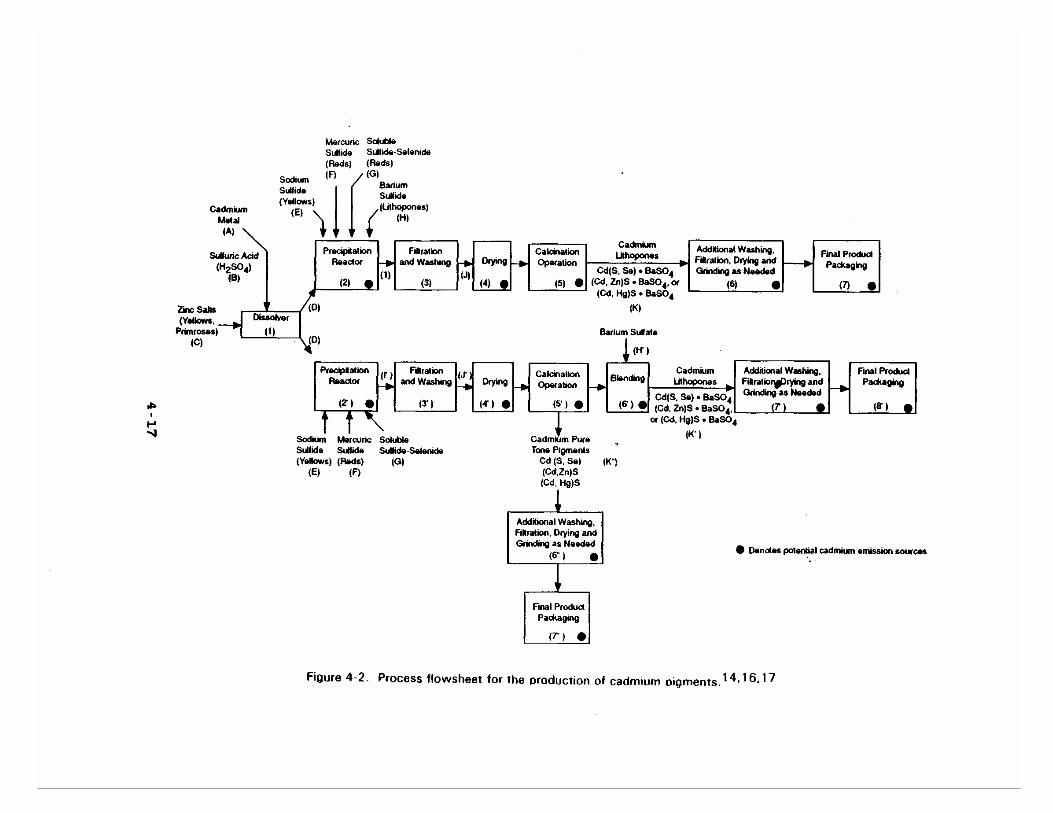

The sourc e of cadmiu m fo r cadmiu m pigmen t productio n i s a
pur e solutio n of eithe r cadmiu m sulfate , CdSO4, or cadmium
nitrate , Cd(NO3) 2. Cadmiu m sulfat e i s more commonl y used. These
solution s ar e eithe r purchase d i n bul k or produce d on-sit e by
dissolvin g cadmiu m oxide , cadmiu m metal , or cadmiu m spong e (a
porous , high-surface-are a for m of cadmiu m metal ) (Strea m A) in
th e appropriat e aci d (Strea m B). Zin c salt s (Strea m C) may be
adde d t o th e dissolve r (Ste p 1). The CdSO4 solutio n (Strea m D)
i s the n route d t o a precipitatio n reacto r (Ste p 2 or 2’ ) and
mixe d wit h varyin g quantitie s of an aqueou s solutio n of sodium
sulfid e (o r othe r alkal i sulfide , dependin g on th e desire d color)
(Strea m E). Thi s precipitate s CdS i n crystallographi c form. To
for m pigment s wit h a re d shad e (cadmiu m sulfoselenides) , the
cadmiu m sulfat e solutio n (Strea m E) i s reacte d wit h an alkali
sulfide-selenid e (Strea m G). Reds ca n als o be produce d by adding
mercuri c sulfid e (Strea m F) t o th e precipitatio n reactor.
Cadmiu m pur e ton e pigmen t productio n (n o BaSO4) i s depicted
i n th e figur e by th e pat h incorporatin g step s 1, 2’ - 5’ , 6’’ , and
7’’. Lithopon e productio n i s represente d i n Figur e 5 by two
paths , Step s 1- 7 and Step s 1, 2’-8’. To for m lithopones , barium
i s eithe r adde d t o th e precipitatio n Reacto r 2 as bariu m sulfide
(Strea m H) or adde d t o th e mechanica l blende r (Ste p 6’ ) as barium
sulfat e (strea m H’). BaSO4 precipitate s alon g wit h CdS or Cd(S,
Se) i n Reacto r 2.
When th e batc h proces s precipitatio n reactio n i s complete,
th e CdS or Cd(S,Se ) precipitate s (Strea m I wit h BaSO4; Strea m I’
withou t BaSO4) ar e filtere d fro m th e solution , washed , and dried
i n Step s 3 or 3’ and 4 or 4’. The ver y fine , colored
particulate s (Strea m J or J’ ) do not ye t posses s pigment
properties. The color s and propertie s of th e pigment s develop
durin g thei r calcination , or roasting. I n th e calcination
4-18

proces s (Ste p 5 or 5’) , th e drie d pigmen t precipitat e material
(Strea m J or J’ ) i s transferre d t o a furnac e and heate d to
betwee n 550° and 650° C (1022 ° t o 1202°F). Thi s convert s the
pigmen t materia l fro m a cubi c t o a more stable , hexagona l crystal
structure. I n an alternativ e rout e t o lithopon e pigments , the
cadmiu m pur e ton e pigmen t produce d by Ste p 5’ may be blende d in
Ste p 6’ wit h bariu m sulfat e (Strea m H’). The calcine d pigment
(Strea m K, K’ , or K’’ ) i s the n washed wit h hydrochlori c aci d to
remov e any remainin g solubl e cadmiu m particles. The produc t is
the n washed wit h water , filtered , and drie d (Ste p 6 or 7’ for
lithopones ; Ste p 6’ ’ fo r pur e ton e pigments). The cadmium
pigmen t emerge s as a filte r cake , whic h i s eithe r groun d and
package d as th e fina l product , or furthe r processe d befor e final
packaging. The fine , discret e pigmen t particle s hav e diameters
of abou t 1 µm (rang e 0. 1 t o 3. 5 µm).
Emission s and Controls
Cadmiu m i s potentiall y emitte d fro m th e dissolve r (Ste p 1),
th e precipitatio n reacto r (Ste p 2, 2’) , th e drye r (Ste p 4, 4’)
th e calcinin g furnac e (Ste p 5 or 5’) , th e blende r (Ste p 6’) , and
fina l produc t packagin g (Ste p 7, 8’ , 7"). Calcinin g emissions
ar e th e larges t sourc e of cadmiu m i n th e for m of CdS, Cd(S,Se),
or Cd pigmen t (2 5 percen t Cd i n lithopone ; 65 percen t i n pur e Cd
pigment). Standar d particulat e matte r emissio n control s are
used.
Reacto r chargin g fo r CdSO4 productio n (Ste p 1) (a t two
plants ) i s typicall y uncontrolled , thoug h i t i s controlle d by a
low-energ y wet scrubbe r at th e Louisville , Kentucky , plant.
Calcinin g operation s ar e generall y controlle d by wet scrubbers.
Dryin g operation s ar e most ofte n uncontrolled ; th e Louisville
plan t controlle d drye r emission s wit h a low-energ y wet scrubber.
Tra y desig n dryer s hav e lo w cadmiu m emissions. Grinding,
4-19

blending , and packagin g operation s ar e generall y controlle d by
baghouses. Fugitiv e emission s occurrin g insid e building s during
th e transfe r and handlin g (loading , unloading ) of cadmium-
containin g material s ar e typicall y capture d by hood s and ducted
t o a contro l device. Packagin g emission s ar e low. 5,8
Tabl e 4- 8 list s cadmiu m emission s reporte d by th e inorganic
pigmen t plant s i n th e 1990 Toxi c Chemical s Releas e Inventory. 7
The estimate s fro m th e 1990 Inventor y fo r thre e of th e four
curren t cadmiu m pigmen t producer s (denote d by footnot e "a " in
Tabl e 4-8 ) add up t o 0.8 3 Mg (1,83 8 lb). 7
The result s of tw o studie s of th e cadmiu m pigmen t industry
wer e publishe d i n reference s 4 and 6. Bot h of thes e studies
estimate d cadmiu m emission s and develope d cadmiu m emission
factor s fro m individua l source s at eac h of th e fou r plants
identifie d t o be producin g cadmiu m pigments. Each of th e four
plant s provide d informatio n throug h Sectio n 114 information
requests. Additionally , sit e visit s wer e made t o thre e of these
plant s and emissio n test s wer e conducte d at tw o of th e plants.
Throughou t thes e studies , th e individua l plant s claime d process
description s and al l proces s dat a t o be confidentia l business
informatio n (CBI). As a result , emission s fro m eac h plan t are
presente d i n thes e reference s as tota l cadmiu m emission s instead
of by individua l emissio n source. Becaus e th e productio n dat a is
CBI , emissio n factor s canno t be determine d fo r any source s in
thi s sourc e category.
CADMIUM STABILIZER S PRODUCTION
Cadmiu m i s emitte d durin g th e manufactur e of cadmium
stabilizers. Thi s subsectio n wil l describ e th e manufacturing
process , emissio n sources , and emissio n controls.
4-20
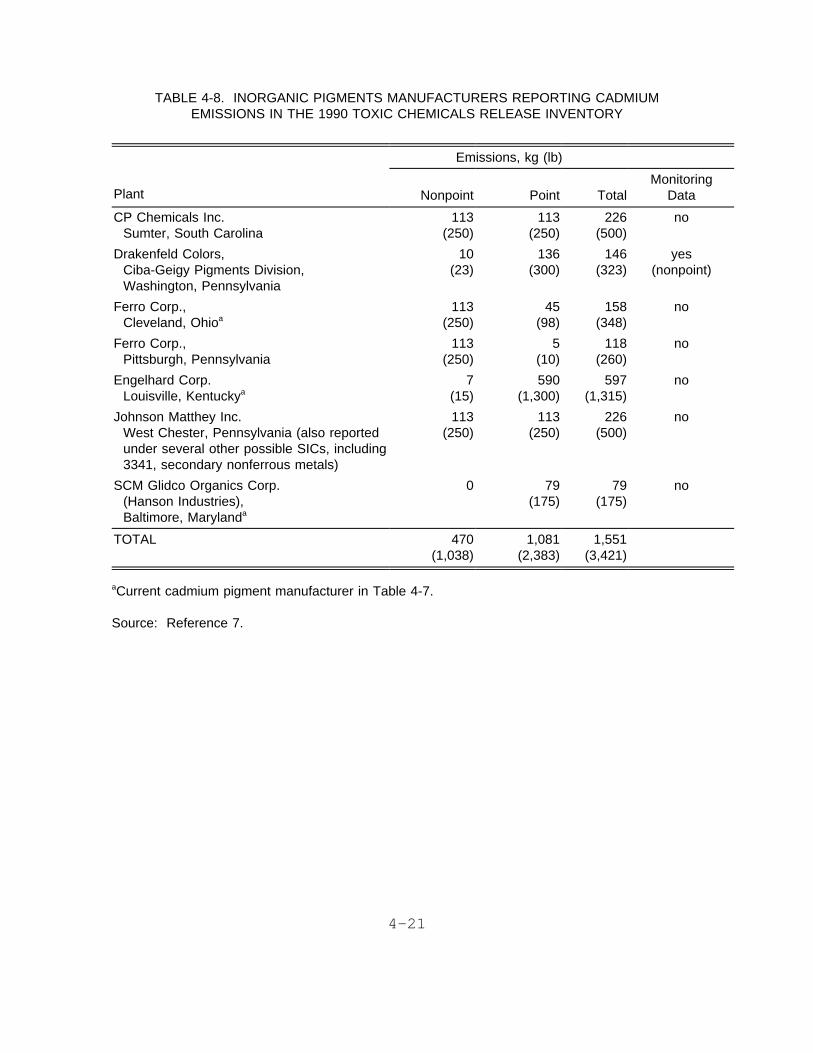
TABLE 4-8. INORGANIC PIGMENTS MANUFACTURERS REPORTING CADMIUMEMISSIONS IN THE 1990 TOXIC CHEMICALS RELEASE INVENTORY
Emissions, kg (lb)
Plant Nonpoint Point TotalMonitoring
Data
CP Chemicals Inc.Sumter, South Carolina
113(250)
113(250)
226(500)
no
Drakenfeld Colors,Ciba-Geigy Pigments Division,Washington, Pennsylvania
10(23)
136(300)
146(323)
yes(nonpoint)
Ferro Corp.,Cleveland, Ohioa
113(250)
45(98)
158(348)
no
Ferro Corp.,Pittsburgh, Pennsylvania
113(250)
5(10)
118(260)
no
Engelhard Corp.Louisville, Kentuckya
7(15)
590(1,300)
597(1,315)
no
Johnson Matthey Inc.West Chester, Pennsylvania (also reportedunder several other possible SICs, including3341, secondary nonferrous metals)
113(250)
113(250)
226(500)
no
SCM Glidco Organics Corp.(Hanson Industries),Baltimore, Marylanda
0 79(175)
79(175)
no
TOTAL 470(1,038)
1,081(2,383)
1,551(3,421)
aCurrent cadmium pigment manufacturer in Table 4-7.
Source: Reference 7.
4-21
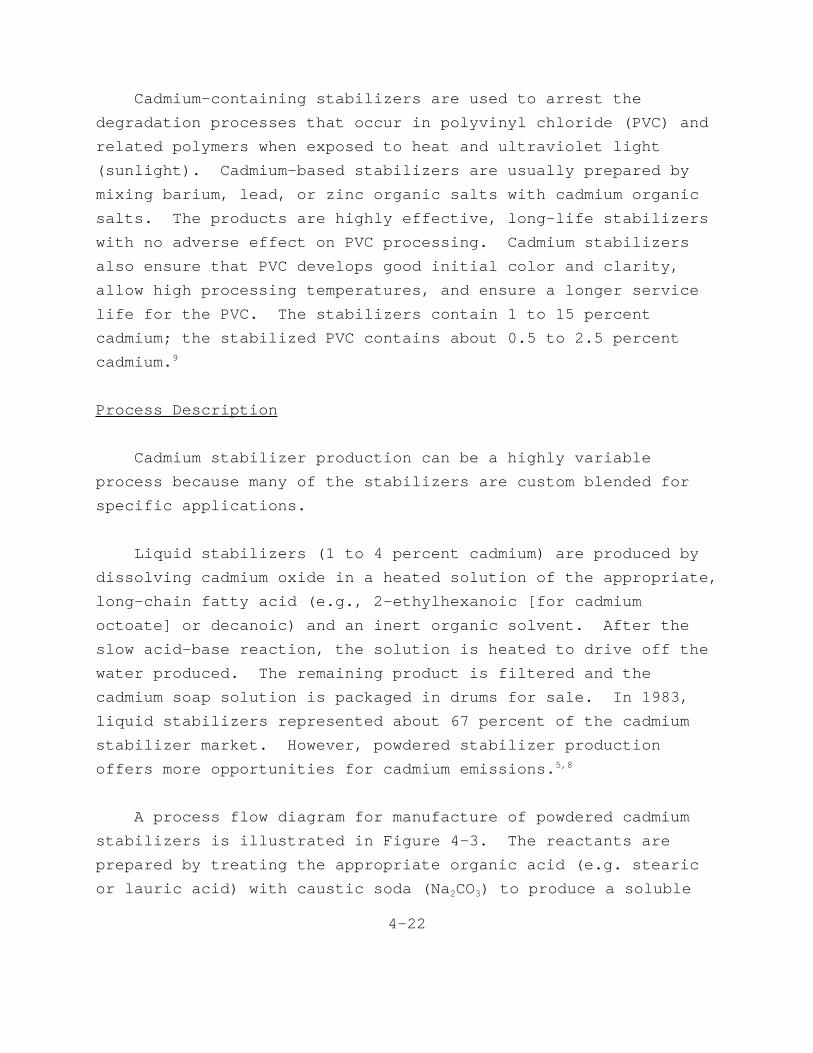
Cadmium-containin g stabilizer s ar e use d t o arres t the
degradatio n processe s tha t occu r i n polyviny l chlorid e (PVC) and
relate d polymer s when expose d t o hea t and ultraviole t light
(sunlight). Cadmium-base d stabilizer s ar e usuall y prepare d by
mixin g barium , lead , or zin c organi c salt s wit h cadmiu m organic
salts. The product s ar e highl y effective , long-lif e stabilizers
wit h no advers e effec t on PVC processing. Cadmiu m stabilizers
als o ensur e tha t PVC develop s good initia l colo r and clarity,
allo w hig h processin g temperatures , and ensur e a longe r service
lif e fo r th e PVC. The stabilizer s contai n 1 t o 15 percent
cadmium ; th e stabilize d PVC contain s abou t 0. 5 t o 2. 5 percent
cadmium. 9
Proces s Description
Cadmiu m stabilize r productio n ca n be a highl y variable
proces s becaus e many of th e stabilizer s ar e custo m blende d for
specifi c applications.
Liqui d stabilizer s ( 1 t o 4 percen t cadmium ) ar e produce d by
dissolvin g cadmiu m oxid e i n a heate d solutio n of th e appropriate,
long-chai n fatt y aci d (e.g. , 2-ethylhexanoi c [fo r cadmium
octoate ] or decanoic ) and an iner t organi c solvent. Afte r the
slo w acid-bas e reaction , th e solutio n i s heate d t o driv e of f the
wate r produced. The remainin g produc t i s filtere d and the
cadmiu m soa p solutio n i s package d i n drums fo r sale. I n 1983,
liqui d stabilizer s represente d abou t 67 percen t of th e cadmium
stabilize r market. However , powdere d stabilize r production
offer s more opportunitie s fo r cadmiu m emissions. 5,8
A proces s flo w diagra m fo r manufactur e of powdere d cadmium
stabilizer s i s illustrate d i n Figur e 4-3. The reactant s are
prepare d by treatin g th e appropriat e organi c aci d (e.g . stearic
or lauri c acid ) wit h causti c sod a (Na 2CO3) t o produc e a soluble
4-22
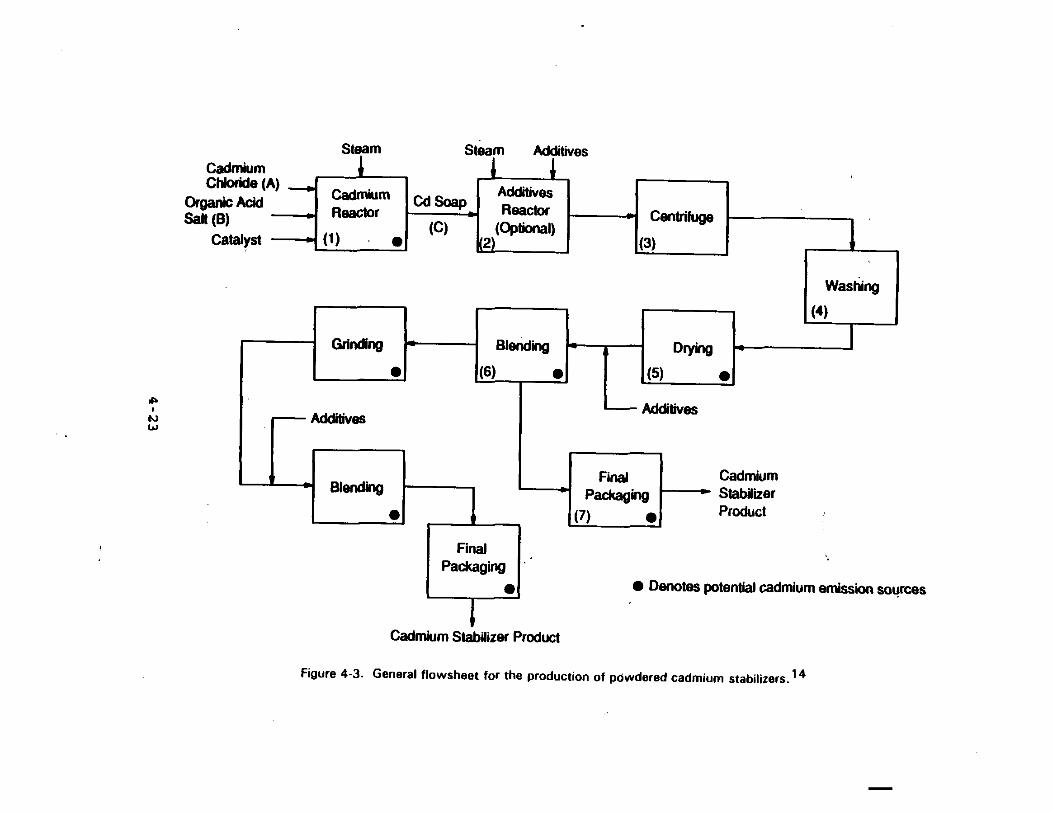

sodiu m soa p (Strea m A). A cadmiu m chlorid e solutio n (Strea m B)
i s prepare d by dissolvin g cadmiu m meta l or CdO i n hydrochloric
acid. The sodiu m sal t of th e organi c aci d (th e solubl e soap)
(Strea m A) i s adde d t o th e cadmiu m chlorid e solutio n (Strea m B)
i n th e cadmiu m reacto r (Ste p 1) at an elevate d temperature
(provide d by additio n of steam ) i n th e presenc e of a catalys t to
precipitat e th e cadmiu m soa p (Strea m C). Ste p 2 probably
involve s th e additio n of th e bariu m organi c sal t or it s precursor
reactants. The resultan t slurr y i s route d t o a centrifug e and
dewatere d (Ste p 3). The soli d soa p i s washed , dried , possibly
blended , and package d (Step s 4-7). The fina l powdere d stabilizer
produc t contain s 7 t o 15 percen t cadmium. Additive s and
moistenin g agent s ca n be blende d wit h th e soa p as necessar y to
produc e a particula r end product. The number and sequenc e of
blending , grinding , and packagin g operation s var y wit h th e final
product. 8
Emissio n and Controls
Cadmiu m emissio n source s and control s durin g cadmium
stabilize r manufactur e ar e summarize d i n thi s section. The
chargin g of powdere d cadmiu m oxid e t o th e organi c aci d solution
i s a potentia l cadmiu m emissio n sourc e fro m liqui d cadmium
stabilize r production. Thi s proces s i s typicall y controlle d by a
wet scrubber. Fugitiv e emission s ar e capture d by hooding , which
i s eithe r ducte d t o baghouse s or vente d t o th e air. 5,8
Potentia l cadmiu m emissio n source s durin g powdere d stabilizer
productio n includ e cadmiu m oxid e production , chargin g cadmium
oxid e t o th e reacto r (Ste p 1) , dryin g (Ste p 5) , blendin g (Step
6) , grindin g (a t one facility) , weighing , and packagin g (Ste p 7)
of th e fina l product. The cadmiu m oxid e productio n proces s (one
facility ) i s controlle d by a baghouse. Reactor s ar e controlled
by wet scrubbers. Dryin g operation s ar e generall y uncontrolled.
4-24

Grinding , blending , weighing , and packagin g operation s are
controlle d by hoodin g and baghouses. 5,8
Tabl e 4- 9 list s th e manufacturer s of organi c chemical s who
reporte d cadmiu m emission s i n th e 1990 Toxi c Chemical s Release
Inventory. The tota l fo r al l plant s producin g stabilizer s in
Tabl e 4- 9 i s 3.3 3 Mg (3.6 7 tons).
For simila r reason s describe d abov e fo r cadmiu m pigment
manufacturers , emissio n factor s coul d not be calculate d for
individua l proces s steps.
OTHER CADMIUM COMPOUND PRODUCTION
The productio n processe s use d t o produc e cadmiu m pigment s and
stabilizers , CdS, CdSO4, and cadmiu m oxid e hav e been described
above. Rathe r tha n describ e th e productio n of a larg e number of
othe r cadmiu m compounds , productio n processe s ar e describe d only
fo r a fe w of th e othe r compounds whose manufacturer s reported
cadmiu m emission s i n th e 1990 Toxi c Chemical s Releas e Inventory. 7
The cadmiu m compounds describe d and thei r use s ar e liste d in
Tabl e 4-10.
Proces s Descriptions
Cadmiu m hydroxide , Cd(OH2) , i s produce d by addin g a solution
of cadmiu m nitrate , Cd(NO3) 2, t o a boilin g solutio n of sodiu m or
potassiu m hydroxid e (NaOH or KOH). The cadmiu m metal , oxide,
hydroxide , or carbonat e i s digeste d wit h nitri c aci d followe d by
crystallizatio n t o produc e cadmiu m nitrate. 12
Hydrate d amorphou s cadmiu m carbonate , CdCO3, i s precipitated
fro m cadmiu m sal t solution s by addin g sodiu m or potassium
carbonate. Heatin g amorphou s cadmiu m carbonat e wit h ammonium
4-25

TABLE 4-9. MANUFACTURERS OF ORGANIC COMPOUNDS REPORTING CADMIUMEMISSIONS IN THE 1990 TOXIC CHEMICALS RELEASE INVENTORY
Emissions, kg (lb)
Plant Nonpoint Point TotalMonitoring data
*Akzo Chemical Inc., Interstab Div.,New Brunswick, New Jersey (compoundsBa Cd stabilizers)
0 226(500)
226(500)
no
*Argus Division, WitcoCorp., Brooklyn, New York(Ba Cd vinyl heat stabilizers)
2,180(4,805)
342(755)
2,522(5,560)
no
*Ferro Corporation,Bedford, Ohio(Cadmium octoate, PVC stabilizers)
113(250)
113(250)
226(500)
no
Rohm & Haas DelawareValley, Inc., Bristol, Pennsylvania (alsoreported under SIC 2821, Plasticsmaterials, and resins)
2(5)
0 2(5)
yes(nonpoint)
*Synthetic Products Co.,Stratford, Connecticut(compounds Ba Cdstabilizers)
1(1)
113(250)
114(251)
no
*Synthetic Products Co.,Cleveland, Ohio(Cadmium stearate)
113(250)
113(250)
225(500)
no
*Vanderbilt Chemical Corp.,Bethel, Connecticut(Cadmium diethyldithio-carbamate)
1(3)
13(28)
14(31)
no
TOTAL 2,410(5,314)
920(2,033)
3,330(7,347)
*Assumed to be cadmium stabilizer manufacturers.
Source: References 7 and 10.
4-26
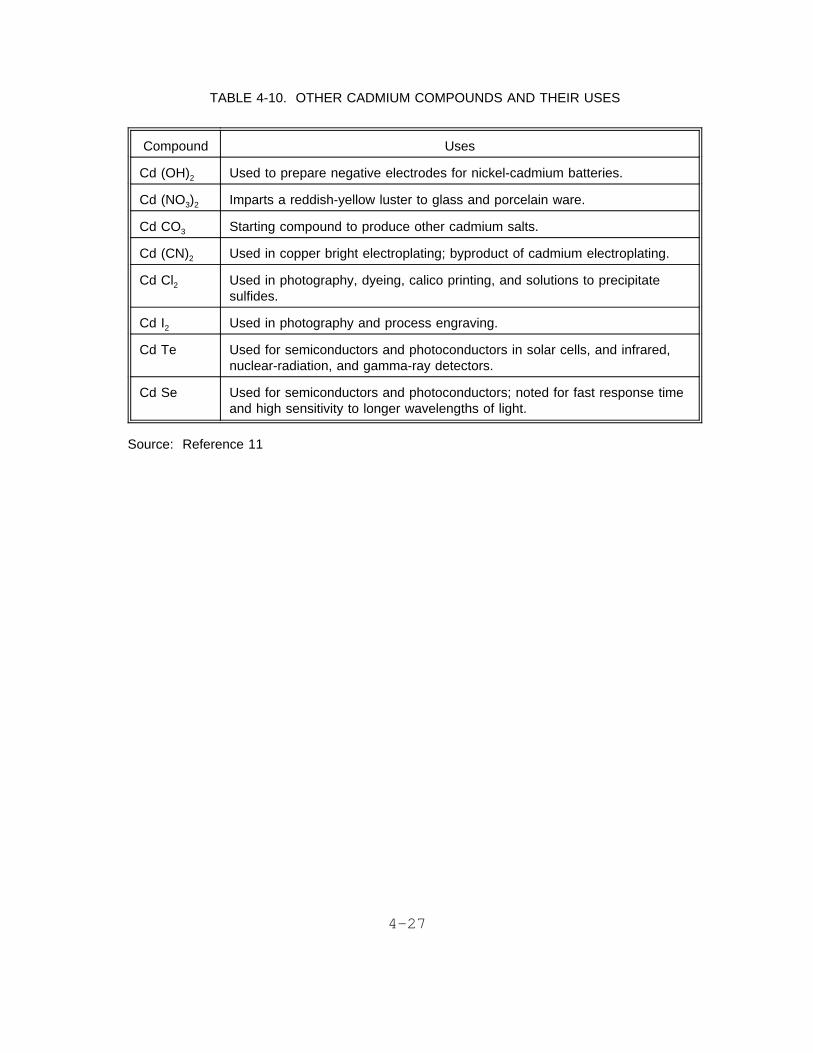
TABLE 4-10. OTHER CADMIUM COMPOUNDS AND THEIR USES
Compound Uses
Cd (OH)2 Used to prepare negative electrodes for nickel-cadmium batteries.
Cd (NO3)2 Imparts a reddish-yellow luster to glass and porcelain ware.
Cd CO3 Starting compound to produce other cadmium salts.
Cd (CN)2 Used in copper bright electroplating; byproduct of cadmium electroplating.
Cd Cl2 Used in photography, dyeing, calico printing, and solutions to precipitatesulfides.
Cd I2 Used in photography and process engraving.
Cd Te Used for semiconductors and photoconductors in solar cells, and infrared,nuclear-radiation, and gamma-ray detectors.
Cd Se Used for semiconductors and photoconductors; noted for fast response timeand high sensitivity to longer wavelengths of light.
Source: Reference 11
4-27

chlorid e at 150° t o 180° C (302° F t o 356°F ) i n th e absenc e of
oxyge n give s th e crystallin e form. Anhydrou s cadmiu m carbonate
i s prepare d by addin g exces s ammonium carbonat e t o a cadmium
chlorid e solutio n followe d by dryin g th e precipitat e at 100°C
(212°F). 12
Cadmiu m cyanid e ca n be forme d in -situ as a by-produc t by
dissolvin g cadmiu m oxid e i n exces s sodiu m cyanid e electroplating
solution. 12
Hydrate d cadmiu m chloride , CdCl 2.5H 2O ca n be prepare d by
reaction s i n aqueou s solutio n betwee n hydroge n chloride , HCl , and
cadmiu m meta l or a compound suc h as CdCO3, CdS, CdO, or Cd(OH) 2.
The reactio n solutio n i s the n evaporate d t o recove r crystal s of
th e hydrate d salt. 12
Anhydrou s cadmiu m chloride , CdCl 2, may be prepare d by several
methods: 12
1.Refluxin g th e hydrat e wit h thiony l chloride , SOCl2.
2.Calcinin g th e hydrat e (remove s H2O) i n an atmospher e of HCl
gas.
3.Chlorinatin g dr y cadmiu m acetate , CdO2CCH3, wit h acetyl
chloride , CH3COCl, i n glacia l aceti c aci d (CH3CO2H)
4.Mixin g hydrate d cadmiu m nitrate , Cd(NO3) 2.4H 2O, wit h hot
concentrate d hydrochlori c aci d and removin g CdCl 2 by distilling
th e solution.
5.
Treatin g cadmiu m meta l wit h chlorin e gas.
6.
Treatin g cadmiu m meta l wit h hydroge n chlorid e gas.
Cadmiu m iodide , CdI 2, i s prepare d by dissolvin g cadmiu m metal
or a compound suc h as CdO, Cd(OH) 2, or CdCO3 i n hydroiodi c acid
4-28
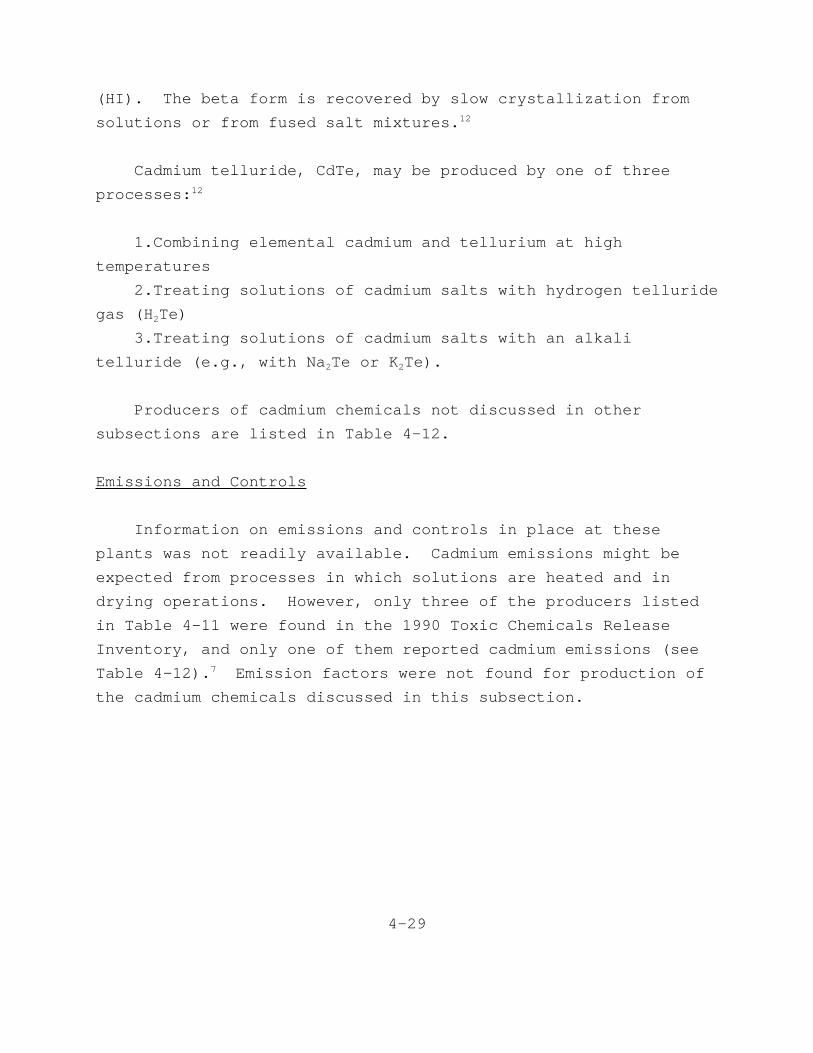
(HI). The bet a for m i s recovere d by slo w crystallizatio n from
solution s or fro m fuse d sal t mixtures. 12
Cadmiu m telluride , CdTe, may be produce d by one of three
processes: 12
1.Combinin g elementa l cadmiu m and telluriu m at high
temperatures
2.Treatin g solution s of cadmiu m salt s wit h hydroge n telluride
gas (H 2Te)
3.Treatin g solution s of cadmiu m salt s wit h an alkali
tellurid e (e.g. , wit h Na2Te or K2Te).
Producer s of cadmiu m chemical s not discusse d i n other
subsection s ar e liste d i n Tabl e 4-12.
Emission s and Controls
Informatio n on emission s and control s i n plac e at these
plant s was not readil y available. Cadmiu m emission s migh t be
expecte d fro m processe s i n whic h solution s ar e heate d and in
dryin g operations. However , onl y thre e of th e producer s listed
i n Tabl e 4-1 1 wer e foun d i n th e 1990 Toxi c Chemical s Release
Inventory , and onl y one of the m reporte d cadmiu m emission s (see
Tabl e 4-12). 7 Emissio n factor s wer e not foun d fo r productio n of
th e cadmiu m chemical s discusse d i n thi s subsection.
4-29
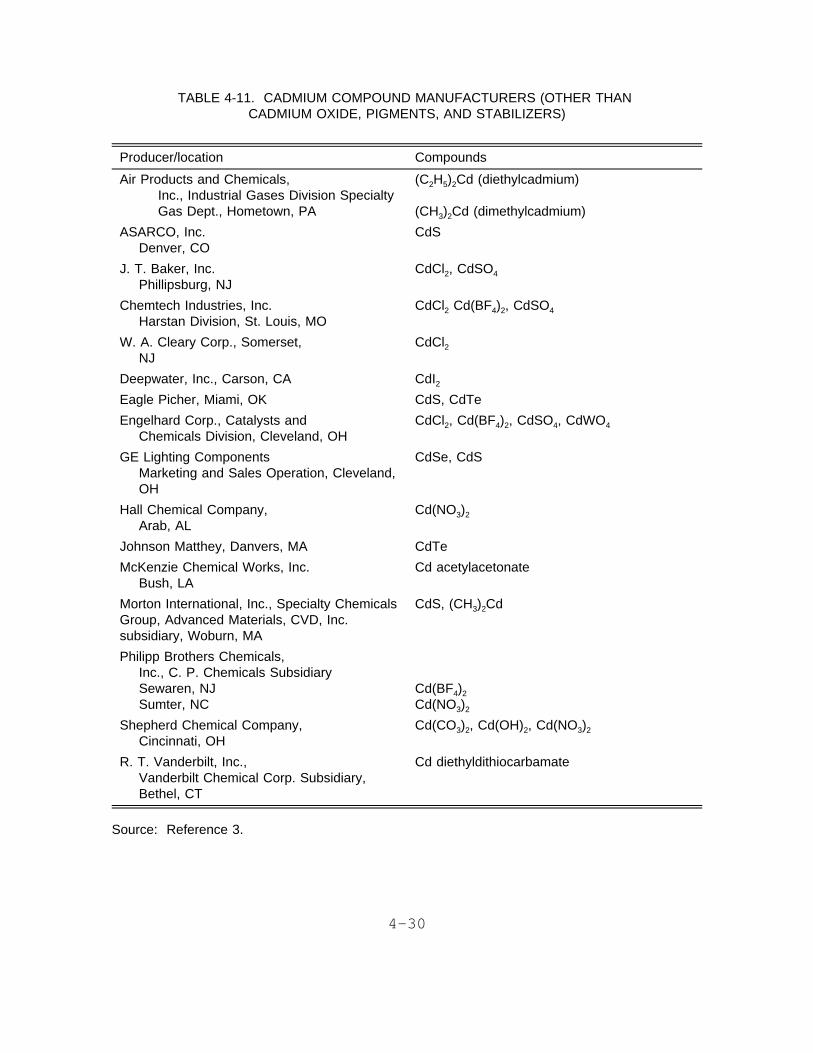
TABLE 4-11. CADMIUM COMPOUND MANUFACTURERS (OTHER THANCADMIUM OXIDE, PIGMENTS, AND STABILIZERS)
Producer/location Compounds
Air Products and Chemicals,Inc., Industrial Gases Division SpecialtyGas Dept., Hometown, PA
(C2H5)2Cd (diethylcadmium)
(CH3)2Cd (dimethylcadmium)
ASARCO, Inc.Denver, CO
CdS
J. T. Baker, Inc.Phillipsburg, NJ
CdCl2, CdSO4
Chemtech Industries, Inc.Harstan Division, St. Louis, MO
CdCl2 Cd(BF4)2, CdSO4
W. A. Cleary Corp., Somerset,NJ
CdCl2
Deepwater, Inc., Carson, CA CdI2Eagle Picher, Miami, OK CdS, CdTe
Engelhard Corp., Catalysts andChemicals Division, Cleveland, OH
CdCl2, Cd(BF4)2, CdSO4, CdWO4
GE Lighting ComponentsMarketing and Sales Operation, Cleveland,OH
CdSe, CdS
Hall Chemical Company,Arab, AL
Cd(NO3)2
Johnson Matthey, Danvers, MA CdTe
McKenzie Chemical Works, Inc.Bush, LA
Cd acetylacetonate
Morton International, Inc., Specialty ChemicalsGroup, Advanced Materials, CVD, Inc.subsidiary, Woburn, MA
CdS, (CH3)2Cd
Philipp Brothers Chemicals,Inc., C. P. Chemicals SubsidiarySewaren, NJSumter, NC
Cd(BF4)2
Cd(NO3)2
Shepherd Chemical Company,Cincinnati, OH
Cd(CO3)2, Cd(OH)2, Cd(NO3)2
R. T. Vanderbilt, Inc.,Vanderbilt Chemical Corp. Subsidiary,Bethel, CT
Cd diethyldithiocarbamate
Source: Reference 3.
4-30
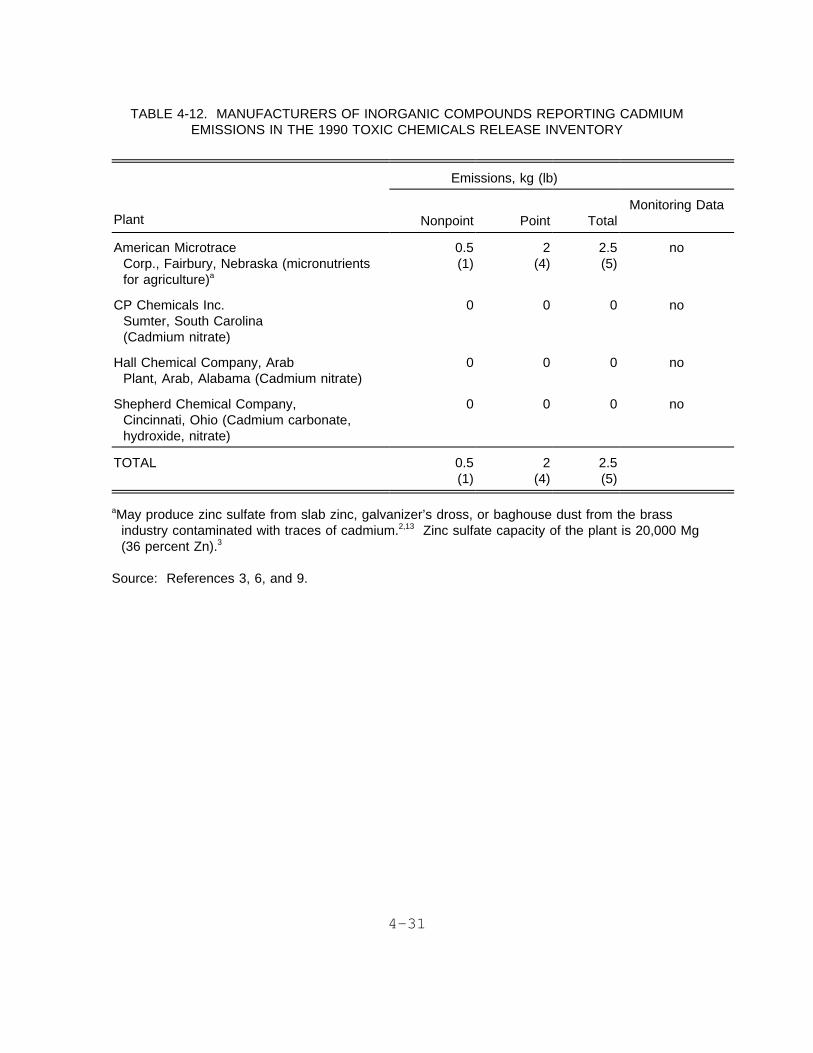
TABLE 4-12. MANUFACTURERS OF INORGANIC COMPOUNDS REPORTING CADMIUMEMISSIONS IN THE 1990 TOXIC CHEMICALS RELEASE INVENTORY
Emissions, kg (lb)
Plant Nonpoint Point TotalMonitoring Data
American MicrotraceCorp., Fairbury, Nebraska (micronutrientsfor agriculture)a
0.5(1)
2(4)
2.5(5)
no
CP Chemicals Inc.Sumter, South Carolina(Cadmium nitrate)
0 0 0 no
Hall Chemical Company, ArabPlant, Arab, Alabama (Cadmium nitrate)
0 0 0 no
Shepherd Chemical Company,Cincinnati, Ohio (Cadmium carbonate,hydroxide, nitrate)
0 0 0 no
TOTAL 0.5(1)
2(4)
2.5(5)
aMay produce zinc sulfate from slab zinc, galvanizer’s dross, or baghouse dust from the brassindustry contaminated with traces of cadmium.2,13 Zinc sulfate capacity of the plant is 20,000 Mg(36 percent Zn).3
Source: References 3, 6, and 9.
4-31
REFERENCES
1. Emissio n Standard s and Engineerin g Division. CadmiumEmission s fro m Cadmiu m Refinin g and Primar y Zinc/Zin c OxideSmeltin g - - Phase I Technica l Report. EPA-450/3-87-011.Offic e of Ai r Qualit y Plannin g and Standards , U. S.Environmenta l Protectio n Agency , Researc h Triangl e Park,Nort h Carolina. Jun e 1987.
2. Jolly , J. H. Zinc. (In ) Mineral s Yearboo k 1989. Volum e I.Metal s and Minerals. Burea u of Mines , U. S. Departmen t ofth e Interior , U. S. Governmen t Printin g Office , Washington,D. C. 1991. pp. 1145-1174.
3. SRI International. 1991 Director y of Chemica l Producers:Unite d State s of America. SRI International , Menl o Park,California. 1991. pp. 516 , 571 , 582 , 869-871 , 946.
4. JACA Corporation. Analysi s and Alternative s - Ai r EmissionsContro l Stud y - ASARCO Glob e Plant , Denver , Colorado. FinalReport. Prepare d fo r th e Colorad o Departmen t of Health.Augus t 6, 1992.
5. Radia n Corporation. Backgroun d Informatio n Document forCadmiu m Emissio n Sources. DCN No. 85-203-012-23-06 , EPAContrac t No. 68-02-3818 , Assignmen t 23. Pollutan t AssessmentBranch , U. S. Environmenta l Protectio n Agency , ResearchTriangl e Park , Nort h Carolina. May 1985. pp. 39-56 , 174,197-212.
6. Midwes t Researc h Institute. Bi g Rive r Zin c Corporation.Assessmen t of Cadmiu m and Arseni c Emissions. EPA ContractNo. 68-02-439 5 (MRI Projec t No. 8986-28). Prepare d fo r Airand Radiatio n Branch , U. S. Environmenta l Protectio n Agency,Regio n V, Chicago , Illinois , and Divisio n of Ai r PollutionControl , Illinoi s Environmenta l Protectio n Agency,Springfield , Illinois. Septembe r 1989. 38 pp.
7. U. S. Environmenta l Protectio n Agency. 1990 Toxi c ChemicalsReleas e Inventory. Offic e of Toxi c Substances , Washington,DC. Januar y 1993.
8. Emissio n Standard s Division. Cadmiu m Emission s fro m Pigmentand Stabilize r Manufacturin g - - Phase I Technica l Report.Offic e of Ai r Qualit y Plannin g and Standards , U. S.Environmenta l Protectio n Agency , Researc h Triangl e Park,Nort h Carolina. Jun e 1988.
4-32
9. Cadmiu m Association/Cadmiu m Council. Technica l Note s onCadmium. Cadmiu m Production , Propertie s and Uses. CadmiumAssociation , London ; Cadmiu m Council , New York , New York.1991. 8 pp.
10. 1991 Thomas Registe r of America n Manufacturers. ThomasPublishin g Company, New York , New York. 1991.
11. McGraw-Hil l Dictionar y of Scientifi c and Technica l Terms,Thir d Edition. Sybi l P. Parker , Edito r i n Chief.McGraw-Hill , New York , New York. 1984.
12. Parker , P.D. Cadmiu m Compounds. (In ) Kirk-OthmerEncyclopedi a of Chemica l Technology. Volum e 4. 3r d Ed.M. Grayson , ed. A Wiley-Interscienc e Publication , Joh n Wileyand Sons, New York , New York. 1978. pp. 397-411.
13. Mumma, C. , K. Bohannon , and F. Hopkins. Chemica l Technologyand Economic s i n Environmenta l Perspectives. Task VI -Cadmiu m i n Phosphat e Fertilize r Production.EPA 560/2-77-006. Offic e of Toxi c Substances , U. S.Environmenta l Protectio n Agency. Washington , D. C. November1977. 35 pp.
4-33
SECTION 5
EMISSIONS FROM MAJOR USES OF CADMIUM
Emission s fro m industria l processe s tha t us e cadmiu m are
discusse d i n thi s section. Based on th e 1991 U.S . industrial
demand figure s presente d i n Figur e 3-1 , Sectio n 3, cadmiu m and
cadmiu m compounds hav e fou r majo r commercia l uses. Thes e are:
(1 ) electroplating , (2 ) secondar y (i.e. , rechargeable ) battery
manufacture , (3 ) hea t stabilizer s fo r syntheti c material s and
plasti c resins , and (4 ) pigment s fo r plasti c products. This
sectio n i s divide d int o fou r subsections , one devote d t o each
majo r use. Each subsectio n present s a brie f introductio n t o the
industr y and a genera l discussio n of th e productio n process.
Where cadmiu m i s use d i n th e process , description s of existing
cadmiu m emissio n contro l measure s and estimate s of cadmium
emissio n factor s ar e given. The leve l of detai l wil l vary
accordin g t o th e availabilit y of information , particularl y for
emission s wher e dat a may be incomplet e or absent.
CADMIUM ELECTROPLATING
I n 1991 , cadmiu m electroplatin g application s accounte d for
approximatel y 20 percen t of th e tota l demand fo r cadmium. 1 In
cadmiu m electroplating , a thi n laye r of cadmiu m i s deposited
directl y ove r a bas e meta l (usuall y steel ) t o provid e corrosion
protection , a lo w coefficien t of friction , and a lo w electrical
contac t resistance. I n addition , cadmiu m coating s als o ar e used
i n th e electrica l industr y becaus e cadmiu m i s easil y soldered.
Cadmiu m electroplatin g i s performe d on suc h item s as aircraft
5-1

fasteners , cabl e connector s fo r computers , shi p components , and
automobil e engin e components. Tabl e 5- 1 present s th e major
marke t area s fo r cadmiu m coatings. 2
An estimate d 1,20 0 meta l finishin g jo b shop s tha t perform
cadmiu m electroplatin g operat e i n th e Unite d States. 3 Metal
finishin g shop s ar e typicall y locate d at or nea r th e industries
the y serve. Therefore , th e geographica l distributio n of the
meta l finishin g shop s closel y follow s tha t of th e manufacturing
bas e i n th e U.S. 3
Proces s Description
A flo w diagra m fo r a typica l cadmiu m electroplatin g process
i s presente d i n Figur e 5-1. Prio r t o plating , th e part s undergo
a serie s of pretreatmen t step s t o smoot h th e surfac e of th e part
and t o remov e any surfac e soil , grease , or oil. Pretreatment
step s includ e polishing , grinding , and/o r degreasin g of th e part
t o prepar e fo r plating. The par t bein g plate d i s rinse d after
eac h ste p i n th e proces s t o preven t carry-ove r of solutio n that
may contaminat e th e bath s use d i n successiv e proces s steps.
Polishin g and grindin g ar e performe d t o smoot h th e surfac e of
th e part. Degreasin g i s performe d eithe r by dippin g th e par t in
organi c solvent s or by vapo r degreasin g th e par t usin g organic
solvents. Vapor degreasin g i s typicall y use d when th e surface
loadin g of oi l or greas e i s excessive. The tw o organi c solvents
most commonl y use d fo r cleanin g application s are
trichloroethylen e and perchloroethylene.
Alkalin e cleanin g i s sometime s use d t o dislodg e surfac e soil
and preven t i t fro m settlin g bac k ont o th e metal. Thes e cleaning
solution s ar e typicall y made up of compounds , suc h as sodium
carbonate , sodiu m phosphate , and sodiu m hydroxide ; the y usually
5-2
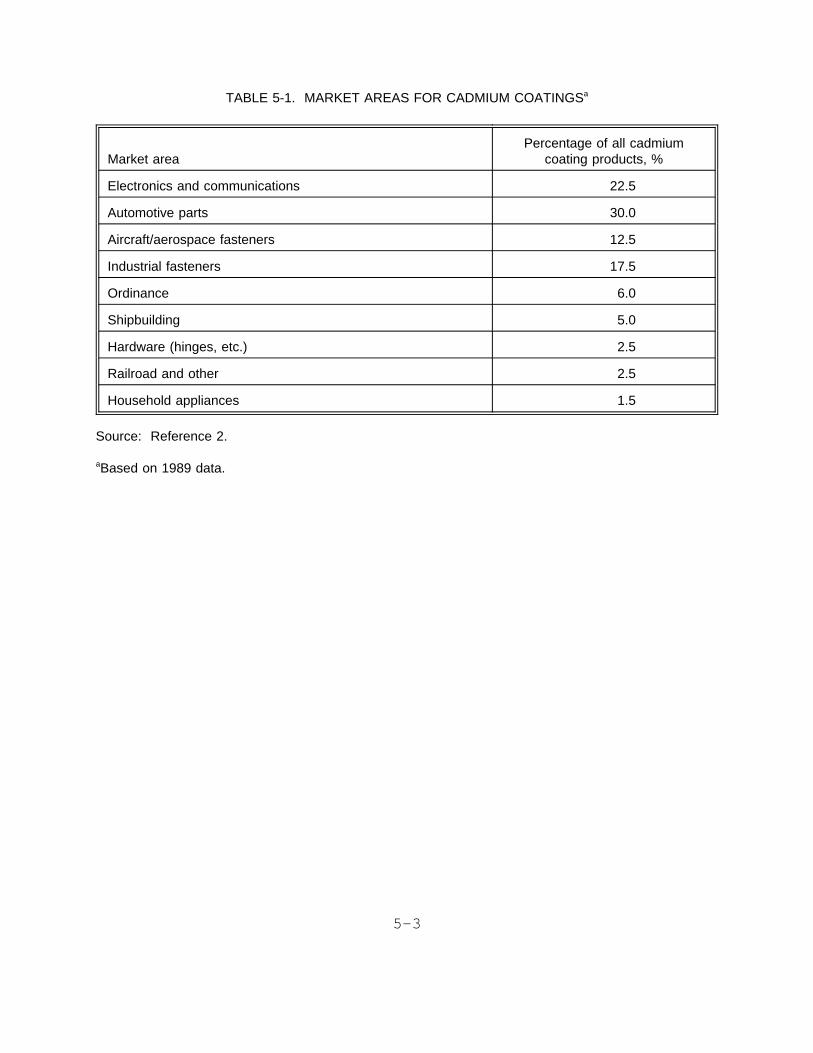
TABLE 5-1. MARKET AREAS FOR CADMIUM COATINGSa
Market areaPercentage of all cadmium
coating products, %
Electronics and communications 22.5
Automotive parts 30.0
Aircraft/aerospace fasteners 12.5
Industrial fasteners 17.5
Ordinance 6.0
Shipbuilding 5.0
Hardware (hinges, etc.) 2.5
Railroad and other 2.5
Household appliances 1.5
Source: Reference 2.
aBased on 1989 data.
5-3
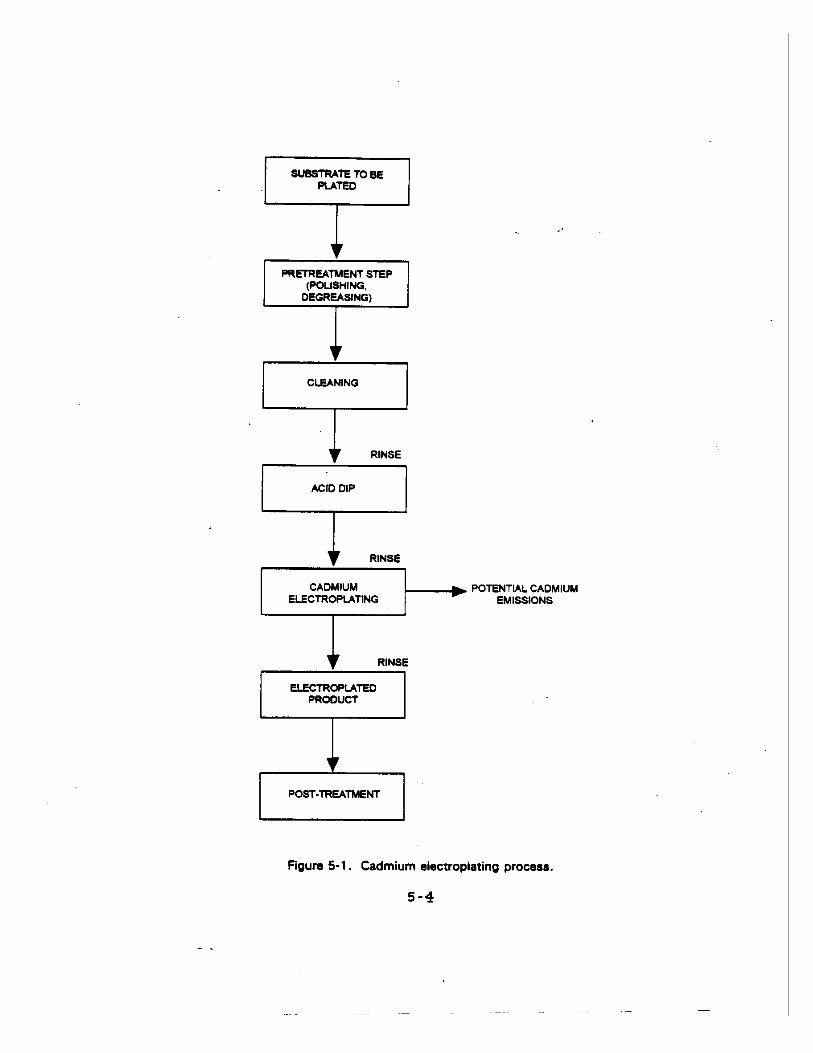
contai n a surfactant. Alkalin e cleanin g technique s include
soakin g and cathodi c and anodi c cleaning.
Aci d dip s may be use d t o remov e any tarnis h or oxid e films
forme d i n th e alkalin e cleanin g ste p and t o neutraliz e the
alkalin e film. Aci d di p solution s typicall y contai n fro m 10 to
30 percen t by volum e hydrochlori c or sulfuri c aci d i n water.
The exac t pretreatmen t step s use d depen d upon th e amount of
soil , grease , or oi l on th e parts. Followin g pretreatment , the
part s ar e transferre d t o th e platin g tank.
Severa l cadmiu m platin g bat h formulation s ar e use d t o deposit
cadmiu m on th e bas e meta l or part ; however , th e cadmiu m cyanide
bat h i s th e predominan t formulatio n use d t o deposi t cadmium.
Othe r bat h formulation s use d includ e a neutra l sulfate , an acid
fluorborate , or an aci d sulfat e bath. Currently , th e us e of
thes e othe r bat h formulation s i s not appreciabl e becaus e the
cadmiu m deposit s forme d fro m thes e bath s ar e not of sufficient
qualit y (i.e. , do not displa y th e desire d physica l properties ) to
gai n widesprea d acceptance. Therefore , th e followin g discussion
wil l focu s on th e cadmiu m cyanid e platin g bath.
Tabl e 5- 2 present s th e bat h compositio n and operating
parameter s of th e cadmiu m cyanid e bath. 4 I n cadmiu m plating , the
part(s ) i s place d i n a tan k and connecte d int o th e electrical
circui t as th e cathode. I f smal l part s ar e t o be plated , the
part s ar e firs t place d i n a platin g barre l or on a platin g rack.
The barre l or platin g rac k i s the n place d i n th e tan k and
connecte d int o th e electrica l circuit. As curren t i s applied,
cadmiu m ion s i n th e solutio n ar e draw n t o th e negatively-charged
cathod e wher e the y underg o reduction , resultin g i n th e cadmium
bein g deposite d on th e part. The efficienc y of th e platin g bath
i s base d on th e amount of curren t tha t i s consume d i n the
5-5
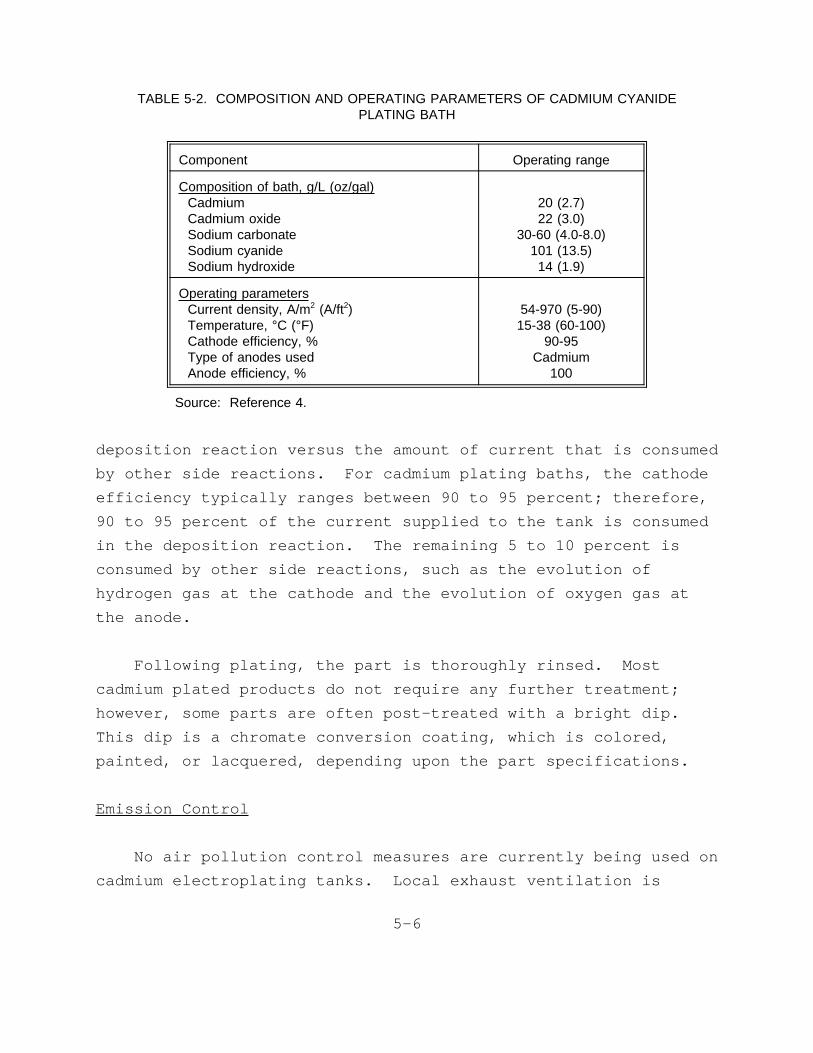
depositio n reactio n versu s th e amount of curren t tha t i s consumed
TABLE 5-2. COMPOSITION AND OPERATING PARAMETERS OF CADMIUM CYANIDEPLATING BATH
Component Operating range
Composition of bath, g/L (oz/gal)CadmiumCadmium oxideSodium carbonateSodium cyanideSodium hydroxide
20 (2.7)22 (3.0)
30-60 (4.0-8.0)101 (13.5)
14 (1.9)
Operating parametersCurrent density, A/m2 (A/ft2)Temperature, °C (°F)Cathode efficiency, %Type of anodes usedAnode efficiency, %
54-970 (5-90)15-38 (60-100)
90-95Cadmium
100
Source: Reference 4.
by othe r sid e reactions. For cadmiu m platin g baths , th e cathode
efficienc y typicall y range s betwee n 90 t o 95 percent ; therefore,
90 t o 95 percen t of th e curren t supplie d t o th e tan k i s consumed
i n th e depositio n reaction. The remainin g 5 t o 10 percen t is
consume d by othe r sid e reactions , suc h as th e evolutio n of
hydroge n gas at th e cathod e and th e evolutio n of oxyge n gas at
th e anode.
Followin g plating , th e par t i s thoroughl y rinsed. Most
cadmiu m plate d product s do not requir e any furthe r treatment;
however , some part s ar e ofte n post-treate d wit h a brigh t dip.
Thi s di p i s a chromat e conversio n coating , whic h i s colored,
painted , or lacquered , dependin g upon th e par t specifications.
Emissio n Control
No ai r pollutio n contro l measure s ar e currentl y bein g use d on
cadmiu m electroplatin g tanks. Loca l exhaus t ventilatio n is
5-6

sometime s use d on thes e tank s as a precautionar y measur e against
worke r exposure.
Emissions
Based on th e ventilatio n guideline s publishe d by th e American
Nationa l Standard s Institut e (ANSI) , th e emissio n potentia l from
cadmiu m electroplatin g tank s i s extremel y low. Cadmiu m cyanide
electroplatin g tank s ar e give n a hazardou s classificatio n of D-4,
th e lowes t possibl e rating. 5 I n th e 1990 Toxi c Chemica l Release
Inventor y (TRI) , 41 facilitie s reporte d cadmiu m emission s under
SI C 3471 , Platin g and Polishing. 6 Tota l cadmiu m emissions
reporte d fro m thes e facilitie s totale d 3,32 4 Mg (3,65 6 tons).
However , i t shoul d be note d tha t 25 percen t of th e facilities
accoun t fo r 98 percen t of th e emissions. Fift y percen t of the
facilitie s reporte d zer o emissions , and 25 percen t reporte d less
tha n 10 lb/y r of cadmiu m emissions. A revie w of th e facilities
wit h th e highe r emissio n estimate s reveale d tha t some of the
facilitie s wer e manufacturer s of platin g bat h chemical s and not
cadmiu m platin g facilities. No additiona l dat a ar e available
regardin g cadmiu m emission s fro m cadmiu m electroplatin g tanks.
SECONDARY BATTERY MANUFACTURE
Cadmiu m i s use d i n th e productio n of severa l type s of
secondar y (rechargeable ) batteries. I n 1991 , thi s are a accounted
fo r approximatel y 45 percen t of th e tota l demand fo r cadmium. 1
Thi s subsectio n focuse s on emission s and control s during
productio n of nickel-cadmiu m batteries , th e larges t segment of
th e cadmiu m batter y industry. Othe r batter y type s tha t use
cadmiu m includ e silver-cadmiu m batteries , whic h hav e aerospace
applications , and mercuri c oxide-cadmiu m butto n cells.
Informatio n was not availabl e on th e potentia l fo r cadmium
emission s fro m thes e othe r batter y types.
5-7
Nickel-cadmiu m cell s ar e manufacture d i n a variet y of forms
and size s fo r principall y tw o applications: industria l and
portabl e batteries. Nickel-cadmiu m batterie s fo r industria l use
ar e usuall y th e vente d (o r open ) or semi-seale d typ e and may be
eithe r pocke t plate , sintere d plate , or fibe r structured
construction. Vente d (open ) cel l design s ar e currentl y use d for
larger-size d cell s designe d fo r industria l or othe r heav y duty
applications. I n thes e applications , th e batterie s ar e subject
t o frequen t chargin g and requir e additio n of electrolyte s after
lon g period s of operation. Application s fo r th e industrial
batterie s includ e severa l railwa y use s (e.g. , locomotive
starting , emergenc y braking , signal s and warnin g lights) , standby
power fo r alar m systems , emergenc y lighting , military
communications , sola r energ y storage , navigatio n equipment,
hospita l operatin g rooms , and aeronautica l applications. 7
Sealed-cel l nickel-cadmiu m batterie s designe d fo r portable
application s (e.g. , toys , camcorders , portabl e tools , and
cellula r telephones ) usuall y ar e constructe d usin g sintere d plate
electrodes. Thes e cell s ar e manufacture d i n cylindrical , button,
and prismati c shapes ; the y may be recharge d up t o 2,00 0 times,
and requir e no maintenance. 7
Eigh t primar y producers , thei r plan t locations , batter y type,
and processe s use d wer e identifie d i n an EPA report. 8 The
informatio n on company name and plan t location s was update d using
emissio n report s fro m th e 1990 TRI and i s presente d in
Tabl e 5-3. 6 I n additio n t o thes e primar y producers , some
companie s may assembl e nickel-cadmiu m batterie s usin g imported
components.
5-8
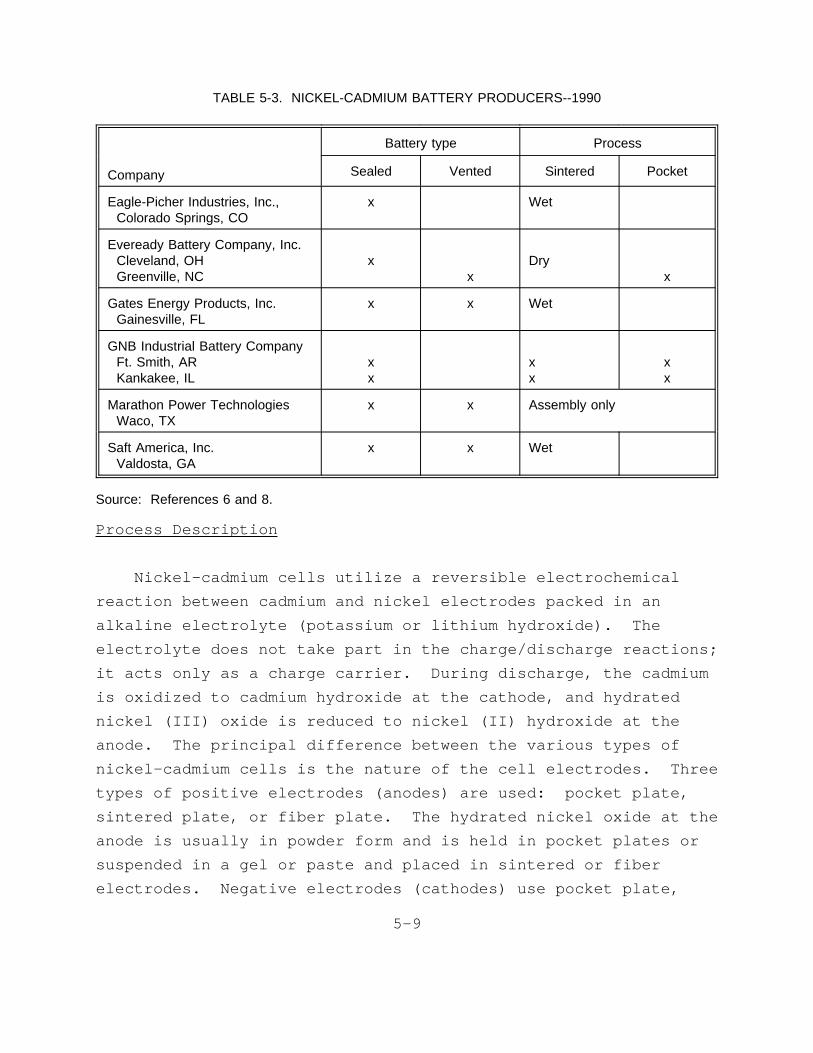
Proces s Description
TABLE 5-3. NICKEL-CADMIUM BATTERY PRODUCERS--1990
Company
Battery type Process
Sealed Vented Sintered Pocket
Eagle-Picher Industries, Inc.,Colorado Springs, CO
x Wet
Eveready Battery Company, Inc.Cleveland, OHGreenville, NC
xx
Dryx
Gates Energy Products, Inc.Gainesville, FL
x x Wet
GNB Industrial Battery CompanyFt. Smith, ARKankakee, IL
xx
xx
xx
Marathon Power TechnologiesWaco, TX
x x Assembly only
Saft America, Inc.Valdosta, GA
x x Wet
Source: References 6 and 8.
Nickel-cadmiu m cell s utiliz e a reversibl e electrochemical
reactio n betwee n cadmiu m and nicke l electrode s packe d i n an
alkalin e electrolyt e (potassiu m or lithiu m hydroxide). The
electrolyt e does not tak e par t i n th e charge/discharg e reactions;
i t act s onl y as a charg e carrier. Durin g discharge , th e cadmium
i s oxidize d t o cadmiu m hydroxid e at th e cathode , and hydrated
nicke l (III ) oxid e i s reduce d t o nicke l (II ) hydroxid e at the
anode. The principa l differenc e betwee n th e variou s type s of
nickel-cadmiu m cell s i s th e natur e of th e cel l electrodes. Three
type s of positiv e electrode s (anodes ) ar e used: pocke t plate,
sintere d plate , or fibe r plate. The hydrate d nicke l oxid e at the
anod e i s usuall y i n powder for m and i s hel d i n pocke t plate s or
suspende d i n a gel or past e and place d i n sintere d or fiber
electrodes. Negativ e electrode s (cathodes ) us e pocke t plate,
5-9
sintere d powder , fibe r plate , foa m or plasti c bande d support s to
hol d th e cadmiu m hydroxid e i n place. Graphit e or iro n oxid e is
commonl y adde d t o improv e th e conductivit y of bot h th e nicke l and
cadmiu m hydroxide. 7
A descriptio n of th e sintere d plat e wet proces s fo r nickel-
cadmiu m batter y productio n i s presente d i n thi s subsection. A
flo w diagra m fo r th e proces s i s shown i n Figur e 5-2. This
proces s appear s t o hav e th e greates t potentia l fo r cadmium
emission s as reporte d by th e industr y i n th e 1990 TRI survey. 6
Description s wer e not availabl e fo r th e othe r production
processes.
I n sintered-plat e formation , nicke l powder i s heate d on a
nickel-plate d stee l stri p t o giv e a porou s mediu m boun d t o a
base. Heatin g th e nicke l powder at hig h temperature s welds
togethe r th e contac t point s of th e nicke l powder grains. During
th e impregnatio n steps , solution s of nicke l or cadmiu m impregnate
th e voi d space s of th e sintere d nickel. Durin g th e nickel
impregnation , th e sintere d plat e i s soake d wit h a saturated
solutio n of nicke l nitrat e i n nitri c acid. The cadmium
impregnatio n ste p i s similar , excep t tha t th e saturate d solution
contain s cadmiu m nitrate. The cadmiu m nitrat e solutio n may be
prepare d onsit e fro m cadmiu m oxid e or purchased. 9
The impregnate d plate s ar e drie d and the n immerse d i n a
potassiu m hydroxid e solutio n t o conver t th e nicke l and cadmium
salt s t o thei r respectiv e hydroxides. The anode s (wit h nickel
hydroxide ) and cathode s (wit h cadmiu m hydroxide ) underg o a series
of step s befor e bein g assemble d int o cell s and the n batteries:
washin g and ove n drying , fina l causti c soak , hot deionize d water
rinse , formin g i n caustic , and fina l brus h and rinse. 8,9
5-10
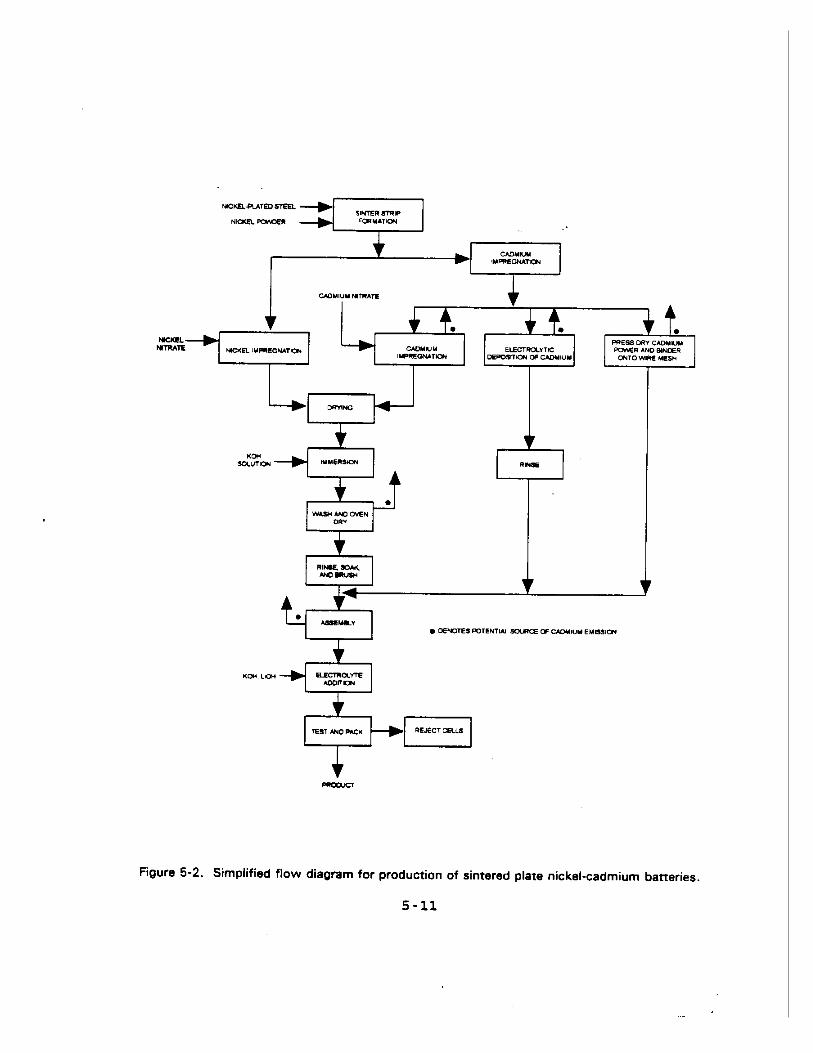

Two alternativ e method s fo r impregnatin g th e cathod e are
used. I n one method , th e cadmiu m i s electrolyticall y deposited
fro m a standar d cadmiu m electroplatin g solutio n ont o th e sintered
plate. The cadmium-plate d sintere d stri p i s the n rinse d and is
read y fo r assembly. I n anothe r metho d fo r cathod e production,
dr y cadmiu m powder and a binde r ar e presse d on wir e mesh i n a
mol d and transferre d t o th e assembl y steps. 8,9 Sinc e the
individua l cell s ar e precycle d befor e assemblin g int o batteries,
i t i s not importan t whethe r th e cathode s ar e originally
impregnate d wit h Cd(OH) 2 (th e produc t of discharg e reactions ) or
Cd (th e produc t of chargin g reactions). The reaction s ar e as
follows:
discharge2 β-NiOO H + Cd + 2H2O __________ > Ni(OH) 2 + Cd(OH) 2
<__________
charge
dischargeCd + 2OH- __________ > Cd(OH) 2 + 2e-
<__________
charge
Durin g assembly , th e nickel-containin g anod e and th e cadmium-
containin g cathode s ar e assemble d alternatel y int o cell s with
felte d nylo n cellulos e separators , and th e cell s ar e assembled
int o batter y case s of plasti c or nickel-plate d steel. The
electrolyt e containin g potassiu m hydroxid e and lithiu m hydroxide
i s adde d t o th e assemble d component s i n th e batter y case. The
separato r materia l hold s th e electrolyte , as wel l as separates
th e negativ e and positiv e electrodes. The batterie s finally
underg o testin g and packing ; faile d batterie s ar e rejected. 8,9
Emissio n Contro l Measures
I n a nickel-cadmiu m batter y plant , th e most common form s of
cadmiu m emitte d ar e cadmiu m nitrate , cadmiu m hydroxide , and
5-12
possibl y cadmiu m oxide. Al l ai r emission s of cadmiu m compounds
wil l occu r as particulat e matter--an d primaril y as fugitive
emission s due t o materia l handlin g and transfe r procedures , oven
dryin g operations , and cel l assembly.
The predominan t contro l method s use d i n th e industr y are:
(1 ) hood s and vacuu m system s ducte d t o dus t collector s and
(2 ) fabri c filter s i n cadmiu m handlin g areas. Fabri c filter s are
known t o be highl y effectiv e particulat e remova l devices,
especiall y fo r th e lowe r temperatur e emission s anticipate d for
thi s industry. At most facilities , fugitiv e emission s are
containe d withi n th e plan t and ar e capture d and sen t t o a control
device.
Emissions
Cadmiu m i s potentiall y emitte d fro m severa l step s i n the
manufactur e of nickel-cadmiu m batteries. Potentia l emission
source s wer e note d wit h a soli d circl e i n Figur e 5-2. Operations
involvin g th e handlin g of dr y cadmiu m salt s and powders , oven
drying , and cel l assembl y ar e th e likelies t sources.
Solutio n preparatio n i s als o a potentia l sourc e of cadmium
emissions. I f th e sintere d plate s ar e t o be impregnate d with
cadmiu m nitrat e solution , cadmiu m may be emitte d by th e handling
of dr y salt s durin g solutio n preparation. Preparatio n of the
cadmium-containin g electrolyt e fo r th e electrolyti c deposition
als o woul d emi t cadmiu m i f dr y materia l i s used. I f th e cathode
i s prepare d by th e dry-pressin g process , handlin g of dr y cadmium
powder s and pressin g th e cadmiu m powder int o th e gri d are
potentia l emissio n sources. Oven dryin g of cathod e plate
materia l and th e cel l assembl y ste p als o ar e potentia l cadmium
emissio n sources.
5-13
No cadmiu m emissio n factor s hav e been publishe d fo r the
nickel-cadmiu m batter y productio n process , nor ar e any emission
tes t dat a availabl e tha t woul d allo w th e calculatio n of emission
factors. A 1985 backgroun d document on cadmiu m emissio n sources
estimate d nationwid e emission s fro m batter y manufacturin g at
100 kg/y r (22 0 lb/yr). 8 I n th e 1990 TRI , th e eigh t battery
productio n site s shown i n Tabl e 5- 3 reporte d a tota l annual
cadmiu m releas e of 316 kg (69 7 lb). 6 Based on thes e data , the
productio n of nickel-cadmiu m batterie s does not appea r t o be a
majo r sourc e of cadmiu m emissions.
CADMIUM STABILIZER S FOR PLASTICS
Cadmiu m compounds , i n conjunctio n wit h bariu m compounds , have
been widel y use d as an effectiv e hea t stabilize r syste m for
polyviny l chlorid e (PVC) and relate d polymers. Polyvinyl
chlorid e i s generall y regarde d as one of th e most versatil e of
polymer s becaus e of it s compatibilit y wit h many othe r materials,
suc h as plasticizers , fillers , and othe r polymers. The major
disadvantag e i s it s poo r therma l stability. The physical
appearanc e and performanc e propertie s of PVC ca n be modifie d by
th e incorporatin g additives , but nothin g ca n be done to
completel y preven t polyme r decompositio n by physica l or chemical
means. Additive s classifie d as stabilizer s ca n effectively
hinde r and reduc e th e degradatio n proces s unti l i t essentially
ceases , but a breakdow n unde r th e actio n of physica l and chemical
agent s i s alway s presen t t o some degree. Severa l mechanism s have
been propose d as route s fo r PVC destruction. Thes e mechanisms
ar e quit e simila r chemicall y and ca n be directl y relate d t o the
physica l stat e of th e PVC. Dehydrochlorinatio n i s th e most
significan t caus e of degradatio n i n PVC. The proces s ca n be
initiate d eithe r by los s of a labile-chlorin e ato m or throug h a
fre e radica l reactio n wit h th e resultan t formatio n of a double
bond. As dehydrochlorinatio n continues , conjugate d doubl e bonds
5-14

ar e formed , resultin g i n a shif t i n th e wavelengt h of light
absorbe d by th e polymer. The wavelengt h of absorbe d light
change s accordin g t o th e number of conjugate d doubl e bond systems
tha t ar e present , and th e colo r of th e polyme r change s fro m light
yello w t o dar k yello w t o amber t o reddish-brow n and finall y to
black. 10
Stabilizer s ar e usuall y inorgani c or organometallic
compounds , whose names reflec t th e cation s involved. The major
classe s of stabilizer s ar e base d on tin , lead , and a mixtur e of
Grou p I I metals , suc h as barium , cadmium , and zinc. The Grou p II
meta l (mixe d metal ) stabilizer s hav e progresse d ove r th e years
fro m simpl e addition s of bariu m succinat e and cadmiu m palmitate
t o comple x blend s of barium/cadmium/zin c soaps , organophosphites,
antioxidants , solvents , extruders , peptizers , colorants,
ultraviole t (UV) absorbers , and many othe r constituents. Cadmium
stabilizer s wer e initiall y use d becaus e the y impar t clarit y and
retentio n of initia l colo r t o a PVC formulation. The long-term
hea t stabilit y supplie d by cadmiu m and zin c i s much les s than
tha t offere d by bariu m compounds. Cadmiu m stabilizer s are
functionall y dependen t upon th e anions , and th e anion s ar e a
majo r facto r tha t affect s properties , suc h as lubricity , plate-
out , clarity , colo r drift , and hea t stability. Common anion s for
cadmiu m ar e th e 2-ethylhexoat e (octoate) , phenate , benzoate , and
stearate. 10
Cadmium/bariu m stabilizer s ar e commerciall y availabl e in
liqui d or soli d form. Liqui d stabilize r system s ar e easie r to
handl e and do not resul t i n plate-ou t problems , whic h may occur
wit h th e powdere d systems. The liqui d stabilizer s usuall y hav e a
lowe r cadmiu m conten t ( 1 t o 4 percent ) and ar e cheape r on a
weigh t basis. Soli d stabilizer s hav e a highe r cadmiu m conten t (7
t o 15 percent ) and ar e more effectiv e tha n liqui d stabilizer s on
a weigh t basis. 13
5-15

I n thes e mixe d meta l stabilize r systems , th e cadmiu m content
range s fro m 1 t o 15 percent , and th e stabilize r system
constitute s betwee n 0. 5 t o 2. 5 percen t of th e fina l PVC
compounde d resin. 7 Most cadmium-containin g stabilize r systems
ar e barium/cadmium-zin c base d mixtures ; thes e system s ar e being
replace d wit h barium/zin c products. The successfu l replacement
of cadmium-containin g product s depend s principall y on th e us e of
highe r barium-to-zin c ratio s tha n barium-to-cadmiu m ratio s and
th e anio n chemistry , whic h compensate s fo r th e smalle r siz e of
th e zin c ato m compare d t o th e cadmiu m atom. 11 An estimate d 30
t o 35 percen t of th e cadmium-containin g stabilize r usag e i n the
U.S . has change d t o noncadmiu m products , and thi s percentag e is
expecte d t o increas e t o more tha n 50 percen t by th e end of
1992. 12
Proces s Description
The additio n of hea t stabilize r additive s occur s as par t of
th e overal l productio n of th e formulate d PVC resins. Formulation
of th e resi n normall y use s a blende r syste m and , dependin g upon
th e particula r PVC product , may be a batc h or continuous
operation. Soli d cadmiu m stabilize r system s may be added
directl y t o th e dr y PVC resi n and the n thoroughl y mixe d wit h the
resi n particles. Liqui d cadmiu m stabilizer s may be added
directl y t o th e resi n or mixe d wit h a liqui d plasticize r prio r to
additio n t o th e resin. The particula r sequenc e of stabilizer
additio n depend s upon th e processin g metho d t o be use d (e.g.,
calendering , extrusion , dipping). Afte r al l additives , including
th e stabilize r hav e been incorporated , th e formulate d resi n is
usuall y a free-flowin g powder or granul e wit h th e liquids
adsorbe d on th e resi n particles.
The most common usag e of cadmium-base d stabilizer s i s for
flexibl e and semi-rigi d PVC applications. 11 I n general , cadmium-
5-16
base d stabilizer s ar e use d i n th e productio n of flexibl e and
semi-rigi d PVC products. Thes e PVC product s ar e processe d by
calendering , extrusion , or injectio n moldin g techniques. 10
Cadmium-base d stabilizer s fin d limite d us e i n rigi d PVC products
or film s fo r electrica l uses. Liqui d cadmiu m stabilizer s may be
use d i n productio n of th e followin g type s of PVC products:
1. Flexibl e or semi-rigi d injectio n molded;
2. Clea r plastisols;
3. Thi n gaug e or lightl y fille d calendere d films;
4. Clea r and lightl y fille d extrude d film s or sheets ; and
5. Dippin g operations.
Soli d cadmium-base d stabilizer s may be use d i n highl y filled
calendere d shee t (e.g. , floo r tile ) or othe r calendering,
injectio n molding , or extrusio n processe s t o manufactur e filled
(i.e. , nonclear ) PVC products.
Emissio n Contro l Measures
No informatio n i s availabl e fo r th e specifi c type s of
emissio n contro l device s use d t o contro l cadmiu m emissions
resultin g fro m productio n of PVC products. One manufacturing
facilit y usin g cadmiu m stabilizer s indicate d tha t th e major
emissio n sourc e woul d be due t o material s handling. 16 This
sourc e presumabl y woul d be i n th e resi n formulatio n are a and i f a
smal l batc h operatio n wer e used , durin g transfe r of the
formulate d resin. Most soli d cadmiu m stabilizer s ar e produce d in
form s (e.g. , flaxes , pellets ) t o reduc e dus t emission s during
handling.
Cadmiu m emission s fro m th e processe s of extruding , molding,
and calenderin g ar e probabl y minima l sinc e th e temperatures
necessar y t o volatiliz e significan t quantitie s of cadmium
compounds woul d thermall y destro y th e resi n and othe r organic
constituents.
5-17
Emissions
Cadmiu m emission s may occu r when cadmium-containing
stabilizer s system s ar e adde d t o PVC resin s durin g formulation;
prio r t o processin g th e PVC resin. Althoug h us e of cadmiu m in
th e productio n of stabilizer s constitute s abou t 12 percen t of the
tota l demand fo r cadmium , th e emissio n of cadmiu m resultin g from
th e us e of th e stabilizer s durin g resi n formulatio n had not been
considere d a potentia l source. Tabl e 5- 4 present s cadmium
emission s by severa l manufacturer s of formulate d resin s and
plastic s reporte d i n th e 1990 TRI. 6 Some of thes e facilitie s are
probabl y als o usin g cadmium-base d pigment s i n th e resins , but the
reportin g syste m i n th e TRI does not easil y distinguis h between
th e tw o cadmiu m products. Thus , some of th e cadmiu m emissions
may resul t fro m pigmen t usage.
No emissio n factor s ar e publishe d fo r thi s process , and no
tes t dat a ar e availabl e t o allo w calculatio n of an emission
factor.
CADMIUM PIGMENTS I N PLASTICS
About 80 percen t of al l cadmium-base d pigment s i s use d i n the
plastic s industry. The othe r 20 percen t i s use d mostl y fo r the
coloratio n of paints , coatings , ceramics , and glasses. 15 I n the
plastic s industry , pigment s and othe r additive s ar e blende d with
th e resin s befor e th e plastic s product s ar e manufactured. This
blendin g ste p ca n be done i n conjunctio n wit h othe r manufacturing
step s at th e productio n site. Alternatively , custom-blended
resin s ca n be purchase d fro m anothe r company and transporte d to
th e productio n site. Thi s i s a common practic e fo r smaller
companie s or fo r specialt y products. Tabl e 5- 5 lists
manufacturer s of custo m compound purchase d resin s who reported
emission s of cadmiu m i n th e 1990 TRI. 6 Most of thi s grou p blends
5-18
TABLE 5-4. REPORTED CADMIUM EMISSIONS BY MANUFACTURERS OFFORMULATED RESINS AND PLASTIC PRODUCTS
Company Location
Reported emissions
kg lb
Rohm & Haas, Inc. Bristol, PA 2 5
Gencorp Polymer Products Newcomerstown, OH 5 10
General Electric Plastics Selkirk, NY 8 16
Synthetic Products Company Stratford, CT (2)Cleveland, OH
118227
261500
Monsanto Company Addyson, OH 5 11
General Electric Chemicals Washington, WV 1 2
Huls America, Inc. Mountain Top, PA 113 250
Franklin Burlington Plastics Burlington, NJ 227 500
O’Sullivan Corp. Lebannon, PAWinchester, VAYerington, NV
555
101010
Gary Corp. Leominster, MA 43 94
North American Plastics, Inc. Prairie, MS 5 10
Vytron Corp. Loudon, TN 113 250
Standard Products Company Winnsboro, SC 2 5
RJF International Corp. Marietta, OH 5 10
Achilles USA, Inc. Everett, WA 16 35
IPC Corinth Division, Inc. Corinth, MS 113 250
B.F. Goodrich Pedricktown, NJ 24 52
Regalite Plastics Corp. Newton Upper Falls, MA 5 10
TOTAL 1,047 2,301
Source: Reference 6.
Note: In addition to the companies and locations shown in the table, 16 additional companies orlocations reported zero cadmium emissions.
5-19

TABLE 5-5. REPORTED CADMIUM EMISSIONS BY PRODUCERS OFCUSTOM COMPOUNDED RESINS
Company Location
Emissions
kg lb
Plastics Color Chip, Inc. Ashboro, NCCalumet City, IL
227116
500255
Vista Chemical Company Jeffersontown, KY 116 255
Reed Plastics Corp. Albion, MIHolden, MA
22
55
General Color and ChemicalCompany
Minerva, OH 113 250
A. Schulman, Inc. Akron, OH 5 10
PMS Consolidated Norwalk, OHFt. Worth, TXFlorence, KYGastonia, NCSt. Peters, MOSomerset, NJElk Grove Village, IL
227116116227227116116
500255255500500255255
Teknor Apex Company Pawtucket, RI 5 10
Hoechst Celanese Florence, KY 5 10
Quantum Chemical Corp. Fairport Harbor, OH 227 500
TOTAL 1,963 4,320
Source: Reference 6.
5-20

pigment s wit h resins.
The cost s of purchasin g custo m compounde d resin s hav e risen
t o a leve l wher e some producer s of plasti c good s hav e change d to
blendin g thei r own resins. Thi s shif t i n productio n local e may
be particularl y tru e fo r user s of cadmiu m pigments , becaus e these
pigment s ar e expensiv e and hav e advantage s of eas y mixin g and
rapid , eve n spreading.
Proces s Description 16
Most commercia l pigment s hav e an averag e particl e siz e i n the
rang e of 10-3 t o 10-5 mm (0.0 1 t o 1. 0 µ). The dr y pigmen t powders
ar e usuall y agglomerate d befor e sal e i n orde r t o reduc e material
los s durin g transport. Thes e agglomerate s must be disperse d by
th e compound resi n manufacturer , eithe r befor e or during
processing. The initia l ste p i n dr y pigmen t dispersio n is
wettin g of th e pigmen t surface. Subsequen t step s ar e breaking
down of agglomerates , distributio n of th e particle s i n th e resin,
and stabilizatio n of th e dispersion. 17 Sinc e cadmiu m pigment
los s woul d be minima l afte r th e dr y pigmen t i s wet , this
discussio n focuse s on material s handling.
Bul k material s ca n be store d i n outdoo r silos , boxes , bags,
or drums. Larg e vacuu m pumps transpor t material s fro m railca r or
truc k t o silos. Smalle r vacuu m pumps transpor t material s from
onsit e storag e i n bags , drums , and boxe s t o th e hoppe r loader s of
proces s machinery , i f not t o th e machine s themselves. Vacuum
line s ente r hopper s tangentiall y so tha t th e materia l ca n be
separate d fro m th e conveyin g ai r stream. An externa l ratio
mixin g valv e i s usuall y locate d at th e inle t of eac h vacuum
hoppe r t o allo w regrind s and othe r recycle d materia l t o be
proportionall y mixe d wit h virgi n materia l prio r t o processing. 17
5-21

Emissio n Contro l Measures
Accordin g t o conversation s wit h company official s at
productio n plants , i t was determine d tha t cadmiu m emissions
originat e primaril y fro m material s handling. 18,19
Hand method s of blendin g material s ca n wast e up t o 25 percent
of purchase d colorants. Automati c methods , suc h as metering,
mixing , and vacuu m transport , substantiall y reduc e wast e and
emissions. Emission s of powdere d material s fro m vacuu m hoppers
ar e usuall y controlle d wit h filter s and floor-mounte d dust
collectors. Al l cadmiu m emissions , as cadmiu m pigments , woul d be
i n a particulat e for m so th e us e of dus t filter s and dust
collector s shoul d be an effectiv e emissio n contro l measure.
However , ther e ar e no tes t dat a availabl e t o substantiat e the
effectivenes s of thes e control s fo r th e cadmiu m pigment
particulat e foun d at thes e sources.
Emissions
Emissio n factor s ar e not availabl e fo r pigmen t blending
operations , whic h hav e not been recognize d as a potentia l source
of cadmiu m emission s i n previou s surveys. No tes t dat a are
availabl e tha t ca n be use d t o calculat e emissio n factors.
5-22

REFERENCES
1. 1991 Minera l Industr y Surveys--Cadmium. Annual Review.Burea u of Mines , U.S . Departmen t of Interior , Washington , DC.Januar y 1993.
2. Kraft , G.G. "Th e Futur e of Cadmiu m Electroplating, " MetalFinishing. Volum e 88, No. 7. Jul y 1990.
3. Finishers ’ Management Media/Marke t Bulletin. Meta l FinishingJo b Shop Industria l Profile...1985/86. Glenview , IL. 1986.
4. Meta l Finishing. Guideboo k and Director y Issue.Januar y 1993. Volum e 91, Number 1A. New York , NY.
5. America n Nationa l Standard , Practice s fo r Ventilatio n andOperatio n of Open-Surfac e Tanks , America n Nationa l StandardsInstitute , New York , NY.
6. U. S. Environmenta l Protectio n Agency. 1990 Toxic s ReleaseInventory. Offic e of Toxi c Substances , Washington , DC.Januar y 1993.
7. Cadmiu m Association/Cadmiu m Council. Technica l Note s onCadmium. Cadmiu m Production , Properties , and Uses. CadmiumAssociation , London ; Cadmiu m Council , New York , NY. 1991.
8. Radia n Corporation. Backgroun d Informatio n Document forCadmiu m Emissio n Sources. DCN No. 85-203-012-23-06 , EPAContrac t No. 68-02-3818 , Assignmen t 23. Pollutan t AssessmentBranch , U. S. Environmenta l Protectio n Agency , ResearchTriangl e Park , NC. May 1985.
9. Radia n Corporation. Locatin g and Estimatin g Ai r Emissionsfro m Source s of Nickel. EPA-450/4-84-007f. Offic e of AirQualit y Plannin g and Standards , U. S. EnvironmentalProtectio n Agency , Researc h Triangl e Park , NC. Marc h 1984.
10. Moder n Plastics. Encyclopedi a ’92. "Chemical s andAdditivies: Stabilizers". Vol . 68 (11) , pp. 190-192.McGraw Hil l Publishing , New York , NY. Octobe r 1991.
11. Moder n Plastics. Specia l Buyer s Guid e and Encyclopedia , 1993Issue. "Additives: Heat Stabilizers." Vol . 69 (13),pp. 313-315. McGraw Hil l Publishing , New York , NY.December 1992.
12. Moder n Plastics. "Specia l Report: Chemical s and Additives."Vol . 69 (9) , pp. 61-63. McGraw Hil l Publishing , New York,NY. Septembe r 1992.
5-23
13. Cadmiu m Association/Cadmiu m Council. Technica l Note s onCadmium: Cadmiu m i n Stabilizer s fo r Plastics. CadmiumAssociation , London ; Cadmiu m Council , New York , NY. 1978.
14. Telecon. Gupta , R., Midwes t Researc h Institut e withP. Vorhees , Rohm and Haas, Philadelphia , PA. Particulateemission s fro m th e us e of cadmiu m stabilizer s i n PVC.Apri l 1992.
15. Lynch , R.F. Colo r I t Cadmiu m When You Need th e Best.Plastic s Eng. , Apri l 1985.
16. Witlock , D.C. Material s Handling: I n Moder n PlasticsEncyclopedia , Vol . 63 (10A) , Octobe r 1986.
17. Schiek , R.C. Colorants: I n Moder n Plastic s Encyclopedia;Vol . 63(10A). Octobe r 1986.
18. Telecon. Camp, J. , Midwes t Researc h Institute , withV. Karagan , Avecor , Inc. , San Fernando , CA. Apri l 9, 1992.Cadmiu m pigment s material s handlin g durin g compoundin g withresins.
19. Telecon. Camp, J. , Midwes t Researc h Institute , withD. Frost , PMS Consolidated , Toledo , OH. Apri l 16, 1992.Cadmiu m pigmen t material s handlin g durin g compoundin g withresins.
5-24

SECTION 6
EMISSIONS FROM COMBUSTION SOURCES
Cadmiu m i s ofte n foun d as a trac e contaminan t i n fossi l fuels
or wast e materials. When thes e material s ar e fe d t o combustion
processes , th e combinatio n of th e elevate d temperatur e of the
proces s and th e relativ e volatilit y of cadmiu m result s i n cadmium
bein g partitione d betwee n th e as h and th e combustio n gas exhaust
stream. Thi s sectio n addresse s cadmiu m emission s fro m seven
stationar y sourc e combustio n processes:
- Coal combustion
- Oi l combustion
- Natura l gas combustion
- Wood combustion
- Municipa l wast e combustion
- Sewage sludg e incineration
- Medica l wast e incineration
Thes e seve n processe s fal l int o tw o genera l categories. The
firs t fou r involv e fossi l fue l combustio n fo r energ y generation,
whil e th e las t thre e ar e primaril y wast e disposa l processes,
althoug h some energ y may be recovere d fro m thes e processes. The
paragraph s belo w provid e a genera l introductio n t o th e two
combustio n categories. As par t of thi s introduction , a summary
of nationwid e fue l usag e i s presente d i n detail. This
informatio n was use d i n Sectio n 3 t o develo p nationwid e emissions
of cadmiu m fo r differen t sector s and fuels. Such informatio n is
als o neede d t o develo p cadmiu m emissio n inventorie s fo r specific
6-1
areas. I t i s include d i n th e introductio n rathe r tha n in
individua l section s becaus e (1 ) th e individua l section s are
organize d by fue l typ e rathe r tha n by us e secto r and (2 ) fossil
fue l us e pattern s diffe r geographicall y by industr y sector. The
introductio n als o briefl y describe s th e wast e combustion
category. Specifi c discussion s fo r th e seve n sourc e categories
follo w thes e introductor y paragraphs.
I n 1990 , th e tota l annua l nationwid e energ y consumptio n in
th e Unite d State s was 85.5 3 x 10¹² megajoule s (MJ)
(81.1 5 x 10¹⁵ Britis h therma l unit s [Btu]). 1 Of thi s total , about
52.0 1 x 10¹² MJ (49.3 5 x 10¹⁵ Btu ) or 61 percen t involved
consumptio n of coal , petroleu m products , and natura l gas in
nontransportatio n combustio n processes. (N o dat a wer e available
on energ y consumptio n fo r wood combustio n fro m th e Unite d States
Departmen t of Energy.) Tabl e 6- 1 summarize s th e 1990 United
State s distributio n of fossi l fue l combustio n as a functio n of
fue l i n th e utility , industrial , commercial , and residential
sectors. The paragraph s belo w provid e brie f summarie s of fuel
us e patterns ; additiona l detail s on fue l consumptio n by sector
fo r eac h Stat e ca n be foun d i n Referenc e 1.
As shown i n Tabl e 6-1 , th e utilit y secto r i s th e largest
fossi l fue l energ y consume r at th e rat e of abou t 21 x 1012 MJ
(2 0 x 1015 Btu ) per year. About 80 percen t of thi s energ y was
generate d fro m coa l combustion , wit h bituminou s and lignit e coal
contributin g substantiall y greate r quantitie s tha n anthracite
coal. I n fact , Pennsylvani a i s th e onl y Stat e i n which
anthracit e coa l i s use d fo r electri c power generation. Although
most State s relie d primaril y on coa l fo r power generation , the
distributio n among fossi l fuel s varie d fro m Stat e t o State , and
severa l State s relie d heavil y on natura l gas and fue l oi l for
power generation. I n California , natura l gas provide s about
90 percen t of th e fossil-fue l base d electricit y production , and
6-2

TABLE 6-1. DISTRIBUTION OF FOSSIL FUEL CONSUMPTIONIN THE UNITED STATES
Fuel
Annual energy consumption1012 MJ (10 15 Btu)
Utilities Industrial Commercial Residential Total
Bituminous/lignite coal
16.939(16.071)
2.892(2.744)
0.085(0.081)
0.045(0.043)
19.961(18.939)
Anthracite coal 0.018(0.017)
0.009(0.009)
0.013(0.012)
0.019(0.018)
0.059(0.056)
Distillate oil 1.201(1.139)
1.245(1.181)
0.513(0.487)
0.882(0.837)
3.900(3.700)
Residual oil 0.091(0.086)
0.436(0.414)
0.255(0.242)
--
0.782(0.742)
Other petroleumfuels
0.026(0.025)
7.083(6.720)
0.197(0.187)
0.452(0.429)
8.540(7.361)
Natural gas 3.015(2.861)
8.925(8.468)
2.907(2.758)
4.762(4.518)
19.609(18.605)
Total 21.290(20.199)
20.590(19.536)
3.970(3.767)
6.160(5.845)
52.01(49.35)
Source: Reference 1.
6-3

no coa l i s used. I n Hawaii , fue l oi l i s use d exclusively , while
i n Oklahom a and Texas , a mixtur e of coa l and fue l oi l ar e used.
I n Florida , Louisiana , Massachusetts , and New York , coal , fuel
oil , and natura l gas eac h represen t a substantia l fractio n of the
power generation. The State s of Idaho , Maine , Rhode Island , and
Vermont had no coa l consumption. Idah o relie s exclusivel y on
hydroelectri c power , whil e th e New Englan d State s us e a mixture
of fue l oil , natura l gas , nuclear , and hydroelectri c sources.
At 20. 6 x 10¹² MJ (19. 5 x 10¹⁵ Btu ) per year , th e industrial
secto r i s th e secon d larges t consume r of fossi l fuels. This
secto r use s a mixtur e of natura l gas (4 3 percent) , fue l oil
( 8 percent) , othe r petroleu m fuel s (3 4 percent) , and coal
(1 4 percent). The othe r petroleu m fuel s tha t ar e use d include
primaril y liquifie d petroleu m gas , asphal t and roa d oil , and
othe r nonclassifie d fuels. Again , th e distributio n among the
thre e fue l type s varie s substantiall y fro m Stat e t o State , with
eac h of th e thre e contributin g significan t fraction s i n most
States. Notabl e exception s ar e Hawaii , whic h relie s almost
exclusivel y on petroleu m fuels ; Alaska , whic h relie s primaril y on
natura l gas ; and th e northeaster n State s of Connecticut , New
Hampshire , Rhode Island , and Vermont , whic h us e almos t no coal.
As shown i n Tabl e 6-1 , substantiall y smalle r quantitie s of
fossi l fue l ar e use d i n th e commercia l and residentia l sectors
tha n ar e use d i n th e utilit y and industria l sectors. The fuels
use d ar e primaril y natura l gas , fue l oil , and liquifie d petroleum
gas (th e "othe r petroleu m fuels " i n th e residentia l category).
Almos t al l State s us e a mixtur e of th e fuels , but the
distribution s var y substantially , wit h some State s like
Californi a and Louisian a usin g primaril y natura l gas and others
lik e New Hampshir e and Vermont usin g a much greate r fractio n of
fue l oil. One uniqu e cas e i s Pennsylvani a wher e anthracit e coal
i s use d i n bot h th e residentia l and commercia l sectors.
6-4
I n th e individua l section s below , additiona l informatio n will
be presente d on th e cadmiu m conten t of th e differen t fuel s and on
th e relationshi p betwee n fue l typ e and emissions. However , for
any geographi c area , th e contributio n of energ y generation
source s t o cadmiu m emission s wil l be a functio n of the
distributio n of fuel s use d i n th e differen t sector s withi n the
area.
The source s withi n th e secon d combustio n categor y ar e engaged
primaril y i n wast e disposal. Cadmiu m emission s fro m these
processe s ar e relate d t o th e cadmiu m contaminan t level s i n the
waste. The differen t wast e type s ar e generall y characterized
wit h distinc t sourc e categories . Furthermore , thes e waste
disposa l practice s ar e not strongl y related. Consequently , each
of thes e categorie s wil l be characterize d individuall y withi n the
section s belo w rathe r tha n i n a genera l discussio n here. The
eigh t section s belo w hav e a consisten t organization. First , the
characteristic s of th e fue l or wast e ar e describe d and , i n the
cas e of th e wast e combustio n processes , th e genera l source
categor y i s als o described. Second , proces s description s are
presente d and emissio n point s ar e identified. Third , available
emissio n contro l measure s ar e identifie d and described. Finally,
emissio n factor s ar e presented.
COAL COMBUSTION
As presente d i n Tabl e 6-1 , most coa l combustio n i n th e United
State s occur s i n th e utilit y and industria l sectors , wit h about
85 percen t bein g bituminou s and lignit e combustio n withi n the
utilit y secto r and abou t 14 percen t bein g bituminou s and lignite
combustio n i n th e industria l sector. Consequently , th e focu s of
th e discussio n belo w wil l be on bituminou s and lignit e coal
combustio n i n utilit y and industria l boilers. However , limited
informatio n on anthracit e coa l combustio n wil l als o be presented.
6-5

Coal Characteristics
The coa l characteristic s of greates t interes t i n evaluating
cadmiu m emission s fro m coa l combustio n ar e coa l heatin g values
and coa l cadmiu m content. Cadmiu m emission s ar e a direct
functio n of th e cadmiu m content , whil e heatin g value s ar e use d to
conver t emissio n factor s betwee n mass input-base d and heat
input-base d activit y levels. Thi s sectio n briefl y summarize s the
informatio n abou t coa l heatin g level s and cadmiu m content
containe d i n Reference s 2 throug h 4. More complet e summarie s can
be foun d i n Referenc e 2, and detaile d analyse s of coa l cadmium
conten t as a functio n of coa l typ e and geographi c regio n ca n be
foun d i n Reference s 3 and 4.
Coal i s a comple x combinatio n of organi c matte r and inorganic
as h forme d i n geologi c formation s fro m successiv e layer s of
falle n vegetation. Coal type s ar e broadl y classifie d as
anthracite , bituminous , subbituminous , or lignite , and
classificatio n i s made by heatin g value s and amount s of fixed
carbon , volatil e matter , ash , sulfur , and moisture. 5 Formulas
fo r differentiatin g coal s base d on thes e propertie s ar e give n in
Referenc e 6. Thes e fou r coa l type s ar e furthe r subdivided
int o 13 componen t groups. Tabl e 6- 2 summarize s informatio n about
th e heatin g value s fo r thes e componen t groups. 2
The heatin g valu e of coa l varie s betwee n coa l regions,
betwee n mine s withi n a region , betwee n seams withi n a mine , and
withi n a seam. The variabilit y i s minima l compare d t o tha t found
wit h trac e meta l level s describe d below , but i t may be important
when fue l hea t conten t i s use d as th e activit y leve l measur e for
sourc e emissio n calculations. Dat a presente d i n Tabl e 6-3
illustrat e th e regiona l variabilit y of coa l hea t content. Heat
conten t among coal s fro m severa l differen t mine s withi n a region
appear s t o exhibi t greate r variabilit y tha n eithe r variability
6-6

TABLE 6-2. COAL HEATING VALUES
Heating value, kJ/kg (Btu/lb)
Coal classComponent
group Definition Source a Rangea Average a
Anthracite A1 Meta-anthracite PA,RI 21,580-29,530(9,310-12,740)
25,560(11,030)
A2 Anthracite CO,PA,NM 27,700-31,800(11,950-13,720)
30,270(13,001)
A3 Semianthracite AR,PA,VA 27,460-31,750(11,850-13,700)
29,800(12,860)
Bituminous B1 Low volatilebituminous
AR,MD,OK,PA,WV
30,640-34,140(13,220-14,730)
32,400(13,980)
B2 Medium volatilebituminous
AL,PA,VA 31,360-33,170(13,530-14,310)
32,170(13,880)
B3 High volatileA bituminous
AL,CO,KS,KY,MO,NM,PA,TN,TX,UT,VA,WV
28,340-35,710(12,230-14,510)
31,170(13,450)
B4 High volatileB bituminous
IL,KY,MO,OH,UT,WY
26,190-30-480(11,300-13,150)
28,480(12,290)
B5 High volatileC bituminous
IL,IN,IA,MI 24,450-27,490(10,550-11,860)
26,030(11,230)
Subbituminous S1 Subbituminous A MT,WA 23,940-25,820(10,330-11,140)
24,890(10,740)
S2 Subbituminous B WY 21,650-22,270(9,340-9,610)
21,970(9,480)
S3 Subbituminous C CO,WY 19,280-19,890(8,320-8,580)
19,580(8,450)
Lignite L1 Lignite A ND,TX 16,130-17,030(6,960-7,350)
16,660(7,190)
L2 Lignite B NA NA NA
Source: Reference 2.
aNA = Not available.
6-7
TABLE 6-3. EXAMPLES OF COAL HEAT CONTENT VARIABILITY
Variability Coal source
Coal heat content, Btu/lb Percentvariation about
the meanMean Range
Interminevariability
Eastern U.S.
Central U.S.
Western U.S.
12,320
10,772
11,227
10,750 - 13,891
9,147 - 12,397
9,317 - 13,134
12.7
15
17
Intraminevariability
Eastern U.S.
Central U.S.
Western U.S.
12,95010,00812,000
12,48010,975
10,351
NAa
9,182 - 10,83411,335 - 12,665
NAa
9,667 - 12,284
9,791 - 10,911
4.8 b
8.05.5
5.7 c
12.0
5.4
Intraseamvariability
Eastern U.S.
Central U.S.
Western U.S.
12,230
10,709
11,540
NAa
10,304 - 11,113
NAa
3.0 d
3.7
2.5 e
Source: Reference 2.
aNA = not available.
bBased on a standard deviation of 624.
cBased on a standard deviation of 708.
dBased on a standard deviation of 371.
eBased on a standard deviation of 291.
6-8
withi n a min e or withi n a seam. For th e sampl e point s presented
i n Tabl e 6-3 , intermin e variabilit y average d 15 percent,
intramin e variabilit y 7 percent , and intrasea m variability
3 percent. Becaus e fe w combustio n source s bur n coa l fro m just
one sea m or one mine , coa l hea t conten t variabilit y may
significantl y affec t emissio n estimate s tha t ar e bein g calculated
usin g emissio n factors , coa l us e data , and coa l hea t content
data , eve n i f th e sourc e get s al l it s coa l fro m th e same are a of
th e country. 2
To an eve n greate r exten t tha n th e heatin g value , th e cadmium
conten t of coa l varie s substantiall y among coa l types , at
differen t location s i n th e same mine , and acros s geographic
regions. The most comprehensiv e sourc e of informatio n on coal
compositio n i s th e Unite d State s Geologica l Surve y (USGS)
Nationa l Coal Resource s Dat a Syste m (NCRDS). Geochemica l and
trac e elemen t dat a ar e store d withi n th e USCHEM fil e of NCRDS.
As of Octobe r 1982 , th e fil e containe d informatio n on 7,53 3 coal
sample s representin g al l Unite d State s coa l provinces. Trace
elemen t analysi s fo r abou t 4,40 0 coa l sample s wer e include d in
th e dat a base. Thi s computerize d dat a syste m was not accessed
durin g th e curren t stud y due t o tim e and budgetar y constraints
and informatio n fro m USGS tha t indicate d tha t fe w dat a had been
adde d t o th e syste m sinc e 1972 ; however , a summary of th e data
presente d i n Referenc e 2 was reviewed. The most extensiv e source
of publishe d trac e elemen t dat a was produce d by Swanson et al . of
th e USGS.4 Thi s repor t contain s dat a fo r 799 coa l sample s taken
fro m 150 producin g mine s and include s th e most importan t United
State s coa l seams. Dat a fro m th e Swanson stud y was th e initial
inpu t int o th e USCHEM fil e of NCRDS. The informatio n presented
her e summarize s Brooks ’ revie w of th e result s publishe d by White
and Swanson. 2-4 Not e tha t thes e result s ar e consisten t with
unpublishe d analyse s conducte d by USGS on th e dat a containe d in
NCRDS as of 1989. 7
6-9

Tabl e 6- 4 present s informatio n on th e mean concentratio n of
cadmiu m i n coa l and on th e distribution s of cadmium
concentration s by coa l type. Bituminou s coal s hav e th e highest
mean cadmiu m concentration , 0.9 1 part s per millio n by
weigh t (ppmwt). The standar d deviatio n of th e mean, 7. 3 ppmwt,
exceed s th e mean, indicatin g substantia l variatio n withi n the
data. Bituminou s coal s hav e th e greates t reporte d rang e of
cadmiu m concentration s (<0.0 2 t o 100 ppmwt). 2 Based on
conversation s wit h USGS personnel , th e means reporte d in
Tabl e 6- 4 ar e regarde d as typica l value s fo r in-groun d cadmium
concentratio n i n coal s i n th e Unite d States.
The concentratio n of cadmiu m i n coa l als o varie s by
geographi c regio n fro m whic h th e coa l i s mined. Based on the
"bes t typical " value s fo r eac h region , whic h ar e footnote d in
Tabl e 6-5 , coal s fro m th e Interio r Provinc e hav e th e highes t mean
cadmiu m concentration , 5.4 7 ppmwt. That stud y als o showed that
th e greates t rang e of concentration s i s foun d i n coal s fro m the
Interio r Province , wit h a reporte d rang e of <0.0 2 t o 100 ppmwt.
Also , base d on th e bes t availabl e data , th e lowes t mean
concentratio n i s foun d i n coal s fro m th e Appalachia n region
(0.1 3 ppmwt). 2 The means reporte d i n Tabl e 6- 5 may be regarded
as typica l in-groun d concentration s of cadmiu m i n coal s fro m each
geographi c region.
Proces s Description 2,5,8
As shown i n Tabl e 6-1 , almos t al l coa l combustio n occur s in
utilit y and industria l boilers. Almos t al l of th e coa l burne d is
bituminou s and subbituminou s (9 5 percent ) and lignite
( 4 percent). 2 However , th e processe s use d fo r th e different
coal s ar e comparable. The paragraph s belo w firs t describ e the
boiler s use d fo r bituminou s coa l combustion. Then, lignit e and
6-10

TABLE 6-4. CADMIUM CONCENTRATION IN COAL BY COAL TYPE
Cadmium concentration, ppmwt
Coal typeCadmium concentration
range, ppmwt Mean Standard deviationNumber of
samples
Bituminous
Subbituminous
Anthracite
Lignite
<0.02 to 100
0.04 to 3.7
0.1 to 0.3
<0.11 to 5.5
0.91
0.38
0.22
0.55
7.3
0.47
0.30
0.61
3,527
640
52
183
Source: Reference 2.
TABLE 6-5. CADMIUM CONCENTRATION IN COAL BY REGION
RegionNumber of
samples
Cadmium concentration, ppmwt
Range Arithmetic mean Standard deviation
Appalachian 2,749331
---0.03-6.8
0.13 a
0.7
0.21---
Interior 592155
---<0.02-100
5.47 a
7.1
18.5---
Illinois Basin 82 0.1-65 2.89 ---
Gulf Province 3834
---<0.11-5.5
0.50 a
1.3
0.49---
Northern Plains 371490
---0.02-2.7
0.30 a
0.08
0.48---
Rocky Mountains 512124
---<0.03-0.5
0.35 a
<0.5
0.38---
Alaska 10718
---<0.1-0.7
0.28 a
<0.2
0.59---
Source: Reference 2.
aValues are based on the most comprehensive data set currently available and may be used as typical values forcadmium in coal from these regions.
6-11

anthracit e combustio n ar e describe d briefly. Reference s 5
and 8 offe r additiona l detail s on thes e processes.
The tw o majo r coa l combustio n technique s use d t o fire
bituminou s and subbituminou s coal s ar e suspensio n firin g and
grat e firing. Suspensio n firin g i s th e primar y combustion
mechanis m i n pulverize d coa l and cyclon e systems. Grat e firing
i s th e primar y mechanis m i n underfee d and overfee d stokers. Both
mechanism s ar e employe d i n spreade r stokers.
Pulverize d coa l furnace s ar e use d primaril y i n utilit y and
larg e industria l boilers. I n thes e systems , th e coa l is
pulverize d i n a mil l t o th e consistenc y of talcu m power (i.e. , at
leas t 70 percen t of th e particle s wil l pas s throug h a 200-mesh
sieve). The pulverize d coa l i s generall y entraine d i n primary
ai r and suspension-fire d throug h th e burner s t o th e combustion
chamber. Pulverize d coa l furnace s ar e classifie d as eithe r dry
or wet bottom , dependin g on th e as h remova l technique. Dry
botto m furnace s fir e coal s wit h hig h as h fusio n temperatures , and
dr y as h remova l technique s ar e used. I n wet botto m (sla g tap)
furnaces , coal s wit h lo w as h fusio n temperature s ar e used , and
molte n as h i s draine d fro m th e botto m of th e furnace.
Cyclon e furnace s bur n lo w as h fusio n temperatur e coa l crushed
t o a 4-mes h size. The coa l i s fe d tangentially , wit h primary
air , t o a horizonta l cylindrica l combustio n chamber. Smal l coal
particle s ar e burne d i n suspension , whil e th e large r particles
ar e force d agains t th e oute r wall. Becaus e of th e high
temperature s develope d i n th e relativel y smal l furnac e volume,
and becaus e of th e lo w fusio n temperatur e of th e coa l ash , much
of th e as h form s a liqui d sla g tha t i s draine d fro m th e botto m of
th e furnac e throug h a sla g ta p opening. Cyclon e furnace s are
use d mostl y i n utilit y and larg e industria l applications.
6-12
I n spreade r stokers , a flippin g mechanis m throw s th e coal
int o th e furnac e and ont o a movin g fue l bed . Combustio n occurs
partiall y i n suspensio n and partiall y on th e grate. Becaus e the
entraine d particle s i n th e furnac e exhaus t hav e substantial
carbon , flyas h reinjectio n fro m mechanica l collector s i s commonly
use d t o improv e boile r efficiency. Ash residu e i n th e fue l bed
i s deposite d i n a receivin g pi t at th e end of th e grate.
I n overfee d stokers , coa l i s fe d ont o a travelin g or
vibratin g grat e and burn s on th e fue l bed as i t progresses
throug h th e furnace. Ash particle s fal l int o an as h pi t at the
rea r of th e stoker. "Overfeed " applie s becaus e th e coa l i s fed
ont o th e movin g grat e unde r an adjustabl e gate. Conversely , in
"underfeed " stokers , coa l i s fe d int o th e firin g zon e from
underneat h by mechanica l rams or scre w conveyers. The coa l moves
i n a channel , known as a retort , fro m whic h i t i s force d upward,
spillin g ove r th e to p of eac h sid e t o fee d th e fue l bed.
Combustio n i s complete d by th e tim e th e bed reache s th e sid e dump
grates , fro m whic h th e as h i s discharge d t o shallo w pits.
The nex t most common coa l use d i n th e Unite d State s is
lignite. Lignit e i s a relativel y youn g coa l wit h properties
intermediat e t o thos e of bituminou s coa l and peat. Because
lignit e has a hig h moistur e conten t (3 5 t o 40 weigh t percent ) and
a lo w wet basi s heatin g valu e (3,90 0 kcal/k g [7,20 0 Btu/lb]) , it
generall y i s use d as a fue l onl y i n area s i n whic h i t i s mined.
Lignit e i s use d mainl y fo r steam/electri c productio n i n power
plant s and typicall y i s fire d i n large r pulverize d coal-fire d or
cyclone - fire d boilers.
Anthracit e coa l i s a high-ran k coa l wit h more fixe d carbon
and les s volatil e matte r tha n eithe r bituminou s coa l or lignite.
Becaus e of it s lo w volatil e matte r conten t and sligh t clinkering,
anthracit e i s most commonl y fire d i n medium-size d travelin g grate
6-13

stoker s and smal l hand-fire d units. Some anthracite
(occasionall y wit h petroleu m coke ) i s use d i n pulverize d coal-
fire d boilers , and i t may be blende d wit h bituminou s coal.
Becaus e of it s lo w sulfu r conten t (typicall y les s tha n 0. 8 weight
percent ) and minima l smokin g tendencies , anthracit e i s considered
a desirabl e fue l i n area s wher e i t i s readil y available. I n the
Unite d States , anthracit e i s mine d i n northeaster n Pennsylvania
and i s consume d mostl y i n Pennsylvani a and surroundin g States.
The larges t us e of anthracit e i s fo r spac e heating. Lesser
amount s ar e employe d fo r steam/electri c production , typicall y in
underfee d stoke r and pulverize d coa l dry-botto m boilers.
Althoug h smal l quantitie s of cadmiu m may be emitte d as
fugitiv e particulat e matte r fro m coa l storag e and handling
operations , th e primar y sourc e of cadmiu m emission s fro m coal
combustio n i s th e combustio n stack. Becaus e th e combustio n zone
i n boiler s operate s at temperature s i n exces s of 1100° C (2000°F),
th e cadmiu m i n th e coa l i s volatilized. As th e flu e gas cool s in
th e convectiv e hea t transfe r sectio n and furthe r i n th e air
preheater , th e volatilize d cadmiu m condenses. The cadmiu m may
condens e or adsor b ont o existin g particle s accordin g t o the
availabl e surfac e are a or i t may condens e homogeneously , forming
fin e particles. The cadmiu m thu s volatilize d woul d be depleted
i n th e botto m as h and concentrate d i n th e fl y as h sinc e th e fly
as h has more relativ e surfac e are a tha n th e botto m as h and since
th e botto m as h does not come i n contac t wit h th e volatilized
cadmiu m lon g enoug h fo r th e cadmiu m t o condens e on th e bottom
ash.
Emissio n Contro l Measures 6
Emissio n contro l measure s fo r coal-fire d boiler s include
control s base d on combusto r desig n and operatin g practice s that
ar e directe d primaril y at nitroge n oxide s (NOx) and particulate
6-14
matte r (PM) contro l and add-o n ai r pollutio n contro l device s that
ar e designe d fo r aci d gas and PM control. Thos e measure s that
ar e most likel y t o affec t cadmiu m contro l ar e add-o n PM and acid
gas contro l devices. The primar y type s of PM contro l devices
use d fo r coa l combustio n includ e multipl e cyclones , electrostatic
precipitators , fabri c filter s (baghouses) , and scrubbers , while
bot h wet and dr y flu e gas desulfurizatio n (FGD) system s ar e used
fo r sulfu r dioxid e (SO2). Some measur e of PM contro l i s also
obtaine d fro m as h settlin g i n boiler/ai r heater/economize r dust
hoppers , larg e breeches , and chimne y bases , but thes e mechanisms
wil l not significantl y reduc e cadmiu m emissions.
Electrostati c precipitator s (ESP) ar e th e most common high
efficienc y contro l devic e use d on pulverize d coa l and cyclone
units. Thes e device s ar e als o bein g use d increasingl y on
stokers. Generally , PM collectio n efficiencie s ar e a functio n of
th e specifi c collectio n are a (i.e. , th e rati o of th e collection
plat e are a t o th e volumetri c flo w rat e of flu e gas throug h the
device) , and PM efficiencie s of 99. 9 weigh t percen t hav e been
measure d wit h ESP’s. Fabri c filter s hav e recentl y see n increased
us e i n bot h utilit y and industria l application s bot h as a PM
contro l measur e and as th e collectio n mechanis m i n dr y FGD
systems , generall y effectin g abou t 99. 8 percen t PM control
efficiency. Scrubber s ar e als o use d t o contro l PM emissions,
althoug h thei r primar y us e i s t o contro l emission s of sulfur
oxides.
Mechanica l collectors , generall y multipl e cyclones , ar e the
primar y means of contro l on many stoker s and ar e sometimes
installe d upstrea m of hig h efficienc y contro l device s i n orde r to
reduc e th e as h collectio n burden. Dependin g on applicatio n and
design , multipl e cyclon e PM efficiencie s ca n var y tremendously.
However , thes e system s ar e relativel y inefficien t fo r fine
particle s and ar e not likel y t o provid e measurabl e contro l of
6-15

cadmiu m emissions , whic h ar e primaril y i n th e fin e particle
fraction s of th e exhaust.
Dat a on th e performanc e of coa l combustio n emissio n control
measures , relativ e t o cadmium , ar e quit e sparse. Furthermore,
many of th e dat a tha t ar e availabl e ar e somewhat date d and ar e of
questionabl e reliability. The sectio n on emissio n factor s below
present s th e availabl e dat a on emissio n contro l system
performance. However , i n evaluatin g th e potentia l emission s from
a facilit y or grou p of facilities , any assumption s abou t control
syste m performance , includin g thos e base d on th e dat a presented
herein , shoul d be examine d carefull y t o assur e tha t the y are
supporte d by reliabl e tes t dat a obtaine d vi a method s comparable
t o thos e describe d i n Sectio n 9. Also , performanc e estimates
must be consisten t wit h th e physica l and chemica l propertie s of
th e compounds bein g emitte d and wit h th e operating
characteristic s of th e system s bein g evaluated.
Emissions
Two distinc t source s of informatio n wer e use d t o develo p and
evaluat e cadmiu m emissio n factor s fo r coa l combustion. First,
th e dat a presente d abov e on cadmiu m concentration s i n coa l and
coa l heatin g value s wer e use d t o develo p mass balance-based
emissio n factor s unde r th e assumptio n tha t al l cadmiu m charged
wit h th e coa l i s emitte d as fin e PM i n th e stac k gas. Second,
th e emissio n factor s presente d i n th e coa l and oi l Locatin g and
Estimatin g (L&E ) document wer e reviewe d and summarized. 2 No
attemp t was made t o verif y th e source s of dat a use d i n th e coal
and oi l L&E document or t o rat e th e emissio n factor s tha t were
develope d therein. The result s obtaine d fro m eac h of th e these
method s ar e discusse d separatel y i n th e paragraph s below. Then
th e relativ e merit s of th e emissio n factor s obtaine d by the
6-16
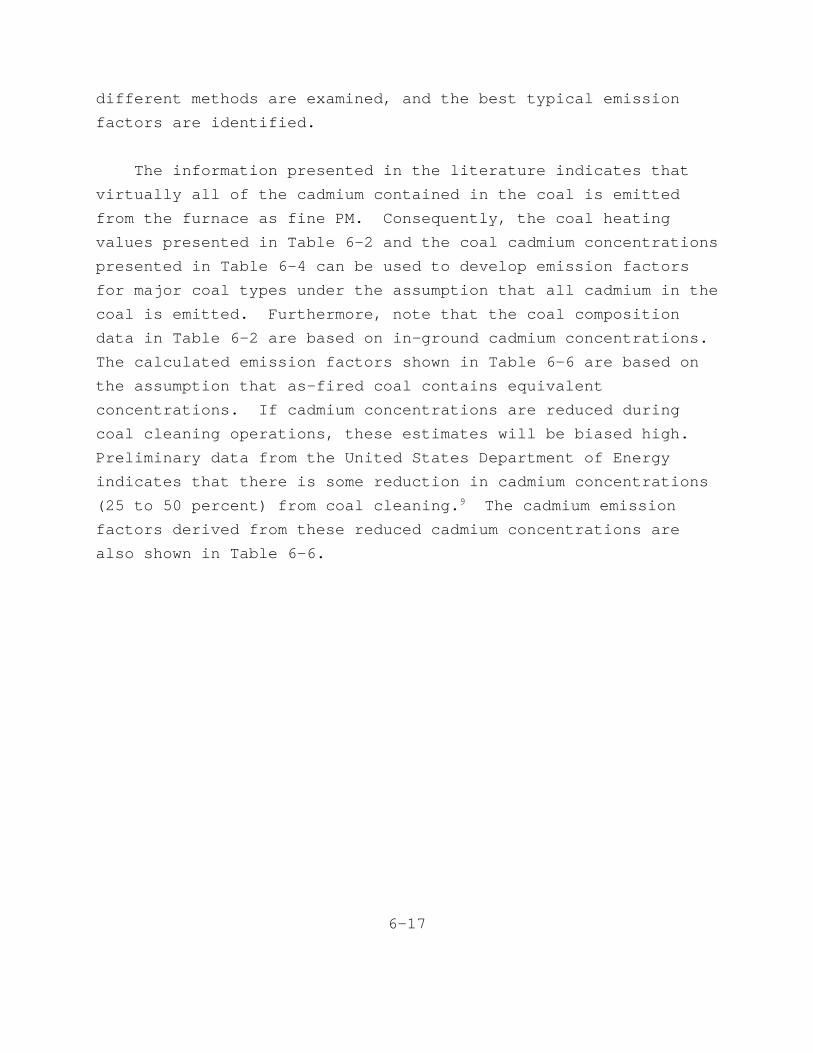
differen t method s ar e examined , and th e bes t typica l emission
factor s ar e identified.
The informatio n presente d i n th e literatur e indicate s that
virtuall y al l of th e cadmiu m containe d i n th e coa l i s emitted
fro m th e furnac e as fin e PM. Consequently , th e coa l heating
value s presente d i n Tabl e 6- 2 and th e coa l cadmiu m concentrations
presente d i n Tabl e 6- 4 ca n be use d t o develo p emissio n factors
fo r majo r coa l type s unde r th e assumptio n tha t al l cadmiu m i n the
coa l i s emitted. Furthermore , not e tha t th e coa l composition
dat a i n Tabl e 6- 2 ar e base d on in-groun d cadmiu m concentrations.
The calculate d emissio n factor s shown i n Tabl e 6- 6 ar e base d on
th e assumptio n tha t as-fire d coa l contain s equivalent
concentrations. I f cadmiu m concentration s ar e reduce d during
coa l cleanin g operations , thes e estimate s wil l be biase d high.
Preliminar y dat a fro m th e Unite d State s Departmen t of Energy
indicate s tha t ther e i s some reductio n i n cadmiu m concentrations
(2 5 t o 50 percent ) fro m coa l cleaning. 9 The cadmiu m emission
factor s derive d fro m thes e reduce d cadmiu m concentration s are
als o shown i n Tabl e 6-6.
6-17
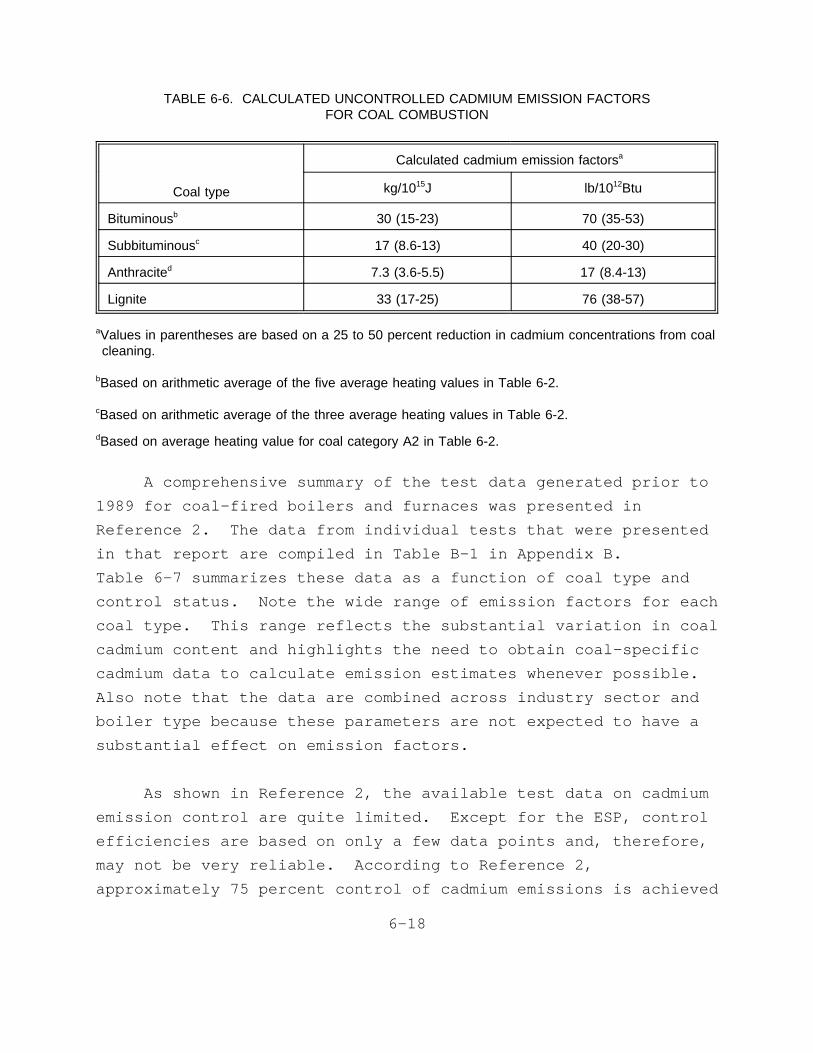
TABLE 6-6. CALCULATED UNCONTROLLED CADMIUM EMISSION FACTORSFOR COAL COMBUSTION
Coal type
Calculated cadmium emission factorsa
kg/1015J lb/1012Btu
Bituminousb 30 (15-23) 70 (35-53)
Subbituminousc 17 (8.6-13) 40 (20-30)
Anthracited 7.3 (3.6-5.5) 17 (8.4-13)
Lignite 33 (17-25) 76 (38-57)
aValues in parentheses are based on a 25 to 50 percent reduction in cadmium concentrations from coalcleaning.
bBased on arithmetic average of the five average heating values in Table 6-2.
cBased on arithmetic average of the three average heating values in Table 6-2.
dBased on average heating value for coal category A2 in Table 6-2.
A comprehensiv e summary of th e tes t dat a generate d prio r to
1989 fo r coal-fire d boiler s and furnace s was presente d in
Referenc e 2. The dat a fro m individua l test s tha t wer e presented
i n tha t repor t ar e compile d i n Tabl e B- 1 i n Appendi x B.
Tabl e 6- 7 summarize s thes e dat a as a functio n of coa l typ e and
contro l status. Not e th e wid e rang e of emissio n factor s fo r each
coa l type. Thi s rang e reflect s th e substantia l variatio n i n coal
cadmiu m conten t and highlight s th e need t o obtai n coal-specific
cadmiu m dat a t o calculat e emissio n estimate s wheneve r possible.
Als o not e tha t th e dat a ar e combine d acros s industr y secto r and
boile r typ e becaus e thes e parameter s ar e not expecte d t o hav e a
substantia l effec t on emissio n factors.
As shown i n Referenc e 2, th e availabl e tes t dat a on cadmium
emissio n contro l ar e quit e limited. Excep t fo r th e ESP, control
efficiencie s ar e base d on onl y a fe w dat a point s and , therefore,
may not be ver y reliable. Accordin g t o Referenc e 2,
approximatel y 75 percen t contro l of cadmiu m emission s i s achieved
6-18
TABLE 6-7. SUMMARY OF CADMIUM EMISSION FACTORS FOR COAL COMBUSTION
Coaltype a Control status b
No. ofboilers
No. ofdata
points
Cadmium emission factors
kg/10 15 J lb/10 12 Btu
Average Range Average Range
B UN 19 40 34 1.8-130 80 4.1-300
B MP or MC 11 20 38 0.082-210 88 0.19-490
B ESP or MP/ESP 30 45 2.5 0.0040-23 5.8 0.0090-53
B ESP-2 stage 1 1 19.8 -- 46 --
B WS or MC/WS 6 6 42 0.037-210 98 0.086-490
B FF 1 1 0.14 -- 0.33 --
SB UN 3 5 970 2.1-1,900 2,200 4.9-4,400
SB ESP or MP/ESP 4 5 1.6 0.17-6.0 3.7 0.39-14
SB WS 2 2 110 1.7-210 250 4.0-490
L MC 4 4 5.3 2.2-11 12 5.1-26
L ESP 3 3 0.95 0.52-1.5 2.2 1.2-3.5
L ESP/WS 1 2 13 0.77-25 31 1.8-59
A UN 3 3 1.0 0.60-1.5 2.4 1.4-3.5
Source: Reference 2.
aB = bituminous, SB = subbituminous, L = lignite, A = anthracite.
bUN = uncontrolled, MP = mechanical precipitation system, MC = multiclone, ESP = electrostatic precipitator, WS =wet scrubber.
6-19

by ESP’s. At leas t 75 percen t contro l shoul d be achieve d by a
combinatio n of an ESP and a wet scrubbe r or by tw o ESP’ s in
series. Insufficien t dat a ar e availabl e on th e performanc e of
wet scrubber s relativ e t o cadmiu m emissions , but , accordin g to
th e literature , wet scrubber s ca n achiev e ove r 99 percen t removal
of PM. Cadmiu m reductio n wit h a wet scrubbe r i s expecte d t o be
les s tha n tha t sinc e cadmiu m partition s wit h th e fin e PM, and wet
scrubber s ar e much les s effectiv e i n reducin g emission s of fine
PM.10 A conservativ e estimat e of cadmiu m reductio n wit h a wet
scrubbe r woul d be 75 percen t sinc e PM contro l wit h a scrubbe r is
at leas t as good as PM contro l wit h an ESP system. The reported
29 percen t contro l achieve d by multiclone s i s consisten t wit h the
inefficienc y of thes e system s i n reducin g cadmiu m emissions.
Based on revie w of th e availabl e data , th e bes t estimates
fo r uncontrolle d emissio n factor s fo r typica l coa l combustion
facilitie s ar e thos e obtaine d fro m a mass balanc e usin g coal
compositio n data. Thi s approac h was selecte d becaus e the
availabl e tes t dat a ar e of uncertai n quality , and th e coal
concentratio n dat a ar e representativ e of a much large r industry
segment. Controlle d emissio n factor s wer e obtaine d by applying
75 percen t contro l fo r ESP’s , greate r tha n 75 percen t contro l for
a combinatio n of ESP’ s and wet scrubbers , and greate r than
75 percen t contro l fo r tw o ESP’ s i n series. Dat a wer e inadequate
t o estimat e efficiencie s fo r system s equippe d wit h mechanical
collectors , wet scrubbers , or fabri c filters. The resultan t best
typica l emissio n factor s ar e shown i n Tabl e 6-8.
FUEL OI L COMBUSTION
As shown i n Tabl e 6-1 , fue l oi l us e span s th e fou r sectors
of energ y users. Distillat e fue l oi l i s use d extensivel y i n all
sector s wit h th e larges t us e i n th e utilit y (3 1 percent ) and the
industria l (3 2 percent ) sectors , but wit h substantia l amounts
6-20

TABLE 6-8. BEST TYPICAL CADMIUM EMISSION FACTORS FOR COAL COMBUSTION
Coal type aControlstatus b
Cadmium emission factors
kg/10 15 J lb/10 12 Btu
B Uncontrolled 30 70
B ESP 7.7 18
B ESP/wet scrubber <7.7 <18
B ESP-2 stage <7.7 <18
SB Uncontrolled 17 40
SB ESP 4.4 10
SB ESP/wet scrubber <4.4 <10
SB ESP-2 stage <4.4 <10
A Uncontrolled 7.3 17
A ESP 1.8 4.3
A ESP/wet scrubber <1.8 <4.3
A ESP-2 stage <1.8 <4.3
L Uncontrolled 33 76
L ESP 8.4 19
L ESP/wet scrubber <8.4 <19
L ESP-2 stage <8.4 <19
aB = bituminous, SB = subbituminous, A = anthracite, L = lignite.
bESP = electrostatic precipitator.
6-21
use d i n bot h th e commercia l (1 3 percent ) and residential
(2 3 percent ) sectors. Residua l oi l i s use d primaril y i n the
industria l (5 6 percent ) and commercia l (3 3 percent ) sectors.
Becaus e th e oi l combustio n proces s i s not complex , and control
system s ar e not widel y applie d t o oil-fire d units , th e discussion
belo w wil l focu s on fue l oi l characteristic s and on emissions
fro m oil-fire d units. 1
Fuel Oi l Characteristics 2
The fue l oi l characteristic s of greates t importanc e for
characterizin g cadmiu m emission s fro m fue l oi l combustio n ar e the
heatin g valu e and th e cadmiu m conten t of th e oil. The heating
valu e i s use d fo r convertin g fro m emissio n factor s wit h mass- or
volume-base d activit y level s t o thos e wit h activit y level s based
on hea t input.
The ter m fue l oi l cover s a variet y of petroleu m products,
includin g crud e petroleum , lighte r petroleu m fraction s suc h as
kerosene , and heavie r residua l fraction s lef t afte r distillation.
To provid e standardizatio n and means fo r comparison,
specification s hav e been establishe d tha t separat e fue l oil s into
variou s grades. Fuel oil s ar e grade d accordin g t o specific
gravit y and viscosity , wit h No. 1 Grad e bein g th e lightes t and
No. 6 th e heaviest. The heatin g valu e of fue l oil s i s expressed
i n term s of kJ/ L (Btu/gal ) of oi l at 16° C (60°F ) or kJ/kg
(Btu/lb ) of oi l at 16° C (60°F). The heatin g valu e per gallon
increase s wit h specifi c gravit y becaus e ther e i s more weigh t per
gallon. The heatin g valu e per mass of oi l varie s inversel y with
specifi c gravit y becaus e lighte r oi l contain s more hydrogen. For
an uncracke d distillat e or residua l oil , heatin g valu e ca n be
approximate d by th e followin g equation:
Btu/lb = 17,66 0 + (6 9 x API gravity)
6-22
For a cracke d distillate , th e relationshi p becomes:
Btu/l b = 17,78 0 + (5 4 x API gravity)
Tabl e 6- 9 provide s an overal l summary of th e heatin g values
of typica l fue l oil s use d i n th e Unite d States , and Tabl e 6-10
shows th e variabilit y i n fue l oi l heatin g value s use d i n various
region s of th e country. Appendi x B of Referenc e 2 provides
additiona l details.
The dat a bas e fo r cadmiu m conten t i n fue l oil s i s much more
limite d tha n was th e coa l cadmiu m conten t dat a base. No single
centralize d dat a bas e i s available , and th e informatio n presented
belo w i s base d on limite d dat a fro m individua l studies.
Concentration s of cadmiu m i n fue l oi l depen d upon th e type
of oi l used. No comprehensiv e oi l characterizatio n studie s have
been done , but dat a i n th e literatur e repor t simila r cadmium
concentratio n means and range s i n residua l and distillat e oils.
The suggeste d typica l cadmiu m conten t of residua l oi l is
0.3 0 ppmwt, and tha t of distillat e oi l i s 0.2 1 ppmwt. The
typica l valu e fo r cadmiu m i n crud e oi l i s 0.0 3 ppmwt. Tabl e 6-11
list s th e typica l value s fo r cadmiu m i n oils. The typica l values
fo r distillat e and crud e oi l wer e obtaine d by takin g th e average
of th e mean value s foun d i n th e literature. The valu e for
residua l oi l was base d on reporte d concentration s withou t using
th e tw o hig h value s of 2.2 7 and 2.0 2 ppmwt.
Proces s Description 5,8
Fuel oil s ar e broadl y classifie d int o tw o majo r types:
distillat e and residual. Distillat e oil s (fue l oi l grade
Nos. 1 and 2) ar e use d mainl y i n domesti c and smal l commercial
application s i n whic h eas y fue l burnin g i s required. Distillates
ar e more volatil e and les s viscou s tha n residua l oils , having
6-23

TABLE 6-9. TYPICAL HEATING VALUES OF FUEL OILS
FUEL OIL GRADES
No. 1 No. 2 No. 4 No. 5 No. 6 −−
Type Distillate Distillate Very light residual Light residual Residual Crudeb
Color Light Amber Black Black Black −−
Heating valuea
kJ/L (Btu/gal)
kJ/kg (Btu/lb)
38,200(137,000)
45,590−46,030(19,670−19,860)
40,900(141,000)
44,430−45,770(19,170−19,750)
40,700(146,000)
42,370−44,960(18,280−19,400)
41,200(148,000)
41,950−44,080(18,100−19,020)
41,800(150,000)
40,350−43,800(17,410−18,900)
39,900−42,200(143,000−152,000)
40,700−43,200(17,500−18,600)
Source: References 2 and 11.
aThe distillate and residual oil samples analyzed for Btu/gal and Btu/lb heating values are different; therefore, the heating values presented do not directly correspond toone another.
bThese crude oil values are based on a limited number of samples from West Coast field sites presented in Reference 11 and may not be representative of thedistribution of crude oils processed in the United States.
6-2
4
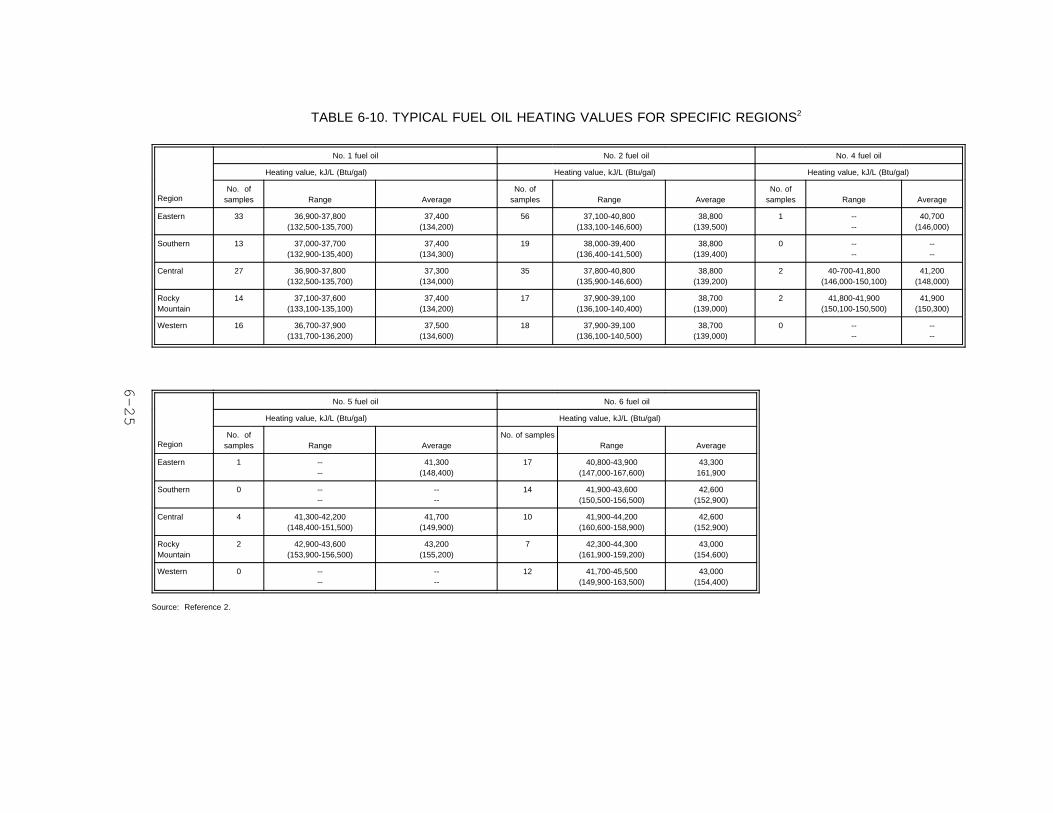
TABLE 6-10. TYPICAL FUEL OIL HEATING VALUES FOR SPECIFIC REGIONS2
No. 1 fuel oil No. 2 fuel oil No. 4 fuel oil
Heating value, kJ/L (Btu/gal) Heating value, kJ/L (Btu/gal) Heating value, kJ/L (Btu/gal)
RegionNo. of
samples Range AverageNo. of
samples Range AverageNo. of
samples Range Average
Eastern 33 36,900-37,800(132,500-135,700)
37,400(134,200)
56 37,100-40,800(133,100-146,600)
38,800(139,500)
1 ----
40,700(146,000)
Southern 13 37,000-37,700(132,900-135,400)
37,400(134,300)
19 38,000-39,400(136,400-141,500)
38,800(139,400)
0 ----
----
Central 27 36,900-37,800(132,500-135,700)
37,300(134,000)
35 37,800-40,800(135,900-146,600)
38,800(139,200)
2 40-700-41,800(146,000-150,100)
41,200(148,000)
RockyMountain
14 37,100-37,600(133,100-135,100)
37,400(134,200)
17 37,900-39,100(136,100-140,400)
38,700(139,000)
2 41,800-41,900(150,100-150,500)
41,900(150,300)
Western 16 36,700-37,900(131,700-136,200)
37,500(134,600)
18 37,900-39,100(136,100-140,500)
38,700(139,000)
0 ----
----
No. 5 fuel oil No. 6 fuel oil
Heating value, kJ/L (Btu/gal) Heating value, kJ/L (Btu/gal)
RegionNo. of
samples Range AverageNo. of samples
Range Average
Eastern 1 ----
41,300(148,400)
17 40,800-43,900(147,000-167,600)
43,300161,900
Southern 0 ----
----
14 41,900-43,600(150,500-156,500)
42,600(152,900)
Central 4 41,300-42,200(148,400-151,500)
41,700(149,900)
10 41,900-44,200(160,600-158,900)
42,600(152,900)
RockyMountain
2 42,900-43,600(153,900-156,500)
43,200(155,200)
7 42,300-44,300(161,900-159,200)
43,000(154,600)
Western 0 ----
----
12 41,700-45,500(149,900-163,500)
43,000(154,400)
Source: Reference 2.
6-2
5
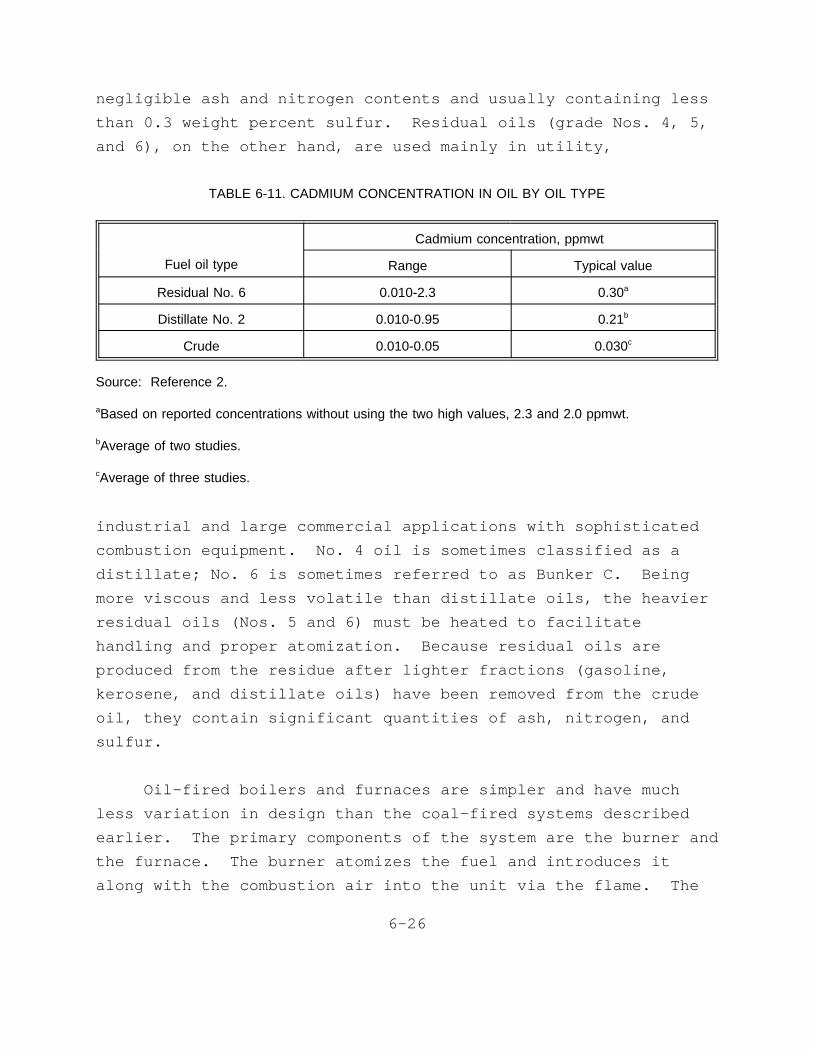
negligibl e as h and nitroge n content s and usuall y containin g less
tha n 0. 3 weigh t percen t sulfur. Residua l oil s (grad e Nos. 4, 5,
and 6) , on th e othe r hand , ar e use d mainl y i n utility,
TABLE 6-11. CADMIUM CONCENTRATION IN OIL BY OIL TYPE
Cadmium concentration, ppmwt
Fuel oil type Range Typical value
Residual No. 6 0.010-2.3 0.30a
Distillate No. 2 0.010-0.95 0.21b
Crude 0.010-0.05 0.030c
Source: Reference 2.
aBased on reported concentrations without using the two high values, 2.3 and 2.0 ppmwt.
bAverage of two studies.
cAverage of three studies.
industria l and larg e commercia l application s wit h sophisticated
combustio n equipment. No. 4 oi l i s sometime s classifie d as a
distillate ; No. 6 i s sometime s referre d t o as Bunke r C. Being
more viscou s and les s volatil e tha n distillat e oils , th e heavier
residua l oil s (Nos . 5 and 6) must be heate d t o facilitate
handlin g and prope r atomization. Becaus e residua l oil s are
produce d fro m th e residu e afte r lighte r fraction s (gasoline,
kerosene , and distillat e oils ) hav e been remove d fro m th e crude
oil , the y contai n significan t quantitie s of ash , nitrogen , and
sulfur.
Oil-fire d boiler s and furnace s ar e simple r and hav e much
les s variatio n i n desig n tha n th e coal-fire d system s described
earlier. The primar y component s of th e syste m ar e th e burne r and
th e furnace. The burne r atomize s th e fue l and introduce s it
alon g wit h th e combustio n ai r int o th e uni t vi a th e flame. The
6-26

furnac e provide s th e residenc e tim e and mixin g neede d t o complete
combustio n of th e fuel. The primar y differenc e i n system s that
fir e distillat e oi l and residua l oi l i s tha t th e residua l oil
system s must hav e an oi l preheate r t o reduc e th e viscosit y of the
oi l so tha t i t ca n be atomize d properl y i n th e burner.
The onl y sourc e of cadmiu m emission s fro m oil-fire d boilers
and furnace s i s th e combustio n stack. Becaus e th e entir e fuel
suppl y i s expose d t o hig h flam e temperatures , essentiall y al l of
th e cadmiu m containe d i n th e fue l oi l wil l be volatilized , with
most condensin g ont o smal l particle s and the n exhauste d fro m the
combustio n chamber wit h th e combustio n gas exhaust. Unles s the
combustio n gase s ar e expose d t o high-efficienc y PM control
systems , whic h typicall y ar e not foun d on oil-fire d units , the
cadmiu m wil l be exhauste d as fin e PM throug h th e combustion
stack.
Emissio n Contro l Measures 8
The thre e type s of contro l measure s applie d t o oil-fired
boiler s and furnace s ar e boile r modifications , fue l substitution,
and flu e gas cleanin g systems. Onl y fue l substitutio n and flue
gas cleanin g system s wil l affec t cadmiu m emissions. Fuel
substitutio n i s use d primaril y t o reduc e SO2 and NOx emissions.
However , i f th e substitute d fuel s hav e lowe r cadmium
concentrations , th e substitutio n wil l als o reduc e cadmium
emissions. Becaus e PM emission s fro m oil-fire d unit s are
generall y much lowe r tha n thos e fro m coal-fire d units,
high-efficienc y PM contro l system s ar e generall y not employe d on
oil-fire d systems. Consequently , thes e flu e gas cleanin g systems
ar e not likel y t o achiev e substantia l cadmiu m control. However,
th e flu e gas system s tha t ar e typicall y use d on oil-fire d units
ar e describe d briefl y below.
6-27
Flu e gas cleanin g equipmen t generall y i s employe d onl y on
large r oil-fire d boilers. Mechanica l collectors , a prevalent
typ e of contro l device , ar e primaril y usefu l i n controllin g PM
generate d durin g soo t blowing , durin g upse t conditions , or when a
ver y dirt y heav y oi l i s fired. Durin g thes e situations , high
efficienc y cycloni c collector s ca n affec t up t o 85 percent
contro l of PM, but les s contro l of cadmiu m i s expecte d with
mechanica l collector s becaus e cadmiu m i s enriche d ont o fin e PM,
whic h i s not as easil y capture d by contro l devices.
Electrostati c precipitator s ar e commonl y use d i n oil-fired
power plants. Olde r ESP’ s may remov e 40 t o 60 percen t of th e PM,
but lowe r cadmiu m contro l i s expecte d becaus e of th e reaso n cited
above. Scrubbin g system s hav e been installe d on oil-fired
boiler s t o contro l bot h sulfu r oxide s and PM. Thes e system s can
achiev e PM contro l efficiencie s of 50 t o 60 percent. Because
the y provid e gas coolin g belo w th e condensatio n poin t of cadmium,
some cadmiu m contro l may be obtained , but no dat a ar e available
on thei r performance.
Emissions
Thre e type s of informatio n wer e use d t o develo p emission
factor s fo r oi l combustion. First , th e dat a describe d abov e on
fue l oi l heatin g valu e and cadmiu m conten t of fue l oil s wer e used
t o develo p emissio n factor s by mass balance , assumin g tha t all
cadmiu m fire d wit h th e fue l oi l i s emitte d throug h th e stack.
Second , th e emissio n factor s fro m th e coa l and oi l L&E document
wer e evaluate d and summarized , but no attemp t was made t o verify
origina l reference s or t o rat e thes e data. Finally , rated
emissio n tes t dat a develope d i n preparatio n of thi s document were
evaluate d and summarized. The paragraph s belo w firs t presen t the
result s generate d fro m eac h of th e thre e sources. Then, the
relativ e merit s of th e emissio n factor s generate d vi a eac h of the
6-28
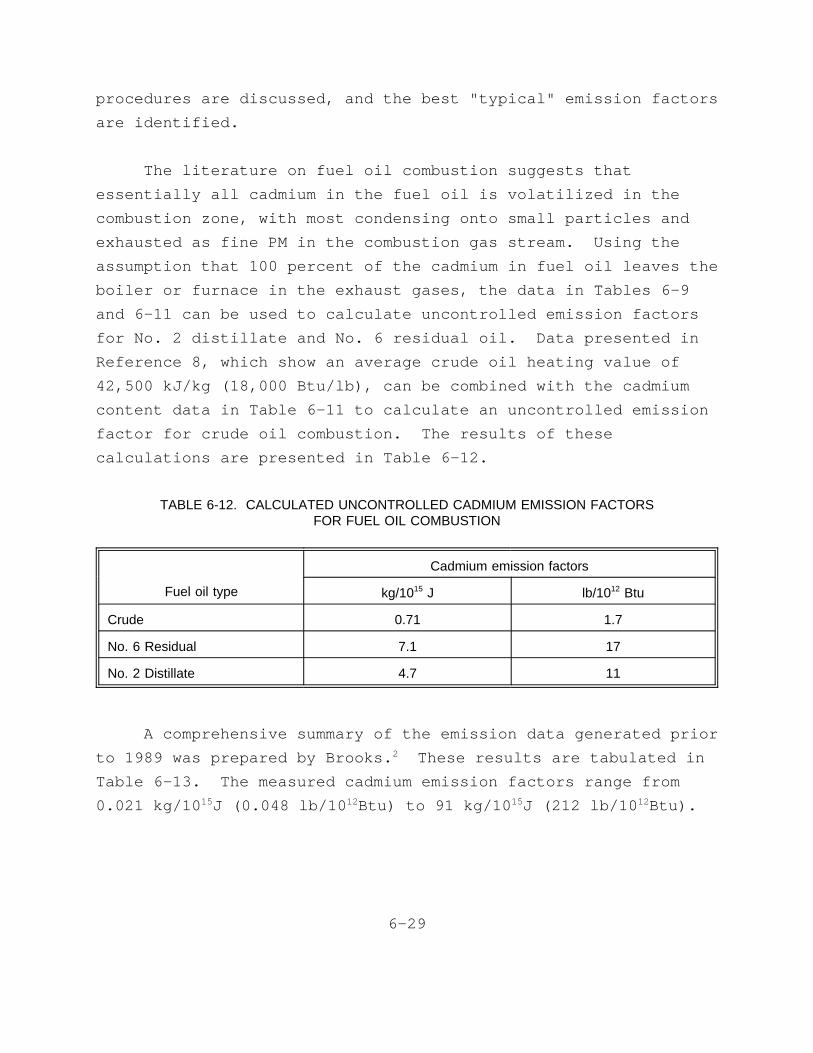
procedure s ar e discussed , and th e bes t "typical " emissio n factors
ar e identified.
The literatur e on fue l oi l combustio n suggest s that
essentiall y al l cadmiu m i n th e fue l oi l i s volatilize d i n the
combustio n zone , wit h most condensin g ont o smal l particle s and
exhauste d as fin e PM i n th e combustio n gas stream. Usin g the
assumptio n tha t 100 percen t of th e cadmiu m i n fue l oi l leave s the
boile r or furnac e i n th e exhaus t gases , th e dat a i n Table s 6-9
and 6-1 1 ca n be use d t o calculat e uncontrolle d emissio n factors
fo r No. 2 distillat e and No. 6 residua l oil. Dat a presente d in
Referenc e 8, whic h sho w an averag e crud e oi l heatin g valu e of
42,50 0 kJ/k g (18,00 0 Btu/lb) , ca n be combine d wit h th e cadmium
conten t dat a i n Tabl e 6-1 1 t o calculat e an uncontrolle d emission
facto r fo r crud e oi l combustion. The result s of these
calculation s ar e presente d i n Tabl e 6-12.
TABLE 6-12. CALCULATED UNCONTROLLED CADMIUM EMISSION FACTORSFOR FUEL OIL COMBUSTION
Cadmium emission factors
Fuel oil type kg/1015 J lb/1012 Btu
Crude 0.71 1.7
No. 6 Residual 7.1 17
No. 2 Distillate 4.7 11
A comprehensiv e summary of th e emissio n dat a generate d prior
t o 1989 was prepare d by Brooks. 2 Thes e result s ar e tabulate d in
Tabl e 6-13. The measure d cadmiu m emissio n factor s rang e from
0.02 1 kg/10 15J (0.04 8 lb/10 12Btu ) t o 91 kg/10 15J (21 2 lb/10 12Btu).
6-29

TABLE 6-13. MEASURED CADMIUM EMISSION FACTORS FOR FUEL OIL COMBUSTION
Fuel oil typeIndustrysectora
Controlstatusb
Fuel Cdcontent,ppmwt
Cadmium emission factors
Datekg/1015 J lb/1012 Btu
No. 6 oil I MC/WS 3.5 21 49c 1979
No. 6 oil I MC 3.5 91 210d 1979
No. 6 oil I UN 3.0 0.30 0.69 1978
No. 6 oil I UN 3.0 1.3 3.0 1978
No. 6 oil I UN 3.0 3.7 8.6 1978
1:1 Residual/Crude U UN 0.70 0.021 0.048 1981
1:1 Residual/Crude U UN 0.70 3.5 8.2 1981
1:1 Residual/Crude U UN 0.50 14 33 1981
Distillatee R UN --- 11 26f 1979
Distillatee R UN 0.10 2.1 4.9 1981
Distillatee R UN 0.10 3.2 7.5 1981
Distillatee R UN 0.19 bdg bdg 1982
Source: Reference 2.
aU = utility, I = industrial, R = residential.
bMC = multiclone, WS = wet scrubber, UN = uncontrolled.
cOutlet from a wet scrubber.
dInlet to a wet scrubber.
eType of distillate oil not specified.
fAverage of eight tests on seven units.
gbd = below detection limit.
6-30
The averag e distillat e valu e i s 5. 4 kg/10 15J (1 3 lb/10 12Btu),
simila r t o th e calculate d valu e of 4. 7 kg/10 15J (1 1 lb/10 12Btu).
The value s fo r No. 6 residua l oi l fro m th e 1979 stud y ar e higher
tha n value s reporte d i n th e othe r studie s despit e th e presenc e of
PM contro l devices. The cause s of th e larg e variatio n in
measure d cadmiu m emissio n factor s ar e unknown. 2 Consequently,
th e tes t dat a i n Tabl e 6-1 3 shoul d be use d cautiously.
As a par t of thi s study , thre e tes t report s prepare d as a
par t of th e Californi a "Ho t Spots " progra m wer e reviewed. 11-13 The
emissio n factor s generate d fro m thes e thre e report s are
summarize d i n Tabl e 6-14. Each of th e report s containe d th e data
on fue l oi l characteristic s neede d t o calculat e cadmiu m input
rates , so Tabl e 6-1 4 contain s bot h calculate d emissio n factors
base d on cadmiu m inpu t level s and measure d emissio n factor s based
on stac k tests. Becaus e cadmiu m level s i n al l of th e fue l oils
teste d wer e belo w detectio n limits , al l calculate d emission
factor s ar e reporte d as "les s than " values. Not e tha t al l three
stac k test s showed cadmiu m emissio n level s abov e th e detection
limi t i n th e stac k but substantiall y belo w th e detectio n limit
fo r cadmiu m i n fue l oil. I f cadmiu m level s i n fue l oi l ar e close
t o th e detectio n limit , the n th e test s showed measure d emissions
t o be substantiall y les s tha n cadmiu m inpu t t o th e process. On
balance , thes e dat a provid e littl e informatio n fo r emission
facto r development.
6-31
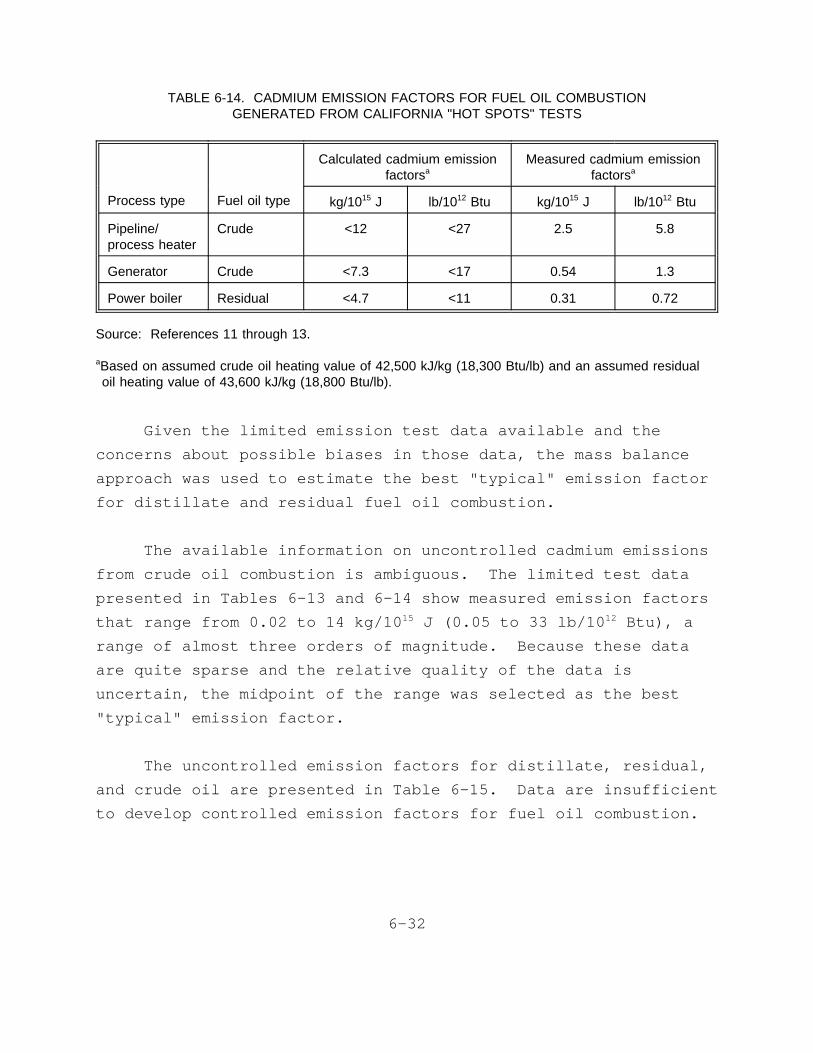
TABLE 6-14. CADMIUM EMISSION FACTORS FOR FUEL OIL COMBUSTIONGENERATED FROM CALIFORNIA "HOT SPOTS" TESTS
Calculated cadmium emissionfactorsa
Measured cadmium emissionfactorsa
Process type Fuel oil type kg/1015 J lb/1012 Btu kg/1015 J lb/1012 Btu
Pipeline/process heater
Crude <12 <27 2.5 5.8
Generator Crude <7.3 <17 0.54 1.3
Power boiler Residual <4.7 <11 0.31 0.72
Source: References 11 through 13.
aBased on assumed crude oil heating value of 42,500 kJ/kg (18,300 Btu/lb) and an assumed residualoil heating value of 43,600 kJ/kg (18,800 Btu/lb).
Give n th e limite d emissio n tes t dat a availabl e and the
concern s abou t possibl e biase s i n thos e data , th e mass balance
approac h was use d t o estimat e th e bes t "typical " emissio n factor
fo r distillat e and residua l fue l oi l combustion.
The availabl e informatio n on uncontrolle d cadmiu m emissions
fro m crud e oi l combustio n i s ambiguous. The limite d tes t data
presente d i n Table s 6-1 3 and 6-1 4 sho w measure d emissio n factors
tha t rang e fro m 0.0 2 t o 14 kg/10 15 J (0.0 5 t o 33 lb/10 12 Btu) , a
rang e of almos t thre e order s of magnitude. Becaus e thes e data
ar e quit e spars e and th e relativ e qualit y of th e dat a is
uncertain , th e midpoin t of th e rang e was selecte d as th e best
"typical " emissio n factor.
The uncontrolle d emissio n factor s fo r distillate , residual,
and crud e oi l ar e presente d i n Tabl e 6-15. Dat a ar e insufficient
t o develo p controlle d emissio n factor s fo r fue l oi l combustion.
6-32
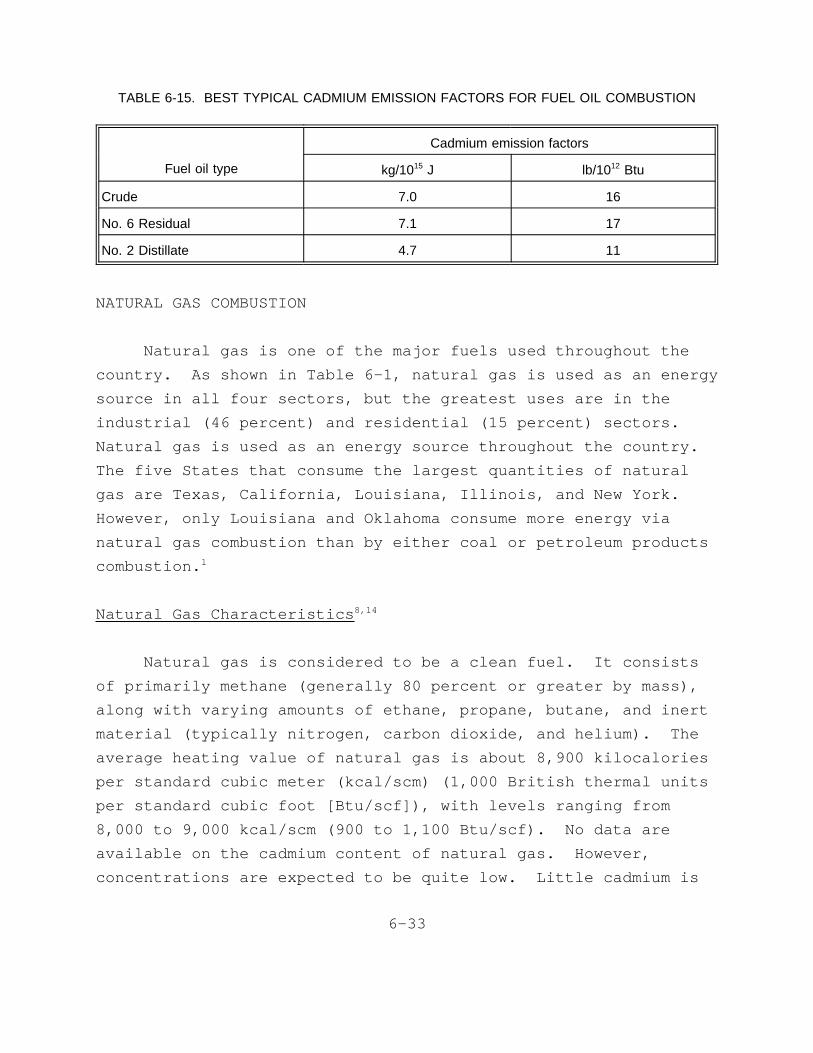
TABLE 6-15. BEST TYPICAL CADMIUM EMISSION FACTORS FOR FUEL OIL COMBUSTION
Cadmium emission factors
Fuel oil type kg/1015 J lb/1012 Btu
Crude 7.0 16
No. 6 Residual 7.1 17
No. 2 Distillate 4.7 11
NATURAL GAS COMBUSTION
Natura l gas i s one of th e majo r fuel s use d throughou t the
country. As shown i n Tabl e 6-1 , natura l gas i s use d as an energy
sourc e i n al l fou r sectors , but th e greates t use s ar e i n the
industria l (4 6 percent ) and residentia l (1 5 percent ) sectors.
Natura l gas i s use d as an energ y sourc e throughou t th e country.
The fiv e State s tha t consume th e larges t quantitie s of natural
gas ar e Texas , California , Louisiana , Illinois , and New York.
However , onl y Louisian a and Oklahom a consume more energ y via
natura l gas combustio n tha n by eithe r coa l or petroleu m products
combustion. 1
Natura l Gas Characteristics 8,14
Natura l gas i s considere d t o be a clea n fuel. I t consists
of primaril y methan e (generall y 80 percen t or greate r by mass),
alon g wit h varyin g amount s of ethane , propane , butane , and inert
materia l (typicall y nitrogen , carbo n dioxide , and helium). The
averag e heatin g valu e of natura l gas i s abou t 8,90 0 kilocalories
per standar d cubi c mete r (kcal/scm ) (1,00 0 Britis h therma l units
per standar d cubi c foo t [Btu/scf]) , wit h level s rangin g from
8,00 0 t o 9,00 0 kcal/sc m (90 0 t o 1,10 0 Btu/scf). No dat a are
availabl e on th e cadmiu m conten t of natura l gas. However,
concentration s ar e expecte d t o be quit e low. Littl e cadmiu m is
6-33
expecte d t o be foun d i n ra w gas , and th e processin g step s use d to
recove r liqui d constituent s and t o remov e hydroge n sulfid e from
th e ra w gas shoul d als o remov e any cadmiu m tha t i s containe d in
th e ra w gas.
Proces s Description 14
Natura l gas combustio n source s ca n be divide d int o four
categories: utility/larg e industria l boilers , smal l industry
boilers , commercia l boilers , and residentia l furnaces. These
system s ar e configure d differently , but th e combustio n processes
ar e comparabl e fo r al l categories. The natura l gas and
combustio n ai r ar e mixe d i n a burne r and introduce d t o a
combustio n chamber vi a a flame. The natura l gas flame
temperature , whic h exceed s 1000° C (1800°F) , wil l volatiliz e any
cadmiu m i n th e fuel. Most of th e cadmiu m wil l the n condens e onto
smal l particle s and be exhauste d as fin e PM fro m th e boile r or
furnac e wit h th e combustio n gas stream. Thi s exhaus t strea m is
th e onl y sourc e of cadmiu m emission s fro m natura l gas combustion.
Emissio n Contro l Measures
No contro l measure s appl y t o natura l gas-fire d boilers , and
furnace s ar e expecte d t o affec t cadmiu m emissions.
Emissions
No dat a ar e availabl e on cadmiu m emission s fro m natura l gas
combustion , but emission s ar e expecte d t o be quit e low. As
state d earlier , littl e cadmiu m i s expecte d t o be foun d i n raw
gas , and , give n th e processin g step s tha t natura l gas undergoes,
any cadmiu m tha t i s presen t woul d be remove d fro m th e ra w gas.
Consequently , no cadmiu m emissio n facto r i s presente d fo r natural
gas combustion.
6-34
WOOD COMBUSTION
Wood and wood waste s ar e use d as fue l i n bot h th e industrial
and residentia l sectors. I n th e industria l sector , wood wast e is
fire d t o industria l boiler s t o provid e proces s heat , whil e wood
i s fire d t o fireplace s and wood stove s i n th e residential
sectors. No dat a ar e availabl e on th e cadmiu m conten t of wood
and wood wastes. Consequently , th e informatio n belo w includes
proces s description s fo r th e thre e combustio n processe s (boilers,
fireplaces , and wood stoves) , description s of th e control
measure s use d fo r wood-fire d processes , and emissio n factors.
Proces s Description 14
Wood wast e combustio n i n boiler s i s mostl y confine d t o those
industrie s fo r whic h i t i s availabl e as a byproduct. These
boiler s generat e energ y and alleviat e possibl e soli d waste
disposa l problems. I n boilers , wood wast e i s normall y burne d in
th e for m of hogge d wood, sawdust , shavings , chips , sanderdust , or
wood trim. Heatin g value s fo r thi s wast e rang e fro m abou t 2,200
t o 2,70 0 kcal/k g (4,00 0 t o 5,00 0 Btu/lb ) of fue l on a wet , as-
fire d basis. The moistur e conten t i s typicall y nea r 50 weight
percen t but may var y fro m 5 t o 75 weigh t percent , dependin g on
th e wast e typ e and storag e operations. Generally , bar k i s the
majo r typ e of wast e burne d i n pul p mills ; eithe r a mixtur e of
wood and bar k wast e or wood wast e alon e i s burne d most frequently
i n th e lumber , furniture , and plywoo d industries. As of 1980,
approximatel y 1,60 0 wood-fire d boiler s wer e operatin g i n the
Unite d States , wit h a tota l capacit y of ove r 30 gigawatts(GW)
(1. 0 x 1011 Btu/hr). No specifi c dat a on th e distributio n of
thes e boiler s wer e identified , but most ar e likel y t o be located
i n th e Southeast , th e Pacifi c Northwes t States , Wisconsin,
Michigan , and Maine.
6-35
The most common firin g metho d employe d fo r large r wood-fired
boiler s i s th e spreade r stoker. Wood enter s th e furnac e through
a fue l chut e and i s sprea d eithe r pneumaticall y or mechanically
acros s th e furnace , wher e smal l piece s of th e fue l bur n whil e in
suspension. Simultaneously , large r piece s of fue l ar e sprea d in
a thin , eve n bed on a stationar y or movin g grate. Natura l gas or
oi l i s ofte n fire d i n spreade r stoke r boiler s as auxiliar y fuel
t o maintai n a constan t stea m suppl y when th e wood wast e supply
fluctuates. Auxiliar y fue l ca n als o provid e more stea m tha n can
be generate d fro m th e wast e suppl y alone.
Anothe r boile r typ e sometime s use d fo r wood combustio n is
th e suspension-firin g boiler. Thi s boile r differ s fro m a
spreade r stoke r i n tha t small-size d fue l (normall y les s than
2 mm) i s blow n int o th e boile r and combuste d by suspensio n firing
i n ai r rathe r tha n on fixe d grates. Rapi d change s i n combustion
rat e and , therefore , stea m generatio n rat e ar e possibl e because
th e finel y divide d fue l particle s bur n ver y quickly.
Wood stove s ar e commonl y use d i n residence s as space
heaters , bot h as th e primar y sourc e of residentia l hea t and to
supplemen t conventiona l heatin g systems. The thre e different
categorie s of wood stove s are:
· The conventiona l wood stove;
· The noncatalyti c wood stove ; and
· The catalyti c wood stove.
The conventiona l stov e categor y comprise s al l stove s without
catalyti c combustor s not include d i n th e othe r noncatalytic
categorie s (i.e. , noncatalyti c and pellet). Conventiona l stoves
do not hav e any emission s reductio n technolog y or desig n features
and , i n most cases , wer e manufacture d befor e Jul y 1, 1986.
6-36

Stove s of many differen t airflo w design s may be i n thi s category,
suc h as updraft , downdraft , crossdraft , and S-flow.
Noncatalyti c wood stove s ar e thos e unit s tha t do not employ
catalyst s but do hav e emission s reductio n technolog y or features.
Typica l noncatalyti c desig n include s baffle s and secondary
combustio n chambers.
Catalyti c stove s ar e equippe d wit h a cerami c or metal
honeycom b devic e (calle d a combusto r or converter ) tha t i s coated
wit h a nobl e meta l suc h as platinu m or palladium. The catalyst
materia l reduce s th e ignitio n temperatur e of th e unburned
volatil e organi c compounds (VOC’s ) and carbo n monoxid e (CO) in
th e exhaus t gases , thu s augmentin g thei r ignitio n and combustion
at norma l stov e operatin g temperatures.
Fireplace s ar e use d primaril y fo r aestheti c effect s and
secondaril y as a supplementa l heatin g sourc e i n house s and other
dwellings. Wood i s th e most common fue l fo r fireplaces , but coal
and densifie d wood "logs " may als o be burned. The user
intermittentl y adds fue l t o th e fir e by hand.
Al l of th e system s describe d abov e operat e at temperatures
tha t ar e abov e th e boilin g poin t of cadmium. Consequently , any
cadmiu m containe d i n th e fue l wil l be emitte d wit h th e combustion
gase s as enriche d fin e PM. The combustio n exhaus t stac k i s the
onl y sourc e of cadmiu m emission s fro m thes e processes.
Emissio n Contro l Measures 14
Althoug h some wood stove s us e contro l measure s t o reduc e VOC
and CO emissions , thes e technique s ar e not expecte d t o affect
cadmiu m emissions. However , wood wast e boiler s do emplo y PM
6-37

contro l equipment , whic h may provid e some reduction. These
system s ar e describe d briefl y below.
Currently , th e fou r most common contro l device s use d to
reduc e PM emission s fro m wood-fire d boiler s ar e mechanical
collectors , wet scrubbers , ESP’s , and fabri c filters. Of these
controls , onl y th e las t thre e hav e th e potentia l fo r significant
cadmiu m reduction.
The most widel y use d wet scrubber s fo r wood-fire d boilers
ar e ventur i scrubbers. Wit h gas-sid e pressur e drop s exceeding
4 kilopascal s (1 5 inche s of water) , PM collectio n efficiencie s of
90 percen t or greate r hav e been reporte d fo r ventur i scrubbers
operatin g on wood-fire d boilers. No dat a wer e locate d on the
performanc e of thes e system s relativ e t o cadmiu m emissions , but
i t i s expecte d t o be somewhat les s becaus e cadmiu m i s likel y to
be concentrate d i n th e fin e PM, whic h i s les s readil y collected
by contro l devices.
Fabri c filter s (i.e. , baghouses ) and ESP’ s ar e employe d when
PM collectio n efficiencie s abov e 95 percen t ar e required.
Collectio n efficiencie s of 93 t o 99. 8 percen t fo r PM hav e been
observe d fo r ESP’ s operatin g on wood-fire d boilers , but cadmium
efficiencie s ar e likel y t o be somewhat les s becaus e of th e reason
cite d above. Fabri c filter s hav e had limite d application s to
wood-fire d boiler s becaus e of fir e hazards. Despite
complications , fabri c filter s ar e generall y preferre d fo r boilers
firin g salt-lade n wood. Thi s fue l produce s fin e PM wit h a high
sal t conten t fo r whic h fabri c filter s ca n achiev e hig h collection
efficiencies. I n tw o test s of fabri c filter s operatin g on
salt-lade n wood-fire d boilers , PM collectio n efficiencie s were
abov e 98 percent. No dat a ar e availabl e on cadmiu m emission
reductio n fo r fabri c filters , but becaus e cadmiu m i s enriched
6-38

ont o fin e PM, whic h i s les s readil y collecte d tha n PM as a whole,
i t i s expecte d tha t efficiencie s wil l be somewhat lower.
Emissions
The dat a on cadmiu m emission s fro m wood combustio n ar e quite
limited. A recen t stud y t o updat e th e wood wast e combustion
sectio n of AP-4 2 provide d a rang e and averag e typica l emission
facto r fo r wood wast e combustio n i n boiler s base d on th e results
of seve n tests. Tabl e 6-1 6 present s th e rang e and average
obtaine d fro m thos e test s and th e rang e and averag e fro m a
Californi a "Ho t Spots " tes t of a fluidized-be d wood-fire d boiler
not include d i n th e AP-4 2 update. 15,16
TABLE 6-16. SUMMARY OF CADMIUM EMISSION FACTORS FOR WOOD COMBUSTION
Cadmium emission factors
10-5 kg/Mg wood burned 10-5 lb/ton wood burned
Operation Range Average Range Average
Wood waste boilera 0.13-27 0.85 0.27-54 1.7
Wood waste boiler-"Hot Spots"b 0.44-1.0 0.74 0.88-2.0 1.5
Residential wood stove-conventional
----
1.13.6
----
2.27.2
Residential wood stove-noncatalytic
-- 1.0 -- 2.0
Residential wood stove-catalytic -- 2.3 -- 4.6
Source: References 15 through 17.
aBased on an assumed heating value of 10,460 kJ/kg (4,500 Btu/lb) and PM control.
bBased on a heating value of 19,220 kJ/kg (8,270 Btu/lb) and PM control with multiclones and ESP.
A revie w of th e literatur e produce d fou r emissio n factors
fo r residentia l wood stov e combustion , whic h ar e als o presented
i n Tabl e 6.16. 15,17 Thre e of th e fou r emissio n factor s were
6-39
provide d by th e sectio n on residentia l wood combustio n i n the
recen t AP-4 2 and include d emissio n factor s fo r conventional,
noncatalytic , and catalyti c wood stov e combustion. However , the
dat a use d t o develo p thes e emissio n factor s showed a hig h degree
of variabilit y withi n th e sourc e population. The fourt h emission
facto r fro m th e literatur e was base d on onl y a singl e tes t at one
locatio n of an uncontrolle d conventiona l wood stov e and may not
be representativ e of condition s acros s th e Unite d States.
Therefore , thes e emissio n factor s shoul d be use d cautiously.
MUNICIPAL WASTE COMBUSTION
Refus e or municipa l soli d wast e (MSW) consist s primaril y of
househol d garbag e and othe r nonhazardou s commercial,
institutional , and industria l soli d waste. Municipa l waste
combustor s (MWC’s) ar e use d t o reduc e th e mass and volum e of MSW
tha t ultimatel y must be landfilled.
Currently , ove r 160 MWC plant s ar e i n operatio n i n the
Unite d State s wit h capacitie s greate r tha n 36 megagrams per day
(Mg/d ) (4 0 ton s per day [ton/d] ) and a tota l capacit y of
approximatel y 100,00 0 Mg/d (110,00 0 ton/d ) of MSW. I t is
predicte d tha t by 1997 , th e tota l MWC capacit y wil l approach
150,00 0 Mg/d (165,00 0 ton/d) , whic h represent s ove r 28 percen t of
th e estimate d tota l amount of MSW generate d i n th e Unite d States
by th e yea r 2000. Tabl e 6-1 7 shows th e geographi c distribution
of MWC unit s and capacitie s by States. 18
I n additio n t o thes e larg e units , a number of smaller,
specialize d facilitie s aroun d th e Unite d State s als o bur n MSW.
However , th e tota l nationwid e capacit y of thos e smalle r unit s is
onl y a smal l fractio n of th e tota l capacit y of th e unit s with
individua l capacitie s of 36 Mg/d (4 0 ton/d ) and larger.
6-40
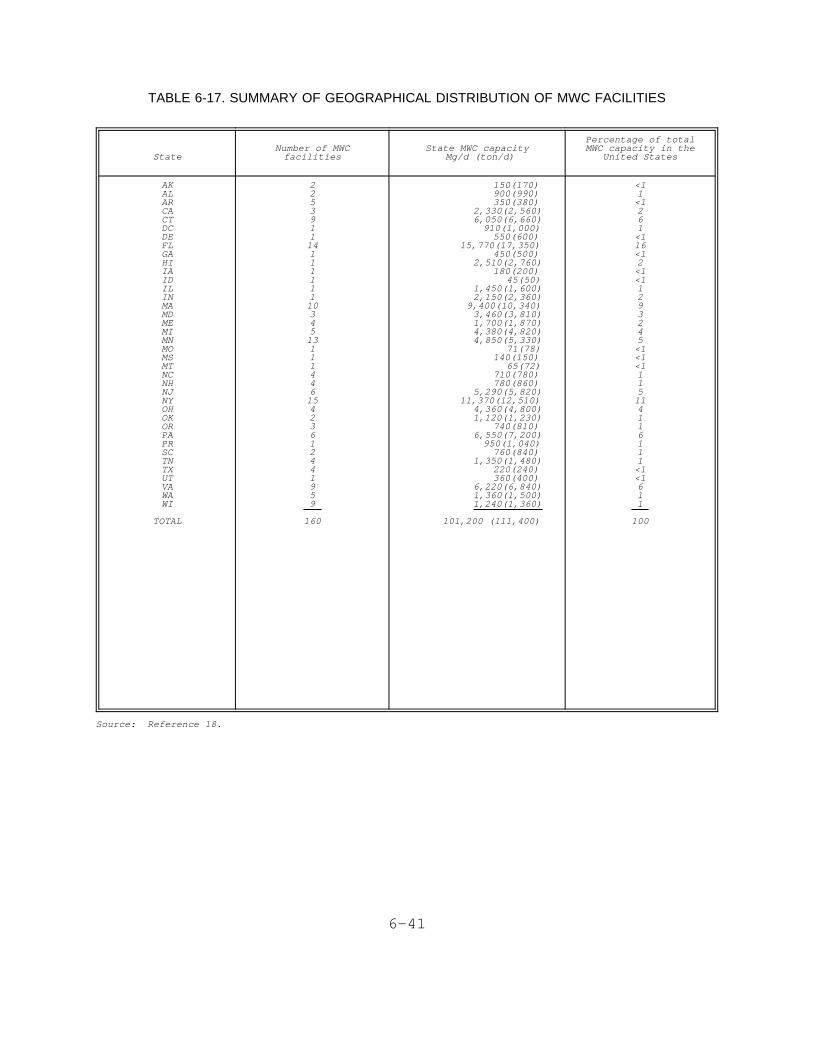
TABLE 6-17. SUMMARY OF GEOGRAPHICAL DISTRIBUTION OF MWC FACILITIES
StateNumber of MWC
facilitiesState MWC capacity
Mg/d (ton/d)
Percentage of totalMWC capacity in the
United States
AKALARCACTDCDEFLGAHIIAIDILINMAMDMEMIMNMOMSMTNCNHNJNYOHOKORPAPRSCTNTXUTVAWAWI
TOTAL
2253911
14111111
10345
13111446
15423612441959
160
150(170)900(990)350(380)
2,330(2,560)6,050(6,660)
910(1,000)550(600)
15,770(17,350)450(500)
2,510(2,760)180(200)
45(50)1,450(1,600)2,150(2,360)
9,400(10,340)3,460(3,810)1,700(1,870)4,380(4,820)4,850(5,330)
71(78)140(150)
65(72)710(780)780(860)
5,290(5,820)11,370(12,510)
4,360(4,800)1,120(1,230)
740(810)6,550(7,200)
950(1,040)760(840)
1,350(1,480)220(240)360(400)
6,220(6,840)1,360(1,500)1,240(1,360)
101,200 (111,400)
<11
<1261
<116<12
<1<11293245
<1<1<1115
114116111
<1<1611
100
Source: Reference 18.
6-41
Municipa l Soli d Waste Characteristics 19
Municipa l soli d wast e i s a heterogeneou s mixtur e of the
variou s material s foun d i n household , commercial , and industrial
wastes. Majo r constituent s i n typica l municipa l wast e ar e listed
i n Tabl e 6-18. No dat a on th e concentratio n of cadmiu m i n MSW
stream s wer e located , but known source s of cadmiu m i n MSW are
batteries , discarde d electrica l equipmen t and wiring , and
plastics.
Proces s Description 8,18,20,21
The thre e principa l MWC classe s ar e mass burn , refuse-
derive d fue l (RDF) , and modula r combustors. The paragraph s below
briefl y describ e some of th e ke y desig n and operating
characteristic s of thes e differen t combusto r types.
Reference s 8, 18, and 20 provid e more detaile d process
description s and proces s diagram s fo r eac h of th e systems
describe d below.
I n mass bur n units , th e MSW i s combuste d withou t any
preprocessin g othe r tha n remova l of item s to o larg e t o go through
th e fee d system. I n a typica l mass bur n combustor , refus e is
place d on a grat e tha t moves throug h th e combustor. Combustion
ai r i n exces s of stoichiometri c amount s i s supplie d bot h below
(underfir e air ) and abov e (overfir e air ) th e grate. Mass burn
combustor s ar e usuall y erecte d at th e sit e (a s oppose d t o being
prefabricate d at anothe r location ) and rang e i n siz e fro m 46 to
900 Mg/d (5 0 t o 1,00 0 tons/d ) of MSW throughpu t per unit. The
mass bur n combusto r categor y ca n be divide d int o mass burn
refractor y wal l (MB/REF) , mass burn/waterwal l (MB/WW), and mass
burn/rotar y waterwal l (MB/RC) designs. The tw o most common,
MB/REF and MB/WW, ar e describe d below.
6-42

TABLE 6-18. CURRENT AND FORECAST COMPOSITION OF DISPOSED RESIDENTIALAND COMMERCIAL WASTE (WEIGHT PERCENT)
Year
Component 1980 1990
Paper and Paperboard
Yard Wastes
Food Wastes
Glass
Metals
Plastics
Wood
Textiles
Rubber and Leather
Miscellaneous
33.6
18.2
9.2
11.3
10.3
6.0
3.9
2.3
3.3
1.9
38.3
17.0
7.7
8.8
9.4
8.3
3.7
2.2
2.5
2.1
TOTAL 100.0 100.0
Source: Reference 19.
6-43
The MB/REF combustor s ar e olde r facilitie s tha t comprise
severa l designs. One desig n involve s a batch-fe d upright
combustor , whic h may be cylindrica l or rectangula r i n shape. A
secon d desig n consist s of rectangula r combustio n chamber s with
traveling , rocking , or reciprocatin g grates. Thi s typ e of
combusto r i s continuousl y fe d and operate s i n an exces s ai r mode
wit h bot h underfir e and overfir e ai r provided. The wast e is
moved on a travelin g grat e and i s not mixe d as i t advances
throug h th e combustor. As a result , wast e burnou t or complete
combustio n i s inhibite d by fue l bed thickness , and ther e is
considerabl e potentia l fo r unburne d wast e t o be discharge d into
th e botto m as h pit. Rockin g and reciprocatin g grat e system s mix
and aerat e th e wast e bed as i t advance s throug h th e combustion
chamber , thereb y improvin g contac t betwee n th e wast e and
combustio n ai r and increasin g th e burnou t of combustibles. The
syste m generall y discharge s th e as h at th e end of th e grate s t o a
wate r quenc h pi t fo r collectio n and disposa l i n a landfill. The
MB/REF combustor s typicall y operat e at relativel y hig h exces s air
rate s t o preven t excessiv e temperatures , whic h ca n resul t in
refractor y damage, slagging , fouling , and corrosio n problems.
One advers e effec t of highe r exces s ai r level s i s th e potential
fo r increase d carryove r of PM fro m th e combustio n chamber , and,
ultimately , increase d stac k emissio n rates.
Becaus e of thei r operatin g characteristics , th e traveling
grat e system s may hav e coo l as h pocket s i n whic h cadmiu m i s not
expose d t o hig h temperature s and i s thereb y retaine d i n th e ash,
rathe r tha n bein g exhauste d wit h th e combustio n gas stream.
Consequently , cadmiu m may be emitte d as fugitiv e emission s from
as h handling. However , th e combustio n stac k i s th e primary
sourc e of cadmiu m emissions. I n th e rockin g and reciprocating
grat e systems , essentiall y al l cadmiu m wil l be exhauste d wit h the
combustio n gas.
6-44
The MB/WW desig n represent s th e predominan t technolog y in
th e existin g populatio n of larg e MWC’s, and i t i s expecte d that
ove r 50 percen t of new unit s wil l be MB/WW designs. I n MB/WW
units , th e combusto r wall s ar e constructe d of meta l tube s that
contai n pressurize d wate r and recove r radian t energ y fro m the
combustio n chamber. Wit h thi s typ e of system , unprocesse d waste
(afte r remova l of large , bulk y item s and noncombustibles ) is
delivere d by an overhea d cran e t o a fee d hoppe r tha t convey s the
wast e int o th e combustio n chamber. Nearl y al l moder n MB/WW
facilitie s utiliz e reciprocatin g grate s or rolle r grate s t o move
th e wast e throug h th e combustio n chamber. The grate s typically
includ e tw o or thre e separat e section s wher e designate d stage s in
th e combustio n proces s occur. On th e initia l grat e section,
referre d t o as th e dryin g grate , th e moistur e conten t of the
wast e i s reduce d prio r t o ignition. I n th e secon d grat e section,
th e burnin g grate , th e majorit y of activ e burnin g take s place.
The thir d grat e section , referre d t o as th e burnou t or finishing
grate , i s wher e remainin g combustible s i n th e wast e ar e burned.
Botto m as h i s discharge d fro m th e finishin g grat e int o a water-
fille d as h quenc h pi t or ra m discharger. Fro m there , th e moist
as h i s discharge d t o a conveyo r syste m and transporte d t o an ash
loadin g are a or storag e are a prio r t o disposal. Becaus e the
wast e bed i s expose d t o fairl y unifor m hig h combustion
temperatures , cadmiu m wil l volatiliz e and condens e on small
particles. Most cadmiu m wil l be exhauste d as fin e PM wit h the
combustio n gases , althoug h some may be partitione d wit h th e ash.
Refuse-derive d fue l combustor s bur n MSW tha t has been
processe d t o varyin g degrees , fro m simpl e remova l of bulk y and
noncombustibl e item s accompanie d by shredding , t o extensive
processin g t o produc e a finel y divide d fue l suitabl e fo r co-
firin g i n pulverize d coal-fir e boilers. Processin g MSW t o RDF
generall y raise s th e heatin g valu e of th e wast e becaus e many of
th e noncombustibl e item s hav e been removed.
6-45

A se t of standard s fo r classifyin g RDF type s has been
establishe d by th e America n Societ y fo r Testin g and Materials
The typ e of RDF use d i s dependen t on th e boile r design. Boilers
tha t ar e designe d t o bur n RDF as th e primar y fue l usuall y utilize
spreade r stoker s and fir e fluf f RDF i n a semi-suspensio n mode.
Thi s mode of feedin g i s accomplishe d by usin g an ai r swept
distributor , whic h allow s a portio n of th e fee d t o bur n in
suspensio n and th e remainde r t o be burne d out afte r fallin g on a
horizonta l travelin g grate. The number of RDF distributor s i n a
singl e uni t varie s directl y wit h uni t capacity. The distributors
ar e normall y adjustabl e so tha t th e trajector y of th e wast e feed
ca n be varied. Becaus e th e travelin g grat e moves fro m th e rear
t o th e fron t of th e furnace , distributo r setting s ar e adjuste d so
tha t most of th e wast e land s on th e rea r two-third s of th e grate
t o allo w more tim e fo r combustio n t o be complete d on th e grate.
Botto m as h drop s int o a water-fille d quenc h chamber. Underfire
ai r i s normall y preheate d and introduce d beneat h th e grat e by a
singl e plenum. Overfir e ai r i s injecte d throug h row s of high
pressur e nozzles , providin g a zon e fo r mixin g and completio n of
th e combustio n process. Becaus e essentiall y al l of th e wast e is
expose d t o hig h combustio n temperature s on th e grate , most of the
cadmiu m i n th e RDF wil l be discharge d wit h th e combustio n gas
exhaus t as fin e PM.
I n a fluidized-be d combusto r (FBC) , fluf f or pelletize d RDF
i s combuste d on a turbulen t bed of noncombustibl e material , such
as limestone , sand , or silica. I n it s simples t form , th e FBC
consist s of a combusto r vesse l equippe d wit h a gas distribution
plat e and underfir e ai r windbo x at th e bottom. The combustion
bed overlie s th e gas distributio n plate. The RDF may be injected
int o or abov e th e bed throug h port s i n th e combusto r wall. The
combusto r bed i s suspende d or "fluidized " throug h the
introductio n of underfir e ai r at a hig h flo w rate. Overfir e air
i s use d t o complet e th e combustio n process.
6-46
Good mixin g i s inheren t i n th e FBC design. Fluidized-bed
combustor s hav e unifor m gas temperature s and mass composition s in
bot h th e bed and i n th e uppe r regio n of th e combustor. This
uniformit y allow s th e FBC’ s t o operat e at lowe r exces s ai r and
temperatur e level s tha n conventiona l combustio n systems. Waste-
fire d FBC’ s typicall y operat e at exces s ai r level s betwee n 30 and
100 percen t and at bed temperature s aroun d 815° C (1500°F). At
thi s temperature , most of th e cadmiu m wil l be volatilized. The
cadmiu m the n condense s ont o smal l particle s and i s exhauste d with
th e combustio n gas strea m as fin e PM.
I n term s of number of facilities , modula r starved - (or
controlled- ) ai r (MOD/SA) combustor s represen t a larg e segment of
th e existin g MWC population. However , becaus e of thei r small
sizes , the y accoun t fo r onl y a smal l percentag e of th e total
capacity. The basi c desig n of a MOD/SA combusto r consist s of two
separat e combustio n chambers , referre d t o as th e "primary " and
"secondary " chambers. Waste i s batch-fe d intermittentl y t o the
primar y chamber by a hydraulicall y activate d ram. The charging
bi n i s fille d by a front-en d loade r or by othe r mechanical
systems. Waste i s fe d automaticall y on a se t frequency , with
generall y 6 t o 10 minute s betwee n charges.
Waste i s moved throug h th e primar y combustio n chamber by
eithe r hydrauli c transfe r rams or reciprocatin g grates.
Combustor s usin g transfe r rams hav e individua l hearth s upon which
combustio n take s place. Grat e system s generall y includ e two
separat e grat e sections. I n eithe r case , wast e retentio n times
i n th e primar y chamber ar e lengthy , lastin g up t o 12 hours.
Botto m as h i s usuall y discharge d t o a wet quenc h pit.
The quantit y of ai r introduce d i n th e primar y chamber
define s th e rat e at whic h wast e burns. Combustio n ai r is
introduce d i n th e primar y chamber at substoichiometri c levels,
6-47
resultin g i n a flu e gas ric h i n unburne d hydrocarbons. The
combustio n ai r flo w rat e t o th e primar y chamber i s controlle d to
maintai n an exhaus t gas temperatur e se t poin t [generall y 650° to
980° C (1200 ° t o 1800°F)] , whic h correspond s t o abou t 40 to
60 percen t theoretica l air. As th e hot , fuel-ric h flu e gases
flo w t o th e secondar y chamber , the y ar e mixe d wit h exces s ai r to
complet e th e burnin g process. The temperatur e of th e exhaust
gase s fro m th e primar y chamber i s abov e th e autoignitio n point.
Thus , completin g combustio n i s simpl y a matte r of introducin g air
t o th e fuel-ric h gases. The amount of ai r adde d t o th e secondary
chamber i s controlle d t o maintai n a desire d flu e gas exit
temperature , typicall y 980° t o 1200° C (1800 ° t o 2200°F). At
thes e primar y chamber and secondar y chamber temperatures,
essentiall y al l of th e cadmiu m containe d i n th e wast e i s expected
t o be volatilized , condens e ont o smal l particles , and be emitted
as fin e PM fro m th e secondar y chamber wit h th e combustio n gas
stream. 21
Emissio n Contro l Measures 18
Cadmiu m emission s fro m MWC unit s ar e generall y controlle d by
condensin g th e cadmiu m vapor s fro m th e combustio n chamber to
particl e for m and the n removin g th e particle-phas e cadmiu m wit h a
high-efficienc y PM contro l device. The PM contro l device s most
frequentl y use d i n th e Unite d State s ar e ESP’ s and fabric
filters. Typically , newer MWC system s us e a combinatio n of gas
coolin g and duc t sorben t injectio n (DSI ) or spra y drye r (SD)
system s upstrea m of th e PM devic e t o reduc e temperature s and
provid e a mechanis m fo r aci d gas control. The paragraph s below
briefl y describ e th e DSI and SD processes. Becaus e th e ESP’ s and
FF’ s use d on MWC’s ar e comparabl e t o thos e use d on other
combustio n systems , the y ar e not described. Referenc e 18
provide s more detaile d description s of th e contro l system s and
additiona l informatio n on th e performanc e of thes e systems.
6-48
Spra y dryin g i n combinatio n wit h eithe r fabri c filtratio n or
an ESP i s th e most frequentl y use d aci d gas contro l technology
fo r MWC’s i n th e Unite d States. Spra y dryer/fabri c filter
system s ar e more common tha n SD/ESP system s and ar e use d most on
new, larg e MWC’s. I n th e spra y dryin g process , lim e i s slurried
and the n injecte d int o th e SD throug h eithe r a rotar y atomize r or
dual-flui d nozzles. The ke y desig n and operatin g parameter s that
significantl y affec t SD performanc e ar e th e SD’ s outle t approach
t o saturatio n temperatur e and lime-to-aci d gas stoichiometric
ratio. The SD outle t approac h t o saturatio n temperatur e is
controlle d by th e amount of wate r i n th e lim e slurry. More
effectiv e aci d gas and metal s remova l occur s at lower
temperatures , but th e gas temperatur e must be kep t hig h enoug h to
ensur e th e slurr y and reactio n product s ar e adequatel y dried
prio r t o collectio n i n th e PM contro l device.
Wit h DSI , powdere d sorben t i s pneumaticall y injecte d into
eithe r a separat e reactio n vesse l or a sectio n of flu e gas duct
locate d downstrea m of th e combusto r economizer. Alkal i i n the
sorben t (generall y calcium ) react s wit h HCl and SO2 t o form
alkal i salt s (e.g. , calciu m chlorid e [CaCl 2] and calciu m sulfite
[CaSO3]). Reactio n products , fl y ash , and unreacte d sorben t are
collecte d wit h eithe r an ESP or fabri c filter.
Based on a summary of MWC cadmiu m emissio n dat a in
Referenc e 18, substantia l cadmiu m remova l ca n be achieve d using
spra y dryin g or duc t sorben t injectio n i n combinatio n wit h fabric
filtratio n or an ESP. A cadmiu m remova l efficienc y of 98 percent
ca n be achieve d wit h an SD/ESP system , slightl y lowe r tha n the
cadmiu m contro l wit h an SD/FF syste m (9 9 percent ) becaus e of the
metal s enrichmen t of th e fin e particles. I f th e removal
efficienc y of PM wit h an ESP i s 98 percen t or greater , the
remova l efficienc y of cadmiu m wit h an ESP wil l generall y be at
leas t 95 percent. Removal efficiencie s greate r tha n 95 percent
6-49
ca n generall y be achieve d by DSI/ES P systems. A DSI/F F system
ca n achiev e 99 percen t remova l of cadmium.
Emissions 18
A recen t stud y conducte d t o updat e th e municipa l waste
combustio n sectio n of AP-4 2 provide d a comprehensiv e revie w of
th e availabl e MWC cadmiu m emissio n data , whic h ar e summarize d in
Tabl e B- 2 of Appendi x B. The emissio n dat a tha t ar e presente d in
Appendi x B ar e i n concentratio n unit s rathe r tha n emission
factor s becaus e th e stud y foun d tha t most of th e tes t reports
containe d insufficien t proces s dat a t o generat e emissio n factors.
Afte r reviewin g th e tes t data , th e author s conclude d that
th e developmen t of emissio n factor s fo r MWC’s, usin g onl y the
tes t report s whic h estimate d fee d rates , woul d eliminat e data
fro m so many facilities , especiall y ke y facilities , tha t the
value s derive d wer e not likel y t o be representativ e of th e entire
MWC population. I n addition , th e subjectiv e natur e of th e refuse
fee d rate s calle d int o questio n th e validit y of th e limite d data.
Consequently , emissio n factor s wer e develope d usin g th e F-factor,
whic h i s th e rati o of th e gas volum e of th e product s of
combustio n t o th e heatin g valu e of th e fue l develope d by th e EPA
(EPA Metho d 19). Thi s approac h require s an F-facto r and an
estimat e of th e fue l heatin g value. For MWC’s, an F-facto r of
0.25 7 dscm/MJ (9,57 0 dscf/10 6 Btu ) (a t zer o percen t oxygen ) is
assigned. For al l combusto r types , excep t RDF combustors , an
assumed heatin g valu e of 10,50 0 kJ/k g (4,50 0 Btu/lb ) refus e was
als o used. For RDF combusto r units , th e processe d refus e has a
highe r heatin g value , and th e assumed heatin g valu e was
12,80 0 kJ/k g (5,50 0 Btu/lb). Overall , thes e dat a are
representativ e of averag e value s fo r MWC’s.
6-50
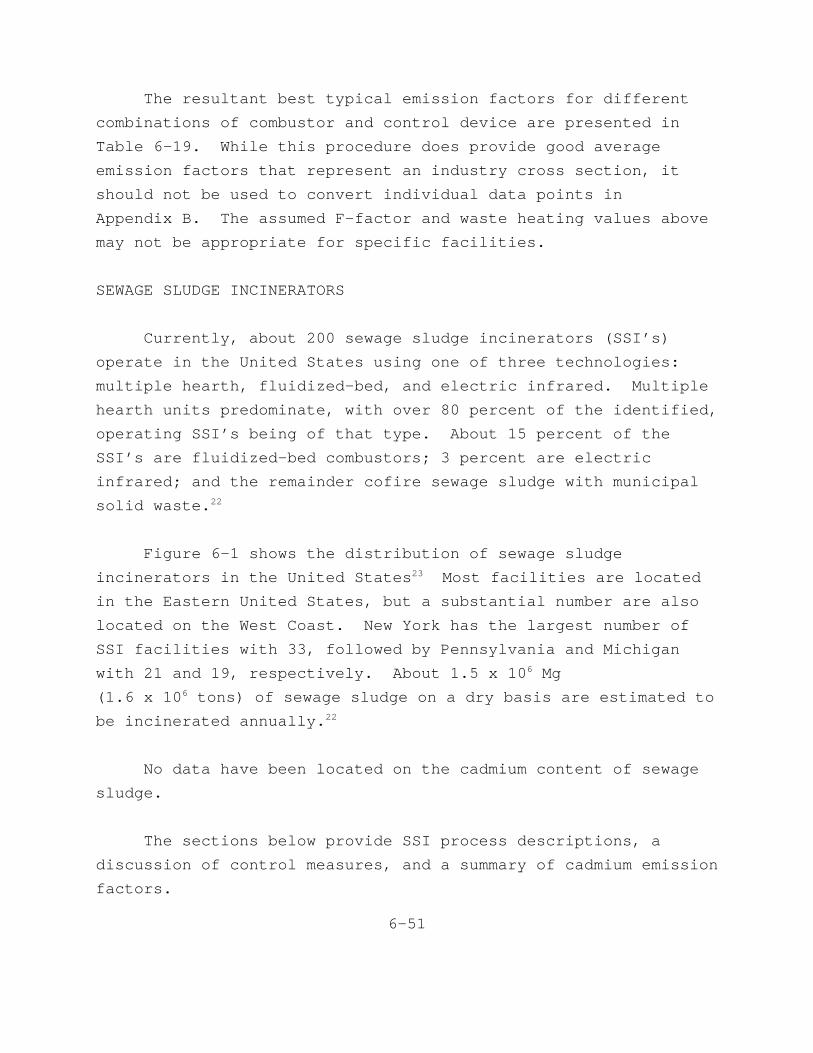
The resultan t bes t typica l emissio n factor s fo r different
combination s of combusto r and contro l devic e ar e presente d in
Tabl e 6-19. Whil e thi s procedur e does provid e good average
emissio n factor s tha t represen t an industr y cros s section , it
shoul d not be use d t o conver t individua l dat a point s in
Appendi x B. The assumed F-facto r and wast e heatin g value s above
may not be appropriat e fo r specifi c facilities.
SEWAGE SLUDGE INCINERATORS
Currently , abou t 200 sewage sludg e incinerator s (SSI’s)
operat e i n th e Unite d State s usin g one of thre e technologies:
multipl e hearth , fluidized-bed , and electri c infrared. Multiple
heart h unit s predominate , wit h ove r 80 percen t of th e identified,
operatin g SSI’ s bein g of tha t type. About 15 percen t of the
SSI’ s ar e fluidized-be d combustors ; 3 percen t ar e electric
infrared ; and th e remainde r cofir e sewage sludg e wit h municipal
soli d waste. 22
Figur e 6- 1 shows th e distributio n of sewage sludge
incinerator s i n th e Unite d States 23 Most facilitie s ar e located
i n th e Easter n Unite d States , but a substantia l number ar e also
locate d on th e West Coast. New Yor k has th e larges t number of
SSI facilitie s wit h 33, followe d by Pennsylvani a and Michigan
wit h 21 and 19, respectively. About 1. 5 x 10⁶ Mg
(1. 6 x 10⁶ tons ) of sewage sludg e on a dr y basi s ar e estimate d to
be incinerate d annually. 22
No dat a hav e been locate d on th e cadmiu m conten t of sewage
sludge.
The section s belo w provid e SSI proces s descriptions , a
discussio n of contro l measures , and a summary of cadmiu m emission
factors.
6-51

TABLE 6-19. BEST TYPICAL CADMIUM EMISSION FACTORS FOR MUNICIPALWASTE COMBUSTORS
Combustortype
Controlstatusa
Cadmium emission factors
g/Mg waste 10-3 lb/ton waste
Mass Burn/Waterwall UN 4.8 9.7
SD/FF 0.015 0.029
SD/ESP 0.056 0.11
ESP 0.55 1.1
DSI/FF 0.016 0.032
Mass Burn/RotaryWaterwall
DSI/FF 0.012 0.024
Mass Burn/Refractory Wall UN 5.7 1.1
ESP 0.10 0.20
DSI/ESP 0.044 0.089
Refuse-Derived Fuel-Fired UN 4.4 8.7
SD/FF 0.0 0.0
SD/ESP 0.042 0.084
ESP 0.083 0.17
Modular/Excess Air DSI/FF 0.0081 0.016
Modular/Starved Air UN 1.2 2.4
ESP 0.23 0.46
Source: Reference 18.
aUN = uncontrolled, SD = spray dryer, FF = fabric filter, ESP = electrostatic precipitator,DSI = duct sorbent injection.
6-52
Proces s Description 8,22
Figur e 6- 2 present s a simplifie d diagra m of th e sewage
sludg e incineratio n process , whic h involve s tw o primar y steps.
The firs t ste p i n th e proces s of sewage sludg e incineratio n is
th e dewaterin g of th e sludge. Sludg e i s generall y dewatered
unti l i t i s abou t 15 t o 30 percen t solids. When i t i s more than
25 percen t solids , th e sludg e wil l usuall y bur n withou t auxiliary
fuel. Afte r dewatering , th e sludg e i s sen t t o th e incinerator,
and therma l oxidatio n occurs. The unburne d residua l as h is
remove d fro m th e incinerator , usuall y on a continuou s basis , and
i s disposed. A portio n of th e noncombustibl e waste , as wel l as
unburne d volatil e organi c compounds , i s carrie d out of the
combusto r throug h entrainmen t i n th e exhaus t gas stream. Air
pollutio n contro l devices , primaril y wet scrubbers , ar e use d to
remov e th e entraine d pollutant s fro m th e exhaus t gas stream. The
gas strea m i s the n exhausted , and th e collecte d pollutant s are
sen t bac k t o th e head of th e wastewate r treatmen t plan t i n the
scrubbe r effluent. As shown i n Figur e 6-2 , th e primar y sourc e of
cadmiu m emission s fro m th e SSI proces s i s th e combustio n stack.
Some fugitiv e emission s may be generate d fro m as h handling , but
th e quantitie s ar e expecte d t o be small. Becaus e cadmiu m is
relativel y volatile , most cadmiu m wil l leav e th e combustion
chamber as fin e PM i n th e exhaus t gas , althoug h some cadmiu m may
be foun d i n th e as h residue.
The paragraph s belo w briefl y describ e th e thre e primar y SSI
processe s use d i n th e Unite d States. Reference s 8 and 22 provide
more detaile d description s and proces s diagrams.
The basi c multipl e heart h furnac e i s cylindrica l i n shape
and i s oriente d vertically. The oute r shel l i s constructe d of
steel , line d wit h refractory , and surround s a serie s of
horizonta l refractor y hearths. A hollo w cas t iro n rotatin g shaft
6-54

run s throug h th e cente r of th e hearths. Coolin g ai r fo r the
cente r shaf t and rabbl e arms i s introduce d int o th e shaf t by a
fa n locate d at it s base. Attache d t o th e centra l shaf t ar e the
rabbl e arms wit h teet h shape d t o rak e th e sludg e i n a spiral
motion , alternatin g i n directio n fro m th e outsid e in , the n inside
out , betwee n hearths. Typically , th e uppe r and lowe r hearth s are
fitte d wit h fou r rabbl e arms , and th e middl e hearth s ar e fitted
wit h two. Burner s tha t provid e auxiliar y hea t ar e locate d i n the
sidewall s of th e hearths.
Partiall y dewatere d sludg e i s typicall y fe d ont o the
perimete r of th e to p hearth. Typically , th e rabbl e arms move the
sludg e throug h th e incinerato r as th e motio n of th e rabbl e arms
rake s th e sludg e towar d th e cente r shaft , wher e i t drop s through
hole s locate d at th e cente r of th e hearth. Thi s proces s is
repeate d i n al l of th e subsequen t hearths , wit h th e sludg e moving
i n opposit e direction s i n adjacen t hearths. The effec t of the
rabbl e motio n i s t o brea k up soli d materia l t o allo w better
surfac e contac t wit h hea t and oxygen.
Ambien t ai r i s firs t ducte d throug h th e centra l shaf t and
it s associate d rabbl e arms. Thi s ai r i s the n take n fro m th e top
of th e shaf t and recirculate d ont o th e lowermos t heart h as
preheate d combustio n air. The combustio n ai r flow s upward
throug h th e dro p hole s i n th e hearths , countercurren t t o th e flow
of th e sludge , befor e bein g exhauste d fro m th e to p hearth.
Multipl e heart h furnace s ca n be divide d int o thre e zones.
The uppe r hearth s compris e th e dryin g zon e wher e most of the
moistur e i n th e sludg e i s evaporated. The temperatur e i n the
dryin g zon e i s typicall y betwee n 425° and 760° C (800 ° and
1400°F). Sludg e combustio n occur s i n th e middl e hearth s (second
zone ) as th e temperatur e i s increase d betwee n 815° and 925°C
(1500 ° and 1700°F). When expose d t o th e temperature s i n both
6-56

uppe r zones , most cadmiu m wil l be volatilized , condens e on small
particles , and the n be discharge d as fin e PM i n th e exhaus t gas.
Some of th e cadmiu m may be partitione d wit h th e ash. The third
zone , made up of th e lowermos t hearth(s) , i s th e coolin g zone.
I n thi s zone , th e as h i s coole d as it s hea t i s transferre d t o the
incomin g combustio n air.
Fluidized-be d combustor s (FBC’s ) ar e cylindricall y shaped
and oriente d vertically. The oute r shel l i s constructe d of steel
and i s line d wit h refractory. Tuyere s (nozzle s designe d to
delive r blast s of air ) ar e locate d at th e bas e of th e furnace
withi n a refractory-line d grid. A bed of san d rest s upon the
grid. Partiall y dewatere d sludg e i s fe d int o th e bed of the
furnace. Ai r injecte d throug h th e tuyeres , at pressure s fro m 20
t o 35 kPa ( 3 t o 5 psig) , simultaneousl y fluidize s th e bed of hot
san d and th e incomin g sludge. Temperature s of 725° t o 825°C
(1350 ° t o 1500°F) , whic h ar e sufficien t t o vaporiz e most cadmium
containe d i n th e sludge , ar e maintaine d i n th e bed. As the
sludg e burns , fin e as h particles , includin g cadmium , ar e carried
out th e to p of th e furnac e wit h th e exhaus t gas.
An electri c incinerato r consist s of a horizontall y oriented,
insulate d furnace. A woven wir e bel t conveyo r extend s th e length
of th e furnace , and infrare d heatin g element s ar e locate d i n the
roo f abov e th e conveyo r belt. Combustio n ai r i s preheate d by the
flu e gase s and i s injecte d int o th e discharg e end of th e furnace.
Electri c incinerator s consis t of a number of prefabricated
module s whic h ca n be linke d togethe r t o provid e th e necessary
furnac e length. The dewatere d sludg e cak e i s conveye d int o one
end of th e incinerator. An interna l rolle r mechanis m level s the
sludg e int o a continuou s laye r approximatel y 2. 5 centimeter s (cm)
( 1 inc h [in.] ) thic k acros s th e widt h of th e belt. The sludg e is
sequentiall y drie d and the n burne d as i t moves beneat h the
infrare d heatin g elements. Ash i s discharge d int o a hoppe r at
6-57

th e opposit e end of th e furnace. The preheate d combustio n air
enter s th e furnac e abov e th e as h hoppe r and i s furthe r heate d by
th e outgoin g ash. The directio n of ai r flo w i s countercurren t to
th e movement of th e sludg e alon g th e conveyor.
Emissio n Contro l Measures 22,24
Most SSI’ s ar e equippe d wit h some typ e of wet scrubbing
syste m fo r PM control. Becaus e thes e system s provid e gas cooling
as wel l as PM removal , the y ca n provid e some cadmiu m control.
The paragraph s belo w briefl y describ e th e wet scrubbin g systems
typicall y use d on existin g SSI’s.
Wet scrubbe r control s on SSI’ s rang e fro m lo w pressur e drop
spra y tower s and wet cyclone s t o highe r pressur e dro p venturi
scrubber s and venturi/impingemen t tra y scrubbe r combinations.
The most widel y use d contro l devic e applie d t o a multipl e hearth
incinerato r i s th e impingemen t tra y scrubber. Olde r unit s use
th e tra y scrubbe r alon e whil e combinatio n venturi/impingement
tra y scrubber s ar e widel y applie d t o newer multipl e hearth
incinerator s and t o fluidized-be d incinerators. Most electric
incinerator s and some fluidized-be d incinerator s us e venturi
scrubber s only.
I n a typica l combinatio n venturi/impingemen t tra y scrubber,
hot gas exit s th e incinerato r and enter s th e precoolin g or quench
sectio n of th e scrubber. Spra y nozzle s i n th e quenc h section
coo l th e incomin g gas , and th e quenche d gas the n enter s the
ventur i sectio n of th e contro l device. Ventur i wate r i s usually
pumped int o an inle t wei r abov e th e quencher. The ventur i water
enter s th e scrubbe r abov e th e throa t and flood s th e throat
completely. Most ventur i section s come equippe d wit h variable
throat s t o allo w th e pressur e dro p t o be increased , thereby
increasin g PM efficiency. At th e bas e of th e floode d elbow , the
6-58

gas strea m passe s throug h a connectin g duc t t o th e bas e of the
impingemen t tra y tower. Gas velocit y i s furthe r reduce d upon
entr y t o th e towe r as th e gas strea m passe s upwar d throug h the
perforate d impingemen t trays. Water usuall y enter s th e trays
fro m inle t port s on opposit e side s and flow s acros s th e tray. As
gas passe s throug h eac h perforatio n i n th e tray , i t create s a jet
tha t bubble s up th e wate r and furthe r entrain s soli d particles.
At th e to p of th e towe r i s a mis t eliminato r t o reduc e the
carryove r of wate r droplet s i n th e stac k effluen t gas.
Accordin g t o th e literature , th e contro l of cadmium
emission s wit h wet scrubbe r control s i s expecte d t o be les s than
th e contro l of tota l PM emissions. I n a stud y of emission s from
fou r municipa l wastewate r sludg e incinerator , thre e multiple
heart h and one fluidized-bed , cadmiu m and othe r heav y metal s were
foun d t o be enriche d i n th e fin e particles , whic h ar e not as
efficientl y remove d by scrubber s as large r particles. 24 The
efficienc y dat a fo r cadmiu m emission s contro l fo r sewage sludge
incineratio n ar e ver y limite d and , therefore , ar e not completely
reliable. Based on tw o test s reporte d i n Referenc e 22, an
averag e cadmiu m contro l efficienc y of 75 percen t ca n be achieved
wit h a combinatio n of ventur i scrubbe r and impingemen t scrubber
systems. By contrast , base d on th e result s of thre e othe r tests,
an averag e of 95 percen t contro l of PM ca n be achieve d wit h an
impingemen t scrubbe r alone. About 86 percen t PM contro l was
achieve d wit h a ventur i scrubbe r i n anothe r test.
Emissions
As a par t of th e recen t updat e of AP-42 , dat a hav e been
develope d on cadmiu m emission s fro m SSI’s. 22 Thes e dat a are
tabulate d i n Appendi x B, Tabl e B- 3 and summarize d i n Tabl e 6-20.
Becaus e no dat a ar e availabl e on cadmiu m concentration s in
6-59
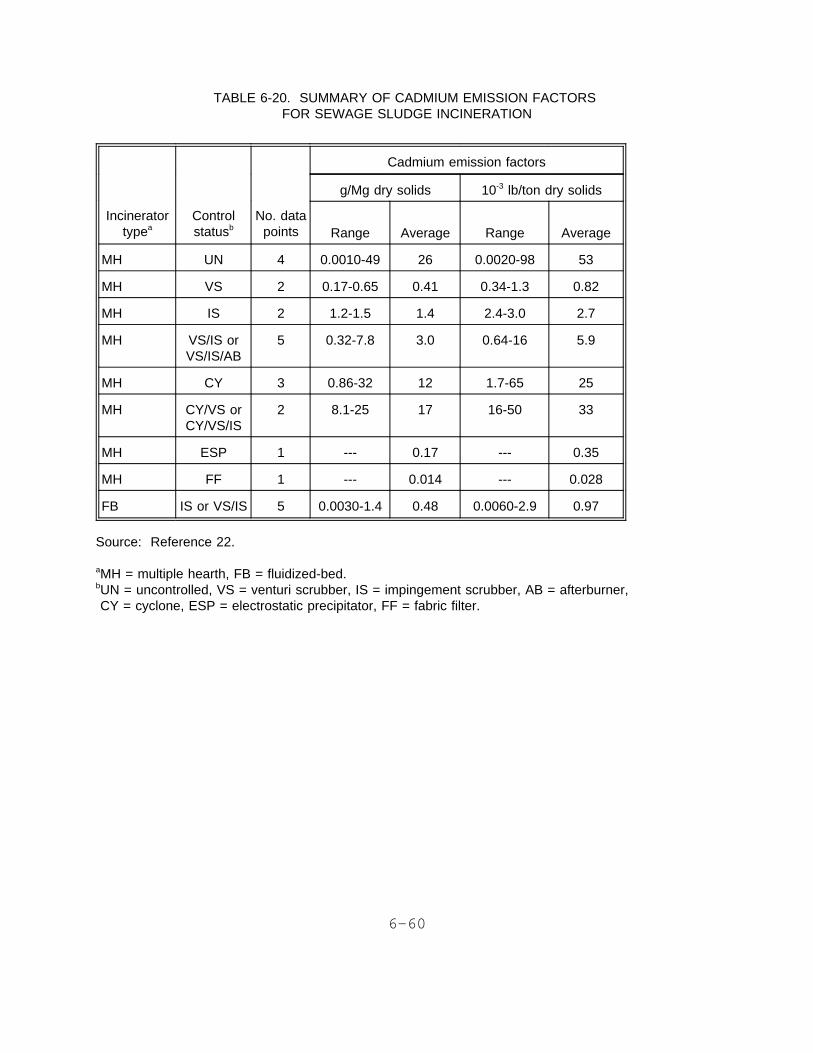
TABLE 6-20. SUMMARY OF CADMIUM EMISSION FACTORSFOR SEWAGE SLUDGE INCINERATION
Cadmium emission factors
g/Mg dry solids 10-3 lb/ton dry solids
Incineratortypea
Controlstatusb
No. datapoints Range Average Range Average
MH UN 4 0.0010-49 26 0.0020-98 53
MH VS 2 0.17-0.65 0.41 0.34-1.3 0.82
MH IS 2 1.2-1.5 1.4 2.4-3.0 2.7
MH VS/IS orVS/IS/AB
5 0.32-7.8 3.0 0.64-16 5.9
MH CY 3 0.86-32 12 1.7-65 25
MH CY/VS orCY/VS/IS
2 8.1-25 17 16-50 33
MH ESP 1 --- 0.17 --- 0.35
MH FF 1 --- 0.014 --- 0.028
FB IS or VS/IS 5 0.0030-1.4 0.48 0.0060-2.9 0.97
Source: Reference 22.
aMH = multiple hearth, FB = fluidized-bed.bUN = uncontrolled, VS = venturi scrubber, IS = impingement scrubber, AB = afterburner,CY = cyclone, ESP = electrostatic precipitator, FF = fabric filter.
6-60
sludge , th e tes t dat a i n Tabl e 6-2 0 represen t th e bes t typical
emissio n factor s fo r sewage sludg e incineration.
MEDICAL WASTE INCINERATION
Medica l wast e include s infectiou s and noninfectiou s wastes
generate d by a variet y of facilitie s engage d i n medica l care,
veterinar y care , or researc h activitie s suc h as hospitals,
clinics , doctors ’ and dentists ’ offices , nursin g homes,
veterinar y clinic s and hospitals , medica l laboratories , and
medica l and veterinar y school s and thei r researc h units. Medical
wast e i s define d by th e U. S. EPA as "an y soli d wast e whic h is
generate d i n th e diagnosis , treatment , or immunizatio n of human
being s or animals , i n researc h pertainin g thereto , or i n the
productio n or testin g of biologicals." A medica l waste
incinerato r (MWI) i s any devic e tha t burn s suc h medica l waste. 25
Recent estimate s develope d by EPA sugges t tha t about
3.0 6 millio n Mg (3.3 6 millio n tons ) of medica l wast e ar e produced
annuall y i n th e Unite d States. Approximatel y 5,00 0 MWI’s , which
ar e distribute d geographicall y throughou t th e Unite d States , are
use d t o trea t thi s waste. Of thes e 5,00 0 units , abou t 3,00 0 are
locate d at hospitals ; abou t 150 ar e large r commercia l facilities;
and th e remainde r ar e distribute d among veterinar y facilities,
nursin g homes, laboratories , and othe r miscellaneous
facilities. 26
Availabl e informatio n indicate s tha t thes e MWI system s can
be significan t source s of cadmiu m emissions. Cadmiu m emissions
resul t fro m cadmium-bearin g material s containe d i n th e waste.
Althoug h concentration s of specifi c metal s i n th e wast e hav e not
been full y characterized , known cadmiu m source s i n medica l waste
includ e batteries , pigments , and plastics. Batteries , primarily
nickel-cadmiu m and mercury-cadmiu m batteries , ar e a majo r cadmium
6-61

source. Mercury-cadmiu m batterie s ar e use d i n transistorized
equipment , hearin g aids , watches , calculators , computers , smoke
detectors , tap e recorders , regulate d power supplies , radiation
detectio n meters , scientifi c equipment , pagers , oxyge n and metal
monitors , and portabl e electrocardiogra m monitors. The nickel-
cadmiu m batter y i s th e most widel y use d rechargeabl e household
batter y and i s use d i n computers , hearin g aids , and pocket
calculators. Cadmiu m pigment s ar e primaril y use d i n plastic s but
ar e als o use d i n paints , enamels , printin g inks , rubber , paper,
and painte d textiles. 27 Plastic s ar e use d i n disposable
instruments , syringes , petr i dishes , plasti c containers,
packaging , bedpans , urin e bags , respirator y devices , dialysis
equipment , etc. 28 Al l of thes e material s ca n be route d t o an
MWI, thereb y contributin g t o cadmiu m emission s fro m thi s source
category.
Proces s Description
Althoug h th e ultimat e destinatio n of almos t al l medical
wast e produce d i n th e Unite d State s i s a soli d wast e landfill,
th e wast e generall y must be treate d befor e i t ca n be landfilled.
The primar y function s of MWI facilitie s ar e t o rende r th e waste
biologicall y innocuou s and t o reduc e th e volum e and mass of
solid s tha t must be landfille d by combustin g th e organi c material
containe d i n th e waste. Over th e years , a wid e variet y of MWI
syste m design s and operatin g practice s hav e been use d to
accomplis h thes e functions. To accoun t fo r thes e system
differences , a number of MWI classificatio n schemes hav e been
use d i n pas t studies , includin g classificatio n by wast e type
(pathological , mixe d medica l waste , re d bag waste , etc.),
classificatio n by operatin g mode (continuous , intermittent,
batch) , and classificatio n by combusto r desig n (retort,
fixed-hearth , pulsed-hearth , rotar y kiln , etc.). Some insight
int o MWI processes , emissions , and emission s contro l i s provided
6-62
by eac h of thes e schemes. However , becaus e th e available
evidenc e suggest s tha t cadmiu m emission s ar e affecte d primarily
by wast e characteristics , th e characterizatio n and contro l of
cadmiu m emission s fro m MWI’s ca n be discusse d withou t considering
othe r MWI desig n and operatin g practice s i n detail. The
paragraph s belo w provid e a generi c MWI proces s descriptio n and
identif y potentia l source s of cadmiu m emissions. More detailed
description s of specifi c MWI desig n and operatin g practice s can
be foun d i n Reference s 29 throug h 31.
A schemati c of a generi c MWI syste m tha t identifie s the
majo r component s of th e syste m i s shown i n Figur e 6-3. As
indicate d i n th e schematic , most MWI’s ar e multiple-chamber
combustio n system s tha t compris e primary , secondary , and possibly
tertiar y chambers. The primar y component s of th e MWI proces s are
th e waste-chargin g system , th e primar y chamber , th e as h handling
system , th e secondar y chamber , and th e combustio n gas system,
whic h ar e discusse d briefl y below.
Medica l wast e i s introduce d t o th e primar y chamber vi a the
waste-chargin g system. The wast e ca n be charge d eithe r manually
or mechanically. Wit h manual charging , whic h i s use d onl y on
batc h and smalle r (generall y older ) intermitten t units , the
operato r open s a charg e door on th e sid e of th e primar y chamber
and tosse s bags or boxe s of wast e int o th e unit. When mechanical
fee d system s ar e employed , some typ e of mechanica l devic e i s used
t o charg e th e wast e t o th e incinerator. The most common
mechanica l fee d syste m i s th e hopper/ra m assembly. I n a
mechanica l hopper/ra m fee d system , th e followin g step s take
place: (1 ) wast e i s place d int o a chargin g hoppe r manually , and
th e hoppe r cove r i s closed ; (2 ) a fir e doo r isolatin g th e hopper
fro m th e incinerato r opens ; (3 ) th e ra m moves forwar d t o pus h the
wast e int o th e incinerator ; (4 ) th e ra m reverse s t o a location
behin d th e fir e door ; (5 ) afte r th e fir e doo r closes , a water
6-63
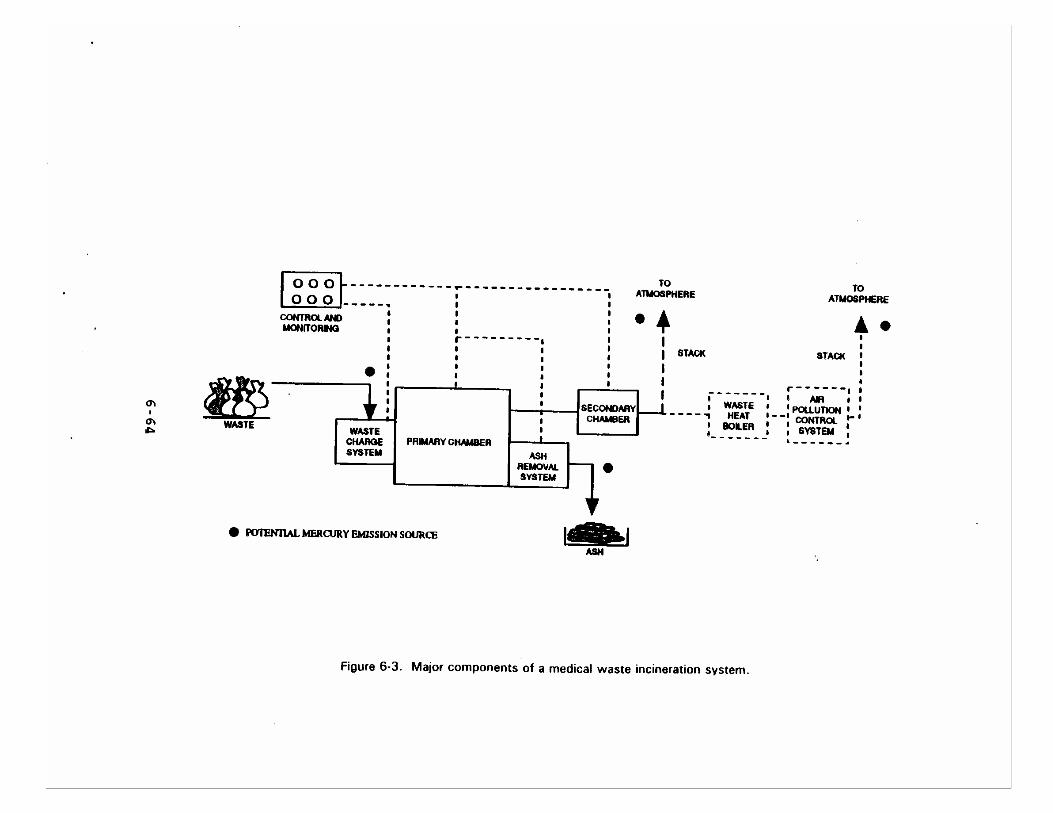
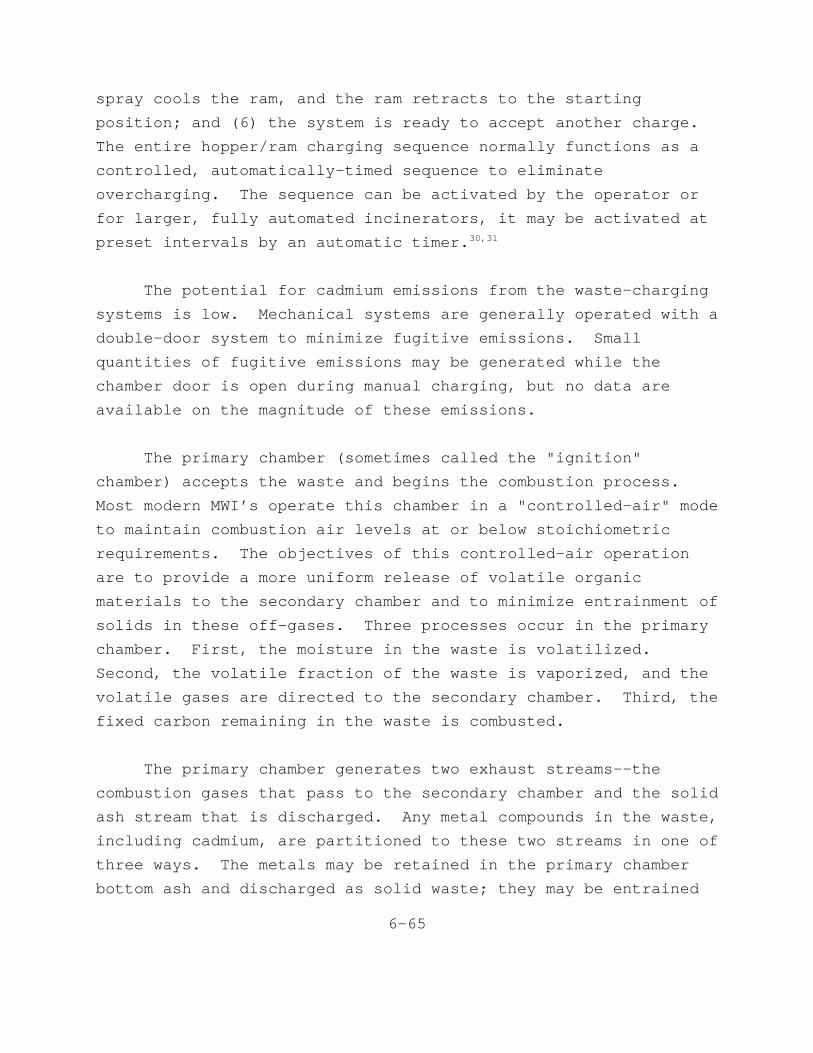
spra y cool s th e ram, and th e ra m retract s t o th e starting
position ; and (6 ) th e syste m i s read y t o accep t anothe r charge.
The entir e hopper/ra m chargin g sequenc e normall y function s as a
controlled , automatically-time d sequenc e t o eliminate
overcharging. The sequenc e ca n be activate d by th e operato r or
fo r larger , full y automate d incinerators , i t may be activate d at
prese t interval s by an automati c timer. 30,31
The potentia l fo r cadmiu m emission s fro m th e waste-charging
system s i s low. Mechanica l system s ar e generall y operate d wit h a
double-doo r syste m t o minimiz e fugitiv e emissions. Small
quantitie s of fugitiv e emission s may be generate d whil e the
chamber door i s open durin g manual charging , but no dat a are
availabl e on th e magnitud e of thes e emissions.
The primar y chamber (sometime s calle d th e "ignition"
chamber ) accept s th e wast e and begin s th e combustio n process.
Most moder n MWI’s operat e thi s chamber i n a "controlled-air " mode
t o maintai n combustio n ai r level s at or belo w stoichiometric
requirements. The objective s of thi s controlled-ai r operation
ar e t o provid e a more unifor m releas e of volatil e organic
material s t o th e secondar y chamber and t o minimiz e entrainmen t of
solid s i n thes e off-gases. Thre e processe s occu r i n th e primary
chamber. First , th e moistur e i n th e wast e i s volatilized.
Second , th e volatil e fractio n of th e wast e i s vaporized , and the
volatil e gase s ar e directe d t o th e secondar y chamber. Third , the
fixe d carbo n remainin g i n th e wast e i s combusted.
The primar y chamber generate s tw o exhaus t streams--the
combustio n gase s tha t pas s t o th e secondar y chamber and th e solid
as h strea m tha t i s discharged. Any meta l compounds i n th e waste,
includin g cadmium , ar e partitione d t o thes e tw o stream s i n one of
thre e ways. The metal s may be retaine d i n th e primar y chamber
botto m as h and discharge d as soli d waste ; the y may be entrained
6-65

as PM i n th e combustio n gases ; or the y may be volatilize d and
discharge d as a vapo r wit h th e combustio n gases. Becaus e the
primar y chamber typicall y operate s i n th e rang e of 650° t o 820°C
(1200 ° t o 1500°F) , most of th e cadmiu m i n th e wast e strea m will
be volatilize d and discharge d t o th e secondar y chamber. At the
lowe r exhaus t temperatures , th e cadmiu m condense s ont o small
particle s and i s exhauste d as fin e PM t o th e secondar y chamber.
A smal l fractio n may be retaine d i n th e primar y chamber bottom
ash.
The primar y chamber botto m as h i s discharge d vi a an ash
remova l syste m and transporte d t o a landfil l fo r disposal. The
as h remova l syste m may be eithe r manual or mechanical.
Typically , batc h unit s and smalle r intermitten t unit s employ
manual as h removal. Afte r th e syste m has shu t down and th e ash
has cooled , th e operato r use s a rak e or shove l t o remov e th e ash
and plac e i t i n a dru m or dumpster. Some intermittent-dut y MWI’s
and al l continuousl y operate d MWI’s us e a mechanica l as h removal
system. The mechanica l syste m include s thre e majo r components:
(1 ) a means of movin g th e as h t o th e end of th e incinerator
hearth--usuall y an as h transfe r ra m or serie s of transfe r rams,
(2 ) a collectio n devic e or containe r fo r th e as h as i t is
discharge d fro m th e hearth , and (3 ) a transfe r syste m t o move the
as h fro m th e collectio n point. Generally , thes e automatic
system s ar e designe d t o minimiz e fugitiv e emissions. For
example , one typ e of collectio n syste m use s an as h bi n sealed
directl y t o th e discharg e chut e or positione d withi n an air-
seale d chamber belo w th e hearth. A door or gat e tha t seal s the
chut e i s opene d at regula r interval s t o allo w th e as h t o drop
int o th e collectio n bin. When th e bi n i s filled , th e seal-gate
i s closed , and th e bi n i s remove d and replace d wit h an empt y bin.
I n anothe r system , th e as h i s discharge d int o a wate r pit. The
as h discharg e chut e i s extende d int o th e wate r pi t so tha t an air
sea l i s maintained. The wate r bat h quenche s th e as h as th e ash
6-66

i s collected. A mechanica l device , eithe r a rak e or drag
conveyo r system , i s use d t o intermittentl y or continuousl y remove
th e as h fro m th e quenc h pit. The exces s wate r i s allowe d to
drai n fro m th e as h as i t i s remove d fro m th e pit , and th e wetted
as h i s discharge d int o a collectio n container.
The potentia l fo r cadmiu m emission s fro m bot h mechanica l and
manual as h discharg e system s i s minimal. As describe d above,
most mechanica l system s hav e seal s and provid e as h wettin g as
describe d abov e t o minimiz e fugitiv e PM emissions. Whil e manual
system s ca n generat e substantia l fugitiv e PM, th e concentrations
of cadmiu m hav e generall y been shown t o be quit e low. 32
Consequently , fugitiv e cadmiu m emission s ar e negligible.
Almos t al l th e cadmiu m tha t enter s th e primar y chamber is
exhauste d t o th e secondar y chamber as fin e PM, althoug h a small
fractio n may be partitione d wit h th e ash. The primar y function
of th e secondar y chamber i s t o complet e th e combustio n of the
volatil e organi c compounds tha t was initiate d i n th e primary
chamber. Becaus e th e temperature s i n th e secondar y chamber are
typicall y 980° C (1800°F ) or greater , essentiall y al l of the
cadmiu m tha t enter s th e secondar y chamber wil l be exhauste d as
fin e PM. The hot exhaus t gase s fro m th e secondar y chamber may
pas s throug h an energ y recover y devic e (wast e hea t boile r or air-
to-ai r hea t exchanger ) and an ai r pollutio n contro l syste m before
the y ar e discharge d t o th e atmospher e throug h th e combustion
stack. Thi s combustio n stac k i s th e majo r rout e of cadmium
emission s fro m MWI’s.
Emissio n Contro l Measures 32
A number of ai r pollutio n contro l syste m configuration s have
been use d t o contro l PM and gaseou s emission s fro m th e MWI
combustio n stacks. Most of thes e configuration s fal l withi n the
6-67

genera l classe s of wet system s and dr y systems. Wet systems
typicall y compris e a wet scrubbe r designe d fo r PM control
(ventur i scrubbe r or rotar y atomizin g scrubber ) i n serie s wit h a
packed-be d scrubbe r fo r aci d gas remova l and a high-efficiency
mis t eliminatio n system. Most dr y system s us e a fabri c filter
fo r PM removal , but ESP’ s hav e been installe d on some larger
MWI’s. Thes e dr y system s may us e sorben t injectio n vi a either
dr y injectio n or spra y dryer s upstrea m fro m th e PM devic e to
enhanc e aci d gas control. More detaile d description s of MWI air
pollutio n contro l system s ca n be foun d i n Referenc e 32. The
emissio n dat a presente d i n th e sectio n belo w provid e information
on th e performanc e of some of th e more common systems.
Emissions 33-50
Over th e pas t 5 years , cadmiu m emission s hav e been measured
at severa l MWI’s throughou t th e U. S. EPA’ s regulatory
developmen t program , th e MWI emissio n characterizatio n studies
conducte d by th e Stat e of California , and complianc e tests
conducte d i n respons e t o Stat e ai r toxi c requirements. Emission
dat a fro m 25 MWI’s wer e identifie d i n developin g thi s L&E
document. However , th e dat a fro m onl y 18 facilitie s were
considere d adequat e fo r emissio n facto r development. For the
remainin g facilities , eithe r proces s dat a wer e insufficien t to
develo p emissio n factor s or th e tes t methodologie s were
considere d unacceptable. Emissio n dat a fo r th e 18 facilitie s are
tabulate d i n Appendi x B, Tabl e B-4. The paragraph s below
summariz e th e informatio n on uncontrolle d emission s and on the
performanc e of emissio n contro l system s collecte d fro m these
18 facilities.
The uncontrolle d emissio n dat a collecte d at 13 facilities
showed substantia l variability , wit h cadmiu m emissio n factors
rangin g fro m 0.1 2 t o 22 g/Mg of wast e charge d (2. 4 x 10⁻⁴ to
6-68

4. 4 x 10⁻² lb/ton). 33-41,44,47-50 Thi s rang e of emissio n factors
represent s a variet y of wast e type s (mixe d medica l waste , re d bag
[infectious ] wast e only , and pathologica l waste ) and a variet y of
incinerato r type s (continuou s and intermitten t unit s wit h varied
operatin g practices). Whil e th e dat a ar e insufficien t to
demonstrat e unequivocall y a direc t relationshi p betwee n waste
characteristic s and emissions , th e dat a strongl y sugges t that
most of thi s variabilit y i s relate d t o difference s i n th e cadmium
conten t of th e waste. First , characterizatio n of th e botto m ash
at severa l facilitie s showed littl e cadmiu m i n th e ash,
indicatin g tha t most of th e cadmiu m i n th e wast e i s discharged
wit h th e combustio n gases. Second , as par t of an EPA study,
waste s fro m tw o differen t hospital s wer e fire d t o th e same
incinerato r unde r comparabl e operatin g conditions. Ther e was an
almos t threefol d differenc e i n th e averag e emissio n factor s for
th e tw o wastes , wit h waste s fro m th e smalle r hospita l yieldin g an
emissio n facto r of 1. 6 g/Mg (3. 1 x 10⁻³ lb/ton ) and thos e from
th e large r hospita l yieldin g a facto r of 4. 4 g/Mg
(8. 8 x 10⁻³ lb/ton) , agai n providin g evidenc e of waste-related
variation. Althoug h ther e has been some speculatio n tha t the
highe r emissio n factor s resul t fro m havin g cadmium-bearin g items,
suc h as batteries , pigments , and plastic s i n th e wast e stream,
insufficien t informatio n i s availabl e t o defin e conclusively
thos e wast e attribute s tha t affec t cadmiu m emissions.
Becaus e emission s ar e strongl y relate d t o waste
characteristics , separat e uncontrolle d emissio n factor s were
develope d fo r th e differen t wast e types. Thes e emissio n factors
ar e summarize d i n Tabl e 6-21 . Substantiall y greate r information
i s availabl e fo r mixe d medica l wast e incineratio n tha n fo r either
re d bag or pathologica l wast e incineration. Consequently , the
mixe d wast e result s ar e considere d t o be a more reliable
indicato r of th e rang e of emissio n factor s likel y t o be found
acros s th e MWI populatio n tha n ar e th e re d bag or pathological
6-69
TABLE 6-21. UNCONTROLLED CADMIUM EMISSION FACTORSFOR MEDICAL WASTE INCINERATORS
Waste typeNo. of
facilitiesNo. of
test runs
Cadmium emission factors,g/Mg (10-3 lb/ton)
Range Average
Mixeda 13 72 0.12 - 22(0.24 - 44)
2.5(5.0)
Red bagb 1 9 0.72 - 2.5(1.4 - 5.0)
1.6(3.3)
Pathologicalc 1 6 <0.0 - 4.7(<0.0 - 9.3)
0.90(1.8)
Source: References 33-41, 44, 47-50.
aBased on the range of facility averages. Number of runs for each facility ranged from2 to 16.
bBased on the range spanned by three test averages (each test comprised three runs) at onefacility.
cThis emission factor is strongly influenced by a single large value. A better estimate of emissionsfrom a "typical" facility is the trimmed mean, which is 0.18 g/Mg (0.37 x 10⁻³ lb/ton).
6-70
results. However , becaus e th e rang e i n emissio n factor s i s so
large , eve n th e mixe d wast e emissio n factor s shoul d be applie d to
individua l MWI’s wit h caution.
The emissio n factor s fo r th e re d bag and pathologica l waste
shoul d be use d wit h extrem e cautio n becaus e eac h facto r i s based
on result s fro m wast e fire d at onl y one facility. Two
observation s ar e noteworth y i n interpretin g thes e data. First,
th e re d bag emissio n facto r of 1. 6 g/Mg (3. 3 x 10⁻³ lb/ton ) is
withi n th e rang e of th e emissio n factor s fo r mixe d medica l waste.
However , th e waste s wer e generate d by th e same facilit y tha t had
one of th e larges t mixe d wast e emissio n factors , so th e re d bag
emissio n facto r may be misleading. Second , th e emissio n factor
fo r pathologica l wast e of 0.9 0 g/Mg (1. 8 x 10⁻³ lb/ton ) i s near
th e botto m end of th e mixe d wast e rang e and coul d be eve n lower
becaus e i t i s strongl y influence d by a singl e larg e value
(4. 7 g/Mg [9. 3 x 10⁻³ lb/ton]). Thi s valu e i s a facto r of
20 large r tha n th e secon d larges t value. I f th e larges t and
smalles t value s ar e removed , th e trimme d mean i s 0.1 8 g/Mg
(0.3 7 x 10⁻³ lb/ton) , whic h i s simila r t o th e media n of th e data.
Hence, th e emissio n facto r of 0.1 8 g/Mg (0.3 7 x 10⁻³ lb/ton ) is
recommende d as th e bes t emissio n facto r fo r a typica l MWI firing
pathologica l waste. However , thi s lo w emissio n facto r als o may
be misleadin g becaus e test s at th e same facilit y produce d the
lowes t mixe d wast e emissio n factor. As evidence d by these
observations , th e re d bag and pathologica l emissio n dat a ar e too
spars e t o differentiat e effectivel y betwee n th e effect s of waste
typ e and facility-specifi c wast e practice s on cadmiu m emissions.
Substantiall y fewe r dat a ar e availabl e on controlled
emission s tha n on uncontrolle d emissions. 35,36,40-46,48,50 The best
dat a availabl e ar e thos e whic h characteriz e th e performanc e of
seve n MWI ai r pollutio n contro l systems-- a wet scrubbe r system , a
ventur i scrubbe r system , a ventur i scrubber/packed-be d system , a
6-71
duc t sorben t injection/electrostati c precipitato r system , a
fabri c filte r system , a dr y injection/fabri c filte r system , and a
spra y dryer/fabri c filte r system. Tabl e 6-2 2 present s controlled
emissio n factor s and cadmiu m emissio n contro l efficiencie s for
thes e ai r pollutio n contro l systems. Becaus e controlle d emission
factor s coul d onl y be develope d fo r a fe w facilities , the y are
not likel y t o represen t th e variabilit y acros s th e incinerator
population. Therefore , i t i s recommende d tha t controlled
emissio n factor s be develope d by applyin g th e averag e control
efficiencie s t o uncontrolle d emissio n factor s or emissio n rates
rathe r tha n usin g th e controlle d emissio n factor s presente d in
Tabl e 6-22.
The performance s of tw o of th e dr y system s (dry
injection/fabri c filte r and spra y dryer/fabri c filter ) were
examine d wit h and withou t carbo n injection. The result s from
thes e test s and fro m th e tes t of th e fabri c filte r wit h no carbon
injectio n ar e presente d i n Tabl e B-4 , Appendi x B. Thes e results
indicat e tha t th e dr y system s withou t carbo n injectio n provided
greate r tha n 99 percen t contro l of cadmium. For thes e systems,
th e outle t cadmiu m emission s rang e fro m 99. 1 percen t to
99. 9 percen t lowe r tha n th e inle t emissions. Thi s variabilit y is
considere d t o be wel l withi n th e norma l rang e of proces s and
emissio n tes t metho d variabilit y as describe d i n Sectio n 8.
Consequently , th e result s ar e consisten t wit h essentially
complet e remova l by th e contro l system. The dr y system s with
carbo n injectio n achiev e essentiall y th e same cadmiu m remova l as
thos e system s withou t carbo n injection , wit h contro l efficiencies
rangin g fro m 97. 3 percen t t o 99. 9 percent.
The emissio n tes t result s fo r th e wet system s ar e also
presente d i n Tabl e B-4 , Appendi x B. As shown i n Tabl e 6-22 , the
performanc e of th e wet system s i n controllin g cadmiu m emissions
was not as effectiv e as tha t achieve d by th e dr y system s wit h or
6-72

TABLE 6-22. SUMMARY OF CONTROLLED CADMIUM EMISSION FACTORS AND CONTROLEFFICIENCIES FOR MEDICAL WASTE INCINERATORS
Waste
typea
Control
statusb
No. offacilities
No. ofruns
Cadmium emission factorsc
Control efficiency (%)g/Mg waste 10-3 lb/ton waste
Average Range Average Range Average Range
M WSVSVS/PBDI/ESPFFDI/FFDI/FF+CSD/FFSD/FF+C
114111111
3311339533
2.60.754.30.30
<0.00260.00970.0440.0210.012
1.1-5.30.56-0.930.71-10
0.26-0.36<0.0025-<0.0027
0.0088-0.0110.0064-0.200.010-0.029
0.0096-0.015
5.11.58.50.59
<0.00520.0190.0880.0430.024
2.1-111.1-1.91.4-20
0.53-0.72<0.0049-<0.0053
0.018-0.0220.013-0.390.021-0.0590.019-0.029
NAd
7.7
38e
-->99.999.699.199.799.8
NAd
-62-4934-45
-->99.8->99.9
99.4-99.897.3-99.999.6-99.899.8-99.9
RB DI/FF 1 9 0.013 0.0096-0.016 0.026 0.019-0.031 99.1 98.6-99.5
Source: References 35, 36, 40-46, 48, 50.
aM = mixed medical waste, RB = red bag waste.
bWS = wet scrubber, VS = venturi scrubber, PB = packed bed scrubber, DI = dry injection
ESP = electrostatic precipitator, FF = fabric filter, SD = spray dryer, C = carbon injection.
cRanges are for individual runs. Averages were obtained by taking the arithmetic mean of facility averages.
dNA = not available.
eEfficiency data were available for only one facility.
6-6
8

withou t carbo n injection. For th e wet systems , th e outlet
cadmiu m emission s rang e fro m 160 percen t highe r t o 49 percent
lowe r tha n th e inle t emissions. Tabl e 6-2 3 present s th e best
typica l uncontrolle d emissio n factor s fo r MWI’s. To obtai n best
typica l controlle d emissio n factor s fo r ventur i scrubber/packed
bed systems , appl y a 38-percen t efficienc y t o thes e uncontrolled
emissio n factors. For dr y system s wit h or withou t carbon
injection , appl y a 97-percen t efficienc y t o thes e uncontrolled
emissio n factors.
TABLE 6-23. BEST TYPICAL UNCONTROLLED CADMIUM EMISSION FACTORS FOR MEDICALWASTE INCINERATORS
Waste type
Cadmium emission factors
g/Mg of Waste 10-3 lb/ton of Waste
Mixed 2.5 5.0
Red Bag 1.6 3.3
Pathological 0.18 0.37
6-74
REFERENCES
1. Unite d State s Departmen t of Energy. Stat e Energ y DataReport , Consumptio n Estimates , 1960-1990. ReportNo. DOE/EIA-0214(90). Energ y Informatio n Administration,Offic e of Energ y Market s and End Use, Unite d StatesDepartmen t of Energy , Washington , DC. May 1992.
2. Brooks , Garry. Estimatin g Ai r Toxi c Emission s fro m Coal andOi l Combustio n Sources. EPA-450/2-89-001. U. S.Environmenta l Protectio n Agency , Researc h Triangl e Park , NC.Apri l 1989.
3. White , D.M. , L.O . Edwards , A.G. Eklund , D.A . DuBose, andF.D . Skinner. Correlatio n of Coal Propertie s withEnvironmenta l Contro l Technolog y Needs fo r Sulfu r and TraceElements. EPA-600/7-84-066. U. S. Environmenta l ProtectionAgency , Researc h Triangl e Park , NC. 1984.
4. Swanson, V.E. , J.H . Medlin , J.R . Hatch , S.L . Coleman,G.H. Wood, S.D . Woodruff , and R.T . Hildebrand. Collection,Chemica l Analysis , and Evaluatio n of Coal Sample s i n 1975.USGS Repor t No. 76-468. Unite d State s Departmen t of theInterior , Geologica l Survey . Washington , DC. 1976.
5. U. S. Environmenta l Protectio n Agency, Compilatio n of AirPollutan t Emissio n Factors , AP-42 , Fourt h Edition,Supplemen t B. U. S. Environmenta l Protectio n Agency,Researc h Triangl e Park , NC. Septembe r 1988.
6. Babcoc k and Wilco x Company. Steam: It s Generatio n and Use.Babcoc k and Wilcox , New York , NY. 1978.
7. Lette r fro m R.B . Finkelman , Unite d State s Departmen t of theInterior , t o D.D. Wallace , Midwes t Researc h Institute.Februar y 8, 1993. Meta l concentration s i n coal.
8. Buonicore , A.J . and W.T. Davis , eds. Ai r PollutionEngineerin g Manual. Van Nostran d Reinhold , New York,NY, 1992.
9. Boron , D.J. Controllin g Toxi c Emissions. Coal. Jun e 1990.
10. Ondov, J.M. , R.C. Ragaini , and A.H . Biermann. ElementalEmission s fro m a Coal-Fire d Power Plant. Compariso n of aVentur i Wet Scrubbe r Syste m wit h a Cold-Sid e ElectrostaticPrecipitator. Environmenta l Scienc e and Technology.Volum e 13, Number 5. May 1979.
6-75
11. Osborne , W.E. and M.D. McDannel. Emission s of Ai r ToxicSpecies: Tes t Conducte d Under AB2588 fo r th e Wester n StatesPetroleu m Association. Repor t No. CA 72600-2601. CARNOT,Tustin , CA. May 1990.
12. Pape & Steine r Environmenta l Services. AB2588 Testin g atTexac o Tradin g and Transportation , Inc. PanocheStation-Heater , Jun e 18 throug h Jun e 29, 1990. ReportPS-90-2187. Pape & Steine r Environmenta l ServicesBakersfield , CA. Septembe r 1990.
13. Hopkins , K.C . and L. A Green. Ai r Toxic s Testin g at MorroBay Uni t 3. Marc h 1-5 , 1990 CARNOT, Tustin , CA. May 1990.
14. U. S. Environmenta l Protectio n Agency, Compilatio n of AirPollutan t Emissio n Factors , AP-42 , Fourt h Edition,Supplemen t E. U. S. Environmenta l Protectio n Agency,Researc h Triangl e Park , NC. Octobe r 1992.
15. Emissio n Facto r Documentatio n fo r AP-4 2 Sectio n 1.6 , WoodWaste Combustio n i n Boilers. U. S. Environmenta l ProtectionAgency , Researc h Triangl e Park , NC. 1992.
16. Schultz , S. Auberr y Energy , Inc . Toxi c Hot Spot s Report.Yanke Energy. Octobe r 1990.
17. DeAngelis , D.G. , D.S . Ruffin , J.A . Peters , and R.B . Reznik.Sourc e Assessment: Residentia l Wood Combustion.EPA-600/2-80-426. U. S. Environmenta l Protectio n Agency,Researc h Triangl e Park , NC. 1980.
18. U. S. Environmenta l Protectio n Agency, Emissio n FactorDocumentatio n fo r AP-4 2 Sectio n 2.1 , RefuseCombustion . U. S. Environmenta l Protectio n Agency,Researc h Triangl e Park , NC. Septembe r 1992.
19. Radia n Corporation. Municipa l Waste Combustio n Study.Characterizatio n of th e Municipa l Waste Combustio n Industry.EPA-530/SW-87-021h. U. S. Environmenta l Protectio n Agency,Washington , DC. Jun e 1987.
20. Radia n Corporation. Locatin g and Estimatin g Ai r ToxicsEmission s fro m Municipa l Waste Combustors.EPA-450/2-89-006. U. S. Environmenta l Protectio n Agency,Researc h Triangl e Park , NC. Apri l 1989.
21. Greenberg , R.R. , W.H. Zoller , and G.E. Gordon. Compositionand Siz e Distribution s of Particle s Release d i n RefuseIncineration. Environmenta l Scienc e and TechnologyVolum e 12, Number 5. May 1978.
6-76
22. U. S. Environmenta l Protectio n Agency, Emissio n FactorDocumentatio n fo r AP-4 2 Sectio n 2.5 , Sewage SludgeIncineration. U. S. Environmenta l Protectio n Agency,Researc h Triangl e Park , NC. Septembe r 1992.
23. Radia n Corporation. Locatin g and Estimatin g Ai r ToxicsEmission s fro m Sewage Sludg e Incinerators.EPA-450/2-90-009. U. S. Environmenta l Protectio n Agency,Researc h Triangl e Park , NC. May 1990.
24. Bennett , R.L . and K.T . Knapp. Characterizatio n ofParticulat e Emission s fro m Municipa l Wastewate r SludgeIncinerators. Environmenta l Scienc e and Technology.Volum e 16, Number 12. December 1982.
25. Midwes t Researc h Institute. Medica l Waste Incinerators-Backgroun d Informatio n fo r Propose d Standard s andGuidelines: Industr y Profil e Repor t fo r New and ExistingFacilities. Draf t Report. Cary , NC. Apri l 1992.
26. U. S. Environmenta l Protectio n Agency, Medica l WasteIncinerators-Backgroun d Paper fo r New and ExistingFacilities , Draft. U. S. Environmenta l Protectio n Agency,Researc h Triangl e Park , NC. Jun e 1992.
27. Frankli n Associates , Ltd. Characterizatio n of ProductsContainin g Lead and Cadmiu m i n Municipa l Soli d Waste i n theUnite d States , 1970 t o 2000. EPA-530/SW-89-015A. U. S.Environmenta l Protectio n Agency , Washington , DC.Januar y 1989.
28. Doyle , B. , D. Drum, and J. Lauber. The Smolderin g Questionof Hospita l Wastes. Pollutio n Engineerin g Magazine.Jul y 1985.
29. Radia n Corporation. Hospita l Waste Combustio n Study: DataGatherin g Phase. EPA-450/3-88-017. U. S. EnvironmentalProtectio n Agency , Researc h Triangl e Park , NC.December 1988.
30. Neulicht , R. , M. Turner , L. Chaput , D. Wallace , andS. Smith, Operatio n and Maintenanc e of Hospita l WasteIncinerators. EPA-450/3-89-002. U. S. EnvironmentalProtectio n Agency , Researc h Triangl e Park , NC. Marc h 1989.
31. Neulicht , R. , L. Chaput , D. Wallace , M. Turner , andS. Smith, Hospita l Incinerato r Operato r Trainin g Course:Volum e I Studen t Handbook. EPA-450/3-89-003.U. S. Environmenta l Protectio n Agency , Researc h TrianglePark , NC. Marc h 1989.
6-77

32. Midwes t Researc h Institute. Medica l Waste Incinerators-Backgroun d Informatio n fo r Propose d Standard s andGuidelines: Contro l Technolog y Performanc e Repor t fo r Newand Existin g Facilities. Cary , NC. Jul y 1992.
33. Bumbaco, M. J. Repor t on Stac k Samplin g Progra m t o Measureth e Emission s of Selecte d Trac e Organi c Compounds,Particulates , Heavy Metal s and HCl fro m th e Royal JubileeHospita l Incinerator , Victoria , BC. Environmen t Canada.Apri l 1983.
34. McCormack, J. , P. Ouchida , and G. Lew. Evaluatio n Tes t on aSmal l Hospita l Refus e Incinerator , Sain t BernadinesHospital , San Bernadino , California , ARB/ML-89-028.Californi a Ai r Resource s Board , Sacramento , CA. Jul y 1989.
35. England , G. , D. Hansell , J. Newhall , and N. Soelberg.Michiga n Hospita l Incinerato r Emission s Tes t Program,Volum e II: Sit e Summary Repor t Borges s Medica l CenterIncinerator. Energ y and Environmenta l Researc h Corporation,Irvine , CA. Augus t 1991.
36. England , G. , D. Hansell , J. Newhall , and N. Soelberg.Michiga n Hospita l Incinerato r Emission s Tes t Program,Volum e III: Sit e Summary Repor t Universit y of MichiganMedica l Cente r Incinerator , Energ y and EnvironmentalResearc h Corporation , Irvine , CA. Augus t 1991.
37. Radia n Corporation. Medica l Waste Incineratio n EmissionTes t Report , Lenoi r Memoria l Hospital , Kinston , NorthCarolina , EMB Repor t 90-MWI-3. U. S. EnvironmentalProtectio n Agency , Researc h Triangl e Park , NC. May 1990.
38. Radia n Corporation. Medica l Waste Incineratio n EmissionTes t Report , Cape Fear Memoria l Hospital , Wilmington , NorthCarolina. EMB Repor t 90-MWI-4. U. S. EnvironmentalProtectio n Agency , Researc h Triangl e Park , NC.November 1990.
39. Radia n Corporation. Medica l Waste Incineratio n EmissionTes t Report , AMI Centra l Carolin a Hospital , Sanford , NorthCarolina. EMB Repor t 90-MWI-5. U. S. EnvironmentalProtectio n Agency , Researc h Triangl e Park , NC.December 1990.
40. Radia n Corporation. Medica l Waste Incineratio n EmissionTes t Report , Borges s Medica l Center , Kalamazoo , Michigan.EMB Repor t 91-MWI-9. U. S. Environmenta l Protectio n Agency,Researc h Triangl e Park , NC. December 1991.
6-78

41. Radia n Corporation. Medica l Waste Incineratio n EmissionTes t Report , Morristow n Memoria l Hospital , Morristown , NewJersey. EMB Repor t 91-MWI-8. U. S. EnvironmentalProtectio n Agency , Researc h Triangl e Park , NC.December 1991.
42. ETS, Inc. Complianc e Testin g fo r Southlan d Exchang e JointVenture , Hampton , Sout h Carolina. ETS, Inc. , Roanoke , VA.Jul y 1989.
43. Sourc e Tes t Report , MEGA of Kentucky. Augus t 1988.
44. U. S. Environmenta l Protectio n Agency. Emissio n FactorDocumentatio n fo r AP-4 2 Sectio n 2.6 , Medica l WasteIncineration. U. S. Environmenta l Agency , Researc h TrianglePark , NC. Septembe r 1992.
45. Ai r Management Services. Emission s Tes t Repor t forFox-Chas e Cancer Center , Philadelphia , PA. Februar y 1989.
46. AirNova , Inc. Emissio n Complianc e Tes t Progra m fo r NazarethHospital , Philadelphia , PA. Septembe r 1989.
47. Jenkins , A. , P. Ouchida , and G. Lew. Evaluatio n Retes t on aHospita l Refus e Incinerato r at Sutte r Genera l Hospital,Sacramento , California , ARB/ML-88-026. Californi a AirResource s Board , Sacramento , CA. Apri l 1988.
48. Jenkins , A. , P. Ouchida , and G. Lew. Evaluatio n Tes t on aRefus e Incinerato r at Stanfor d Universit y EnvironmentalSafet y Facility , Stanford , California , ARB/ML-88-025.Californi a Ai r Resource s Board , Sacramento , CA. Apri l 1988.
49. Jenkins , A. , P. Ouchida , and D. Simeroth. Evaluatio n Teston a Hospita l Refus e Incinerato r at Sain t Agnes MedicalCenter , Fresno , California , ARB/SS-87-01. Californi a AirResource s Board , Sacramento , CA. Januar y 1987.
50. Jenkins , A. , C. Castronovo , G. Lindner , P. Ouchida , andD. Simeroth. Evaluatio n Tes t on a Hospita l RefuseIncinerato r at Cedar s Sina i Medica l Center , Los Angeles,California , ARB/SS-87-11. Californi a Ai r Resource s Board,Sacramento , CA. Apri l 1987.
6-79

SECTION 7
EMISSIONS FROM NONFERROUS SMELTING/REFINING
Cadmiu m i s emitte d fro m variou s nonferrou s smeltin g and
refinin g operation s includin g th e following:
1. Primar y lea d smelting;2. Primar y coppe r smelting;3. Primar y zin c smeltin g and refining--electrolytic
process;4. Primar y zin c smeltin g and refining--electrothermic
process;5. Secondar y coppe r smeltin g and refining;6. Secondar y zin c recover y fro m metalli c scrap ; and7. Secondar y zin c recover y fro m stee l production.
Raw material s processe d at th e facilitie s liste d above
includ e mineral s and ore s extracte d fro m th e earth , as wel l as
metalli c wast e fro m miscellaneou s products. Thes e ra w materials
contai n cadmium. At variou s stage s of manufacturing , th e raw
material s ar e processe d at elevate d temperatures , therefore
resultin g i n cadmiu m bein g emitte d fro m th e ra w materials. This
sectio n present s proces s information , ai r pollutio n control
measures , and estimate s of cadmiu m emission s fro m thes e sources.
PRIMARY LEAD SMELTING
Lead i s recovere d fro m a sulfid e ore , primaril y galen a (lead
sulfid e [PbS]) , whic h als o contain s smal l amount s of copper,
iron , zinc , and othe r trac e elements. Cadmiu m als o ca n be
expecte d t o be presen t i n th e lea d ore. One dat a sourc e has
7-1
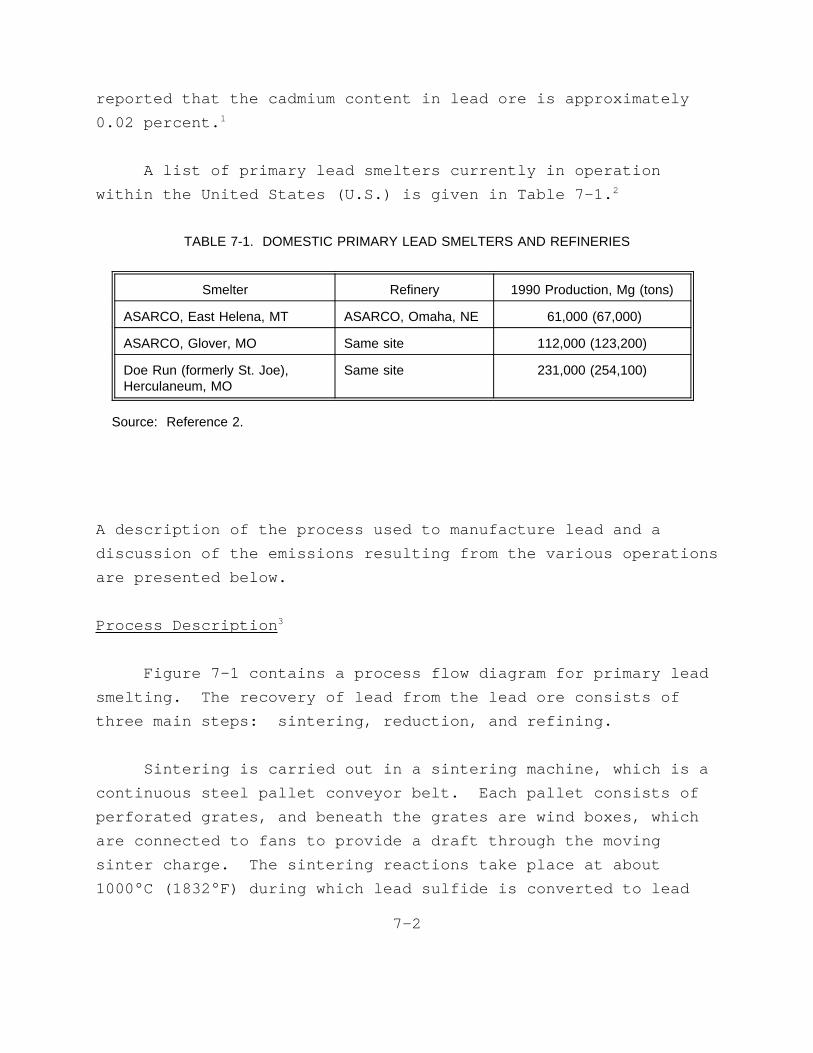
reporte d tha t th e cadmiu m conten t i n lea d or e i s approximately
0.0 2 percent. 1
A lis t of primar y lea d smelter s currentl y i n operation
withi n th e Unite d State s (U.S. ) i s give n i n Tabl e 7-1. 2
A descriptio n of th e proces s use d t o manufactur e lea d and a
TABLE 7-1. DOMESTIC PRIMARY LEAD SMELTERS AND REFINERIES
Smelter Refinery 1990 Production, Mg (tons)
ASARCO, East Helena, MT ASARCO, Omaha, NE 61,000 (67,000)
ASARCO, Glover, MO Same site 112,000 (123,200)
Doe Run (formerly St. Joe),Herculaneum, MO
Same site 231,000 (254,100)
Source: Reference 2.
discussio n of th e emission s resultin g fro m th e variou s operations
ar e presente d below.
Proces s Description 3
Figur e 7- 1 contain s a proces s flo w diagra m fo r primar y lead
smelting. The recover y of lea d fro m th e lea d or e consist s of
thre e mai n steps: sintering , reduction , and refining.
Sinterin g i s carrie d out i n a sinterin g machine , whic h i s a
continuou s stee l palle t conveyo r belt. Each palle t consist s of
perforate d grates , and beneat h th e grate s ar e win d boxes , which
ar e connecte d t o fan s t o provid e a draf t throug h th e moving
sinte r charge. The sinterin g reaction s tak e plac e at about
1000° C (1832°F ) durin g whic h lea d sulfid e i s converte d t o lead
7-2
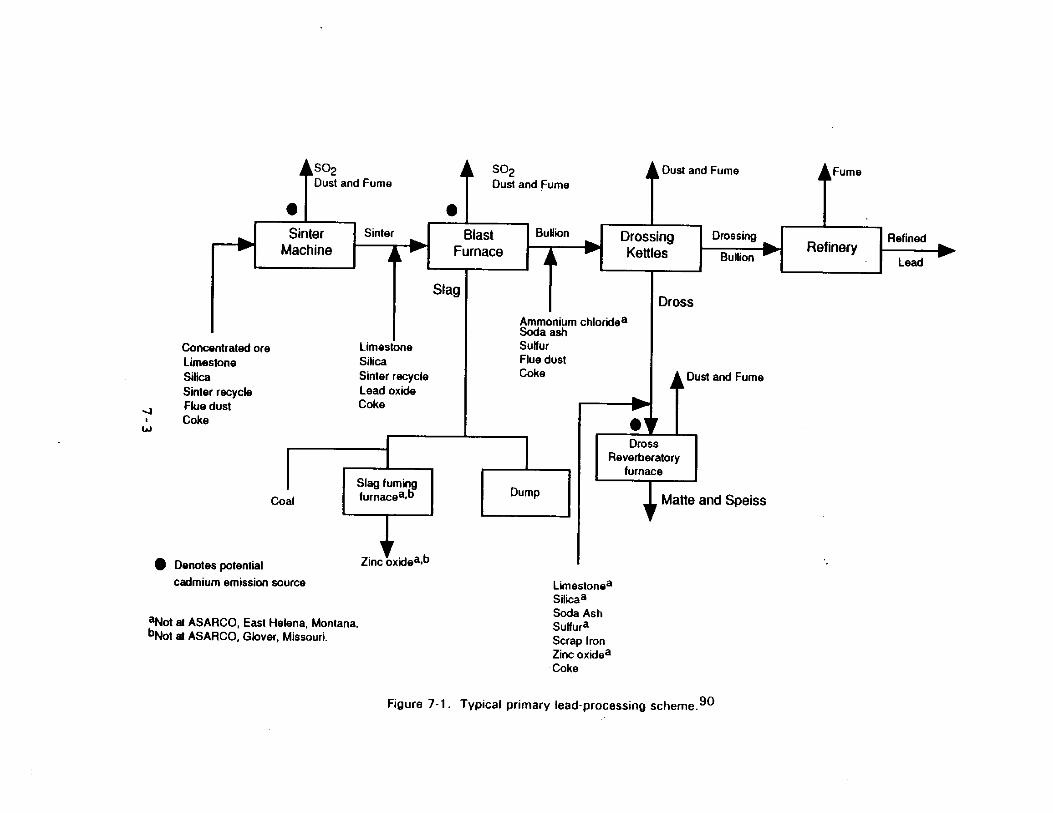
oxid e and lea d sulfate. Sinc e cadmiu m boil s at approximately
767° C (1415°F) , most of th e cadmiu m i n th e or e ca n be expecte d to
be emitte d durin g sintering.
Reductio n of th e sintere d lea d i s carrie d out i n a blast
furnac e at a temperatur e of 1600° C (2912°F). The furnac e is
charge d wit h a mixtur e of sinte r (8 0 t o 90 percen t of charge);
metallurgica l cok e ( 8 t o 14 percen t of charge) ; and other
materials , suc h as limestone , silica , litharge , and unspecified
slag-formin g constituents. I n th e blas t furnace , th e sinte r is
reduce d t o lead. The leve l of hea t neede d t o creat e th e reaction
i s supplie d by cok e combustion. Slag , consistin g of impurities,
i s continuousl y collecte d fro m th e furnac e and i s either
processe d at th e smelte r (fo r it s meta l content ) or shippe d to
treatmen t facilities. The impuritie s includ e arsenic , antimony,
coppe r sulfid e and othe r meta l sulfides , and silicates. Lead
bullion , whic h i s th e primar y product , undergoe s a preliminary
treatmen t t o remov e impurities , suc h as copper , sulfur , arsenic,
antimony , and nickel , befor e furthe r refinin g occurs. Any
residua l cadmiu m lef t i n th e or e ca n be expecte d t o be emitted
durin g th e reductio n step. Refinin g of th e lea d bullio n is
carrie d out i n cas t iro n kettles. Refine d lead , whic h i s 99.99
t o 99.99 9 percen t pure , i s cas t int o pig s fo r shipment.
Emissio n Contro l Measures 3
Cadmiu m emissio n source s ar e indicate d i n Figur e 7- 1 by
soli d circles. Emissio n control s on lea d smelte r operation s are
use d fo r controllin g particulat e matte r (PM) and sulfu r dioxide
(SO2) emission s resultin g fro m th e blas t furnac e and sintering
machines. Centrifuga l collector s (cyclones ) ar e use d in
conjunctio n wit h fabri c filter s or electrostati c precipitators
(ESP’s ) fo r PM control. Becaus e cadmiu m has a boilin g poin t of
approximatel y 767° C (1415°F) , most of th e cadmiu m will
7-4
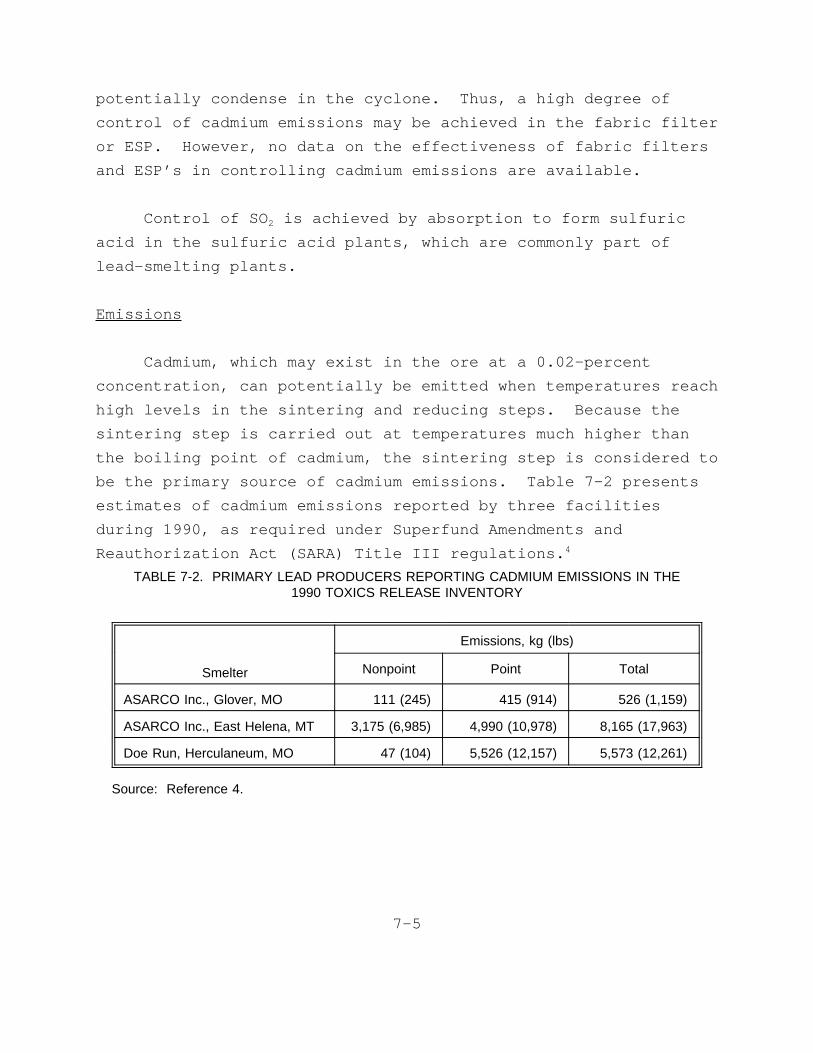
potentiall y condens e i n th e cyclone. Thus , a hig h degre e of
contro l of cadmiu m emission s may be achieve d i n th e fabri c filter
or ESP. However , no dat a on th e effectivenes s of fabri c filters
and ESP’ s i n controllin g cadmiu m emission s ar e available.
Contro l of SO2 i s achieve d by absorptio n t o for m sulfuric
aci d i n th e sulfuri c aci d plants , whic h ar e commonl y par t of
lead-smeltin g plants.
Emissions
Cadmium, whic h may exis t i n th e or e at a 0.02-percent
concentration , ca n potentiall y be emitte d when temperature s reach
hig h level s i n th e sinterin g and reducin g steps. Becaus e the
sinterin g ste p i s carrie d out at temperature s much highe r than
th e boilin g poin t of cadmium , th e sinterin g ste p i s considere d to
be th e primar y sourc e of cadmiu m emissions. Tabl e 7- 2 presents
estimate s of cadmiu m emission s reporte d by thre e facilities
durin g 1990 , as require d unde r Superfun d Amendments and
Reauthorizatio n Act (SARA) Titl e II I regulations. 4
TABLE 7-2. PRIMARY LEAD PRODUCERS REPORTING CADMIUM EMISSIONS IN THE1990 TOXICS RELEASE INVENTORY
Smelter
Emissions, kg (lbs)
Nonpoint Point Total
ASARCO Inc., Glover, MO 111 (245) 415 (914) 526 (1,159)
ASARCO Inc., East Helena, MT 3,175 (6,985) 4,990 (10,978) 8,165 (17,963)
Doe Run, Herculaneum, MO 47 (104) 5,526 (12,157) 5,573 (12,261)
Source: Reference 4.
7-5

Tes t dat a pertainin g t o cadmiu m emission s for m th e various
operation s ar e not available. Tabl e 7- 3 present s cadmium
emissio n factor s reporte d i n th e USEPA dat a base , SPECIATE, for
variou s operation s durin g primar y lea d smelting. 5 Becaus e the
validit y of thes e emissio n factor s canno t be verified , extreme
cautio n shoul d be exercise d when usin g thes e factors.
PRIMARY COPPER SMELTING
The principa l metho d fo r recoverin g coppe r fro m sulfid e ore
i s pyrometallurgica l smelting. Copper ore s contai n significant
quantitie s of arsenic , cadmium , lead , antimony , and othe r heavy
metals. One dat a sourc e has reporte d tha t cadmiu m conten t in
lea d or e i s approximatel y 0.0 1 percent. 6
A lis t of primar y coppe r smelter s currentl y operatin g within
th e U.S . i s give n i n Tabl e 7-4. 7 A descriptio n of th e process
use d t o manufactur e coppe r and a discussio n of th e emissions
resultin g fro m th e variou s operation s ar e presente d below.
Proces s Description 8
A conventiona l pyrometallurgica l copper-smeltin g proces s is
illustrate d i n Figur e 7-2 . Thi s proces s include s roastin g ore
concentrate s t o produc e calcine , smeltin g of roaste d (calcine
feed ) or unroaste d (gree n feed ) or e concentrate s t o produce
matte , and convertin g th e matt e t o yiel d bliste r coppe r product
(abou t 99 percen t pure). Typically , th e bliste r coppe r is
refine d i n an anod e furnace , cas t int o "anodes" , and the n sen t to
an electrolyti c refiner y fo r furthe r impurit y elimination.
I n roasting , charg e materia l of coppe r concentrate , mixed
wit h a siliceou s flu x (ofte n a lo w grad e ore) , i s heate d i n air
t o abou t 650° C (1200°F) , eliminatin g 20 t o 50 percen t of the
7-6
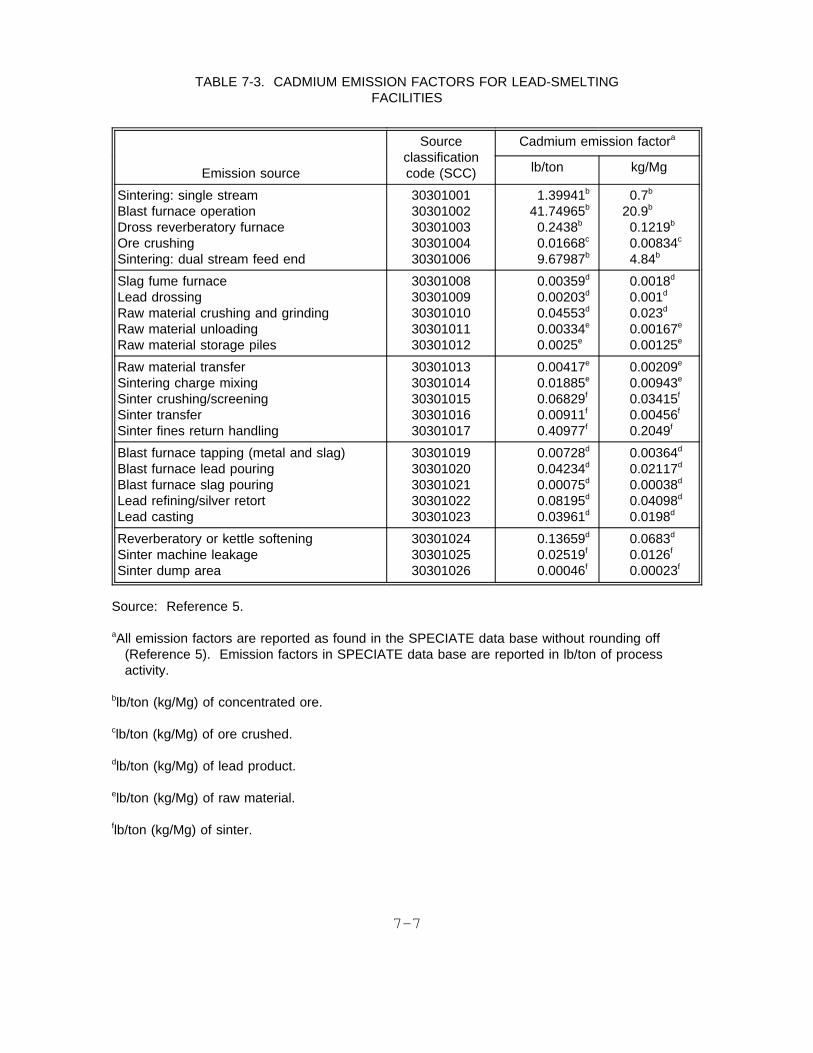
TABLE 7-3. CADMIUM EMISSION FACTORS FOR LEAD-SMELTINGFACILITIES
Emission source
Sourceclassificationcode (SCC)
Cadmium emission factora
lb/ton kg/Mg
Sintering: single streamBlast furnace operationDross reverberatory furnaceOre crushingSintering: dual stream feed end
3030100130301002303010033030100430301006
1.39941b
41.74965b
0.2438b
0.01668c
9.67987b
0.7b
20.9b
0.1219b
0.00834c
4.84b
Slag fume furnaceLead drossingRaw material crushing and grindingRaw material unloadingRaw material storage piles
3030100830301009303010103030101130301012
0.00359d
0.00203d
0.04553d
0.00334e
0.0025e
0.0018d
0.001d
0.023d
0.00167e
0.00125e
Raw material transferSintering charge mixingSinter crushing/screeningSinter transferSinter fines return handling
3030101330301014303010153030101630301017
0.00417e
0.01885e
0.06829f
0.00911f
0.40977f
0.00209e
0.00943e
0.03415f
0.00456f
0.2049f
Blast furnace tapping (metal and slag)Blast furnace lead pouringBlast furnace slag pouringLead refining/silver retortLead casting
3030101930301020303010213030102230301023
0.00728d
0.04234d
0.00075d
0.08195d
0.03961d
0.00364d
0.02117d
0.00038d
0.04098d
0.0198d
Reverberatory or kettle softeningSinter machine leakageSinter dump area
303010243030102530301026
0.13659d
0.02519f
0.00046f
0.0683d
0.0126f
0.00023f
Source: Reference 5.
aAll emission factors are reported as found in the SPECIATE data base without rounding off(Reference 5). Emission factors in SPECIATE data base are reported in lb/ton of processactivity.
blb/ton (kg/Mg) of concentrated ore.
clb/ton (kg/Mg) of ore crushed.
dlb/ton (kg/Mg) of lead product.
elb/ton (kg/Mg) of raw material.
flb/ton (kg/Mg) of sinter.
7-7

TABLE 7-4. DOMESTIC PRIMARY COPPER SMELTERS AND REFINERIES
Smelter 1992 Capacity, Mg (tons)
ASARCO Inc., Hayden, AZ 170,000 (187,000)
Cyprus Miami Mining Co., Globe, AZ 180,000 (198,000)
MAGMA Copper Co., San Manuel, AZ 290,000 (319,000)
Copper Range Co., White Pine, MI 60,000 (66,000)
Phelps Dodge, Hidalgo, NM 190,000 (209,000)
Chino Mines Co., Hurley, NM 170,000 (187,000)
ASARCO Inc., El Paso, TX 104,000 (114,400)
Kennecott, Garfield, UT 210,000 (231,000)
Source: Reference 7.
7-8
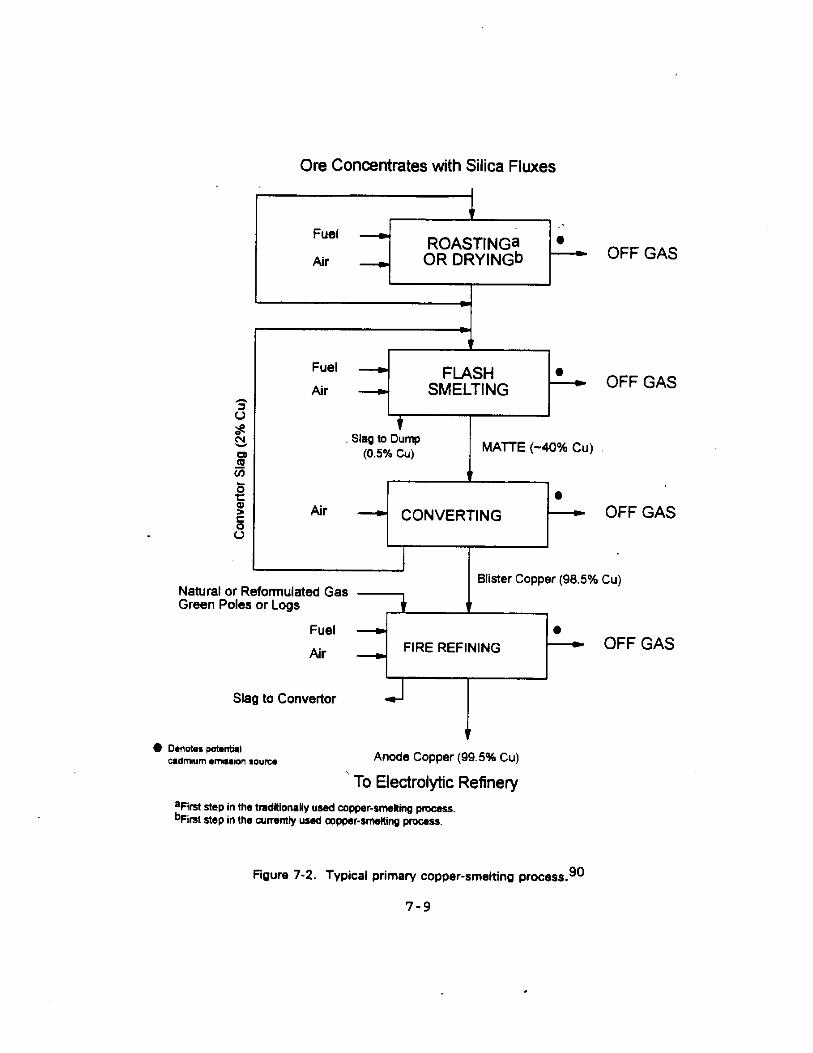
sulfu r as SO2. Portion s of suc h impuritie s as antimony , arsenic,
and lea d ar e drive n off , and some iro n i s converte d t o oxide.
The roaste d product , calcine , serve s as a drie d and heate d charge
fo r th e smeltin g furnace. Eithe r multiple-heart h or fluidized-
bed roaster s ar e use d fo r roastin g coppe r concentrate.
Multiple-heart h roaster s accep t mois t concentrate , whereas
fluidized-be d roaster s ar e fe d finel y groun d materia l (6 0 percent
minu s 200 mesh). Wit h bot h of thes e types , th e roastin g is
autogenous. Becaus e ther e i s les s ai r dilution , highe r SO2
concentration s ar e presen t i n fluidized-be d roaste r gase s tha n in
multiple-heart h roaste r gases. Becaus e cadmiu m has a boiling
poin t of 767° C (1415°F) , most of th e cadmiu m i n th e or e may
remai n i n th e calcine , instea d of bein g emitte d as an air
pollutan t durin g roasting.
I n th e smeltin g process , eithe r hot calcine s fro m the
roaste r or ra w unroaste d concentrate s ar e melte d wit h siliceous
flu x i n a smeltin g furnac e t o produc e coppe r matte , a molten
mixtur e of cuprou s sulfid e (Cu 2S) , ferrou s sulfid e (FeS ) and some
heav y metals. The require d hea t comes fro m partia l oxidatio n of
th e sulfid e charg e and fro m burnin g externa l fuel. Most of the
iro n and some of th e impuritie s i n th e charg e oxidiz e wit h the
fluxe s t o for m a sla g on to p of th e molte n bath ; thi s sla g is
periodicall y remove d and discarded. Copper matt e remain s i n the
furnac e unti l tapped. Matte s produce d by th e domesti c industry
rang e fro m 35 t o 65 percen t copper , wit h 45 percen t bein g the
most common. The coppe r conten t percentag e i s referre d t o as the
matt e grade. Currently , fiv e smeltin g furnac e technologie s are
use d i n th e U.S.: reverberatory , electric , Noranda , Outokumpu
(flash) , and Inc o (flash). Reverberator y furnace s may operat e at
temperature s as hig h as 1500° C (2732°F) , whil e flas h furnace s may
operat e at temperature s of 1000° F (1832°F). Even thoug h the
exac t temperature s at whic h th e othe r tw o furnac e technologies
(electri c and Noranda ) operat e ar e not known, i t i s probabl e that
7-10
the y operat e at temperature s highe r tha n th e boilin g poin t of
cadmium. Therefore , most of th e cadmiu m tha t remain s i n the
calcin e may be emitte d as an ai r pollutan t durin g th e smelting
step.
Reverberator y furnac e operatio n i s a continuou s process,
wit h frequen t chargin g of inpu t material s and periodi c tappin g of
matt e and skimmin g of slag. Heat i s supplie d by combustio n of
oil , gas or pulverize d coal , and furnac e temperature s may exceed
1500° C (2732°F).
For smeltin g i n electri c ar c furnaces , hea t i s generate d by
th e flo w of an electri c curren t i n carbo n electrodes. These
electrode s ar e lowere d throug h th e furnac e roo f and submerge d in
th e sla g laye r of th e molte n bath. The fee d generall y consists
of drie d concentrate s or calcines ; chargin g wet concentrate s is
avoided. The chemica l and physica l change s occurrin g i n the
molte n bat h ar e simila r t o thos e occurrin g i n th e molte n bat h of
a reverberator y furnace. Also , th e matt e and slag-tapping
practice s ar e simila r at bot h furnaces. Electri c furnace s do not
produc e fue l combustio n gases , so flo w rate s ar e lowe r and SO2
concentration s ar e highe r i n th e effluen t gas of electric
furnace s tha n i n th e effluen t gas of reverberator y furnaces.
Flas h furnac e smeltin g combine s th e operation s of roasting
and smeltin g t o produc e a high-grad e coppe r matt e from
concentrate s and flux. I n flas h smelting , drie d or e concentrates
and finel y groun d fluxe s ar e injected , togethe r wit h oxygen,
preheate d air , or a mixtur e of both , int o a furnac e of special
desig n wher e temperatur e i s maintaine d at approximatel y 1000°C
(1832°F). I n contras t t o reverberator y and electri c furnaces,
flas h furnace s us e th e hea t generate d fro m partia l oxidatio n of
thei r sulfid e charg e t o provid e much or al l of th e energ y (heat)
7-11

require d fo r smelting. They als o produc e offga s streams
containin g hig h concentration s of SO2.
Sla g produce d by flas h furnac e operation s contains
significantl y highe r amount s of coppe r tha n i s foun d in
reverberator y or electri c furnac e operations. As a result , the
flas h furnac e and converte r slag s ar e treate d i n a slag-cleaning
furnac e t o recove r th e copper. Slag-cleanin g furnace s usually
ar e smal l electri c furnaces. The flas h furnac e and converter
slag s ar e charge d t o a slag-cleanin g furnac e and ar e allowe d to
settl e unde r reducin g conditions , wit h th e additio n of cok e or
iro n sulfide. The copper , whic h i s i n th e oxid e for m i n the
slag , i s converte d t o coppe r sulfide. The coppe r sulfid e is
subsequentl y remove d fro m th e furnac e and i s charge d t o a
converte r wit h regula r matte. I f th e slag’ s coppe r conten t is
low , th e sla g i s discarded.
The Norand a process , as originall y designed , allowe d the
continuou s productio n of bliste r coppe r i n a singl e vesse l by
effectivel y combinin g roasting , smeltin g and convertin g int o one
operation. Metallurgica l problems , however , le d t o th e operation
of thes e reactor s fo r th e productio n of coppe r matte. As in
flas h smelting , th e Norand a proces s take s advantag e of th e heat
energ y availabl e fro m th e coppe r ore. The remainin g thermal
energ y requiremen t i s supplie d by oi l burners , or by coa l mixed
wit h th e or e concentrates.
The fina l ste p i n bliste r coppe r productio n i s conversion.
Thi s ste p eliminate s th e remainin g iro n and sulfu r presen t i n the
matt e and leave s behin d onl y th e molte n "blister " copper. All
but one U.S . smelte r use s Pierce-Smit h converters , whic h are
refractory-line d cylindrica l stee l shell s mounte d on trunnion s at
eithe r end , and rotate d abou t th e majo r axi s fo r chargin g and
pouring. An openin g i n th e cente r of th e converte r function s as
7-12
a mout h throug h whic h molte n matte , siliceou s flux , and scrap
coppe r ar e charged , and gaseou s product s ar e vented. Ai r or
oxygen-ric h ai r i s blow n throug h th e molte n matte. Iro n sulfide
(FeS ) i s oxidize d t o iro n oxid e (FeO) and SO2, and th e blowing
and slag-skimmin g step s ar e repeate d unti l an adequat e amount of
relativel y pur e Cu2S, calle d "whit e metal, " accumulate s i n the
botto m of th e converter. A renewe d ai r blas t the n oxidize s the
coppe r sulfid e sulfu r t o SO2, leavin g bliste r coppe r i n the
converter. The bliste r coppe r i s subsequentl y remove d and
transferre d t o refinin g facilities. Thi s segment of converter
operatio n i s terme d th e finis h blow. The SO2 produce d throughout
th e operatio n i s vente d t o pollutio n contro l devices.
One domesti c smelte r use s Hoboke n converters , whic h has the
advantag e of emissio n controls. The Hoboke n converte r is
essentiall y lik e a conventiona l Pierce-Smit h converter , except
tha t thi s vesse l i s fitte d wit h a sid e flu e at one end , whic h is
shape d as an inverte d U. Thi s flu e arrangemen t permit s siphoning
of gase s fro m th e interio r of th e converte r directl y int o the
offga s collectio n system. Thi s leave s th e converte r mout h under
a sligh t vacuum.
Bliste r coppe r usuall y contain s fro m 98. 5 t o 99. 5 percent
pur e copper. Impuritie s may includ e gold , silver , antimony,
arsenic , bismuth , iron , lead , nickel , selenium , sulfur,
tellurium , and zinc. To purif y bliste r coppe r further , fire
refinin g and electrolyti c refinin g ar e used. I n fir e refining,
bliste r coppe r i s place d i n a fire-refinin g furnace ; a flu x is
usuall y added , and ai r i s blow n throug h th e molte n mixtur e to
oxidiz e remainin g impurities , whic h ar e remove d as a slag. The
remainin g meta l bat h i s subjecte d t o a reducin g atmosphere , which
reconvert s cuprou s oxid e t o copper. The temperatur e i n the
furnac e i s aroun d 1100° C (2012°F). The fire-refine d coppe r is
the n cas t int o anodes , and the n furthe r electrolyti c refining
7-13
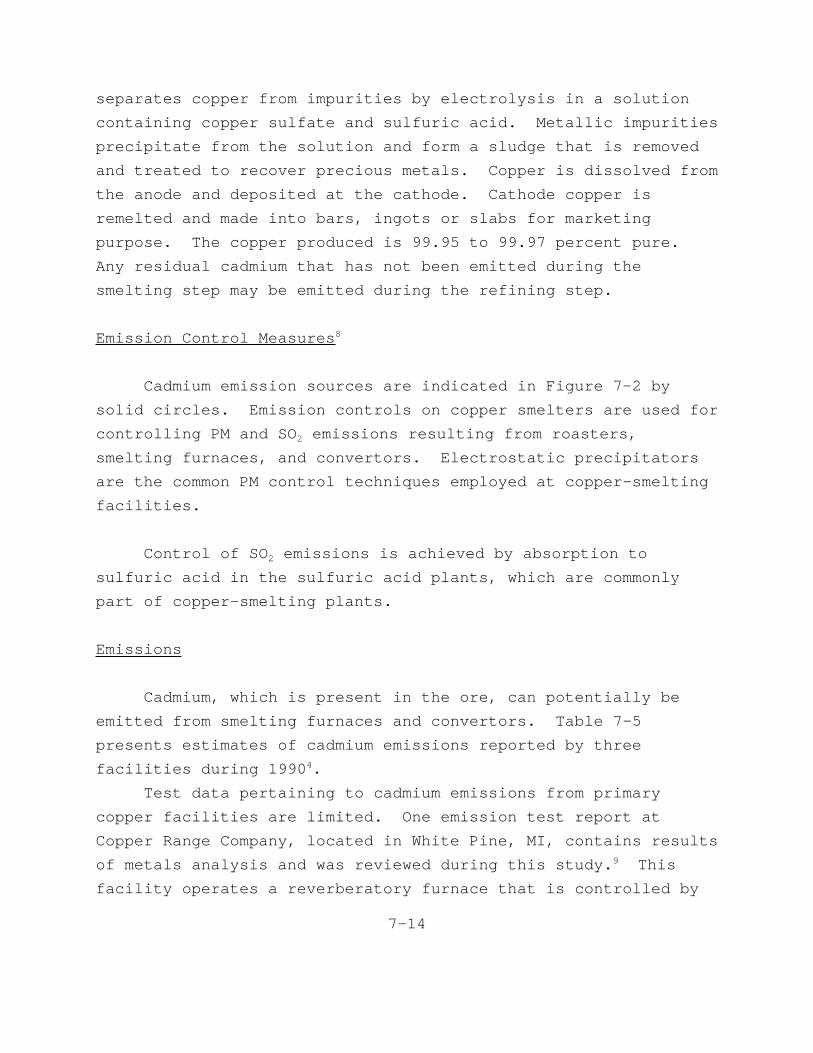
separate s coppe r fro m impuritie s by electrolysi s i n a solution
containin g coppe r sulfat e and sulfuri c acid. Metalli c impurities
precipitat e fro m th e solutio n and for m a sludg e tha t i s removed
and treate d t o recove r preciou s metals. Copper i s dissolve d from
th e anod e and deposite d at th e cathode. Cathod e coppe r is
remelte d and made int o bars , ingot s or slab s fo r marketing
purpose. The coppe r produce d i s 99.9 5 t o 99.9 7 percen t pure.
Any residua l cadmiu m tha t has not been emitte d durin g the
smeltin g ste p may be emitte d durin g th e refinin g step.
Emissio n Contro l Measures 8
Cadmiu m emissio n source s ar e indicate d i n Figur e 7- 2 by
soli d circles. Emissio n control s on coppe r smelter s ar e use d for
controllin g PM and SO2 emission s resultin g fro m roasters,
smeltin g furnaces , and convertors. Electrostati c precipitators
ar e th e common PM contro l technique s employe d at copper-smelting
facilities.
Contro l of SO2 emission s i s achieve d by absorptio n to
sulfuri c aci d i n th e sulfuri c aci d plants , whic h ar e commonly
par t of copper-smeltin g plants.
Emissions
Cadmium, whic h i s presen t i n th e ore , ca n potentiall y be
emitte d fro m smeltin g furnace s and convertors. Tabl e 7-5
present s estimate s of cadmiu m emission s reporte d by three
facilitie s durin g 1990 4.
Tes t dat a pertainin g t o cadmiu m emission s fro m primary
coppe r facilitie s ar e limited. One emissio n tes t repor t at
Copper Range Company, locate d i n Whit e Pine , MI, contain s results
of metal s analysi s and was reviewe d durin g thi s study. 9 This
facilit y operate s a reverberator y furnac e tha t i s controlle d by
7-14
an ESP. The exhaus t strea m fro m th e converto r (whic h is
TABLE 7-5. PRIMARY COPPER PRODUCERS REPORTING CADMIUM EMISSIONSIN THE 1990 TOXICS RELEASE INVENTORY
Smelter
Emissions, kg (lbs)
Nonpoint Point Total
ASARCO Inc., El Paso, TX 771 (1,696) 3,048 (6,706) 3,819 (8,402)
ASARCO Inc., Hayden, AR 113 (249) 1,203 (2,647) 1,316 (2,895)
Kennecott, Garfield, UT 113 (249) 340 (748) 453, (997)
Note: Cypress Miami Mining Co., Globe, AZ, reported zero cadimum emissions in the 1990 TRI.
Source: Reference 4.
uncontrolled ) i s mixe d wit h th e exhaus t fro m th e ESP outle t and
i s route d throug h th e mai n stac k and discharge d int o the
atmosphere. Testin g fo r metal s was performe d at th e mai n stack
afte r tw o exhaus t stream s (fro m th e ESP outle t and th e convertor)
wer e mixed. Cadmiu m emission s wer e measure d fo r thre e modes of
converto r operation: slag-blow , copper-blow , and converto r idle
(n o blow ) cycles. The cadmiu m leve l durin g th e slag-blo w cycle
was measure d t o be th e highest , correspondin g t o a cadmium
emissio n rat e of 2.350 9 lb/hr. Additionally , th e plan t capacity
was reporte d t o be approximatel y 42 tons/h r of feed , which
consist s of mil l concentrate , limestone , iro n pyrites , and
recycle d material. The actua l proces s rat e durin g th e tes t is
not known. Sinc e th e fee d mi x varie s fro m facilit y t o facility,
th e cadmiu m emission s measure d at Copper Range Co. canno t be used
t o estimat e a genera l cadmiu m emissio n facto r tha t woul d be valid
on an industrywid e basis. Additionally , Copper Range Co. , i s the
onl y facilit y i n th e U.S . tha t operate s a reverberator y furnace.
Al l othe r copper-smeltin g facilitie s us e flas h furnace s which
inherentl y produc e les s emissions.
7-15
The onl y availabl e emissio n facto r dat a ar e fro m the
SPECIATE dat a base. Tabl e 7- 6 present s cadmiu m emissio n factors
fo r variou s emissio n point s at primar y copper-smeltin g facilities
as reporte d i n th e SPECIATE dat a base. 5 Becaus e th e validit y of
thes e emissio n factor s canno t be verified , extrem e cautio n should
be exercise d when usin g thes e factors.
PRIMARY ZIN C SMELTING AND REFINING
Zin c i s foun d primaril y as th e sulfid e ore , sphalerite
(ZnS). It s common coproduc t ore s ar e lea d and copper. Metal
impuritie s commonl y associate d wit h ZnS ar e cadmiu m (u p t o 2
percent ) and mino r quantitie s of germanium , gallium , indium , and
thallium. Zin c ore s typicall y contai n fro m 3 t o 11 percen t zinc.
Some ores , containin g as littl e as 2 percent , ar e recovered.
Concentratio n at th e min e bring s thi s t o 49 t o 54 percen t zinc,
wit h approximatel y 31 percen t fre e and uncombine d sulfur. 10
A lis t of primar y zin c smelter s currentl y i n operation
withi n th e U.S . i s give n i n Tabl e 7-7. 11 Zin c ore s ar e processed
int o metalli c sla b zin c by tw o basi c processes. Thre e of the
fou r domesti c U.S . zinc-smeltin g facilitie s us e th e electrolytic
process , and one plan t use s a pyrometallurgica l smeltin g process,
whic h i s typica l of th e primar y nonferrou s smeltin g industry.
The plan t tha t use s th e pyrometallurgica l proces s provide s energy
by electri c resistanc e heating. Therefore , i n thi s case , the
pyrometallurgica l proces s i s referre d t o as th e electrothermic
process. A descriptio n of th e proces s use d t o manufactur e zinc
by th e electrolyti c and electrothermi c processe s and a discussion
of th e emission s resultin g fro m th e variou s operation s are
presente d below.
7-16

TABLE 7-6. CADMIUM EMISSIONS FROM PRIMARY COPPER PRODUCTION
Emission source
Sourceclassificationcode (SCC)
Cadmiumemission factora
lb/ton kg/Mg
Reverberatory smelting furnace after roaster--ESPConvertor (all configurations)--ESPFire (furnace) refining--ESPOre concentrate dryer--ESPReverberatory smelting furnace with ore charging
(without roasting)--ESP
3030050330300504303005053030050630300507
0.0050.00360.0010.0010.005
0.00250.00180.00050.00050.0025
Fluidized-bed roaster--ESPElectric smelting furnace--ESPFlash smeltingRoasting: fugitive emissions--ESPReverberatory furnace: fugitive emissions--ESP
3030050930300510303005123030051330300514
0.00550.012.31280.000260.00716
0.002750.0051.15640.000130.00358
Convertor: fugitive emissionsAnode refining furnace: fugitive emissions--ESPSlag-cleaning furnace: fugitive emissions--ESPSlag-cleaning furnace--ESPAFT MHR+RF/FBR+EF
3030051530300516303005173030052230300524
0.028290.000050.00080.0010.18
0.0141450.0000250.00040.00050.09
Fluidized-bed roaster with reverberatory furnace +convertor--ESP
Concentrate dryer with electric furnace, cleaningfurnace and convertor--ESP
Concentrate dryer with flash furnace andconvertor--ESP
30300525
30300526
30300527
0.0055
0.001
0.001
0.00275
0.0005
0.0005
Source: Reference 5.
aAll emission factors are reported as found in the SPECIATE data base without rounding off(Reference 5). All emission factors reported above are in the units of lb/ton of concentrated ore.
7-17

Proces s Descriptio n - Electrolytic 10
TABLE 7-7. DOMESTIC PRIMARY ZINC PRODUCERS
Company Type of process1992 slab zinc production
capacity, Mg (tons)
Big River Zinc Co., Sauget, IL Electrolytic 82,000 (90,200)
Jersey Miniers Zinc Co.,Clarksville, TN
Electrolytic 98,000 (107,800)
Zinc Corporation of America,Bartlesville, OK
Electrolytic 51,000 (56,100)
Zinc Corporation of America,Monaca, PA
Electrothermic 123,000 (135,300)
Source: Reference 11.
A genera l diagra m of th e electrolyti c and electrothermic
processe s i s presente d i n Figur e 7-3. Electrolyti c processing
involve s fou r majo r steps: roasting , leaching , purification , and
electrolysis.
Roastin g i s a proces s common t o bot h electrolyti c and
pyrometallurgica l processing. Calcin e i s produce d by the
roastin g reaction s i n any one of thre e differen t type s of
roasters: multiple-hearth , suspension , or fluidized-bed.
Multiple-heart h roaster s ar e th e oldes t typ e use d i n th e United
States , whil e fluidized-be d roaster s ar e th e most modern. The
primar y zinc-roastin g reactio n occur s betwee n 640° and 1000°C
(1184 ° and 1832°F) , dependin g on th e typ e of roaste r used. The
reactio n is:
2ZnS + 3O2 > 2ZnO + 2SO2 (1)
I n a multiple-heart h roaster , th e concentrat e i s blown
throug h a serie s of nin e or more hearth s stacke d insid e a brick-
7-18
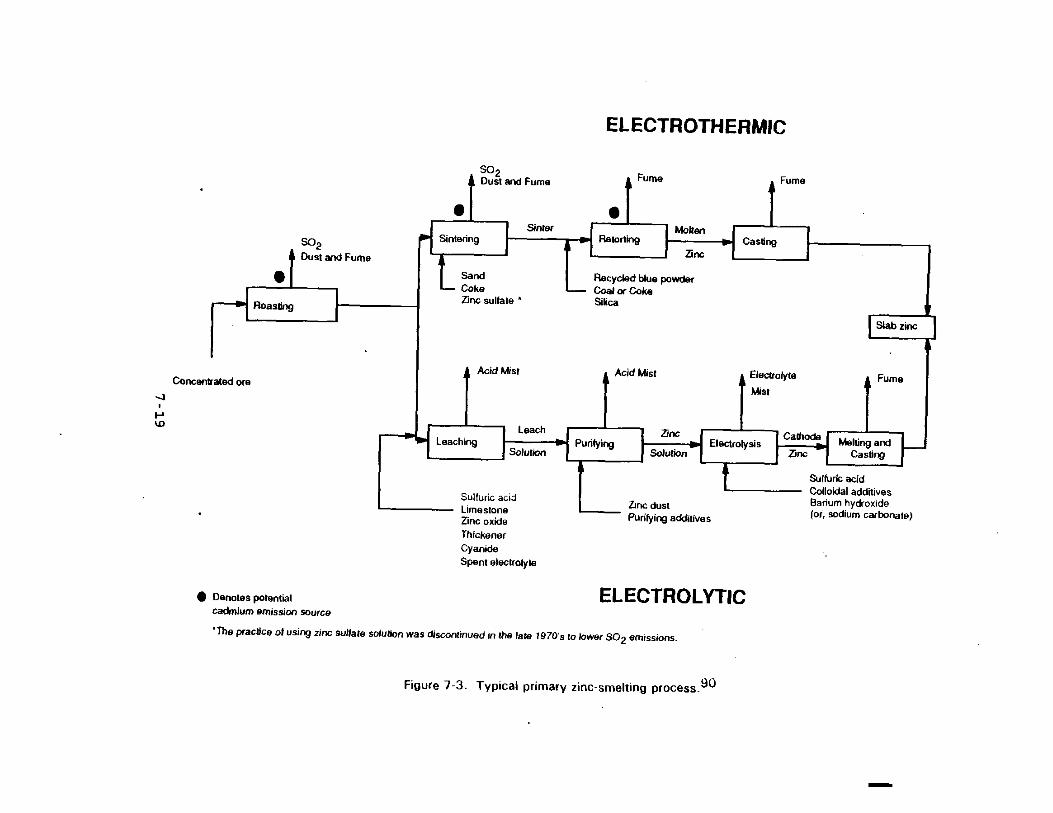

line d cylindrica l column. As th e fee d concentrat e drop s through
th e furnace , i t i s firs t drie d by th e hot gase s passin g through
th e hearth s and the n oxidize d t o produc e calcine. The reactions
ar e slo w and ca n onl y be sustaine d by th e additio n of fuel.
I n a suspensio n roaster , th e fee d i s blow n int o a combustion
chamber , whic h i s ver y simila r t o tha t of a pulverize d coal
furnace. Additiona l grinding , beyon d tha t require d fo r a
multiple-heart h furnace , i s normall y require d t o assur e tha t heat
transfe r t o th e materia l i s fas t enoug h t o initiate
desulfurizatio n and oxidatio n reaction s i n th e furnac e chamber.
Hearth s at th e botto m of th e roaste r captur e th e larger
particles , whic h need more tim e i n th e furnac e t o complet e the
desulfurizatio n reaction.
I n a fluidized-be d roaster , finel y groun d sulfide
concentrate s ar e suspende d and oxidize d withi n a pneumatically
supporte d feedstoc k bed. Thi s techniqu e achieve s th e lowest
sulfu r conten t calcin e of th e thre e roaste r designs.
Suspensio n and fluidized-be d roaster s ar e superio r t o the
multipl e heart h fo r severa l reasons. Althoug h the y emi t more
uncontrolle d particulate , thei r reactio n rate s ar e much faster,
allowin g greate r proces s rates. Also , th e SO2 conten t of the
effluen t stream s of thes e tw o roaster s i s significantl y higher,
permittin g more efficien t and economica l us e of aci d plant s to
contro l SO2 emissions.
Cadmiu m has a boilin g poin t of approximatel y 767° C (1413°F).
Therefore , most of th e cadmiu m ca n be expecte d t o be emitted
durin g th e roastin g step , irrespectiv e of whic h proces s is
followed.
7-20

Leachin g i s th e firs t ste p of electrolyti c reduction. In
thi s step , th e zin c oxid e react s wit h sulfuri c aci d t o form
aqueou s zin c sulfat e i n an electrolyt e solution.
ZnO + H2SO4 > Zn+2(aq ) + SO4-2 (aq ) + H2O (2)
Singl e and doubl e leac h method s ca n be used , althoug h the
forme r exhibit s excessiv e sulfuri c aci d losse s and poor zinc
recovery. I n doubl e leaching , th e calcin e i s firs t leache d i n a
neutra l or slightl y alkalin e solution. The readil y soluble
sulfate s fro m th e calcin e dissolve , but onl y a portio n of the
zin c oxid e enter s th e solution. The calcin e i s the n leache d in
th e acidi c electrolysi s recycl e electrolyte. The zin c oxid e is
dissolve d as shown i n reactio n 2, as ar e many of th e impurities,
especiall y iron. The electrolyt e i s neutralize d by thi s process,
and i t serve s as th e leac h solutio n fo r th e firs t stag e of the
calcin e leaching. Thi s recyclin g als o serve s as th e firs t stage
of refining , sinc e much of th e dissolve d iro n precipitate s out of
th e solution. Variation s on thi s basi c procedur e includ e th e use
of progressivel y stronge r and hotte r aci d bath s t o brin g as much
of th e zin c int o solutio n as possible.
Purificatio n i s a proces s i n whic h a variet y of reagent s are
adde d t o th e zinc-lade n electrolyt e t o forc e impuritie s to
precipitate. The soli d precipitate s ar e separate d fro m the
solutio n by filtration. The technique s tha t ar e use d ar e among
th e most advance d industria l application s of inorgani c solution
chemistry. Processe s var y fro m smelte r t o smelter , and the
detail s ar e proprietar y and ofte n patented. Metalli c impurities,
suc h as arsenic , antimony , cobalt , germanium , nickel , and
thallium , interfer e severel y wit h th e electrolyt e depositio n of
zin c and thei r fina l concentration s ar e limite d t o les s than
0.0 5 milligram s per lite r ( 4 x 10⁻⁷ pound s per gallon).
7-21
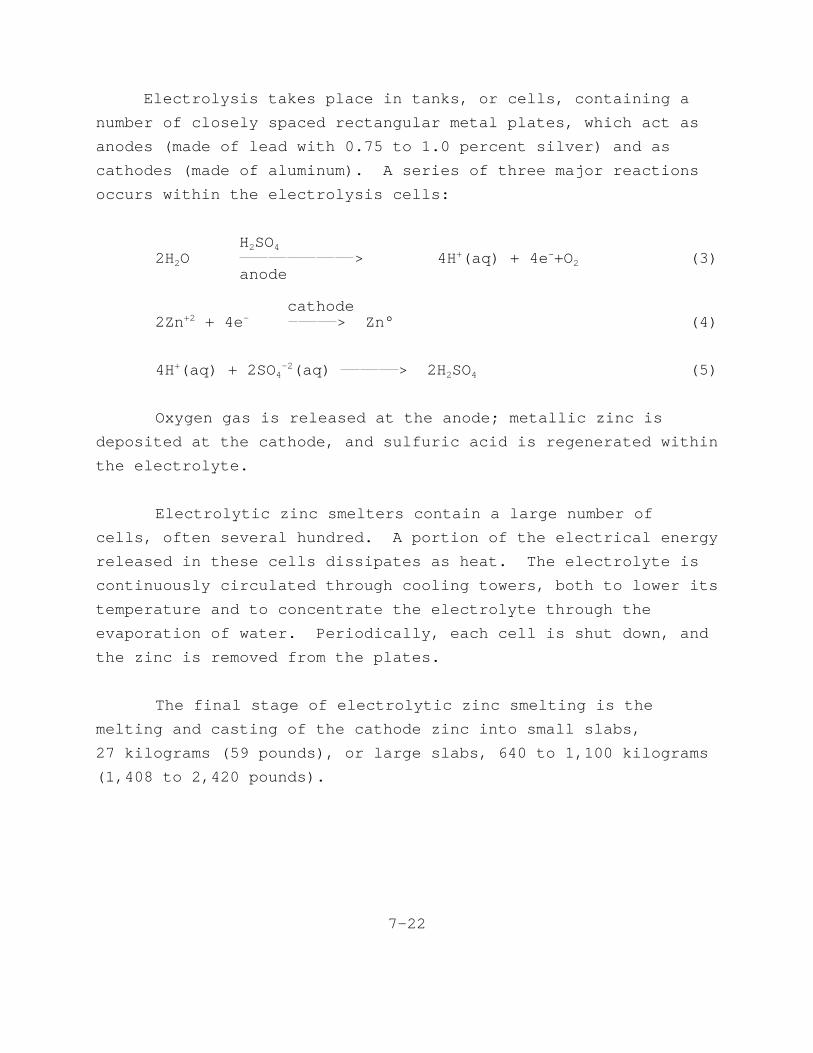
Electrolysi s take s plac e i n tanks , or cells , containin g a
number of closel y space d rectangula r meta l plates , whic h ac t as
anode s (made of lea d wit h 0.7 5 t o 1. 0 percen t silver ) and as
cathode s (made of aluminum). A serie s of thre e majo r reactions
occur s withi n th e electrolysi s cells:
H2SO4
2H2O > 4H+(aq ) + 4e- +O2 (3)anode
cathode2Zn+2 + 4e- > Zn° (4)
4H+(aq ) + 2SO4-2 (aq) > 2H2SO4 (5)
Oxygen gas i s release d at th e anode ; metalli c zin c is
deposite d at th e cathode , and sulfuri c aci d i s regenerate d within
th e electrolyte.
Electrolyti c zin c smelter s contai n a larg e number of
cells , ofte n severa l hundred. A portio n of th e electrica l energy
release d i n thes e cell s dissipate s as heat. The electrolyt e is
continuousl y circulate d throug h coolin g towers , bot h t o lowe r its
temperatur e and t o concentrat e th e electrolyt e throug h the
evaporatio n of water. Periodically , eac h cel l i s shu t down, and
th e zin c i s remove d fro m th e plates.
The fina l stag e of electrolyti c zin c smeltin g i s the
meltin g and castin g of th e cathod e zin c int o smal l slabs,
27 kilogram s (5 9 pounds) , or larg e slabs , 640 t o 1,10 0 kilograms
(1,40 8 t o 2,42 0 pounds).
7-22
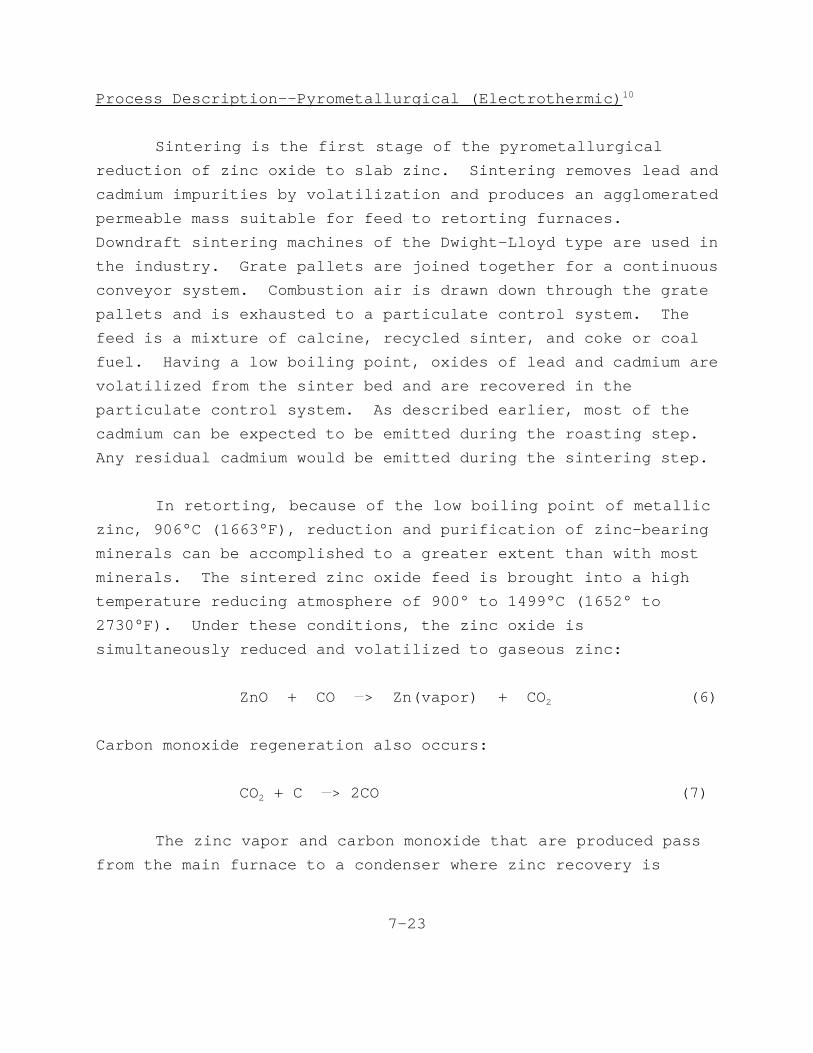
Proces s Description--Pyrometallurgica l (Electrothermic) 10
Sinterin g i s th e firs t stag e of th e pyrometallurgical
reductio n of zin c oxid e t o sla b zinc. Sinterin g remove s lea d and
cadmiu m impuritie s by volatilizatio n and produce s an agglomerated
permeabl e mass suitabl e fo r fee d t o retortin g furnaces.
Downdraf t sinterin g machine s of th e Dwight-Lloy d typ e ar e use d in
th e industry. Grat e pallet s ar e joine d togethe r fo r a continuous
conveyo r system. Combustio n ai r i s draw n down throug h th e grate
pallet s and i s exhauste d t o a particulat e contro l system. The
fee d i s a mixtur e of calcine , recycle d sinter , and cok e or coal
fuel. Havin g a lo w boilin g point , oxide s of lea d and cadmiu m are
volatilize d fro m th e sinte r bed and ar e recovere d i n the
particulat e contro l system. As describe d earlier , most of the
cadmiu m ca n be expecte d t o be emitte d durin g th e roastin g step.
Any residua l cadmiu m woul d be emitte d durin g th e sinterin g step.
I n retorting , becaus e of th e lo w boilin g poin t of metallic
zinc , 906° C (1663°F) , reductio n and purificatio n of zinc-bearing
mineral s ca n be accomplishe d t o a greate r exten t tha n wit h most
minerals. The sintere d zin c oxid e fee d i s brough t int o a high
temperatur e reducin g atmospher e of 900° t o 1499° C (1652 ° to
2730°F). Under thes e conditions , th e zin c oxid e is
simultaneousl y reduce d and volatilize d t o gaseou s zinc:
ZnO + CO > Zn(vapor) + CO2 (6)
Carbo n monoxid e regeneratio n als o occurs:
CO2 + C > 2CO (7)
The zin c vapo r and carbo n monoxid e tha t ar e produce d pass
fro m th e mai n furnac e t o a condense r wher e zin c recover y is
7-23

accomplishe d by bubblin g th e gas mixtur e throug h a molte n zinc
bath.
Retortin g furnace s ca n be heate d eithe r externall y by
combustio n flame s or internall y by electri c resistanc e heating.
The latte r approach , electrothermi c reduction , i s th e onl y method
currentl y practice d i n th e Unite d States , and i t has greater
therma l efficienc y tha n do externa l heatin g methods. I n a retort
furnace , preheate d cok e and sinter , silic a and miscellaneous
zinc-bearin g material s ar e fe d continuousl y int o th e to p of the
furnace. Feed cok e serve s as th e principa l electrica l conductor,
producin g heat ; i t als o provide s th e carbo n monoxid e require d for
zin c oxid e reduction. Furthe r purificatio n step s ca n be
performe d on th e molte n meta l collecte d i n th e condenser. The
molte n zin c finall y i s cas t int o smal l slabs , 27 kilograms
(5 9 pounds) , or th e larg e slabs , 640 t o 1,10 0 kilogram s (1,40 8 to
2,42 0 pounds). Any cadmiu m tha t i s lef t ove r fro m th e roasting
and sinterin g step s may be emitte d durin g th e retortin g step.
Emissio n Contro l Measures 10,12
Cadmiu m emissio n source s ar e indicate d i n Figur e 7- 3 by
soli d circles. Emissio n control s use d at electrolyti c zinc
smelter s includ e fabri c filter s fo r controllin g PM fro m ore
storag e and handlin g operations , and zinc-smeltin g operations.
Emissio n control s employe d at electrothermi c zin c smelters
includ e fabri c filter s fo r controllin g PM fro m sinte r machines,
sinte r sizin g and crushin g operations , electrothermi c furnace
preheaters , electrothermi c furnaces , zinc-holdin g furnaces , and
zinc-refinin g columns.
Contro l of SO2 emission s at bot h electrolyti c and
electrothermi c zin c smelter s i s achieve d by absorptio n to
7-24

sulfuri c aci d i n th e sulfuri c aci d plants , whic h ar e commonly
par t of zinc-smeltin g plants.
Emissions
Cadmium, whic h i s presen t i n th e ore , ca n potentiall y be
emitte d fro m roaster s (i n bot h electrolyti c and electrothermic
processes ) and fro m sinterin g machine s and retortin g step s of the
electrothermi c process. Tabl e 7- 8 present s estimate s of cadmium
emission s reporte d by th e fou r facilitie s durin g 1990. 4 The
onl y availabl e emissio n facto r dat a ar e fro m th e SPECIATE data
base. Tabl e 7- 9 present s cadmiu m emissio n factor s fo r various
emissio n point s at primar y zinc-smeltin g facilitie s as reported
i n th e SPECIATE dat a base. 5 Becaus e th e validit y of these
emissio n factor s canno t be verified , extrem e cautio n shoul d be
exercise d when usin g them.
TABLE 7-8. PRIMARY ZINC PRODUCERS REPORTING CADMIUM EMISSIONSIN THE 1990 TOXICS RELEASE INVENTORY
Company Type of process Emissions, kg (lb)
Big River Zinc Co., Sauget, IL Electrolytic 860 (1,892)
Jersey Miniere Zinc Co.,Clarksville, TN
Electrolytic 227 (499)
Zinc Corporation of America,Bartlesville, OK
Electrolytic 2,936 (6,459)
Zinc Corporation of America,Monaca, PA
Electrothermic 1,724 (3,793)
Source: Reference 4.
7-25
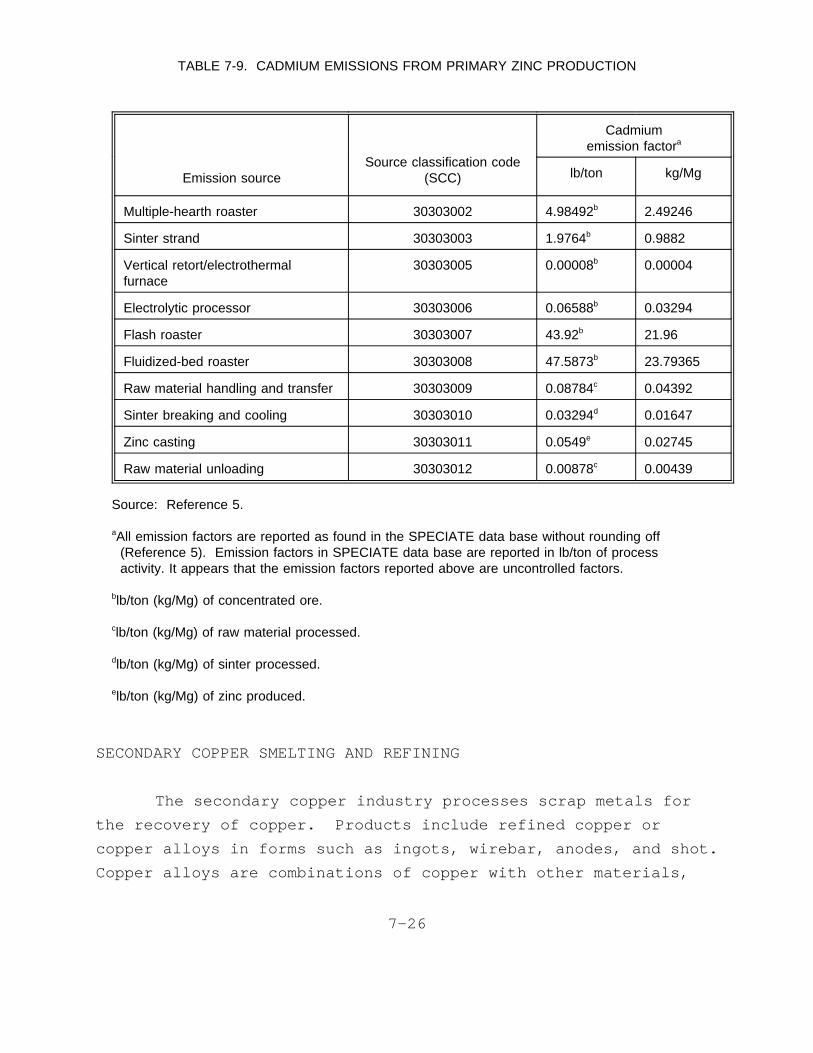
SECONDARY COPPER SMELTING AND REFINING
TABLE 7-9. CADMIUM EMISSIONS FROM PRIMARY ZINC PRODUCTION
Emission sourceSource classification code
(SCC)
Cadmiumemission factora
lb/ton kg/Mg
Multiple-hearth roaster 30303002 4.98492b 2.49246
Sinter strand 30303003 1.9764b 0.9882
Vertical retort/electrothermalfurnace
30303005 0.00008b 0.00004
Electrolytic processor 30303006 0.06588b 0.03294
Flash roaster 30303007 43.92b 21.96
Fluidized-bed roaster 30303008 47.5873b 23.79365
Raw material handling and transfer 30303009 0.08784c 0.04392
Sinter breaking and cooling 30303010 0.03294d 0.01647
Zinc casting 30303011 0.0549e 0.02745
Raw material unloading 30303012 0.00878c 0.00439
Source: Reference 5.
aAll emission factors are reported as found in the SPECIATE data base without rounding off(Reference 5). Emission factors in SPECIATE data base are reported in lb/ton of processactivity. It appears that the emission factors reported above are uncontrolled factors.
blb/ton (kg/Mg) of concentrated ore.
clb/ton (kg/Mg) of raw material processed.
dlb/ton (kg/Mg) of sinter processed.
elb/ton (kg/Mg) of zinc produced.
The secondar y coppe r industr y processe s scra p metal s for
th e recover y of copper. Product s includ e refine d coppe r or
coppe r alloy s i n form s suc h as ingots , wirebar , anodes , and shot.
Copper alloy s ar e combination s of coppe r wit h othe r materials,
7-26

notably , tin , zinc , and lead. Also , fo r specia l applications,
combination s includ e suc h metal s as cobalt , manganese , iron,
nickel , cadmium , and beryllium , and nonmetals , suc h as arsenic
and silicon. 13
A lis t of secondar y coppe r smelter s currentl y operating
withi n th e Unite d State s i s give n i n Tabl e 7-10. 7 A description
of th e proces s use d t o manufactur e secondar y coppe r and a
discussio n of th e emission s resultin g fro m th e variou s operations
ar e presente d below.
Proces s Description 13
TABLE 7-10. DOMESTIC SECONDARY COPPER PRODUCERS
Smelter 1992 Capacity, Mg (tons)
Cerro Copper Products, Sauget, IL 70,000 (77,000)
Chemetco (Concorde Metals), Alton, IL 135,000 (148,500)
Franklin Smelting & Refining, Philadelphia, PA 16,000 (17,600)
Gaston Recycling Industries, Gaston, SC 110,000 (121,000)
Southwire Co., Carrolton, GA 105,000 (115,500)
Cyprus Casa Grande Corp., Lakeshore, AZ 45,000 (49,500)
Source: Reference 7.
The principa l processe s involve d i n coppe r recover y are
scra p meta l pretreatmen t and smelting. Pretreatmen t includes
cleanin g and concentratio n t o prepar e th e materia l fo r the
smeltin g furnace. Smeltin g involve s heatin g and treatin g the
scra p t o achiev e separatio n and purificatio n of specifi c metals.
The fee d materia l use d i n th e recover y proces s ca n be any
metalli c scra p containin g a usefu l amount of copper , bronze
7-27
(coppe r and tin) , or bras s (coppe r and zinc). Traditiona l forms
ar e punchings ; turning s and borings ; defectiv e or surplu s goods;
metallurgica l residue s suc h as slags , skimmings , and drosses ; and
obsolete , worn-out , or damaged articles , includin g automobile
radiators , pipe , wire , bushings , and bearings.
The typ e and qualit y of th e fee d materia l determine s the
processe s th e smelte r wil l use. Due t o th e larg e variet y of
possibl e fee d material s available , th e metho d of operatio n varies
greatl y betwee n plants. Generally , a secondar y coppe r facility
deal s wit h les s pur e ra w material s and produce s a more refined
product , wherea s bras s and bronz e allo y processor s tak e cleaner
scra p and do les s purificatio n and refining. Figur e 7- 4 i s a
flowshee t depictin g th e majo r processe s tha t ca n be expecte d i n a
secondar y copper-smeltin g operation. A bras s and bronz e alloying
operatio n i s shown i n Figur e 7-5.
Pretreatmen t of th e fee d materia l ca n be accomplished
usin g severa l differen t procedures , eithe r separatel y or in
combination. Feed scra p i s concentrate d by manual and mechanical
methods , suc h as sorting , stripping , shredding , and magnetic
separation. Feed scra p i s sometime s briquette d i n a hydraulic
press. Pyrometallurgica l pretreatmen t may includ e sweating,
burnin g of insulatio n (especiall y fro m wir e scrap) , and drying
(burnin g of f oi l and volatiles ) i n rotar y kilns.
Hydrometallurgica l method s includ e flotatio n and leaching , with
chemica l recovery.
I n smelting , low-grad e scra p i s melte d i n a cupola
furnace , producin g "blac k copper " (7 0 t o 80 percen t Cu) and slag;
thes e ar e ofte n separate d i n a reverberator y furnace. Fro m here,
th e mel t i s transferre d t o a converte r or electri c furnac e to
produc e "blister " copper , whic h i s 90 t o 99 percen t Cu. The
actua l temperatur e at whic h th e smeltin g take s plac e i s not
7-28
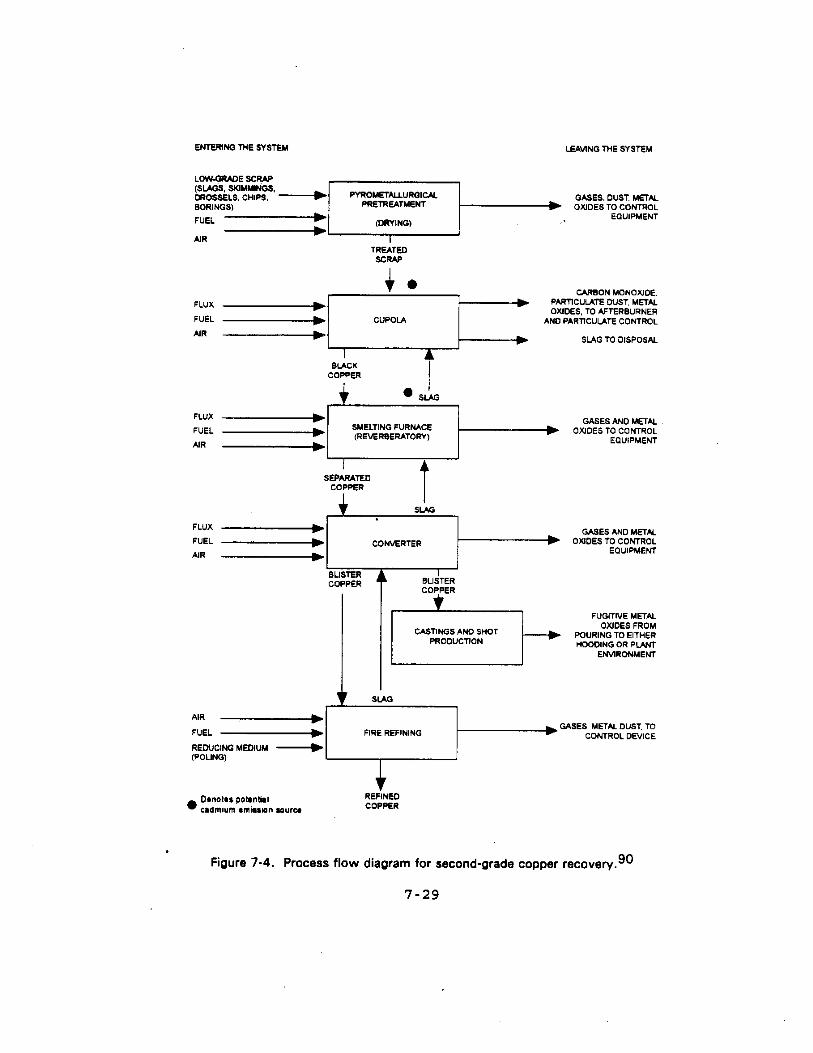
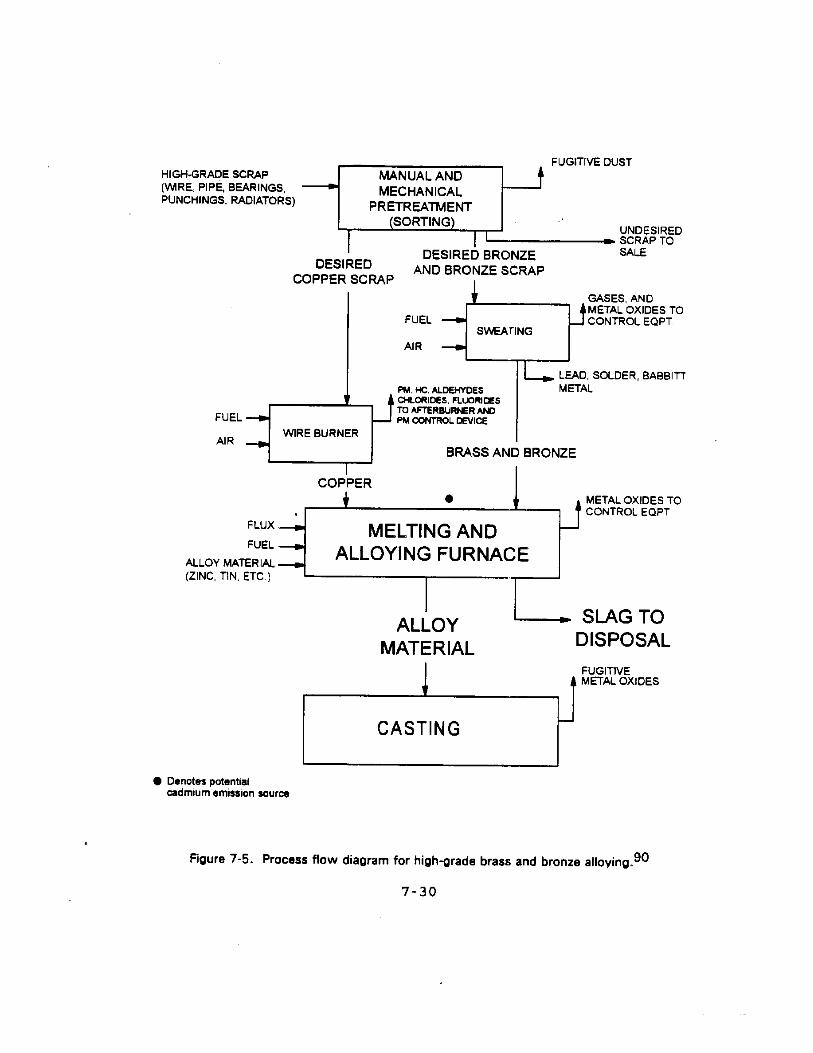
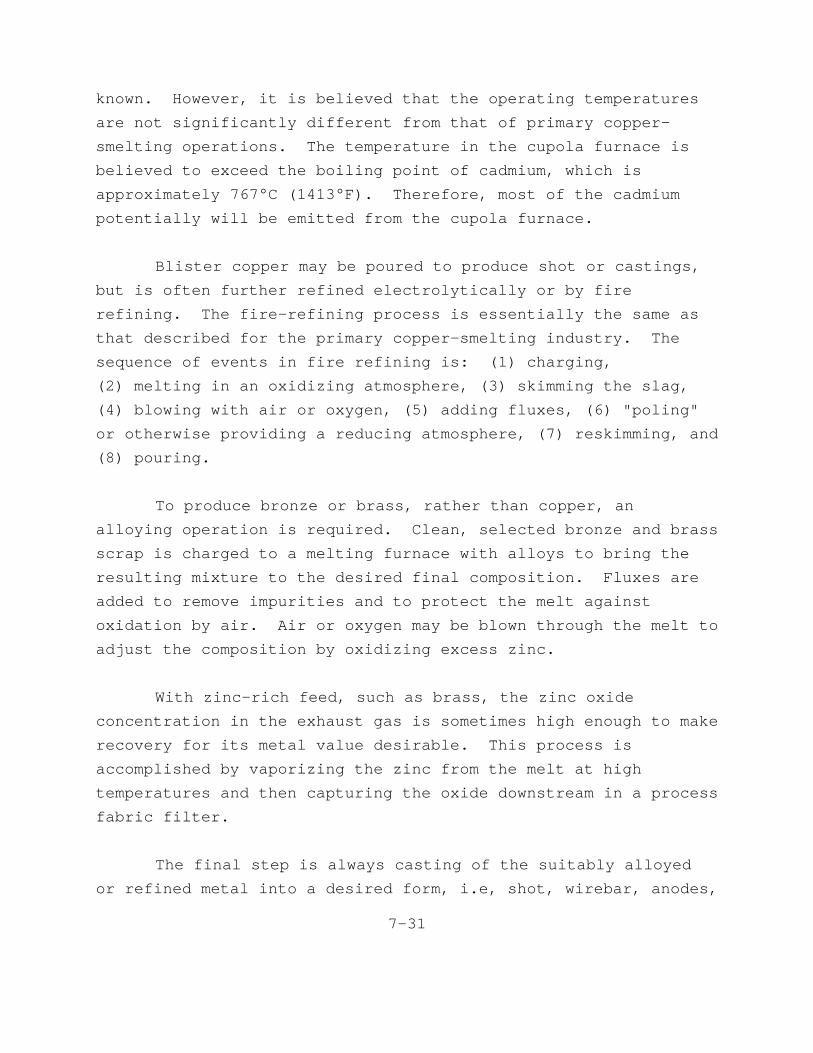
known. However , i t i s believe d tha t th e operatin g temperatures
ar e not significantl y differen t fro m tha t of primar y copper-
smeltin g operations. The temperatur e i n th e cupol a furnac e is
believe d t o excee d th e boilin g poin t of cadmium , whic h is
approximatel y 767° C (1413°F). Therefore , most of th e cadmium
potentiall y wil l be emitte d fro m th e cupol a furnace.
Bliste r coppe r may be poure d t o produc e sho t or castings,
but i s ofte n furthe r refine d electrolyticall y or by fire
refining. The fire-refinin g proces s i s essentiall y th e same as
tha t describe d fo r th e primar y copper-smeltin g industry. The
sequenc e of event s i n fir e refinin g is: (1 ) charging,
(2 ) meltin g i n an oxidizin g atmosphere , (3 ) skimmin g th e slag,
(4 ) blowin g wit h ai r or oxygen , (5 ) addin g fluxes , (6 ) "poling"
or otherwis e providin g a reducin g atmosphere , (7 ) reskimming , and
(8 ) pouring.
To produc e bronz e or brass , rathe r tha n copper , an
alloyin g operatio n i s required. Clean , selecte d bronz e and brass
scra p i s charge d t o a meltin g furnac e wit h alloy s t o brin g the
resultin g mixtur e t o th e desire d fina l composition. Fluxe s are
adde d t o remov e impuritie s and t o protec t th e mel t against
oxidatio n by air. Ai r or oxyge n may be blow n throug h th e mel t to
adjus t th e compositio n by oxidizin g exces s zinc.
Wit h zinc-ric h feed , suc h as brass , th e zin c oxide
concentratio n i n th e exhaus t gas i s sometime s hig h enoug h t o make
recover y fo r it s meta l valu e desirable. Thi s proces s is
accomplishe d by vaporizin g th e zin c fro m th e mel t at high
temperature s and the n capturin g th e oxid e downstrea m i n a process
fabri c filter.
The fina l ste p i s alway s castin g of th e suitabl y alloyed
or refine d meta l int o a desire d form , i.e , shot , wirebar , anodes,
7-31
cathodes , ingots , or othe r cas t shapes. The meta l fro m th e melt
i s usuall y poure d int o a ladl e or a smal l pot (whic h serve s as a
surg e hoppe r and a flo w regulator ) the n continue s int o a mold.
Emissio n Contro l Measures 13
The principa l pollutant s emitte d fro m secondar y copper-
smeltin g activitie s ar e particulat e matte r i n variou s forms.
Removal of insulatio n fro m wir e by burnin g cause s particulate
emission s of meta l oxide s and unburne d insulation. The dryin g of
chip s and boring s t o remov e exces s oil s and cuttin g fluid s can
resul t i n larg e amount s of dens e smoke, consistin g of soo t and
unburne d hydrocarbons , bein g discharged. Particulat e emissions
fro m th e to p of a cupol a furnac e consis t of meta l oxid e fumes,
dirt , and dus t fro m limeston e and coke.
The smeltin g proces s utilize s larg e volume s of ai r to
oxidiz e sulfides , zinc , and othe r undesirabl e constituent s of the
feed. Thi s procedur e generate s considerabl e particulat e matter
i n th e exi t gas stream. The wid e variatio n among furnac e types,
charg e types , quality , exten t of pretreatment , and siz e of the
charg e i s reflecte d i n a broa d spectru m of particl e size s and
variabl e grai n loading s i n th e escapin g gases. One majo r factor
contributin g t o difference s i n emissio n rate s i s th e amount of
zin c presen t i n scra p fee d materials ; th e low-boilin g zinc
evaporate s and combine s wit h ai r oxygen , producin g zin c oxide
fumes.
Meta l oxid e fume s fro m furnace s use d i n secondar y smelters
hav e been controlle d by fabri c filters , ESP’s , or wet scrubbers.
Contro l efficienc y by fabri c filter s may be bette r than
99 percent , but coolin g system s ar e neede d t o preven t th e hot
exhaus t gase s fro m damagin g or destroyin g th e bag filters. A
two-stag e syste m usin g bot h wate r jacketin g and radian t cooling
7-32

i s common. Electrostati c precipitator s ar e not as wel l suite d to
thi s application , havin g a low-collectio n efficienc y fo r dense
particulates , suc h as oxide s of lea d and zinc. Wet scrubber
installation s als o ar e relativel y ineffectiv e i n th e secondary
coppe r industry. Scrubber s ar e useful , mainl y fo r particles
large r tha n 1 micron , but th e meta l oxid e fume s generate d are
generall y submicro n i n size.
Particulat e emission s associate d wit h dryin g kiln s ca n be
similarl y controlled. Dryin g temperature s up t o 150° C (302°F)
produc e relativel y coo l exhaus t gases , requirin g no precooling
fo r contro l by fabri c filters.
Wir e burnin g generate s larg e amount s of particulate
matter , largel y unburne d combustibles. Thes e emission s ca n be
effectivel y controlle d by direct-flam e afterburners , wit h an
efficienc y of 90 percen t or bette r i f th e afterburne r combustion
temperatur e i s maintaine d abov e 1000° C (1832°F). I f the
insulatio n contain s chlorinate d organics , suc h as polyvinyl
chloride , hydroge n chlorid e gas wil l be generate d and wil l not be
controlle d by th e afterburner.
One sourc e of fugitiv e emission s i n secondar y smelter
operation s i s chargin g of scra p int o furnace s containin g molten
metals. Thi s ofte n occur s when th e scra p bein g processe d i s not
sufficientl y compacte d t o allo w a ful l charg e t o fi t int o the
furnac e prio r t o heating. The introductio n of additional
materia l ont o th e liqui d meta l surfac e produce s significant
amount s of volatil e and combustibl e material s and smoke, which
ca n escap e throug h th e chargin g door. Briquettin g th e charge
offer s a way t o avoi d fractiona l charges. When fractional
chargin g canno t be eliminated , fugitiv e emission s ar e reduce d by
turnin g of f th e furnac e burner s durin g charging. Thi s reduces
7-33
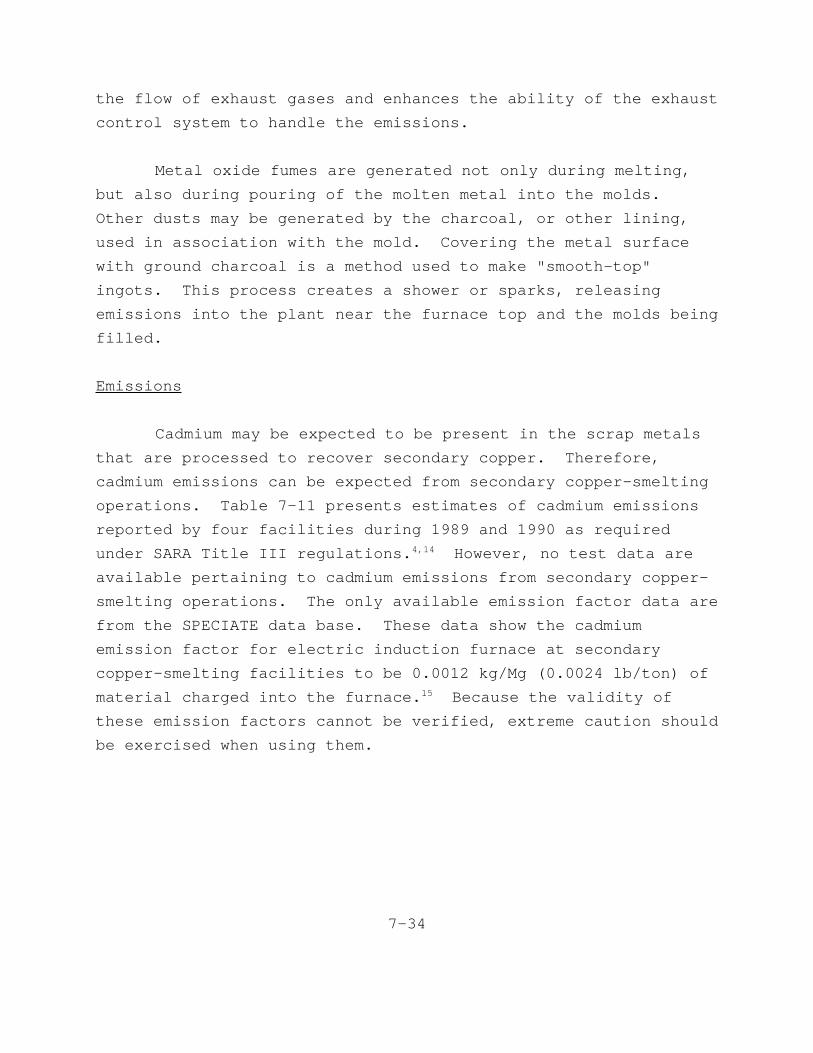
th e flo w of exhaus t gase s and enhance s th e abilit y of th e exhaust
contro l syste m t o handl e th e emissions.
Meta l oxid e fume s ar e generate d not onl y durin g melting,
but als o durin g pourin g of th e molte n meta l int o th e molds.
Othe r dust s may be generate d by th e charcoal , or othe r lining,
use d i n associatio n wit h th e mold. Coverin g th e meta l surface
wit h groun d charcoa l i s a metho d use d t o make "smooth-top"
ingots. Thi s proces s create s a shower or sparks , releasing
emission s int o th e plan t nea r th e furnac e to p and th e mold s being
filled.
Emissions
Cadmiu m may be expecte d t o be presen t i n th e scra p metals
tha t ar e processe d t o recove r secondar y copper. Therefore,
cadmiu m emission s ca n be expecte d fro m secondar y copper-smelting
operations. Tabl e 7-1 1 present s estimate s of cadmiu m emissions
reporte d by fou r facilitie s durin g 1989 and 1990 as required
unde r SARA Titl e II I regulations. 4,14 However , no tes t dat a are
availabl e pertainin g t o cadmiu m emission s fro m secondar y copper-
smeltin g operations. The onl y availabl e emissio n facto r dat a are
fro m th e SPECIATE dat a base. Thes e dat a sho w th e cadmium
emissio n facto r fo r electri c inductio n furnac e at secondary
copper-smeltin g facilitie s t o be 0.001 2 kg/M g (0.002 4 lb/ton ) of
materia l charge d int o th e furnace. 15 Becaus e th e validit y of
thes e emissio n factor s canno t be verified , extrem e cautio n should
be exercise d when usin g them.
7-34
SECONDARY ZIN C RECOVERY FROM METALLIC SCRAP
TABLE 7-11. SECONDARY COPPER PRODUCERS REPORTING CADMIUMEMISSIONS IN THE 1989 AND 1990 TOXICS RELEASE INVENTORY
Company Location Emissions, kg(lb)
Southwire Co. Carrolton, GA 57 (125)a
Franklin Smelting & Refining Philadelphia, PA 454 (1,000)b
Gaston Copper RecyclingIndustries
Gaston, SC 4.5 (10)b
Chemetco Sauget, IL 680 (1,496)b
SOURCE: References 4 and 14
aThe emission rate reported is for 1989.
bThe emission rate reported is for 1990.
The secondar y zin c industr y processe s obsolet e and scrap
material s t o recove r zin c as slabs , dust , and zin c oxide. 15
Tabl e 7-1 2 present s a lis t of U.S . facilitie s wher e zinc
currentl y i s recovere d fro m meta l scrap. Cadmiu m ca n be expected
t o be presen t i n th e metalli c scra p tha t i s processe d t o recover
zinc , and therefor e be emitte d as an ai r pollutan t during
differen t processin g steps. A descriptio n of th e proces s use d to
manufactur e zin c fro m metalli c scra p i s presente d below.
Proces s Description 15
Processin g involve s thre e operations: scra p pretreatment,
melting , and refining. Processe s typicall y use d i n each
operatio n ar e shown i n Figur e 7-6. Molte n produc t zin c may be
use d i n zin c galvanizing.
Scra p Pretreatment--
Pretreatmen t i s th e partia l remova l of meta l and other
contaminant s fro m scra p containin g zinc. Sweatin g separate s zinc
fro m high-meltin g metal s and contaminant s by meltin g th e zin c in
7-35

TABLE 7-12. DOMESTIC PRODUCERS OF SECONDARY ZINCFROM METALLIC SCRAP
Smelter Location1990 Production capacity, Mg
(tons)
Arco Alloys, Inc. Detroit, MI See footnote a
W.J. Bullock, Inc. Fairfield, AL See footnote a
T.L. Diamond & Co., Inc. Spelter, WV See footnote a
Florida Steel Co. Jackson, TN See footnote a
Gulf Reduction Corp. Houston, TX See footnote a
Hugo Neu-Proler Co. Terminal Island, CA See footnote a
Huron Valley Steel Corp. Belleville, MI See footnote a
Indiana Steel & Wire Co., Inc. Muncie, IN See footnote a
Interamerican Zinc Inc. Adrian, MI See footnote a
New England Smelting Works,Inc.
West Springfield, MA See footnote a
Nucor Yamato Steel Co. Blytheville, AR See footnote a
The River Smelting & RFG Co. Cleveland, OH See footnote a
Zinc Corp. of America Palmerton, PA See footnote a
Source: Reference 11.
aThe total zinc production capacity for all 13 plants is 58,000 Mg (63,800 tons).Individual capacity data are not available.
7-36
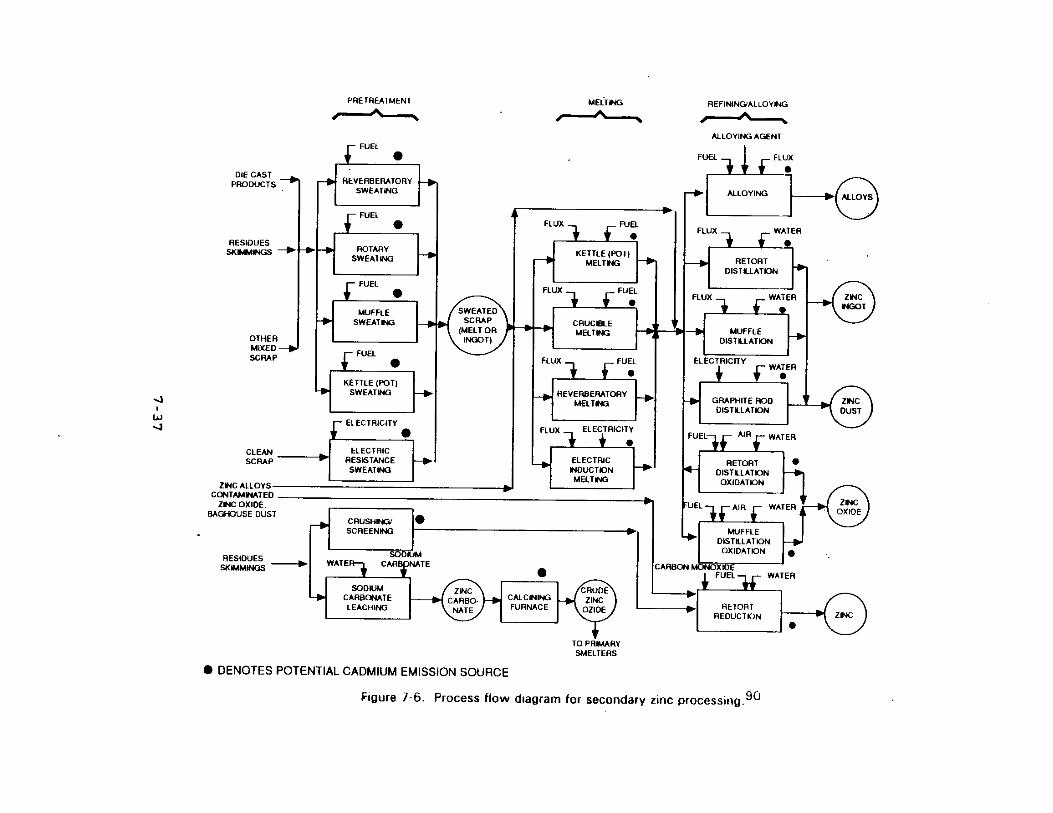

kettle , rotary , reverberatory , muffl e or electri c resistance
furnaces. Usually , th e produc t zin c the n i s directl y use d in
melting , refinin g or alloyin g processes. The high-melting
residu e i s periodicall y rake d fro m th e furnac e and further
processe d t o recove r zinc. Thes e residue s may be processe d by
crushing/screenin g t o recove r impur e zin c or by sodiu m carbonate
leachin g t o produc e zin c oxide. The temperatur e at whic h the
pretreatmen t take s plac e may be highl y variable , dependin g on the
typ e of scrap. I t i s believe d tha t th e temperatur e at whic h the
pretreatmen t take s plac e may be comparabl e t o tha t of primary
zin c operations. Therefore , th e pretreatmen t ste p may resul t in
cadmiu m emissions.
I n crushing/screening , zinc-bearin g residue s are
pulverize d or crushe d t o brea k th e physica l bond s between
metalli c zin c and contaminants. The impur e zin c i s then
separate d i n a screenin g or pneumati c classificatio n step.
I n sodiu m carbonat e leaching , th e zinc-bearin g residues
ar e converte d t o zin c oxide , whic h ca n be reduce d t o zin c metal.
They ar e crushe d and washed t o leac h out zin c fro m contaminants.
The aqueou s strea m i s the n treate d wit h sodiu m carbonate,
precipitatin g zin c as th e hydroxid e or carbonate. The
precipitat e i s the n drie d and calcine d t o conver t zin c hydroxide
int o crud e zin c oxide. The ZnO produc t i s usuall y refine d to
zin c at primar y zin c smelters.
Melting--
Zin c i s melte d at 425-590° C (797-1094°F ) i n kettle,
crucible , reverberatory , and electri c inductio n furnaces. Zinc
t o be melte d may be i n th e for m of ingots , rejec t castings,
flashin g or scrap. Ingots , rejects , and heav y scra p are
generall y melte d firs t t o provid e a molte n bat h t o whic h light
scra p and flashin g ar e added. Befor e pouring , a flu x i s added
7-38
and th e batc h agitate d t o separat e th e dros s tha t accumulates
durin g th e meltin g operation. The flu x float s th e dros s and
condition s i t so i t ca n be skimme d fro m th e surface. After
skimming , th e mel t ca n be poure d int o mold s or ladles. Any
residua l cadmiu m lef t ove r fro m th e pretreatmen t ste p may not be
emitte d durin g th e meltin g stag e becaus e th e meltin g take s place
at a much lowe r temperatur e tha n th e boilin g poin t of cadmium.
Refining/Alloying--
Additiona l processin g step s may involv e alloying,
distillation , distillatio n and oxidation , or reduction. Alloying
produce s mainl y zin c alloy s fro m pretreate d scrap. Ofte n the
alloyin g operatio n i s combine d wit h sweatin g or melting.
Distillatio n retort s and furnace s ar e use d t o reclai m zinc
fro m alloy s or t o refin e crud e zinc. Retor t distillatio n i s the
vaporizatio n at 980-1250° C (1796-2282°F ) of elementa l zin c with
it s subsequen t condensatio n as zin c dus t or liqui d zinc. Rapid
coolin g of th e vapo r strea m belo w th e zin c meltin g poin t produces
zin c dust , whic h ca n be remove d fro m th e condense r and packaged.
I f sla b zin c i s th e desire d product , th e vapor s ar e condensed
slowl y at a highe r temperature. The resultan t mel t i s cas t into
ingot s or slabs. Muffl e distillatio n furnace s produce
principall y zin c ingots , and graphit e ro d resistanc e distillation
produce s zin c dust. Becaus e th e distillatio n take s plac e at
temperature s highe r tha n th e boilin g poin t of cadmiu m (767°C
[1413°F]) , cadmiu m may potentiall y be emitte d durin g the
distillatio n step.
Retor t and muffl e furnac e distillatio n and oxidation
processe s produc e zin c oxid e dust. Thes e processe s ar e similar
t o distillatio n throug h th e vaporizatio n step. I n contrast , for
distillation/oxidation , th e condense r i s omitted , and th e zinc
vapo r i s discharge d directl y int o an ai r strea m leadin g t o a
7-39
refractory-line d combustio n chamber. Exces s ai r i s adde d to
complet e oxidatio n and t o coo l th e product. The zin c oxide
produc t i s usuall y collecte d i n a fabri c filter.
I n retor t reduction , zin c meta l i s produce d by the
reactio n of carbo n monoxid e and zin c oxid e t o yiel d zin c and
carbo n dioxide. Carbo n monoxid e i s supplie d by th e partial
oxidatio n of th e coke. The zin c i s recovere d by condensation.
Zin c Galvanizing--
Zin c galvanizin g i s th e coatin g of clea n oxid e fre e iron
or stee l wit h a thi n laye r of zin c by immersio n i n molte n zinc.
The galvanizin g occur s i n a va t or i n di p tank s containin g molten
zin c and cove r flux.
Emissio n Contro l Measures 15
Emission s fro m seatin g and meltin g operation s consist
principall y of particulates , zin c fumes , othe r volatil e metals,
flu x fumes , and smoke generate d by th e incomplet e combustio n of
grease , rubbe r and plastic s i n th e zinc-bearin g fee d material.
Zin c fume s ar e negligibl e at lo w furnac e temperatures , fo r they
hav e a lo w vapo r pressur e eve n at 480° C (896°F). Wit h elevated
temperatures , however , heav y fumin g ca n result. Flu x emissions
ar e minimize d by th e us e of a nonfumin g flux. Substantial
emission s may aris e fro m incomplet e combustio n of carbonaceous
materia l i n th e zin c scrap. Thes e contaminant s ar e usually
controlle d by afterburners. Furthe r emission s ar e th e products
of combustio n of th e furnac e fuel. Sinc e th e furnac e fue l is
usuall y natura l gas , thes e emission s ar e minor. I n reverberatory
furnaces , th e product s of fue l combustio n ar e emitte d wit h the
othe r emissions. Othe r furnace s emi t th e fue l combustion
product s as a separat e emissio n stream.
7-40
Particulate s fro m sweatin g and meltin g ar e mainl y hydrated
zin c chlorid e (ZnCl 2) and ZnO, wit h smal l amount s of carbonaceous
material. Thes e particulate s als o contai n Cu, Cd, maganese (Mn),
and chromiu m (Cr).
Fabri c filter s ar e most commonl y use d t o recover
particulat e emission s fro m sweatin g and melting. I n one
applicatio n on a muffle-sweatin g furnace , a cyclon e and fabric
filte r achieve d particulat e recover y efficiencie s i n exces s of
99. 7 percent. I n anothe r applicatio n on a reverberator y sweating
furnace , a fabri c filte r remove d 96. 3 percen t of the
particulates , reducin g th e dus t loadin g fro m 0.51 3 g/Nm3 to
0.0 2 g/Nm3. Fabri c filter s sho w simila r efficiencie s i n removing
particulate s fro m exhaus t gase s of meltin g furnaces.
Crushin g and screenin g operation s als o ar e source s of dust
emissions. Thes e particulate s ar e compose d of Zn, Al , Cu, Fe,
lea d (Pb) , Cd, ti n (Sn) , and Cr , and the y ca n be recovere d from
hoode d exhaust s by fabri c filters.
The sodiu m carbonat e leachin g proces s produce s particulate
emission s of ZnO dus t durin g th e calcinin g operation. Thi s dust
ca n be recovere d i n fabri c filters , althoug h ZnCl 2 i n th e dust
may caus e pluggin g problems.
Emission s fro m refinin g operation s ar e mainl y metallic
fumes. Thes e fume and dus t particle s ar e quit e small , wit h sizes
rangin g fro m 0.05- 1 µ. Distillation/oxidatio n operation s emit
thei r entir e ZnO produc t i n th e exhaus t gas. The ZnO has a very
smal l particl e siz e (0.0 3 t o 0. 5 µ) and i s recovere d i n fabric
filter s wit h typica l collectio n efficiencie s of 98 t o 99 percent.
7-41

Some emission s of zin c oxid e occu r durin g galvanizing , but
thes e emission s ar e smal l becaus e of th e bat h flu x cove r and the
relativel y lo w temperatur e maintaine d i n th e bath.
Emissions
Cadmiu m may be expecte d t o be presen t i n th e scra p metals
tha t ar e processe d t o recove r zinc. Therefore , cadmiu m emissions
ca n be expecte d fro m secondar y zin c recover y operations. One
secondar y smelte r reporte d a cadmiu m emissio n rat e of 588 lb/yr
durin g th e yea r 1989. 14 However , no tes t dat a ar e available
pertainin g t o cadmiu m emission s fro m secondar y zin c recovery
operations. The onl y availabl e emissio n facto r dat a ar e fro m the
SPECIATE dat a base. Tabl e 7-1 3 present s cadmiu m emissio n factors
fo r variou s emissio n point s at secondar y zinc-smeltin g facilities
as reporte d i n th e SPECIATE dat a base. 5 Becaus e th e validit y of
thes e emissio n factor s canno t be verified , extrem e cautio n should
be exercise d when usin g them.
SECONDARY ZIN C RECOVERY FROM STEEL PRODUCTION
Zin c als o i s recovere d fro m electri c ar c furnac e (EAF)
dus t generate d at iro n and stee l manufacturin g facilities. A
stud y carrie d out i n May 1985 by th e Cente r fo r Metal s Production
estimate d tha t approximatel y 14. 5 percen t of EAF dus t is
processe d fo r zin c recovery. One dat a sourc e has reporte d that
cadmiu m conten t i n th e EAF dus t i s approximatel y 0.0 5 percent.
Thus , cadmiu m ca n potentiall y be emitte d durin g th e proces s of
recoverin g zin c fro m EAF dust. 16
Tabl e 7-1 4 contain s a lis t of facilitie s i n th e U.S . that
ar e capabl e of producin g EAF dust. 11 Of thes e facilities , only
tw o actuall y recove r zinc. 17 A descriptio n of th e processe s used
t o recove r zin c fro m EAF dus t i s presente d below.
7-42
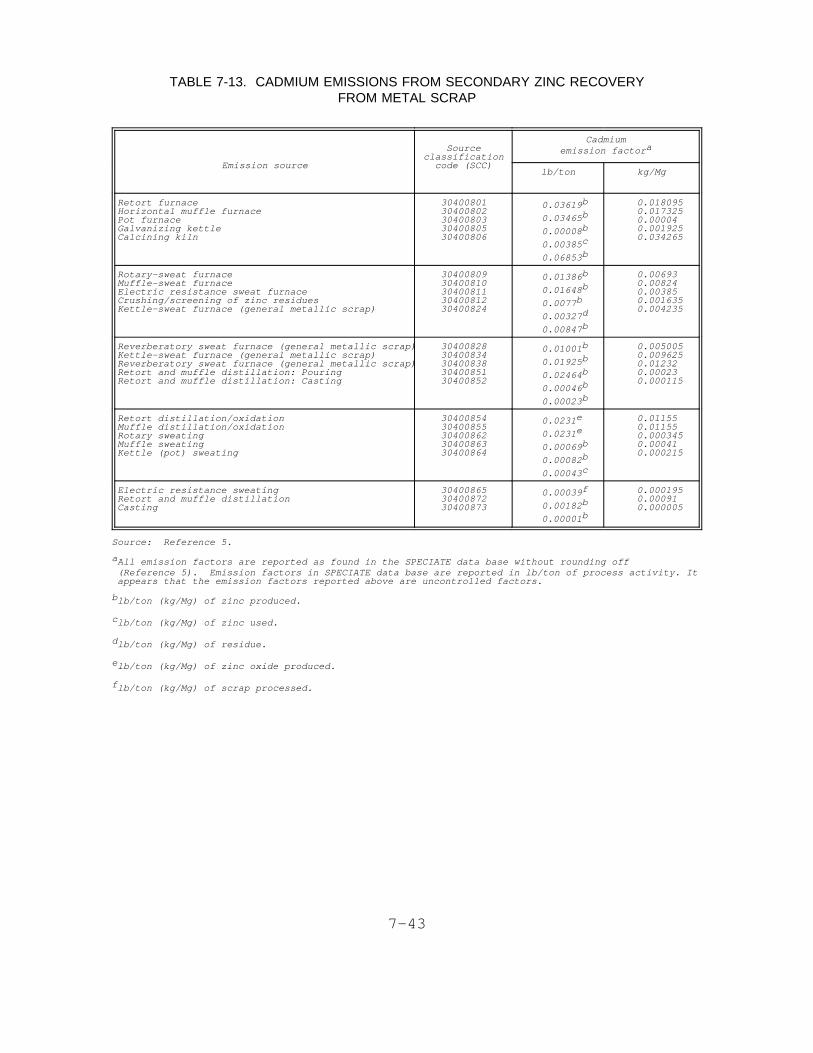
TABLE 7-13. CADMIUM EMISSIONS FROM SECONDARY ZINC RECOVERYFROM METAL SCRAP
Emission source
Sourceclassification
code (SCC)
Cadmiumemission factor a
lb/ton kg/Mg
Retort furnaceHorizontal muffle furnacePot furnaceGalvanizing kettleCalcining kiln
3040080130400802304008033040080530400806
0.03619 b
0.03465 b
0.00008 b
0.00385 c
0.06853 b
0.0180950.0173250.000040.0019250.034265
Rotary-sweat furnaceMuffle-sweat furnaceElectric resistance sweat furnaceCrushing/screening of zinc residuesKettle-sweat furnace (general metallic scrap)
3040080930400810304008113040081230400824
0.01386 b
0.01648 b
0.0077 b
0.00327 d
0.00847 b
0.006930.008240.003850.0016350.004235
Reverberatory sweat furnace (general metallic scrap)Kettle-sweat furnace (general metallic scrap)Reverberatory sweat furnace (general metallic scrap)Retort and muffle distillation: PouringRetort and muffle distillation: Casting
3040082830400834304008383040085130400852
0.01001 b
0.01925 b
0.02464 b
0.00046 b
0.00023 b
0.0050050.0096250.012320.000230.000115
Retort distillation/oxidationMuffle distillation/oxidationRotary sweatingMuffle sweatingKettle (pot) sweating
3040085430400855304008623040086330400864
0.0231 e
0.0231 e
0.00069 b
0.00082 b
0.00043 c
0.011550.011550.0003450.000410.000215
Electric resistance sweatingRetort and muffle distillationCasting
304008653040087230400873
0.00039 f
0.00182 b
0.00001 b
0.0001950.000910.000005
Source: Reference 5.
aAll emission factors are reported as found in the SPECIATE data base without rounding off(Reference 5). Emission factors in SPECIATE data base are reported in lb/ton of process activity. Itappears that the emission factors reported above are uncontrolled factors.
blb/ton (kg/Mg) of zinc produced.
clb/ton (kg/Mg) of zinc used.
dlb/ton (kg/Mg) of residue.
elb/ton (kg/Mg) of zinc oxide produced.
f lb/ton (kg/Mg) of scrap processed.
7-43
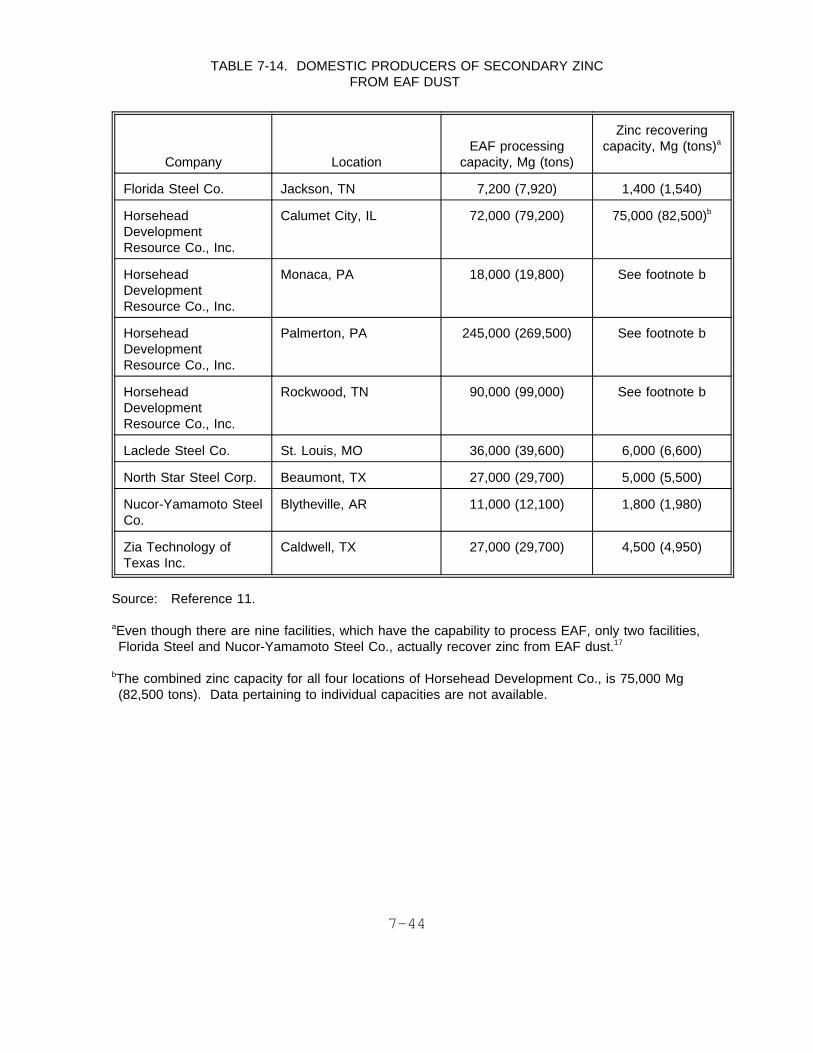
TABLE 7-14. DOMESTIC PRODUCERS OF SECONDARY ZINCFROM EAF DUST
Company LocationEAF processing
capacity, Mg (tons)
Zinc recoveringcapacity, Mg (tons)a
Florida Steel Co. Jackson, TN 7,200 (7,920) 1,400 (1,540)
HorseheadDevelopmentResource Co., Inc.
Calumet City, IL 72,000 (79,200) 75,000 (82,500)b
HorseheadDevelopmentResource Co., Inc.
Monaca, PA 18,000 (19,800) See footnote b
HorseheadDevelopmentResource Co., Inc.
Palmerton, PA 245,000 (269,500) See footnote b
HorseheadDevelopmentResource Co., Inc.
Rockwood, TN 90,000 (99,000) See footnote b
Laclede Steel Co. St. Louis, MO 36,000 (39,600) 6,000 (6,600)
North Star Steel Corp. Beaumont, TX 27,000 (29,700) 5,000 (5,500)
Nucor-Yamamoto SteelCo.
Blytheville, AR 11,000 (12,100) 1,800 (1,980)
Zia Technology ofTexas Inc.
Caldwell, TX 27,000 (29,700) 4,500 (4,950)
Source: Reference 11.
aEven though there are nine facilities, which have the capability to process EAF, only two facilities,Florida Steel and Nucor-Yamamoto Steel Co., actually recover zinc from EAF dust.17
bThe combined zinc capacity for all four locations of Horsehead Development Co., is 75,000 Mg(82,500 tons). Data pertaining to individual capacities are not available.
7-44
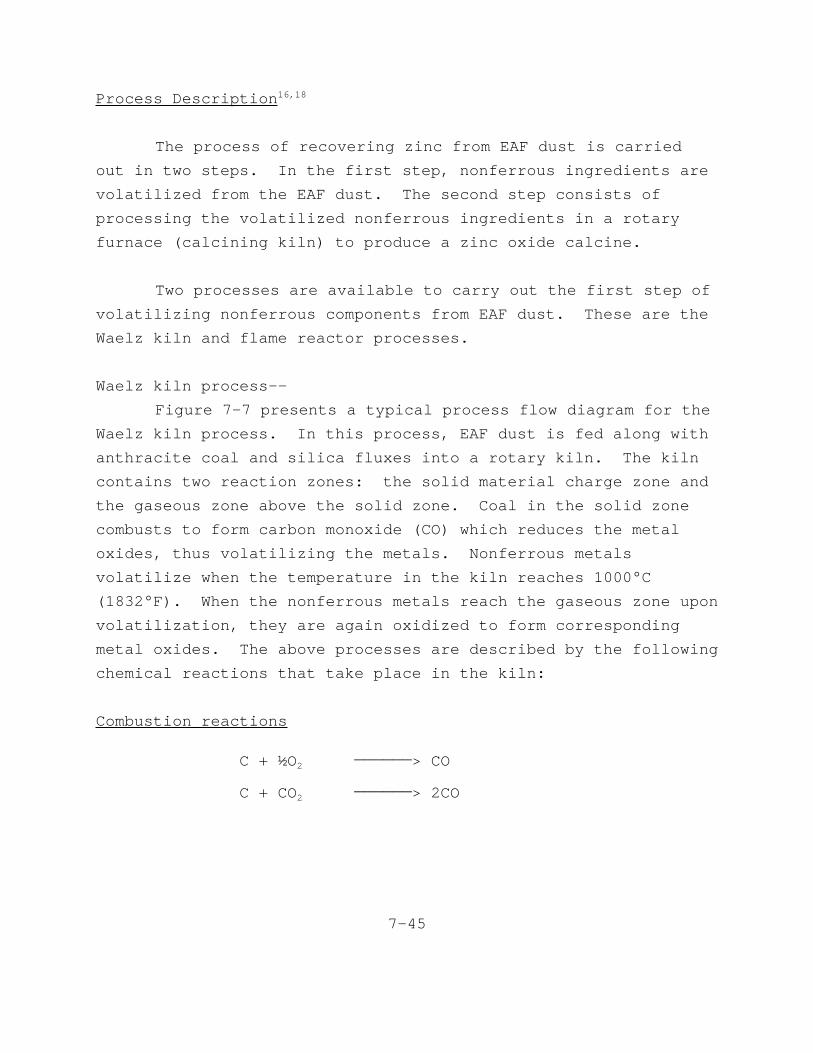
Proces s Description 16,18
The proces s of recoverin g zin c fro m EAF dus t i s carried
out i n tw o steps. I n th e firs t step , nonferrou s ingredient s are
volatilize d fro m th e EAF dust. The secon d ste p consist s of
processin g th e volatilize d nonferrou s ingredient s i n a rotary
furnac e (calcinin g kiln ) t o produc e a zin c oxid e calcine.
Two processe s ar e availabl e t o carr y out th e firs t ste p of
volatilizin g nonferrou s component s fro m EAF dust. Thes e ar e the
Waelz kil n and flam e reacto r processes.
Waelz kil n process--
Figur e 7- 7 present s a typica l proces s flo w diagra m fo r the
Waelz kil n process. I n thi s process , EAF dus t i s fe d alon g with
anthracit e coa l and silic a fluxe s int o a rotar y kiln. The kiln
contain s tw o reactio n zones: th e soli d materia l charg e zon e and
th e gaseou s zon e abov e th e soli d zone. Coal i n th e soli d zone
combust s t o for m carbo n monoxid e (CO) whic h reduce s th e metal
oxides , thu s volatilizin g th e metals. Nonferrou s metals
volatiliz e when th e temperatur e i n th e kil n reache s 1000°C
(1832°F). When th e nonferrou s metal s reac h th e gaseou s zon e upon
volatilization , the y ar e agai n oxidize d t o for m corresponding
meta l oxides. The abov e processe s ar e describe d by th e following
chemica l reaction s tha t tak e plac e i n th e kiln:
Combustio n reactions
C + ½O2______ > CO
C + CO2______ > 2CO
7-45


Reductio n reactions
Fe3O4 + CO ______ > 3FeO + CO2
ZnO + CO ______ > Zn + CO2
CdO + CO ______ > Cd + CO2
Oxidatio n reactions
CO + ½O2______ > CO2
Zn + ½O2______ > ZnO
Cd + ½O2______ > CdO
ZnO Calcin e Formation--
The nonferrou s meta l oxid e produc t forme d by ZnO calcine
formatio n i s capture d i n a fabri c filte r and subsequently
processe d i n a natura l gas-fire d calcinin g kil n t o for m zinc
calcine. Figur e 7- 7 als o present s a typica l proces s flo w diagram
fo r th e calcinin g kil n operation. I n th e calcinin g kiln , the
nonferrou s meta l oxide s ar e introduce d withou t any additives , and
selectiv e volatilizatio n i s carrie d out t o separat e cadmium,
lead , chlorine , and fluorine. The volatilize d materia l is
collecte d i n a fabri c filter. Zin c originall y presen t i n the
for m of ZnO i s recovere d unaltere d as residu e fro m th e calcining
kiln. The ZnO ca n subsequentl y be processe d by electrothermic
proces s t o recove r zinc.
Flam e Reacto r Process--
Figur e 7- 8 present s a flo w diagra m fo r th e flam e reactor
proces s use d t o volatiliz e nonferrou s metal s fro m dust. This
proces s i s an alternativ e metho d fo r th e Waelz kil n process. In
th e flam e reacto r process , EAF dus t i s fe d int o a water-cooled,
natura l gas-fire d reactor. The combustio n ai r i s enriche d with
oxyge n raisin g th e oxyge n conten t t o a leve l betwee n 40 and
80 percent. Flam e temperature s up t o 2200° C (3992°F ) ca n be
obtaine d thi s way. As th e EAF dus t i s introduce d int o th e hot
7-47
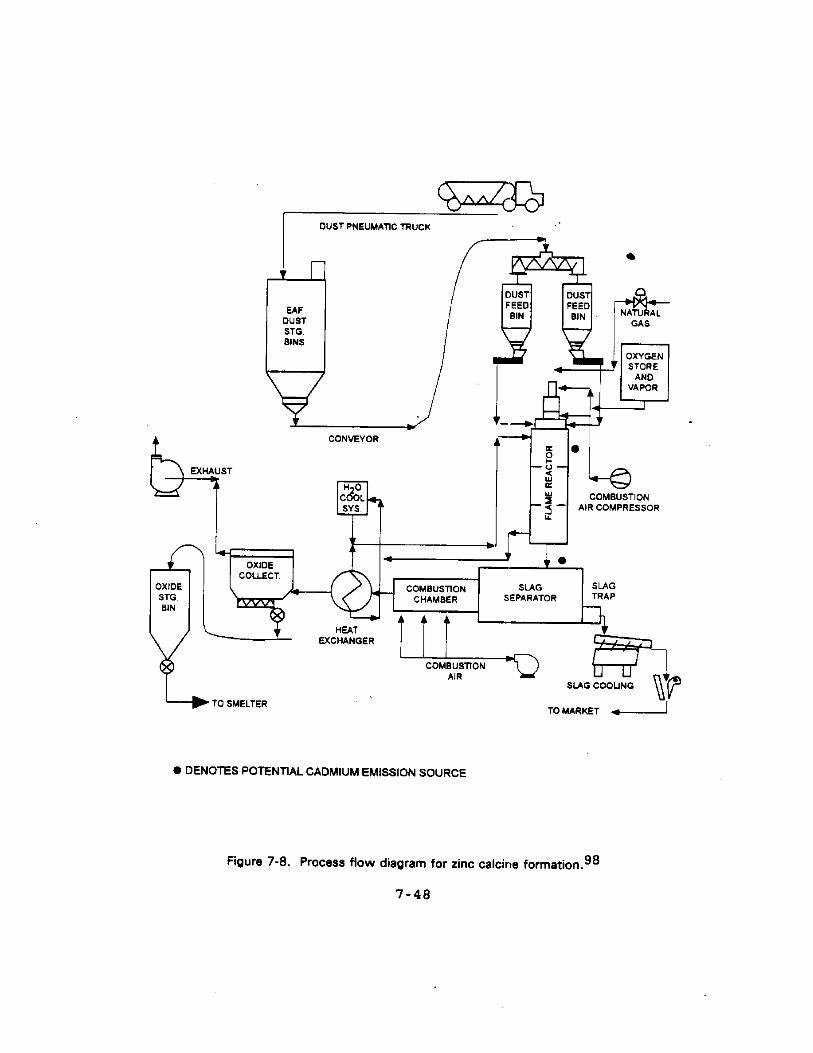
gase s and temperature s reac h 1600° C (2912°F) , refractory
compounds presen t i n th e dus t fus e t o for m molte n slag. The
molte n sla g and th e combustio n gase s ar e conveye d int o a slag
converto r wher e iron-ric h sla g i s continuousl y tapped. The
offgase s exitin g th e separato r ar e oxidize d furthe r t o form
metalli c (nonferrous ) oxides , whic h ar e recovere d i n a fabric
filte r and shippe d as feedstoc k t o zinc-smeltin g facilities.
Emissio n Contro l Measures 16,18
Emission s resultin g fro m processin g of EAF dus t chiefly
consis t of particulat e matte r made up of nonferrou s metallic
oxide s (includin g cadmiu m oxide) , whic h ar e recovere d i n a fabric
filter. The fabri c filte r i s use d more as a produc t recovery
devic e tha n a contro l device.
Emissions 18
Dat a pertainin g t o cadmiu m emission s fro m EAF dust
processin g ar e limited. One sourc e has reporte d a cadmium
emissio n rat e of 5.0 4 x 10⁻⁴ lb/h r measure d at th e outle t of a
fabri c filte r servicin g a flam e reactor , whic h correspond s t o a
EAF dus t processin g rat e of 40 lb/mi n (1. 2 tons/hr). This
result s i n a cadmiu m emissio n facto r of 2. 1 x 10⁻⁴ kg/Mg
(4. 2 x 10⁻⁴ lb/ton ) of EAF dus t processed. No othe r details
pertainin g t o th e tes t ar e available. Therefore , th e validit y of
thi s cadmiu m emissio n facto r canno t be verified. The cadmium
emissio n facto r must be use d wit h extrem e caution.
7-49

REFERENCES
1. Emissio n Standard s Division. Cadmiu m Emission s fromPrimar y Lead and Primar y Copper Smelting--Phas e ITechnica l Report. EPA-450/3-88-006. Offic e of AirQualit y Plannin g and Standards , U.S . EnvironmentalProtectio n Agency , Researc h Triangl e Park , NC. Jun e 1988.p. 5.
2. Woodbury , W.D. Lead--Annua l Repor t 1990. Burea u of Mines,U.S . Departmen t of th e Interior , U.S . Governmen t PrintingOffice , Washington , DC. Apri l 1992.
3. Compilatio n of Ai r Pollutio n Emissio n Factors , Volum e I:Stationar y Poin t and Are a Source s (AP-42) , Fourt h Edition.U. S. Environmenta l Protectio n Agency. Researc h TrianglePark , NC. Pp. 7.6- 1 - 7.6-15.
4. U. S. Environmenta l Protectio n Agency. 1990 ToxicChemica l Releas e Inventory. Offic e of Toxi c Substances,Washington , DC., Januar y 1993.
5. SPECIATE. Volatil e Organi c Compound (VOC)/ParticulateMatte r (PM) Speciatio n Dat a System , Versio n 1.4. Officeof Ai r and Radiation. Offic e of Ai r Qualit y Plannin g andStandards , U.S . Environmenta l Protectio n Agency , ResearchTriangl e Park , NC. Octobe r 1991.
6. Referenc e 1, p. 9.
7. Telefa x fro m Jolly , J. Burea u of Mines , U.S . Departmentof th e Interior , Washington , DC. Januar y 23, 1993.Capacitie s of U.S . coppe r smelters.
8. Referenc e 5, Pp. 7.3- 1 - 7.3-18.
9. TRC Environmenta l Corporation. Emissio n CharacterizationProgram. Prepare d fo r Copper Range Company, Whit e Pine,Michigan. Octobe r 15, 1992.
10. Referenc e 3, Pp. 7.7- 1 - 7.7-8.
11. Telefa x fro m Jolly , J. Burea u of Mines , U.S . Departmentof th e Interior , Washington , DC. Februar y 10, 1993.Capacitie s of U.S . zin c smelters.
12. Zinc/Zin c Oxid e Preliminar y Sourc e Assessment.EPA-450/3-87-008. Offic e of Ai r Qualit y Plannin g andStandards , U.S . Environmenta l Protectio n Agency , ResearchTriangl e Park , NC. Apri l 1987. Pp. 1-10-1-11.
7-50
13. Referenc e 3, Pp. 7.9- 1 - 7.9-6.
14. U. S. Environmenta l Protectio n Agency. 1989 ToxicChemica l Releas e Inventory. Offic e of Toxi c Substances,Washington , DC. Januar y 1993.
15. Referenc e 3. Pp. 7.14- 1 - 7.14-8.
16. James, S. E. , and C. O. Bounds. Recyclin g Lead andCadmium, As Well As Zinc , fro m EAF Dust. (In ) Lead-Zinc,’90 , Proc . Worl d Symp. Metall . Environ . Contro l 119 th TMSAnnu. Meet. T. S. Mackey and R. D. Prengaman , eds.Miner . Met . Mater . Soc. , Warrendale , PA. 1990.Pp. 477-495.
17. Telecon. Kalagnanam , R.S. , Midwes t Researc h Institute,wit h J.H . Jolly . Burea u of Mines , U.S . Departmen t of theInterior . Februar y 10, 1993. U.S . processor s of EAF dust.
18. Bounds , C. O. , and J. F. Pusateri. EAF Dust Processin g inth e Gas-Fire d Flam e Reacto r Process. (In ) Lead-Zinc , ’90,Proc . Worl d Symp. Metall . Environ . Contro l 119 th TMS Annu.Meet. T. S. Mackey and R. D. Prengaman , eds. Miner . Met.Mater . Soc. , Warrendale , PA. 1990. Pp. 511-528.
7-51

SECTION 8
EMISSIONS FROM MISCELLANEOUS SOURCES
Cadmiu m i s presen t i n minerals , ores , and crude s extracted
fro m th e eart h and thes e material s ar e use d i n several
manufacturin g processes. Thes e manufacturin g processe s ca n be
potentia l cadmiu m emissio n source s i f the y us e cadmiu m containing
material s i n therma l treatmen t steps. The manufacturing
processe s describe d i n thi s sectio n are : iro n and steel
production , Portlan d cement manufacture , phosphat e rock
processing , carbo n blac k production , and mobil e sources. This
sectio n present s proces s informatio n and emissio n control
measures , and estimate s of cadmiu m emission s fro m eac h of these
sources.
IRON AND STEEL PRODUCTION1
Two type s of iro n and stee l plant s wil l be discusse d in
thi s section: integrate d and nonintegrated. Becaus e cadmiu m can
be presen t as a trac e contaminan t i n proces s fee d material s such
as coal , iro n ore , and scra p metal , proces s operation s i n both
plan t type s ar e potentia l cadmiu m emissio n sources.
Integrate d iro n and stee l plant s ar e thos e iro n and
steelmakin g facilitie s tha t ar e capabl e of startin g wit h iro n ore
as a ra w materia l fee d and producin g finishe d stee l products. At
a minimum , thes e facilitie s hav e blas t furnac e facilitie s fo r pig
iro n production ; steelmakin g furnace s (generall y one or more
basi c oxyge n furnaces) , and stee l finishin g operations. Many
8-1
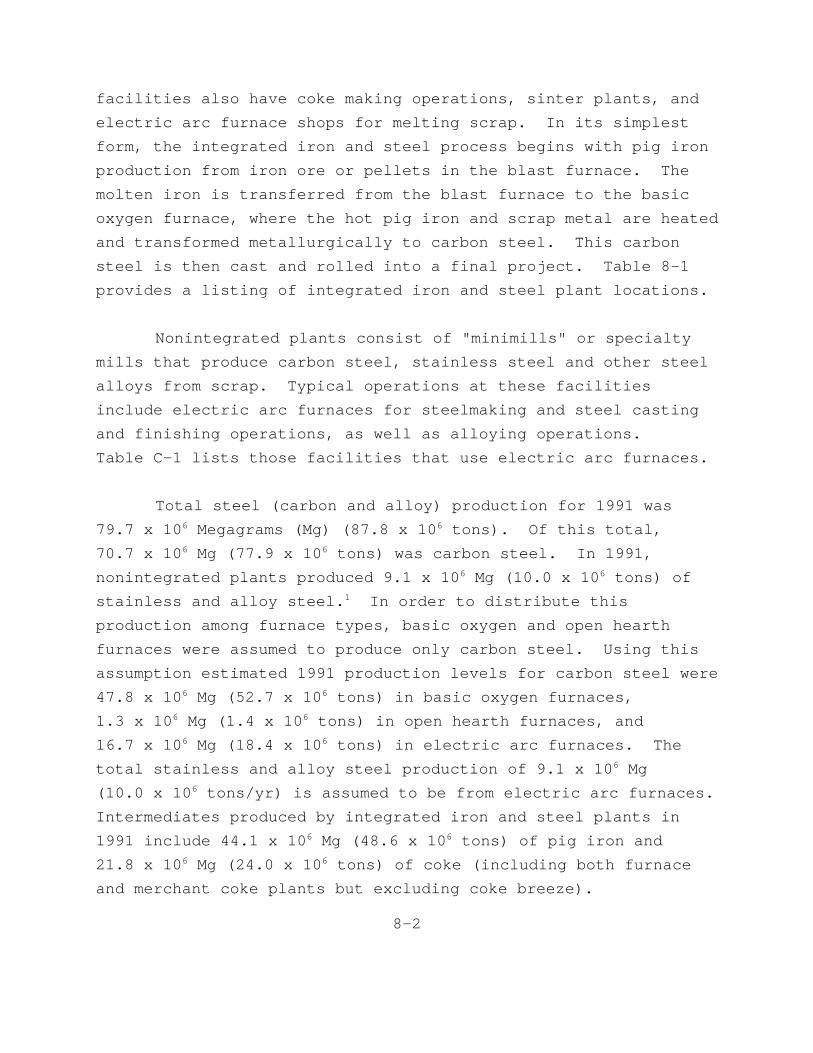
facilitie s als o hav e cok e makin g operations , sinte r plants , and
electri c ar c furnac e shop s fo r meltin g scrap. I n it s simplest
form , th e integrate d iro n and stee l proces s begin s wit h pi g iron
productio n fro m iro n or e or pellet s i n th e blas t furnace. The
molte n iro n i s transferre d fro m th e blas t furnac e t o th e basic
oxyge n furnace , wher e th e hot pi g iro n and scra p meta l ar e heated
and transforme d metallurgicall y t o carbo n steel. Thi s carbon
stee l i s the n cas t and rolle d int o a fina l project. Tabl e 8-1
provide s a listin g of integrate d iro n and stee l plan t locations.
Nonintegrate d plant s consis t of "minimills " or specialty
mill s tha t produc e carbo n steel , stainles s stee l and othe r steel
alloy s fro m scrap. Typica l operation s at thes e facilities
includ e electri c ar c furnace s fo r steelmakin g and stee l casting
and finishin g operations , as wel l as alloyin g operations.
Tabl e C- 1 list s thos e facilitie s tha t us e electri c ar c furnaces.
Tota l stee l (carbo n and alloy ) productio n fo r 1991 was
79. 7 x 10⁶ Megagrams (Mg) (87. 8 x 10⁶ tons). Of thi s total,
70. 7 x 10⁶ Mg (77. 9 x 10⁶ tons ) was carbo n steel. I n 1991,
nonintegrate d plant s produce d 9. 1 x 10⁶ Mg (10. 0 x 106 tons ) of
stainles s and allo y steel. 1 I n orde r t o distribut e this
productio n among furnac e types , basi c oxyge n and open hearth
furnace s wer e assumed t o produc e onl y carbo n steel. Usin g this
assumptio n estimate d 1991 productio n level s fo r carbo n stee l were
47. 8 x 10⁶ Mg (52. 7 x 10⁶ tons ) i n basi c oxyge n furnaces,
1. 3 x 10⁶ Mg (1. 4 x 10⁶ tons ) i n open heart h furnaces , and
16. 7 x 10⁶ Mg (18. 4 x 10⁶ tons ) i n electri c ar c furnaces. The
tota l stainles s and allo y stee l productio n of 9. 1 x 10⁶ Mg
(10. 0 x 106 tons/yr ) i s assumed t o be fro m electri c ar c furnaces.
Intermediate s produce d by integrate d iro n and stee l plant s in
1991 includ e 44. 1 x 10⁶ Mg (48. 6 x 10⁶ tons ) of pi g iro n and
21. 8 x 10⁶ Mg (24. 0 x 106 tons ) of cok e (includin g bot h furnace
and merchan t cok e plant s but excludin g cok e breeze).
8-2

TABLE 8-1. INTEGRATED IRON AND STEEL PLANTS
Company Facility City and State
No. ofbasic
oxygenfurnaces
No. ofblast
furnaces
Acme Steel CompanyAcme Steel CompanyAllegheny Ludlum Corp.Armco Steel Company, L.P. a
Armco Steel Company, L.P. a
Chicago PlantRiverdale WorksBrankenridge WorksAshland WorksHamilton Plant
Chicago, ILRiverdale, ILNatrona, PAAshland, KYHamilton, OH
2222-
21122
Armco Steel Company, L.P.Bethlehem Steel Corp.Bethlehem Steel Corp. a
Bethlehem Steel Corp. a
Geneva Steel Company a
Middletown WorksBethlehem PlantBurns Harbor PlantSparrows Pt. PlantGeneva Works
Middletown, OHBethlehem, PABurns Harbor, INSparrows Pt., MDOrem, UT
22321
24233
Gulf States Steel a
Inland Steel Company b
LTV Steel Flat Rolled & Bar Co.LTV Steel Flat Rolled & Bar Co. a
LTV Steel
Gadsen WorksCleveland WorksIndiana Harbor WorksLTV Stills
Gadsen, ALEast Chicago, INCleveland, OHEast Chicago, INChicago, IL
24421
19521
McLouth SteelNational Steel CorporationNational Steel CorporationRouge Steel CompanySharon Steel, Incorporated
Trenton WorksGranite City SteelGreat Lakes SteelRouge WorksFarrell Works
Trenton, MIGranite City, ILEcorse, MIDearborn, MIFarrell, PA
52222
22321
Sharon Steel, IncorporatedU.S. Steel Corporation (USX)U.S. Steel Corporation (USX)U.S. Steel Corporation (USX)U.S. Steel Corporation (USX) a
Monessen, Inc.Edgar Thomson PlantFairfield WorksFairless WorksGary Works
Sharon, PABraddock, PAFairfield, ALFairless Hills, PAGary, IN
-2316
12125
USS/Kobe Steel CompanyWarren Consolidated Inc.Weirton Steel Company a
Wheeling-Pittsburgh Steel Corp.Wheeling-Pittsburgh Steel Corp. c
Warren FacilityWeirton WorksSteubenville Plant, NSteubenville Plant, S
Lorain, OHWarren, OHWeirton, WVSteubenville, OHMingo Junction, OH
22221
41422
TOTAL 65 74
Source: Reference 2.
aAlso has a sinter plant at this location.
bHas a sinter plant at the Indiana Harbor Works facility.
cHas a sinter plant at the Follansbee Plant, Follansbee, WV.
8-3

Proces s Description
Figur e 8- 1 provide s a flo w diagra m fo r iro n and steel
production. The principa l component s of th e proces s ar e iron
production , steelmaking , and stee l finishing. However , two
importan t ancillar y component s ar e cok e makin g and sinter
production. The proces s step s discusse d belo w appl y t o an
integrate d plant. Proces s difference s wil l be note d for
nonintegrate d plants.
Frequently , th e firs t ste p i n th e proces s fo r an
integrate d plan t i s t o produc e metallurgica l cok e (elemental
carbon ) fo r th e blas t furnace. Coke i s use d to: (1 ) provid e a
substrat e fo r ra w material s i n th e blas t furnace , (2 ) functio n as
fue l fo r th e hot blas t air , and (3 ) remov e iro n or e oxides.
Tabl e 8- 2 list s th e cok e productio n capacitie s fo r batteries
locate d at or associate d circl e integrate d plants. Nonintegrated
plant s do not us e blas t furnace s and , therefore , do not need
coke. The cok e i s made fro m coa l tha t i s pulverize d and then
heate d i n a cok e ove n withou t oxyge n at 1050° C (1925°F ) fo r 12 to
20 hours. Volatile s ar e drive n off , and elementa l carbo n (coke)
and as h ar e formed. Becaus e cadmiu m i s a trac e contaminan t in
coal , ther e i s a potentia l fo r emission s when th e coa l i s heated.
Two type s of oven s (arrange d i n batteries ) ca n be used: a
slo t ove n and a nonrecover y oven. The slo t ove n proces s recovers
volatile s tha t ar e drive n of f durin g th e heatin g process , and
thes e volatile s ar e refine d t o produc e coke-ove n gas , tar,
sulfur , ammonium sulfat e and ligh t oil. Becaus e most of the
volatil e material s generate d by th e ove n ar e cycle d through
recover y proces s wit h organi c condensatio n steps , cadmium
emission s generate d by by-produc t cokemakin g facilitie s is
8-4
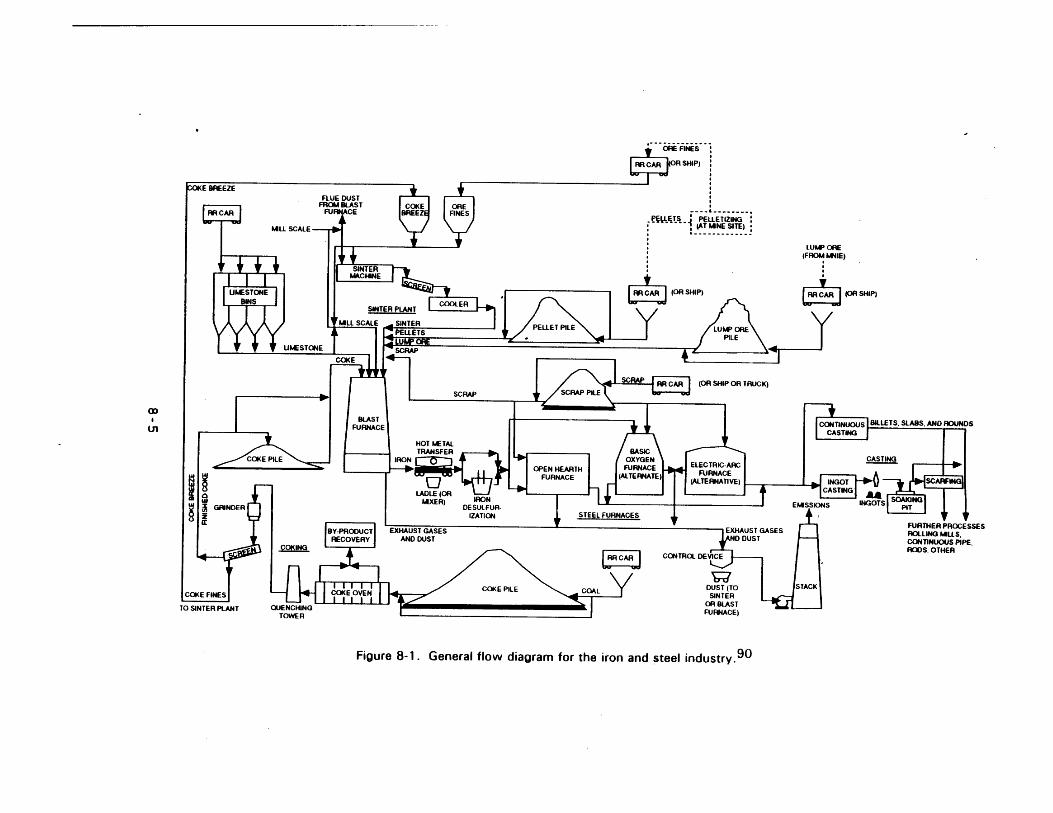
TABLE 8-2. COKE PRODUCTION CAPACITY FOR INTEGRATED IRON AND STEEL FACILITIESIN THE UNITED STATES IN 1991
Total capacity
Facility No. ofbatteries
Total No. ofovens
Megagramsper day
Tons perday
Acme Steel, Chicago, IL 2 100 1,626 1,600
Armco, Inc., Ashland, KY 2 146 2,743 2,700
Armco, Inc., Middleton, OH 3 203 4,608 4,535
Bethlehem Steel, Bethlehem, PA 3 284 4,007 3,944
Bethlehem Steel, Burns Harbor, IN 2 164 4,400 4,380
Bethlehem Steel, Lackawanna, NY 2 152 1,902 1,872
Bethlehem Steel, Sparrows Point, MD 3 210 4,134 4,069
Geneva Steel, Orem, UT 1 208 2,323 2,250
Gulf States Steel, Gadsden, AL 2 130 2,845 2,800
Inland Steel, East Chicago, IN 6 446 5,868 5,775
LTV Steel, Pittsburgh, PA 5 315 5,491 5,404
LTV Steel, Chicago, IL 1 60 1,626 1,600
LTV Steel, Cleveland, OH 2 126 3,251 3,200
LTV Steel, Warren, OH 1 85 1,524 1,500
National Steel, Granite City, IL 2 90 1,544 1,520
National Steel, Ecorse, MI 1 78 940 925
USS, Div. of USX Corp., Clairton, PA 12 816 12,843 12,640
USS, Div. of USX Corp., Gary, IN 6 422 7,249 7,135
Wheeling-Pittsburgh Steel, East Steubenville,WV 4 224 3,861 3,800
Total 60 4,259 72,835 71,649
SOURCE: Reference 5.
8-6

expecte d t o be negligible. However , nonrecover y oven s do not
recove r volatile s and instea d combust them. Thes e oven s may be a
sourc e of cadmiu m emissions.
Afte r th e cokin g cycl e i s complete , th e cok e i s quickly
coole d down by a quenchin g tower , t o preven t produc t los s via
combustion. Furthe r coolin g occur s afte r th e wate r i s drained
fro m th e coke , i t i s size d t o remov e th e undersize d material
(cok e breeze ) and transferre d t o storag e piles. Becaus e cadmium
may remai n as a trac e contaminan t i n th e coke , smal l quantities
of cadmiu m may be release d as fugitiv e emission s durin g these
handling , transfer , and storag e operations.
A secon d ancillar y proces s foun d at many integrate d plants
i s th e sinterin g operation. The sinterin g proces s i s a
materials-recover y process , whic h convert s fine-size d raw
materials , includin g iro n ore , cok e breeze , limestone , mill
scale , and flu e dust , int o an agglomerate d produc t called
"sinter." 4 Cadmiu m ca n be containe d i n th e iro n or e use d to
produc e sinte r and may be emitte d when th e sinte r mixtur e is
combusted. The ra w material s ar e place d on a continuous,
travellin g grat e calle d th e sinte r strand. A burne r hood , at the
beginnin g of th e sinte r strand , ignite s th e cok e i n th e mixture.
Combustio n ai r i s draw n down throug h th e materia l bed and int o a
common duc t leadin g t o a gas cleanin g device. The fuse d sinter
i s discharge d fro m th e sinte r stran d wher e i t i s crushe d and
screened. Undersize d sinte r i s recycle d t o th e mixin g mil l and
bac k t o th e strand. The remainin g sinte r produc t i s coole d in
th e open ai r or i n a circula r coole r wit h wate r spray s or
mechanica l fans.
The initia l proces s common t o al l integrate d plant s i s the
blas t furnace , whic h i s use d t o produc e molte n iro n ("pi g iron").
Iro n ore , coke , limeston e flu x and sinte r ar e introduced
8-7

("charged" ) int o th e to p of th e furnace. Heate d ai r i s injected
throug h th e botto m of th e furnace. Thi s blas t ai r combust s the
cok e containe d i n th e breez e t o mel t th e sinter , and flu x with
th e iro n oxide s i n th e or e and for m molte n iron , slag , and carbon
monoxid e (CO). The molte n iro n and th e sla g collec t i n the
heart h at th e bas e of th e furnac e and ar e periodicall y tapped.
The CO i s collecte d throug h offtake s at th e to p of th e furnace.
Becaus e th e iro n or e contain s trace s of cadmium , emission s are
possibl e as particulat e matte r (PM) entraine d i n th e CO.
However , thi s CO wil l be use d as fue l withi n th e plan t afte r it
i s cleane d of PM; consequently , cadmiu m emission s ar e expecte d to
be negligible.
The molte n iro n fro m th e blas t furnac e undergoes
desulfurization , afte r whic h i t i s introduce d t o a basi c oxygen
furnac e (BOF) or open heart h furnac e t o make steel. These
furnace s us e oxyge n as a refinin g agent. I n a BOF, th e raw
materia l i s typicall y 70-percen t molte n meta l and 30-percent
scra p metal. Again , cadmiu m may be presen t as a contaminan t in
th e scra p metal. The oxyge n react s wit h carbo n and other
impuritie s i n th e ra w materia l and remove s the m fro m th e molten
metal. Larg e quantitie s of carbo n monoxid e (CO) ar e produce d by
th e exothermi c reaction s i n th e BOF. Thes e gases , whic h may
contai n cadmium , frequentl y ar e burne d at th e mout h of the
furnac e t o oxidiz e CO. The gase s ar e the n vente d t o gas cleaning
device s befor e bein g discharge d t o th e atmosphere.
Ther e ar e tw o type s of BOF’s. Conventiona l BOF’s blow
oxyge n int o th e to p of th e furnac e throug h a water-coole d lance.
The newer Quell e Basi c Oxygen proces s (Q-BOP) furnace s inject
oxyge n throug h tuyeres , whic h ar e locate d i n th e botto m of the
furnace . Typica l cycle s involv e scra p charge , hot meta l charge,
oxyge n blo w (refining ) period , testin g fo r temperatur e and
chemica l compositio n of th e steel , allo y addition s and reblows
8-8
(i f necessary) , tapping , and slagging. The ful l furnac e cycle
typicall y range s fro m 25 t o 45 minutes.
The open-heart h furnac e (OHF) i s a shallow,
refractory-line d basi n i n whic h scra p and molte n iro n ar e melted
togethe r and the n refine d int o steel. The mixtur e of scra p and
hot meta l may consis t of eithe r al l scra p or al l hot metal , but a
half-and - hal f mixtur e of scra p and meta l i s common. Because
scra p i s used , ther e i s a potentia l fo r cadmiu m emissions;
however , no informatio n was availabl e t o evaluat e emissions
potential. Becaus e thes e furnace s hav e limite d us e and ar e being
eliminated , the y ar e not considere d a significan t cadmium
emissio n sources.
Nonintegrate d plant s us e electrica l ar c furnace s (EAF’s)
t o produc e carbo n and allo y steels. The ra w materia l fo r an EAF
i s typicall y 100 percen t scrap , whic h i s a sourc e fo r cadmium
emissions. Thes e furnace s ar e cylindrica l and refractory-lined.
They hav e carbo n electrode s tha t ar e raise d or lowere d through
th e furnac e roof. Wit h electrode s raised , th e furnac e roo f can
be moved asid e t o allo w scra p stee l t o be introduce d by an
overhea d crane. Alloyin g agent s and fluxin g material s are
usuall y adde d throug h th e door s on th e sid e of th e furnace. Heat
generate d by th e electrica l curren t passin g betwee n the
electrode s i s use d t o mel t th e scrap. Afte r meltin g and refining
periods , th e sla g and stee l ar e poure d fro m th e furnac e by
tilting. The productio n of stee l i n an EAF i s a batc h process.
Cycles , or "heats, " rang e fro m abou t 1 1/ 2 t o 5 hour s fo r carbon
stee l productio n and fro m 5 t o 10 hours , or more , fo r allo y steel
production. Becaus e cadmiu m may be containe d i n th e scra p metal
use d t o fee d EAF’s , the y ar e considere d t o be a potentia l source
of cadmiu m emissions.
8-9

Afte r productio n i n eithe r a BOF, OHF, or EAF, th e molten
stee l i s cas t int o mold s or i s continuousl y cas t t o for m a
finishe d product. Thi s fina l produc t consist s of shape s called
blooms , slabs , and billets. No cadmiu m emission s ar e expected
fro m thi s fina l proces s ste p fro m th e col d steel , becaus e cadmium
i s not expecte d t o be presen t i n th e molte n stee l product.
Emissio n Contro l Measures 2
Cadmiu m i s usuall y emitte d as fin e particulat e matte r from
hig h temperatur e operation s suc h as th e furnace s foun d i n the
iro n and stee l plants. 6 Cadmiu m emission s fro m iro n and steel
productio n ar e expecte d fro m furnaces , BOF’s , OHF’s , EAF’s,
sinterin g operations , and possibly , chargin g of by-produc t ovens
and nonrecover y cok e ove n operations. No specifi c dat a were
availabl e on cadmiu m contro l fro m iro n and stee l operations.
However , becaus e thes e processe s generat e primaril y fine
particles , th e cadmiu m contro l efficiencie s ar e assumed t o be
equivalen t t o th e overal l PM contro l efficiencie s for
electrostati c precipitators , hig h energ y scrubbers , and fabric
filter s applie d t o hig h temperatur e processes.
Informatio n availabl e on one nonrecover y ove n shows that
chargin g emission s ar e controlle d wit h a travellin g hood that
vent s t o a baghouse. 7 Tota l captur e efficienc y was estimate d at
70 percent , and cadmiu m was not detecte d i n th e baghous e samples.
The detectio n leve l was 0. 5 milligra m per kilogra m (mg/kg ) [parts
per millio n (ppm)]. 7 Therefore , i t ca n be assumed ther e ar e no
significan t cadmiu m emission s fro m nonrecover y cok e ovens.
Estimate s on contro l devic e efficienc y fo r PM are
availabl e fo r ESP’s , scrubbers , and baghouse s use d i n sintering
operations. Thes e efficiencie s rang e fro m 93 percen t (fo r a
8-10
cyclone , ESP, scrubbe r configuration ) t o 99. 9 percen t (fo r a
baghouse ) and ar e base d on Stat e permittin g information.
Control s use d fo r blas t furnace s includ e cyclone s or
gravit y collector s i n combinatio n wit h scrubbers , baghouses , and
ESP’s. Efficiencie s fo r baghouse s range d fro m 98 to
99.2 5 percent. I f followe d by a scrubber , the y coul d be as high
as 99. 9 percent. Gravit y collector s use d wit h scrubber s could
achiev e 99 t o 99. 9 percen t efficiency. Scrubber s use d wit h an
ESP hav e remova l efficiencie s of 99. 3 t o 99. 9 percent.
Contro l device s use d fo r BOF’s includ e scrubbers , fabric
filter s and ESP’s. Contro l efficienc y estimate s are: (1 ) 99.4
t o 99. 7 percen t fo r ESP’s , (2 ) 98. 5 t o 99. 9 percen t for
scrubbers , (3 ) 99 percen t fo r baghouses , and (4 ) 96 percen t fo r a
cyclon e wit h scrubber. No informatio n was availabl e on control
device s use d fo r open heart h furnaces.
Becaus e a substantia l portio n of th e emission s fro m an EAF
ar e fugitiv e i n nature , emissio n contro l system s includ e capture
and collectio n systems. The captur e system s includ e a primary
system , whic h i s designe d t o captur e emission s durin g th e melt,
and a secondar y system , whic h i s designe d t o captur e fugitive
emission s fro m charging , tapping , and furnac e leakage.
Typically , primar y collectio n system s ar e eithe r direc t shell
evacuatio n (DSE) system s (als o calle d fourt h hol e systems ) or
sid e draf t hood systems , and secondar y emission s ar e collected
vi a canop y hoods , close-captur e loca l hoods , or furnace
enclosures. Gases collecte d by thes e system s ar e generally
directe d t o a fabri c filte r fo r PM collection. Available
informatio n indicate s tha t properl y designe d and operated
secondar y system s ar e expecte d t o captur e 75 t o 95 percen t of the
emission s fro m EAF’s , whil e DSE system s collec t 99 percen t of the
emission s generate d durin g th e melt. Performanc e dat a fo r fabric
8-11

filter s ar e generall y presente d as achievabl e outlet
concentratio n level s but well-operate d unit s ar e expecte d to
achiev e efficiencie s tha t excee d 99 percent.
Emissions 1,8
Tabl e 8- 3 summarize s cadmiu m release s reporte d i n the
1990 Toxi c Chemica l Releas e Inventor y (TRI). Tes t dat a for
cadmiu m emission s ar e onl y availabl e fro m one plant , Bethlehem
Stee l at Sparrow s Point , Maryland. Becaus e thes e dat a ar e not
complet e and coul d not be validated , the y shoul d be used
cautiously. I t shoul d be note d tha t thi s particula r plant
reporte d no cadmiu m emission s i n th e 1990 TRI. The tes t dat a for
thi s one facilit y ar e summarize d i n Tabl e 8-4 , but no information
i s availabl e on thei r representativeness.
No specifi c dat a fo r cadmiu m emission s fro m EAF’ s were
foun d i n th e literature , and no emissio n tes t dat a wer e available
t o permi t th e calculatio n of cadmiu m emissions.
PORTLAND CEMENT MANUFACTURING
More tha n 30 ra w material s ar e use d t o manufacture
Portlan d cement. Thes e material s ca n be classifie d int o four
basi c classe s of ra w materials: lime , silica , alumina , and iron.
Two processes , th e wet and dr y processes , ca n be use d to
manufactur e Portlan d cement. I n 1990 , ther e wer e a tota l of 212
U.S . cement kiln s wit h a combine d tota l clinke r capacit y of
73,51 8 x 10³ Mg (81,05 6 x 10³ tons). Of thi s total , 11 kilns
wit h a combine d capacit y of 1,76 7 x 10³ Mg (1,94 8 x 10³ tons)
wer e inactive. The tota l number of activ e kiln s was 201 wit h a
clinke r capacit y of 71,75 1 x 10³ Mg (79,10 8 x 10³ tons). 11 The
name, location , and clinke r capacit y of eac h kil n i s presente d in
Appendi x C. Based on 1990 U.S . cement kil n capacit y data , an
8-12
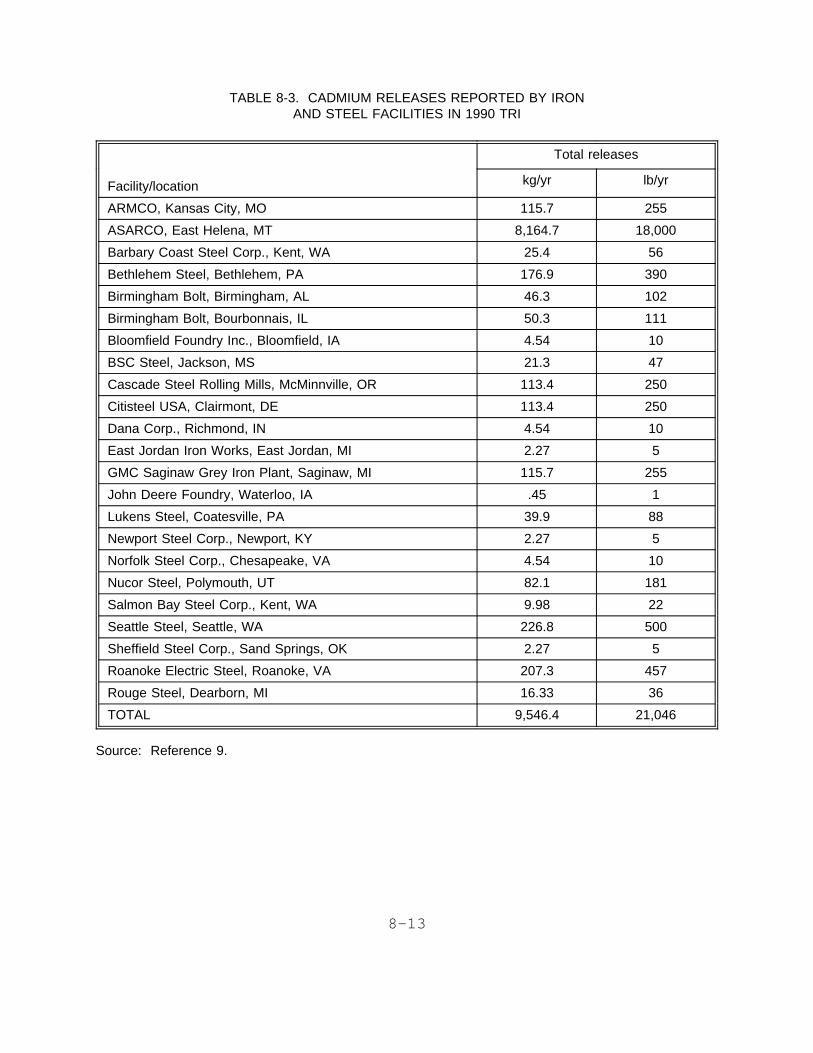
TABLE 8-3. CADMIUM RELEASES REPORTED BY IRONAND STEEL FACILITIES IN 1990 TRI
Facility/location
Total releases
kg/yr lb/yr
ARMCO, Kansas City, MO 115.7 255
ASARCO, East Helena, MT 8,164.7 18,000
Barbary Coast Steel Corp., Kent, WA 25.4 56
Bethlehem Steel, Bethlehem, PA 176.9 390
Birmingham Bolt, Birmingham, AL 46.3 102
Birmingham Bolt, Bourbonnais, IL 50.3 111
Bloomfield Foundry Inc., Bloomfield, IA 4.54 10
BSC Steel, Jackson, MS 21.3 47
Cascade Steel Rolling Mills, McMinnville, OR 113.4 250
Citisteel USA, Clairmont, DE 113.4 250
Dana Corp., Richmond, IN 4.54 10
East Jordan Iron Works, East Jordan, MI 2.27 5
GMC Saginaw Grey Iron Plant, Saginaw, MI 115.7 255
John Deere Foundry, Waterloo, IA .45 1
Lukens Steel, Coatesville, PA 39.9 88
Newport Steel Corp., Newport, KY 2.27 5
Norfolk Steel Corp., Chesapeake, VA 4.54 10
Nucor Steel, Polymouth, UT 82.1 181
Salmon Bay Steel Corp., Kent, WA 9.98 22
Seattle Steel, Seattle, WA 226.8 500
Sheffield Steel Corp., Sand Springs, OK 2.27 5
Roanoke Electric Steel, Roanoke, VA 207.3 457
Rouge Steel, Dearborn, MI 16.33 36
TOTAL 9,546.4 21,046
Source: Reference 9.
8-13
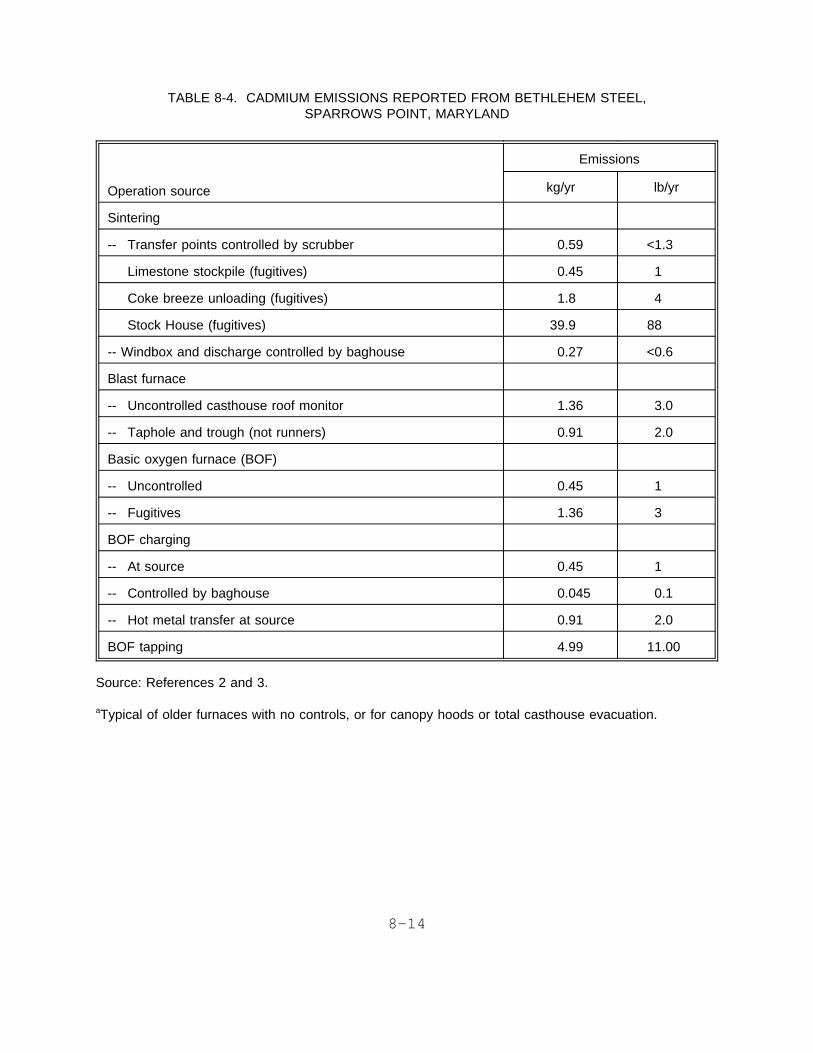
TABLE 8-4. CADMIUM EMISSIONS REPORTED FROM BETHLEHEM STEEL,SPARROWS POINT, MARYLAND
Operation source
Emissions
kg/yr lb/yr
Sintering
-- Transfer points controlled by scrubber 0.59 <1.3
Limestone stockpile (fugitives) 0.45 1
Coke breeze unloading (fugitives) 1.8 4
Stock House (fugitives) 39.9 88
-- Windbox and discharge controlled by baghouse 0.27 <0.6
Blast furnace
-- Uncontrolled casthouse roof monitor 1.36 3.0
-- Taphole and trough (not runners) 0.91 2.0
Basic oxygen furnace (BOF)
-- Uncontrolled 0.45 1
-- Fugitives 1.36 3
BOF charging
-- At source 0.45 1
-- Controlled by baghouse 0.045 0.1
-- Hot metal transfer at source 0.91 2.0
BOF tapping 4.99 11.00
Source: References 2 and 3.
aTypical of older furnaces with no controls, or for canopy hoods or total casthouse evacuation.
8-14

estimate d 68 percen t of th e Portlan d cement i s manufacture d using
th e dr y process , and th e remainin g 32 percen t i s base d on th e wet
process. A descriptio n of th e processe s use d t o manufacture
Portlan d cement and a discussio n of th e emission s resultin g from
th e variou s operation s ar e presente d below.
Proces s Description 3,10
Figur e 8- 2 present s a basi c flo w diagra m of th e Portland
cement manufacturin g process. The proces s ca n be divide d into
fou r majo r steps: ra w materia l acquisitio n and handling , kiln
fee d preparation , pyroprocessing , and produc t finishing.
The initia l ste p i n th e productio n of Portlan d cement
manufacturin g i s ra w material s acquisition. Calcium , whic h is
th e elemen t of highes t concentratio n i n Portlan d cement , is
obtaine d fro m a variet y of calcareou s ra w materials , including
limestone , chalk , marl , se a shells , aragonite , and an impure
limeston e known as "natura l cement rock." The othe r raw
materials--silicon , aluminum , and iron--ar e obtaine d fro m ores
and minerals , suc h as sand , shale , clay , and iro n ore. Cadmium
i s expecte d t o be presen t i n th e ore s (primaril y iron , zinc , lead
and copper ) and mineral s extracte d fro m th e earth. 6 The only
potentia l sourc e of cadmiu m emission s fro m ra w material
acquisitio n woul d be due t o windblow n cadmium-containing
particulat e fro m th e quarr y operations.
The secon d ste p involve s preparatio n of th e ra w materials
fo r pyroprocessing. Raw materia l preparatio n include s a variety
of blendin g and sizin g operation s designe d t o provid e a fee d with
appropriat e chemica l and physica l properties. The ra w material
processin g differ s somewhat fo r wet and dr y process. At
facilitie s wher e th e dr y proces s i s used , th e moistur e conten t in
th e ra w material , whic h ca n rang e betwee n 2 and 35 percent , is
8-15
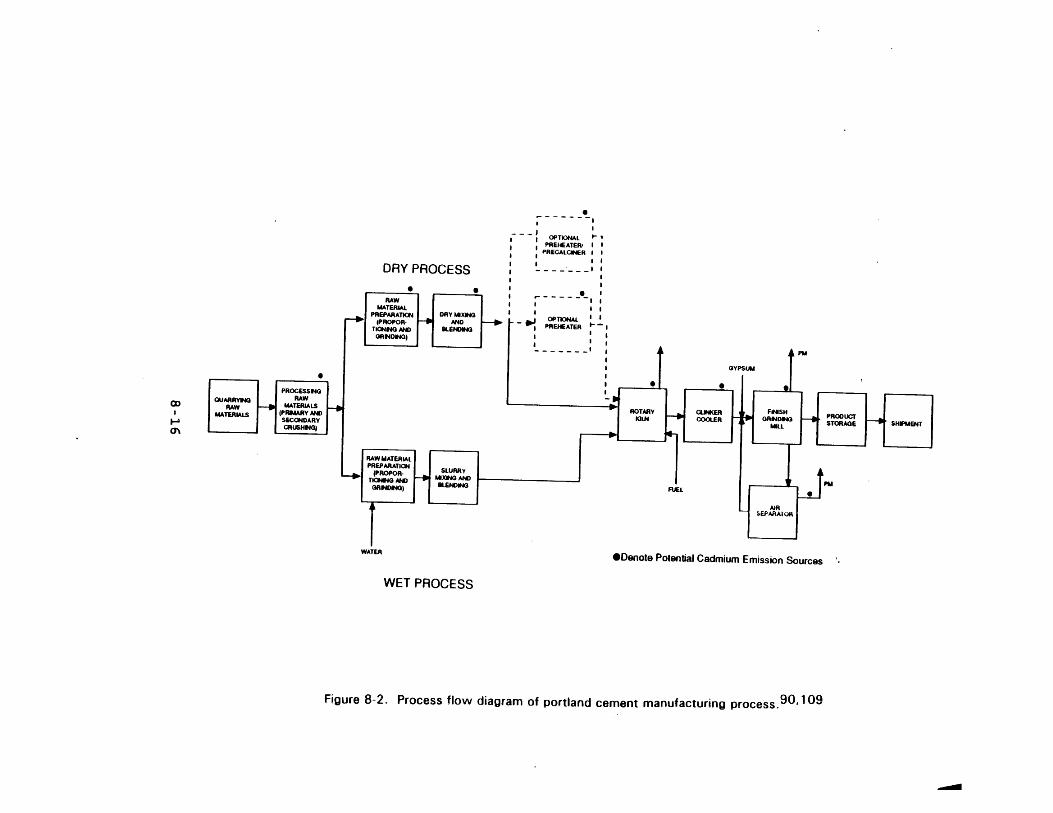

reduce d t o les s tha n 1 percent. Cadmiu m emission s ca n occur
durin g thi s dryin g process. The leve l of th e emission s will
depen d upon th e chemica l for m of th e mercur y i n th e ra w material
and th e temperatur e and duratio n of th e dryin g process. Heat for
dryin g i s provide d by th e exhaus t gase s fro m th e pyroprocessor.
At facilitie s wher e th e wet proces s i s used , wate r i s adde d to
th e ra w materia l durin g th e grindin g step , thereb y producin g a
pumpabl e slurr y containin g approximatel y 65 percen t solids.
Pyroprocessin g (therma l treatment ) of th e ra w materia l is
carrie d out i n th e kiln , whic h i s th e hear t of th e Portland
cement manufacturin g process. Durin g pyroprocessing , th e raw
materia l i s transforme d int o clinkers , whic h ar e gray , glass-
hard , spherically-shape d nodule s tha t rang e fro m 0.3 2 t o 5. 1 cm
(0.12 5 t o 2. 0 in. ) i n diameter. The chemica l reaction s and
physica l processe s tha t tak e plac e durin g pyroprocessin g include:
1. Evaporatio n of uncombine d wate r fro m ra w material s as
materia l temperatur e increase s t o 100° C (212°F),
2. Dehydratio n and precalcinatio n as th e material
temperatur e increase s fro m 100° C t o approximatel y 430° C (806°F),
3. Calcinatio n durin g whic h carbo n dioxid e (CO2) i s
evolved , betwee n 430° C and 900° C (1652°F),
4. Sinterin g of th e oxide s i n th e burnin g zon e of the
rotar y kil n at temperature s up t o 1510° C (2750°F) , and
5. Productio n of cement clinke r as th e temperature
decrease s fro m 1510° C t o 1370° C (2498°F).
The rotar y kil n i s a long , cylindrical , slightl y inclined,
refractory-line d furnace. The ra w materia l mi x i s introduce d in
8-17
th e kil n at th e elevate d end , and th e combustio n fuel s are
introduce d int o th e kil n at th e lowe r end , i n a countercurrent
manner. The rotar y motio n of th e kil n transport s th e raw
materia l fro m th e elevate d end t o th e lowe r end. Fuel suc h as
coal , oil , or natura l gas i s use d t o provid e energ y for
calcination. Use of othe r fuels , suc h as shredde d municipal
garbage , chippe d rubber , coke , and wast e solvents , i s becoming
increasingl y popular.
Pyroprocessin g ca n be carrie d out usin g one of four
differen t processes: wet process , dr y process , dr y proces s with
a preheater , and dr y proces s wit h a preheater/precalciner. These
processe s essentiall y accomplis h th e same physica l and chemical
step s describe d above. Dependin g on th e prevalenc e of preheaters
and precalciner s at facilitie s wher e Portlan d cement is
manufacture d by th e dr y process , thes e segment s of th e process
ca n be th e primar y source s of cadmiu m emissions. Thi s i s because
cadmiu m presen t i n th e ra w materia l ca n evaporat e readil y during
th e preheatin g and precalcinin g steps. The las t ste p i n the
pyroprocessin g i s th e coolin g of th e clinker. Thi s proces s step
recoup s up t o 30 percen t of th e hea t inpu t t o th e kil n system,
lock s i n desirabl e produc t qualitie s by freezin g mineralogy , and
makes i t possibl e t o handl e th e coole d clinke r wit h conventional
conveyin g equipment. Finally , afte r th e cement clinke r is
cooled , a sequenc e of blendin g and grindin g operation s i s carried
out t o transfor m th e clinke r int o finishe d Portlan d cement.
Emissio n Contro l Measures
Wit h th e exceptio n of th e pyroprocessin g operations , the
emissio n source s i n th e Portlan d cement industr y ca n be
classifie d as eithe r proces s fugitiv e or open dus t emissions.
The primar y pollutant s resultin g fro m thes e fugitiv e source s are
PM. The contro l measure s use d fo r thes e fugitiv e dus t sources
8-18

ar e comparabl e t o thos e use d throughou t th e minera l products
industries.
Method s use d t o reduc e particulat e level s i n th e ambient
ai r due t o vehicula r traffi c includ e pavin g and roa d wetting.
Additiona l method s tha t ar e applie d t o othe r open dus t sources
includ e wet sprays , wit h and withou t surfactants , chemica l dust
suppressants , win d screens , and proces s modification s t o reduce
dro p height s or enclos e storag e operations.
Proces s fugitiv e emissio n source s includ e materials
handlin g and transfer , ra w millin g operation s i n dr y process
facilities , and finis h millin g operations. Cadmiu m emission
source s ar e indicate d i n Figur e 8- 2 by soli d circles. Typically,
particulat e emission s fro m thes e processe s ar e capture d by a
ventilatio n syste m comprisin g one or more mechanica l collectors
wit h a fabri c filte r i n a series. Becaus e th e dus t fro m these
unit s i s returne d t o th e process , the y ar e considere d t o be
proces s unit s as wel l as ai r pollutio n contro l devices. The
industr y use s shaker , revers e air , and puls e je t filters , as well
as some cartridg e units , but most newer facilitie s us e puls e jet
filters. For proces s fugitiv e operations , th e differen t systems
ar e reporte d t o achiev e typica l outle t PM loading s of 45
milligram s per cubi c mete r mg/m3 (0.0 2 grain s per actua l cubic
foo t [gr/acf]). Becaus e th e cadmiu m i s i n particl e form , the
performanc e of thes e system s relativ e t o cadmiu m contro l is
expecte d t o be equivalen t t o thi s overal l particulate
performance. However , no dat a ar e availabl e on cadmium
performanc e of fugitiv e contro l measures.
I n th e pyroprocessin g units , PM emission s ar e controlled
by fabri c filter s (revers e air , puls e jet , or puls e plenum),
electrostati c precipitator s (ESP’s) , and electrifie d grave l bed
(EGB) filters. The revers e ai r fabri c filter s and ESP’s
8-19
typicall y use d t o contro l kil n exhaust s ar e reporte d t o achieve
outle t PM loading s of 45 mg/m3 (0.0 2 gr/acf). Clinke r cooler
system s ar e controlle d most frequentl y wit h puls e je t or pulse
plenu m fabri c filters , but revers e ai r fabri c filters , ESP’s , and
EGB’s ar e becomin g increasingl y popular. No dat a ar e available
on th e performanc e of thes e contro l system s fo r cadmium
emissions.
Emissions
Emission s resultin g fro m al l fou r processin g step s include
particulat e matter. Additionally , emission s fro m the
pyroprocessin g ste p includ e othe r product s of fue l combustion
suc h as sulfu r dioxid e (SO2) , nitroge n oxide s (NOx) , and carbon
monoxid e (CO). Cadmiu m emission s ca n be expecte d fro m th e rotary
kil n or preheater/precalciner , i f use d i n th e process. Cadmium
tha t may be presen t i n th e ra w materia l and th e fue l can
potentiall y be emitte d fro m eithe r of thes e sources. As th e use
of municipa l wast e and hazardou s wast e becomes more prevalen t as
an auxiliar y fuel , th e likelihoo d fo r cadmiu m emission s may
increas e significantly. Tabl e 8- 5 provide s emissio n factors
base d on emissio n test s conducte d durin g a new sourc e performance
standar d (NSPS) developmen t fo r Portlan d cement plants
PHOSPHATE ROCK PROCESSING
Phosphat e rock , a calciu m phosphat e minera l known as
apatit e (Ca 10(PO4) 6F2) i s mine d and processe d by beneficiation,
dryin g or calcining , and grinding. 12 As a natura l impurit y in
th e phosphat e rock , cadmiu m emission s may occu r durin g any
therma l processin g of th e rock. Florid a ore s ca n contai n 2 to
15 part s per millio n (ppm) of cadmium ; Nort h Carolin a ores , 10 to
25 ppm; Tennesse e ores , 0. 1 t o 2 ppm; and wester n ore s (mainly
Idaho) , 2 t o 980 ppm wit h a media n concentratio n of 200 ppm. 12
8-20

TABLE 8-5. CADMIUM EMISSION FACTORS FROM PORTLAND CEMENT FACILITIES
Process
Emission Factor
Ref.akg/Mg of feed lb/ton of feed
Raw Mill-Air Separator 4.43 x 10⁻⁷ 8.87 x 10⁻⁷ 1
Finishing Mill - Weigh Hopper 7.56 x 10⁻⁷ 1.51 x 10⁻⁶ 1
Finishing Mill - Air Separator 1.30 x 10⁻⁶ 2.59 x 10⁻⁶ 1
Clinker Cooler 8.7 x 10⁻⁶ 1.7 x 10⁻⁵ 2
Wet Rotary Kiln 1.1 x 10⁻⁴ 2.2 x 10⁻⁴ 2
Source: Reference 10.
a1. Source test: Emissions from Dry Process Raw Mill and Finish Mill Systems at Ideal CementCompany, Tijeras, New Mexico. ETB Test number 71-MM-02. 1972.
2. Source test: Emissions from Wet Process Cement Kiln and Clinker Cooler at Ideal CementCompany, Seattle, Washington. ETB Test number 71-MM-03. 1972.
8-21

Whil e fertilize r productio n i s th e majo r us e fo r phosphate
rock , th e roc k ca n als o be use d t o produc e phosphori c aci d and
elementa l phosphorus. Thes e industrie s ar e not considere d part
of th e phosphat e roc k processin g industry ; however , becaus e they
us e phosphat e roc k as a ra w materia l the y ar e briefl y summarized.
Phosphori c aci d i s produce d by digestin g th e phosphat e roc k with
sulfuri c acid , and pur e phosphoru s i s manufacture d i n an electric
ar c or blas t furnac e fro m phosphat e roc k and silica. 13,14
A number of fertilizer s ar e produce d dependin g on the
phosphat e conten t of th e rock. Thes e fertilizer s are: normal
superphosphate , tripl e superphosphate ; and ammonium phosphate.
No therma l processin g i s use d i n fertilize r production;
therefore , i t i s not considere d a significan t sourc e of cadmium
emissions. Additionally , no dat a ar e availabl e tha t quantify
cadmiu m ai r emission s durin g th e chemica l reaction s tha t produce
fertilizers. Sinc e ther e i s als o no therma l processin g during
phosphori c aci d production , thi s proces s i s not considere d t o be
a cadmiu m emissio n source.
Usin g an EAF i n elementa l phosphoru s productio n i s a
therma l treatmen t proces s and th e EAF may be a cadmiu m emission
source. The roc k i s heate d i n a larg e furnac e wit h cok e and
silic a t o temperature s of 1300 ° t o 1500° C (2372 ° t o 2732°F ) to
produc e phosphoru s vapor. Elementa l phosphoru s i s condense d t o a
liqui d i n coolin g tower s wit h wate r spray s at 45° t o 55° C (113°
t o 131°F). 14
Dryin g or calcinin g phosphat e rock , ar e als o thermal
treatmen t processes , and ar e considere d cadmiu m emissio n sources
fo r phosphat e roc k processing. Thes e potentia l emissio n sources
ar e discusse d i n more detai l i n th e proces s description.
8-22
Tabl e C- 3 i n Appendi x C list s thos e companies , as of
Januar y 1, 1991 , whic h min e phosphat e roc k and thei r annual
capacities. I n 1991 , 154. 5 millio n Mg (34 0 millio n tons ) of
phosphat e roc k wer e mine d and 48. 1 millio n Mg (10 6 millio n tons)
wer e markete d afte r processing. 15 Of tha t amount , Florid a and
Nort h Carolin a produce d 149. 8 millio n Mg (33 0 millio n pounds).
The remainin g 4. 7 millio n Mg (10. 3 millio n tons ) wer e mine d in
Idaho , Montana , Tennessee , and Utah. 15 Annual plan t production
capacit y was reporte d as 59. 1 millio n Mg (13 0 millio n tons ) in
1991. 16
Known EAF operation s tha t produc e elementa l phosphorus
fro m phosphat e roc k ar e i n Pocatello , Idaho ; Silve r Bow, Montana;
and Soda Springs , Idah o (Monsanto). Thes e producer s and their
capacitie s ar e liste d i n Tabl e C- 4 i n Appendi x C.
Proces s Description 3
Figur e 8- 3 provide s a flo w diagra m fo r th e overall
processin g of th e roc k fo r manufacturing. Befor e manufacturing
fertilize r or elementa l phosphorus , th e mine d phosphat e roc k must
be beneficiated , drie d (o r calcined) , and ground.
Beneficiatio n require s removin g clay , sand , or organic
materials. Dependin g on wher e th e roc k was mined , i t may need to
be segregate d by certai n size s fo r washin g and furthe r grinding.
Once a particula r siz e i s reached , and al l foreig n material s have
been removed , a wet roc k mil l grind s th e fina l slurr y t o the
consistenc y of fin e beac h sand. Hydrocyclone s separat e the
slurr y int o roc k and clay ; the n th e roc k i s filtere d out and
allowe d t o dr y i n piles. Sinc e thi s i s a wet grindin g process
wit h no therma l treatment , no cadmiu m emission s ar e anticipated.
8-23
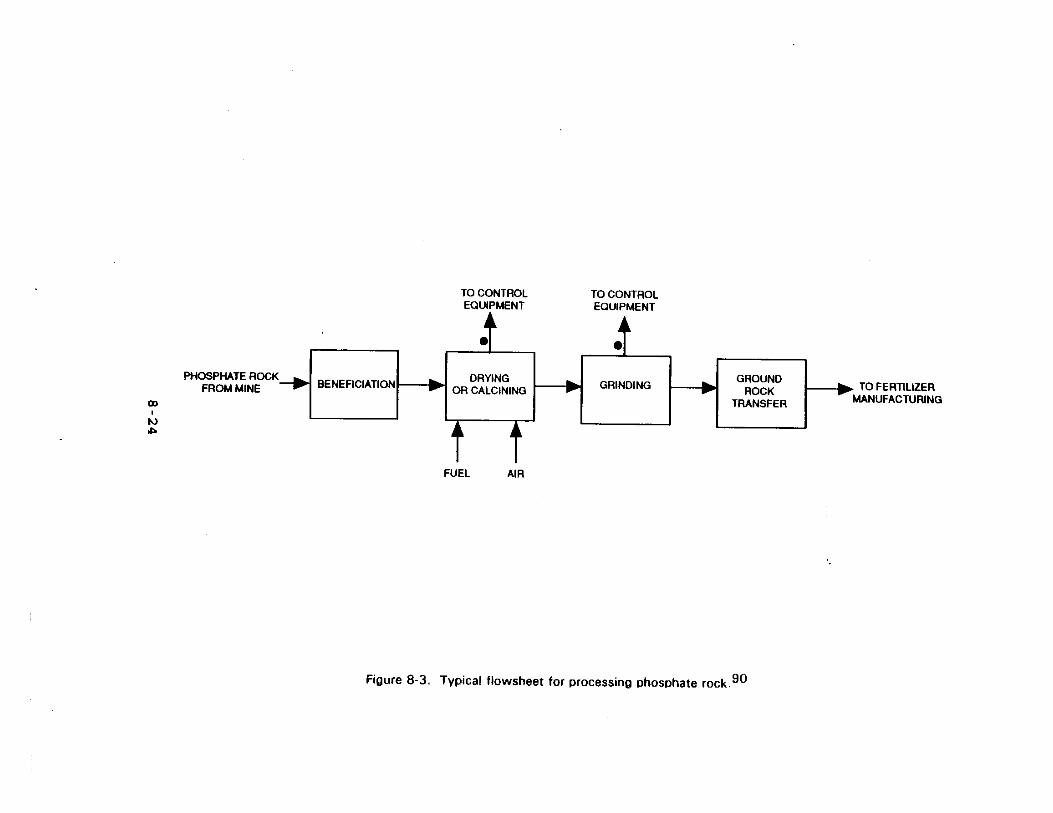

The organi c conten t of th e roc k determine s whethe r the
roc k i s drie d i n rotar y or fluidized-be d driers , or heate d in
fluidized-be d calciners. Rock fre e of organi c contaminant s is
drie d i n dryer s at temperature s aroun d 120° C (248°F). Rotary
drier s ar e most commonl y use d and operat e on natura l gas or fuel
oi l (Nos . 2 or 6). Rock wit h organi c contaminant s i s heate d to
760° C t o 870° C (1400° F t o 1598°F) , usuall y i n fluidized-bed
calciners. Afte r heatin g or drying , th e roc k i s conveye d to
storag e silo s on protecte d conveyor s fo r processin g i n the
grindin g mill. Sinc e dryer s and calciner s ar e hea t processes , it
i s believe d ther e wil l be cadmiu m emission s fro m thes e sources.
Afte r calcinin g or drying , th e phosphat e roc k i s sen t to
th e grindin g mills. Rolle r or bal l mill s ar e use d t o grind
calcine d phosphat e roc k int o a fin e powder ; 60 percen t (by
weight ) of thi s powder typicall y passe s throug h a 200-mes h sieve.
A rotar y valv e feed s th e roc k int o th e grindin g mills , and
circulatin g ai r stream s remov e th e groun d rock. Any remaining
oversize d particle s ar e sen t bac k int o th e mil l fo r regrinding.
Fina l produc t roc k i s separate d by a cyclon e fo r us e i n th e next
manufacturin g step , usuall y t o make fertilizers.
Whil e grindin g i s not a hea t treatmen t step , i t is
believe d t o be a sourc e of fugitiv e particulat e emission s from
blow n fin e rock. Thi s particulat e may contai n cadmiu m trace s as
note d previously. 12
Emissio n Contro l Measures 3
Contro l equipmen t use d fo r phosphat e roc k dryer s usually
consist s of scrubber s or electrostati c precipitators. Fabric
filter s ar e not used. Ventur i scrubber s wit h lo w pressur e drops
(1 2 inche s of water , or 3,00 0 Pascal , (Pa) ) ca n remov e 80 to
99 percen t of th e particulate s tha t ar e 1 t o 10 micrometer s in
8-25

diameter ; and fo r particulate s les s tha n 1 micrometer , 10 to
80 percen t may be removed. Scrubber s wit h hig h pressur e drops
(3 0 inche s of water , or 7,50 0 Pa) ca n remov e 96 t o 99. 9 percent
( 1 t o 10 micromete r particulates ) or 80 t o 86 percen t (les s than
1 micromete r particulates). Electrostati c precipitator s can
remov e 90 t o 99 percen t of al l particulates. I f a wet grinding
proces s i s used , a dryin g ste p and it s particula r emission s are
eliminated.
Calciner s als o us e scrubber s and sometime s fabri c filters.
One operatin g calcine r use s an electrostati c precipitator.
Grinder s us e fabri c filter s and scrubber s t o contro l emissions.
Operatin g th e ai r circulatin g stream s i n grinder s at negative
pressur e avoid s fugitiv e emission s of roc k dust.
Materia l handlin g system s fo r groun d rock , suc h as
elevator s and conveyors , hav e a hig h potentia l fo r fugitive
emissions. Thes e emission s ca n be controlle d by coverin g and
enclosin g conveyors , whic h hav e controlle d discharg e points.
Materia l transfe r area s ar e hoode d and th e hood s evacuate d t o a
contro l device. Storag e silo s or bin s tha t ar e vente d t o the
atmospher e usuall y hav e fabri c filter s t o contro l particulate
emissions.
Electri c ar c furnac e emission s fro m elementa l phosphorous
productio n ar e most ofte n controlle d by fabri c filters , although
ventur i scrubber s and electrostati c precipitator s ca n be used. 17
Emissions 3
Phosphat e Rock Processing--
The majo r cadmiu m particulat e emission s fro m phosphate
roc k processin g (t o produc e fertilizers ) ar e associate d wit h the
processe s of drying , calcining , and grinding. Thes e emission
8-26

source s ar e shown by soli d circle s on Figur e 8-3. Since
beneficiatio n involve s slurrie s of roc k and water , ther e ar e no
significan t cadmiu m particulat e emissions.
No dat a wer e availabl e concernin g measure d cadmium
emission s fro m drying , calcinin g and grinding. Ther e are
emissio n factor s i n AP-4 2 fo r uncontrolle d PM fro m these
particula r processes , but no informatio n i s availabl e on cadmium
level s i n thi s PM. Therefore , thes e factor s canno t be use d to
provid e informatio n on potentia l cadmiu m emissions.
No specifi c dat a fo r cadmiu m emission s fro m phosphat e rock
processin g wer e foun d i n th e literature , and no emissio n test
dat a wer e availabl e t o permi t th e calculatio n of cadmium
emissions.
Elementa l Phosphoru s Production--
Onl y one EAF reporte d cadmiu m emission s i n th e 1990 TRI,
FMC Corporatio n i n Pocatello , Idaho. Tota l release s of 3,96 6 kg
(8,72 5 lb ) wer e reported ; emissio n factor s wer e use d t o estimate
nonpoin t release s of 88 kg (19 4 lb ) and th e remainin g point
release s of 3,87 8 kg (8,53 2 lb ) wer e base d on monitorin g data. 9
Accordin g t o th e Burea u of Mines , a number of EAF plant s were
close d by 1991 , and th e 1990 TRI probabl y reflect s thi s declining
production. 9,15
CARBON BLACK PRODUCTION
Carbo n blac k i s an industria l chemica l use d as a
reinforcin g agen t i n rubbe r products , suc h as tires , and as a
blac k pigmen t fo r printin g inks , surfac e coatings , and pape r and
plastics. 17 Cadmiu m may be a contaminan t i n th e ra w materials
use d and may be emitte d durin g carbo n blac k production.
Tabl e 8- 6 provide s a listin g of facilitie s producin g carbon
8-27

TABLE 8-6. CARBON BLACK PRODUCTION FACILITIES
Company LocationType of
process a
Annual capacity b
103 Mg 106 lb
Cabot CorporationNorth American Rubber Black Division
Franklin, Louisiana F 141 310
Pampa, Texas F 32 70
Villa Platte, Louisiana F 127 280
Waverly, West Virginia F 82 180
Chevron CorporationChevron Chemical Company, subsidiaryOlevins and Derivatives Division
Cedar Bayou, Texas A 9 20
Degussa Corporation Aransas Pass, Texas F 57 125
Belpre, Ohio F 59 130
New Iberia, Louisiana F 91 200
Ebonex Corporation Melvindale, Michigan C 4 8
General Carbon Company Los Angeles, California C 0.5 1
Hoover Color Corporation Hiwassee, Virginia C 0.5 1
J.M. Huber Corporation Baytown, Texas F 102 225
Borger, Texas F and T 79 175
Orange, Texas F 61 135
Phelps Dodge CorporationColombian Chemical Company, subsidiary
El Dorado, Arkansas F 50 110
Moundsville, West Virginia F 77 170
North Bend, Louisiana F 109 240
Ulysses, Kansas F 36 80
Sir Richardson Carbon & Gasoline Company Addis, Louisiana F 66 145
Big Spring, Texas F 52 115
Borger, Texas F 98 215
Witco CorporationContinental Carbon Company, subsidiary
Phenix City, Alabama F 27 60
Ponca City, Oklahoma F 66 145
Sunray, Texas F 45 100
TOTAL 1,471 3,240
Source: Reference 16.
aA = acetylene decompositionC = combustionF = furnaceT = thermal
bCapacities are variable and based on SRI estimates as of January 1, 1991
8-28

black , thei r annua l capacity , and productio n processes. Total
annua l capacit y as of 1991 was 1.4 7 millio n Mg (1.6 2 million
tons). 16
Proces s Description 18
Carbo n blac k i s produce d by partia l combustio n of
hydrocarbons. The most predominantl y use d proces s (which
account s fo r more tha n 98 percen t of carbo n blac k produced ) is
base d on a feedstoc k consistin g of a highl y aromatic
petrochemica l or carbochemica l heav y oil. Cadmiu m ca n be
expecte d t o be presen t i n th e feedstock. Althoug h th e cadmium
conten t i n th e feedstoc k use d t o manufactur e carbo n blac k i s not
known, cadmiu m conten t i n petroleu m crud e has been reporte d at
0.0 3 part s per millio n by weigh t (ppmwt). 19 Figur e 8- 4 contains
a flo w diagra m of thi s process.
Thre e primar y ra w material s use d i n thi s proces s are,
preheate d feedstoc k (eithe r th e petrochemica l oi l or
carbochemica l oil) , whic h i s preheate d t o a temperatur e between
150° C and 250° C (302° F and 482°F) , preheate d air , and an
auxiliar y fue l suc h as natura l gas. A turbulent , high-
temperatur e zon e i s create d i n th e reacto r by combustin g the
auxiliar y fuel , and th e preheate d oi l feedstoc k i s introduce d in
thi s zon e as an atomize d spray. I n thi s zon e of th e reactor,
most of th e oxyge n woul d be use d t o bur n th e auxiliar y fuel,
resultin g i n insufficien t oxyge n t o combust th e oi l feedstock.
Thus , pyrolysi s (partia l combustion ) of th e feedstoc k is
achieved , and carbo n blac k i s produced. Most of th e cadmium
presen t i n th e feedstoc k wil l be emitte d as PM i n th e hot exhaust
gas fro m th e reactor.
The produc t strea m fro m th e reacto r i s quenche d with
water , and any residua l hea t i n th e produc t strea m i s use d to
8-29

prehea t th e oi l feedstoc k and combustio n ai r befor e recovering
th e carbo n i n a fabri c filter. Carbo n recovere d i n th e fabric
filte r i s i n a fluff y form. The fluff y carbo n blac k may be
groun d i n a grinder , i f desired. Dependin g on th e end use,
carbo n blac k may be shippe d i n a fluff y for m or i n th e for m of
pellets. Pelletizin g i s done by a wet proces s i n whic h carbon
blac k i s mixe d wit h wate r alon g wit h a binde r and fe d int o a
pelletizer. The pellet s ar e subsequentl y drie d and bagge d prior
t o shipping.
Emissio n Contro l Measures 18
Durin g th e manufactur e of carbo n black , high-performance
fabri c filter s ar e use d i n th e oi l furnac e proces s t o recover
additiona l carbo n black ; however , the y als o contro l PM emissions
fro m mai n proces s streams. Fabri c filter s reportedl y ca n reduce
PM emission s t o level s as lo w as 6 mg/m3 (norma l m3) , and wil l be
use d by facilitie s t o optimiz e thei r manufacturin g performance.
For oi l furnaces , a cyclon e ca n be use d fo r particle
agglomeratio n upstrea m of th e fabri c filter. A singl e collection
syste m ofte n serve s severa l manifolde d furnaces.
Emissions
The location s of cadmiu m particulat e emissio n source s from
th e oi l furnac e proces s ar e shown by soli d circle s i n Figur e 8-4.
The greates t releas e of cadmiu m occur s durin g pyrolysi s of the
feedstock , makin g th e reacto r th e majo r emissio n sourc e during
production.
No dat a ar e availabl e concernin g cadmiu m emission s from
th e therma l process. I t i s als o not known how efficientl y fabric
filter s captur e cadmiu m emissions. The onl y availabl e dat a are
8-31
fo r emission s fro m th e oi l furnac e process. Thes e dat a show
cadmiu m emission s t o be les s tha n 5. 0 x 10-5 kg/Mg
(1. 0 x 10-4 lb/ton ) fro m th e mai n proces s vent. 19 Thi s data
sourc e was a compilatio n of reporte d dat a and not tes t data ; it
shoul d be use d wit h caution.
MOBILE SOURCES
Historically , th e majo r emission s measure d and regulated
unde r Titl e I I of th e Clea n Ai r Act (CAA) fro m mobil e source s are
CO, NOx, and hydrocarbon s (HC). Emissio n factor s fo r these
specifi c pollutant s among th e differen t moto r vehicl e classe s are
compile d i n AP-42 , Volum e II. 21 Gasoline-powere d motor , on-road,
light-dut y vehicle s compris e th e most significan t mobil e emission
source s becaus e of thei r larg e numbers. Accordin g t o th e 1990
Statistica l Abstract , 1988 nationwid e registration s were
estimate d t o be 183. 5 millio n cars , trucks , and buses. Of that
number , 140. 7 millio n wer e passenge r car s and 42. 8 millio n were
truck s and buses. 22 As of 1991 , th e tota l vehicl e mile s traveled
(VMT) i n th e Unite d State s was 3,457,47 8 millio n kilometers
(2,147,50 1 millio n miles). 23
Potentia l cadmiu m emission s resul t fro m trac e quantities
presen t i n th e petroleu m crud e oi l feedstoc k fo r fue l and motor
oil. 19 Uncontrolle d vehicl e emission s hav e decline d because
catalyti c converter s and unleade d gasolin e ar e require d along
wit h State-regulate d inspectio n and maintenanc e programs.
Therefore , malfunctionin g vehicle s woul d be th e emissio n source
fro m cadmiu m containin g fue l or moto r oil. Tir e wear may als o be
a sourc e of cadmiu m emission s i f any cadmiu m i s presen t as an
impurit y i n th e finishe d tire.
8-32
A stud y conducte d i n 1979 characterize d exhaus t emissions
fro m noncatalyst - and catalyst-equippe d vehicle s under
malfunctionin g conditions. 24 No cadmiu m was detecte d i n the
exhausts. A more recen t tes t was performe d i n 1989 to
characteriz e exhaus t emission s of lat e model car s fo r toxic
pollutant s liste d or undergoin g revie w fo r listin g under
California’ s ai r toxic s program. 25 Particulat e sample s were
take n and analyze d fo r 31 trac e metals , includin g cadmium. Of
th e 31 trac e metals , onl y 18 wer e detecte d i n th e exhaust;
cadmiu m was among th e grou p of metal s tha t was not detected. The
stud y use d x-ra y fluorescenc e fo r th e metal s analyse s but di d not
stat e a detectio n limi t fo r cadmium. Based on thi s study , the
presenc e of cadmiu m i n aut o exhaus t canno t be exclude d but may be
presen t at a leve l belo w th e unspecifie d detectio n limi t of the
analytica l metho d use d i n th e study.
REFERENCES
1. Houck , G.W. Iro n and Steel. Annual Report : 1991. Bureauof Mines , U.S . Departmen t of th e Interior. Washington,
DC. December 1992.
2. Trenholm , A.R. Midwes t Researc h Institute. DRAFTPreliminar y Descriptio n of th e Integrate d Iro n and SteelIndustr y and of Blas t Furnac e Basi c Oxygen Furnac e andSinterin g Operations. Emission s Standard s Division,Offic e of Ai r Qualit y Plannin g and Standards , U. S.Environmenta l Protectio n Agency , Researc h Triangl e Park,NC. Octobe r 1991.
3. U. S. Environmenta l Protectio n Agency. Compilatio n of AirPollutan t Emissio n Factor s - 4t h ed. , Volum e I , StationaryPoin t and Are a Sources. AP-42. Offic e of Ai r andRadiation , Offic e of Ai r Qualit y Plannin g and Standards,U. S. Environmenta l Protectio n Agency , Researc h TrianglePark , NC. 1985.
4. Easterly , W. E. et al. Metallurgica l Coke. (In ) AirPollutio n Engineerin g Manual. A. J. Buonicor e andW. T. Davies , eds. Van Nostran d Reinhold , NY. 1992.
8-33
5. Huskonen , W. W. Addin g th e Fina l Touches. 33 MetalProducing. 29:28-131. May 1991.
6. Coleman , R. et al. Source s of Atmospheri c Cadmium.EPA-450/5-79-006. Offic e of Ai r Qualit y Plannin g andStandards , U. S. Environmenta l Protectio n Agency , ResearchTriangl e Park , NC. Augus t 1979.
7. I T Corporation. Engineerin g Evaluatio n of th e ChargingMachin e Hood Syste m at Jewel Coal and Coke Company.Knoxville , TN. December 1992.
8. U. S. Environmenta l Protectio n Agency. Electri c ArcFurnace s and Argon-Oxyge n Decarburizatio n Vessel s i n SteelIndustry-Backgroun d Informatio n fo r Propose d Revision s toStandards. Draf t EIS. EPA-450/3-82-020a. Offic e of AirQualit y Plannin g and Standards , Researc h Triangl e Park,N.C. Jul y 1983.
9. U. S. Environmenta l Protectio n Agency. 1990 ToxicChemica l Releas e Inventory. Offic e of Toxi c Substances.Washington , DC. Januar y 1993.
10. Midwes t Researc h Institute. Portlan d Cement Manufacturing- AP-4 2 Update. DRAFT. Technica l Suppor t Division,Offic e of Ai r Qualit y Plannin g and Standards , U. S.Environmenta l Protectio n Agency , Researc h Triangl e Park,NC. Jul y 1992.
11. Portlan d Cement Association. U.S . and Canadia n PortlandCement Industry: Plan t Informatio n Summary. PortlandCement Association. Skokie , IL . 1990.
12. Mumma, C. , K. Bohannon , and F. Hopkins. ChemicalTechnolog y and Economic s i n Environmenta l Perspectives.Task VI - Cadmiu m i n Phosphat e Fertilize r Production.EPA 560/2-77-006. Offic e of Toxi c Substances , U. S.Environmenta l Protectio n Agency. Washington , DC.November 1977.
13. Dolan , M. J. , and R. B. Hudson. Phosphori c Aci d andPhosphates. (In ) Kirk-Othme r Concis e Encyclopedi a ofChemica l Technology. M. Grayso n and D. Eckroth , eds. AWiley-Interscienc e Publication , Joh n Wile y and Sons, NewYork , NY. 1985.
14. Van Wazer , J. R. Phosphoru s and th e Phosphides. (In)Kirk-Othme r Concis e Encyclopedi a of Chemica l Technology.M. Grayso n and D. Eckroth , eds. A Wiley-IntersciencePublication , Joh n Wile y and Sons, New York , NY. 1985.
8-34

15. Stowasser , W. F. Phosphat e Rock. Annual Report : 1991.Burea u of Mines , U. S. Departmen t of th e Interior.Washington , DC. November 1992.
16. SRI International. 1991 Director y of Chemica l Producers:Unite d State s of America. SRI International , Menl o Park,CA. 1991.
17. GCA Corporation. Surve y of Cadmiu m Emissio n Sources.EPA 450/3-81-013. Offic e of Ai r Qualit y Plannin g andStandards , Researc h Triangl e Park , NC. Septembe r 1981.
18. Taylor , B. R. , Buonicore , A. J. , and W. T. Davies , eds.Carbo n Black. (In ) Ai r Pollutio n Engineerin g Manual.Van Nostran d Reinhold , NY. 1992.
19. Smith , I.C. , T. L. Ferguson , and B. L. Carson. Metal s inNew and Used Petroleu m Products. (In ) The Rol e of TraceMetal s i n Petroleum. T. F. Yeh, ed. Ann Arbo r SciencePublishers , Ann Arbor , MI. 1975.
20. Serth , R. W., and T. W. Hughes. Polycycli c Organi c Matter(POM) and Trac e Elemen t Content s of Carbo n Blac k Vent Gas.Environmen t Scienc e Technology , 14(3): 298-301. 1980.
21. U. S. Environmenta l Protectio n Agency. Compilationo f AirPollutan t Emissio n Factors-4t h ed. , Volum e II , MobileSources. AP-42. Moto r Vehicl e Emissio n Laboratory,Offic e of Mobil e Sources , U. S. Environmenta l ProtectionAgency , Ann Arbor , MI. 1985.
22. U. S. Burea u of th e Census. Statistica l Abstrac t of theUnite d States: 1990 (110t h ed.). Washington , DC. 1990.
23. Telecon. N. Dobie , EPA, Offic e of Mobil e Sources , withT. Campbell , Midwes t Researc h Institute. HighwayStatistic s on Tota l Vehicl e Mile s Travele d i n th e U.S . in1990. November 1992.
24. Urban , C.M, and R.J . Garbe. Regulate d and UnregulatedExhaus t Emission s fro m Malfunctionin g Automobiles.Societ y of Automotiv e Engineers , Inc. , Technica l PaperSeries , No. 790696. Jun e 1979.
25. Warner-Selph , M., and J. De Vita. Measurement s of ToxicExhaus t Emission s fro m Gasoline-Powere d Light-DutyVehicles. Societ y of Automotiv e Engineers , Inc.,Technica l Paper Series , No. 892075. Septembe r 1989.
8-35
SECTION 9
SOURCE TEST PROCEDURES
INTRODUCTION
A number of method s exis t t o determin e cadmiu m (Cd)
emission s fro m stationar y sources. Severa l EPA office s and some
Stat e agencie s hav e develope d source-specifi c or dedicated
samplin g method s fo r Cd. Othe r industr y samplin g method s do
exist , but none of thes e method s hav e been validate d and wil l not
be discusse d i n thi s section.
Subsequen t part s of thi s sectio n wil l discus s EPA
referenc e or equivalen t samplin g method s fo r Cd. Sampling
method s fal l int o one of tw o categories: (1 ) dedicate d Cd
method s fo r specifi c source s or (2 ) multipl e metal s sampling
train s tha t includ e Cd fo r multipl e sources. Each categor y of
method s wil l be described , difference s among th e method s wil l be
discussed , and a citatio n wil l be provide d fo r more detailed
informatio n abou t th e methods.
Samplin g method s include d i n thi s sectio n wer e selected
fro m EPA referenc e methods , equivalen t methods , draf t methods , or
Stat e methods. To be a referenc e method , a samplin g metho d must
underg o a validatio n proces s and be published. To qualif y as an
equivalen t method , a samplin g metho d must be demonstrate d t o the
EPA Administrator , unde r specifi c conditions , as an acceptable
alternativ e t o th e normall y use d referenc e methods. Also
include d i n thi s sectio n i s a draf t method , whic h i s under
development.
9-1
MULTIPLE METALS SAMPLING TRAINS
Metho d 0012-Methodolog y fo r th e Determinatio n of Metal s Emissions
i n Exhaus t Gases fro m Hazardou s Waste Incineratio n and Similar
Combustio n Sources 1
Thi s metho d was develope d fo r th e determinatio n of a total
of 16 metals , includin g Cd, fro m stac k emission s of hazardous
wast e incinerator s and simila r combustio n processes. Metho d 0012
allow s fo r th e determinatio n of particulat e emission s fro m these
sources. A diagra m of a samplin g trai n typica l of a multiple
metal s samplin g trai n i s presente d i n Figur e 9-1.
The stac k sampl e i s withdraw n isokineticall y fro m the
source. Particulat e emission s ar e collecte d i n th e prob e and on
a heate d filter ; gaseou s emission s ar e collecte d i n a serie s of
fou r chille d impingers: tw o contai n an aqueou s solutio n of
dilut e HNO3 combine d wit h dilut e H2O2 and tw o contai n acidi c KMnO4
solution. Samplin g trai n component s ar e recovere d and digested
i n separat e front - and back-hal f fractions. Material s collected
i n th e samplin g trai n ar e digeste d wit h aci d solution s using
conventiona l Parr ® Bomb, or microwav e digestio n technique s to
dissolv e organic s and t o remov e organi c constituent s tha t may
creat e analytica l interferences. The detectio n limi t fo r Cd by
ICAP i s approximatel y 5 ng Cd/ml.
The correspondin g in-stac k metho d detectio n limi t ca n be
calculate d by usin g (1 ) th e procedure s describe d i n thi s method,
(2 ) th e analytica l detectio n limit s describe d i n th e previous
paragraph , (3 ) a volum e of 300 ml fo r th e front-hal f and 150 ml
fo r th e back-hal f samples , and (4 ) a stac k gas sampl e volum e of
1.2 5 m3:
9-2
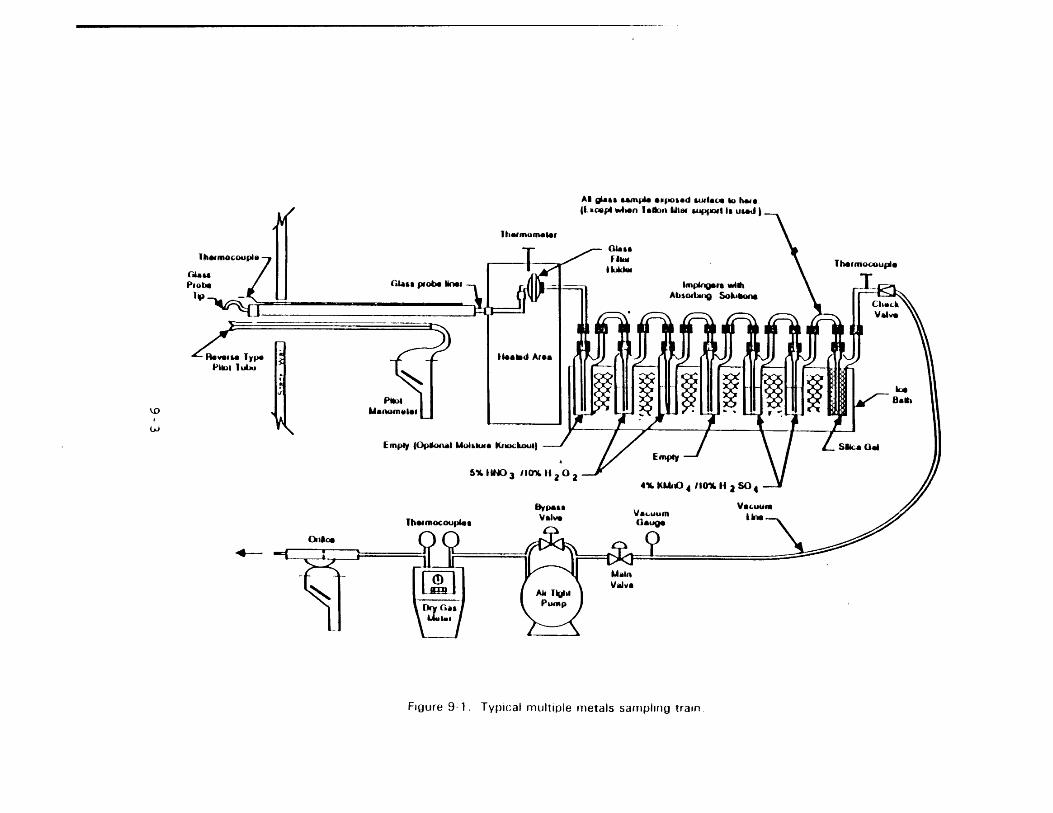
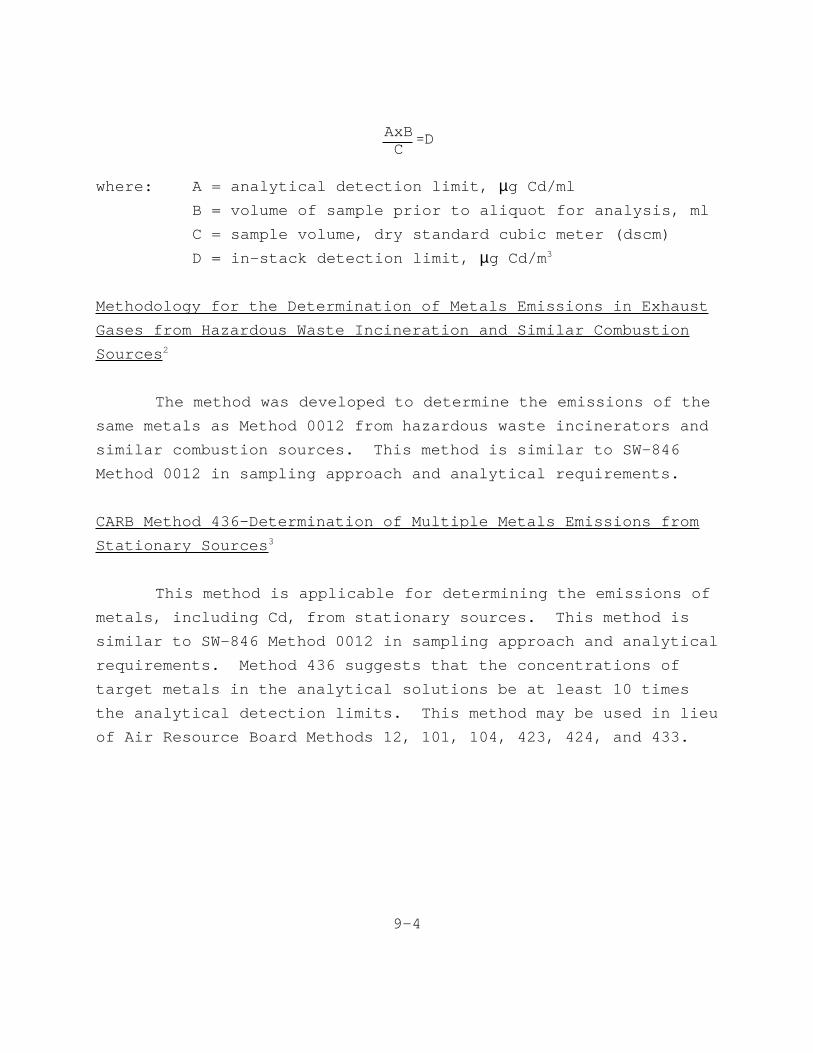
where: A = analytica l detectio n limit , µg Cd/ml
AxBC
D
B = volum e of sampl e prio r t o aliquo t fo r analysis , ml
C = sampl e volume , dr y standar d cubi c mete r (dscm)
D = in-stac k detectio n limit , µg Cd/m3
Methodolog y fo r th e Determinatio n of Metal s Emission s i n Exhaust
Gases fro m Hazardou s Waste Incineratio n and Simila r Combustion
Sources 2
The metho d was develope d t o determin e th e emission s of the
same metal s as Metho d 0012 fro m hazardou s wast e incinerator s and
simila r combustio n sources. Thi s metho d i s simila r t o SW-846
Metho d 0012 i n samplin g approac h and analytica l requirements.
CARB Metho d 436-Determinatio n of Multipl e Metal s Emission s from
Stationar y Sources 3
Thi s metho d i s applicabl e fo r determinin g th e emission s of
metals , includin g Cd, fro m stationar y sources. Thi s metho d is
simila r t o SW-846 Metho d 0012 i n samplin g approac h and analytical
requirements. Metho d 436 suggest s tha t th e concentration s of
targe t metal s i n th e analytica l solution s be at leas t 10 times
th e analytica l detectio n limits. Thi s metho d may be use d i n lieu
of Ai r Resourc e Boar d Method s 12, 101 , 104 , 423 , 424 , and 433.
9-4
EPA Metho d 29-Methodolog y fo r th e Determinatio n of Metals
Emission s i n Exhaus t Gases fro m Incineratio n and Similar
Combustio n Source s (Draft) 4
Thi s metho d i s applicabl e fo r determinin g th e emission s of
metals , includin g Cd, fro m stationar y sources. Thi s metho d is
simila r t o SW-846 Metho d 0012 i n samplin g approac h and analytical
requirements.
ANALYTICAL METHODS FOR DETERMINATION OF CADMIUM
Thi s sectio n contain s brie f overvie w description s of the
fiv e analytica l technique s generall y use d fo r trac e metal
determinations: (1 ) inductivel y couple d argo n plasm a emission
spectrometr y (ICAP) , (2 ) direct-aspiratio n or flam e atomic
absorptio n spectrometr y (FAA) , (3 ) graphite-furnac e atomic
absorptio n spectrometr y (GFAA) , (4 ) hydride-generatio n atomic
absorptio n spectrometr y (HGAA), and (5 ) cold-vapo r atomic
absorptio n spectrometr y (CVAA). Each techniqu e i s discussed
belo w i n term s of advantages , disadvantages , and caution s for
analysis.
The primar y advantag e of ICAP i s tha t i t allows
simultaneou s or rapi d sequentia l determinatio n of many elements
i n a shor t time. The primar y disadvantag e of ICAP i s background
radiatio n fro m othe r element s and th e plasm a gases. Althoug h all
ICAP instrument s utiliz e high-resolutio n optic s and background
correctio n t o minimiz e thes e interferences , analysi s fo r traces
of metal s i n th e presenc e of a larg e exces s of a singl e meta l is
difficult. An exampl e woul d be trace s of metal s i n an allo y or
trace s of a meta l i n a lime d (hig h calcium ) waste. ICAP and
Flam e AA hav e comparabl e detectio n limit s (withi n a facto r of 4),
excep t tha t ICAP exhibit s greate r sensitivit y fo r refractories
(Al , Ba, etc.).
9-5

Flam e AAS (FAA) determinations , as oppose d t o ICAP, are
normall y complete d as singl e elemen t analyse s and ar e relatively
fre e of interelemen t spectra l interferences. Eithe r a nitrous-
oxide/acetylen e or air/acetylen e flam e i s use d as an energy
sourc e fo r dissociatin g th e aspirate d sampl e int o th e fre e atomic
state , makin g analyt e atom s availabl e fo r absorptio n of light.
I n th e analysi s of some elements , th e temperatur e and typ e of
flam e use d i s critical. I f th e prope r flam e and analytical
condition s ar e not used , chemica l and ionizatio n interferences
ca n occur.
Graphit e Furnac e AAS (GFAA) replace s th e flam e wit h an
electricall y heate d graphit e furnace. The furnac e allow s for
gradua l heatin g of th e sampl e aliquo t i n severa l stages. Thus,
th e processe s of desolvation , dryin g decompositio n fo r organic
and inorgani c molecule s and salts , and formatio n of atom s (which
must occu r i n a flam e or ICAP i n a fe w milliseconds ) may be
allowe d t o occu r ove r a much longe r tim e perio d and at controlled
temperature s i n th e furnace. Thi s allow s th e remova l of unwanted
matri x component s by usin g temperatur e programmin g and/o r matrix
modifiers. The majo r advantag e of thi s techniqu e i s tha t it
afford s extremel y lo w detectio n limits. I t i s th e easiest
techniqu e t o perfor m on relativel y clea n samples. Becaus e this
techniqu e i s so sensitive , interference s ca n be a problem;
findin g th e optimu m combinatio n of digestion , heatin g time s and
temperatures , and matri x modifier s ca n be difficul t fo r complex
matrices. Furnac e AA, i n general , wil l exhibi t lowe r detection
limit s tha n eithe r ICAP or flam e AAS.
Hydrid e AA (HGAA) utilize s a chemica l reductio n t o reduce
and separat e arseni c or seleniu m selectivel y fro m a sample
digestate. The technique , therefore , has th e advantag e of being
abl e t o isolat e thes e tw o element s fro m comple x samples , which
may caus e interference s fo r th e analytica l procedures.
9-6

Significan t interference s hav e been reporte d when any of the
followin g i s present: (1 ) easil y reduce d metal s (Cu , Ag, Hg),
(2 ) hig h concentration s of transitio n metal s (>20 0 mg/L) , and
(3 ) oxidizin g agent s (oxide s of nitrogen ) tha t remai n following
sampl e digestion.
Cold-Vapo r AA (CVAA) use s a chemica l reductio n to
selectivel y reduc e Hg. The procedur e i s extremel y sensitiv e but
i s subjec t t o interference s fro m some volatil e organics,
chlorine , and sulfu r compounds.
SUMMARY
Al l of th e abov e sourc e samplin g method s collec t a sample
fo r analysi s of multipl e metals , includin g Cd. Significant
criteri a and characteristic s of eac h metho d ar e presente d in
Tabl e 9-1. Thi s tabl e i s a summary of informatio n presente d in
variou s methods. The majo r difference s betwee n th e methods
involve: (1 ) th e typ e of impinge r solutions , (2 ) th e amount or
concentratio n of impinge r solutions , (3 ) th e sequenc e and types
of sampl e trai n recover y solutions , and (4 ) th e us e and/o r type
of particulat e filter.
I n assessin g Cd emission s fro m tes t reports , th e age or
revisio n number of th e metho d indicate s th e leve l of precision
and accurac y of th e method. Olde r method s ar e sometime s less
precis e or accurat e tha n thos e tha t hav e undergon e more extensive
validation. Currently , EPA Metho d 301 fro m 40 CFR Par t 63,
Appendi x A ca n be use d t o validat e or prov e th e equivalenc y of
new methods.
9-7

TABLE 9-1. CADMIUM SAMPLING METHODS
Method Filter Impinger Range Chemical interference Detection limitEPA 29(Draft)
Quartz or glassfiber
1 X empty (optional)2 X HNO3/H2O2
1 X empty2 X KMnO4/H2SO4
1 X silica gel
ngCd/ml to µg Cd/ml Excessive chloride, iron 5 ng Cd/ml
SW-846 0012 Quartz or glassfiber
1 X empty (optional)2 X HNO3/H2O2
1 X empty2 X KMnO4/H2SO4
1 X silica gel
ngCd/ml to µg Cd/ml Excessive chloride, iron 4 ng Cd/mlby ICAP
OSW-BIF Quartz or glassfiber
1 X empty2 X HNO3/H2O2
1 X empty2 X KMnO4/H2SO4
1 X silica gel
ngCd/ml to µg Cd/ml Excessive chloride 5 ng Cd/ml
CARB 436 Quartz or glassfiber
1 X empty2 X HNO3/H2O2
2 X KMnO4/H2SO4
1 X silica gel
ngCd/ml to µg Cd/ml Excessive chloride 5 ng Cd/ml9-8
REFERENCES
1. EPA Metho d 0012 , Methodolog y fo r th e Determinatio n ofMetal s Emission s i n Exhaus t Gases fro m Hazardou s WasteIncineratio n and Simila r Combustio n Sources , Tes t Methodsfo r Evaluatin g Soli d Waste : Physical/Chemica l Methods.SW-846, Thir d Edition. Offic e of Soli d Waste andEmergenc y Response , U. S. Environmenta l Protectio n Agency,Washington , DC. Septembe r 1988.
2. Methodolog y fo r th e Determinatio n of Metal s Emission s inExhaus t Gases fro m Hazardou s Waste Incineratio n andSimila r Combustio n Sources , Method s Manual fo r Compliancewit h th e BI F Regulation s Burnin g Hazardou s Waste inBoiler s and Industria l Furnaces. EPA/530-SW-91-010.Offic e of Soli d Waste and Emergenc y Response , U. S.Environmenta l Protectio n Agency , Washington , DC. December1990.
3. CARB Metho d 436 , Determinatio n of Multipl e MetalsEmission s fro m Stationar y Sources. Stat e of CaliforniaAi r Resource s Board , Sacramento , CA.
4. EPA Metho d 29. Methodolog y fo r th e Determinatio n ofMetal s Emission s i n Exhaus t Gases fro m Incineration s andSimila r Combustio n Source s (Draft). 40 Code of FederalRegulations , Par t 60, Appendi x A. Washington , DC. 1992.
9-9

APPENDIX A
NATIONWIDE EMISSION ESTIMATES
9-10
EMISSIONS FROM CADMIUM PRODUCTION
Cadmiu m Refining
Basi s of Inpu t Data
1. The 1990 TRI reporte d emission s fo r al l producer s ofcadmiu m (se e Tabl e 4-3 ) t o be 4. 2 Mg (4. 6 tons).
2. Emission s reporte d i n th e TRI may giv e abnormall y highvalue s becaus e th e TRI dat a may includ e unusua l andaccidenta l releases. However , i n th e absenc e of otherdata , th e nationwid e estimate s wil l be base d on thesedata.
Cadmiu m Pigment s Production
Basi s of Inpu t Data
1. The emission s reporte d i n th e 1990 TRI fo r producersof inorgani c pigment s wer e 1. 6 Mg (1. 8 tons). Thesedat a ar e presente d i n Tabl e 4-8.
2. Emission s reporte d i n th e TRI may giv e abnormall y highvalue s becaus e th e TRI dat a may includ e unusua l andaccidenta l releases. However , i n th e absenc e of otherdata , th e nationwid e estimate s wil l be base d on thesedata.
Cadmiu m Stabilizer s Production
No emissio n factor s ar e availabl e fo r cadmiu m emissionsfro m thi s source.
Othe r Cadmiu m Compound Production
No emissio n factor s ar e availabl e fo r cadmiu m emissionsfro m thi s source.
A-1
EMISSIONS FROM MAJOR USES OF CADMIUM
Secondar y Batter y Manufacture
Basi s of Inpu t Data
1. The 1990 TRI reporte d emission s fo r al l manufacturersof secondar y cadmiu m batterie s t o be 0.3 2 Mg (0.35tons).
2. Emission s reporte d i n th e TRI may giv e abnormall y highvalue s becaus e th e TRI dat a may includ e abnorma l andaccidenta l releases. However , i n th e absenc e of otherdata , th e nationwid e emission s presente d i n Sectio n 3ar e base d on th e 1990 TRI report.
A-2

EMISSIONS FROM COMBUSTION SOURCES
Coal Combustion
Coal-Fire d Utilit y Boilers--
Basi s of Inpu t Data
1. Fro m Tabl e 6-8 , emissio n facto r fo r bituminou s coalcombustio n = 3. 0 x 10-14 kg/ J and fo r anthracit e coalcombustio n = 7. 3 x 10-15 kg/J.
2. Bituminou s coa l combustio n system s controlle d by ESP’swit h an averag e cadmiu m contro l efficienc y of75 percent.
3. Anthracit e coa l combustio n system s uncontrolled.
4. Energ y fro m coa l combustio n i n utilit y secto r fromTabl e 6-1.
Calculations
Annual Emission s = 3. 0 x 10-14 kg/ J * 16.93 9 x 10¹⁸ J/y r *0.25
+ 7. 3 x 10-15 kg/ J * 0.01 8 x 10¹⁸ J/yr= 128.3 7 Mg/y r = 141.5 1 tons/yr
Coal-Fire d Industria l Boilers--
Basi s of Inpu t Data
1. Fro m Tabl e 6-8 , emissio n facto r fo r bituminou s coalcombustio n = 3. 0 x 10-14 kg/ J and fo r anthracit e coalcombustio n = 7. 3 x 10-15 kg/J
2. No contro l of emission s fro m industria l boiler s wasassumed.
3. Energ y fro m coa l combustio n i n industria l secto r fromTabl e 6-1.
Calculations
Annual Emission s = 3. 0 x 10-14 kg/ J * 2.89 2 x 10¹⁸ J/yr+ 7. 3 x 10-15 kg/ J * 0.00 9 x 10¹⁸ J/yr
= 87.6 4 Mg/y r = 96.6 1 ton/yr
Coal-Fire d Commercia l and Residentia l Boilers - -
A-3

Basi s of Inpu t Data
1. Fro m Tabl e 6-8 , emissio n facto r fo r bituminou s coalcombustio n = 3. 0 x 10-14 kg/ J and fo r anthracit e coalcombustio n = 7. 3 x 10-15 kg/J
2. No contro l of emission s fro m industria l boiler s wasassumed.
3. Energ y fro m coa l combustio n i n commercial/residentialsector s fro m Tabl e 6-1.
Calculations
Annual Emission s = 3. 0 x 10-14 kg/ J * 0.13 0 x 1018 J/yr+ 7. 3 x 10-15 kg/ J * 0.03 2 x 10¹⁸J/yr
= 4.1 7 Mg/y r = 4.6 0 tons/yr
Oil-Fire d Utilit y Boilers--
Basi s of Inpu t Data
1. Fro m Tabl e 6-15 , emissio n facto r fo r distillat e oilcombustio n = 4. 7 x 10-15 kg/ J and fo r residua l oilcombustio n = 7. 1 x 10-15 kg/J
2. Ai r pollutio n contro l measure s assumed t o provid e nocadmiu m emissio n reduction.
3. Energ y consumptio n fro m fue l oi l combustio n fromTabl e 6-1.
Calculations
Annual Emission s = 4. 7 x 10-15 kg/ J * 1.20 1 x 10¹⁸ J/yr+ 7. 1 x 10-15 kg/ J * 0.09 1 x 10¹⁸ J/yr
= 6.2 4 Mg/y r = 6.8 8 tons/yr
Oil-Fire d Industria l Boilers--
Basi s of Inpu t Data
1. Fro m Tabl e 6-15 , emissio n facto r fo r distillat e oilcombustio n = 4. 7 x 10-15 kg/ J and fo r residua l oilcombustio n = 7. 1 x 10-15 kg/J
2. Ai r pollutio n contro l measure s assumed t o provid e nocadmiu m emissio n reduction.
3. Energ y consumptio n fro m fue l oi l combustio n from
A-4

Tabl e 6-1.
Calculations
Annual Emission s = 4. 7 x 10-15 kg/ J * 1.24 5 x 10¹⁸ J/yr+ 7. 1 x 10-15 kg/ J * 0.43 6 x 10¹⁸ J/yr
= 8.9 1 Mg/y r = 9.8 2 tons/yr
Oil-Fire d Commercial/Residentia l Boilers--
Basi s of Inpu t Data
1. Fro m Tabl e 6-15 , emissio n facto r fo r distillat e oilcombustio n = 4. 7 x 10-15 kg/ J and fo r residua l oilcombustio n = 7. 1 x 10-15 kg/J
2. Ai r pollutio n contro l measure s assumed t o provid e nocadmiu m emissio n reduction.
3. Energ y consumptio n fro m fue l oi l combustio n fromTabl e 6-1.
Calculations
Annual Emission s = 4. 7 x 10-15 kg/ J * 1.39 5 * 1018 J/yr+ 7. 1 x 10-15 kg/ J * 0.25 5 x 10¹⁸ J/yr
= 8.3 1 Mg = 9.1 6 tons/yr
Wood Combustio n i n Boilers--
Basi s of Inpu t Data
1. Wood combustio n rat e i n boiler s i s 1. 0 x 1011 Btu/hr,whic h i s th e same rat e as 1980 give n on p. 6-35.Boiler s assumed t o operat e at capacity , 8,76 0 hr/yr.
2. Heatin g valu e of wood i s 4,50 0 Btu/l b base d onmidpoin t of rang e presente d on p. 6-35.
3. Emissio n facto r of 8. 5 x 10⁻⁶ lb/to n of wood burned.
4. No dat a availabl e on contro l of cadmiu m emission s fromwood wast e boilers.
Calculations
Annual Emissions
A-5
=1. 0 x 1011 Btu/h r * 8,76 0 hr/y r * 8. 5 x 10⁻⁶ lb/ton s wood4,50 0 Btu/l b * 2,00 0 l b wood/to n wood * 2,00 0 l b Hg/to n Hg= 0.4 1 ton/y r = 0.3 8 Mg/yr
Municipa l Waste Combustors--
Basi s of Inpu t Data
1. The emissio n factor s fo r uncontrolle d system s containedi n Tabl e 6-1 9 wer e average d t o obtai n th e following"typical " emissio n factors:
Mass Bur n - 5. 3 g/MgModular - 1. 2 g/MgRDF - 4. 4 g/Mg
2. Electrostati c precipitator s achiev e 95 percen t removal.Spra y drye r system s combine d wit h fabri c filter s orESP’ s achiev e 99 and 98 percen t removal , respectively.Duct sorben t injectio n system s combine d wit h fabricfilter s or ESP’ s achiev e 99 and 95 percen t removal,respectively. Based on result s fo r othe r combustionsources , wet scrubbe r system s achiev e abou t 75 percentremoval.
3. The 1990 MWC processin g rate s ar e assumed t o be equalt o thos e presente d i n Waste Age, November 1991 , andtabulate d i n th e calculatio n tabl e below. 1
Calculations
Controlle d Emissions
Annual Emissions
= Proces s Rat e * Emissio n Factor * (100-Efficiency)100
The calculate d emission s ar e tabulate d below:
A-6
Combustortype
Controlstatus a
Processrate,
106 Mg/yrEmission
factor , g/Mg
Controlefficiency,
%
Annual Emissions
Mg/yr ton/yr
Mass Burn SD/FF 7.190 5.26 99 0.38 0.42
Mass Burn SD/ESP 7.190 5.26 98 0.76 0.83
Mass Burn DSI/FF 1.077 5.26 99 0.06 0.06
Mass Burn DSI/ESP 1.077 5.26 95 0.28 0.31
Mass Burn ESP 13.806 5.26 95 3.63 4.00
Mass Burn U 0.517 5.26 0 2.72 3.00
RDF SD/FF 2.809 4.37 99 0.12 0.14
RDF SD/ESP 2.809 4.37 98 0.25 0.27
Modular WS 0.630 1.21 75 0.19 0.21
Total 8.39 9.24
a SD = Spra y dryerFF = Fabri c filter
ESP = Electrostati c precipitatorDSI = Duct sorben t injection
WS = Wet scrubberU = Uncontrolled
Sewage Sludg e Incinerator s --
Basi s fo r Inpu t Data
1. Tota l sludg e processe d annuall y i s 1. 5 x 10⁶ Mg(se e p. 6-51)
2. Fro m Tabl e 6-20 , th e bes t "typical " uncontrolledemissio n facto r i s 26 g/Mg.
3. Most unit s ar e controlle d by eithe r a ventur i orimpingemen t scrubbe r and averag e nationwid e efficiencyi s 75 percent.
Calculations
Annual Emission s = 26 g/Mg * 1. 5 x 10⁶ Mg/y r (1-0.75)= 9.8 9 Mg/y r = 10.9 1 tons/yr
Medica l Waste Incinerator s --
Basi s of Inpu t Data
1. Fro m unpublishe d dat a containe d i n th e medica l wasteincinerato r NSPS backgroun d files , annua l proces s ratesar e 0.20 4 x 10⁶ Mg/y r fo r pathologica l wast e and1.43 1 x 10⁶ Mg/y r fo r mixe d medica l waste.
A-7
2. Fro m Tabl e 6-2 3 "typical " uncontrolle d emissio n factorsar e 2. 5 g/Mg fo r mixe d wast e and 0.1 8 g/Mg forpathologica l waste.
3. Fro m unpublishe d dat a i n th e medica l wast e incineratorNSPS backgroun d files , approximatel y 3 percen t of theMWI’s firin g mixe d waste s ar e equippe d wit h pollutioncontro l devices. Approximatel y 45 percen t of thecontrolle d MWI’s ar e equippe d wit h dr y scrubber s andapproximatel y 55 percen t wit h wet scrubbers. Drysystem s ca n achiev e at leas t 97 percen t contro l whilewet system s ca n achiev e abou t 38 percen t control.
Calculations
Annual Emissions
2. 5 g/Mg * 1.4 3 x 10⁶ Mg/y r * 0.97+ 2. 5 g/Mg * 1.4 3 x 10⁶ Mg/y r * 0.0 3 * 0.4 5 * (1-0.97)
2. 5 g/Mg * 1.4 3 x 10⁶ Mg/y r * (0.0 3 * 0.5 5 * (1-0.38))+ 0.1 8 g/Mg * 0.20 4 x 10⁶ Mg/yr= 3.5 5 Mg/y r = 3.9 1 tons/yr
EMISSIONS FROM NONFERROUS SMELTING OPERATIONS
1. Primar y lea d smelting
Basi s of Inpu t Data
Dat a i n 1990 Toxi c Releas e Inventor y (TRI ) System. Therear e 3 primar y lea d smeltin g facilitie s withi n th e U.S. All3 facilitie s reporte d cadmiu m emission s resultin g fro m alloperation s fo r th e yea r 1990. Thes e dat a ar e presente d inTabl e 7-2. Accurac y of thes e dat a canno t be verified.Therefore , th e su m of th e cadmiu m emission s fo r al l 3facilitie s wil l als o be th e estimate d nationwid e cadmiumemissio n rate.
Calculations
The su m of th e cadmiu m emission s (fo r both , nonpoin t andpoin t sources ) fo r al l 3 facilitie s i s 14. 3 Mg (15.8 0 tons),whic h i s als o th e estimate d nationwid e annua l emissio n rateof cadmiu m fro m primar y lea d smeltin g facilities.
2. Primar y Copper Smelting
Basi s of Inpu t Data
A-8
Dat a i n 1990 TRI. Four facilitie s reporte d totalfacilitywid e cadmiu m emissio n rate s fo r 1990. Thes e dataar e presente d i n Tabl e 7-5.
Calculations
Four facilitie s reporte d cadmiu m emissio n rate s fo r 1990 asrequire d unde r Superfun d Amendments and Reauthorizatio n Act(SARA) Titl e II I provisions. The su m of th e cadmiumemissio n rate s reporte d by th e 4 facilitie s i s 5. 6 Mg(6. 2 tons).
3. Primar y Zin c Smelting
Basi s of Inpu t DataDat a i n 1990 Toxi c Releas e Inventor y Syste m (TRIS). Therear e 4 primar y zin c smeltin g facilitie s withi n th e U.S. All4 facilitie s reporte d cadmiu m emission s resultin g fro m alloperation s fo r th e yea r 1990. Thes e dat a ar e presente d inTabl e 7-8. Accurac y of thes e dat a canno t be verified.Therefore , th e su m of th e cadmiu m emission s fo r al l 4facilitie s wil l be th e estimate d nationwid e cadmiu m emissionrate.
Calculations
The su m of th e cadmiu m emission s (fo r both , nonpoin t andpoin t sources ) fo r al l 4 facilitie s i s 5. 7 Mg (6. 3 tons),whic h i s als o th e estimate d nationwid e annua l emissio n rateof cadmiu m fro m primar y zin c smeltin g facilities.
4. Secondar y Copper Smelting
Basi s of Inpu t Data
Dat a i n 1989 and 1990 TRI. Thre e facilitie s reporte d totalfacilitywid e cadmiu m emissio n rate s fo r 1990. One facilityreporte d cadmiu m emissio n dat a fo r 1989. Thes e dat a arepresente d i n Tabl e 7-11.
Calculations
The TRI dat a bas e contain s emission s reporte d fo r 1990 by 3facilities. Anothe r facilit y (Southwir e Co. ) reporte d datafo r 1989. For thi s study , i t i s assumed tha t th e cadmiumemission s at Southwir e Co. fo r 1990 was th e same as thatreporte d fo r 1989.
Ther e ar e a tota l of 6 secondar y coppe r manufacturingfacilitie s i n th e U.S. Raw material s use d at these
A-9
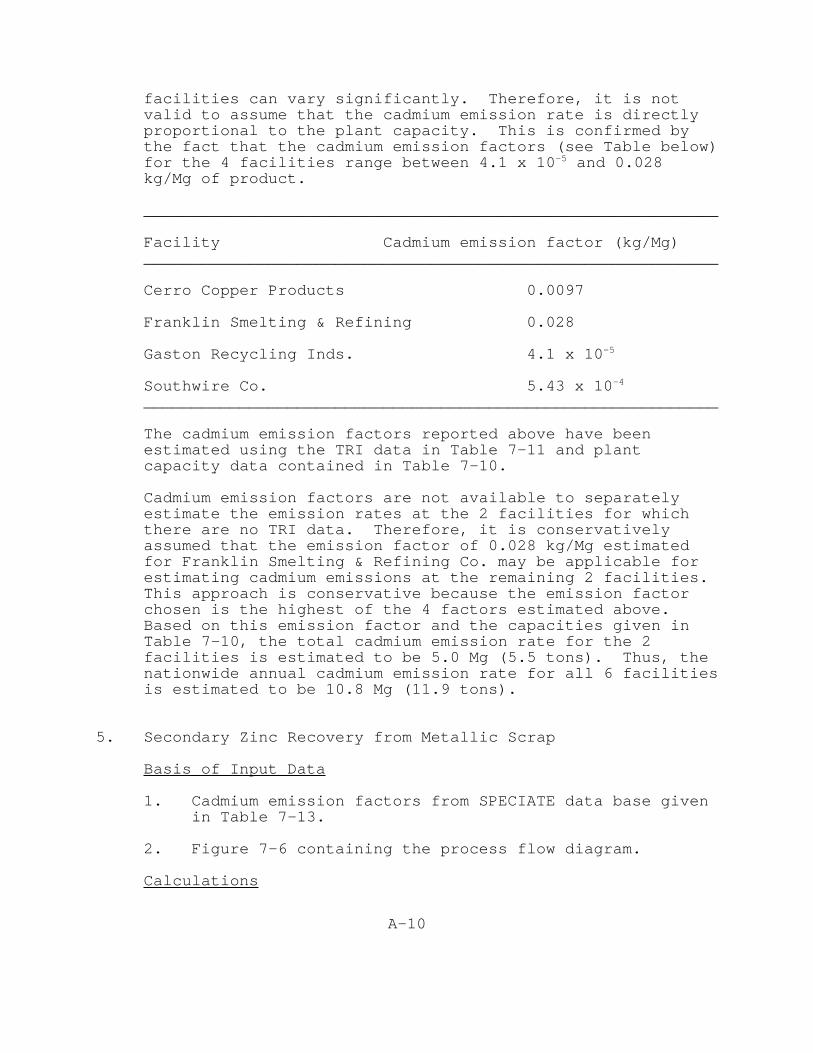
facilitie s ca n var y significantly. Therefore , i t i s notvali d t o assume tha t th e cadmiu m emissio n rat e i s directlyproportiona l t o th e plan t capacity. Thi s i s confirme d byth e fac t tha t th e cadmiu m emissio n factor s (se e Tabl e below)fo r th e 4 facilitie s rang e betwee n 4. 1 x 10⁻⁵ and 0.028kg/M g of product.
____________________________________________________________
Facility Cadmiu m emissio n facto r (kg/Mg)____________________________________________________________
Cerr o Copper Products 0.0097
Frankli n Smeltin g & Refining 0.028
Gasto n Recyclin g Inds. 4. 1 x 10⁻⁵
Southwir e Co. 5.4 3 x 10⁻⁴
____________________________________________________________
The cadmiu m emissio n factor s reporte d abov e hav e beenestimate d usin g th e TRI dat a i n Tabl e 7-1 1 and plantcapacit y dat a containe d i n Tabl e 7-10.
Cadmiu m emissio n factor s ar e not availabl e t o separatelyestimat e th e emissio n rate s at th e 2 facilitie s fo r whichther e ar e no TRI data. Therefore , i t i s conservativelyassumed tha t th e emissio n facto r of 0.02 8 kg/M g estimatedfo r Frankli n Smeltin g & Refinin g Co. may be applicabl e forestimatin g cadmiu m emission s at th e remainin g 2 facilities.Thi s approac h i s conservativ e becaus e th e emissio n factorchose n i s th e highes t of th e 4 factor s estimate d above.Based on thi s emissio n facto r and th e capacitie s give n inTabl e 7-10 , th e tota l cadmiu m emissio n rat e fo r th e 2facilitie s i s estimate d t o be 5. 0 Mg (5. 5 tons). Thus , thenationwid e annua l cadmiu m emissio n rat e fo r al l 6 facilitiesi s estimate d t o be 10. 8 Mg (11. 9 tons).
5. Secondar y Zin c Recover y fro m Metalli c Scrap
Basi s of Inpu t Data
1. Cadmiu m emissio n factor s fro m SPECIATE dat a bas e giveni n Tabl e 7-13.
2. Figur e 7- 6 containin g th e proces s flo w diagram.
Calculations
A-10

Majo r proces s step s ar e pretreatmen t of scrap , meltin g thesweate d scra p and refining/alloying. Each of thes e stepsca n be performe d i n variou s ways. Becaus e th e specificproces s descriptio n fo r eac h of th e 13 plant s liste d inTabl e 7-1 2 i s not known, we need t o creat e a conservativemodel proces s flo w scheme.
Refe r t o Figur e 7-6. For thi s study , assume tha t al l plantsproduc e secondar y zin c fro m di e cas t products , residueskimmings , and othe r mixe d scraps. Pretreatmen t of thesematerial s i s carrie d out i n one of 4 ways as shown i n Figure7-6. Of th e 4 cadmiu m emissio n factor s correspondin g tothes e 4 pretreatmen t methods , th e emission s facto r forreverberator y sweat furnac e (genera l metalli c scrap ) i s thehighest. Thi s emissio n facto r i s 0.0123 2 kg/M g of zincproduced. Therefore , i t i s assumed tha t al l 13 plant s useth e reverberator y sweat furnac e fo r pretreatment.
Next , th e meltin g i s carrie d out i n one of 4 ways. However,Tabl e 7-1 3 does not contai n cadmiu m emissio n factor s formeltin g operations. Therefore , i t i s assumed tha t al l 13plant s als o carr y out th e meltin g i n reverberator y meltingkettle s and th e cadmiu m emissio n facto r fo r meltin g i s thesame as tha t fo r pretreatmen t (0.0123 2 kg/M g of zincproduced).
Finally , zin c ingo t i s produce d i n one of 2 ways. Thecadmiu m emissio n facto r fo r bot h method s i s reporte d t o be0.0009 1 kg/Mg.
Therefore , th e tota l cadmiu m emissio n facto r fo r th e threemajo r processin g step s i s estimate d t o be 0.0255 5 kg/M g ofzin c produced. The tota l zin c productio n capacit y fo r all13 plant s i s reporte d t o be 58,00 0 Mg. Therefore , thenationwid e annua l cadmiu m emissio n rat e fo r al l 13 plantsresultin g for m th e majo r processin g step s i s estimate d t o be1. 5 Mg (1. 7 tons).
6. Secondar y Zin c Recover y fro m EAF Dust
Basi s of Inpu t Data
Cadmiu m emissio n facto r dat a fo r recover y of zin c fro m EAFdus t ar e limited. Cadmiu m emissio n facto r fo r onl y oneprocessin g ste p usin g th e flam e reacto r i s available. Theemissio n facto r i s reporte d t o be 2. 1 x 10⁻⁴ kg/M g of EAFdus t processed. Therefore , fo r thi s study , i t i s assumedtha t al l facilitie s producin g zin c fro m EAF dus t us e theflam e reactor.
A-11

Calculations
Tabl e 7-1 4 present s th e EAF dus t processin g capacit y fo r all9 facilitie s i n th e U.S. The tota l EAF dus t processingcapacit y i s 533,20 0 Mg/yr. I f al l thi s dus t i s processe d ina flam e reacto r equippe d wit h a fabri c filter , thenationwid e annua l cadmiu m emissio n rat e resultin g fro m thisprocessin g ste p i s estimate d t o be 112 kg (24 6 lb). I t mustbe note d tha t othe r majo r processin g step , th e calciningkiln , wil l als o emi t cadmium. However , th e cadmiu m emissionrat e correspondin g t o thi s ste p canno t be estimate d due toth e lac k of emissio n facto r data.
EMISSIONS FROM MISCELLANEOUS SOURCES
Iro n and Stee l Production
The availabl e dat a ar e insufficien t t o permi t thecalculatio n of emissio n estimates.
Portlan d Cement Production
Basi s of Inpu t Data
1. The 1990 tota l productio n of cement was 70. 6 x 10⁶ Mg(77. 8 x 10⁶ tons ) of whic h 95. 7 percen t was Portlandcement. Tota l productio n of Portlan d cement was67. 5 x 10⁶ Mg (74. 5 x 10⁶ tons).
2. Cadmiu m emissio n factor s fo r selecte d processe s i n bothdr y proces s kiln s and wet proces s kiln s wer e presentedi n Tabl e 8-5. Thes e emissio n factor s ar e base d onquantit y of ra w materia l feed.
3. Based on dat a i n tes t reports , th e followin g averageconversion s wer e obtaine d fo r ra w materia l quantitiest o clinke r quantities:
wet process : 1. 7 Mg (1.8 7 tons ) of fee d produces1. 0 Mg (1. 1 tons ) of clinker
dr y process : 1. 6 Mg (1.7 6 tons ) of fee d produces1. 0 Mg (1. 1 tons ) of clinker
4. Based on th e tw o processes , cadmiu m emission s from adr y proces s kiln , includin g preheater/precalciner , arenot anticipate d t o be any les s tha n emission s fro m thewet process. Therefore , th e emissio n factor s inTabl e 8- 5 ar e use d fo r al l Portlan d cement produced.
A-12
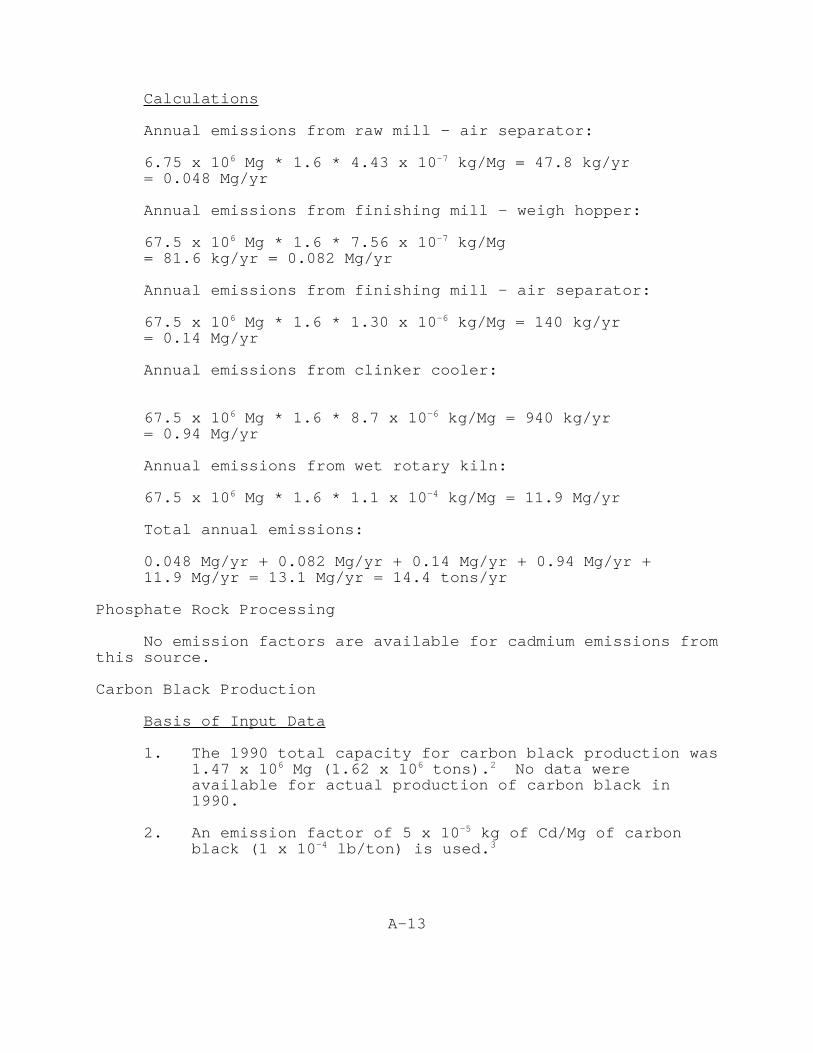
Calculations
Annual emission s fro m ra w mil l - ai r separator:
6.7 5 x 106 Mg * 1. 6 * 4.4 3 x 10⁻⁷ kg/M g = 47. 8 kg/yr= 0.04 8 Mg/yr
Annual emission s fro m finishin g mil l - weig h hopper:
67. 5 x 106 Mg * 1. 6 * 7.5 6 x 10⁻⁷ kg/Mg= 81. 6 kg/y r = 0.08 2 Mg/yr
Annual emission s fro m finishin g mil l - ai r separator:
67. 5 x 106 Mg * 1. 6 * 1.3 0 x 10-6 kg/M g = 140 kg/yr= 0.1 4 Mg/yr
Annual emission s fro m clinke r cooler:
67. 5 x 106 Mg * 1. 6 * 8. 7 x 10⁻⁶ kg/M g = 940 kg/yr= 0.9 4 Mg/yr
Annual emission s fro m wet rotar y kiln:
67. 5 x 106 Mg * 1. 6 * 1. 1 x 10⁻⁴ kg/M g = 11. 9 Mg/yr
Tota l annua l emissions:
0.04 8 Mg/y r + 0.08 2 Mg/y r + 0.1 4 Mg/y r + 0.9 4 Mg/y r +11. 9 Mg/y r = 13. 1 Mg/y r = 14. 4 tons/yr
Phosphat e Rock Processing
No emissio n factor s ar e availabl e fo r cadmiu m emission s fromthi s source.
Carbo n Blac k Production
Basi s of Inpu t Data
1. The 1990 tota l capacit y fo r carbo n blac k productio n was1.4 7 x 10⁶ Mg (1.6 2 x 10⁶ tons). 2 No dat a wereavailabl e fo r actua l productio n of carbo n blac k in1990.
2. An emissio n facto r of 5 x 10⁻⁵ kg of Cd/Mg of carbonblac k ( 1 x 10⁻⁴ lb/ton ) i s used. 3
A-13
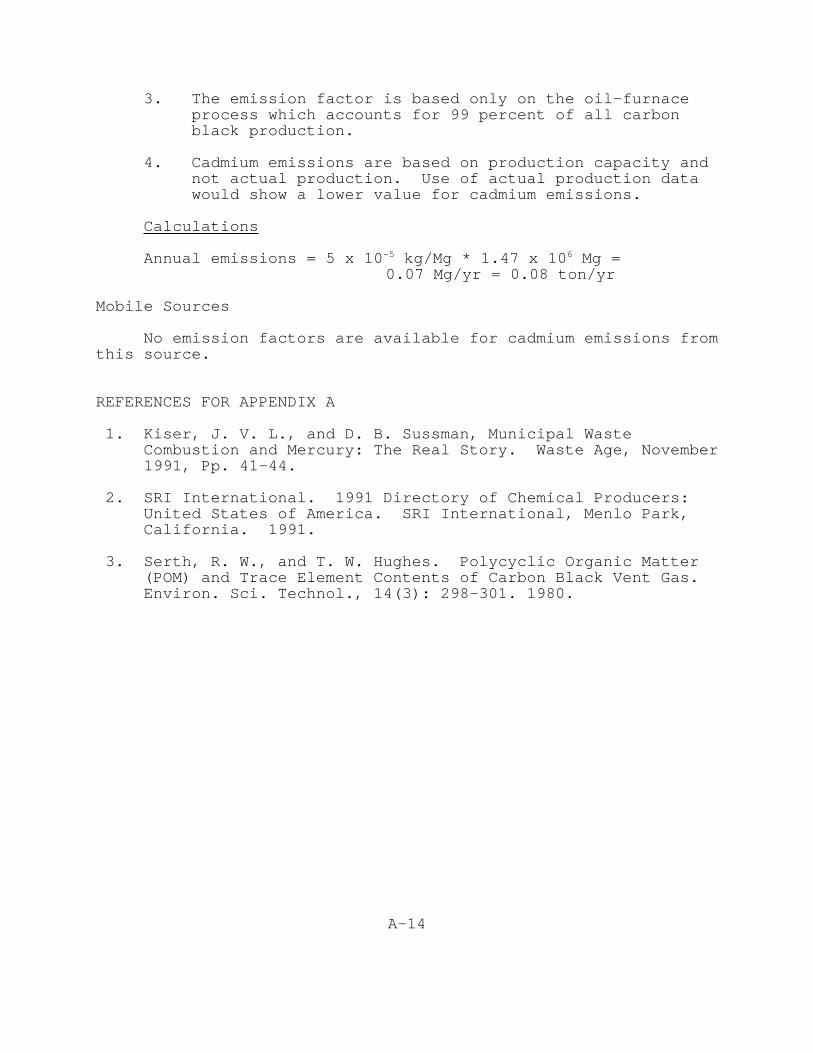
3. The emissio n facto r i s base d onl y on th e oil-furnaceproces s whic h account s fo r 99 percen t of al l carbonblac k production.
4. Cadmiu m emission s ar e base d on productio n capacit y andnot actua l production. Use of actua l productio n datawoul d sho w a lowe r valu e fo r cadmiu m emissions.
Calculations
Annual emission s = 5 x 10⁻⁵ kg/M g * 1.4 7 x 10⁶ Mg =0.0 7 Mg/y r = 0.0 8 ton/yr
Mobil e Sources
No emissio n factor s ar e availabl e fo r cadmiu m emission s fromthi s source.
REFERENCES FOR APPENDIX A
1. Kiser , J. V. L. , and D. B. Sussman, Municipa l WasteCombustio n and Mercury : The Real Story. Waste Age, November1991 , Pp. 41-44.
2. SRI International. 1991 Director y of Chemica l Producers:Unite d State s of America. SRI International , Menl o Park,California. 1991.
3. Serth , R. W., and T. W. Hughes. Polycycli c Organi c Matter(POM) and Trac e Elemen t Content s of Carbo n Blac k Vent Gas.Environ . Sci . Technol. , 14(3) : 298-301 . 1980.
A-14
APPENDIX B
SUMMARY OF COMBUSTION SOURCE CADMIUM EMISSION DATA
A-15

TABLE B-1. SUMMARY OF COAL COMBUSTION EMISSION DATA
Industrysectora
Facilitytypeb
Controlstatusc
Coaltyped
Emission factor
kg/1015 J lb/1012 Btu
Mean Range Mean Range
U PC/DB ESP B 1.1 -- 2.6 --
U PC/DB WS B 0.52 -- 1.2 --
U PC/DB MP/ESP B 0.82 -- 1.9 --
U PC/DB MP/ESP B 0.60 -- 1.4 --
U PC/DB ESP B 11 4.9-23 26 11-53
U PC/DB UN B 59 49-72 140 110-170
U PC/DB ESP B 2.8 -- 6.6 --
U PC/DB ESP B 4.2 -- 9.8 --
U PC/DB ESP B 1.6 -- 3.8 --
U PC/DB UN B 18 -- 41 --
U PC/DB UN B 5.2 -- 12 --
U PC/DB UN B 4.7 -- 11 --
U PC/DB ESP B 1.9 -- 4.5 --
U PC/DB ESP B 3.1 -- 7.1 --
U PC/DB UN B 4.3 -- 10 --
U PC/DB UN B 4.0 -- 9.2 --
U PC/DB UN B -- 4.3-6.0 -- 10-14
U PC/DB ESP B <2.0 -- <4.6 --
U PC/DB ESP/WS B <2.0 -- <4.6 --
U PC/DB MP B 130 59-210 290 140-490
U PC/DB MP/ESP B 20 -- 46 --
U PC/DB VS B 0.84 -- 2.0 --
U PC/DB ESP B -- 0.095-0.26 -- 0.22-0.60
U PC/DB MP B 13 6.5-24 31 15-56
U PC/DB UN B 18 10-32 42 24-74
U PC/WB MP/ESP B 0.82 -- 1.9 --
U PC/WB ESP B 0.24 -- 0.56 --
B-1

TABLE B-1. (continued)
Industrysectora
Facilitytypeb
Controlstatusc
Coaltyped
Emission factor
kg/1015 J lb/1012 Btu
Mean Range Mean Range
U PC/WB ESP B 0.27 -- 0.63 --
U PC/WB VS B 0.037 -- 0.086 --
U PC/WB ESP B 0.60 -- 1.4 --
U PC/WB ESP B 1.1 -- 2.6 --
U CY WS B 210 -- 490 --
U CY ESP B 1.3 -- 3.0 --
U CY ESP B 0.47 -- 1.1 --
U CY ESP B 0.15 -- 0.35 --
U CY ESP B 0.47 -- 1.1 --
U CY UN B 12 9.5-15 28 22-35
U CY ESP B 0.34 0.30-0.39 0.80 0.70-0.90
U S FF B 0.14 -- 0.33 --
U S MP B 1.8 -- 4.2 --
U S MC B 9.5 -- 22 --
U CY UN SB 1,900 -- 4,400 --
U CY WS SB 210 -- 490 --
U PC VS SB 1.7 -- 4.0 --
U PC ESP SB <0.17 -- <0.40 --
U NA ESP SB 0.17 -- 0.39 --
U NA ESP SB 0.73 -- 1.7 --
U PC/DB MC L 11 -- 26 --
U PC/DB MC L 2.2 -- 5.1 --
U PC/DB ESP L <1.5 -- <3.5 --
U CY ESP L 0.52 -- 1.2 --
U CY CY L 6.9 -- 16 --
U CY ESP/WS L 13 0.77-25 31 1.8-59
B-2

TABLE B-1. (continued)
Industrysectora
Facilitytypeb
Controlstatusc
Coaltyped
Emission factor
kg/1015 J lb/1012 Btu
Mean Range Mean Range
U SS MC L 2.3 -- 5.3 --
U SS ESP L 0.82 -- 1.9 --
I PC/DB ESP B 8.6 -- 20 --
I PC/DB ESP B 0.21 -- 0.49 --
I PC/DB MC B 200 -- 460 --
I PC/DB MC/WS B 0.42 -- 0.98 --
I PC/DB UN B 124 -- 290 --
I PC/DB ESP B 17 -- 39 --
I PC/WB MC B 0.65 -- 1.5 --
I SS MC/ESP B 0.0039 -- 0.0090 --
I SS MC B 0.082 -- 0.19 --
I SS MC B 0.40 -- 0.93 --
I SS UN B 2.1 1.8-2.4 4.8 4.1-5.6
I SS UN B 8.6 6.9-9.4 20 16-23
I SS UN B 15 -- 35 --
I SS UN B 3.7 -- 8.7 7.4-10
I SS UN B 9.5 -- 22 20-25
I SS UN B 19 -- 45 25-65
I OS UN B 16 -- 37 --
I OS UN B 5.2 -- 12 --
I OS UN B 77 26-130 180 60-300
I OS UN B 43 -- 100 --
I OS MP B 24 19-29 56 44-67
I SS UN B 5.6 -- 13 --
I SS ESP B 0.56 -- 1.3 --
I SS UN B 4.7 -- 11 --
B-3
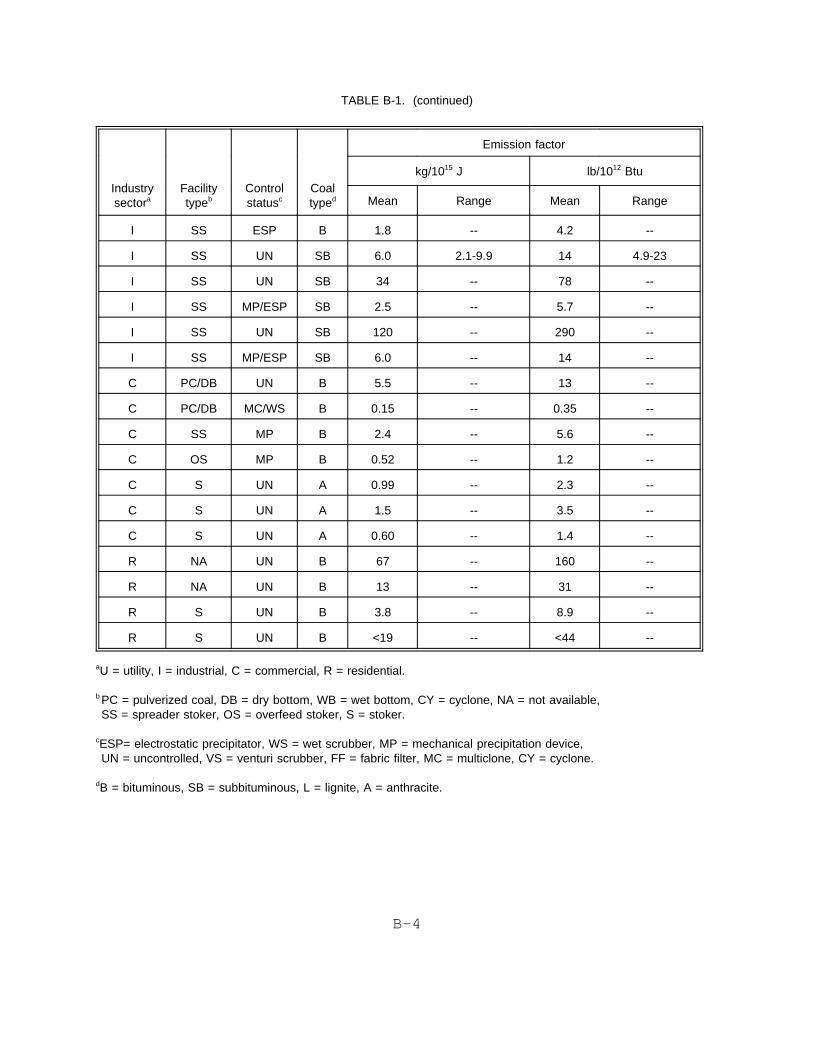
TABLE B-1. (continued)
Industrysectora
Facilitytypeb
Controlstatusc
Coaltyped
Emission factor
kg/1015 J lb/1012 Btu
Mean Range Mean Range
I SS ESP B 1.8 -- 4.2 --
I SS UN SB 6.0 2.1-9.9 14 4.9-23
I SS UN SB 34 -- 78 --
I SS MP/ESP SB 2.5 -- 5.7 --
I SS UN SB 120 -- 290 --
I SS MP/ESP SB 6.0 -- 14 --
C PC/DB UN B 5.5 -- 13 --
C PC/DB MC/WS B 0.15 -- 0.35 --
C SS MP B 2.4 -- 5.6 --
C OS MP B 0.52 -- 1.2 --
C S UN A 0.99 -- 2.3 --
C S UN A 1.5 -- 3.5 --
C S UN A 0.60 -- 1.4 --
R NA UN B 67 -- 160 --
R NA UN B 13 -- 31 --
R S UN B 3.8 -- 8.9 --
R S UN B <19 -- <44 --
aU = utility, I = industrial, C = commercial, R = residential.
b PC = pulverized coal, DB = dry bottom, WB = wet bottom, CY = cyclone, NA = not available,SS = spreader stoker, OS = overfeed stoker, S = stoker.
cESP= electrostatic precipitator, WS = wet scrubber, MP = mechanical precipitation device,UN = uncontrolled, VS = venturi scrubber, FF = fabric filter, MC = multiclone, CY = cyclone.
dB = bituminous, SB = subbituminous, L = lignite, A = anthracite.
B-4

TABLE B-2. SUMMARY OF MUNICIPAL WASTE COMBUSTOR EMISSION DATA
Facility nameCombustor
typeaControl
technologybConcentration
µg/dscm @ 7% O2c
CommerceCommerce
Commerce averageQuebec City - PilotQuebec City - PilotQuebec City - PilotQuebec City - PilotQuebec City - PilotQuebec City - Pilot
Quebec City averageVancouver
MB/WWMB/WWMB/WWMB/WWMB/WWMB/WWMB/WWMB/WWMB/WWMB/WWMB/WW
UNUNUNUNUNUNUNUNUNUNUN
9601,6001,2801,0001,5001,2001,3001,1001,2001,2201,200
BabylonBabylonBabylon
Babylon averageBridgeportBridgeportBridgeport
Bridgeport averageBristolBristolBristol
Bristol averageCommerceCommerce
Commerce averageFairfaxFairfaxFairfaxFairfax
Fairfax averageGloucesterGloucesterGloucester
Glouster averageHempsteadHempsteadHempstead
Hempstead averageKentKent
Kent averageLong BeachMarion CountyStanislaus CountyStanislaus CountyStanislaus County
Stanislaus County average
MB/WWMB/WWMB/WWMB/WWMB/WWMB/WWMB/WWMB/WWMB/WWMB/WWMB/WWMB/WWMB/WWMB/WWMB/WWMB/WWMB/WWMB/WWMB/WWMB/WWMB/WWMB/WWMB/WWMB/WWMB/WWMB/WWMB/WWMB/WWMB/WWMB/WWMB/WWMB/WWMB/WWMB/WWMB/WWMB/WWMB/WW
SD/FFSD/FFSD/FFSD/FFSD/FFSD/FFSD/FFSD/FFSD/FFSD/FFSD/FFSD/FFSD/FFSD/FFSD/FFSD/FFSD/FFSD/FFSD/FFSD/FFSD/FFSD/FFSD/FFSD/FFSD/FFSD/FFSD/FFSD/FFSD/FFSD/FFSD/FFSD/FFSD/FFSD/FFSD/FFSD/FFSD/FF
1.005.00bd
2.00bd
4.00bd
1.332.001.002.001.67
0.4002.001.209.006.006.005.006.50bdbdbd
0.00bdbdbd
0.004.004.004.0018.03.002.002.002.002.00
B-5

TABLE B-2. (continued)
Facility nameCombustor
typeaControl
technologybConcentration
µg/dscm @ 7% O2c
HaverhillHaverhillHaverhill
Haverhill averageMillburyMillburyMillburyMillburyMillburyMillburyMillbury
Millbury averagePortlandPortland
Portland average
MB/WWMB/WWMB/WWMB/WWMB/WWMB/WWMB/WWMB/WWMB/WWMB/WWMB/WWMB/WWMB/WWMB/WWMB/WW
SD/ESPSD/ESPSD/ESPSD/ESPSD/ESPSD/ESPSD/ESPSD/ESPSD/ESPSD/ESPSD/ESPSD/ESPSD/ESPSD/ESPSD/ESP
38.018.010.022.013.022.032.06.0018.07.0011.015.64.004.004.00
Pinellas CountyTulsaTulsa
Tulsa average
MB/WWMB/WWMB/WWMB/WW
ESPESPESPESP
8.00390140265
Vancouver MB/WW DSI/FF 4.00
Dutchess CountyDutchess County
Dutchess County average
MB/RCMB/RCMB/RC
DSI/FFDSI/FFDSI/FF
3.003.003.00
DaytonDaytonDaytonDaytonDayton
Dayton average
MB/REFMB/REFMB/REFMB/REFMB/REFMB/REF
UNUNUNUNUNUN
1,2001,1001,9501,3001,5001,410
DaytonDayton
Dayton average
MB/REFMB/REFMB/REF
ESPESPESP
30.019.024.5
Dayton MB/REF DSI/ESP 11.0
BiddefordMid-ConnecticutMid-ConnecticutMid-ConnecticutMid-ConnecticutMid-Connecticut
Mid-Connecticut average
RDFRDFRDFRDFRDFRDFRDF
UNUNUNUNUNUNUN
1,100500567
1,100600617677
B-6
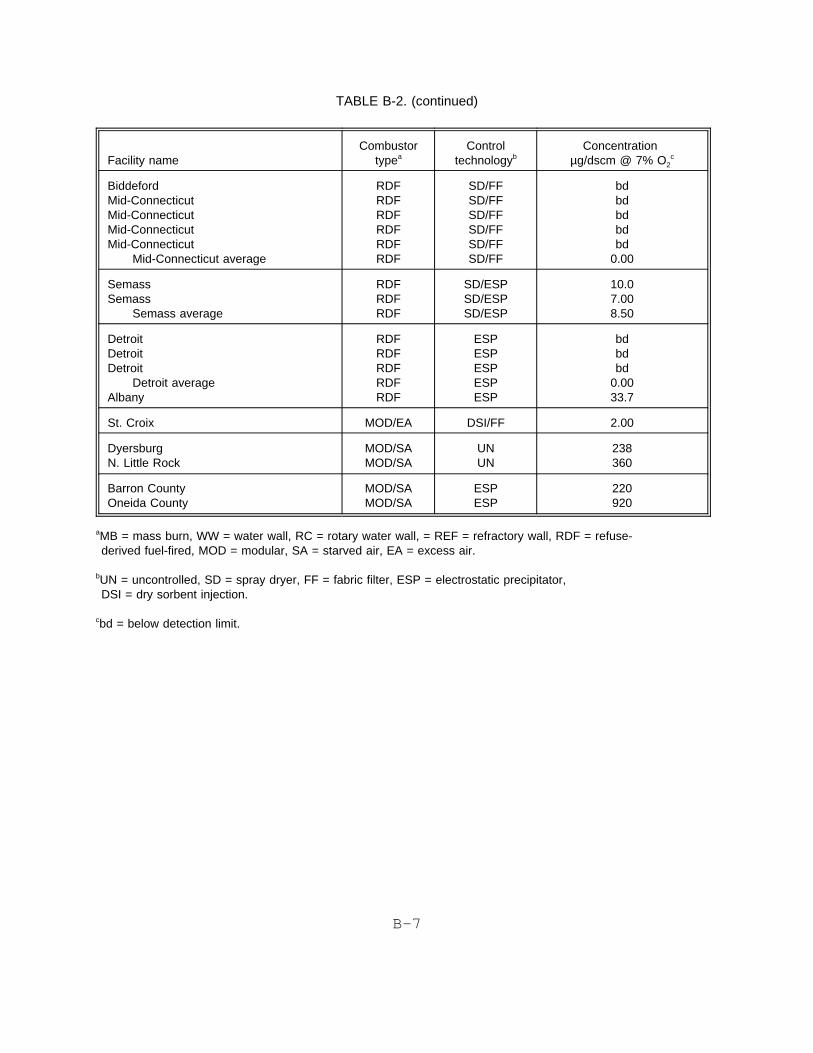
TABLE B-2. (continued)
Facility nameCombustor
typeaControl
technologybConcentration
µg/dscm @ 7% O2c
BiddefordMid-ConnecticutMid-ConnecticutMid-ConnecticutMid-Connecticut
Mid-Connecticut average
RDFRDFRDFRDFRDFRDF
SD/FFSD/FFSD/FFSD/FFSD/FFSD/FF
bdbdbdbdbd
0.00
SemassSemass
Semass average
RDFRDFRDF
SD/ESPSD/ESPSD/ESP
10.07.008.50
DetroitDetroitDetroit
Detroit averageAlbany
RDFRDFRDFRDFRDF
ESPESPESPESPESP
bdbdbd
0.0033.7
St. Croix MOD/EA DSI/FF 2.00
DyersburgN. Little Rock
MOD/SAMOD/SA
UNUN
238360
Barron CountyOneida County
MOD/SAMOD/SA
ESPESP
220920
aMB = mass burn, WW = water wall, RC = rotary water wall, = REF = refractory wall, RDF = refuse-derived fuel-fired, MOD = modular, SA = starved air, EA = excess air.
bUN = uncontrolled, SD = spray dryer, FF = fabric filter, ESP = electrostatic precipitator,DSI = dry sorbent injection.
cbd = below detection limit.
B-7
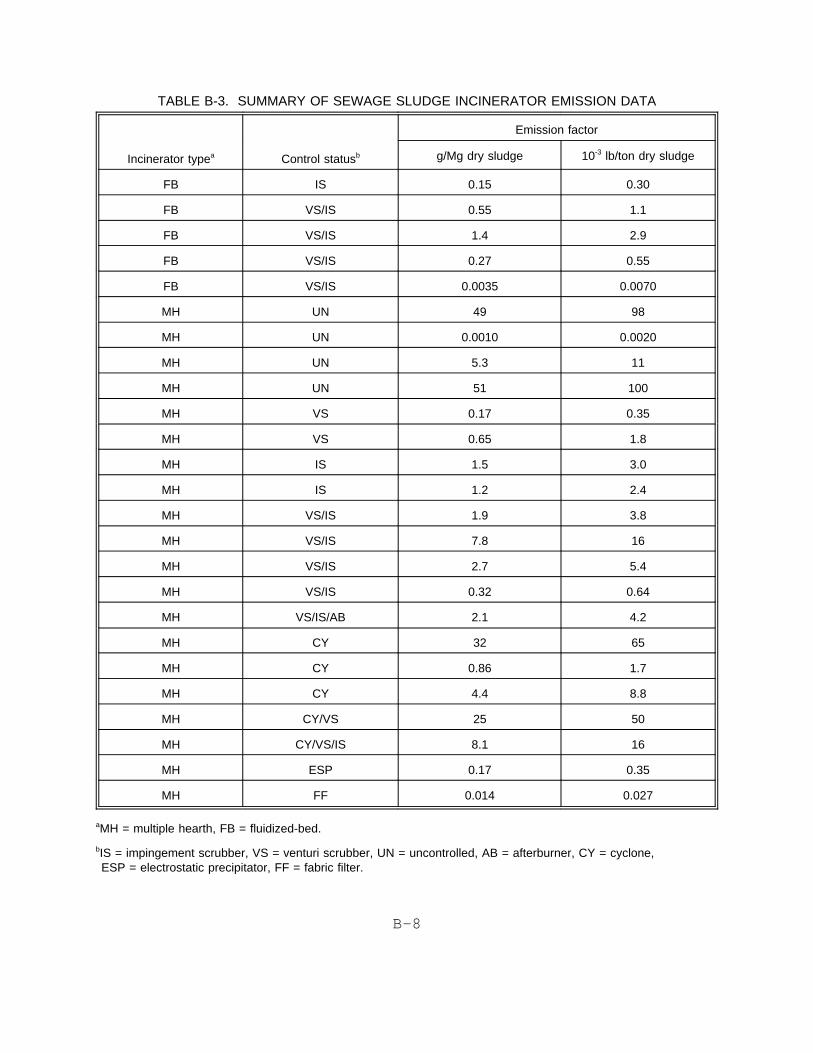
TABLE B-3. SUMMARY OF SEWAGE SLUDGE INCINERATOR EMISSION DATA
Incinerator typea Control statusb
Emission factor
g/Mg dry sludge 10-3 lb/ton dry sludge
FB IS 0.15 0.30
FB VS/IS 0.55 1.1
FB VS/IS 1.4 2.9
FB VS/IS 0.27 0.55
FB VS/IS 0.0035 0.0070
MH UN 49 98
MH UN 0.0010 0.0020
MH UN 5.3 11
MH UN 51 100
MH VS 0.17 0.35
MH VS 0.65 1.8
MH IS 1.5 3.0
MH IS 1.2 2.4
MH VS/IS 1.9 3.8
MH VS/IS 7.8 16
MH VS/IS 2.7 5.4
MH VS/IS 0.32 0.64
MH VS/IS/AB 2.1 4.2
MH CY 32 65
MH CY 0.86 1.7
MH CY 4.4 8.8
MH CY/VS 25 50
MH CY/VS/IS 8.1 16
MH ESP 0.17 0.35
MH FF 0.014 0.027
aMH = multiple hearth, FB = fluidized-bed.
bIS = impingement scrubber, VS = venturi scrubber, UN = uncontrolled, AB = afterburner, CY = cyclone,ESP = electrostatic precipitator, FF = fabric filter.
B-8
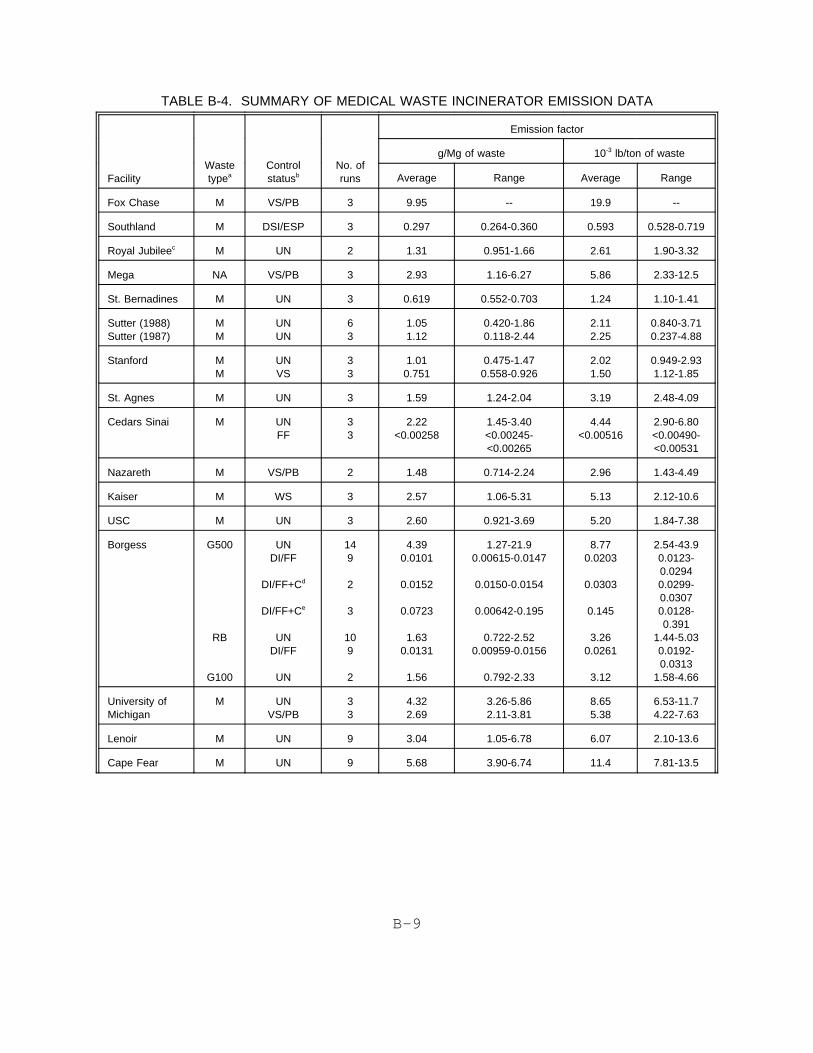
TABLE B-4. SUMMARY OF MEDICAL WASTE INCINERATOR EMISSION DATA
Emission factor
FacilityWastetypea
Controlstatusb
No. ofruns
g/Mg of waste 10-3 lb/ton of waste
Average Range Average Range
Fox Chase M VS/PB 3 9.95 -- 19.9 --
Southland M DSI/ESP 3 0.297 0.264-0.360 0.593 0.528-0.719
Royal Jubileec M UN 2 1.31 0.951-1.66 2.61 1.90-3.32
Mega NA VS/PB 3 2.93 1.16-6.27 5.86 2.33-12.5
St. Bernadines M UN 3 0.619 0.552-0.703 1.24 1.10-1.41
Sutter (1988)Sutter (1987)
MM
UNUN
63
1.051.12
0.420-1.860.118-2.44
2.112.25
0.840-3.710.237-4.88
Stanford MM
UNVS
33
1.010.751
0.475-1.470.558-0.926
2.021.50
0.949-2.931.12-1.85
St. Agnes M UN 3 1.59 1.24-2.04 3.19 2.48-4.09
Cedars Sinai M UNFF
33
2.22<0.00258
1.45-3.40<0.00245-<0.00265
4.44<0.00516
2.90-6.80<0.00490-<0.00531
Nazareth M VS/PB 2 1.48 0.714-2.24 2.96 1.43-4.49
Kaiser M WS 3 2.57 1.06-5.31 5.13 2.12-10.6
USC M UN 3 2.60 0.921-3.69 5.20 1.84-7.38
Borgess G500
RB
G100
UNDI/FF
DI/FF+Cd
DI/FF+Ce
UNDI/FF
UN
149
2
3
109
2
4.390.0101
0.0152
0.0723
1.630.0131
1.56
1.27-21.90.00615-0.0147
0.0150-0.0154
0.00642-0.195
0.722-2.520.00959-0.0156
0.792-2.33
8.770.0203
0.0303
0.145
3.260.0261
3.12
2.54-43.90.0123-0.02940.0299-0.03070.0128-0.391
1.44-5.030.0192-0.0313
1.58-4.66
University ofMichigan
M UNVS/PB
33
4.322.69
3.26-5.862.11-3.81
8.655.38
6.53-11.74.22-7.63
Lenoir M UN 9 3.04 1.05-6.78 6.07 2.10-13.6
Cape Fear M UN 9 5.68 3.90-6.74 11.4 7.81-13.5
B-9
TABLE B-4. (continued)
Emission factor
FacilityWastetypea
Controlstatusb
No. ofruns
g/Mg of waste 10-3 lb/ton of waste
Average Range Average Range
AMI CentralCarolina
M
P
UN
UN
3
6
0.461
0.902
0.403-0.575<0.000-4.67
0.923
1.80
<0.807-1.15<0.000-9.34
Morristown M UNSD/FF
SD/FF+C
63
3
6.860.0213
0.0121
4.72-8.250.0104-0.0293
0.00955-0.0145
13.70.0427
0.0242
9.43-16.50.0208-0.05870.0191-0.0290
aM = mixed medical waste, NA = not available, G500 = mixed waste from 500-bed hospital, RB = red bag waste,G100 = mixed waste from 100-bed hospital, P = pathological waste.
bVS = venturi scrubber, PB = packed bed, DSI = duct sorbent injection, ESP = electrostatic precipitator,UN = uncontrolled, FF = fabric filter, WS = wet scrubber, DI = dry injection, C = carbon addition, SD = spray dryer.
cSampling method suspect, results biased low.
dCarbon injection at 1 lb/hr rate.
eCarbon injection at 2.5 lb/hr rate.
B-10